Search, Matching, and the Role of Digital Marketplace ...
50
Search, Matching, and the Role of Digital Marketplace Design in Enabling Trade: Evidence from Airbnb Andrey Fradkin * MIT Sloan [email protected] March 21, 2017 Abstract Digital peer-to-peer marketplaces have increased the volume of trade in underutilized assets. I use the setting of Airbnb to investigate trans- action costs in these markets and the role of search engine design in reducing these costs. I show that this market is characterized by many options, heterogeneity in preferences, and uncertain availability. Con- sequently, search is limited, time-consuming, and sometimes results in failed transaction attempts due to rejections of searchers by hosts. I estimate a model of search and matching and use it to show that the search engine plays a critical role in facilitating transactions. With- out availability tracking and filtering, searches with accepted inquiries would fall by 68% and rejections would increase by 140%. Lastly, I show how searcher outcomes can be improved from the status quo (as of 2014) by algorithms that redirect searchers towards listings that are more likely to accept those searchers. * This paper supersedes the first half of “Search Frictions and the Design of Online Mar- ketplaces.” I thank Liran Einav, Caroline Hoxby, Jon Levin, Luigi Pistaferri, Susan Athey, Chiara Farranoto, John Horton, Ramesh Johari, Scott Kominers, and numerous seminar participants for advice. I am grateful to Airbnb (especially the analytics and data infras- tructure teams) for providing me with the data and for helping me execute every aspect of this project. Financial support was provided by the SIEPR Graduate Fellowship, the B.F. Haley and E.S. Shaw Fellowship for Economics, the NET Institute, and Airbnb. The author was employed by Airbnb, Inc. while writing much of this paper but the paper represents the views of the author and not necessarily Airbnb, Inc. 1
Transcript of Search, Matching, and the Role of Digital Marketplace ...

Search, Matching, and the Role of DigitalMarketplace Design in Enabling Trade:
Evidence from Airbnb
Andrey Fradkin∗
March 21, 2017
Abstract
Digital peer-to-peer marketplaces have increased the volume of tradein underutilized assets. I use the setting of Airbnb to investigate trans-action costs in these markets and the role of search engine design inreducing these costs. I show that this market is characterized by manyoptions, heterogeneity in preferences, and uncertain availability. Con-sequently, search is limited, time-consuming, and sometimes results infailed transaction attempts due to rejections of searchers by hosts. Iestimate a model of search and matching and use it to show that thesearch engine plays a critical role in facilitating transactions. With-out availability tracking and filtering, searches with accepted inquirieswould fall by 68% and rejections would increase by 140%. Lastly, Ishow how searcher outcomes can be improved from the status quo (asof 2014) by algorithms that redirect searchers towards listings that aremore likely to accept those searchers.
∗This paper supersedes the first half of “Search Frictions and the Design of Online Mar-ketplaces.” I thank Liran Einav, Caroline Hoxby, Jon Levin, Luigi Pistaferri, Susan Athey,Chiara Farranoto, John Horton, Ramesh Johari, Scott Kominers, and numerous seminarparticipants for advice. I am grateful to Airbnb (especially the analytics and data infras-tructure teams) for providing me with the data and for helping me execute every aspect ofthis project. Financial support was provided by the SIEPR Graduate Fellowship, the B.F.Haley and E.S. Shaw Fellowship for Economics, the NET Institute, and Airbnb. The authorwas employed by Airbnb, Inc. while writing much of this paper but the paper representsthe views of the author and not necessarily Airbnb, Inc.
1

1 Introduction
There are always individually owned assets not being used and people with
free time who are not working. Without transaction costs, many of these
assets and people could be employed in productive ways, if only for a short
time. These transactions could generate welfare by expanding market capacity,
offering better matching products, and providing new sources of income for
sellers. However, the costs of transacting between unacquainted individuals
have been so large in developed economies that people instead preferred to
exclusively transact with traditional firms in most markets. Over the past
20 years, peer-to-peer marketplaces have greatly expanded transaction volume
between individuals in markets such as short-term apartment rentals (Airbnb),
used goods (Ebay), labor services (Upwork and Taskrabbit), and rides (Uber
and Lyft).1
In this paper, I use the setting of Airbnb to study the transaction costs
which previously prevented trade, the role marketplace design in reducing
those costs, and the potential for further improvements in search and match-
ing. The motivation for this study is two-fold. First, as digital intermediaries
are becoming more prominent, it is increasingly important to understand how
they generate value. Peer-to-peer marketplaces implement many features, in-
cluding payments processing, messaging, reputation, and search. I show that
the design of the search engine is especially important in making Airbnb suc-
ceed. Second, because search engines have important economic effects, there
are potentially large gains in improving their design. I empirically show how
changes in the design of the search algorithm have the potential to improve
market efficiency but entail trade-offs between buyers and sellers in the market.
Search and matching is especially important in peer-to-peer settings be-
cause of the presence of heterogeneous sellers or goods with limited capacity
1See Einav, Farronato and Levin (2016) for a general overview of peer-to-peer marketsand Farronato and Fradkin (2017) for an empirical analysis of the effect of Airbnb on themarket for short-term accommodations. Horton and Zeckhauser (2016) and Fraiberger andSundararajan (2015) describe equilibrium models of asset ownership and use as a functionof a reduced form transaction cost parameter.
2

or availability. For example, while a hotel may have hundreds of similar rooms
and would like to rent them out every night, the typical Airbnb host has one
unique apartment or room and does not always wish to rent it out. Conse-
quently, consumers in peer-to-peer markets face much larger and more hetero-
geneous choice sets than consumers of traditional firms. I use data on user
behavior to show that these features make search more time consuming in the
peer-to-peer market than in a retail market. Second, unlike in retail markets,
consumers in peer-to-peer markets face chance of being rejected by a seller,
either due to the lack of availability or due to seller preferences. I demonstrate
that rejection occurs frequently and is perceived as a large transaction cost
by consumers, who leave the platform at higher rates when they are rejected.
An implication of these facts is that digital technologies can actually increase
equilibrium transaction costs in the economy by shifting the mix of sellers
towards peers.
I demonstrate the importance of the search engine design by estimating
models of searcher choice and host rejections and using these models to cal-
culate counterfactual outcomes. My first set of counterfactuals focuses on
outcomes where the search engine is worse than Airbnb circa 2013 - 2014
(‘status quo’). Specifically, I consider the role of three functions: the removal
of previously booked listings from the search results of subsequent searchers,
the ability to filter accurately by geography, price, and room type, and a search
ranking algorithm. I show that without these functions, searches resulting in
an accepted inquiry would fall by 68% and that the share of first inquiries that
would be rejected by hosts would increase by 144%. Furthermore, the tracking
of listing availability is relatively more important than the ability to filter in
improving outcomes.
Next, I consider counterfactuals with potentially better algorithms than in
the ‘status quo’ scenario. An important aspect of digital platform design is
that the platform can observe the incurred transaction costs of prior users. It
can then use this data to direct search activity towards lower transaction cost
alternatives, as predicted by historical data. In my counterfactuals, I study
expected outcomes where the search engine displays listings that are both
3

more attractive to the searcher and are more likely to accept the searcher.
In particular, I show that the share of accepted searchers increases by 10%
when search ranking algorithms use the expected probability of an acceptance
by a host relative to a similar algorithm that does not use this information.
Furthermore, the design of these algorithms entails important trade-offs. First,
a ranking algorithm must balance showing attractive listings versus showing
listings that are more likely to accept the searcher. Second, an algorithm that
places weight on the acceptance probability of a contact redistributes demand
away from listings managed by hosts who value the ability to select between
guests. This potential for increased efficiency for the buyers at a harm to some
of the sellers highlights the importance and challenge of search engine design
for online platforms.
I begin the paper by describing the behavior of users on Airbnb with regard
to two transaction costs: search and communication. With regards to search,
the median Airbnb searcher to a large US city (City A) between 2013 and 2014
only sees 4.2% of the over one thousand typically visible listings given a set
of search parameters. Even the more motivated searchers who send contacts
regarding booking see only 5.5% of these listings. This search is highly directed
and heterogeneous: 57% of searchers filter for a location within the city, 70%
filter for a room type, and 52% apply the maximum price filter. The process of
search consequently takes time. The median searcher in my sample spends 58
minutes browsing the site before sending an inquiry whereas a consumer who
books on ‘booking.com’ spends just 34 minutes browsing before booking.2
Furthermore, searchers on a typical hotel website do not get rejected. In
contrast, 36% of first contacts and 42% of all contacts by searchers regarding
a booking are rejected by the hosts in my sample. One novel aspect of my
descriptive analysis is that I classify rejections into three categories, each of
which have differing implications for market design. Stale vacancy rejections,
which happen when the listing is eventually marked as unavailable by the host
and not booked for the dates of an inquiry, occur 15% of the time. Another
2This figure was calculated using the time spent browsing in the two days prior to pur-chase in the 2013 comScore web panel.
4

8% of rejections occur due to congestion, which happens when listings are
booked by inquiries from guests who sent earlier inquiries for the set of dates.3
Lastly, the remainder of inquiries are rejected due to the characteristics of the
searcher or the trip.
These rejections represent transaction costs on the platform. First, com-
munication is costly and leads to delay and uncertainty. Second, rejection
leads searchers to leave the Airbnb platform. Conditional on being rejected
from their first inquiry, searchers are 51% less likely to eventually book a list-
ing for a given market. I demonstrate that this effect is likely to be causal
by showing that it persists even when controlling for market-level availability
of rooms, guest and listing characteristics, and guest motivation. I also use
the presence of stale vacancies, which should be exogenous to host preferences
regarding a particular trip, as an instrument for rejection and find that the
effect of a rejection on eventual booking by a searcher persists.
I then study the extent to which these transaction costs would be higher
in a world where Airbnb’s search engine was worse. As a baseline comparison,
consider the ways in which the ‘status quo’ differs from Craigslist’s circa 2005
(Figures 1 and 3). Craigslist has had listings for short-term rentals in cities
since at least the early 2000’s. However, Craigslist operates as a mostly pas-
sively listing service that does not track transactions. Consequently, listings
on Craigslist may have already been booked when they are shown to searchers.
Furthermore, Craigslist did not limit results to relevant geographies, dates, or
prices, and displayed listings in chronological order rather than by relevance.
In contrast, Airbnb directly mediates the transaction between guest and host
(e.g. Varian (2010)). This allows it to remove previously booked listings,
display only relevant geographies and prices, and to use a ranking algorithm
based on historical data regarding searcher outcomes.
Because I cannot observe the extent of transaction costs before Airbnb
existed, I estimate models of searcher and host behavior to study outcomes
under a scenario with a limited search engine. I use a discrete choice model
3Note that my definition of congestion is more narrow than that of Roth (2008), whosedefinition would treat all rejections on the platform as congestion.
5

to predict a searcher’s choice of whether and whom to contact from a fixed
consideration set. Importantly, I use each searcher’s choice of filters to account
for preference heterogeneity. For example, searchers who filter for a particular
neighborhood in a city are far more likely to send an inquiry to a listing in that
neighborhood. On the host side, I use the set of inquiries which are not rejected
due to a stale vacancy or due to congestion to estimate a logistic regression
predicting rejection as a function of guest and listing characteristics. I find that
the heterogeneity in selectivity across listings as measured by listing random
or fixed effects is large relative to the coefficients on inquiry characteristics.
I consider the effects of alternative search engine designs under the assump-
tion that each searcher sees the same number of listings as they did in the data.
I first calculate expected outcomes for the the status quo and show that they
are close to the ones seen in the data. I then study the effects of random
consideration sets from the set of all active listings in the market for a given
set of dates. This counterfactual takes away the ability of searchers to filter,
the ranking algorithm of the platform, and displays listings that were already
known by the platform to be unavailable. I find that under this scenario, the
share of searchers who choose the outside option4 increases by 1.6 percentage
points and the share of rejected inquiries increases from 32% to 78%.
In the next counterfactual, I study the effects of a search engine without
filters but with availability tracking. I find that in this scenario the share of
individuals who choose the outside option increases by 3 percentage points,
the rejection rate falls to 43%. Therefore, while both market design features
play an important role, availability tracking is relatively more important.
Finally, I consider potential improvements to market efficiency through
ranking algorithms that display a alternative consideration sets to searchers.
I show that without availability tracking, better ranking algorithms make lit-
tle difference. However, with availability tracking, matching outcomes would
improve by a meaningful amount. For example, I find that a ranking algo-
4Throughout the paper, the “outside option” refers to a decision by a searcher to choosea hotel option, a non-market option such as staying with friends and family, or not choosingto take the trip at all.
6

rithm which personalizes search results with regards to both expected utility
and the probability of screening rejections by hosts would increase the rate at
which searchers send a contact and are accepted to 34% from 24%.5 Of course,
because this counterfactual is static, it does not account for the market equi-
librium effects of the policy. Fradkin (2015) simulates these effects accounting
for the fact that a booking today reduces supply for subsequent searchers and
that policies affect the level of congestion in the market.
This paper necessarily focuses on a limited set of digital marketplace de-
sign choices. Other mechanisms also play an important role in these markets.
Reputation systems reveal seller quality in ways that reduce both adverse se-
lection and moral hazard on the part of sellers (Resnick et al. (2000), Klein,
Lambertz and Stahl (Forthcoming), Fradkin et al. (2015)). Innovative pric-
ing and matching mechanisms such as auctions (Einav et al. (Forthcoming),
employer initiated search (Horton (Forthcoming)), and surge pricing (Hall,
Kendrick and Nosko (2016)) are frequently used to clear the market. The in-
formational structure of the market, including the ability to post photos (Lewis
(2011)) and disclose quality (Tadelis and Zettelmeyer (2015)), can also affect
market efficiency. Lastly, non-design features of peer-to-peer marketplaces af-
fect their success as well. Cullen and Farronato (2016) show that Taskrabbit
is more successful in cities with high geographic density and Farronato and
Fradkin (2017) show that Airbnb is more successful in cities with constraints
to building hotels.
The closest papers to this one include both empirical and theoretical con-
tributions regarding transaction costs in digital marketplaces. Horton (2016)
empirically shows that the availability friction represents a large transaction
cost for employers on the oDesk / Upwork marketplace, Dinerstein et al. (2014)
study a redesign of the search engine on eBay, and Ellison and Ellison (2009)
show that sellers respond to high competition online by obfuscation, coun-
teracting some of the benefits of search engines. Bakos (1997) theoretically
demonstrates how high search costs can lead to a market breakdown even in
5Indeed, this is a direction which Airbnb has chosen to pursue in a feature called “HostPreferences” (http://nerds.airbnb.com/host-preferences/).
7

the presence of Pareto efficient exchanges and Arnosti, Johari and Kanoria
(2014) analyze a matching market where sellers are potentially unavailable
and show that the lack of knowledge about availability can cause large welfare
loses. My research also relates to a large and growing literature on models of
search in digital marketplaces, which I discuss in detail in subsection 3.3.
Search and matching also plays a large role in the economics of labor,
housing, and household formation. Theoretical results in this literature such
as Burdett, Shi and Wright (2001), Albrecht, Gautier and Vroman (2006),
and Kircher (2009) show that markets where sellers have limited capacity,
such as Airbnb, entail higher search costs than markets with large firms. Two
recent papers by Cheron and Decreuse (2017) and Albrecht, Decreuse and
Vroman (2017) are particularly relevant. These papers build models of search
and matching with ‘phantom’ vacancies, which are analogous to congested
and stale vacancies in my setting, and study their implications in the labor
market. One notable advantage of my setting is the availability of data on
search and communication, which is missing in the above papers. This data
can be used to directly test the importance of the mechanisms underlying
search and matching models. Other papers with similar data include Wolthoff
(2011) for the labor market, Hitsch, Hortacsu and Ariely (2010) for the dating
market, and Piazzesi, Schneider and Stroebel (2015) for the housing market.
2 Setting
Airbnb describes itself as a trusted community marketplace for people to list,
discover, and book unique accommodations around the world – online or from
a mobile phone. The marketplace was founded in 2008 and has at least doubled
in total transaction volume during every subsequent year. Airbnb created a
market for a previously rare transaction: the short-term rental of an apartment
or part of an apartment by a consumer.6 In addition to a search engine,
Airbnb operates a reputation and fraud detection system, customer service, a
communications platform, a mobile application, an insurance policy for hosts,
and a transactions processing platform. This paper investigates the role of
8
a subset of these technologies. A typical Airbnb transaction consists of the
following steps:
1. Using the Search Engine (Figure 1) - Searchers enter the travel dates,
number of guests and location into a search engine and receive a list of
results. The search can then be refined using filters. Only listings that
have an ‘open’ calendar for the trip dates are visible to searchers. Cal-
endar dates become unavailable either when a listing is booked or when
a host updates the calendar to be unavailable. Importantly, calendars
are frequently not an accurate representation of true availability. This
occurs because hosts do not always attend to their calendar or because
hosts may be in conversation with other potential bookers (either on or
off of Airbnb the platform).
2. Investigation (Figure 2) - The searcher clicks on a listing in search. The
subsequent page displays additional photos, amenities, reviews, house
rules and information about the host.
3. Communication and Booking (Figure 4) - The searcher sends a message
to hosts inquiring about room details and availability. This can be done
in one of two ways, either by sending an inquiry or by clicking the “Book
It” button. In the case of an inquiry, a host will typically reply with an
acceptance or a rejection. If accepted, the guest can then click the “Book
It” button to go through with the booking. A host who has received
either type of request has the right to make a final decision of whether
to accept or reject. There are two exceptions. First, some hosts are
available to be “Instant Booked” by some guests, in which a transaction
is confirmed as soon as guests click “Instant Book”. Second, a host can
“Pre-approve” a guest after an inquiry, which subsequently allows the
guest to book without further communication.
6Couchsurfing, a large travel based social network started in 2003, facilitates similar staysbut without monetary exchange. Vacation rentals by owners in tourist destinations havealso existed for a long time.
9

4. Stay - There is frequently communication regarding the key exchange
and details of the trip. Either party can cancel a booking with a pre-
specified cancellation penalty (a monetary amount for a guest and an
Airbnb specific punishment for the host). Following the transaction,
guests and hosts can review each other.
3 Browsing Behavior
In this section, I provide a comprehensive description of the process by which
searchers on Airbnb find a suitable listing. I first start by describing the data
used to conduct the study. I then use the data to document three features of
search behavior: limited consideration sets, redundant search, and the filtering
of results.
3.1 Data Selection Procedure
The search data used for this study consists of the searches of a 10% random
sample of users for short-term rentals conducted on Airbnb for City A between
September 2013 and September 2014. For the purposes of this study, a short-
term rental is defined as one which has fewer than 8 nights of stay. I limit my
focus to a large US city because this represents the setting in which Airbnb
first became successful.
I further limit thesample to searches whose cookie or device-ID can be
linked to a registered user. Furthermore, I remove anomalous searches such as
searches with 0 nights, searches where the check-in date has already passed,
searches with more than 6 guests, searches likely to be conducted by bots,7and
searches more than two months ahead of the check-in date.
Next, I group searches into distinct search spells so that searches by the
same searcher which differ in destinations and trip date are kept separate.
To create a search spell, I first link the searches to a contact (an inquiry or
7Bots are software agents that programatically browse websites for the sole purpose ofcollecting information. E-commerce sites are frequently ‘scraped’ by bots for the purposesof competitive analysis and research.
10

booking) conducted by the searcher. For those searches that can be linked to
a contact, I only keep the searches which occurred within two days preceding
the contact. Furthermore, I use only the searches related to the first contact
by a user in the city during the sample period. For those searches that cannot
be linked to a contact, I keep only the searches conducted within the last two
days of search activity. This selection criteria ensures that the search results
in the data reflect the perceived availability when the search spell occurred.
The final set of searches contains 236,000 observations.
3.2 Descriptive Statistics and Stylized Facts
I now describe the behavior of searchers in the sample. Table 1a displays
the summary statistics at a search-spell level for the sample. The median
searcher submits 9 distinct search requests8 in the process of searching. There
is significant heterogeneity in the number of searches. The 25th percentile is
just 3 searches while the 75th percentile results in 21 searches. Furthermore,
the mean number of searches, 19, is twice as large as the median indicating
significant skewness in the distribution. This search behavior is not simply a
result of differences in the time spent per page of search results. The total
time spent browsing displays similar heterogeneity. The typical searcher 17
minutes in search, but the mean is 35 minutes.
Those searchers who eventually send a contact engage in more search than
those who do not. Table 1b displays the summary statistics for the searchers in
the sample who sent at least one contact. The typical searcher with a contact
spends approximately twice as much time browsing and views twice as many
search results as the typical searcher in the sample. This increased search
activity can be caused by two factors. First, there is unobserved heterogeneity
between searchers. Those who get more benefit from using Airbnb relative
to the outside option should search more intensively and be more likely to
contact. Second, there is endogenous selection into contacting based on the
quality of search results. Searchers should be more likely to book when there
8A search request can result from an application of a filter, a shift of the map, a click tothe next page, or a return to a previously seen set of search parameters.
11

are more relevant listings shown in search.
Next, I examine the thoroughness of this search. The typical searcher
sees 54 unique listings during the search spell. This corresponds to 4.2% of
all listings that were potentially visible in search for the set of dates. Those
searchers who send a contact typically see 73 listings, representing 5.5% of
all potential visible listings for their search parameters. This limited search
suggests an important role for marketplace technology to improve matches.
If those listings which are not seen would be good matches, then the search
engine could in principle design an algorithm to show these listings to the
searcher at the beginning of search.
I now document that much of observed search activity is redundant. Airbnb’s
search engine displays a maximum of 18 to 21 results at a time but the typical
searcher sees just 6 unique listings per search. This redundant search happens
for several reasons. First, searchers are frequently distracted by other tasks
while looking for a room and oftentimes restart searching at a later time with
generic parameters.9 Second, there is often overlap between filtered search re-
sults, for example when a user zooms in or slightly shifts the map. Third, users
go back to generic search if they’ve closed the search results tab or pressed
the ‘back’ button after investigating a listing. Furthermore, the eventually
chosen listing is first seen early in search (typically on the fourth search) but
the typical searcher conducts 7 additional searches before stopping the search
process and sending a contact.
Lastly, I describe the choice of searchers to apply filters. Filters offer a
way for searchers to direct their search towards options which are likely to
be better matches. Indeed, the estimates in section 5 show that filters are
predictive of the options selected by a searcher. In this section I focus on the
filters most prominently displayed by Airbnb: the map, price, and room type
filters.10 Maximum price filters and the map are used by over 50% of searchers
and over 60% of those who contact. Those who use the map not only change
the default location but also use the zooming features to focus on specific areas
9Internal surveys suggest that the most common reason why searchers a search sessionis because they are interrupted by work.
12

of interest. In addition to using the map to specify a geography, searchers can
explicitly specify a search neighborhood from a menu, and 8% choose to do so.
Lastly, guests on Airbnb can choose to rent a room within a property or an
entire property. Over 63% of guests filter for a room type at least once during
the search process.
Filtering behavior is heterogeneous across searchers and reflects the het-
erogeneity in searcher preferences. Figure 5, displays the distribution of map
filtering behavior across 20 neighborhoods in the city. The most popular neigh-
borhood is filtered in greater than 10% of searches with a map filter. The
next five neighborhoods are filtered for more than 5% of the time, and the
subsequent 13 neighborhoods are filtered for more than 1% of the time. Fur-
thermore, of the 87% of searchers who use a room type filter, select entire
property and 35% select private room (these sum to more than one because
the same searcher can filter for both). Lastly, Figure 6 displays the distribu-
tion of the maximum of the price filters each searcher uses. Similar to the
other filters, there is significant heterogeneity in price filtering activity across
searchers. Filtering heterogeneity has important implications for search engine
design, which I discuss in the next section.
3.3 Relationship to Theoretical Search Models and Mar-
ket Design Implications
I now describe how the descriptive statistics regarding search correspond to
theoretical models and what they imply for market design. First, the pres-
ence of limited search is consistent with all models of rational search behavior
(Stigler (1961)) However, the extent to which limited search is inefficient addi-
tionally depends on behavioral factors such as impatience or poorly calibrated
beliefs regarding the quality of inventory. The potential gains to the platform
from improving search results depend on the magnitude of search costs and
10The search engine also allows explicit filters for neighborhood, which I group with themap filter. There are also offers filters for various amenities, property types, languages, andother miscellaneous options. These filters require more clicks to access and were used lessthan 1% of the time in the sample period.
13

the extent to which searchers are rational. If searchers have rational expecta-
tions regarding the quality of additional search results, then they are unlikely
to forgo potentially good matches unless search costs are high. On the other
hand, if searchers are irrational or have little insight into the returns to search,
then they may prematurely stop searching even when good matches exist.
Redundant search and recall in the search process suggests that simple
models of sequential search that imply constant reservation utilities, such as
McCall (1970), are unlikely to explain search behavior. Other simple models
with fixed sample search suffer from another problem, also documented in
Bronnenberg, Kim and Mela (2016), that they do not explain why results
accessed later in search, via filters, are more likely to be chosen. Instead, recall
suggests that searchers either learn about product attributes sequentially as in
(Ke, Shen and Villas-Boas (2016)), learn about the market-wide distribution
of utilities during search (De Los Santos, Hortacsu and Wildenbeest (2015)),
or face an exogenous increasing marginal cost of search (Ellison and Wolitzky
(2012)), which may occur in this setting due to work interruptions. This
behavior is likely the reason why many digital marketplaces let users save
search results to collections (called ‘Wish Lists’ on Airbnb) and pro-actively
display previously examined options when users return to the website.
Lastly, the presence and heterogeneity of filtering behavior suggests new,
and to my knowledge non-modeled, market design choices. Specifically, each
marketplace must decide the types of filters offered, their prominence in the
interface, and the extent to which those filters are binding. For example, a
redesign of Airbnb’s search engine in 2013 expanded the map of results to
occupy half of the search screen. In contrast, Booking.com, the most popular
hotel search engine, makes a small map visible only after a searcher has scrolled
past the initial search results.
14
4 Communication, Rejection, and Booking Be-
havior
A key goal of this paper is to demonstrate how digital market design reduced
transaction costs and enabled this market to exist. However, it is impossible
to obtain direct measurements regarding the magnitude of transaction costs in
a market that did not previously exist. In this section, I show that even after
Airbnb’s initial success, transaction costs related to communication remained
significant and caused searchers to leave the platform without transacting.
I use two samples to study communications and rejections. The first sam-
ple, analogous to the sample used to study browsing, consists of all contacts
in City A between September 2013 and September 2014. The second sample,
used to validate the representativeness of City A, consists of a 10% sample
of all contacts to the top 20 non-vacation rental markets in the US. For both
samples, I keep only contacts regarding the first set of contact dates in a city.11
Table 2a displays the summary statistics regarding the communication pro-
cess in City A for first contacts by a searcher in City A. As a reminder of the
notation, I call any communication a ‘contact,’ a non-binding communication
by the searcher an ‘inquiry,’ and a binding communication, a ‘booking request.’
Turning first to the number of contacts, the median number of listings con-
tacted by a searcher in City A for a given set of dates is 1 and the mean is 2.4.
Of these inquiries, 1.4 are on average sent simultaneously, which I define as
within 2 hours of the time at which the first contact was sent by the searcher.
Importantly, since 57% of contacts begin with an inquiry, searchers could send
multiple inquiries without committing themselves to a purchase. Nonetheless
most searchers choose not do so.
Of these first contacts, 36% are rejected by hosts in the sample. This
rejection rate is similar to the overall rejection rates for first contacts in US
cities (Table 2b). The fact that searchers typically send few contacts has
11To do so, I find the minimum check-in date for all contacts in a city by a given guest.I then exclude any contacts from the sample for which the check-in date in the city is morethan 2 days after the initial check-in. I also exclude any contacts which occur on the dateof check-in and which require more than 7 nights.
15
implications for the importance of these rejections. If a searcher sends one
inquiry and it is rejected, then the searcher must conduct a new search before
booking. On the other hand, a searcher who sends many initial contacts does
not have to search again after one rejection.
Bargaining is another reason for communication in many search and match-
ing markets. However, bargaining is rare on Airbnb.12 The potential cost to
a host from a non-trustworthy guest can be much greater than the potential
loss from waiting for another contact.
4.1 The Types and Frequencies of Rejection
If applicants knew, a priori, which hosts would accept and reject which in-
quiries, then they would not need to waste search effort looking at and sending
contacts to rejecting hosts. Relatedly, the platform has an incentive to design
the marketplace in order to prevent this wasteful search. However, the ap-
propriate policies for preventing rejections depend on the mechanisms behind
rejections. In this section, I provide a framework for categorizing rejections by
hosts into three categories, congestion, “stale” vacancies and screening, each
with differing implications for market design and the sources of inefficiency.
Note that my classification is more nuanced than is typical in the market de-
sign literature (e.g. Roth (2008)), which typically groups all rejections under
the term ‘congestion’.
In my framework, congestion occurs when a guest sends an inquiry to a
host who is about to transact with someone else. The host must consequently
reject the inquiry because she can only host one trip for a given set of dates.
The reason that congestion happens is that potentially available listings are
not removed from the search results until the transaction clears. The longer it
takes the transaction to clear, the more likely it is that congestion occurs. In
turn, the clearing time of transactions is determined by the time it takes for a
12Bargaining is impossible when guests contact with the ‘Book It’ button. Furthermore,natural language processing of inquiries shows that bargaining related terms rarely occurfor the short-term stays studied in this paper. The likely reason for this lack of bargainingis that guests who ask for a discount seem less trustworthy and are perceived to be more ofa hassle by sellers.
16

host to respond to an inquiry and the time it takes for a guest to confirm the
transaction.
I classify rejections as being caused by congestion when an inquiry is sent
to a host who is subsequently booked as a result of a previous inquiry.13 Using
this methodology, congestion rejections occur for 7.8% of all inquiries in City
A (Table 2a) and 7.1% of all inquiries in the US (Table 2b). These rejections
constitute a relatively small percentage of the total rejections on this site and
increase in the summer months when the ratio of searchers to listings increases.
The reason for the relatively small frequency of congestion is that hosts
tend to respond quickly when they accept a booking request. Figure 7 plots
the distribution of response times for first inquiries by searchers to locations
in the US. Over 50% of acceptances come within 3 hours of the initial inquiry
and fewer than 10% take more than 2 days. On the other hand, rejections
typically take much longer. For example, over 30% of rejections take longer
than 2 days. The likely reason for this divergence in response times is that
hosts have little incentive to respond quickly for inquiries that are unlikely to
result in bookings.14
The second type of rejection in my framework is due to stale vacancies.
These rejections occur when guests send inquiries regarding listings which are
not actually available for a set of dates. Stale vacancies occur because hosts
don’t promptly block specific dates on their calendar even though they are not
available. I am able to observe rejections due to stale vacancies when an inquiry
is rejected for a set of dates which are subsequently marked as unavailable by
the host.15 Stale vacancy rejections occur for 14.5% of first contacts in City A
and 15.3% of first contacts to US hosts. Although stale vacancies may seem
like an Airbnb specific phenomenon, they are common to many search and
13I assume that hosts evaluate each inquiry sequentially rather than waiting to receiveseveral inquiries and picking the best. In practice, there are cases when a host may receiveinquiries in parallel, if, for example, she checks Airbnb infrequently. I abstract from thisscenario because hosts are notified by text or email of an inquiry and have an incentive torespond quickly.
14To correct this problem, Airbnb has begun enforcing ‘hosting standards’, which, amongother things, reward hosts in search rankings if they respond quickly. For details see:https://www.airbnb.com/hospitality.
17

matching markets. For example, employers may not promptly remove posted
vacancies even when a position has been filled or is no longer needed. Similarly,
in online dating markets, people may not promptly disable a profile even when
they are too busy to date or are in a relationship.
The above methodology for identifying ‘stale vacancies’ could potentially
conflate cases where a calendar was market as unavailable because the listing
was booked off of the Airbnb platform, either through another platform or in
an informal transaction which dis-intermediates Airbnb. While this type of
behavior is likely to be important in many search and matching settings, it is
relatively unimportant on Airbnb for the following reasons. First, with regards
to multi-homing by hosts, surveys of Airbnb hosts in the US suggest that most
hosts transact exclusively on Airbnb. Furthermore, my dataset consists of non-
vacation rental cities in the US, where Airbnb is by far the dominant firm in
this industry.
Dis-intermediation is also unlikely to be a major reason for why calendar
dates are market as unavailable. First, there are large benefits to keeping
transactions on the site because of the insurance, reputation and secure mone-
tary transfer that using Airbnb offers. Second, Airbnb actively tries to prevent
dis-intermediation by removing phone numbers, emails, and other contact in-
formation from messages before transactions are confirmed.
Screening, the final rejection type in my framework, occurs because hosts
have preferences over trips and guests, and those preferences are not explicitly
expressed by hosts to the platform. This results in hosts receiving inquiries
regarding trips they are not willing to host, which are consequently rejected.
In the Section 5, I model hosts’ screening rejection decisions in detail.
4.2 The Effects of Rejection on Searchers
Rejections and the related communication about a transaction are costly from
both a user’s and a platform’s perspective. First, in order for searchers to make
15In some cases, hosts never update their calendars to be unavailable but simply rejectall incoming inquiries. Therefore, my methodology understates the true extent of stalevacancies.
18

travel plans, they need to know where they’ll be staying and when. However,
this planning process is potentially delayed when communication takes time
and there is a possibility of rejection. Second, when rejection does occur, it
may cause searchers to give up on using the Airbnb platform altogether and
to switch into a marketplace with lower transaction costs, such as a typical
hotel booking website. Lastly, to the extent that potential searchers know that
rejections frequently occur Airbnb, they may not use the platform in the first
place. In this section, I document that rejection causes searchers to leave the
Airbnb platform without transacting.
Figure 8 displays summary statistics regarding potential trips where the
searcher sends one initial inquiry. Of the 37% of searchers with a rejected first
inquiry, 51% don’t send another inquiry in the sample. Of those that do send
another inquiry, 67% end up booking. On the other hand, those whose first
inquiries are not rejected book at a 75% rate. In total, cases where an initial
rejection is followed by the searcher leaving comprise 19% of trip attempts in
this sample.
However, the association between rejections and non-booking may not be
causal.16 Consider the following thought exercise. Suppose that the listing
whose host rejected the searcher was not shown to the searcher at all. If the
effect of a rejection is causal, then there would be other suitable listings whose
hosts would accept the searcher. On the other hand, if there were no such
listings or if the searcher never intended to book the listing in the first place,
then the association is spurious. Below, I study whether controlling for these
potentially non-causal mechanisms affects the baseline estimates of the effect
of a rejection.
Consider a potential guest-trip, g (a guest, market, and check-in time com-
bination), sending a first inquiry to a host, h. Column (1) of Table 3 reports
16Horton (2016) uses an instrumental variable technique to show that, in the setting ofOdesk / Upwork, rejection by employees of invitations to apply by employers has a causaleffect on the probability at which a job is eventually filled. In his paper, the two-stage leastsquared estimate is actually larger than the simple OLS estimate of the effect of a rejection.
19
the results of the following OLS regression:
Bg = β0 + β1rgh + εgh (1)
where Bg is an indicator whether the guest-trip results in a booking and rgh is
an indicator for whether host, h, rejects the guest-trip, g. The simple estimator
of the effect is -.41.
The first potential confounder is that there is insufficient supply in the
market at time for a given check-in week. To control for this, I add a fixed
effect for each week of inquiry and week of checkin-in combination (column
(2)). Furthermore, in column (3), I limit the sample to inquiries occurring more
than 2 weeks away from the check-in date, when a relatively large number of
suitable listings should be visible in search results. In both cases, the estimate
differs from the baseline by less than 5 percentage points.
Another potential confounder is that guest-trips which are rejected may
have low intent or may be not be desirable for hosts. In column (4) I add
controls for guest and trip characteristics (country of origin, number of guests,
lead time, whether the guest is reviewed, and number of nights). These con-
trols do not significantly affect the point estimate. In column (5), I limit the
sample to contacts which used the ‘Book It’ button. In this case, the guests
would have been committed to booking had the hosts accepted and therefore
have a high intent to book. The coefficient remains the same in magnitude.
Lastly, in column (6), I use a two-stage least squares strategy where I instru-
ment for rejection with an indicator for whether the host blocked off at least
one of the dates of the inquiry without being booked. The motivation for
this instrument is that, while screening rejections may be due to undesirable
guest-trip characteristics, stale vacancy rejections should be less related to un-
desirable guest-trip characteristics. Column (6) shows that the estimate from
the 2SLS specification is -.57, even larger than from the OLS specifications.
To summarize, there is a large association between rejections and searchers
leaving Airbnb without booking. This association persists and is similar in
magnitude even in specifications that control for non-causal mechanisms that
20

may result in this association. Therefore, rejection represents an important
transaction cost in this market. In the next two sections, I use a model of
searcher choice and host rejection to demonstrate how Airbnb’s market design
reduces transaction costs in the market.
5 The Role of Search Engine Design
In this section I estimate models of search and rejection and use them to study
the role of search engine design. The goal of this section is to understand the
magnitude of transaction costs and the quality of matches in the market in
a world where the the search engine were worse than it’s Airbnb’s circa 2013
- 2014. To make this counterfactual concrete, I consider a scenario in the
style of Craigslist, which existed as a marketplace for urban short-term rentals
before Airbnb. Figure 3 displays the results of a 2005 Craigslist search for
vacation rentals in New York, which are worse than those of Airbnb’s among
several dimensions. First, many of the listings displayed are not in New York,
don’t have a specified availability date, and don’t have a standardized price
per night. Second, Craigslist’s search engine has limited functionality relative
to Airbnb’s. It does not include accurate filters17 for geography within a city or
for the days of the trip. A filter for price is available but is not fully functional
because listed prices are not standardized per night. Furthermore, because
transactions do not take place on the site, the listed prices do not necessarily
reflect the actual prices which listings charge. Third, displayed listings are
not automatically removed when they are booked and there is no availability
tracking system on the site. Lastly, the results are displayed in chronological
order rather than by relevance. My results demonstrate that transaction costs
would be much larger in the Craigslist counterfactual, which may explain why
it was not a successful marketplace for short-term urban rentals.
17Although there are links for specific boroughs, these links also yield results which arenot geographically limited.
21

5.1 A Model of Searcher Choice
The goal of the searcher choice model is to predict which option a searcher
will choose from the set of all options that the searcher sees while searching. I
model this choice using a random utility discrete choice model. The searcher’s
contact decision is a function of the property characteristics, searcher and
search characteristics, and filtering choices. Conditional on these observables,
the searcher chooses listings to contact. The most important difference be-
tween this choice model and standard discrete choice models is that I use the
realized filter choices as proxies for otherwise unobservable idiosyncratic pref-
erences for neighborhood, room type, and price. For example, if a searcher
uses the map to filter for a particular neighborhood, I allow the searcher’s
choice probability to differ for listings in that neighborhood.
Denote each guest-trip (a combination of unique searcher, city, and trip
dates) as g. Each g receives utility from property, h, according to a linear
combination of property characteristics, interactions with idiosyncratic pref-
erences, and a guest specific error term according to the equation below:
ugh = α0 + (pgh + fgh)(FP ′gα1 +NFP ′gα1 + Z ′gα2) + f(Xht, Zg)′β1
+ κN + FNgh + FRgh +Rgh + γh + εgh(2)
where Xht is a vector of property characteristics including review quality,
property type and whether the host controls multiple listings. Zg is a vector
of trip and guest characteristics (Nights, Age, Guests, and a constant), pght
is the nightly price of the property for the trip, fght is the platform fee, FPg
is the maximum price filter used by the searcher (set to 0 if no price filter
used), NFPg is an indicator that takes the value of 1 if a price filter is used,
f(Xht, Zg) is a set of interactions between guest and host characteristics. κN
is a neighborhood fixed effect, FNgh is an indicator variable for whether a
listing’s neighborhood was specified by a searcher’s filter, FRgh is an indicator
variable for whether a listing’s room type was specified by a searcher’s filter,
Rgh is the lowest search rank a listing was shown at to the guest, and ηght is
22
an unobserved component of the utility which is distributed according to the
type 1 Extreme Value (EV) distribution.
The searcher can also choose the outside option and leave the platform
without sending a contact. The searcher’s value of the outside option is deter-
mined by the following equation:
ugo = T ′gµ+ γFP + αHg + εgo (3)
where Tgo are guest and trip characteristics, γFP is a set of dummy variables
that measure the filters used by the searcher, Hg is the number of listings seen
by the guest18 and εgo is a type 1 EV error term.
Before moving to the estimation, I discuss the interpretation of this model.
The main purpose of this model for the paper is prediction. However, the
estimated parameters can have a structural interpretation if additional and
restrictive assumptions are made. These assumptions include (i) that the
price is exogenous conditional on observed characteristics, (ii) that searchers
do not factor the idiosyncratic probability of rejection by a given listing in their
contact decisions, (iii) that, conditional on the observed characteristics, the
choices which determine the consideration set are independent of the listings
shown on the page, and (iv) that the minimum search rank term is treated as
a utility relevant parameter.
With regards to assumption (i), there are clearly omitted listing charac-
teristics which are not captured in my model, such as the whether a listing’s
photo looks good. With regards to assumption (ii), it is hard for searchers to
know rejection probabilities, as this information is not displayed in the search
results. Therefore, I view this assumption as reasonable. Assumption (iii)
is surely violated because the filtering decisions of searchers as a function of
previously seen listings. However, there is no suitable model of this process
in the literature that captures the facts discussed in section 3 and estimating
18This term can be interpreted in two ways. First, it controls for unobserved heterogeneityin a searcher’s returns from searching. Second, it serves as an analogue to the procedure inAckerberg and Rysman (2005), which mitigates the tendency of discrete choice models tooverstate the benefits of variety.
23

such a model is not the purpose of this paper.19
One mitigating feature of the Airbnb setting is that because listings are
removed from results when booked or blocked, there is a lot of variation in the
consideration sets of searchers which is unrelated to searcher characteristics
and endogenous filtering. Lastly, the estimated value of the outside option
includes the effective search cost because those who choose the outside option
avoid the cost of sending a contact and even those who do send a contact have
some probability of leaving without a transaction.
The data used to estimate the searcher model is described in subsection
3.1. I further filter this sample in several ways. First, I remove searchers who
see fewer than the maximum number of search results potentially displayed
on the page. Second, I remove searchers with more than 100 searches because
they have a high probability of being bots. Third, I limit searches to those
that occur within 60 days of check-in. Lastly, I include the chosen option as
well as random sample of up to 20 other options in the estimation procedure.
This sampling procedure reduces the computational time of the estimation
procedure and retains consistency (Train (2009) and Wasi and Keane (2012)).
The results of the estimation procedure are displayed in Table 4. The
coefficient estimates are normalized so that the non-interacted coefficient on
listing price is -1. The estimates are for the most part consistent with prior
intuition regarding listing quality. First, with regard to reviews, the average
rating and total number of five star reviews are predictive of choice. Second,
entire properties and listings with lower search ranks are more likely to be
chosen. Third, the outside option is more likely to be chosen when searches
have fewer guests, when searcher’s don’t filter for price, and when the search is
further away from the check-in date. Interestingly, listings that allow instant
booking are less likely to be chosen. This likely reflects the fact that, at least
during the sample period, listings that allowed instant book were of a lower
quality than those that did not.
The filtering behavior of searchers is highly predictive of choice. Listings
19One recent paper that models filtering in a rational expectations framework is Chenand Yao (Forthcoming)
24

which are in a neighborhood that the searcher filtered for have a $178 addi-
tional value to searchers. Similarly, listings which are of the property type that
is filtered for, are valued an additional $135 by searchers. The price filtering
behavior is also predictive of choice. The higher a searcher’s maximum price
filter, the less sensitive they are to the prices of listings and searchers who use
a price filter are less likely to pick the outside option.
5.2 A Model of Host Screening
In order to model counterfactual scenarios in which the consideration sets of
searchers change, I need to be able to predict when contacts will be rejected
by hosts. Subsection 4.1 describes three reasons why rejection occurs in this
market: congestion, stale vacancies, and screening. Of these, congestion and
stale vacancies occur in a manner that is unrelated to host preferences. On
the other hand, screening rejections occur because hosts have preferences over
when and whom they host. For example, a host might reject a contact be-
cause the guest is not reviewed, has a vague inquiry, or does not have enough
information in his profile. Hosts also reject guests because the check-in dates
of the inquiry can break up a bigger, uninterrupted time of availability for
the host, preventing future inquiries. Lastly, hosts may be waiting for a bet-
ter guest/trip combination or might not be willing to take a particular guest
for idiosyncratic reasons.20 In this section, I describe a simple model of the
decision to reject as a function of guest, trip, and listing characteristics.
The estimating equation for the screening model is:
Pr(Rgh) = Pr(α0 + Z ′hδ + f(Xg, Zh)′β + ηgh > 0) (4)
where ηgh is a logit error term, Rgh is an indicator for whether the response is
20For example, Edelman, Luca and Svirsky (2016) use an audit study to show that somehosts discriminate against non-reviewed guests with African-American names. I do notobserve race in my sample and cannot consequently control for it in this regression. However,since minority applicants are a minority of site users, this omitted variable in unlikely to bedriving my results. Furthermore, even though the audit study applicants had no reviews,pictures, or profile descriptions, they were still frequently accepted by hosts.
25

a rejection, Xg are the number of guests, guest reviews, guest gender, weekly
demand, days in advance of the trip nights, guest age, searcher census tract
demographics and month of check-in. Zh are property type, multi-listing host
indicator, host age, the number of reviews and price. f(Xg, Zh) are interactions
between guest and listing characteristics. I account for the dynamic aspects of
the host decision by controlling for the time in advance of the trip of inquiry
and for the overall demand for each week of check-in.21
The dataset for estimation is described in section 4. From this dataset, I
further select only contacts that were not rejected due to congestion or stale va-
cancies. This leaves me with 93,851 observations of contacts. Table 5 displays
the estimates from the above specification without random effects in column
(1), with listing random effects in column (2), and with listing fixed effects in
column (3). There are regularities across all 3 models. First, guests who send
an inquiry are more likely to be rejected. This is a function of two factors.
First, guests who send ‘book it’ requests are more committed to booking and
are likely to be accepted by hosts. Second, some ‘book it’ requests are instant
bookings, which means that they are guaranteed to be accepted. Next, guest
reputation affects host decisions. Guests have a prior review are less likely to
be rejected. However, the extent to which reviews are valued by hosts varies
across host types. Hosts who have multiple-listings and are less likely to value
the social aspect of the Airbnb transaction show no statistically significant
differences in rejection behavior between reviewed and non-reviewed guests.
Other types of guest information including Airbnb verification of identity and
profile descriptions are also associated with lower guest rejection rates.
Trip characteristics also affect the decisions of hosts. Trips with more guests
are less likely to be rejected by bigger listings. Furthermore, when the number
of guests equals the capacity of the host, the host is more likely to reject. The
number of nights is negatively correlated with rejections. All else equal, hosts
prefer longer trips to shorter trips. Lastly, hosts who allow instant booking
21A more sophisticated model of a host’s decision to accept or reject would require thehost to have expectations over the flow and quality of potential future searchers in themarket.
26

(either for all guests or just experienced guests) are less likely to reject, even
for cases when the guest sends an inquiry.
There is large heterogeneity in rejection probabilities across hosts. The
standard deviation of the host random effect in column (2) is 1.093, which is
larger in magnitude than any of the estimated coefficients. These heteroge-
neous rejection probabilities will be important in the section regarding poten-
tial improvements to the ranking algorithm. The reason is that the platform
can potentially use the ranking algorithm to redirect searchers to listings with
lower rejection probabilities.
5.3 The Effects of Search Engine Design
In this section, I use the previously estimated choice and rejection models (with
listing random effects) to show that the probability of searchers choosing the
outside option and being rejected would both drastically increase if Airbnb’s
search engine was degraded relative to it’s state during the sample period.
I make several simplifying assumptions regarding searcher and host be-
havior in calculating expected outcomes. First, with regards to searchers, I
keep searcher and search characteristics the same as in the data, and assume
that searchers see the same number of unique listings while searching. While
searchers would adjust their search intensity to changes in the search technol-
ogy, this is unlikely to reverse my findings. The history of this market suggests
that most searchers did not consider non-traditional short-term rentals when
Craigslist was the main option in the market. Therefore, most searchers would
react by either decreasing search intensity or leaving the market altogether.
Even if searchers were to increase their browsing intensity, the high chance of
rejection found in the counterfactuals would persist.
With regards to hosts, I assume that their screening rejection function re-
mains the same across counterfactual scenarios. While this is not fully realistic
– hosts may become less selective if there are fewer contacters — it is unlikely
to change the qualitative results of the counterfactuals. The are two reasons
for this. First, in counterfactuals where the search engine does not track avail-
27

ability, rejection is not typically caused by screening. Second, even if some
hosts reduce their screening intensity, heterogeneity in host rejection rates due
to host preferences will still persist.
Lastly, my counterfactuals are in partial equilibrium. For each entering
searcher, I assume that the past and future availability of a listing, as well as
its characteristics, remains as it was in the data. Of course, as explored in
Fradkin (2015), there are dynamic effects of marketplace policies. If a policy
change induces an additional listing to be booked today, that means that later
searchers will not be able to book that listing tomorrow. Furthermore, the
communication choices of searchers and host determine the level of conges-
tion in the market. Neither of these equilibrium effects will affect the baseline
conclusion of these counterfactuals — that without availability tracking and
filtering, searchers will see worse listings that are more likely to be unavail-
able.22
I first calculate expected outcomes in an approximation to the market in
the status quo. To do this, I use each searcher’s realized set of browsed listings
as a choice set, and calculate expected outcomes using the model predicted
probabilities of sending a contact and being rejected by the host who received
the contact.23 Rejections in this scenario can happen for three reasons. First,
the listing’s availability was stale for the contact dates. Second, the listing
chose to reject the contact due to screening. Third, the listing may have been
booked or declared unavailable prior to the search. In the “Status Quo” sce-
nario the third reason for rejection is excluded because Airbnb automatically
removes these listings from search.
22Another possibility is that hosts will reduce prices in response to a worse marketplacedesign. However, Farronato and Fradkin (2017) show that many hosts are at the margin ofparticipation giving the prevailing market prices and only transact in peak demand periods.Consequently, there is not much room for most hosts to decrease prices in this market.
23I make several additional simplifying adjustments. First, some listings seen in searchno longer appeared at the time the contact was sent. Since such listings are not present incounterfactual scenarios, I remove these listings from a searcher’s choice set and re-samplefrom the visible set of listings so that the total number of listings seen by each searcher is thesame as in the data. Second, since congestion rejections are relatively unimportant and are aproperty of multiple interacting searchers, I abstract away from these in the counterfactuals.Lastly, I draw each listing’s minimum rank for the choice model according to the empirical
28
Row (1) of Table 6 displays the results corresponding to this scenario. As in
the data, approximately 36% of searchers choose to send at least one inquiry.
Furthermore, 32% of those inquiries are rejected, which is several percentage
points less than the 36.5% rejection rate observed in the data. This is expected
because congestion rejections are not a part of these counterfactuals. Conse-
quently, 76% of searchers either choose to leave the platform before sending
an inquiry or are rejected in their first inquiry.
The set of browsed listings under the status quo is a function of several
features. First, the platform displays search results according to a ranking
algorithm. Second, the searcher used the search engine filters to find list-
ings closer to his or her preferences. Lastly, the search engine automatically
removed previously booked or unavailable listings from search. In the first
counterfactual, I assume that the search results are instead randomly drawn
from the set of all active listings in the market, regardless of their availabil-
ity. Row (2) shows that there is a 2 percentage point decrease in the share
of searchers who send a contact. This small decrease is due to the fact that
while the search is less directed, the previously booked listings are typically of
higher quality than those remaining in the market. In contrast to the contact
rate, the rejection rate more than doubles from 32% to 78%. This increase
comes primarily from the fact that 22% of searchers are now rejected because
the listing was previously booked. Furthermore, there is also an increase in
screening rejections because the previously booked listings also tend to be
more selective.
In aggregate, the features of filtering, ranking, and availability tracking
combine to increase the rate of searchers with accepted first contacts on Airbnb
from 7.7% to 24%. Furthermore, if we assume that the discrete choice model
provides a valid estimate of utility, the expected utility from booking for those
that are accepted falls from $155 to $140 per night. This means that under
random search, searchers find worse matches, even when they are successful
in finding a transaction partner.
In row (3), I consider what occurs when search is still random but the
distribution of minimum ranks in the data.
29

previously booked and unavailable listings are no longer visible. Under this
scenario, there is a 5 percentage point decrease in the contact rate and an 11
percentage point increase in the rejection rate. This results in a decrease of
6.1 percentage points in the share of searchers who send a first contact which
is accepted. This decrease is much smaller than the decrease in the prior
scenario, suggesting that availability tracking is relatively more important in
the functioning of this market than filtering. Interestingly, the expected utility
for an accepted contact is even smaller in this scenario than in the scenario
without availability tracking. The reason for this is that when the previously
booked listings are visible, available listings must have a high enough utility to
compete with the previously booked listings. In contrast, when the previously
booked listings are not visible, only lower utility listings are left for searchers
to contact.
I’ve shown that two search engine features greatly affect the probability
of a successful search on the Airbnb marketplace. If the marketplace did not
keep track of availability, then rejection rates for contacts regarding bookings
would increase to 78%. If anything, this provides an underestimate of the
true effects of a laissez-faire marketplace design. The Airbnb marketplace as
of 2014 was already curated. Many listings with high rejection rates or low
quality were either manually removed by Airbnb or endogenously left due to
their lack of competitive success in the market. In the next section, I study
the potential for ranking algorithms to further improve market outcomes.
6 The Potential for Improvement in Matching
Even with the marketplace design in 2014, many searchers either chose the
outside option or were rejected in their communications with hosts. This
outcome may be efficient from the perspective of the platform in two cases.
First, if there are no listings in the marketplace suitable to the searcher, then
the platform cannot improve the outcome of that searcher other than by adding
more suitable listings. Second, if the platform could not predict a rejection,
then the only way to discover the availability of a listing to a searcher would
30

be through communication. However, if either of these conditions fail then the
platform could potentially improve matching through search ranking or other
types of marketplace curation.
In this section I study the potential for improved matching. To do this, I
use my models of search and rejection to derive rankings of listings and I com-
pute what happens in the market when searchers see alternative consideration
sets based on these rankings. I consider three types of rankings calculated
according to the following equations:
1. wh,a =∑
h µgh (Average Quality)
2. wgh,p = µgh (Personalized Quality)
3. wgh,t = µgh ∗ (1 − Pr(Rgh)) (Rejection Weighted)
Ranking 1 is a measure of the average utility a listing provides to searchers
in the sample. This would be the easiest ranking to implement since it requires
no particular information about a specific searcher’s preferences.24 Rows (4)
and (5) of Table 6 display the market outcomes if searchers saw the same
sized consideration set as they do in the data, but that consideration set was
picked according to the ranking. Row (4) shows the results if the platform did
not keep track of availability. First, the average quality of the listings that
the searchers see greatly improves. Consequently, the share of searchers who
send a contact increases by 21 percentage points and the expected utility of an
accepted contact increases to $372 per night. However, because availability is
not tracked, 86% of contacts are rejected and the total share of searchers with
accepted first contracts is just 8%. This demonstrates that without availability
tracking, better ranking only has a limited effect on market outcomes. With
availability tracking, the market outcomes, shown in row (5), do improve. The
share of searchers with an accepted contact increases by 3.3 percentage points.
However, the probability of rejection is still higher relative to the status quo.
This occurs because better listings tend to be more selective and consequently
reject more inquiries. Furthermore, this is likely to be an underestimate of
31

the true effect on rejections because the highly correlated rankings among
searchers should also lead to more congestion rejections.
Ranking 2 uses the realized searcher characteristics and filters to calculate
a personalized utility estimate for each searcher and listing combination. This
likely represents an upper bound on the benefits of personalization because
information on which filters the searcher applies are not available until after
the search. Columns (6) and (7) display the results when this ranking is
used to form each searcher’s consideration set. Row (6) shows that, as in the
average quality ranking, without availability tracking the increase in rejection
rates overwhelms the benefits of personalization. Row (7) shows that when
availability is tracked, the personalized algorithm decreases the rate at which
searchers choose the outside option from 64% to 45%. Furthermore, while the
rejection rate does increase relative the status quo, the increase is not as large
as in the case of the average utility ranking. The personalized ranking yields a
3 percentage point increase in searchers who send a contact and are accepted
by their top choice. Lastly, the expected utility from an acceptance increases
by $79 relative to the average quality algorithm and $164 relative to the status
quo.
Neither rankings 1 nor 2 use the information on the screening propensities
of hosts. Ranking 3 explores the possibility of weighting the expected utility
from a listing by the host’s probability of rejecting a guest due to screening.
Such a ranking trades off listing quality for a lower chance of rejection. The
results of this counterfactual are displayed in row (8). The share of searchers
who choose the outside option increase by 1.6 percentage points relative to
the personalized ranking that maximizes expected utility conditional on an
acceptance. At the same time, the expected rejection rate falls from 44% to
36%. The cumulative effect of this policy is that the share of searchers with an
accepted first contact increases by 2.9 percentage points relative to the prior
ranking. Lastly, row (9) displays the results from an alternative search policy
where any option with an expected screening rejection probability greater than
24In contrast, a ranking algorithm based on the filters used in the process of search requiresa more sophisticated technical infrastructure and set of algorithms.
32

.45 is removed from the results. This policy slightly reduces the rejection
probability but does lead to worse options for searchers — the expected utility
from an accepted contact drops from $282 to $206. Therefore the policy of
removing high rejection results from search preforms worse than the rejection
weighted ranking.
The results from these counterfactuals suggest there is a large opportunity
for ranking to improve market efficiency relative to the status quo in 2014.
Rankings based on the expected quality of the match between the searcher and
the listing preform especially well in these counterfactuals. Indeed, informed
by earlier versions of this analysis, subsequent policy by the platform has
focused on matching in ranking algorithm design.
More generally, an optimal ranking algorithm would consider searcher and
host match utilities, the disutility to searchers from rejection, the benefits
of screening for hosts, and the costs to hosts of maintaining calendar accu-
racy. An important and interesting question for the platform is how to choose
the relative utility weights across these market outcomes. Algorithmic design
choices become even more complex when considering their equilibrium effects.
For example, hosts who value the ability to select guests may be relatively dis-
advantaged by algorithms which redirect search effort to less picky hosts. An
algorithm that penalizes rejection may encourage hosts to keep more accurate
calendars, to be more precise about the desired guest and trip characteristics,
and to become less selective. If the platform reduces average searcher trans-
action costs sufficiently through a new algorithm, this may improve outcomes
for all hosts on the platform through an increase in aggregate demand.
7 Discussion
Decentralized search and matching markets suffer from a variety of frictions
which result in transaction costs. Dating back to Coase (1937), economists
have emphasized how these costs affect the optimal structure of production
and exchange throughout the economy. In this paper, I’ve shown how the com-
bination of digital technology and marketplace design enables previously high
33
transaction cost modes of exchange to compete with the firm based forms of
exchange which comprise the majority of transactions in a developed economy.
In the context of Airbnb, the process of transacting is complicated by the
presence of large and heterogeneous choice sets as well as uncertainty regarding
the availability of an option. Airbnb’s marketplace design, which tracks avail-
ability and offers precise filters, greatly reduces these costs. Without these
features, searchers would need to expend much more effort to find suitable
matches in this market. This reduction in transaction costs is especially im-
portant given the fact that searchers have the outside option of booking a hotel
room while incurring much lower transaction costs.
I’ve also shown how the marketplace can use data on historical user be-
havior to predict match quality and generate better rankings. More broadly,
the marketplace can design interfaces which elicit useful information on both
buyer and seller preferences. The data generated by these interfaces can be
used to create better matches. For example, Airbnb gives hosts the ability
to turn on the “Instant Book” feature, which allows any guest who fulfills a
pre-specified set of criteria to book a listing. While this feature is relatively
unimportant in my dataset, its use has greatly expanded since 2014 due to
changes in marketplace rules and an improved interface that allows hosts to
express richer sets of preferences regarding suitable guests and trips. Similar
mechanisms can likely be used to improve the efficiency of other peer-to-peer
digital marketplaces and to create marketplaces in new verticals.
One important issue that this paper does not discuss is the dynamic mis-
allocation of matches. For example, earlier searchers may book highly de-
sirable listings, which would have been better matched with later searchers.
Economists typically assume that the price mechanism will solve these issues,
but in a complex marketplace where demand is volatile and the market struc-
ture is evolving, the assumption of optimal pricing by sellers is unlikely to
hold. Instead, the marketplace possesses much more information than indi-
vidual sellers and this information can be used for pricing or other matching
mechanisms. Indeed, marketplaces such as Airbnb, eBay, and Uber are ex-
perimenting with novel price-setting mechanisms that rely on large scale data
34

regarding demand, supply, and user behavior. New theories and empirical
methods are needed to understand the implications of these algorithmic poli-
cies on platform profits, market efficiency, and fairness.
Lastly, while this paper has focused on digital marketplaces that enable
new forms of trade, marketplace design also affects more traditional search
and matching markets. A large share of activity in the labor, housing, and
dating markets is now, at least partially, conducted through digital platforms.
Therefore, marketplace design may also have important effects on transaction
costs and match quality in these markets.
35

References
Ackerberg, Daniel A., and Marc Rysman. 2005. “Unobserved Product Dif-ferentiation in Discrete-Choice Models: Estimating Price Elasticities and WelfareEffects.” RAND Journal of Economics, 36(4): 771–788.
Albrecht, James, Bruno Decreuse, and Susan Vroman. 2017. “DirectedSearch with Phantom Vacancies.”
Albrecht, James, Pieter A. Gautier, and Susan Vroman. 2006. “EquilibriumDirected Search with Multiple Applications.” The Review of Economic Studies,73(4): 869–891.
Arnosti, Nick, Ramesh Johari, and Yash Kanoria. 2014. “Managing Con-gestion in Decentralized Matching Markets.” EC ’14, 451–451. New York, NY,USA:ACM.
Bakos, J. Yannis. 1997. “Reducing Buyer Search Costs: Implications for Elec-tronic Marketplaces.” Management science, 43(12): 1676–1692.
Bronnenberg, Bart, Jun B. Kim, and Carl Mela. 2016. “Zooming in onChoice.” Marketing Science.
Burdett, Kenneth, Shouyong Shi, and Randall Wright. 2001. “Pricing andMatching with Frictions.” Journal of Political Economy, 109(5): 1060–1085.
Chen, Yuxin, and Song Yao. Forthcoming. “Sequential Search with Refinement:Model and Application with Click-Stream Data.” Management Science.
Cheron, Arnaud, and Bruno Decreuse. 2017. “Matching with Phantoms*.”The Review of Economic Studies.
Coase, Ronald H. 1937. “The Nature of the Firm.” Economica, 4(16): 386–405.
Cullen, Zoe, and Chiara Farronato. 2016. “Outsourcing Tasks Online: Match-ing Supply and Demand on Peer-to-Peer Internet Platforms.” Manuscript.
De Los Santos, Babur, Ali Hortacsu, and Matthijs R. Wildenbeest. 2015.“Search with Learning for Differentiated Products: Evidence from E-Commerce.”Journal of Business & Economic Statistics, 00–00.
Dinerstein, Michael, Liran Einav, Jonathan Levin, and Neel Sundare-san. 2014. “Consumer Price Search and Platform Design in Internet Commerce.”National Bureau of Economic Research Working Paper 20415.
36

Edelman, Benjamin G., Michael Luca, and Dan Svirsky. 2016. “RacialDiscrimination in the Sharing Economy: Evidence from a Field Experiment.”Manuscript.
Einav, Liran, Chiara Farronato, and Jonathan Levin. 2016. “Peer-to-PeerMarkets.” The Annual Review of Economics.
Einav, Liran, Chiara Farronato, Jonathan Levin, and Neel Sundaresan.Forthcoming. “Auctions versus Posted Prices in Online Markets.”
Ellison, Glenn, and Alexander Wolitzky. 2012. “A Search Cost Model of Ob-fuscation.” The RAND Journal of Economics, 43(3): 417–441.
Ellison, Glenn, and Sara Fisher Ellison. 2009. “Search, Obfuscation, and PriceElasticities on the Internet.” Econometrica, 77(2): 427–452.
Farronato, Chiara, and Andrey Fradkin. 2017. “Market Structure with theEntry of Peer-to-Peer Platforms: The Case of Hotels and Airbnb.” Manuscript.
Fradkin, Andrey. 2015. “Search Frictions and the Design of Online Marketplaces.”
Fradkin, Andrey, Elena Grewal, Dave Holtz, and Matthew Pearson. 2015.“Bias and Reciprocity in Online Reviews: Evidence From Field Experiments onAirbnb.” EC ’15, 641–641. New York, NY, USA:ACM.
Fraiberger, Samuel P., and Arun Sundararajan. 2015. “Peer-to-Peer RentalMarkets in the Sharing Economy.” Social Science Research Network SSRN Schol-arly Paper ID 2574337, Rochester, NY.
Hall, Jonathan, Cory Kendrick, and Chris Nosko. 2016. “The Effects ofUber’s Surge Pricing: A Case Study.”
Hitsch, Gunter J., Ali Hortacsu, and Dan Ariely. 2010. “Matching and Sort-ing in Online Dating.” American Economic Review, 100(1): 130–163.
Horton, John J. 2016. “Misdirected Search Effort in a Matching Market: Causes,Consequences and a Partial Solution.” Working Paper.
Horton, John J. Forthcoming. “The Effects of Algorithmic Labor Market Recom-mendations: Evidence from a Field Experiment.” Journal of Labor Economics.
Horton, John J., and Richard J. Zeckhauser. 2016. “Owning, Using andRenting: Some Simple Economics of the” Sharing Economy”.” National Bureauof Economic Research.
Ke, T. Tony, Zuo-Jun Max Shen, and J. Miguel Villas-Boas. 2016. “Searchfor Information on Multiple Products.” Management Science.
37

Kircher, Philipp Albert Theodor. 2009. “Efficiency of Simultaneous Search.”Journal of Political Economy, 117(5): 861–913.
Klein, Tobias J., Christian Lambertz, and Konrad O. Stahl. Forthcom-ing. “Market Transparency, Adverse Selection, and Moral Hazard.” Journal ofPolitical Economy.
Lewis, Gregory. 2011. “Asymmetric Information, Adverse Selection and On-line Disclosure: The Case of eBay Motors.” The American Economic Review,101(4): 1535–1546.
McCall, J. J. 1970. “Economics of Information and Job Search.” The QuarterlyJournal of Economics, 84(1): 113–126.
Piazzesi, Monika, Martin Schneider, and Johannes Stroebel. 2015. “Seg-mented Housing Search.” National Bureau of Economic Research Working Paper20823.
Resnick, Paul, Ko Kuwabara, Richard Zeckhauser, and Eric Friedman.2000. “Reputation Systems.” Commun. ACM, 43(12): 45–48.
Roth, Alvin E. 2008. “What Have We Learned from Market Design?” The Eco-nomic Journal, 118(527): 285–310.
Stigler, George J. 1961. “The Economics of Information.” Journal of PoliticalEconomy, 69(3): 213–225.
Tadelis, Steven, and Florian Zettelmeyer. 2015. “Information Disclosure as aMatching Mechanism: Theory and Evidence from a Field Experiment.” AmericanEconomic Review, 105(2): 886–905.
Train, Kenneth E. 2009. Discrete Choice Methods with Simulation. Cambridge;New York:Cambridge University Press.
Varian, Hal R. 2010. “Computer Mediated Transactions.” The American Eco-nomic Review, 100(2): 1–10.
Wasi, Nada, and Michael P. Keane. 2012. “Estimation of Discrete ChoiceModels with Many Alternatives Using Random Subsets of the Full Choice Set:With an Application to Demand for Frozen Pizza.” Economics Group, NuffieldCollege, University of Oxford Economics Paper 2012-W13.
Wolthoff, Ronald P. 2011. “Applications and Interviews. A Structural Analysis ofTwo-Sided Simultaneous Search.” Fondazione Eni Enrico Mattei Working Paper2011.86.
38
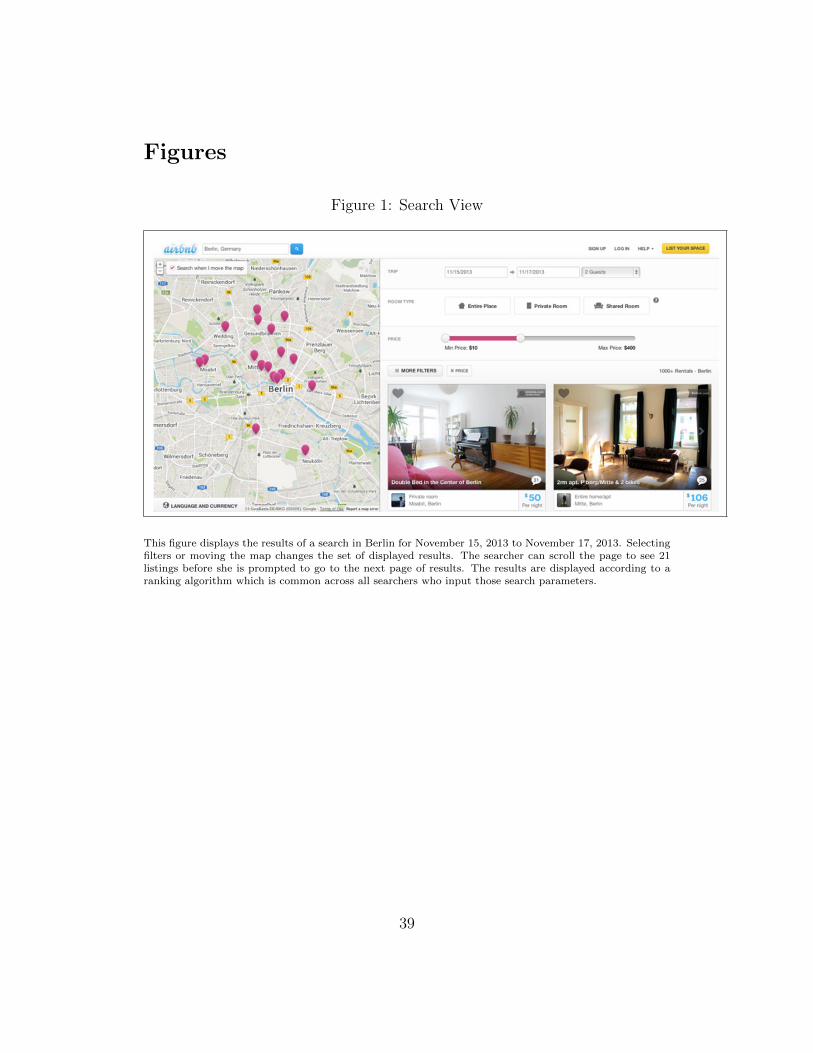
Figures
Figure 1: Search View
This figure displays the results of a search in Berlin for November 15, 2013 to November 17, 2013. Selectingfilters or moving the map changes the set of displayed results. The searcher can scroll the page to see 21listings before she is prompted to go to the next page of results. The results are displayed according to aranking algorithm which is common across all searchers who input those search parameters.
39

Figure 2: Listing View
A searcher who clicks on a listing in the search results sees the following view. The ratings and text ofreviews for the listing are visible lower on the page.
40

Figure 3: Craiglist Vacation Rentals Search - New York, 2005
This figure displays the search results from a Craigslist search for vacation rentals in New York City onFebruary 10th, 2005. Note that the first result is not located in New York, that prices are not standardized,and that listed availability dates vary across search results. “The Internet Archive” (https://archive.org/web/) was used to obtain these results.
41

Figure 4: Inquiry Submission Form
The figure above displays the prompt that searchers see when they click the “Contact Me” button.
Figure 5: Map Filtering Frequencies
The figure displays the share of searches that included a non-default map location for a given neighborhood.Each point represents a distinct neighborhood.
42

Figure 6: Maximum Price Filter Distribution
The figure displays the distribution of the maximum of the applied price filters per user for those users whoused the filter at least once in the sample.
Figure 7: Response Time Distribution (Hours)
The figure displays the distribution of the response times for inquiries sent to listings in the United Statesduring the sample period. Non-responses and responses which took longer than 48 hours are censored at 48hours. The distributions are plotted separately for inquiries which were accepted and rejected by the host.
43

Figure 8: Booking and Rejection Outcomes
Contact
Rejected
Not Rejected
37%
63%
Continue
Outside Option
Book
Book
49% 67%
33%
51%
75%
25%
Total %
6%
12%
19%
16%
47%
Outside Option
Outside Option
This figure displays the booking outcomes for users who sent one initial contact in the sample. Each numberon the tree represents the probability conditional on reaching the prior step. The final column displays theunconditional probabilities of each outcome. ‘Outside Option’ occurs when the searcher does not make abooking of any listing in the market for the date including and close to the dates of the initial inquiry.
44

Tables
Table 1: Descriptive Statistics per Searcher
(a) All Searchers
Statistic N Mean Pctl(25) Median Pctl(75)
Number of Searches 12,241 19.177 3 9 21Unique Listings Seen 12,241 68.530 31 54 88Share of Listings Seen 12,241 0.097 0.020 0.042 0.089Num. Nights Requested 12,241 0.000 0 0 0Num. Guests Requested 12,241 2.174 1 2 2Time Spent Browsing (min) 12,241 35.771 6.497 16.789 41.192Changes Default Map Location? 12,241 0.531 0 1 1Uses Map Zoom Feature? 12,241 0.383 0 0 1Uses Maximum Price Filter? 12,241 0.531 0 1 1Uses Room Type Filter? 12,241 0.636 0 1 1
(b) Searchers Sending a Contact
Statistic N Mean Pctl(25) Median Pctl(75)
Number of Searches 4,426 31.174 7 17 36Unique Listings Seen 4,426 87.812 42 73 114Share of Listings Seen 4,426 0.119 0.028 0.055 0.117Num. Nights Requested 4,426 0.000 0 0 0Num. Guests Requested 4,426 2.226 1 2 2Time Spent Browsing (min) 4,426 57.874 14.192 32.519 70.097Changes Default Map Location? 4,426 0.642 0 1 1Uses Map Zoom Feature? 4,426 0.501 0 1 1Uses Maximum Price Filter? 4,426 0.654 0 1 1Uses Room Type Filter? 4,426 0.695 0 1 1
The above table displays summary statistics for searchers who sent a contact in the sample. ‘Number ofSearches’ is the number of distinct searches in the two days leading up to either the first contact or the lastsearch in the city. ‘Unique listings’ is the number of unique listings seen during these searches. ‘Share ofListings Seen’ is the number of listings seen divided by the total potentially seen listings for the parametersof the search. ‘Nights’ and ‘guests’ are the modal trip parameters for the searcher. ‘Time Spent Browsing’is the total linger time calculated in minutes as the sum across all searches of the minimum of time untilthe next search or five minutes.
45

Table 2: Descriptive Statistics - Contacts
(a) City A
Statistic Mean Median Pctl(75)
Number of Contacts 2.367 1 3Number of Simultaneous Contacts 1.435 1 1Inquiry First 0.566 1 1Rejection 0.365 0 1Stale Vacancy Rejection 0.146 0 0Congestion Rejection 0.078 0 0Booked First Contact 0.378 0 1Booked Any 0.623 1 1
(b) All US Markets
Statistic Mean Median Pctl(75)
Number of Contacts 2.502 1 3Number of Simultaneous Contacts 1.510 1 1Inquiry First 0.630 1 1Rejection 0.331 0 1Stale Vacancy Rejection 0.150 0 0Congestion Rejection 0.073 0 0Booked First Contact 0.348 0 1Booked Any 0.563 1 1
The above table displays summary statistics for searchers who sent a contact to listings in the US. Eachobservation is a searcher who sent at least one contact in the city. ‘Simultaneous Contacts’ refers to thenumber of contacts that occur within one hour of the first contact (including the first contact). ‘InquiryFirst’ takes the value of one when the first contact was an inquiry rather than a booking request or instantbooking. ‘Rejection’ equals one when the first contact was rejection. ‘Stale Vacancy’ refers to rejections thatwere followed by the host setting the inquired for dates to be unavailable. ‘Congestion’ refers to rejectionsthat occurred because a prior contact to the same host for overlapping dates resulted in a booking. ‘BookedFirst Contact’ refers to the first contact resulting in a booking. ‘Booked Any’ equals one if the searcherbooked at least one listing in the market for the inquired set of dates.
46

Tab
le3:
The
Eff
ect
ofR
ejec
tion
son
Book
ing
Dep
enden
tV
aria
ble
Gues
tB
ook
sA
ny
Lis
ting
for
the
Tri
pD
ate
/M
arke
t
(1)
(2)
(3)
(4)
(5)
(6)
Rej
ecti
on−
0.41
1∗∗∗
−0.
409∗∗∗
−0.
374∗∗∗
−0.
395∗∗∗
−0.
387∗∗∗
−0.
578∗∗∗
(0.0
05)
(0.0
05)
(0.0
06)
(0.0
05)
(0.0
06)
(0.0
15)
Sen
dW
eek
-C
hec
k-i
nW
eek
FE
No
Yes
Yes
Yes
Yes
Yes
Gues
tan
dT
rip
Char
acte
rist
ics
No
No
No
Yes
Yes
Yes
Book
ing
Req
ues
tsO
nly
No
No
No
No
Yes
No
2SL
SN
oN
oN
oN
oN
oY
esO
bse
rvat
ions
43,7
2443
,724
26,0
7643
,691
22,5
6243
,691
Adju
sted
R2
0.16
00.
171
0.13
90.
209
0.22
70.
179
Note:
∗ p<
0.1;∗∗
p<
0.05
;∗∗∗ p<
0.01
Th
eta
ble
dis
pla
ys
the
resu
lts
of
regre
ssio
ns
wh
ere
the
ou
tcom
evari
ab
leis
wh
eth
era
searc
her
booked
alist
ing
inC
ity
Afo
ra
giv
entr
ipd
ate
.‘R
ejec
tion
’is
an
ind
icato
rvari
ab
lefo
rw
het
her
the
firs
tco
nta
ctof
the
searc
her
was
reje
cted
.O
nly
searc
her
sw
ith
on
eco
nta
ctw
ith
inth
efi
rst
2h
ou
rsof
conta
ctin
gare
incl
ud
edin
the
sam
ple
.C
olu
mn
(3)
lim
its
the
ob
serv
ati
on
sw
her
eth
efi
rst
conta
ctw
as
sent
more
than
2w
eeks
bef
ore
the
chec
k-i
nd
ate
.G
ues
tan
trip
chara
cter
isti
csin
clu
de
acu
bic
lead
tim
ep
oly
nom
ial
(in
days)
,an
ind
icato
rfo
rw
het
her
the
gu
est
was
revie
wed
pri
or
toth
eco
nta
ct,
nu
mb
erof
nig
hts
,nu
mb
erof
gu
ests
,an
dth
egu
est’
sco
untr
yof
ori
gin
.‘B
ookin
gre
qu
ests
’occ
ur
wh
enth
ese
arc
her
use
sth
e‘B
ook
It’
or
‘In
stant
Book’
op
tion
san
dco
mm
its
ase
arc
her
tob
ookin
gif
the
host
acc
epts
.T
he
two
stage
least
squ
are
sre
gre
ssio
nin
colu
mn
(6)
use
san
ind
icato
rfo
rw
het
her
the
reje
ctio
nw
as
du
eto
ast
ale
vaca
ncy
as
the
inst
rum
ent
inth
efi
rst
stage.
47

Table 4: Choice Model Estimates
Variable Estimate Std. Error
Price -1 0.076Avg. Rating 7.024 6.338
Total Reviews -2.585 0.751Total Five Star Reviews 4.007 1.037
Has Prof. Photo -3.013 6.734Weird Property Type -86.890 38.110Is Instant Bookable -76.590 9.376
No Reviews 79.156 30.601In Neigbhorhood Filter 177.575 8.780
Entire Prop. 58.961 10.293In Room Type Filter 134.776 10.621
Minimum Search Rank -20.280 0.702Outside Option (OO) 1, 079.051 865.502
OO x Guests -35.325 6.143OO x Checkin Date -0.007 0.053
OO x Num. Listings Seen -0.119 0.109OO x Lead Time 1.358 0.356
OO x Has Max Price -133.133 18.499Price x Max Price Filter 0.002 0.0002Price x Has Max Price -1.425 0.130
The above table displays results from a conditional logistic regression ofchoice probabilities among searchers. Up to 20 non-picked options are sam-pled in addition to the chosen option for each searcher (where the outsideoption can be chosen as well). The results above are normalized so thatsearchers with no price filter have a coefficient of -1 on the price. “WeirdProperty Type” refers to properties that are not apartments, houses, orcondos. “Is Instant Bookable” refers to whether a listing is open to beinginstant booked by at least some sample of users. “In Neighborhood Filter”equals one when the listing’s neighborhood is filtered for by the searcher.“In Room Type Filter” equals one when the listing’s room type (privateor entire home) is filtered for by the searcher. “Entire Prop.” equals onewhen the listing is for the rental of an entire property rather than a roomwithin a property. “OO” equals one when the option is the outside option.“Max Price Filter” is the maximum price filtered for by the searcher. “Min-imum Search Rank” is the minimum rank at which the listing appeared ina searchers results. “Num. Listings Seen” is the number of unique listingsseen by the searcher. “Lead Time” is the time (in days) between the searchand the check-in date. “Hotel Price” is the average hotel price in City Afor the days of the stay.
48

Table 5: Rejection Model Estimates
Dependent variable: Is Contact Rejected?
logistic generalized linear conditionalmixed-effects logistic
(1) (2) (3)
Inquiry First 0.786∗∗∗ 0.833∗∗∗ 0.792∗∗∗
(0.017) (0.019) (0.020)
Guest Reviewed −0.066∗∗∗ −0.090∗∗∗ −0.088∗∗∗
(0.023) (0.025) (0.026)
Guest Has About Description −0.034∗ −0.037∗ −0.039∗
(0.018) (0.020) (0.021)
Guest Verified −0.109∗∗∗ −0.111∗∗∗ −0.102∗∗∗
(0.018) (0.020) (0.021)
Guest Has Profile Photo −0.006 −0.022 −0.020(0.018) (0.020) (0.021)
New Guest −0.027 −0.021 −0.020(0.019) (0.021) (0.022)
Num. Guests 0.043∗∗∗ 0.017 0.004(0.015) (0.019) (0.020)
Num. Nights −0.086∗∗∗ −0.144∗∗∗ −0.156∗∗∗
(0.005) (0.006) (0.006)
Entire Property 0.432∗∗∗ 0.408∗∗∗
(0.034) (0.055)
Multi-listing Host −0.005 −0.031(0.021) (0.045)
Instant Book - Experienced −0.942∗∗∗ −0.582∗∗∗
(0.030) (0.049)
Instant Book - All −1.496∗∗∗ −0.890∗∗∗
(0.043) (0.064)
Instant Book - Social −0.668∗∗∗ 0.129(0.192) (0.359)
Full Guest Capacity 0.104∗∗∗ 0.110∗∗∗ 0.086∗∗∗
(0.016) (0.022) (0.026)
Reviewed Guest * Multi-Listing Host 0.057 0.123∗∗∗ 0.130∗∗∗
(0.039) (0.043) (0.044)
Num Guests * Entire Property −0.066∗∗∗ −0.044∗∗ −0.015(0.016) (0.020) (0.020)
Check-in Month and Lead Time Fixed Effects Yes Yes YesDemographic Controls Yes Yes YesListing RE No Yes NoListing FE No No YesObservations 93,851 93,851 93,851Log Likelihood −54,053.190 −49,167.270 −38,390.240
Note: ∗p<0.1; ∗∗p<0.05; ∗∗∗p<0.01
The above table displays results from three logistic regression models predicting whether a contact wasrejected, with column (2) including listing random effects, and column (3) including listing fixed effects.“Inquiry First” is an indicator for whether an inquiry was sent rather than a booking request. “ForeignGuest” refers to guests outside of the United States, “Guest Reviewed” refers to whether the guest hadat least one review prior to inquiry, “Guest Has About Description” refers to whether the guest had aprofile description, “Guest Verified” refers to whether the guest’s identity was verified by Airbnb, “NewGuest” refers to guests who signed up within 31 days of the inquiry. “Multi-listing Host” refers to a hostwho has more than 2 active listings. “Instant Book” refers to hosts who allow guests to book withoutthe possibility of rejection. “Experienced” requires that guests have had a prior stay, “All” is open to allpotential guests, and “Social” is open only to guests with a social connection to the host. “Full GuestCapacity” refers to inquiries in which the number of guests equals the capacity of the listing. Demographiccontrols for age (guest and host), gender (guest and host), and whether the guest is traveling from theUS are included in the above models.
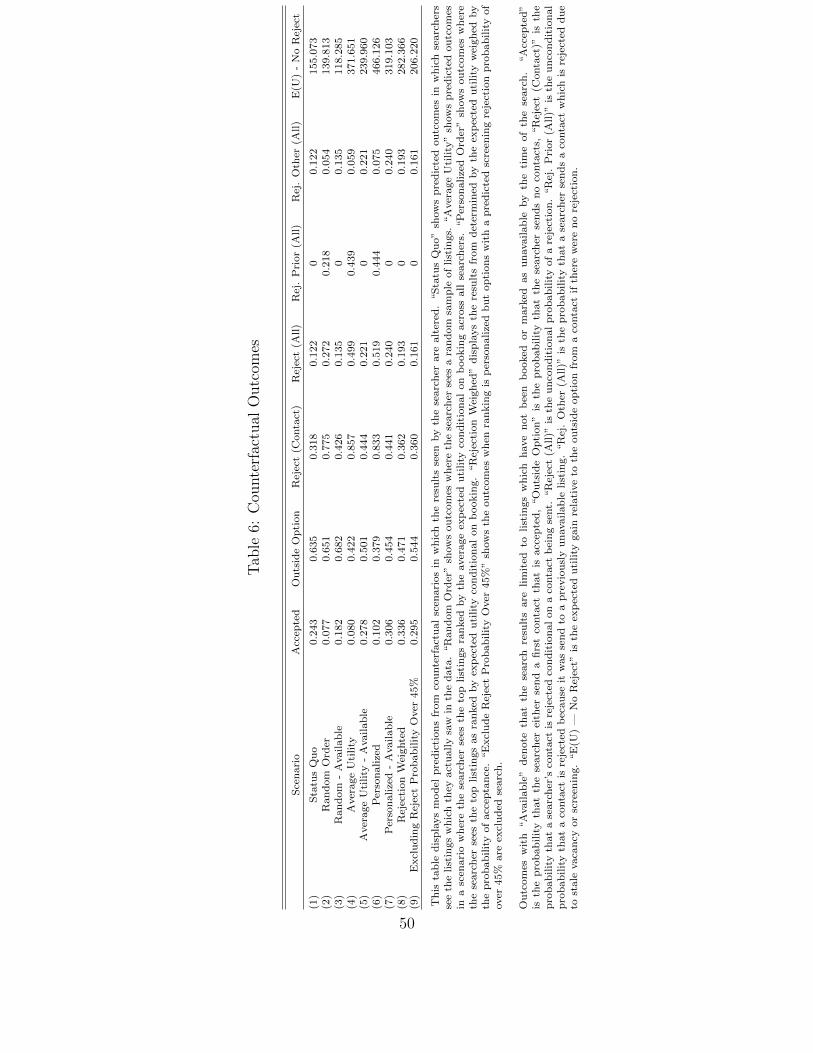
Tab
le6:
Cou
nte
rfac
tual
Outc
omes
Sce
nari
oA
ccep
ted
Ou
tsid
eO
pti
on
Rej
ect
(Conta
ct)
Rej
ect
(All)
Rej
.P
rior
(All
)R
ej.
Oth
er(A
ll)
E(U
)-
No
Rej
ect
(1)
Sta
tus
Quo
0.2
43
0.6
35
0.3
18
0.1
22
00.1
22
155.0
73
(2)
Ran
dom
Ord
er0.0
77
0.6
51
0.7
75
0.2
72
0.2
18
0.0
54
139.8
13
(3)
Ran
dom
-A
vailab
le0.1
82
0.6
82
0.4
26
0.1
35
00.1
35
118.2
85
(4)
Aver
age
Uti
lity
0.0
80
0.4
22
0.8
57
0.4
99
0.4
39
0.0
59
371.6
51
(5)
Aver
age
Uti
lity
-A
vailab
le0.2
78
0.5
01
0.4
44
0.2
21
00.2
21
239.9
60
(6)
Per
son
alize
d0.1
02
0.3
79
0.8
33
0.5
19
0.4
44
0.0
75
466.1
26
(7)
Per
son
alize
d-
Avail
ab
le0.3
06
0.4
54
0.4
41
0.2
40
00.2
40
319.1
03
(8)
Rej
ecti
on
Wei
ghte
d0.3
36
0.4
71
0.3
62
0.1
93
00.1
93
282.3
66
(9)
Excl
ud
ing
Rej
ect
Pro
bab
ilit
yO
ver
45%
0.2
95
0.5
44
0.3
60
0.1
61
00.1
61
206.2
20
Th
ista
ble
dis
pla
ys
mod
elp
red
icti
on
sfr
om
cou
nte
rfact
ual
scen
ari
os
inw
hic
hth
ere
sult
sse
enby
the
searc
her
are
alt
ered
.“S
tatu
sQ
uo”
show
sp
red
icte
dou
tcom
esin
wh
ich
searc
her
sse
eth
elist
ings
wh
ich
they
act
ually
saw
inth
ed
ata
.“R
an
dom
Ord
er”
show
sou
tcom
esw
her
eth
ese
arc
her
sees
ara
nd
om
sam
ple
of
list
ings.
“A
ver
age
Uti
lity
”sh
ow
sp
red
icte
dou
tcom
esin
asc
enari
ow
her
eth
ese
arc
her
sees
the
top
list
ings
ran
ked
by
the
aver
age
exp
ecte
du
tility
con
dit
ion
al
on
bookin
gacr
oss
all
searc
her
s.“P
erso
nalize
dO
rder
”sh
ow
sou
tcom
esw
her
eth
ese
arc
her
sees
the
top
list
ings
as
ran
ked
by
exp
ecte
du
tility
con
dit
ion
al
on
bookin
g.
“R
ejec
tion
Wei
gh
ed”
dis
pla
ys
the
resu
lts
from
det
erm
ined
by
the
exp
ecte
du
tili
tyw
eigh
edby
the
pro
bab
ilit
yof
acc
epta
nce
.“E
xcl
ud
eR
ejec
tP
rob
ab
ilit
yO
ver
45%
”sh
ow
sth
eou
tcom
esw
hen
ran
kin
gis
per
son
alize
db
ut
op
tion
sw
ith
ap
red
icte
dsc
reen
ing
reje
ctio
np
rob
ab
ilit
yof
over
45%
are
excl
ud
edse
arc
h.
Ou
tcom
esw
ith
“A
vailab
le”
den
ote
that
the
searc
hre
sult
sare
lim
ited
tolist
ings
wh
ich
have
not
bee
nb
ooked
or
mark
edas
un
availab
leby
the
tim
eof
the
searc
h.
“A
ccep
ted
”is
the
pro
bab
ilit
yth
at
the
searc
her
eith
erse
nd
afi
rst
conta
ctth
at
isacc
epte
d,
“O
uts
ide
Op
tion
”is
the
pro
bab
ilit
yth
at
the
searc
her
sen
ds
no
conta
cts,
“R
ejec
t(C
onta
ct)”
isth
ep
rob
ab
ilit
yth
at
ase
arc
her
’sco
nta
ctis
reje
cted
con
dit
ion
al
on
aco
nta
ctb
ein
gse
nt.
“R
ejec
t(A
ll)”
isth
eu
nco
nd
itio
nal
pro
bab
ilit
yof
are
ject
ion
.“R
ej.
Pri
or
(All
)”is
the
un
con
dit
ion
al
pro
bab
ilit
yth
at
aco
nta
ctis
reje
cted
bec
au
seit
was
sen
dto
ap
revio
usl
yu
navailab
lelist
ing.
“R
ej.
Oth
er(A
ll)”
isth
ep
rob
ab
ilit
yth
at
ase
arc
her
sen
ds
aco
nta
ctw
hic
his
reje
cted
du
eto
stale
vaca
ncy
or
scre
enin
g.
“E
(U)
—N
oR
ejec
t”is
the
exp
ecte
du
tility
gain
rela
tive
toth
eou
tsid
eop
tion
from
aco
nta
ctif
ther
ew
ere
no
reje
ctio
n.
50