Safety In Numbers
16
Safety In Numbers Fisheries Monitoring and Analysis Division North Pacific Observer Program A Two-year Analysis of Safety Incidents in the North Pacific Observer Program: Can Numbers Be Used to Enhance Observer Safety?
-
Upload
alex-perry -
Category
Documents
-
view
69 -
download
0
Transcript of Safety In Numbers
Safety In Numbers
Fisheries Monitoring and Analysis DivisionNorth Pacific Observer Program
A Two-year Analysis of Safety Incidents in the North Pacific Observer Program:
Can Numbers Be Used to Enhance Observer Safety?

Introduction/Overview• Restructured Observer Program in 2013
– Added previously unobserved vessels from 40-60 feet length overall (LOA) in new Partial Coverage Fleets.
– This report analyzes data collected during the first 2 years of implementation for ROP.
• End of deployment observer survey.• Among many topics covered by the survey, it contains safety related
questions, the data from which will be the subject of this examination.

Background, Dataset Limitations• Operational hypothesis: there will be observable differences in
the types and rates of safety incidents reported between different vessels based on coverage rate, vessel size, and gear type.
• Can the data be used to:– demonstrate patterns across the fleets?– learn lessons about vessel and observer safety? – highlight avenues to improve observer safety in the future?
• Some limitations to the data set:– Preliminary information reported by observers:– May not represent all incidents across the various fleets.

Methods• The data used for this study are:
– Marine casualty incident reports.– Other safety issues encountered and reported that may affect the observers’
safety, health, well being.• Data sources examined for:
– Rates of reported safety incidents by coverage sector.– Rates of reported marine casualty incidents by vessel size.– Rates of marine casualty incidents by fishing gear, fishery, and vessel type.
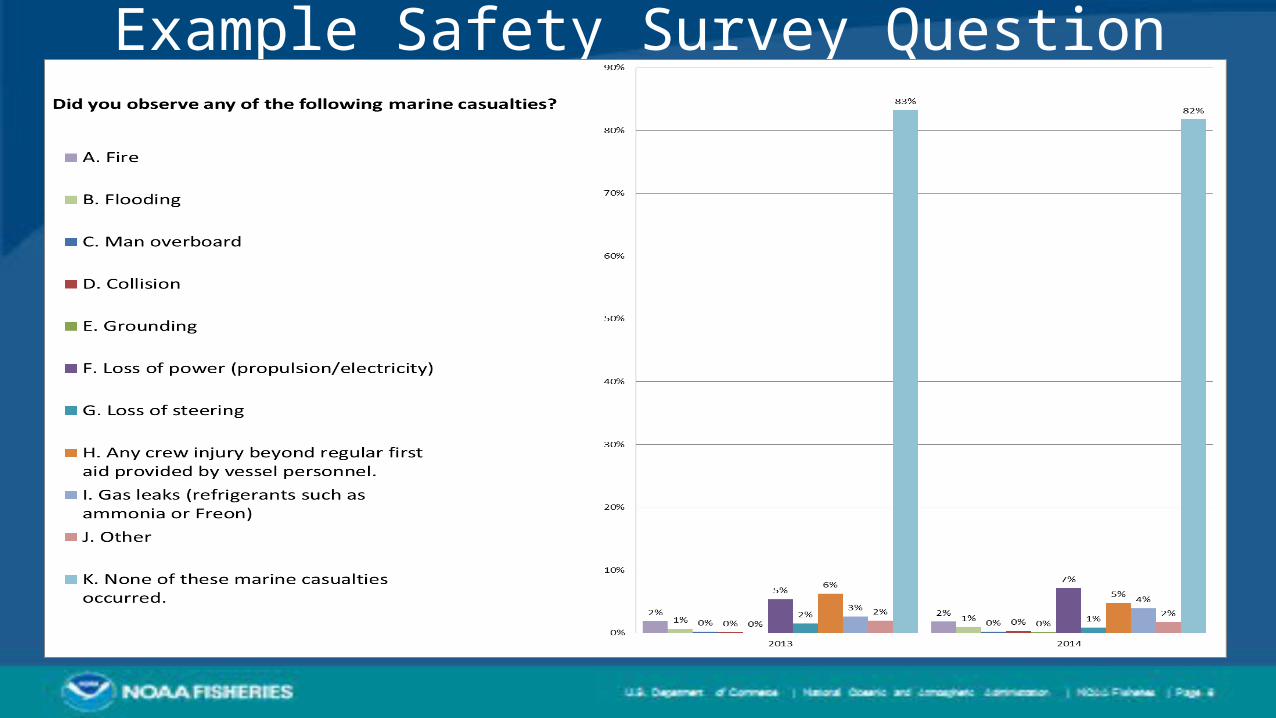
Example Safety Survey Question

Example Safety Survey Question

Example Safety Survey Question

Vessel Marine Casualty Incidents Reported
4820
54
4
171
37
166
86
Vessel Reported Incidents Incidence 2013-2014Σ=541 casualties reported over 82,518 assigned days.0.007 casualties reported per observer assigned day.
A. FireB. FloodingC. Man overboardD. CollisionE. GroundingF. Loss of power (propulsion/electricity)G. Loss of steeringH. Any crew injury beyond regular first aid provided by vessel personnel.I. Gas leaks (refrigerants such as ammonia or Freon)

Assigned Days by Coverage Sector(2013-2014)
• Partial Coverage Stratum 40’-57.4’ (11% Target Coverage Rate): Σ = 2518 days.
• Partial Coverage Stratum >57.4’ (16% Target Coverage Rate): Σ = 5361 days.
• Full Coverage Stratum (100-200% Coverage Rate): Σ = 74639 assigned days.

Reported Lack of Drift/Wheelwatch by Fleet/Coverage Sector
PC 40'-57.4' (~11%) PC> 57.4' (~16%) FC 124'-272' (100-200%)
0
2
4
6
8
10
12
14
16
11
15
7
2013-2014 Reported Lack of Drift Watch by Coverage Sector
PC FC0
2
4
6
8
10
12
14
16
18
2013
2014
17
6
9
1
Drift Watch Reports by Sector

Rate of Wheelwatch Reports by Coverage Sector
• Rate determined by dividing number of reported incidents by observer assigned days.
• Vessel selection (11/2518) = 0.437%• Trip Selection (15/5361) = 0.280%• Full Coverage (7/74639)= 0.009%
PC 40'-57.4' PC >57.4' FC 124'-272'0.00%0.05%0.10%0.15%0.20%0.25%0.30%0.35%0.40%0.45%0.50%

Fire
Flooding
Man Overb
oard
Collision
Grounding
Loss
of Power
Loss
of Steerin
g
Crew Injury
Gas Leaks
0
20
40
60
80
100
120
140
160
PC 40'-57.4' (~11%)
FC (100-200%
)1 1 1 18
3 1
2 1 211
7 61
45
18
4 4 1
152
27
159
85
Reported Casualties by Coverage Sector 2013-2014
PC 40'-57.4' (~11%) PC >57.4' (~16%) FC (100-200%)

Casualty Rate Comparisons Partial And Full Coverage Fleets
Fire
Flooding
Man Ove
rboard
Collision
Grounding
Loss
of Power
Loss
of stee
ring
Crew In
jury
Gas Le
aks
0.0000000
0.0005000
0.0010000
0.0015000
0.0020000
0.0025000
0.0030000
0.0035000
PC 40'-57.4' (11%)
PC >57.4' (16%)
FC (100-200%)
0.0003971 0.0003971 0.0003971 0.0003971
0.0031771
0.0011914
0.0003971
0.00037310.0001865
0.0003731
0.0020519
0.0013057
0.0011192
0.0001865
0.0006029
0.0002411
0.0000535 0.0000535
0.0000133
0.0020364
0.0003617
0.0021302
0.0011388
Reported Casualty Rates Between Sector, 2013-2014 (Normalized by Assigned Days)
PC 40'-57.4' (11%) PC >57.4' (16%) FC (100-200%)Fire Flooding Man
OverboardCollision Grounding Loss of
powerLoss of
steeringCrew Injury Gas leaks
0
0.0005
0.001
0.0015
0.002
0.0025
PC
FC
0.0003807
0.0002538
0.0001269
0.0003807
0.0024114
0.0012691
0.0008884
0.0001269
0.0006029
0.0002411
0.0000535 0.00005350.0000133
0.0020364
0.0003617
0.0021302
0.0011388
PC Combined Casualty Report Rate2013-2014

Results/DiscussionWheelwatch infraction reports
Much higher report rate in Partial Coverage fleets (~35x)
Grounding reports
Much higher report rate in PC (~29x)
Loss of steering reports
~3.5x higher report rate in PC fleet
Man overboard reports
~2x higher reported rate in the PC fleet
Loss of Power reports
Relatively even report rates across coverage sectors
Flooding reports
Relatively even rates across coverage sectors
Collision reports
Very low rate, slightly higher report rate in FC fleets.
Fire reports
~1.6x higher report rate in FC fleets
Crew injury/illness reports
~2.5x higher report rate in FC fleets
Gas leak reports
~9x higher report rate in FC fleets

Conclusions• The NPGHOP has an excellent system in place for collecting
safety and deployment related data via observer surveys, enabling dissemination of data to external agencies for investigations, and studies such as this to be performed.
• This can result in continually improving observer safety through fleet education, improvements to safety and sampling gear, and observer training.
• More years of data can continue to be analyzed in the future in an ongoing effort to promote observer safety on board the commercial fishing vessels in our fleets.

Questions?
Fisheries Monitoring and Analysis DivisionNorth Pacific Observer Program
Thanks to: • Chris Rilling• Brian Mason• Liz Chilton• Ren Narita
• Andy Kingham• Mike Moon• Craig Faunce
• Heather Weikart• Jennifer Cahalan