Rural Income Generating Activities: A Cross Country...
28
1 Rural Income Generating Activities: A Cross Country Comparison Benjamin Davis (FAO), Paul Winters (American University), Gero Carletto (World Bank), Katia Covarrubias (FAO), Esteban Quinones (FAO), Alberto Zezza (FAO), Kostas Stamoulis (FAO) and Stefania DiGiuseppe (FAO) September 7, 2007 Paper for presentation at the 106th EAAE Seminar on “Pro-poor development in low income countries: Food, agriculture, trade, and environment” 25-27 October 2007 Montpellier, France
Transcript of Rural Income Generating Activities: A Cross Country...
1
Rural Income Generating Activities: A Cross Country Comparison
Benjamin Davis (FAO), Paul Winters (American University), Gero Carletto
(World Bank), Katia Covarrubias (FAO), Esteban Quinones (FAO), Alberto
Zezza (FAO), Kostas Stamoulis (FAO) and Stefania DiGiuseppe (FAO)
September 7, 2007
Paper for presentation at the 106th EAAE Seminar on
“Pro-poor development in low income countries:
Food, agriculture, trade, and environment”
25-27 October 2007
Montpellier, France
2
Rural Income Generating Activities: A Cross Country Comparison
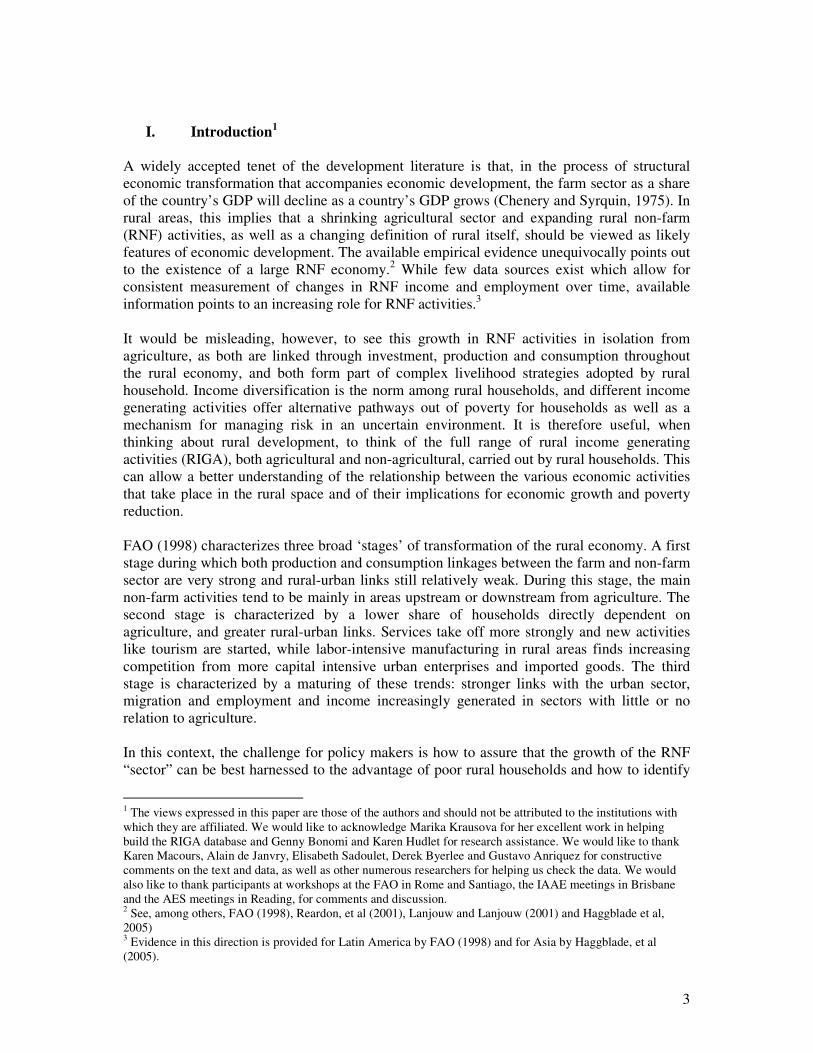
Abstract:
This paper uses a newly constructed cross country database composed of comparable
variables and aggregates from household surveys to examine the full range of income
generating activities carried out by rural households in order to determine: 1) the relative
importance of the gamut of income generating activities in general and across wealth
categories; 2), the relative importance of diversification versus specialization at the household
level; and 3) the influence of rural income generating activities on poverty and inequality.
Analysis of the RIGA cross country dataset paints a clear picture of multiple activities across
rural space and diversification across rural households. This is true across countries in all four
continents, though less so in the African countries included in the dataset. For most countries
the largest share of income stems from off farm activities, and the largest share of households
have diversified sources of income. Diversification, not specialization, is the norm, although
most countries show significant levels of household specialization in non-agricultural
activities as well. Nevertheless, agricultural based sources of income remain critically
important for rural livelihoods in all countries, both in terms of the overall share of agriculture
in rural incomes as well as the large share of households that still specialize in agricultural
sources of income.
3
I. Introduction1
A widely accepted tenet of the development literature is that, in the process of structural
economic transformation that accompanies economic development, the farm sector as a share
of the country’s GDP will decline as a country’s GDP grows (Chenery and Syrquin, 1975). In
rural areas, this implies that a shrinking agricultural sector and expanding rural non-farm
(RNF) activities, as well as a changing definition of rural itself, should be viewed as likely
features of economic development. The available empirical evidence unequivocally points out
to the existence of a large RNF economy.2 While few data sources exist which allow for
consistent measurement of changes in RNF income and employment over time, available
information points to an increasing role for RNF activities.3
It would be misleading, however, to see this growth in RNF activities in isolation from
agriculture, as both are linked through investment, production and consumption throughout
the rural economy, and both form part of complex livelihood strategies adopted by rural
household. Income diversification is the norm among rural households, and different income
generating activities offer alternative pathways out of poverty for households as well as a
mechanism for managing risk in an uncertain environment. It is therefore useful, when
thinking about rural development, to think of the full range of rural income generating
activities (RIGA), both agricultural and non-agricultural, carried out by rural households. This
can allow a better understanding of the relationship between the various economic activities
that take place in the rural space and of their implications for economic growth and poverty
reduction.
FAO (1998) characterizes three broad ‘stages’ of transformation of the rural economy. A first
stage during which both production and consumption linkages between the farm and non-farm
sector are very strong and rural-urban links still relatively weak. During this stage, the main
non-farm activities tend to be mainly in areas upstream or downstream from agriculture. The
second stage is characterized by a lower share of households directly dependent on
agriculture, and greater rural-urban links. Services take off more strongly and new activities
like tourism are started, while labor-intensive manufacturing in rural areas finds increasing
competition from more capital intensive urban enterprises and imported goods. The third
stage is characterized by a maturing of these trends: stronger links with the urban sector,
migration and employment and income increasingly generated in sectors with little or no
relation to agriculture.
In this context, the challenge for policy makers is how to assure that the growth of the RNF
“sector” can be best harnessed to the advantage of poor rural households and how to identify
1 The views expressed in this paper are those of the authors and should not be attributed to the institutions with
which they are affiliated. We would like to acknowledge Marika Krausova for her excellent work in helping
build the RIGA database and Genny Bonomi and Karen Hudlet for research assistance. We would like to thank
Karen Macours, Alain de Janvry, Elisabeth Sadoulet, Derek Byerlee and Gustavo Anriquez for constructive
comments on the text and data, as well as other numerous researchers for helping us check the data. We would
also like to thank participants at workshops at the FAO in Rome and Santiago, the IAAE meetings in Brisbane
and the AES meetings in Reading, for comments and discussion. 2 See, among others, FAO (1998), Reardon, et al (2001), Lanjouw and Lanjouw (2001) and Haggblade et al,
2005) 3 Evidence in this direction is provided for Latin America by FAO (1998) and for Asia by Haggblade, et al
(2005).
4
the mechanisms to best exploit synergies across agricultural and non-agricultural sectors. The
growing consensus is that although agriculture continues to play a central role in rural
development, the promotion of complementary engines of rural growth is of paramount
importance. Yet, the poverty and inequality implications of promoting RNF activities are not
straightforward. They depend on the access of the poor to RNF activities, the potential returns
to RNF activities and the share of RNF activities in total income. Just as for agriculture, the
ability of poor individuals and/or households to participate in potentially more lucrative RNF
activities may be limited given barriers to entry in terms of liquidity or human capital
constraints. When that is the case, a vicious circle may be established whereby poor
households get relegated to low-return RNF activities that serve more as coping strategies
than as a way out of poverty. Promotion of RNF activities may then leave poor household
behind and exacerbate rural income inequality.
The general objective of this background paper is to analyze rural income generating activities
in order to contribute to the design of more effective and better targeted rural development
policies. The specific objectives are to examine the full range of rural income generating
activities carried out by rural households in order to determine: 1) the relative importance of
the gamut of income generating activities in general and across wealth categories, both at the
level of the rural economy and the rural household; 2), the relative importance of
diversification versus specialization in rural income generating activities at the household
level; and 3) the influence of rural income generating activities on poverty and inequality.
While there has been some focus in recent years on rural non-farm activities in the
development literature, most of which are cited in this paper, a number of limitations suggest
the need for further work. First, most of the previous literature has focused on the
diversification into rural non-farm activities at the level of the rural economy. This is usually
done by gauging the shares of different income sources over the rural population or over
groups of rural households. This paper instead stresses the diversification and specialization
of income generating strategies at the level of the rural household.
Second, the methodologies of past efforts have typically not been comparable across
countries. For example, Lanjouw and Feder (2001) note that much of the observed variation
among countries in the share of RNF activities stems from weaknesses in the data being used
since for many countries data are outdated or missing altogether while for others, the only
available data are often case studies of limited geographical reach and therefore not nationally
representative. For those other countries for which nationally representative data are available
and fairly recent, country specific studies typically use idiosyncratic methodologies which are
not comparable with similar studies in other countries, as individual researchers tend to use
definitions and methods tailored for a country in question.
In order to address directly these data concerns, this paper takes advantage of a newly
constructed cross country database composed of comparable variables and aggregates from
selected high-quality household surveys, which we refer to as the RIGA database. The RIGA
database allows for a systematic analysis of data from a range of countries and thus greater
confidence in the comparability of results.
To meet the objectives of this paper, the following areas are covered. In Section II, we
describe the RIGA database. In Section III, we analyze the participation of rural households in
rural income generating activities and the share of income from each activity in household
income, over all households and by expenditure quintile. In Section IV we move from the
5
level of the rural space to that of the rural household, examining patterns of diversification
and specialization in rural income generating activities, again over all households and by
expenditure quintile. In Section V, we decompose income inequality by income source, for all
countries, using the Theil index. Conclusions are then presented in Section VI.
II. Description of the RIGA database
The analysis presented in this background paper utilizes the RIGA database, which is
constructed from a pool of several dozen Living Standards Measurement Study (LSMS) and
other multi-purpose household surveys made available by the World Bank through a joint
project with FAO.4 From this pool of possible surveys, the choice of particular countries was
guided by the desire to ensure geographic coverage across the four principal development
regions – Asia, Africa, Eastern Europe and Latin America –, as well as adequate quality and
sufficient comparability in codification and nomenclatures.
Using these criteria, survey data from the list of countries in Table 1 were utilized. Each
survey is representative for both urban and rural areas; only the rural sample was used for this
analysis. While clearly not representative of all developing countries, the list does represent a
significant range of countries and regions and has proved useful in providing insight into the
income generating activities of rural households in the developing world.
Table 1. Countries included in the analysis
Eastern Europe
Africa
Latin America
Asia
Albania, 2005 Ghana, 1998 Guatemala, 2000 Bangladesh, 2000
Bulgaria, 2001 Madagascar, 1993 Ecuador, 1995 Indonesia, 2000
Malawi, 2004 Nicaragua, 2001 Nepal, 1996
Nigeria, 2004 Panama, 2003 Pakistan, 2001
Vietnam, 1998
Once the countries were selected the next critical step was to construct income aggregates that
were comparable across countries.5 This required resolving a host of issues that arose in the
construction of the aggregates. The first key choice relates to the definition of rural and,
correspondingly, which households are considered rural households for the analysis.
Countries have their own unique mechanisms of defining what constitutes rural. However,
government definitions tend not to be comparable across countries and this may make
differences in results driven by the fact that rural is not being defined in the same way. On the
other hand, it may make sense to use government definitions since presumably this definition
reflects local information about what constitutes rural and is the definition used to administer
government programs. While recognizing the potential problem with using country-specific
definitions of rural, the available survey data do not allow for a straightforward alternative
definition and therefore the government definition of what constitutes rurality is used.
A second choice is to determine how to disaggregate income data in a manner that is
consistent across countries. One common initial division is between agricultural and non-
agricultural activities although defining this distinction in a concise manner is potentially
4 A more detailed description of the database can be found in a longer version of this paper (Davis, et al 2007). 5 Details of the construction of the income aggregates can be found in Carletto, Covarrubias and Krausova
(2007).
6
problematic. A second common division of income, for both agriculture and non-agricultural
activities, is between wage employment and self-employment. Additionally, transfer
payments, either from public or private sources may be included. For this study, seven basic
categories of income have been identified for analysis: 1) crop production income; 2)
livestock production income; 3) agricultural wage employment income, 4) non-agricultural
wage employment income; 5) non-agricultural self employment income; 6) transfer income;
and 7) other income. For some of the analysis, transfer income is further divided into public
and private sources. In addition to this classification, non-agricultural wage employment
income and non-agricultural self employment income have been further disaggregated by
industry using standard industrial codes.
Although these seven created categories form the basis of the analysis, in certain cases these
are aggregated into higher level groupings depending on the type of analysis being carried
out. In one grouping, we distinguish between agricultural and non-agricultural activities. In
this case, the first three categories (crop, livestock and agricultural wage income) make up
agricultural activities while the latter four (non-agricultural wage, non-agriculture self
employment, transfer and other income) represent non-agricultural activities. In a second
grouping, we refer to the first two categories (crop and livestock income) as on-farm
activities, categories 4 and 5 (non-agricultural wage and self employment income), as non-
farm activities, and leave agricultural wage employment, transfer and other income as
separate categories. Finally, we also use the concept of off farm activities, which includes all
non agricultural activities plus agricultural wage labor.
For each of the countries listed in Table 1, income aggregates for rural households were
created as described. Furthermore, a comparable set of household variables—including
demographic characteristics, asset endowments and access to infrastructure and institutions—
was created in order to facilitate the analysis of the data. As with the income aggregates, these
variables were also created in a comparable manner across countries. As an indicator of
welfare levels we used the consumption expenditure aggregates that accompanied each
dataset, each of which had been constructed in a largely comparable fashion according to
widely accepted and internationally recognized criteria. The final set of data used for this
analysis includes 15 nationally representative, comparable datasets with a consistent set of
variables.
III. Rural diversification of income sources
The majority of studies in the existing literature on rural non-farm activities focus on the
diversification of income sources over rural space, or over groups of households within the
rural space. To examine rural diversification, we begin by looking at the share of income from
rural income generating activities as well as household participation rates in the different rural
income generating activities. At this level of analysis, the RIGA data reveal high levels of
rural diversification in terms of income sources in most countries. Yet, rural diversification
clearly does not necessarily mean complete abandonment of on-farm crop and livestock
activities, as most rural households in most countries maintain on-farm activities, despite
participation in other off farm activities. Following the general discussion of rural income
generating activities, we look more closely at rural non-farm activities and the range of
industries in which households participate, finding that even within this sector activities vary
greatly. A similar detailed analysis of transfers follows to determine the relative importance of
public and private transfers which shows significant variability across countries. Finally, the
7
relationship between wealth status and rural income generating activities is examined using
expenditure quintiles. The results highlight the fact that certain activities tend to be more
closely associated with economic status.
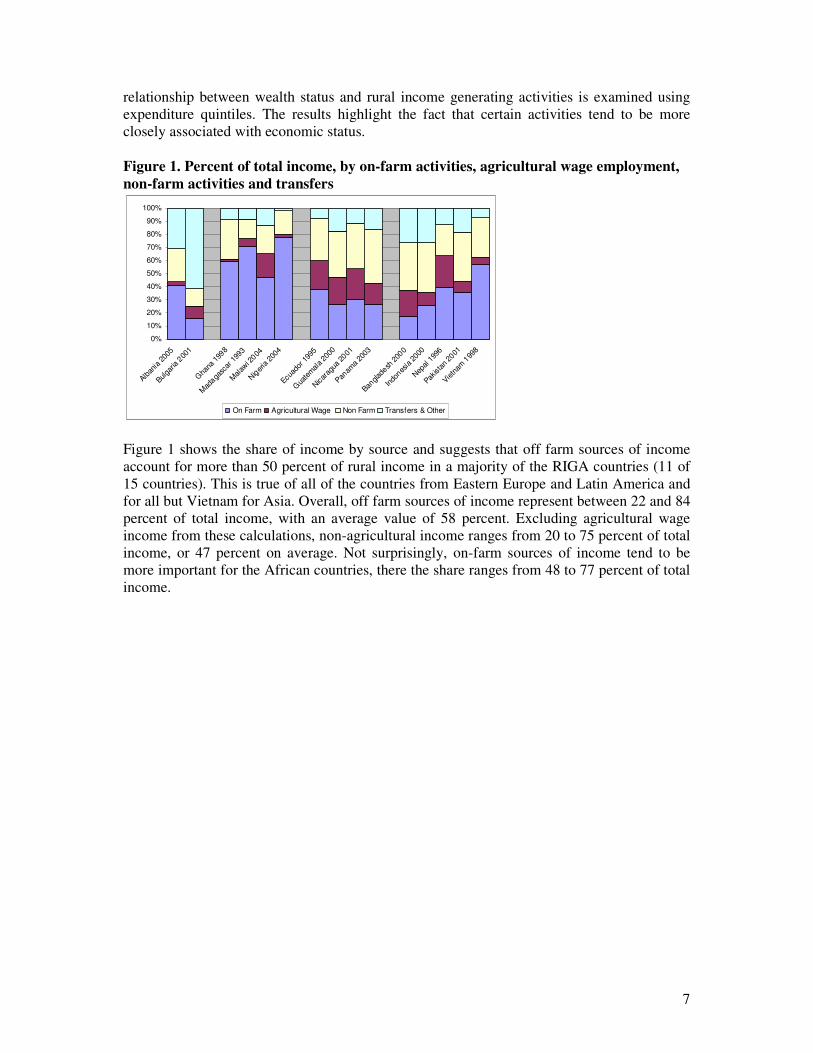
Figure 1. Percent of total income, by on-farm activities, agricultural wage employment,
non-farm activities and transfers
0%
10%
20%
30%
40%
50%
60%
70%
80%
90%
100%
Alban
ia 2
005
Bulga
ria 2
001
Gha
na 1
998
Mad
agasc
ar 1
993
Mal
awi 2
004
Nig
eria
200
4
Ecuad
or 1
995
Gua
tem
ala
2000
Nicar
agua
2001
Panam
a 20
03
Banglad
esh 2
000
Indo
nesia
200
0
Nep
al 1
996
Pakista
n 20
01
Vietn
am 1
998
On Farm Agricultural Wage Non Farm Transfers & Other
Figure 1 shows the share of income by source and suggests that off farm sources of income
account for more than 50 percent of rural income in a majority of the RIGA countries (11 of
15 countries). This is true of all of the countries from Eastern Europe and Latin America and
for all but Vietnam for Asia. Overall, off farm sources of income represent between 22 and 84
percent of total income, with an average value of 58 percent. Excluding agricultural wage
income from these calculations, non-agricultural income ranges from 20 to 75 percent of total
income, or 47 percent on average. Not surprisingly, on-farm sources of income tend to be
more important for the African countries, there the share ranges from 48 to 77 percent of total
income.
8
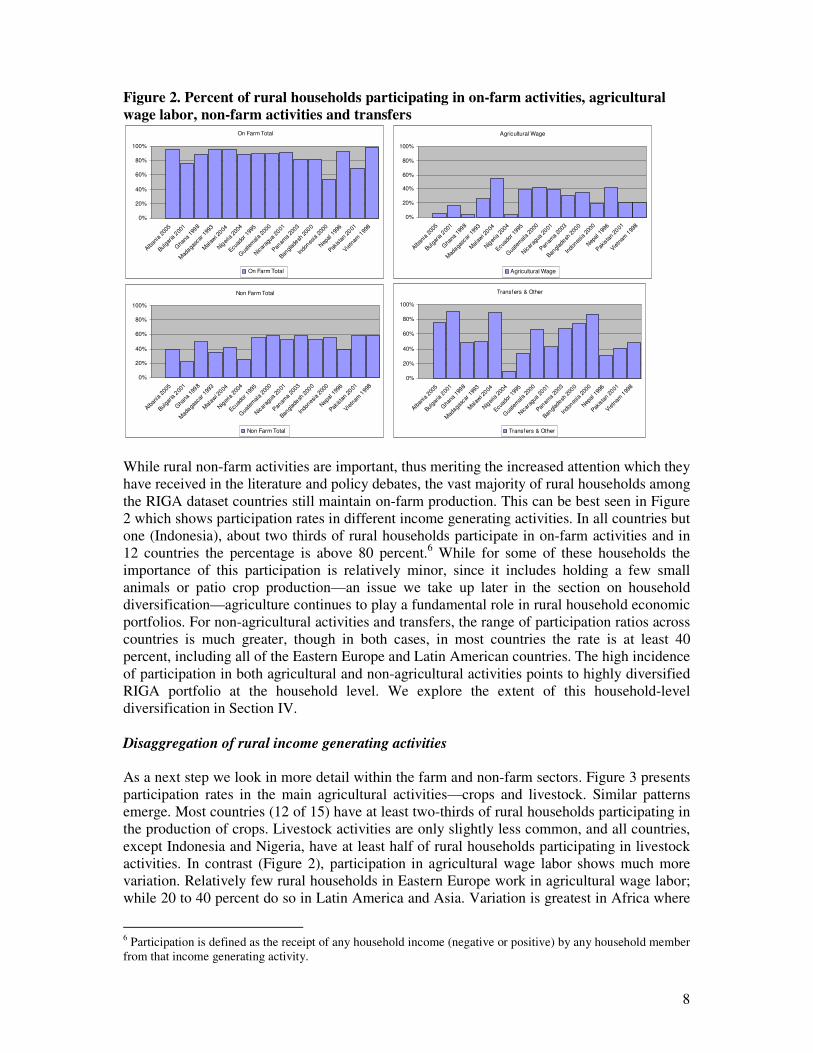
Figure 2. Percent of rural households participating in on-farm activities, agricultural
wage labor, non-farm activities and transfers On Farm Total
0%
20%
40%
60%
80%
100%
Alban
ia 2
005
Bulga
ria 2
001
Gha
na 1
998
Mad
agasc
ar 1
993
Mal
awi 2
004
Nig
eria
200
4
Ecuad
or 1
995
Gua
tem
ala
2000
Nicar
agua
2001
Panam
a 20
03
Banglad
esh 2
000
Indo
nesia
200
0
Nep
al 1
996
Pakista
n 20
01
Vietn
am 1
998
On Farm Total
Agricultural Wage
0%
20%
40%
60%
80%
100%
Alban
ia 2
005
Bulga
ria 2
001
Gha
na 1
998
Mad
agasc
ar 1
993
Mal
awi 2
004
Nig
eria
200
4
Ecuad
or 1
995
Gua
tem
ala
2000
Nicar
agua
2001
Panam
a 20
03
Banglad
esh 2
000
Indo
nesia
200
0
Nep
al 1
996
Pakista
n 20
01
Vietn
am 1
998
Agricultural Wage
Non Farm Total
0%
20%
40%
60%
80%
100%
Alban
ia 2
005
Bulga
ria 2
001
Gha
na 1
998
Mad
agasc
ar 1
993
Mal
awi 2
004
Nig
eria
200
4
Ecuad
or 1
995
Gua
tem
ala
2000
Nicar
agua
2001
Panam
a 20
03
Banglad
esh 2
000
Indo
nesia
200
0
Nep
al 1
996
Pakista
n 20
01
Vietn
am 1
998
Non Farm Total
Transfers & Other
0%
20%
40%
60%
80%
100%
Alban
ia 2
005
Bulga
ria 2
001
Gha
na 1
998
Mad
agasc
ar 1
993
Mal
awi 2
004
Nig
eria 2
004
Ecuad
or 1
995
Gua
tem
ala
2000
Nicar
agua
2001
Panam
a 20
03
Banglad
esh 200
0
Indo
nesia
200
0
Nep
al 1
996
Pakista
n 20
01
Vietn
am 1
998
Transfers & Other
While rural non-farm activities are important, thus meriting the increased attention which they
have received in the literature and policy debates, the vast majority of rural households among
the RIGA dataset countries still maintain on-farm production. This can be best seen in Figure
2 which shows participation rates in different income generating activities. In all countries but
one (Indonesia), about two thirds of rural households participate in on-farm activities and in
12 countries the percentage is above 80 percent.6 While for some of these households the
importance of this participation is relatively minor, since it includes holding a few small
animals or patio crop production—an issue we take up later in the section on household
diversification—agriculture continues to play a fundamental role in rural household economic
portfolios. For non-agricultural activities and transfers, the range of participation ratios across
countries is much greater, though in both cases, in most countries the rate is at least 40
percent, including all of the Eastern Europe and Latin American countries. The high incidence
of participation in both agricultural and non-agricultural activities points to highly diversified
RIGA portfolio at the household level. We explore the extent of this household-level
diversification in Section IV.
Disaggregation of rural income generating activities
As a next step we look in more detail within the farm and non-farm sectors. Figure 3 presents
participation rates in the main agricultural activities—crops and livestock. Similar patterns
emerge. Most countries (12 of 15) have at least two-thirds of rural households participating in
the production of crops. Livestock activities are only slightly less common, and all countries,
except Indonesia and Nigeria, have at least half of rural households participating in livestock
activities. In contrast (Figure 2), participation in agricultural wage labor shows much more
variation. Relatively few rural households in Eastern Europe work in agricultural wage labor;
while 20 to 40 percent do so in Latin America and Asia. Variation is greatest in Africa where
6 Participation is defined as the receipt of any household income (negative or positive) by any household member
from that income generating activity.

9
few households work in agricultural wage in Ghana and Nigeria while over 50 percent work
in agricultural wage labor in Malawi.
Figure 3. Percent of rural households participating in on-farm activities
0%
10%
20%
30%
40%
50%
60%
70%
80%
90%
100%
Alban
ia 2
005
Bulga
ria 2
001
Gha
na 1
998
Mad
agasc
ar 1
993
Mal
awi 2
004
Nig
eria
200
4
Ecuad
or 1
995
Gua
tem
ala
2000
Nicar
agua
2001
Panam
a 20
03
Banglad
esh 2
000
Indo
nesia
200
0
Nep
al 1
996
Pakista
n 20
01
Vietn
am 1
998
Agriculture- Crops Agriculture- Livestock
Participation rates in non-farm activities are further disaggregated into non-agricultural wage
employment and self employment in Figure 4. While the rates of self employment
participation are lowest for the Eastern Europe region, in the other regions participation rates
are generally high for this category and either exceed or mirror those for non-agricultural
wage employment. Wage employment is clearly important for most regions, with more than
20 to 40 percent of households participating in all countries with the exception of Africa,
where the range is from 10 to 20 percent. Non-agricultural wage employment is particularly
important for rural households in Latin America and for most countries in Asia.
Figure 4. Percent of rural households participating in non-farm activities
0%
10%
20%
30%
40%
50%
60%
70%
80%
90%
100%
Alban
ia 2
005
Bulga
ria 2
001
Gha
na 1
998
Mad
agasc
ar 1
993
Mal
awi 2
004
Nig
eria
200
4
Ecuad
or 1
995
Gua
tem
ala
2000
Nicar
agua
2001
Panam
a 20
03
Banglad
esh 2
000
Indo
nesia
200
0
Nep
al 1
996
Pakista
n 20
01
Vietn
am 1
998
Non-farm w age employment Non-farm self-employment
The non-farm wage and self employment component of non-agricultural income can be
further broken down indicating which industries tend to be more important in the non-farm
economy. Eight sectors in wage employment are identified –mining, manufacturing, utilities,
construction, commerce, transport, finance, services and other, and nine in self employment
with the addition of agriculture and fish processing. These sectors could be even further
disaggregated revealing a broad range of industrial activities in which households are
occupied. Focusing on the broader industrial sectors and considering non-agricultural wage
and self employment activities together, Figure 5 shows respectively the share of non-farm
10
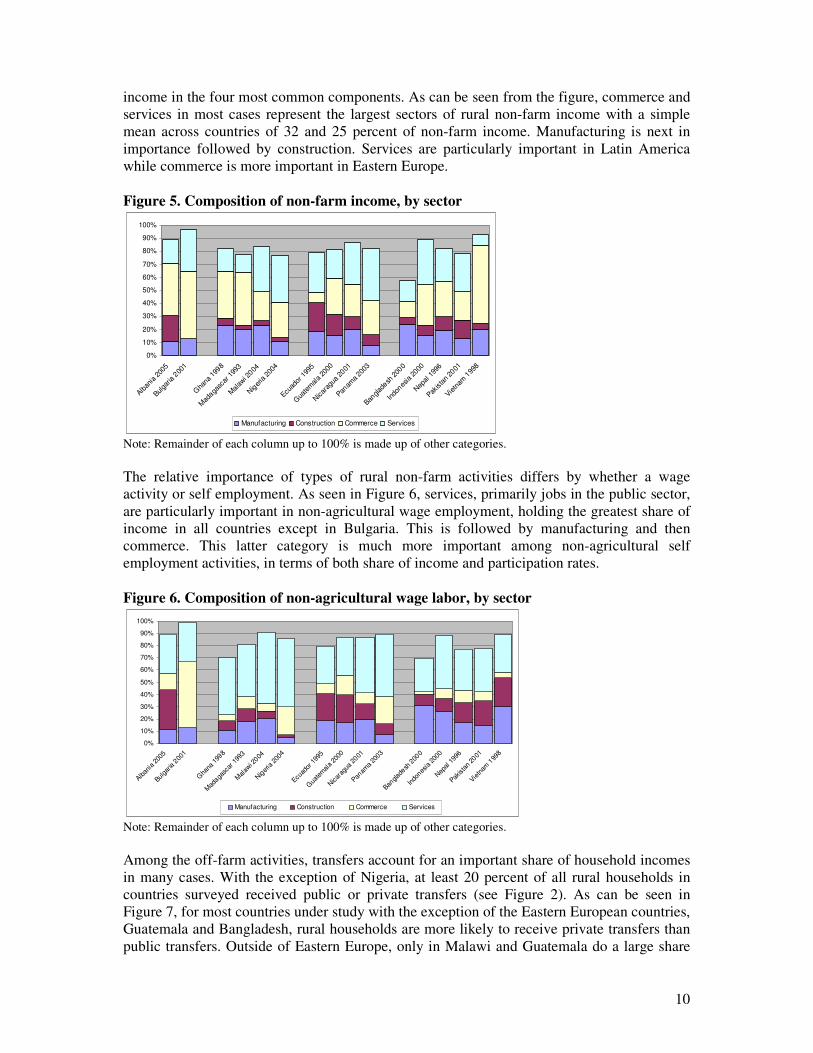
income in the four most common components. As can be seen from the figure, commerce and
services in most cases represent the largest sectors of rural non-farm income with a simple
mean across countries of 32 and 25 percent of non-farm income. Manufacturing is next in
importance followed by construction. Services are particularly important in Latin America
while commerce is more important in Eastern Europe.
Figure 5. Composition of non-farm income, by sector
0%
10%
20%
30%
40%
50%
60%
70%
80%
90%
100%
Alban
ia 2
005
Bulga
ria 2
001
Gha
na 1
998
Mad
agasc
ar 1
993
Mal
awi 2
004
Nig
eria
200
4
Ecuad
or 1
995
Gua
tem
ala
2000
Nicar
agua
2001
Panam
a 20
03
Banglad
esh 2
000
Indo
nesia
200
0
Nep
al 1
996
Pakista
n 20
01
Vietn
am 1
998
Manufacturing Construction Commerce Services
Note: Remainder of each column up to 100% is made up of other categories.
The relative importance of types of rural non-farm activities differs by whether a wage
activity or self employment. As seen in Figure 6, services, primarily jobs in the public sector,
are particularly important in non-agricultural wage employment, holding the greatest share of
income in all countries except in Bulgaria. This is followed by manufacturing and then
commerce. This latter category is much more important among non-agricultural self
employment activities, in terms of both share of income and participation rates.
Figure 6. Composition of non-agricultural wage labor, by sector
0%
10%
20%
30%
40%
50%
60%
70%
80%
90%
100%
Alban
ia 2
005
Bulga
ria 2
001
Gha
na 1
998
Mad
agasc
ar 1
993
Mal
awi 2
004
Nig
eria
200
4
Ecuad
or 1
995
Gua
tem
ala
2000
Nicar
agua
2001
Panam
a 20
03
Banglad
esh 2
000
Indo
nesia
200
0
Nep
al 1
996
Pakista
n 20
01
Vietn
am 1
998
Manufacturing Construction Commerce Services
Note: Remainder of each column up to 100% is made up of other categories.
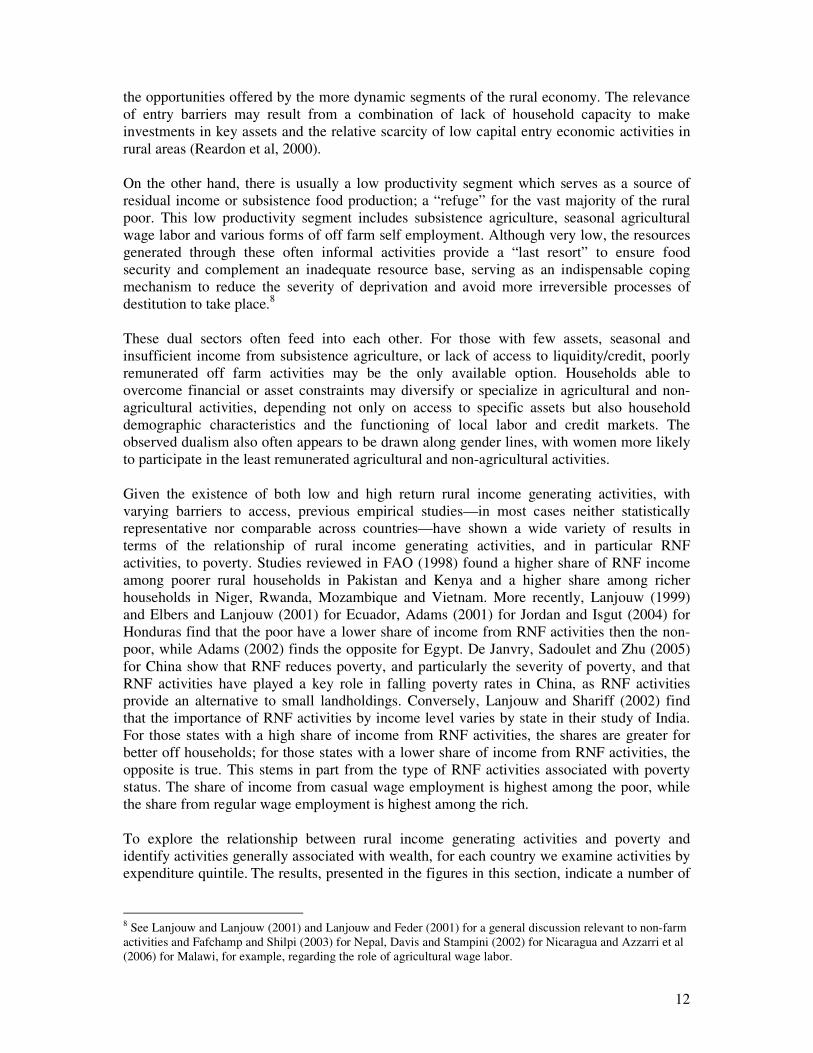
Among the off-farm activities, transfers account for an important share of household incomes
in many cases. With the exception of Nigeria, at least 20 percent of all rural households in
countries surveyed received public or private transfers (see Figure 2). As can be seen in
Figure 7, for most countries under study with the exception of the Eastern European countries,
Guatemala and Bangladesh, rural households are more likely to receive private transfers than
public transfers. Outside of Eastern Europe, only in Malawi and Guatemala do a large share
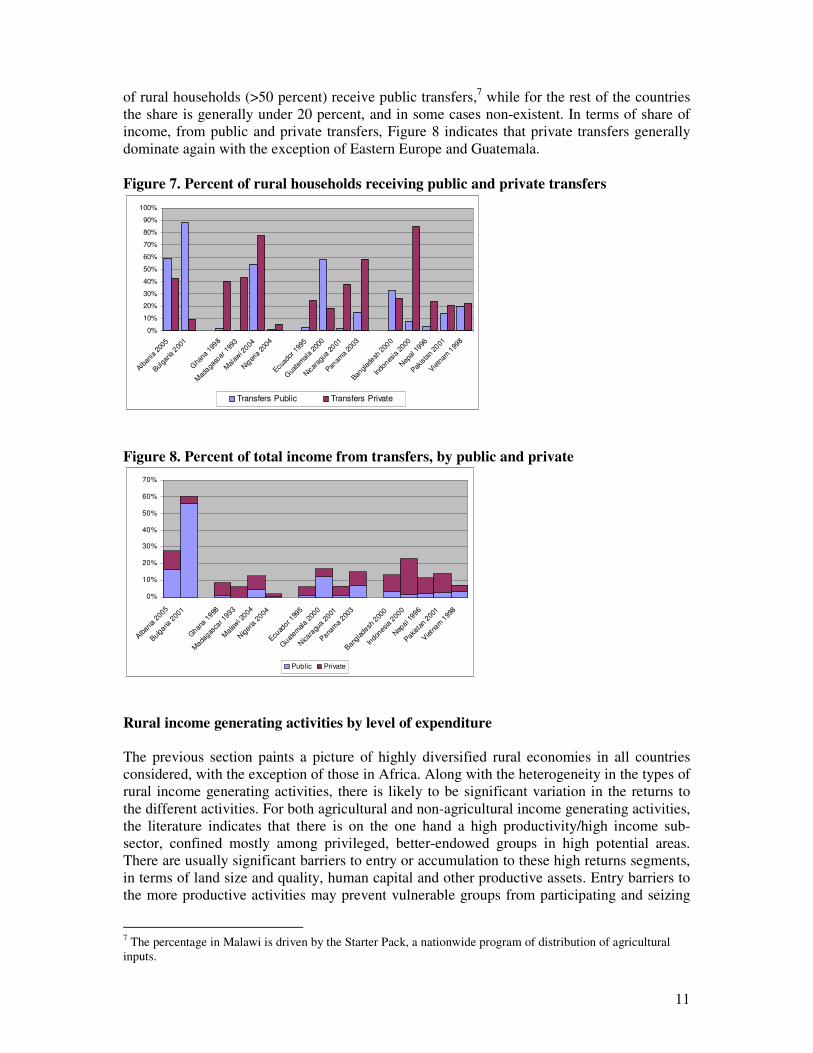
11
of rural households (>50 percent) receive public transfers,7 while for the rest of the countries
the share is generally under 20 percent, and in some cases non-existent. In terms of share of
income, from public and private transfers, Figure 8 indicates that private transfers generally
dominate again with the exception of Eastern Europe and Guatemala.
Figure 7. Percent of rural households receiving public and private transfers
0%
10%
20%
30%
40%
50%
60%
70%
80%
90%
100%
Alban
ia 2
005
Bulga
ria 2
001
Gha
na 1
998
Mad
agasc
ar 1
993
Mal
awi 2
004
Nig
eria
200
4
Ecuad
or 1
995
Gua
tem
ala
2000
Nicar
agua
2001
Panam
a 20
03
Banglad
esh 2
000
Indo
nesia
200
0
Nep
al 1
996
Pakista
n 20
01
Vietn
am 1
998
Transfers Public Transfers Private
Figure 8. Percent of total income from transfers, by public and private
0%
10%
20%
30%
40%
50%
60%
70%
Albania
200
5
Bulgaria
200
1
Ghan
a 1998
Mada
gasca
r 1993
Mala
wi 2
004
Niger
ia 2
004
Ecuad
or 199
5
Guat
emala 2
000
Nica
ragu
a 2001
Panam
a 200
3
Bangla
desh
200
0
Indo
nesia 2
000
Nep
al 1996
Pakista
n 2001
Vietn
am 1
998
Public Private
Rural income generating activities by level of expenditure
The previous section paints a picture of highly diversified rural economies in all countries
considered, with the exception of those in Africa. Along with the heterogeneity in the types of
rural income generating activities, there is likely to be significant variation in the returns to
the different activities. For both agricultural and non-agricultural income generating activities,
the literature indicates that there is on the one hand a high productivity/high income sub-
sector, confined mostly among privileged, better-endowed groups in high potential areas.
There are usually significant barriers to entry or accumulation to these high returns segments,
in terms of land size and quality, human capital and other productive assets. Entry barriers to
the more productive activities may prevent vulnerable groups from participating and seizing
7 The percentage in Malawi is driven by the Starter Pack, a nationwide program of distribution of agricultural
inputs.
12
the opportunities offered by the more dynamic segments of the rural economy. The relevance
of entry barriers may result from a combination of lack of household capacity to make
investments in key assets and the relative scarcity of low capital entry economic activities in
rural areas (Reardon et al, 2000).
On the other hand, there is usually a low productivity segment which serves as a source of
residual income or subsistence food production; a “refuge” for the vast majority of the rural
poor. This low productivity segment includes subsistence agriculture, seasonal agricultural
wage labor and various forms of off farm self employment. Although very low, the resources
generated through these often informal activities provide a “last resort” to ensure food
security and complement an inadequate resource base, serving as an indispensable coping
mechanism to reduce the severity of deprivation and avoid more irreversible processes of
destitution to take place.8
These dual sectors often feed into each other. For those with few assets, seasonal and
insufficient income from subsistence agriculture, or lack of access to liquidity/credit, poorly
remunerated off farm activities may be the only available option. Households able to
overcome financial or asset constraints may diversify or specialize in agricultural and non-
agricultural activities, depending not only on access to specific assets but also household
demographic characteristics and the functioning of local labor and credit markets. The
observed dualism also often appears to be drawn along gender lines, with women more likely
to participate in the least remunerated agricultural and non-agricultural activities.
Given the existence of both low and high return rural income generating activities, with
varying barriers to access, previous empirical studies—in most cases neither statistically
representative nor comparable across countries—have shown a wide variety of results in
terms of the relationship of rural income generating activities, and in particular RNF
activities, to poverty. Studies reviewed in FAO (1998) found a higher share of RNF income
among poorer rural households in Pakistan and Kenya and a higher share among richer
households in Niger, Rwanda, Mozambique and Vietnam. More recently, Lanjouw (1999)
and Elbers and Lanjouw (2001) for Ecuador, Adams (2001) for Jordan and Isgut (2004) for
Honduras find that the poor have a lower share of income from RNF activities then the non-
poor, while Adams (2002) finds the opposite for Egypt. De Janvry, Sadoulet and Zhu (2005)
for China show that RNF reduces poverty, and particularly the severity of poverty, and that
RNF activities have played a key role in falling poverty rates in China, as RNF activities
provide an alternative to small landholdings. Conversely, Lanjouw and Shariff (2002) find
that the importance of RNF activities by income level varies by state in their study of India.
For those states with a high share of income from RNF activities, the shares are greater for
better off households; for those states with a lower share of income from RNF activities, the
opposite is true. This stems in part from the type of RNF activities associated with poverty
status. The share of income from casual wage employment is highest among the poor, while
the share from regular wage employment is highest among the rich.
To explore the relationship between rural income generating activities and poverty and
identify activities generally associated with wealth, for each country we examine activities by
expenditure quintile. The results, presented in the figures in this section, indicate a number of
8 See Lanjouw and Lanjouw (2001) and Lanjouw and Feder (2001) for a general discussion relevant to non-farm
activities and Fafchamp and Shilpi (2003) for Nepal, Davis and Stampini (2002) for Nicaragua and Azzarri et al
(2006) for Malawi, for example, regarding the role of agricultural wage labor.
13
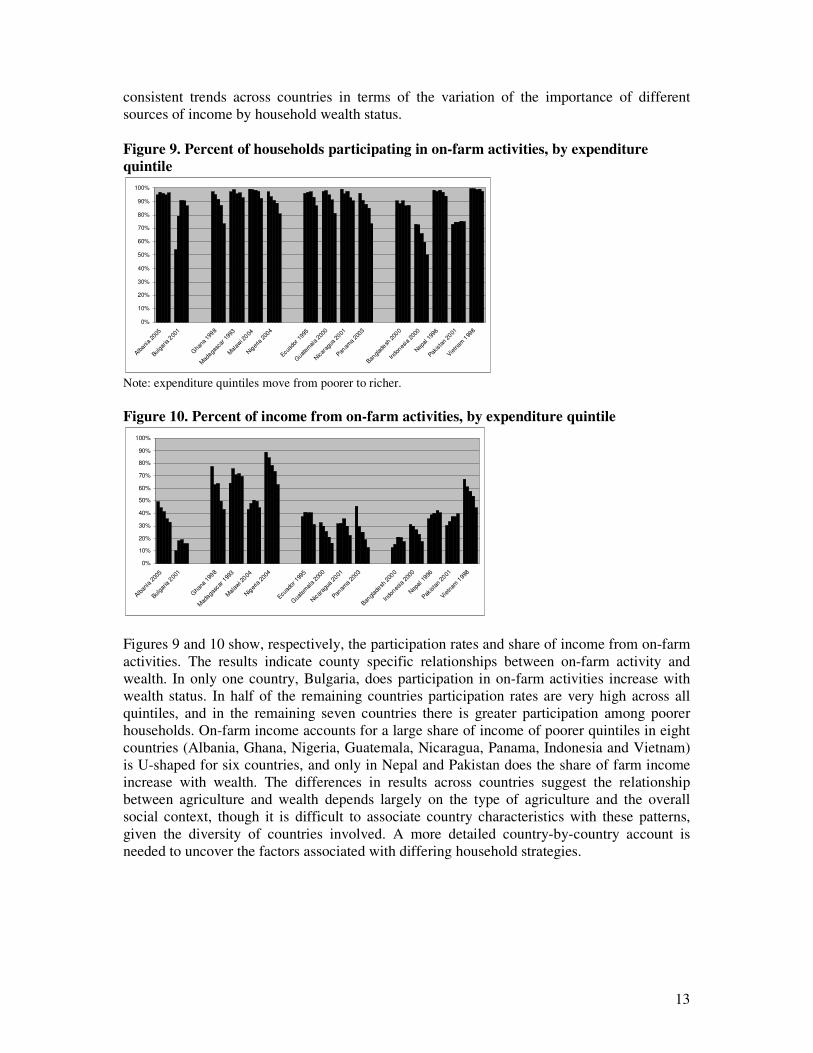
consistent trends across countries in terms of the variation of the importance of different
sources of income by household wealth status.
Figure 9. Percent of households participating in on-farm activities, by expenditure
quintile
0%
10%
20%
30%
40%
50%
60%
70%
80%
90%
100%
Alban
ia 2
005
Bulga
ria 2
001
Gha
na 1
998
Mad
agasc
ar 1
993
Mal
awi 2
004
Nig
eria
200
4
Ecuad
or 1
995
Gua
tem
ala
2000
Nicar
agua
2001
Panam
a 20
03
Banglad
esh 2
000
Indo
nesia
200
0
Nep
al 1
996
Pakista
n 20
01
Vietn
am 1
998
Note: expenditure quintiles move from poorer to richer.
Figure 10. Percent of income from on-farm activities, by expenditure quintile
0%
10%
20%
30%
40%
50%
60%
70%
80%
90%
100%
Alban
ia 2
005
Bulga
ria 2
001
Gha
na 1
998
Mad
agasc
ar 1
993
Mal
awi 2
004
Nig
eria
200
4
Ecuad
or 1
995
Gua
tem
ala
2000
Nicar
agua
2001
Panam
a 20
03
Banglad
esh 2
000
Indo
nesia
200
0
Nep
al 1
996
Pakista
n 20
01
Vietn
am 1
998
Figures 9 and 10 show, respectively, the participation rates and share of income from on-farm
activities. The results indicate county specific relationships between on-farm activity and
wealth. In only one country, Bulgaria, does participation in on-farm activities increase with
wealth status. In half of the remaining countries participation rates are very high across all
quintiles, and in the remaining seven countries there is greater participation among poorer
households. On-farm income accounts for a large share of income of poorer quintiles in eight
countries (Albania, Ghana, Nigeria, Guatemala, Nicaragua, Panama, Indonesia and Vietnam)
is U-shaped for six countries, and only in Nepal and Pakistan does the share of farm income
increase with wealth. The differences in results across countries suggest the relationship
between agriculture and wealth depends largely on the type of agriculture and the overall
social context, though it is difficult to associate country characteristics with these patterns,
given the diversity of countries involved. A more detailed country-by-country account is
needed to uncover the factors associated with differing household strategies.
14
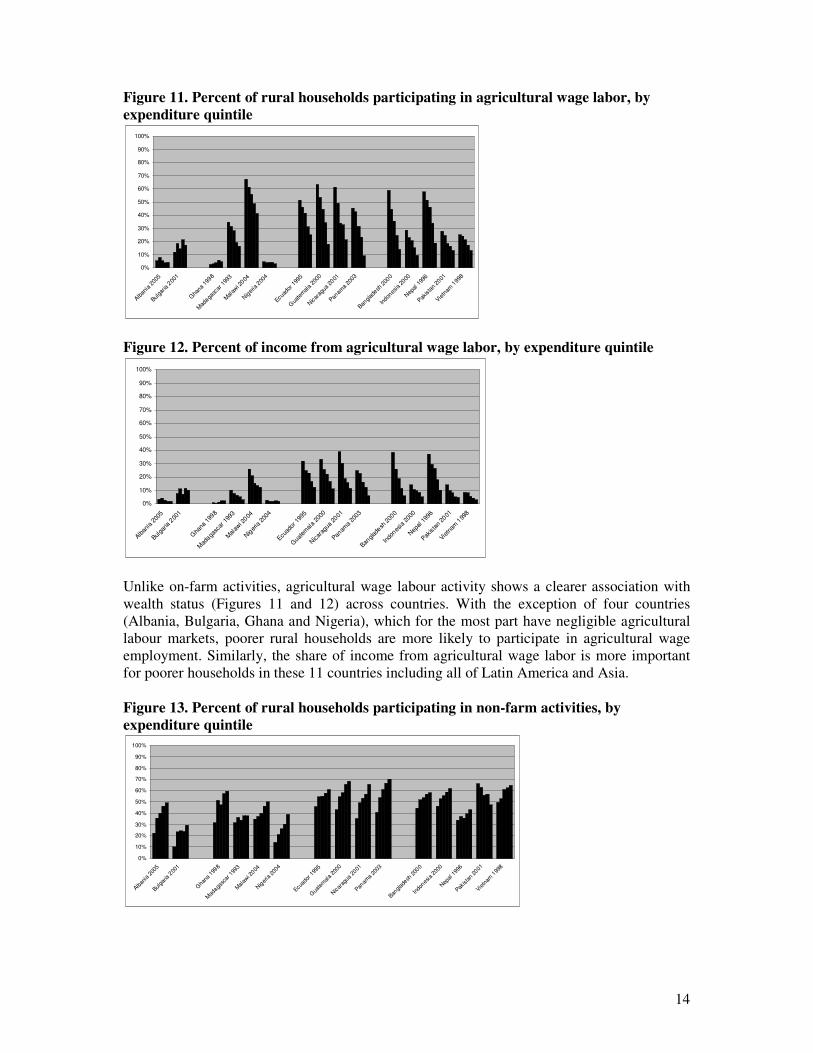
Figure 11. Percent of rural households participating in agricultural wage labor, by
expenditure quintile
0%
10%
20%
30%
40%
50%
60%
70%
80%
90%
100%
Alban
ia 2
005
Bulga
ria 2
001
Gha
na 1
998
Mad
agasc
ar 1
993
Mal
awi 2
004
Nig
eria
200
4
Ecuad
or 1
995
Gua
tem
ala
2000
Nicar
agua
2001
Panam
a 20
03
Banglad
esh 2
000
Indo
nesia
200
0
Nep
al 1
996
Pakista
n 20
01
Vietn
am 1
998
Figure 12. Percent of income from agricultural wage labor, by expenditure quintile
0%
10%
20%
30%
40%
50%
60%
70%
80%
90%
100%
Alban
ia 2
005
Bulga
ria 2
001
Gha
na 1
998
Mad
agasc
ar 1
993
Mal
awi 2
004
Nig
eria
200
4
Ecuad
or 1
995
Gua
tem
ala
2000
Nicar
agua
2001
Panam
a 20
03
Banglad
esh 2
000
Indo
nesia
200
0
Nep
al 1
996
Pakista
n 20
01
Vietn
am 1
998
Unlike on-farm activities, agricultural wage labour activity shows a clearer association with
wealth status (Figures 11 and 12) across countries. With the exception of four countries
(Albania, Bulgaria, Ghana and Nigeria), which for the most part have negligible agricultural
labour markets, poorer rural households are more likely to participate in agricultural wage
employment. Similarly, the share of income from agricultural wage labor is more important
for poorer households in these 11 countries including all of Latin America and Asia.
Figure 13. Percent of rural households participating in non-farm activities, by
expenditure quintile
0%
10%
20%
30%
40%
50%
60%
70%
80%
90%
100%
Alban
ia 2
005
Bulga
ria 2
001
Gha
na 1
998
Mad
agasc
ar 1
993
Mal
awi 2
004
Nig
eria
200
4
Ecuad
or 1
995
Gua
tem
ala
2000
Nicar
agua
2001
Panam
a 20
03
Banglad
esh 2
000
Indo
nesia
200
0
Nep
al 1
996
Pakista
n 20
01
Vietn
am 1
998
15
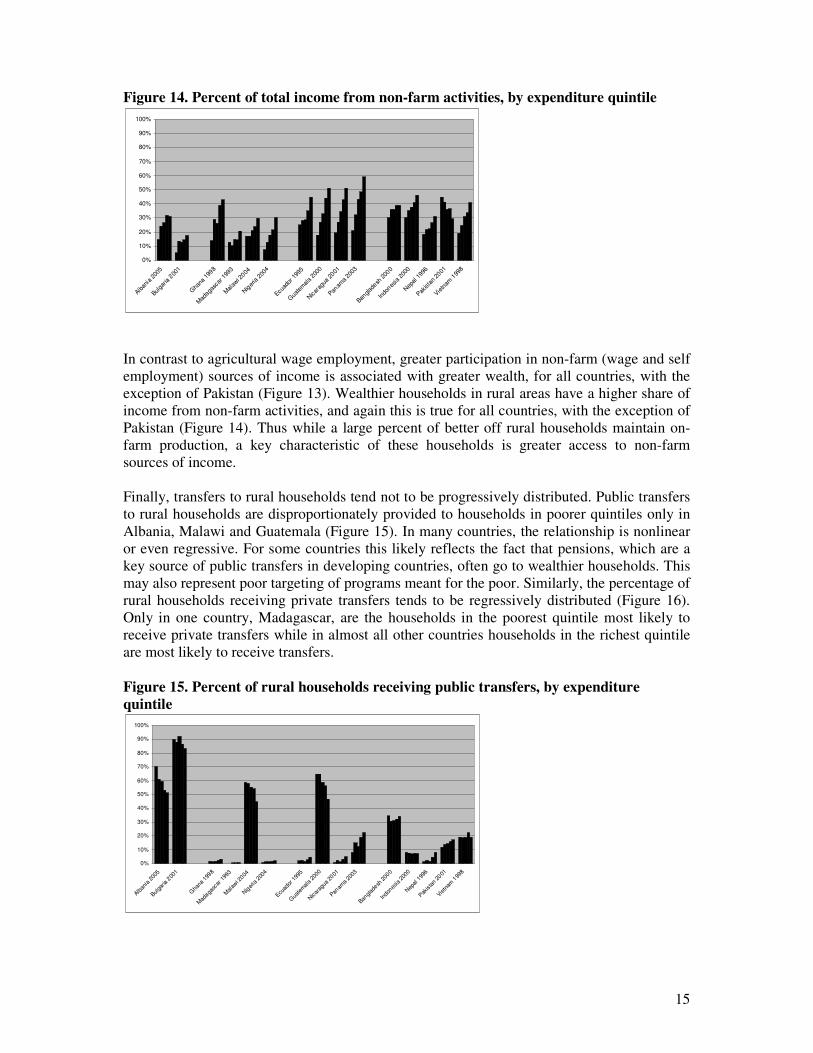
Figure 14. Percent of total income from non-farm activities, by expenditure quintile
0%
10%
20%
30%
40%
50%
60%
70%
80%
90%
100%
Alban
ia 2
005
Bulga
ria 2
001
Gha
na 1
998
Mad
agasc
ar 1
993
Mal
awi 2
004
Nig
eria
200
4
Ecuad
or 1
995
Gua
tem
ala
2000
Nicar
agua
2001
Panam
a 20
03
Banglad
esh 2
000
Indo
nesia
200
0
Nep
al 1
996
Pakista
n 20
01
Vietn
am 1
998
In contrast to agricultural wage employment, greater participation in non-farm (wage and self
employment) sources of income is associated with greater wealth, for all countries, with the
exception of Pakistan (Figure 13). Wealthier households in rural areas have a higher share of
income from non-farm activities, and again this is true for all countries, with the exception of
Pakistan (Figure 14). Thus while a large percent of better off rural households maintain on-
farm production, a key characteristic of these households is greater access to non-farm
sources of income.
Finally, transfers to rural households tend not to be progressively distributed. Public transfers
to rural households are disproportionately provided to households in poorer quintiles only in
Albania, Malawi and Guatemala (Figure 15). In many countries, the relationship is nonlinear
or even regressive. For some countries this likely reflects the fact that pensions, which are a
key source of public transfers in developing countries, often go to wealthier households. This
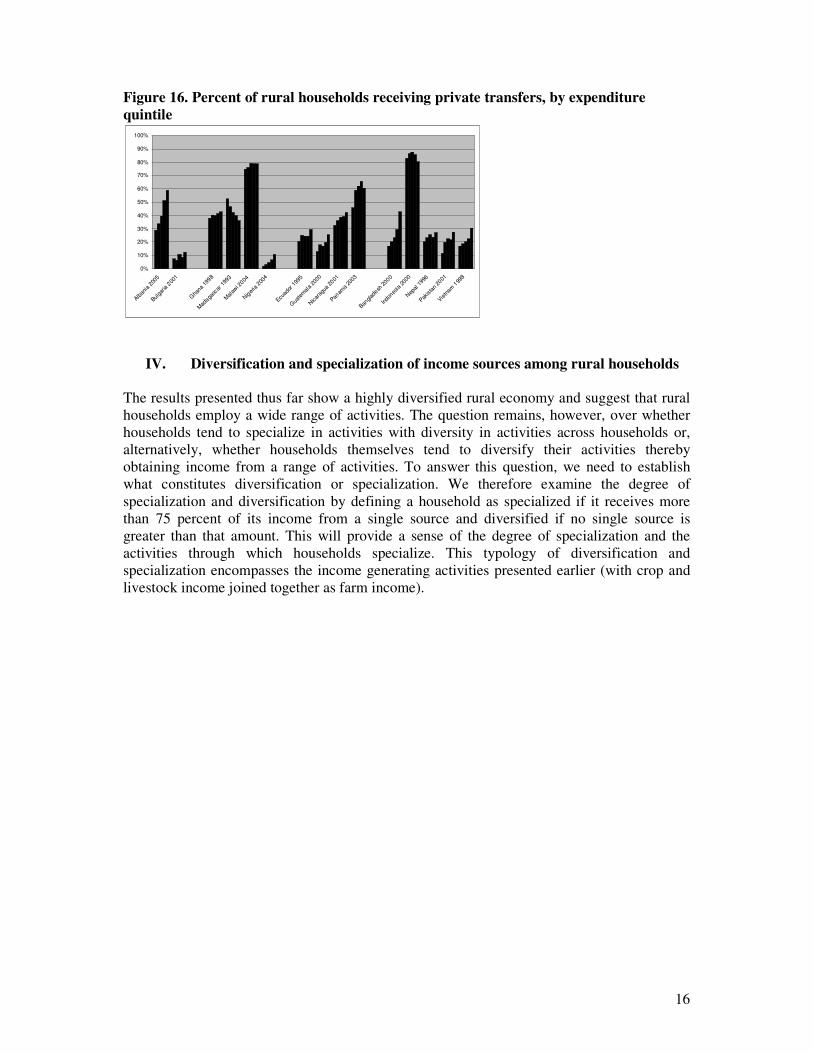
may also represent poor targeting of programs meant for the poor. Similarly, the percentage of
rural households receiving private transfers tends to be regressively distributed (Figure 16).
Only in one country, Madagascar, are the households in the poorest quintile most likely to
receive private transfers while in almost all other countries households in the richest quintile
are most likely to receive transfers.
Figure 15. Percent of rural households receiving public transfers, by expenditure
quintile
0%
10%
20%
30%
40%
50%
60%
70%
80%
90%
100%
Alban
ia 2
005
Bulga
ria 2
001
Gha
na 1
998
Mad
agasc
ar 1
993
Mal
awi 2
004
Nig
eria
200
4
Ecuad
or 1
995
Gua
temal
a 20
00
Nicar
agua
2001
Panam
a 20
03
Banglad
esh 2
000
Indo
nesia
200
0
Nep
al 1
996
Pakistan
2001
Vietnam
199
8
16
Figure 16. Percent of rural households receiving private transfers, by expenditure
quintile
0%
10%
20%
30%
40%
50%
60%
70%
80%
90%
100%
Alban
ia 2
005
Bulga
ria 2
001
Gha
na 1
998
Mad
agasc
ar 1
993
Mal
awi 2
004
Nig
eria
200
4
Ecuad
or 1
995
Gua
tem
ala
2000
Nicar
agua
2001
Panam
a 20
03
Banglad
esh 2
000
Indo
nesia
200
0
Nep
al 1
996
Pakista
n 20
01
Vietn
am 1
998
IV. Diversification and specialization of income sources among rural households
The results presented thus far show a highly diversified rural economy and suggest that rural
households employ a wide range of activities. The question remains, however, over whether
households tend to specialize in activities with diversity in activities across households or,
alternatively, whether households themselves tend to diversify their activities thereby
obtaining income from a range of activities. To answer this question, we need to establish
what constitutes diversification or specialization. We therefore examine the degree of
specialization and diversification by defining a household as specialized if it receives more
than 75 percent of its income from a single source and diversified if no single source is
greater than that amount. This will provide a sense of the degree of specialization and the
activities through which households specialize. This typology of diversification and
specialization encompasses the income generating activities presented earlier (with crop and
livestock income joined together as farm income).
17
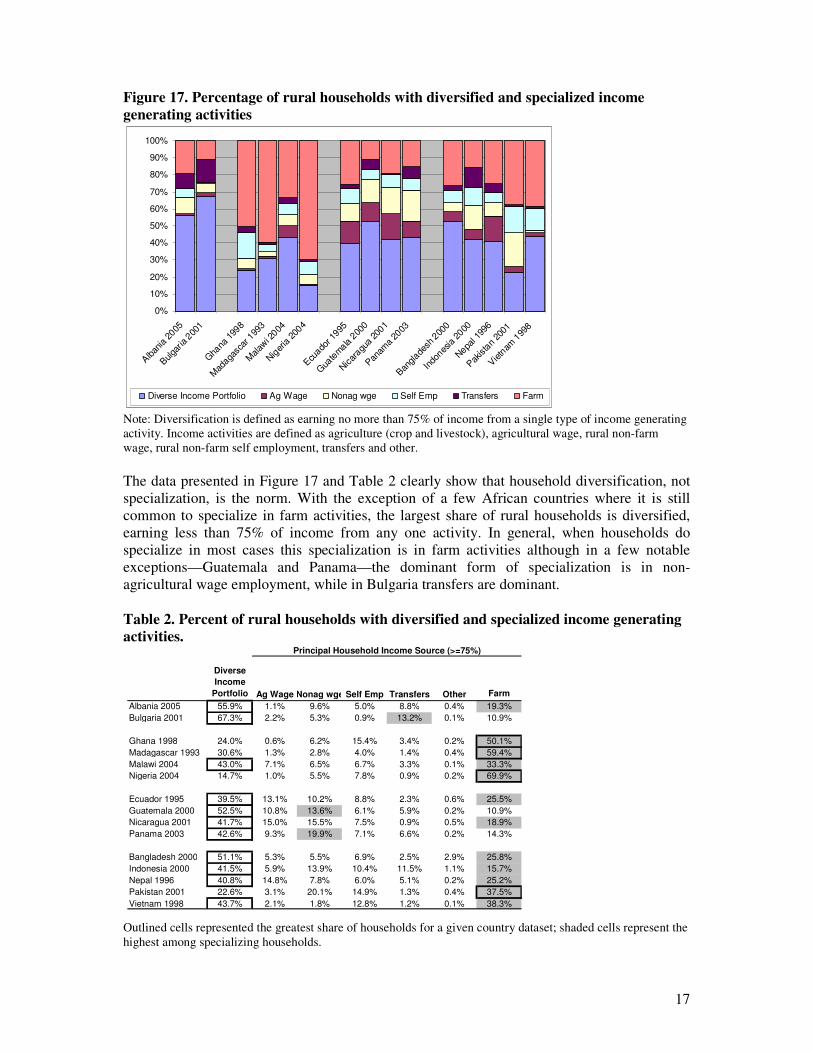
Figure 17. Percentage of rural households with diversified and specialized income
generating activities
0%
10%
20%
30%
40%
50%
60%
70%
80%
90%
100%
Alban
ia 2
005
Bulga
ria 2
001
Gha
na 1
998
Mad
agasc
ar 1
993
Malaw
i 2004
Nig
eria 2
004
Ecu
ador 1
995
Gua
temala
200
0
Nic
aragu
a 20
01
Pan
ama 2
003
Ban
glade
sh 2
000
Indo
nesia
2000
Nepa
l 199
6
Pak
ista
n 20
01
Vietn
am 1
998
Diverse Income Portfolio Ag Wage Nonag wge Self Emp Transfers Farm
Note: Diversification is defined as earning no more than 75% of income from a single type of income generating
activity. Income activities are defined as agriculture (crop and livestock), agricultural wage, rural non-farm
wage, rural non-farm self employment, transfers and other.
The data presented in Figure 17 and Table 2 clearly show that household diversification, not
specialization, is the norm. With the exception of a few African countries where it is still
common to specialize in farm activities, the largest share of rural households is diversified,
earning less than 75% of income from any one activity. In general, when households do
specialize in most cases this specialization is in farm activities although in a few notable
exceptions—Guatemala and Panama—the dominant form of specialization is in non-
agricultural wage employment, while in Bulgaria transfers are dominant.
Table 2. Percent of rural households with diversified and specialized income generating
activities.
Diverse
Income
Portfolio Ag Wage Nonag wge Self Emp Transfers Other Farm
Albania 2005 55.9% 1.1% 9.6% 5.0% 8.8% 0.4% 19.3%
Bulgaria 2001 67.3% 2.2% 5.3% 0.9% 13.2% 0.1% 10.9%
Ghana 1998 24.0% 0.6% 6.2% 15.4% 3.4% 0.2% 50.1%
Madagascar 1993 30.6% 1.3% 2.8% 4.0% 1.4% 0.4% 59.4%
Malawi 2004 43.0% 7.1% 6.5% 6.7% 3.3% 0.1% 33.3%
Nigeria 2004 14.7% 1.0% 5.5% 7.8% 0.9% 0.2% 69.9%
Ecuador 1995 39.5% 13.1% 10.2% 8.8% 2.3% 0.6% 25.5%
Guatemala 2000 52.5% 10.8% 13.6% 6.1% 5.9% 0.2% 10.9%
Nicaragua 2001 41.7% 15.0% 15.5% 7.5% 0.9% 0.5% 18.9%
Panama 2003 42.6% 9.3% 19.9% 7.1% 6.6% 0.2% 14.3%
Bangladesh 2000 51.1% 5.3% 5.5% 6.9% 2.5% 2.9% 25.8%
Indonesia 2000 41.5% 5.9% 13.9% 10.4% 11.5% 1.1% 15.7%
Nepal 1996 40.8% 14.8% 7.8% 6.0% 5.1% 0.2% 25.2%
Pakistan 2001 22.6% 3.1% 20.1% 14.9% 1.3% 0.4% 37.5%
Vietnam 1998 43.7% 2.1% 1.8% 12.8% 1.2% 0.1% 38.3%
Principal Household Income Source (>=75%)
Outlined cells represented the greatest share of households for a given country dataset; shaded cells represent the
highest among specializing households.
18
A rural household may have multiple activities for a variety of reasons: as a response to
market failures, such as in credit markets, and thus earning cash to finance agricultural
activities, or insurance markets, and thus spreading risks among different activities; failure of
any one activity to provide enough income; or different skills and attributes of individual
household members. Diversification into rural non-farm activities can reflect activities in
either high or low return sectors, as described above. Rural non-farm activities may or may
not be countercyclical with agriculture, both within and between years, and particularly if not
highly-correlated with agriculture, they can serve as a consumption smoothing or risk
insurance mechanism. Thus the results raise an interesting question regarding whether
diversification is a strategy for households to manage risk and overcome market failures, or
whether it represents specialization within the household in which some members participate
in certain activities because they have a comparative advantage in those activities. If the latter
is the case and it tends to be the young who are in off-farm activities, diversification may
simply reflect a transition period as the household moves out of farm activities.
High levels of diversification at the household level, in any case, do not necessarily signify
disengagement from agricultural activities. In all countries except for three in Africa,
diversified households account for a least thirty percent of the total value of both marketed
and overall agricultural production, as can be seen in Table 3. In six countries, diversified
households account for a greater share of the total value of both marketed and overall
agricultural production then farm specializing households, and in three of these countries
(Bangladesh, Albania and Guatemala) diversified households account for approximately 60
percent of the total value.
Table 3. Value of marketed and total agricultural production, by diversification
typology
Diversified Farm Agr Wage
Non-Agr
Wage Self Emp
Transfers &
Other Diversified Farm Agr Wage
Non-Agr
Wage Self Emp
Transfers
& Other
Africa
Ghana 1998 21.8 70.8 0.1 1.3 5.7 0.4 22.3 71.2 0.1 1.0 5.2 0.2
Madagascar 1993 21.7 75.3 0.3 0.4 2.1 0.3 17.8 71.3 0.2 0.3 10.3 0.2
Malawi 2004 29.2 67.1 0.6 1.5 1.4 0.2 33.8 59.2 1.6 3.3 1.8 0.3
Nigeria 2004 9.5 86.8 0.6 1.1 1.9 0.1 9.0 88.3 0.5 0.8 1.4 0.1
Asia
Bangladesh 2000 60.5 18.8 3.2 4.8 5.4 7.3 60.4 16.7 3.6 5.0 5.8 8.5
Indonesia 2000 48.8 41.2 0.6 3.7 3.2 2.5 48.8 41.2 0.6 3.7 3.2 2.5
Nepal 1996 44.0 47.2 2.0 2.8 2.3 1.7 45.4 43.6 2.7 3.5 2.4 2.4
Pakistan 2001 28.4 69.6 0.2 0.7 0.5 0.7 31.0 65.1 0.5 1.2 0.8 1.5
Vietnam 1998 39.0 49.1 0.7 1.0 10.0 0.2 39.9 48.5 0.7 0.9 9.7 0.2
Eastern Europe
Albania 2005 59.6 31.8 0.8 3.0 2.2 2.6 60.9 28.2 0.8 3.8 3.0 3.2
Bulgaria 2001 32.0 4.0 0.3 4.2 0.0 59.5 40.1 5.2 0.9 3.9 0.1 49.9
Latin America
Ecuador 1995 42.5 46.3 3.3 3.3 3.1 1.4 44.1 43.7 3.7 3.5 3.8 1.2
Guatemala 2000 59.2 30.3 2.1 2.0 4.5 1.8 61.2 25.9 3.1 2.8 5.4 1.7
Nicaragua 2001 31.9 54.0 4.5 3.7 4.2 1.7 33.9 50.9 4.8 3.6 4.9 1.9
Panama 2003 44.3 34.4 1.8 7.9 9.4 2.2 48.7 31.3 3.4 7.8 6.7 2.3
Percentage of total value of marketed agricultural production Percentage of total value of agricultural production
The empirical relationship between diversification and wealth is thus not straightforward. A
reduction in diversification as household wealth increases could be a sign that those at lower
income levels are using diversification to overcome market imperfections. Alternatively, a
reduction in diversification as household wealth decreases could be a sign of inability to
overcome barriers to entry in a second activity thus indicating that poorer households are
limited from further specialization. Alternatively, an increase in diversification as household
wealth increases could be a sign of using profitability in one activity to overcome threshold
barriers to entry in another activity, or complementary use of assets between activities.

19
Figure 18. Percent of rural households with diversified income portfolio, by expenditure
quintile
0%
10%
20%
30%
40%
50%
60%
70%
80%
Alban
ia 2
005
Bulga
ria 2
001
Gha
na 1
998
Mad
agasc
ar 1
993
Mal
awi 2
004
Nig
eria
200
4
Ecuad
or 1
995
Gua
tem
ala
2000
Nicar
agua
2001
Panam
a 20
03
Banglad
esh 2
000
Indo
nesia
200
0
Nep
al 1
996
Pakista
n 20
01
Vietn
am 1
998
Figure 18 explores the relationship between diversification and expenditure—the proxy used
for wealth—while Figures 19-22 examine specialization by activity across expenditure
quintile. Diversification of income generating strategies varies little by wealth status in the
RIGA countries. In only a few cases (4 of 15), the share of households with diversified
sources of income increases with wealth, and in another four countries, diversification
decreases with wealth. For the rest, there is not pattern across quintiles.
Figure 19. Percent of rural households specializing in on-farm activities, by expenditure
quintile
0%
10%
20%
30%
40%
50%
60%
70%
80%
Alban
ia 2
005
Bulga
ria 2
001
Gha
na 1
998
Mad
agasc
ar 1
993
Mal
awi 2
004
Nig
eria
200
4
Ecuad
or 1
995
Gua
tem
ala
2000
Nicar
agua
2001
Panam
a 20
03
Banglad
esh 2
000
Indo
nesia
200
0
Nep
al 1
996
Pakista
n 20
01
Vietn
am 1
998
20
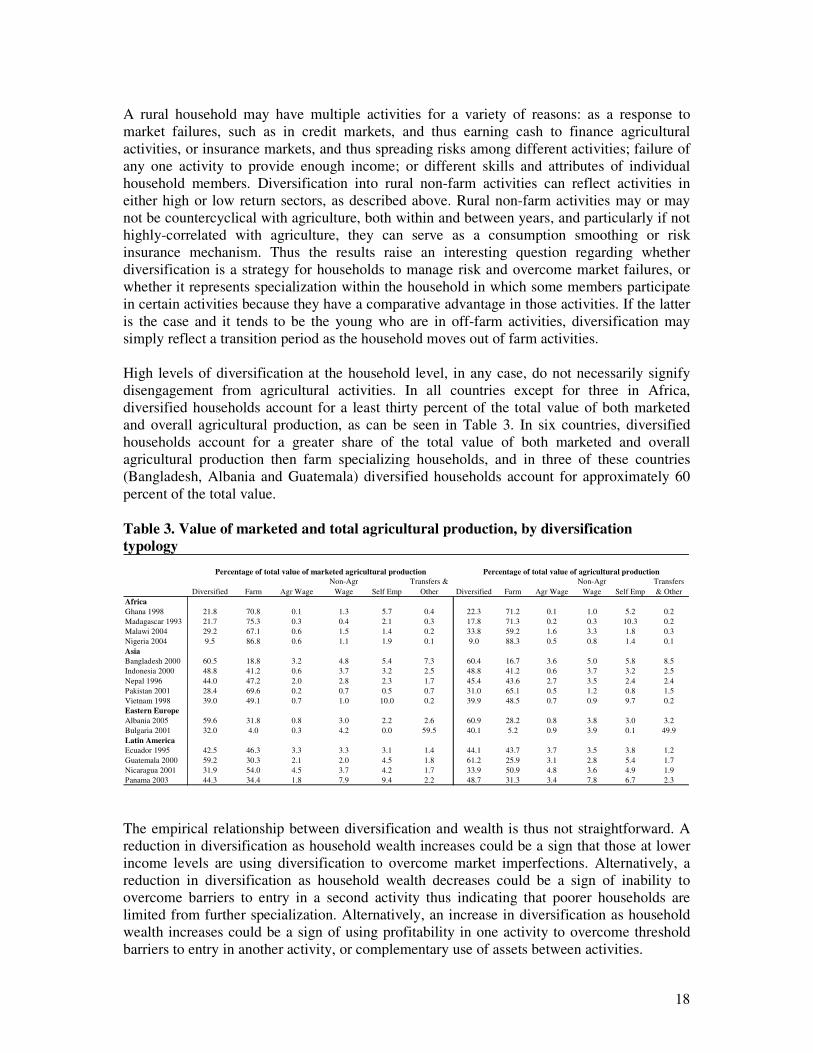
Figure 20. Percent of rural households specializing in agricultural wage labor activities,
by expenditure quintile
0%
10%
20%
30%
40%
50%
60%
70%
80%
Alban
ia 2
005
Bulga
ria 2
001
Gha
na 1
998
Mad
agasc
ar 1
993
Mal
awi 2
004
Nig
eria
200
4
Ecuad
or 1
995
Gua
tem
ala
2000
Nicar
agua
2001
Panam
a 20
03
Banglad
esh 2
000
Indo
nesia
200
0
Nep
al 1
996
Pakista
n 20
01
Vietn
am 1
998
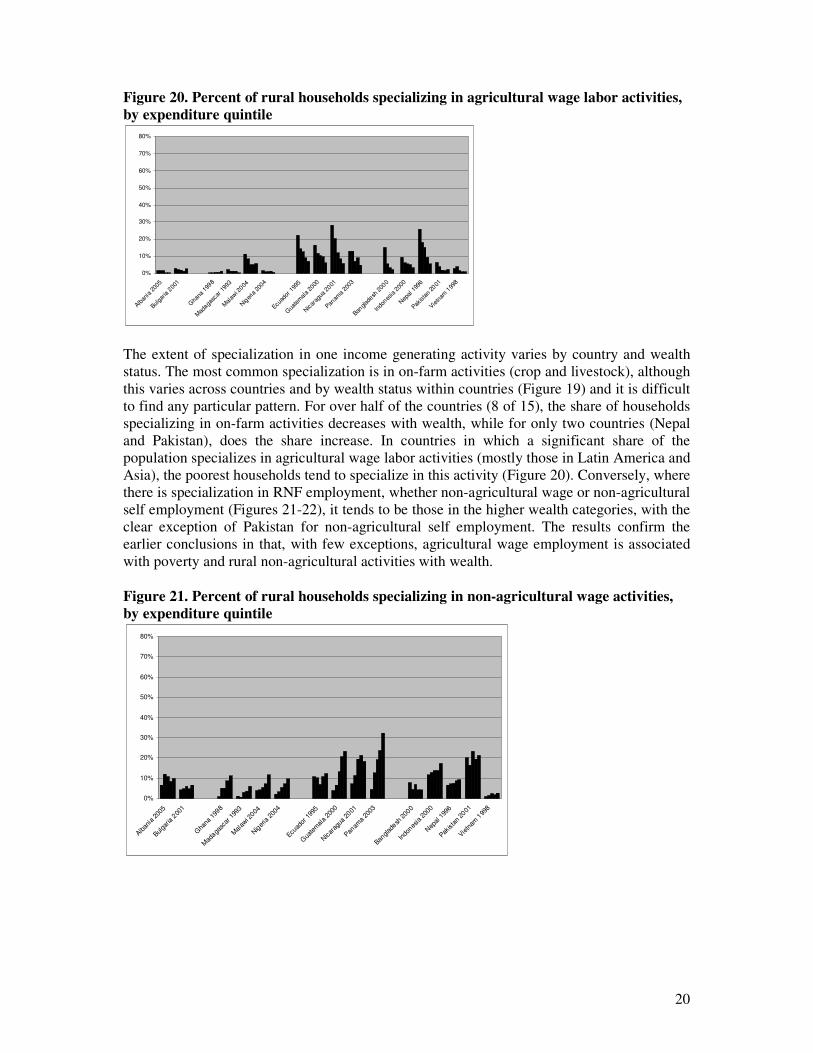
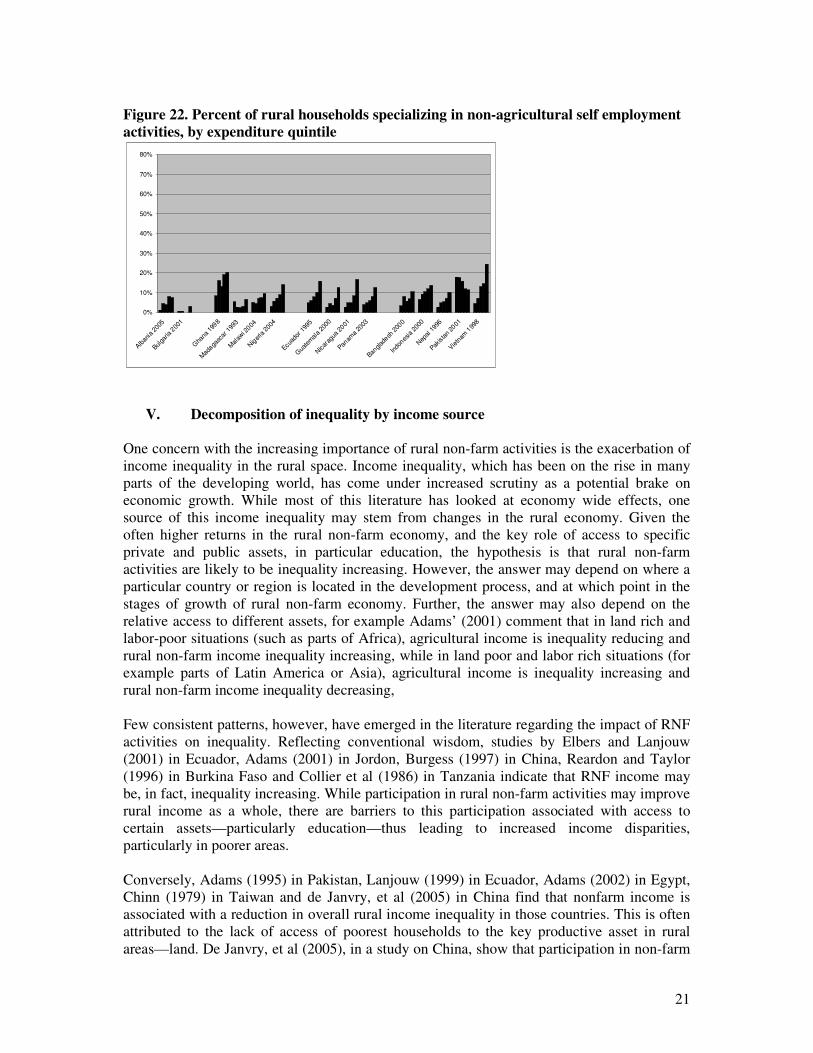
The extent of specialization in one income generating activity varies by country and wealth
status. The most common specialization is in on-farm activities (crop and livestock), although
this varies across countries and by wealth status within countries (Figure 19) and it is difficult
to find any particular pattern. For over half of the countries (8 of 15), the share of households
specializing in on-farm activities decreases with wealth, while for only two countries (Nepal
and Pakistan), does the share increase. In countries in which a significant share of the
population specializes in agricultural wage labor activities (mostly those in Latin America and
Asia), the poorest households tend to specialize in this activity (Figure 20). Conversely, where
there is specialization in RNF employment, whether non-agricultural wage or non-agricultural
self employment (Figures 21-22), it tends to be those in the higher wealth categories, with the
clear exception of Pakistan for non-agricultural self employment. The results confirm the
earlier conclusions in that, with few exceptions, agricultural wage employment is associated
with poverty and rural non-agricultural activities with wealth.
Figure 21. Percent of rural households specializing in non-agricultural wage activities,
by expenditure quintile
0%
10%
20%
30%
40%
50%
60%
70%
80%
Alban
ia 2
005
Bulga
ria 2
001
Gha
na 1
998
Mad
agasc
ar 1
993
Mal
awi 2
004
Nig
eria
200
4
Ecuad
or 1
995
Gua
tem
ala
2000
Nicar
agua
2001
Panam
a 20
03
Banglad
esh 2
000
Indo
nesia
200
0
Nep
al 1
996
Pakista
n 20
01
Vietn
am 1
998
21
Figure 22. Percent of rural households specializing in non-agricultural self employment
activities, by expenditure quintile
0%
10%
20%
30%
40%
50%
60%
70%
80%
Alban
ia 2
005
Bulga
ria 2
001
Gha
na 1
998
Mad
agasc
ar 1
993
Mal
awi 2
004
Nig
eria
200
4
Ecuad
or 1
995
Gua
tem
ala
2000
Nicar
agua
2001
Panam
a 20
03
Banglad
esh 2
000
Indo
nesia
200
0
Nep
al 1
996
Pakista
n 20
01
Vietn
am 1
998
V. Decomposition of inequality by income source
One concern with the increasing importance of rural non-farm activities is the exacerbation of
income inequality in the rural space. Income inequality, which has been on the rise in many
parts of the developing world, has come under increased scrutiny as a potential brake on
economic growth. While most of this literature has looked at economy wide effects, one
source of this income inequality may stem from changes in the rural economy. Given the
often higher returns in the rural non-farm economy, and the key role of access to specific
private and public assets, in particular education, the hypothesis is that rural non-farm
activities are likely to be inequality increasing. However, the answer may depend on where a
particular country or region is located in the development process, and at which point in the
stages of growth of rural non-farm economy. Further, the answer may also depend on the
relative access to different assets, for example Adams’ (2001) comment that in land rich and
labor-poor situations (such as parts of Africa), agricultural income is inequality reducing and
rural non-farm income inequality increasing, while in land poor and labor rich situations (for
example parts of Latin America or Asia), agricultural income is inequality increasing and
rural non-farm income inequality decreasing,
Few consistent patterns, however, have emerged in the literature regarding the impact of RNF
activities on inequality. Reflecting conventional wisdom, studies by Elbers and Lanjouw
(2001) in Ecuador, Adams (2001) in Jordon, Burgess (1997) in China, Reardon and Taylor
(1996) in Burkina Faso and Collier et al (1986) in Tanzania indicate that RNF income may
be, in fact, inequality increasing. While participation in rural non-farm activities may improve
rural income as a whole, there are barriers to this participation associated with access to
certain assets—particularly education—thus leading to increased income disparities,
particularly in poorer areas.
Conversely, Adams (1995) in Pakistan, Lanjouw (1999) in Ecuador, Adams (2002) in Egypt,
Chinn (1979) in Taiwan and de Janvry, et al (2005) in China find that nonfarm income is
associated with a reduction in overall rural income inequality in those countries. This is often
attributed to the lack of access of poorest households to the key productive asset in rural
areas—land. De Janvry, et al (2005), in a study on China, show that participation in non-farm
22
activities was associated with greater improvement in the income of the poorest households,
while the most proficient farmers remained in agriculture.
Some of these differences in outcomes may be due to differences in types of household data,
as well as definitions of what consists of rural non-farm activities. Further, due to the time
dimension, the relationship between inequality and RNF activities may be U-shaped; that is,
at initial stages of development RNF activities are inequality increasing but as the sector
develops and expands RNF activities are inequality decreasing.
Description of decomposition of Theil index
The objective of this section is thus to determine if growth in rural non-farm activities leading
to increased inequality, or more broadly, ascertain the role of each type of rural income
generating activity in reducing or increase household income inequality. We chose the Theil
index over its better known competitor, the Gini index, because we felt that the Thiel index
provides a cleaner and more intuitive decomposition of income inequality by income source.
We estimate the Theil T inequality index for total income and the components of total income
following the approach described by Morduch and Sicular (1998). This measure gives a
measure of inequality that accounts for the population share of each individual as well as the
share of income in total income for the individual level of observation. The following
equation describes how the Theil for each income component is obtained, where n1
represents the population share of each observation, k
iy is the individual-level income from
component k, yµ is the mean total per capita income (such that yky µ is the proportion of
individual-level income from component k to total average income), and iy is total per capita
income:
∑=
=
n
i y
i
y
k
ik yy
nYT
1
ln**1
)(µµ
The sum of the component Theils ( KkYTk ...1),( = ) is then equal to the overall Theil T
index, )(YT , illustrated by the following equation:
∑=
=
n
i y
i
y
i yy
nYT
1
ln**1
)(µµ
A Theil index of zero indicates equality since it implies that the share of income held by each
individual is equal to the individual’s population share (such that yiy µ/ equals 1 and its
logarithm equals zero). The larger the value of the Theil index, the greater the inequality, such
that the value of the overall index is restricted to the range )]ln(,0[ n where n is the sample
size. When the Theil is decomposed into its components, the index is subject only to an upper
bound such that: )ln()( nYTk
≤ . A negative index, 0≤k
T , would then indicate an inequality
reducing effect for component k, whereas a positive index, )ln()(0 nYTk
≤≤ , indicates an
inequality increasing effect, with the effect growing as )( kYT approaches )ln(n . Equality is
still represented by 0)( =k
YT .
23
Results
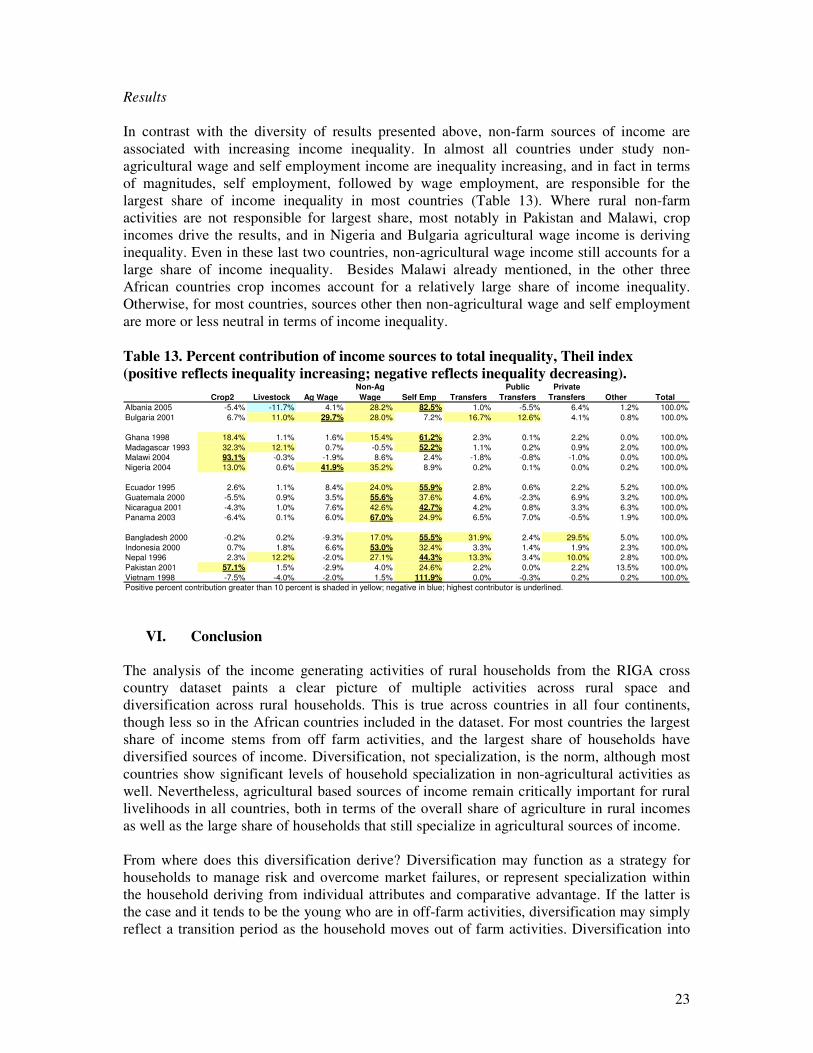
In contrast with the diversity of results presented above, non-farm sources of income are
associated with increasing income inequality. In almost all countries under study non-
agricultural wage and self employment income are inequality increasing, and in fact in terms
of magnitudes, self employment, followed by wage employment, are responsible for the
largest share of income inequality in most countries (Table 13). Where rural non-farm
activities are not responsible for largest share, most notably in Pakistan and Malawi, crop
incomes drive the results, and in Nigeria and Bulgaria agricultural wage income is deriving
inequality. Even in these last two countries, non-agricultural wage income still accounts for a
large share of income inequality. Besides Malawi already mentioned, in the other three
African countries crop incomes account for a relatively large share of income inequality.
Otherwise, for most countries, sources other then non-agricultural wage and self employment
are more or less neutral in terms of income inequality.
Table 13. Percent contribution of income sources to total inequality, Theil index
(positive reflects inequality increasing; negative reflects inequality decreasing).
Crop2 Livestock Ag Wage
Non-Ag
Wage Self Emp Transfers
Public
Transfers
Private
Transfers Other Total
Albania 2005 -5.4% -11.7% 4.1% 28.2% 82.5% 1.0% -5.5% 6.4% 1.2% 100.0%
Bulgaria 2001 6.7% 11.0% 29.7% 28.0% 7.2% 16.7% 12.6% 4.1% 0.8% 100.0%
Ghana 1998 18.4% 1.1% 1.6% 15.4% 61.2% 2.3% 0.1% 2.2% 0.0% 100.0%
Madagascar 1993 32.3% 12.1% 0.7% -0.5% 52.2% 1.1% 0.2% 0.9% 2.0% 100.0%
Malawi 2004 93.1% -0.3% -1.9% 8.6% 2.4% -1.8% -0.8% -1.0% 0.0% 100.0%
Nigeria 2004 13.0% 0.6% 41.9% 35.2% 8.9% 0.2% 0.1% 0.0% 0.2% 100.0%
Ecuador 1995 2.6% 1.1% 8.4% 24.0% 55.9% 2.8% 0.6% 2.2% 5.2% 100.0%
Guatemala 2000 -5.5% 0.9% 3.5% 55.6% 37.6% 4.6% -2.3% 6.9% 3.2% 100.0%
Nicaragua 2001 -4.3% 1.0% 7.6% 42.6% 42.7% 4.2% 0.8% 3.3% 6.3% 100.0%
Panama 2003 -6.4% 0.1% 6.0% 67.0% 24.9% 6.5% 7.0% -0.5% 1.9% 100.0%
Bangladesh 2000 -0.2% 0.2% -9.3% 17.0% 55.5% 31.9% 2.4% 29.5% 5.0% 100.0%
Indonesia 2000 0.7% 1.8% 6.6% 53.0% 32.4% 3.3% 1.4% 1.9% 2.3% 100.0%
Nepal 1996 2.3% 12.2% -2.0% 27.1% 44.3% 13.3% 3.4% 10.0% 2.8% 100.0%
Pakistan 2001 57.1% 1.5% -2.9% 4.0% 24.6% 2.2% 0.0% 2.2% 13.5% 100.0%
Vietnam 1998 -7.5% -4.0% -2.0% 1.5% 111.9% 0.0% -0.3% 0.2% 0.2% 100.0%
Positive percent contribution greater than 10 percent is shaded in yellow; negative in blue; highest contributor is underlined.
VI. Conclusion
The analysis of the income generating activities of rural households from the RIGA cross
country dataset paints a clear picture of multiple activities across rural space and
diversification across rural households. This is true across countries in all four continents,
though less so in the African countries included in the dataset. For most countries the largest
share of income stems from off farm activities, and the largest share of households have
diversified sources of income. Diversification, not specialization, is the norm, although most
countries show significant levels of household specialization in non-agricultural activities as
well. Nevertheless, agricultural based sources of income remain critically important for rural
livelihoods in all countries, both in terms of the overall share of agriculture in rural incomes
as well as the large share of households that still specialize in agricultural sources of income.
From where does this diversification derive? Diversification may function as a strategy for
households to manage risk and overcome market failures, or represent specialization within
the household deriving from individual attributes and comparative advantage. If the latter is
the case and it tends to be the young who are in off-farm activities, diversification may simply
reflect a transition period as the household moves out of farm activities. Diversification into

24
rural non-farm activities can thus be into either high or low return sectors, reflect push or pull
forces, and represent a pathway out of poverty or a survival strategy.
While the nature of the diversification response will vary by a given household, in each
country, overall greater reliance on non-farm sources of income is associated with greater
wealth. In almost all cases, wealthier households in rural areas have a higher level of
participation in, and greater share of income from, non-farm activities, while both public and
private transfers tend to be regressively, or neutrally, distributed. Similarly, wealthier
households have a larger share of specialization into non agricultural wage and self
employment activities.
Conversely, agricultural based sources of income are generally most important for the poorest
households. Income from crop and livestock activities, as well as from agricultural wage
labor, represents a higher share of total income for poorer households in almost all countries.
Furthermore, a higher share of households specializing in on-farm activities or agricultural
wage employment is found at the low end of the wealth distribution.
As would stand to follow from these trends, non-farm sources of income are associated with
increasing income inequality. In almost all countries under study, non-agricultural wage and
self employment income are inequality increasing, and in fact in terms of magnitudes, self
employment, followed by wage employment, account for the largest share of income
inequality in most countries.
These results are not uniform among all countries and Pakistan, for example, is the one
country which bucks most of these trends. Greater share of agricultural sources of income,
and greater specialization in agricultural activities, are associated with wealth, while the
opposite is true for non-farm employment. Similarly, crop income is inequality increasing in
Pakistan. These trends may be due to the particularly strong unequal land access in Pakistan,
and in particular the large number of landless among the poor, with the landless forced to low
return wage employment, both agricultural and non-agricultural.
Multivariate analysis of the data (presented in Davis, et al, 2007) suggests that overall, the
characteristics of households participating in different income generating activities are
surprisingly similar across very different countries. Households participating in on-farm
activities are landed, with lower levels of education, located at greater distances from
infrastructure, with an older, male headed household. Conversely, households involved with
non-agricultural wage labor have, overall, higher levels of education, but also are located
closer to infrastructure, with a younger head of household and a larger family. Households
participating in agricultural wage labor have little land or education, are isolated from
infrastructure, and have a younger, and primarily male, head of household. Finally,
households relying more on transfers are more likely to have older and female heads of
household.
The linking of assets with specific income generating activities is an indication of increasing
specialization of households in a given income generating activity over time, and as they seek
to leave poverty, in most countries as part of a general transition away from agriculture. One
key lesson from this analysis is the need to reduce constraints to participation in the non-farm
sector, both in terms of increasing demand through provision of education and other measures
to enhance human capital, as well as through increasing supply of labor opportunities, locally,
or elsewhere, through migration. A second lesson is the continued importance of agricultural
25
sources of income, particularly for poorer households. This idea, combined with recognition
that a large share of rural non-farm opportunities are often directly or indirectly generated by
agriculture, requires renewed emphasis on this sector.
For policy makers, the results offered here suggest the need to carefully consider how to
promote rural development. While the diversification of rural households clearly indicates the
need to look beyond agriculture in rural development policies, the overall importance of
agriculture, particularly for poorer households, suggests that the promotion of rural non-farm
activities ought to constitute a key component of any strategy. Policy makers must also be
careful that any intervention deal with the likelihood that barriers to entry may limit the
ability of poor households to take advantage of opportunities, particularly the most
remunerative, and thus exacerbate inequalities. The links between certain assets and activities
imply that due consideration be given to those assets, or combination of assets, which will
ensure broad growth in the rural economy. This complexity means that a particular policy is
unlikely to fit different situations across countries and even within regions in a given country
and that location specific policies are necessary. This ultimately calls for an institutional
structure that allows for the diversity of policy measures to match closely the diversity of the
rural economy.
26
References
Adams, R. (1995) “Sources of Income Inequality and Poverty in Rural Pakistan,” Research
Report 102 Washington, DC: International Food Policy Research institute.
Adams, R. (2001) “Non-Farm Income, Inequality and Poverty in Rural Egypt and Jordan,”
Policy Research Working Paper 2572, Washington DC: The World Bank.
Adams, R. (2002) Nonfarm Income, Inequality and Land in Rural Egypt. Economic
Development and Cultural Change 50(2): 339-363.
Araujo, C. (2005) Spatial patterns of non-agricultural rural employment growth in Mexico
during the 90s. Manuscript.
Azzari, C., Carletto, C., Davis, B., Fatchi, T. and Vigneri, T (2006) “Food and Nutrition
Security in Malawi”, Background paper prepared for the World Bank Malawi Poverty
and Vulnerability Assessment, Rome, March.
Barrett, C., Reardon, T. and Webb, P. (2001) “Nonfarm Income Diversification and
Household Livelihood Strategies in Rural Africa: Concepts, Dynamics and Policy
Implications” Food Policy 26(4).
Berdegue, J., Ramirez, E., Reardon, T. and Escobar, G. (2001) Rural Nonfarm Employment
and Incomes in Chile. World Development 29(3): 411-425.
Burgess, R. (1997) Diversification and Welfare in Rural China” Mimeo, London School of
Economics.
Carletto, G., Covarrubias, K. and Krausova, M. (2007) "Rural Income Generating Activities
(RIGA) Study: Income Aggregate Methodology," Agricultural Sector in Economic
Development Service, Food and Agriculture Organization.
Chenery, H. and M. Syrquin (1975). Patterns of Development. Oxford University Press,
London.
Chinn, D. (1979) “Rural Poverty and the Structure f Farm Household income in Developing
Countries: Evidence from Taiwan,” Economic Development and Cultural Change
27:283-301.
Collier, P., Radwan, S. and Wangwe, S. (1986) Labour and Poverty in Rural Tanzania.
Oxford: Claredon Press.
Corral, L. and Reardon, T. (2001) Rural Nonfarm Incomes in Nicaragua. World Development
29(3): 427-442.
Davis, B et al, 2007. “Rural Income-Generating Activities: A Cross Country Comparison”,
Background Paper for the World Development Report 2008.
Davis, B and Stampini, M. (2002) “Pathways towards prosperity in rural Nicaragua; or why
households drop in and out of poverty, and some policy suggestions on how to keep
them out,” ESA Working Paper 10-02, (Rome: FAO).
de Janvry, A., Sadoulet, E. and Zhu, N. (2005) The Role of Non-Farm Incomes in Reducing
Poverty and Inequality in China. CUDARE Working Paper 1001, University of
California, Berkeley.
Elbers, C. and Lanjouw, P. (2001) Intersectoral Transfer, Growth and Inequality in Rural
Ecuador. World Development 29(3): 481-496.

27
Ellis, F. (2000). Rural Livelihoods and Diversity in Developing Countries. Oxford: Oxford
University Press.
Fafchamp, M. and Shilpi, F. (2003) The Spatial Division of Labour in Nepal. Journal of
Development Studies, 39(6), pp. 23-66.
FAO (1998) The State of Food and Agriculture: Rural Non-Farm Income in Developing
Countries. Rome: Food and Agriculture Organization.
Ferreira, F. and Lanjouw, P. (2001) rural Non-farm Activities and Poverty in the Brazilian
Northeast. World Development 29(3): 509-528.
Filmer, D. and L. Pritchett. (2001) Estimating wealth effects without expenditure data – or
tears: An application to educational enrolments in states of India. Demography 38(1):
115-132.
Haggblade, S., Hazell, P. and Reardon, T. (2005) Transforming the Rural Nonfarm Economy,
mimeo
Isgut, A. (2004) Non-farm Income and Employment in Rural Honduras: Assessing the Role
of Locational Factors. Journal of Development Studies 40(3):59-86.
Lanjouw, P. and Shariff, A. (2002) Rural Non-Farm Employment in India: Access, Income
and Poverty Impact. NCAER Working Paper Series No. 81, New Delhi: NCAER.
Lanjouw, P., Quizon, J. and Sparrow, R. (2001) Non-agricultural earnings in peri-urban areas
of Tanzania: evidence from household survey data. Food Policy 26:385-403.
Lanjouw, P. (1999) “Rural nonagricultural Employment and Poverty in Ecuador.” Economic
Development and Cultural Change. 48(1): 91.
Lanjouw, P. and Feder G. (2001) “Rural Nonfarm Activities and Rural Development: From
Experience towards Strategy,” Rural Development Strategy Background Paper #4,
Washington, DC: The World Bank.
Lanjouw, J. and Lanjouw, P. (2001) “The Rural Nonfarm Sector: Issues and Evidence from
Developing Countries,” Agricultural Economics 26(1): 1-23.
Morduch, Jonathan and Terry Sicular. 1998. “Rethinking Inequality Decomposition, with
Evidence from Rural China.” Development Discussion Paper No. 636. Harvard Institute
for International Development, Harvard Univeristy. May.
Reardon, T. and Taylor, J. E. (1996) “Agroclimatic Shock, Income Inequality, and Poverty:
Evidence from Burkina Faso.” World Development 24(4): 901-914.
Reardon, T., Taylor, J. E., Stamoulis, K., Lanjouw P. and Balisacan A. (2000) “Effects of
Non-Farm Employment on Rural Income Inequality in Developing Countries: An
Investment Perspective,” Journal of Agricultural Economics 51(2):266-288.
Reardon, T., Berdegue, J. and Escobar, G. (2001) Rural Nonfarm Employment and Incomes
in Latin America: Overview and Policy Implications. World Development 29(3): 549-
560.
Ruben, R. and Van den Berg, M. (2001) Nonfarm Employment and Poverty Alleviation of
Rural farm Households in Honduras. World Development 29(3): 549-560.
Schmid, A. (1972). Analytical Institutional Economics: Challenging Problems in the
Economics of Resources for New Environment. American Journal of Agricultural
Economics 54:893-901.
28
Smale, Melinda, ed. (2006) Valuing Crop Biodiversity: On-Farm Genetic Resources and
Economic Change. Wallingford, UK: CABI Publishing.
Taylor, J. E., and Yunez-Naude, A. (2000). The Returns From Schooling in a Diversified
Rural Economy. American Journal of Agricultural Economics 82(2), 287-297.
Winters, P., Davis, B. and Corral, L. (2002). Assets, Activities and Income Generation in
Rural Mexico: Factoring in Social and Public Capital. Agricultural Economics 27(2):
139-156.
Yunez-Naude, A. and Taylor, J. E. (2001) The Determinants of Nonfarm Activities and
Incomes in Rural households in Mexico with an Emphasis on Education. World
Development 29(3), 561-572.
Zhang, X. and Li. J. (2001) Does Guanxi Matter to Non-Farm Employment? EPTD
Discussion Paper 74, Washington, DC: IFPRI
Zhu, N. and Luo, X. (2005) Impacts of Non-farm Income on Inequality and Poverty: The
Case of Rural China. Manuscript.