Review of the Business Innovation Facility portfolio
85
Review of the Business Innovation Facility portfolio Assessing results and trajectories of inclusive businesses at the end of a three year pilot BIF M&E team, Caroline Ashley, Carolin Schramm, Adriano Scarampi December 2013 Full version
Transcript of Review of the Business Innovation Facility portfolio
Review of the Business Innovation
Facility portfolio Assessing results and trajectories of inclusive businesses at the end of a three year pilot
BIF M&E team, Caroline Ashley, Carolin Schramm, Adriano Scarampi
December 2013
Full version

Content
Section name Page #
Introduction 3
Section 1 – Portfolio overview 9
Section 2 – Lead organisations 14
Section 3 – Inclusive business models 20
Section 4 – Inclusive business implementation process 26
Section 5 – Commercial results 35
Section 6 – Development impacts 55
Section 7 – Additionality of BIF support 68
Section 8 – Short projects feedback 79
Key acronyms
BoP: Bottom of the
pyramid
IB: Inclusive Business
MNC: Multi-national
Corporation
TA: Technical assistance

Introduction
3
The purpose of this document is to share the full M&E findings from the BIF
portfolio. It covers facts and figures in detail and includes reflections and
summarised findings. More information can be found in other BIF
publications (http://bit.ly/BIFPublications)

• This review summarises and explores emerging results and findings from the almost 300 inclusive businesses across
five countries (Bangladesh, India, Malawi, Nigeria and Zambia), that have been supported by the Business Innovation
Facility (BIF) over the past 3.5 years. Support from BIF is not cash, but technical input – some weeks or months of
advisory support to help the business overcome challenges, seize momentum, and make progress in its inclusive
business journey (see page 5 for further information on the logic of BIF support).
• BIF offers two types of support.
• Long term technical support has been offered to 40 companies on a cost-sharing basis. In general, this support
can last between three and six months. The providers of technical assistance are often deeply involved with the
company for the period of time. The impact of the support is carefully monitored and evaluated. We call these
‘Long Projects’
• Short term technical support. This is provided to a company, or a cluster of companies on one aspect of their
business venture. This short term support (up to 20 days) focuses on helping them to overcome an immediate
bottleneck or to seize an opportunity. We call these ‘Short Projects’. Around 60 companies have been the
direct beneficiaries of this support, as well as almost 200 companies that have taken part to workshops and
focus groups.
• We draw on various data sources (company data, consultant feedback and BIF team knowledge and insights) both
quantitative and qualitative. This review focuses mainly on long projects for which – given the fact support is longer and
more substantial – we also have obtained more monitoring & evaluation data (see pages 7 and 8 for further
information).
• This review builds on previous analysis done over the lifetime of the BIF pilot and compares data over time where
possible. To access previous reviews please visit http://businessinnovationfacility.org/group/inclusive-business-impacts-
network
BIF Context & Background
4

The logic of BIF
5
For a more detailed overview of BIF's logic chain see our Spotlight, the logic of Business Innovation Facility
support ( http://bit.ly/BIFlogic ), that builds up a diagram of our logic chain in six steps. It shows the journey that
companies are on developing inclusive business, where BIF intervenes, and how this is intended to lead to
impacts at the Base of the Pyramid, changes in systems and uptake of inclusive business by others.

BIF support The pilot BIF has provided support to 40 long and 68 short projects across five countries. The total value of the technical
assistance for long projects is $1,883,475 and $759,817 for short projects, i.e. a total of approximately $2.6million. This
review focuses mainly on long projects.
Lead organisations Medium and large companies predominate regardless of location. Only a few are start-ups or led by NGOs. In our
analysis of lead organisations for long projects we differentiate between two categories:
• Established medium/large companies that are diversifying into inclusive business (63%); we refer to these as
‘diversifying-into-IB’ in short
• Where the inclusive business is the core business model of the company (35%); we refer to these as ‘core-IB’ in short
Inclusive Business
Models
The portfolio is split almost evenly between inclusive business projects that primarily benefit consumers at the BoP and
those that benefit producers. Projects are spread across many sectors, but with a heavy concentration in food and
agriculture. A handful of projects have a particular focus on women and/or the environment.
Inclusive Business
implementation
progress
It was always expected that the BIF portfolio would include businesses that flourish, many that progress, and a few that
falter, though firm predictions of percentages were never made. As of September 2013, a snapshot of the portfolio
shows that 80% of the large projects are progressing and one in five has stalled or been cancelled. Of those making
progress, two so far count as flourishing, and just over half count as progressing well.
Commercial
Results
Current turnover of the inclusive businesses varies widely from zero to several millions. Business growth has been
variable in the first year or two since a baseline was completed with BIF. Focusing exclusively on the 18 businesses that
have actual outturns for Years 0 and 1, we can see that turnover grew by 62 per cent from around $95,000 to $155,000.
Based on latest actual figures available four projects are reporting positive profits. A further seven estimate positive
profits in year 1.
Development
impacts
Impacts at the BoP are moderate so far, potentially high, certainly variable and difficult to estimate.
At the time of BIF baselines, the total portfolio was reaching around 75,000 people at the BoP, while latest data for Year
1 is to reach around 235,000. Companies have reported that the reach is expected to grow to a total of 5.7m households
in year 5. Adjusting these estimates by an optimism factor and scaling them down by the current progress of the projects
has allowed us to estimate these figures to a more realistic 3.7m. Of these, we believe that 1.5m households can be
plausibly linked to BIF’s input.
BIF BIF support has focused mainly on business planning support. About 50% of projects perceive strong additionality.
Around 40% identify medium additionality.
Headline messages

7
Data sources for this review
The methodology of BIF’s Monitoring and Evaluation (M&E) system is centred around three milestones
1. An initial Baseline, just before or at the start of service delivery
2. A Progress Report, at completion of service delivery from the Facility
3. An Update Report, completed 12 months after the Progress Report
The data used during this portfolio review has been collected during the three milestones, as well as during the initial
application process through ongoing project management. It is made of both quantitative and qualitative data, which
we have aggregated to provide an overview of the composition of the portfolio, the progress to date and the
expectations going forward.
In addition, we have conducted regular team assessments of various indicators around project progress which are
also part of this review
The diagram below summarizes the various stages of the process, including the type of forms that have been
collected along the way.
BIF
technical
Support
Selection
M&E
milestone #1
Baseline
assessment
After 1
year
M&E
milestone #2
Completion of
support
M&E
milestone #3
Update on
progress
Baseline
Country Manager Wrap
Up report
Service Provider
Feedback report
Project Update
report
Application
form
Application
Progress
Report

8
Project sample sizes subject of this review
40 Application forms
Baseline forms 40*
Progress Reports A (qualitative) 32
Progress Reports B (quantitative) 25
Project Update reports 14
Service Provider Feedback
Country Manager Wrap Up
Team knowledge and research
Sample subject of this portfolio review
Data sources
40**
46
37
32
Long projects approved by BIF selection committee
Long projects contracted, for which baseline was
carried out and BIF support started
Long projects for which BIF support is completed or
expected to be completed
Projects for which updated quantitative & qualitative
data is available (Progress Report or Project Update)
Data availability
* In some instances the sample will be lower than 32 because of the impossibility to capture certain data or poor data provided by the
organisations
** Although all projects completed the baseline reports, one was not able to provide any financial data
Various
39
In total 46 long projects have been approved by the BIF selection committee over the past 3.5 years. BIF support,
however, only began for 40 of these. For 32 projects we obtained updates to information collected at baseline.
Hence, for basic analysis our sample size is 40 and for comparison over time our sample size, in most cases, is 32*.

Section 1
Portfolio overview
9

Overview of BIF input
• The BIF portfolio includes 40 long projects for which
support has been completed (or completion is expected
in due course)
• The average contractual length of the long projects is of
5.5 months. The longest project lasted for 17 months
and the shortest for 2
• The total contracted value of TA support provided is
$1,883,475
• Average BIF spend per project: $47,087
• Highest BIF project input: $115,930
• Lowest BIF project input: $13,200
Match funding
• Total amount match funded by the businesses
themselves is: $2,223,509, which corresponds to 117%
of the amount spent by BIF on TA
• Of this funding, $791,380 was in actual cash
contribution, equal to 42% of BIF’s spend on TA (this
was spent for marketing costs, paying for the hire of
external resources etc…)
• The highest match funding has been for a total of
$175,000, that went to cover product R&D and
marketing costs
Portfolio of the 40 long projects
10
9
6
9
6
10 Zambia
India
Bangladesh
Malawi
Nigeria
Long projects by country of operation (N=40)
$41,947
$56,167 $54,960 $49,538
$43,205
-
10,000
20,000
30,000
40,000
50,000
60,000
Zambia India Bangladesh Malawi Nigeria$
Average long project BIF spend per country, $ (N=40)
46%
35%
19%
BIF TA spend
In kind from recipientorganisations
Cash injection from recipientorganisations
Breakdown of spend (N=40)

Our portfolio of long projects: 40 companies, 5
countries
11
Bangladesh – 9
JITA, Agora, Pabna Meat, ERAS,
ACI, Shiblee, PRAN Agro, large
international NGO*, food producer*
India - 6
Azure, HUL, MCX
GSK, Saraplast,
mKRISHI®,
Waterlife/Bosch
Nigeria - 10
AACE, Furniture Village,
Guinness, Stanbic, Dala
Food, Teragro, L&Z, d.light,
Best Foods, O-Gas
Zambia - 9
Ischool, Barrick,
Healthstore, Sylva Foods,
Tata Tannery, CEC,
Cropserve, Sun Hotels,
Lafarge Malawi - 6
Malawi Mangoes,
Microloan, MEGA, Afrinut,
Universal, tea company*
* confidential
* confidential
Logos are illustrative

Overview of BIF input
• The BIF portfolio includes 68 short projects
• Of these, 46 were one-to-one TA interventions, and 22
were one-to-many workshops and research projects
• The total value of TA support provided is $759,817
• Average BIF spend per project: $11,174
• Highest BIF project input: $24,543
• Lowest BIF project input: $2,550
Portfolio of the 68 short projects
12
$10,998
$13,646
$10,626 $9,999
$12,307
Zambia India Bangladesh Malawi Nigeria
Average short project spend per country (N=68)
10
6
14 21
17 Zambia
India
Bangladesh
Malawi
Nigeria
Short projects by country of operation
(N=68)
46
22 one-to-one
one-to-many
Short projects: one-to-one vs one-to-many (N=68)

Our portfolio of short projects
13
Bangladesh – 15
ACI, BSOA (Bangladesh
Supermarket Owners
Association, FSB, M&S,
Mitsubishi, Pabna Meat, Gain +
workshop participants
India - 6
Airtel, Milk Mantra,
Azure Power, Better
Cotton Initiative,
Sankalp + workshop
participants
Nigeria - 18
Abira, Beekeeping
Extension Society, Folawiyo
Farms Ltd, Guinness,
League of Contractors,
Onward Papermill,
Sabeanat Nigeria Ltd +
workshop participants
Zambia – 10
ARK, BioCarbon Partners
Zambia Limited, CHC
Commodities, Sun Hotels,
Sunline, Taj Pamodzi Hotel
+ workshop participants
Malawi – 22
Afrisphere Worldwide, Charles Stewart, CISP,
Ecobricks, Global Tea and Commodities,
Independent, Malawi Mangoes, Moringa
Miracles, Nali, Rab Processors, Tree Crops
Ltd + workshop participants
Logos are illustrative

Section 2
Lead organisations
In our analysis we distinguish between host companies (“lead organisations”) and their inclusive business models.
In some cases the two are identical, e.g. a small start-up company for which the main and only activity is the
‘inclusive business’. For others, this is not the case, e.g. for medium or large companies that only focus a part of
their business on becoming more inclusive. This gives us two important categories:
• Established medium/large company that is diversifying into inclusive business (62.5%), we refer to these as
‘diversifying-into-IB’ in short
• Inclusive business is the core business model of the company ( 35%), we refer to these as ‘core-IB’ in short.
2.5% of businesses cannot be clearly associated with one category because they are led by an NGO or
International organisation.
14

5
10
3
5
13
10
- 5 10 15
4
10
1
5
6
14
- 5 10 15
NGO international
Internationalmedium/large
NGO domestic
Domestic & startup
Domestic and small
Domestic andmed/large
• We differentiate between lead organisations and
the inclusive business venture
• Lead organisations are defined as the organisations
that BIF has a contractual relationship with
• The size of the lead organisation is determined by
its number of employees:
• Start up or Micro: 10 employees or less
• Small: less than 50 employees
• Medium: between 50 and 250
• Large: more than 250
• The portfolio is diverse: two thirds of lead
organisations are domestic, and one third
international
• Over half of the companies of the 40 long projects
are medium or large (size based on employee
numbers)
• Short projects have a larger proportion of small
domestic lead organisations
A diverse portfolio of lead organisations
15
Long projects (N=40) Short projects (N=46)*
Number of projects per type of lead organisation
* Only 46 lead organisations for the short projects are included as these are the one-on-
one projects. BIF does not have contractual relationships with any organisations on most
one-to-many short projects
# projects

• In terms of number of employees, 43% of the organisations BIF has contracted with have over 250 employees
• Medium and large companies predominate also when looking at the lead firm turnover
• Amongst the 35 contracting organisations for which turnover data is available, 29 (81% of the total) have turnovers
over $1 million
• Seven of these are MNCs: Hindustan Unilever, Tata Group, Waterlife, Guinness, Stanbic, Tata Tannery, and a large
food producer
Medium and large companies predominate in our
portfolio of long projects
16
4
9 10
17
0
2
4
6
8
10
12
14
16
18
Start-up ormicro (10
employees orless)
Small (less than50)
Medium(between 50
and 250)
Large (250plus)
Categorisation of lead firm by number of employees
(N=40)
For four lead firms, turnover data is not available
2 1
4
12
17
-
2
4
6
8
10
12
14
16
18
>=0,<=10,000
>10,000,<=100,000
>100,000,<=1,000,000
>1,000,000,<=10000000
>10,000,000,
$
Categorisation of lead firm turnover (N=36)

17
Medium and large companies predominate regardless
of location. Only a few are start-ups or led by NGOs
1
2
2
1
4
1
2
3
1
2
4
4
3
5
2
3
- 2 4 6 8 10
Zambia
India
Bangladesh
Malawi
Nigeria
# projects
Start-up or micro (10 employees or less)
Small (less than 50)
Medium (between 50 and 250)
Large (250 plus)
Lead organisations categorised by number of
employees and country (N=40)
• In all countries medium and large companies make up a
large proportion of all long projects
• India does not have any small, micro or startup projects
in its portfolio
• Three lead organisations can be classified as startups:
MEGA and Malawi Mangoes in Malawi, AACE in Nigeria
• Six projects are led by NGOs
Lead NGO Country Project name /
company name
Twin Trading Malawi Afrinut
Microloan Foundation Malawi Microventures
Large international NGO* Bangladesh
CARE Bangladesh JITA
Waterlife India Partnership with Bosch
Healthstore Foundation Zambia One Family Health
Projects where the leading organisation is an NGO
* Confidential

Project relationship to lead organisation
18
• We categorise how the inclusive businesses fits into the lead
organisation in the following way:
– Diversifying into IB (62.5% of all long projects): these
are organisations for which the Inclusive Business is a
small part of their overall operations (see diagram with
ACI’s example below)
– Core-IB (35% of all long projects): organisations for
which the Inclusive Business is the lead organisation
itself (see MEGA’s example below)
– Other (2.5% of all long projects): These are projects for
which the other two categorisations do not apply. Only
one cannot be categorised as it is a large NGO-led
programme
• Our portfolio of large projects is well split between the two
different business models
MEGA’s Inclusive Business boundaries ACI’s inclusive business boundaries
25
14
1
Diversifying into IB
Core-IB
Other
Portfolio Breakdown of type of project (N=40)

19
Driving departments in lead organisations
* Using latest available data, 14 projects reported at Progress Update / Project Report, 18 at Baseline
“Other” also includes “General Management”
3
5
4
1
3
2
6
4
4
- 4 8 12
Social responsibility / Public affairs / Communities relations
Operations / Procurement / Supply / Sales
Central innovation / Strategy / R&D
General Management
Other
# projects
Diversifying-into-IB Core-IB
Driving departments in lead organisations, by IB model (N=32)

Section 3
Inclusive business models
This section looks at a range of different characteristics that we use to define and categorise the inclusive business
ventures that BIF has supported. For example, the type of project is defined by sector, product and beneficiary
group (consumers / producers / distributors) . Or in other words the area in the value chain where the greatest
benefits for low income people occur. We also illustrate which projects have a particular focus on women and/or the
environment.
20

• The portfolio is split almost evenly between inclusive
business projects that primarily benefit consumers at
the BoP and those that benefit producers. JITA in
Bangladesh, is the only long project that targets BoP
distributors.
• Around one quarter of projects* also have a
secondary group of beneficiaries. In the case of JITA,
it is projected that up to 2million rural women
consumers will also benefit
• It is important to note that a project is considered
‘consumer focused’ if it sells goods and services to
the BoP – even if they are farmers and their
livelihood is production, E.g. mKrishi® or MCX
• Short projects are predominantly producer focused.
This is driven by the predominance of Malawian and
Nigerian projects in the portfolio, which have a
greater focus on BoP producers.
• Six short projects cannot be classified in terms of
BoP focus. These are networking workshops aimed
at bringing together various players within an industry
sector, not focusing on a specific BoP target
Base of the Pyramid (BoP) focus
21
49
11
2 6 Producer
Consumer
Distributor
N/A
Short projects by primary BOP beneficiary type
(N=68)
21 18
1
Producer
Consumer
Distributor
Long projects by primary beneficiary type (N=40)
JITA
* JITA (Consumer), Malawi Mangoes (Distributor), d.light (Distributors), L&Z (Distributors), Dala Food (Producers), Healthstore
(Distributors), Sylva Foods (Consumers),

BoP focus by country
22
5
5
5
6
4
6
3
1
4
1
- 2 4 6 8 10
Zambia
India
Bangladesh
Malawi
Nigeria
# projects
Project BoP Focus by Country (N=40)
Producer Consumer Distributor
• When looking at BoP focus by country, we see
divergence.
• The largest of our markets, India, focuses
exclusively on projects targeting consumers at
the BoP. These are mainly inclusive businesses
bringing products to the BoP that aim at
improving their lifestyle and living conditions (e.g.
Waterlife, mKrishi®, HUL)
• The smaller Malawian economy, with a large
rural population heavily reliant on the agricultural
sector, has a majority of projects targeting
producers. The principle aim of these projects is
to develop inclusive value chains linking
smallholder farmers to markets, such as
Universal, Malawi Mangoes and Afri-nut
• The Zambian, Nigerian and Bangladeshi
portfolios are more balanced.

32
7
8
10
1
3
3
4
20
7
6
3
2
1
1
- 10 20 30 40
Agriculture and Food
Energy and Infrastructure
Retail, manufacturing andconsumer goods
Other (includes education andICT)
Water, sanitation and wastemanagement
Health
Finance
Cross-sector
# projects
Number of projects by sector of operation
Long projects (N=40) Short projects (N=68)
• Projects are spread across many sectors, but
with a heavy concentration in food and
agriculture.
• This sector includes projects that sell to
farmers (e.g. soil testing kits), purchase farm
products for processing (e.g. mangoes for
juice, hides for tanning), or are sourcing for
food manufacture (e.g. soups) or retail sale
(e.g. urban supermarkets).
• Long projects that benefit farmers as
consumers include mKrishi®, MCX GSK,
ERAS, Cropserve
• Four short projects are not aligned to any
specific industry sector and have been
categorised as “cross-sector”. These are
workshops bringing actors from various
industries together to discuss and network
around the issue of ‘doing’ Inclusive Business
Projects by sector of operation
23
Farmers as consumers: 4
Farmers as consumers: 6

24
Focus on women
Project Country Focus on women
JITA Bangladesh Rural distribution
Pabna Meat Bangladesh Value chain / cattle
PRAN Bangladesh Value chain / cassava
Food
producer **
Bangladesh Nutrition
Shiblee Bangladesh Fish farming
Afri-nut Malawi Value chain / groundnut
Universal Malawi Value chain / cassava
Microloan Malawi Micro-credit for farming
O-Gas Nigeria Cookstoves
Projects with a focus on women (more than 50% of BOP
beneficiaries)
* Categorisation based on BIF team assessment
** Company name confidential
• Nine projects (22.5% of total) are categorised as having a
particular focus on women. Among these, there are producer
focused projects targeting value chains in which women play
an important role (Afri-nut / peanuts, Pabna Meat / Beef,
Universal / cassava), projects linking women to agricultural
markets (Microloan and ERAS) and projects aimed at
empowering distributor women (JITA)
• The thirteen projects classified as targeting less than 50% of
women beneficiaries are mostly projects engaging with male
farmers 13
18
9
-
2
4
6
8
10
12
14
16
18
20
Less than 50% Around 50% More than 50%
Projects by % of women beneficiaries (N=40) *

25
Focus on the environment, ‘climate smart’
projects
7
33
Climate smart projects
Non-climate smart projects
Projects that are be classified as ‘climate smart’ (N=40)
Project Country
ERAS Bangladesh
Waterlife / Bosch India
Azure Power India
MEGA Malawi
Malawi Mangoes Malawi
O-Gas Nigeria
CEC Zambia
List of ‘climate smart’ projects
Example projects
Waterlife/Bosch - India
In partnership with Bosch, Waterlife is seeking to
develop an inclusive business project based on
sound water management. The objective of this
project is to develop an end-to-end system for
water management. As affordable clean drinking
water in India is scarce due to the high cost of
filtration, by 2050, water availability is expected to
drop by about 44%. Waterlife have therefore
identified a significant opportunity to develop a
new technology solution to supply affordable
drinking water to low-income communities.
ERAS - Bangladesh
ERAS aims to create viable private sector supply
chains that give smallholders access to affordable
and effective soil testing services. The
Environmental Research and Analytical Service
(ERAS) aims to provide low-cost materials (start-
up laboratory kits and chemical reagents),
knowledge and support (training and long-term
advisory) for local entrepreneurs to develop soil
testing businesses in rural areas.

Section 4
Inclusive business implementation process
What common constraints and challenges are being faced? What phase of development are projects in – early
design or reaching significant scale? Have phases changed over the lifetime of BIF? This section looks at
• Project progress
• Project maturity
• Partnerships
• Common challenges and constraints
26

27
Assessment of project progress
Category Example project
Flourishing JITA already reaches some thousands of low – income people, turnover is in the hundreds of thousands,
and it is reaching break even ahead of schedule.
Progressing
well
After initial delay in the first season, Malawi Mangoes has now secured first round investment, the
processing plant is being completed, first mangoes will be harvested this year, and further expansion is
underway.
Progressing
slowly
One Family Health is planning to roll out Child and Family Wellness Clinics in Zambia. A great many
obstacles have had to be tackled along the way to get ready for implementation.
Stalled After exploring options for Tata Tannery’s sustainable leather sourcing initiative, it is not clear that the
feasibility and benefits of intervention are strong enough.
On ice Microventures plan to develop market linkages was cancelled after initial problems in the concept
coincided with a gap in staffing.
4 4
13
17
2
-
6
12
18
On ice Stalled / on hold Progressing slowly Progressing well Flourishing / securelyestablished
Project progress by BIF team assessment (N=40)
75% of
projects
The BIF team assessment is an assessment of the progress of the individual projects carried out in September 2013. It is a collaborative effort
between the Country Managers and the BIF core M&E team

25%
68%
7%
Project progress optimism level (N=27)
More optimisticorganisations
Organisationsassessment equal toBIF team's
More pessimisticorganisations
28
Data is only available for 27 projects out of 32 that have completed a progress report or project update
The ‘optimism level’ is the difference between the project
progress reported by the organisations themselves and the
progress that has been assessed by the BIF team
• For 68% of all organisations, the perception of the
progress of their project is in line with the assessment
made by the BIF team
• There is, however, a larger number or organisations that
are optimistic (25%) rather than pessimistic (7%) about
the progress of their project
• There is no visible pattern around the optimism level.
Optimism and pessimism is not driven by the business
model (core-IB vs diversifying-into-IB), nor by the project
progress or maturity (blueprint and design,
implementation etc…)
Assessment of project progress

Assessment of Project Maturity
29
Building on work done by Acumen and Monitor* we differentiate four different phases of development or maturity:
1. Blueprint and design
2. Early operation
3. Implementation
4. Moving to scale
It is important to bear in mind that in some cases the company itself may be well established, but the categorisation
applies to the specific inclusive business project that is supported.
We have assessed project maturity levels** at three milestones during the BIF pilot. At the first milestone in June 2012,
assessment was mainly driven by self categorisation of companies at baseline which explains the high share of projects
‘moving to scale’ in June 2012. When looking at the last two assessments (February and September 2013) we can see
an overall tendency of increasing maturity, and as of September 2013, the majority of projects (66%) are in the
operational phases.
5
22
11 Negative change
No change
Positive change
Project maturity change from February 2013
to September 2013 (N=38)
* Concept note entitled: “Building markets for impact at scale” a research proposal being part funded by DFID, April 2013.
** The assessment of the project’s maturity has been made by BIF’s central M&E team at the milestones: June 2012, February 2013
and September 2013
25%
41%
33%
37%
33%
20%
10%
2%
0% 20% 40% 60% 80% 100%
September 2013(N=40)
February 2013(N=41)
BIF project maturity index (N = various)
Blueprint and design Early operation and Validation
Implementation Moving to scale

Challenge / constraint to the
success of the Inclusive Business
Number of organisations
that identified this as a
challenge at Baseline
(N=40)
How this challenge
ranks in terms of
importance, out of
17 categories
Proportions of
organisations that
believe that BIF has
made an impact on this
challenge / constraint **
Need partnerships with government 12 3/17 44%
Need new or better partnerships
with others 10 7/17 60%
How important are partnerships to the inclusive
business? How has BIF helped?
• Partnerships can also be viewed as a significant obstacle to the success of the inclusive business. This is especially
true for partnerships with the government (this can be either the local or central government)
• Two of the companies that have indicated that BIF has improved their partnerships with the government are:
Universal (Malawi) and ERAS (Bangladesh)
45%
41%
14% High
Medium
Low
Impact that the collaboration with BIF has had
on new partnerships (N=22)*
* We were able to collect data from 22 organisations on this specific
benefit
• When carrying out the baseline assessment, businesses
were asked to rate their expectations on various benefits
that the collaboration with BIF could bring. The same
information was then collected at Progress Report to
understand the impact that BIF had in practice
• Out of 11 benefit categories, ‘New partnerships’ ranks 4th
in terms of BIF contribution, with 45% of businesses
saying that BIF had an impact higher than expected
** out of the organisations that were able to report on this indicator, this refers to the percentage of those that reported that BIF has made a
significant impact on the challenge

31
During our baseline assessment, companies were asked to indicate their top challenges from a drop down list (but could
also add other constraints not listed)
• A wide variety of challenges were identified
• In general, challenges do not seem to be dependent on the BOP focus of the projects but we can see some divergence:
• The policy and regulatory environment is a challenge almost exclusively identified by consumer focused projects
• Lack of infrastructure on the other hand has only been identified as a key challenge by producer focused projects
Common challenges and constraints identified at
baseline
2
2
1
7
5
4
6
6
5
5
4
4
2
4
8
8
1
2
3
2
4
5
5
6
6
8
8
5
6
- 5 10 15
Lack of development impacts
Insufficient internal company support or consensus
Not sure how to move from pilot to scale
Lack of demand/ lack of expertise and/or resources for marketing
Lack of infrastructure
Project development is taking too long/ long timeframe for payback
Too much effort to develop new ways of working
Lack of information about similar work elsewhere
Need new or better partnerships with others
Low return on investment
High risk project
Need to access finance that is appropriate to the nature of the project
Lack of skills within company (knowledge, awareness, expertise)
Policy and regulatory environment are restrictive
Need partnerships with government
Insufficient internal resources and finance
Lack of market information
Challenges of the Inclusive Business identified at Baseline, by BOP focus (N=40)
Producer Consumer
The producer project, JITA, has been merged with the rest of the producer projects in this diagram

32
Has BIF made
a difference?
28 companies have responded to the question “how do you now rate in terms of importance the top 10 challenges that were identified at
Baseline?”
In addition, these 28 companies were asked if BIF had had an impact on addressing this challenge since Baseline. “Has BIF made a
difference” refers to the percentage of respondents that have said “yes” to this question, out of the ones that had identified this challenge as
important at Baseline
At Progress Report, companies were
asked to update the importance of their
top challenges, and report if BIF had
made a difference to addressing it
The bars on the left show the
percentage of projects that have rated
the challenge as ‘high” (high indicates
challenge is still very relevant)
Challenges have been ordered by most
popular at baseline (the highest being
at the top)
• The policy and the regulatory
environment, and the risk of the
project are the two challenges that
are still the most relevant at Progress
Report
• BIF has had the strongest impact at
addressing the risk of the projects,
the lack of skills within the
company, the lack of market
information
• The low return on investment is the
challenge for which BIF’s support has
made the least difference
Evolution of top challenges over the lifetime of
BIF
14%
40%
33%
50%
43%
33%
57%
33%
30%
27%
0% 25% 50% 75%
Lack of information about similarwork elsewhere
Need new or better partnershipswith others
Low return on investment
High risk project
Need to access finance that isappropriate to the specific nature…
Lack of skills within company(knowledge, awareness, expertise)
Policy and regulatory environmentare restrictive
Need partnerships withgovernment
Insufficient internal resources andfinance
Lack of market information
Percentage of projects identifying the challenge as “high”
Top 10 challenges identified at baseline and % of
projects rating them ‘high’ at Progress Report (N=28)
73%
60%
44%
43%
83%
57%
67%
33%
60%
43%
Need to access finance that is
appropriate to the nature of the project

33
21 18
1
Producer
Consumer
Distributor
Portfolio breakdown by primary beneficiary type (N=40)
Summarising some key characteristics of the
portfolio of long projects
4
4
13
17
2 On ice
Stalled / on hold
Progressing slowly
Progressing well
Flourishing / securelyestablished
Portfolio breakdown by status of IB project in September
2013 (N=40)
25
14
1 Diversifying into IB
Core-IB
Other
Portfolio Breakdown of type of project (N=40)
34
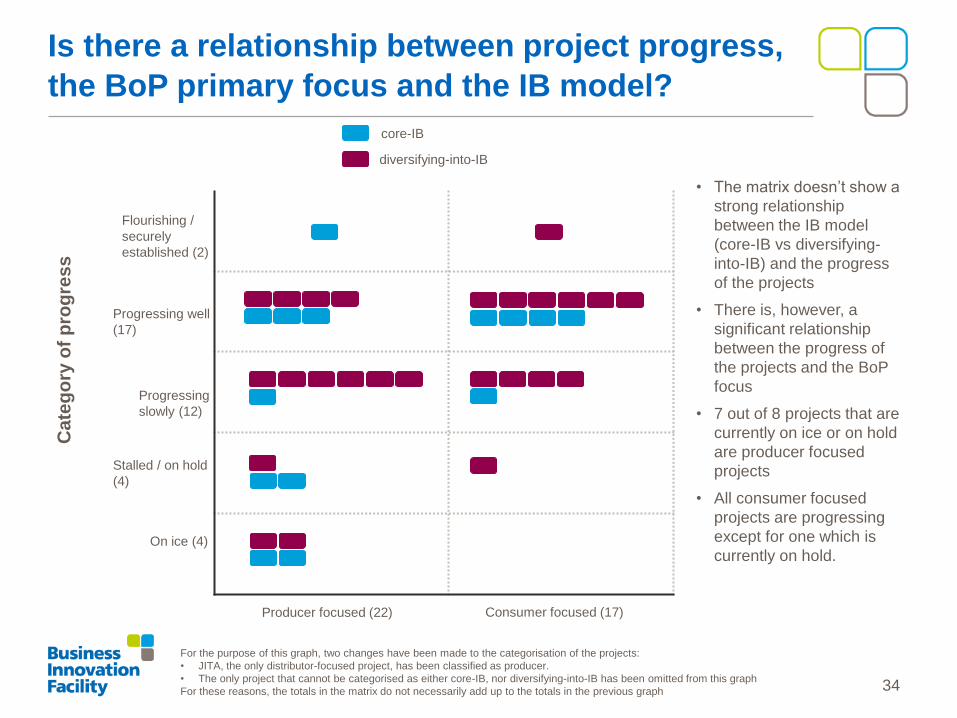
Is there a relationship between project progress,
the BoP primary focus and the IB model?
• The matrix doesn’t show a
strong relationship
between the IB model
(core-IB vs diversifying-
into-IB) and the progress
of the projects
• There is, however, a
significant relationship
between the progress of
the projects and the BoP
focus
• 7 out of 8 projects that are
currently on ice or on hold
are producer focused
projects
• All consumer focused
projects are progressing
except for one which is
currently on hold.
Producer focused (22) Consumer focused (17)
On ice (4)
Stalled / on hold
(4)
Progressing
slowly (12)
Progressing well
(17)
Flourishing /
securely
established (2)
core-IB
diversifying-into-IB
Ca
teg
ory
of
pro
gre
ss
For the purpose of this graph, two changes have been made to the categorisation of the projects:
• JITA, the only distributor-focused project, has been classified as producer.
• The only project that cannot be categorised as either core-IB, nor diversifying-into-IB has been omitted from this graph
For these reasons, the totals in the matrix do not necessarily add up to the totals in the previous graph

Section 5
35
Commercial results
In this section we look at
1. Commercial drivers of projects and to what extent companies feel they are on track to achieve them
2. Financial data: turnover figures collected from long projects
3. Types and levels of investment
4. Assessments of a project’s perceived likelihood to reach commercial viability

Commercial drivers
36

9
8
9
8
4
6
3
10
4
3
6
6
3
3
8
10
8
3
6
6
4
- 10 20 30
Increase profitability of your product/business, increase productivity, reduce costs
Get first mover advantage in an inclusivebusiness model
Access new markets (geographic markets,product markets, base of pyramid markets
etc)
Increase market share of your product/business
Increase/ guarantee security andsustainability of the supply chain
Develop competitive advantage anddifferentiation from competitors
Enhance brand identity/ value, customerappeal
Identified at baseline, but no update available
Identified at baseline, no signs of delivering
Identified at baseline, showing signs of delivering at progress report
Main commercial drivers for long projects identified at baseline, and
progress made (N=40)**
37
• 67.5% of long projects have
identified “Increasing
profitability” as one of their
main commercial drivers at
baseline
• So far, 44% of projects (8 out
of 18) are showing signs of
delivery for this driver *
• The drivers delivered most
successfully so far are
’accessing new markets’
and ‘Getting first mover
advantage’. For these, 70%
of projects are reporting signs
of delivery at progress report
* ‘showing signs of delivering at progress report’ are all projects that have reported that the driver has either been successfully delivered or
that is showing “signs of delivering”
** Only 28 projects have returned Progress Report forms with the progress of the commercial drivers, hence the large amount of drivers with
no update available
What are the most common commercial drivers?
Are projects on track to achieve them?

38
11
11
9
7
- 5 10 15 20
Get first mover advantage in aninclusive business model
Access new markets (geographicmarkets, product markets, base of
pyramid markets etc)
Increase profitability of your product/business, increase productivity, reduce
costs
Develop competitive advantage anddifferentiation from competitors
Four most popular commercial drivers for consumer
focused projects identified at Baseline (N=18)
Projects that identified the challenge at baseline
18
13
11
11
- 5 10 15 20
Increase profitability of your product/business, increase productivity,…
Increase/ guarantee security andsustainability of the supply chain
Get first mover advantage in aninclusive business model
Increase market share of your product/business
Four most popular commercial drivers for producer &
supplier focused projects identified at Baseline (N=21)
Projects that identified the challenge at baseline
• Increase of profitability / productivity of
the product and inclusive business has
been identified as important at Baseline by
85% (18 projects out of 21) of all producer
focused projects
• Consumer focused projects have identified
a wider range of drivers.
• Access to new markets and getting first
mover advantage are the two most
popular ones, with 61% of consumer
focused projects identifying them as
important at Baseline
Do commercial drivers differ between producer
and consumer focused projects?
Increase profitability of your product /
business, increase productivity,
reduce costs

39
88%
71%
50%
67%
69%
62%
0% 20% 40% 60% 80% 100%
Get first mover advantage in an inclusivebusiness model
Access new markets (geographic markets,product markets, base of pyramid markets etc)
Increase profitability of your product/ business,increase productivity, reduce costs
Develop competitive advantage anddifferentiation from competitors
Average for top 4 drivers
Average across all drivers
Consumer focused projects showing signs of delivering the top 4
drivers
40%
50%
50%
40%
45%
53%
0% 20% 40% 60% 80% 100%
Increase profitability of your product/ business,increase productivity, reduce costs
Increase/ guarantee security and sustainabilityof the supply chain
Get first mover advantage in an inclusivebusiness model
Increase market share of your product/business
Average for top 4 drivers
Average across all drivers
Producer & supplier focused projects showing signs of delivering the
top 4 drivers
Which commercial drivers are showing signs of
delivery at progress report?
• 45% of producer focused projects
and 69% of consumer focused
projects are showing signs of
delivering their four most important
drivers at progress report
• Producer focused projects are
therefore showing slower signs of
delivering their key drivers at
progress report
• For consumer projects, signs of
delivery are particularly strong for
‘getting first mover advantage in
an inclusive business model’, for
which 88% of projects are already
showing some signs of delivery at
progress report.
• ‘Increase profitability’ is the driver
of consumer focused projects
showing the slowest progress (50%)
Signs of delivering is the percentage of the projects that have reported to be either seeing initial signs of delivering the driver, or that have
already successfully delivered the driver

Financial data
40

41
The key questions that we are aiming to answer in this section are the following:
What was the financial performance of the projects at Year 0?
How is this performance expected to evolve during the first year?
Were estimates for year 1 in line with actuals?
What are the projections for the next 5 years?
Throughout our M&E data collection, organisations were asked at each M&E milestone to provide estimates and / or
actuals, where available, on their financial performance, and to project these up to 5 years into the future from the
moment that BIF’s intervention began (which we refer to as Year 0). This has allowed us to compare how the financial
performance that organisations have realised differs from what was previously estimated.
It has only been possible to carry out this type of analysis for a small sample of our long projects that have completed a
Progress Report or Project Update form and have also completed their first year of operations.
Most of our analysis in this section is focused on turnover, the indicator for which we have the most data available
Financial analysis

42
Turnover – what was the situation at year 0?
19
10
5 5
-
2
4
6
8
10
12
14
16
18
20
No turnover Smaller than $50k Between $50k and $1m Larger than $1m
Nu
mb
er
of
pro
jects
Turnover of large projects at Year 0 , including outliers (N=39)
The total turnover for the whole portfolio in year 0 is around $806,500,000
The data presented in this slide is the turnover of the inclusive business in year 0, and is a mix of estimated figures and actuals. It includes
all organisations, including outliers.
These figures are a mix of actuals and estimates. Estimated turnover figures are likely to be higher than reality because of the natural
optimism of some of the organisations
Some of the organisations included in this chart have not been able to differentiate the operations of their core business from the inclusive
business. These have been removed from later analysis (see following slide)

It is important to note that data on turnover is heavily skewed by three consumer focused projects (see graph below comparing these three projects with the remaining portfolio combined). In the subsequent analysis we have removed these outliers.
Normally we try to base financial analysis on the inclusive business venture only, however in some cases (particular for large companies) this is tricky:
• In one example, it was impossible to isolate the returns originating from sorghum based products (i.e. brewed products like beer) from the rest of the organisation. Given that the project aims to change the company’s overall sourcing strategy, this was the closest proxy that seemed appropriate at the time of baseline.
• Similarly, a large retailer was unable differentiate the inclusive business financial data from the whole organisation’s, and has reported financials that are not representative of the Inclusive Business.
• In addition, another organisation has also been removed from the aggregation analysis because of its large size – its turnover at year 0 of $6m is as large as the other 36 projects combined
Turnover – what are the data outliers?
43 * No data for one project, 39 projects have reported financial data at year 0
$6 million
$763 million
$32 million
$6 million
- 100 200 300 400 500 600 700 800
Remaining 36 projects(with available year 0 data)
Guinness
Agora
Cropserve
Turnover, $ million
Comparison of Turnover at baseline ($) of outliers vs the rest of the portfolio of large projects
Business #1
Business #2
Business #3

44
Turnover – turnover growth from year 0 to year 1,
actuals against estimates
Year 0
turnover
Year 1
estimated
turnover
Estimated
increase
Y0-Y1
Year 1
actual
turnover
Actual
increase
Y0-Y1
Total TO
($) 1,722,000 4,990,000 3,267,000 2,790,000 1,070,000
Average
TO ($) 96,000 277,000 180,500 155,000 59,500
• Actual turnover growth from year 0 to year 1 has been of 62%
• The estimated turnover growth from Year 0 to Year 1 was of
190%
• Turnover in year 1 has therefore grown 44% less than what
expected
Slower progress has been driven by two factors:
• A natural optimism – even where the business in progressing
well, passionate entrepreneurs were expecting faster
expansion than was possible in reality
• A slower project progress caused by unexpected obstacles /
constraints
Turnover estimates and actuals in year 0 and year 1 (N=18) 96,000
$155,000
$277,000
-
50,000
100,000
150,000
200,000
250,000
300,000
Year 0 Year 1
Growth in turnover per business, Year 0 to Year
1, estimated and actual, $ pa (N=18)
+190%
+62%
Year 1 actual turnover
Year 1 estimated turnover
- 44%
• The analysis excludes outliers and only includes those projects that have reported year 0 turnover figures, and both estimates AND actuals
for year 1.
• The sample used for this analysis is made of projects of different types and sizes and is fairly small (18 out of 40 projects). Although the
figures are not a fair representation of the full portfolio, the trend is likely to be applicable to the majority of the businesses in the portfolio.
• Data has been rounded to the closest thousand or 500

$70,500
$144,500
$256,000
Year 0 Year 1
$126,500
$168,000
$303,000
-
50,000
100,000
150,000
200,000
250,000
300,000
350,000
Year 0 Year 1
Average turnover per project (N=18)
45
+140%
+33%
+261%
+104%
Turnover – how does estimated and actual growth
compare between different IB models?
-45%
Year 1 actual turnover
Year 1 estimated turnover
-44%
Core-IB [N=8] Diversifying-into-IB [N=10]
• The analysis excludes outliers and only includes those projects that have reported year 0 turnover figures, and both estimates AND actuals
for year 1.
• The sample used for this analysis is made of projects of different types and sizes and is fairly small (18 out of 40 projects). Although the
figures are not a fair representation of the full portfolio, the trend is likely to be applicable to the majority of the businesses in the portfolio.
• Data has been rounded to the closest thousand or 500

• Out of $260m of projected turnover in year 5, $200m is
expected to come from 5 particularly large projects
• Half of the inclusive businesses (13 out of 26) are
reporting projections for year 5 of less than $2m
46
Turnover – What are the future projections?
Year 0 Year 1 Year 2-3 Year 4-5
Number of projects
in sample 31 30 31 26
Total TO ($) 7,545,000 16,415,000 96,645,000 260,000,000
Average TO($) 243,000 547,000 3,118,000 10,020,000
Projects with TO>0 15 17 31 26
Average TO ($) 503,000 965,000 3,118,000 10,020,000
• Data on year 2 was used when estimates for year 3 were not available
• Data on year 4 was used when estimates for year 5 were not available
• Data has been rounded to the closest thousand or 500
$243,000 $547,000
$3,118,000
$10,020,000
-
2,000,000
4,000,000
6,000,000
8,000,000
10,000,000
Year 0(N=31)
Year 1(N=30)
Year 3(N=31)
Year 5(N=26)
$
Turnover projections, average per project, $ (N =
various)*
• The data in this slide is made of estimated turnover projections up to 5 years from the beginning of BIF support.
• As shown in the previous slide, estimated data is likely to be inflated by optimism. The sample used is also fairly small compared to the
overall portfolio. All figures should, as a consequence, be used as an indication. The overall trend of high growth is, however,
representative of most inclusive businesses

47
-
20,000
40,000
60,000
80,000
100,000
120,000
140,000
Year 0 Year 1 Year 2/3Year 4/5
$
Range: up to $140,000
-
1
2
3
4
5
6
Year 0 Year 1 Year 2/3 Year 4/5
Millio
n $
Range: up to $6,000,000
-
10
20
30
40
50
60
70
80
90
Year 0 Year 1 Year 2/3 Year 4/5
Millio
n $
Range: up to $90,000,000
Turnover projections per project
The data in this slide is made of estimated turnover projections up to 5 years from the beginning of BIF support.
As shown in the previous slide, estimated data is likely to be inflated by optimism. The sample used is also fairly small compared to the
overall portfolio. All figures should, as a consequence, be used as an indication. The overall trend of high growth is, however,
representative of most inclusive businesses

48
What are the current and planned levels of
investment?
Total
Average per
project
Total investment to
date ($) 104,323,292 3,597,355
Total investment
planned ($) 70,798,500 2,441,328
Organisations were also asked about their preferred
way to obtain financing, and which financial vehicles
they were intending to use in the future
• Commercial debt is the preferred financial
vehicle out of the BIF projects
• A growing number of projects are looking to use
concessional debt and/or equity
7
5
12
5
-
2
4
6
8
10
12
14
No investment Between 0 and$500k
Between $500kand $5m
More than $5m
Total investment to date (mid 2013), (N=28)
10
5
9
5
-
2
4
6
8
10
12
No investment Between 0 and$500k
Between $500kand $5m
More than $5m
Planned investment over the next few years (as of mid
2013) (N=28)
Concessional debt is defined as: “lending extended by creditors at terms that are below market terms with the aim of achieving a certain
goal”, IMF, 2004
Levels of investment (N=28)

How likely is commercial
growth?
Some further commercial analysis
To assess the project’s likelihood of reaching commercial viability
49

50
0% 20% 40% 60% 80% 100%
Zambia
India
Bangladesh
Malawi
Nigeria
BIF Country Manager’s
assessment
Service Providers’
assessment
Organisations self-
assessment
Perception of likelihood to reach commercial
viability across different stakeholders
• Likelihood is generally high,
most scores are above 50%
• Businesses tend to be more
optimistic about the likelihood
of their own project to reach
commercial viability than
external parties, such as the
BIF Country Manager and the
technical assistance service
providers
• At present, Nigerian projects
have the highest reported
likelihood of reaching
commercial viability
• Zambian and Indian projects
on the other hand seem to be
the least likely to reach
commercial viability
As part of our M&E system we asked the key stakeholders involved in the long projects to rate their likelihood to reach
commercial viability within 2-3 years, on a scale from 0 to 100%
All assessments are based on latest available data, however, most of the feedback was received in June-September
2013. The graph below shows the average that the projects have scored in each country.

In addition to people’s assessments of commercial viability
likelihoods (see page 51), we have created our own index
to measure the commercial viability of the Inclusive
Business
We refer to it as the BIF Commercial Viability Index,
which is an index based on a range of six different
indicators:
1. Does the business have a business plan?
2. Has the project reached breakeven?
3. What is our assessment of the likelihood to reach
commercial viability?
4. Is there evidence of strong leadership?
5. Is it on track against identified targets?
6. Do they have access to external leverage?
As of Sept 2013, over half of the projects score medium.
The following pages explore how scores have changed over
the lifetime of BIF.
BIF Commercial Viability Index
51
12
22
6
0 5 10 15 20 25
High
Medium
Low
Project scoring BIF commercial viability index Sep 2013 (N=40)
# projects

Evolution of the commercial viability index over
the lifetime of BIF
52
* N = 39 , an additional project in Nigeria was added to the
portfolio in June 2013
The assessment over time does not show any significant changes. When comparing scores between February 2013 and
September 2013, we can see that the majority of projects has remained in the same overall category, roughly a quarter has
gone down and a fifth of projects score higher than before
Change in scores
(Feb 2013 to Sept
2013)
# projects %
Higher 8 21
Same 21 53
Lower 10 26
6
8
6
22
17
21
12
16
6
0% 20% 40% 60% 80% 100%
September (2013)
February (2013)
June (2012)
Low Medium High
Commercial viability index June 2012 (N=30), February
2013 (N=41) and September 2013 (N=40) Change in Commercial Viability Index (N = 39) *
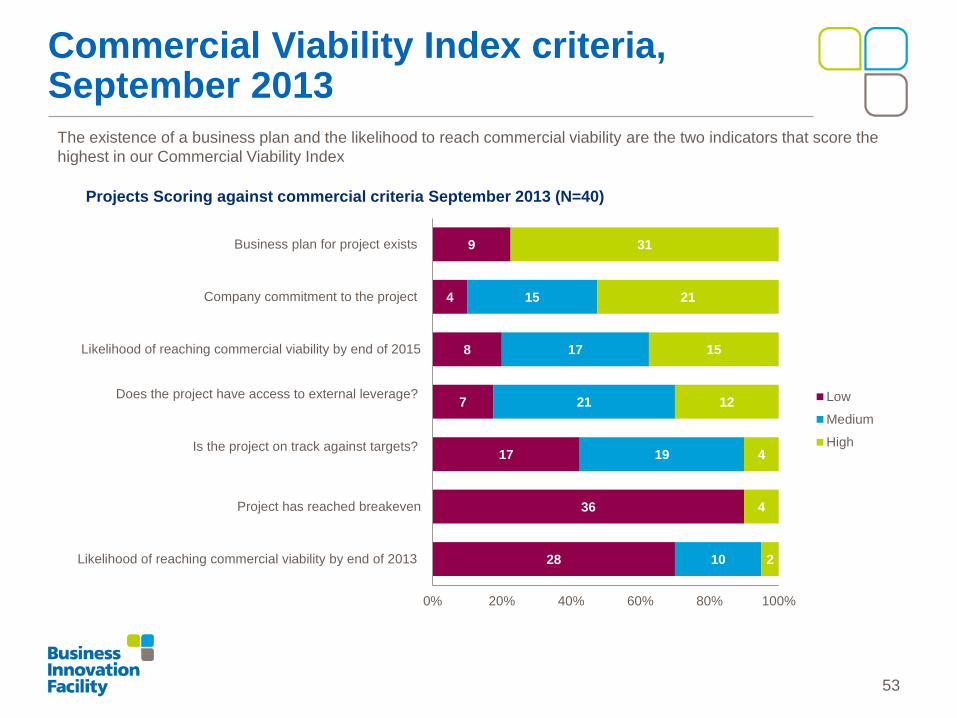
Commercial Viability Index criteria, September 2013
53
The existence of a business plan and the likelihood to reach commercial viability are the two indicators that score the
highest in our Commercial Viability Index
28
36
17
7
8
4
9
10
19
21
17
15
2
4
4
12
15
21
31
0% 20% 40% 60% 80% 100%
Likelihood of reaching commercial viability by end of 2013
Project has reached breakeven
Is the project on track against targets?
Does the project have access to external leverage?
Likelihood of reaching commercial viability by end of 2015
Company commitment to the project
Business plan for project exists
Projects Scoring against commercial criteria September 2013 (N=40)
Low
Medium
High

Commercial criteria comparison over time
54
% of high scoring projects
2
6
7
4
4
5
4
13
11
12
15
15
15
11
12
21
27
23
31
22
16
0 5 10 15 20 25 30 35
Sep-13
Feb-13
Jun-12
Sep-13
Feb-13
Jun-12
Sep-13
Feb-13
Jun-12
Sep-13
Feb-13
Jun-12
Sep-13
Feb-13
Jun-12
Sep-13
Feb-13
Jun-12
Sep-13
Feb-13
Jun-12
Lik
elih
oo
d o
fre
ach
ing
com
me
rcia
lvia
bili
tyb
y e
nd
of 2
013
Pro
ject
has
reach
ed
bre
ake
ve
n
Is t
he
pro
ject
on t
rack
aga
inst
targ
ets
?
Do
es
the
pro
ject
have
acce
ss
toe
xte
rna
lle
ve
rag
e?
Lik
elih
oo
d o
fre
ach
ing
com
me
rcia
lvia
bili
tyb
y e
nd
of 2
015
Co
mpa
ny
com
mit
me
nt
toth
ep
roje
ct
Bu
sin
es
s p
lan
for
pro
ject
exis
ts
Projects scoring against commercial criteria June 2012 (N=30), February 2013 (N=41) and September 2013 (N=40)
Likelihood of reaching
commercial viability by
end of 2013
Project has reached
breakeven
Is the project on track
against targets?
Does the project have
access to external
leverage?
Likelihood of reaching
commercial viability by
end of 2015
Company commitment to
the project
Business plan for project
exists
• At the latest available assessment
(September 2013), there is a growing
proportion of projects that score high
on having a business plan in place
• All other indicators have not
experienced a substantial change in
the proportion of projects scoring
‘high’

Section 6
Development impacts
In this section we look at
1. Households reached at the BoP: figures collected from long projects
2. Assessments of a project’s perceived likelihood to going to scale, reaching thousands of households at the
BoP
55

The key questions that we are analysing in this section are the following:
• What was the BoP reach of the projects at Year 0?
• Were estimates for year 1 in line with actuals?
• What are the projections for the next 5 years?
• How can we calculate realistic projections, given that estimates tend to be inflated by optimism?
Our analysis
Similar to the way the financial data was collected, organisations were asked to provide either estimates or actuals on their
BoP reach, and to project these up to 5 years into the future from the moment that BIF’s intervention began (which we
refer to as Year 0). This has then allowed us to compare how the BoP reach that has been realised differs from the initial
estimates.
Our approach to measuring BoP reach
The inclusive business projects do not have one single type of development impact. As part of our results measurement
approach in BIF we look at:
• Reach to Base of Pyramid (BOP) – the number of low income people reached. In this regard, it is important to
distinguish between low-income producers and entrepreneurs (who gain livelihoods and income) and low-income
consumers (who gain access to goods and services). Inclusive businesses tend to reach many more consumers than
producers, so these totals cannot just be summed together.
• The significance of the project to a low-income person, not just total numbers matters, though is subjective.
• Estimating growth in BOP reach is important. But difficult, as projects are at different stages, a few have large
numbers, and not all have estimates. Figures are unreliable and comparisons worse.
• Other development results are also considered, particularly likelihood of replication, of systemic impact,
Understanding development results
56

57
What was the expected BoP reach in year 0?
9
6
2 1
2
9
1
3
1
3
1
-
2
4
6
8
10
12
14
16
18
0 >0, <=500 >500, <=2,000 >2,000, <=10,000 >10,000
# p
roje
cts
Households reached
Distributor Consumer Producer
BoP households reach for year 0 reported during baseline assessment, by primary BoP focus (N=38)
• At Baseline, 18 out of 38 projects* estimated that no BoP households would be reached in year 0
• Five projects expected to reach more than 10,000 households in year 0. Of these, two had a producer focus
• In our analysis we are only looking at primary BoP reach
*It has not been possible to collect any BoP data for two projects
This slide looks at the BOP reach of the projects in year 0. Some projects have reported actual figures for year 0, while some others have
estimated their BOP reach. Results should therefore be taken as an indication of the overall reach as estimates are likely to be driven by optimism
and are too high as a consequence

178
546
1,189
-
200
400
600
800
1,000
1,200
1,400
Year 0 Year 1
Ho
useh
old
s
620 1,092
6,080
-
1,000
2,000
3,000
4,000
5,000
6,000
7,000
Year 0 Year 1
Ho
useh
old
s
Year 1 actual turnover
Year 1 estimated turnover
+570%
+207%
+881%
+76%
Producer focused projects (N=7) Consumer focused projects (N=5)
58
Growth of BoP reach from year 0 to year 1, actuals
vs estimates
-54% -82%
The analysis excludes outliers and only includes those projects that have reported year 0 BoP reach figures, and both estimates AND
actuals for year 1.
The sample used for this analysis is made of projects of different types and sizes and is fairly small (18 out of 40 projects). Although the
figures are not a fair representation of the full portfolio, the trend is likely to be applicable to the majority of the businesses in the portfolio.
• Producer-focused businesses tend to have a faster rate of growth and are less divergent from their estimates
than the consumer-focused ones
• Consumer-focused projects, however, have a higher overall BoP reach. When looking at projections up to 5
years in the future, we expect consumer-focused businesses to reach roughly 100 times as many households
per business as producer-focused businesses (see page 60)

59
BOP reach projections – average per project
2,310 3,346
216,911
466,440
-
50,000
100,000
150,000
200,000
250,000
300,000
350,000
400,000
450,000
500,000
Year 0 Year 1 Year 2/3Year 4/5
Ho
useh
old
s
Average BOP reach per project,
consumer focused projects (N=10)
193
496
1,395
2,059
-
500
1,000
1,500
2,000
2,500
Year 0 Year 1 Year 2/3 Year 4/5
Ho
useh
old
s
Average BOP reach per project,
producer focused projects (N=8)
The data in this slide is made of estimated BoP reach projections up to 5 years from the beginning of BIF support.
As seen in the previous slide, data is likely to be inflated by optimism, and the sample used is fairly small compared to the overall portfolio.
All figures should, as a consequence, be used as an indication. The overall trend of high growth is, however, representative of most
inclusive businesses

Estimates for future BoP reach, revised for
realism
60
As seen previously (see page 59), organisations tend to overestimate their BOP reach projections. In order to
estimate total reach to the BoP across the portfolio, we have aggregated estimates from companies and scaled them
down by two different weights based on:
1. Actual project progress so far (see page 27)
Year 3 and 5 calculations:
Because some projects have provided actual figures for year 1 and projected estimates for year 3 and 5, we have
unpacked year 3 and year 5 BoP projections in an actual and an estimated component, weighing down only the
estimated component (a more detailed explanation can be seen in an example in the next page)
Optimism Weight
Optimism factor 70%
Project progress Weight
5. Flourishing/securely established 100%
4. Progressing well 75%
3. Progressing slowly 50%
2. Stalled/on hold 10%
1. On ice 0%
2. Our assessment of general over-optimism
within the portfolio

Example – BoP reach revised for realism
61
Optimism weight 70%
Project Progress: Progressing well weight 75%
Year 0 -
latest
Actual /
estimate Year 1
Actual /
estimate Year 2
Actual /
estimate Year 3 Year 4 Year 5
2,100 Actual 2,900 Actual 21,403 Actual 2 120,708 157,548 223,286
Revised for realism BoP reach
Year 1 Year 3 Year 5
Actual component
Year 1 actual 2,900 2,900 2,900
Estimated component
Estimated increase from year 1 (year x - year 1) 0 117,808 220,386
Adjusted for optimism (70%) 0 82,466 154,270
Adjusted for Progress (75%) 0 61,849 115,703
TOTAL reach 2,900 64,749 118,603

62
BoP reach across the whole portfolio,
revised for realism
Notes
• All figures have been rounded to the closest thousand
• 8 projects (20% of total) are either on ice or stalled – these have been excluded from our aggregation as it is assumed that they will not
progress and not realise any of their BOP reach
• Year 3 and 4 / 5 data is not available for 12 businesses. For these 12 businesses our assessment of current progress is on average slower
than for the 20 for which data is available. To estimate the BoP reach for all 32, the total for the 20 has been multiplied by a factor of 40% (to
reflect the slower increase that we are expecting).
Our ‘revised for realism’ projections for year 4 / 5 are about one third of what the companies estimated: from 5,706,000
households reported by the businesses to 2,631,000 once revised for realism (for twenty projects)
The portfolio is reaching at least 80,000 households at the BOP at the end of Year 1, post BIF support.
The portfolio is likely to be reaching around 1.2 million households by Year 3 and perhaps 3.7 million by Year 5.
Realistic BOP reach (totals and
averages across the portfolio)
Year 1 (actuals)
N = 16
Year 1 (estimates
and actuals)
N = 29
Year 3
N = 20
Year 4 / 5
N = 20
Total Average Total Average Total Average Total Average
Figures provided by organisations
(households) 21,000 1,200 228,500 7,900 2,088,000 104,000 5,706,000 285,000
Adjusted for progress and
optimism (households) 21,000 1,200 119,000 4,000 839,000 42,000 2,631,000 131,500
Estimated BOP household reach for all 32 projects progressing** 1,175,000 37,000 3,680,000 115,000
Estimated BOP individuals reached across the 32 projects
progressing*** 5,880,000 184,000 18,400,000 575,000

Moving beyond the numbers…
Some further analysis of development impacts
63

64
0% 20% 40% 60% 80% 100%
Zambia
India
Bangladesh
Malawi
Nigeria
BIF Country Managers’
assessment Service Providers’
Assessment
Recipient Organisations self-
assessment
Perception of likelihood of going to scale, reaching
thousands of BoP households across different stakeholders
• Likelihood is generally high,
most scores are above 50%
• Recipient organisations are
substantially more optimistic
than service providers and
country managers
• BIF Country Managers have
only rated projects an average
of 54% across the BIF portfolio
• Discrepancy between the
perceived likelihood of the
recipient organisations and the
BIF in-country team is
particularly strong in India and
Zambia
• Nigerian projects seem to be the
most likely to be reaching
thousands of low income people
As part of our M&E system we asked the key stakeholders involved in the long projects to rate, on a scale from 0 to
100% , the likelihood to go to scale reaching thousands of BoP households within 2-3 years
All assessments are based on latest available data, however, most of the feedback was received in June-September
2013. The graph below shows the average that the projects have scored in each country.

I addition, to people’s assessments of scale likelihoods,
we have created our own index to measure the
development impacts. We refer to it as BIF Development
Index, a weighted aggregation of the following indicators:
1. Primary beneficiaries reached
2. Likelihood of reaching significant scale by end of 2015
3. Does the project have potential for game changing
scale by year 3
4. Significance per person BOP
5. Systemic Impacts (significance and likelihood of the
projects' influence)
As of Sept 2013, over half of the projects score medium.
The following pages explore how scores have changed
over the lifetime of BIF.
Development Index Sept 2013
65
# projects
7
22
11
0 5 10 15 20 25
High
Medium
Low
Project scoring BIF development index Sep 2013 (N=40)

Evolution of the Development Index over the lifetime of BIF
66
Change in
scores (Feb
2013 to Sept
2013)
# projects %
Higher 4 10
Same 25 64
Lower 10 26
More projects have been rated low in terms of
development index in September 2013 than in
February 2013.
10 projects have a decreased development index
compared to 7 months earlier, while 4 have improved
their rating
11
5
5
22
29
24
7
7
4
0% 20% 40% 60% 80% 100%
September (2013)
February (2013)
June (2012)
Low Medium High
Project scoring BIF development index June 2012
(N=33) , February 2013 (N=41) and September 2013
(N=40)
* N = 39 , Best Foods (Nigeria) was added to the portfolio in
June 2013
Change in Development Index (N = 39) *

Development Index criteria September 2013
67
25
9
9
10
27
8
23
20
19
7
8
10
11
13
0% 20% 40% 60% 80% 100%
Number of people estimated to be reached BL+1
Likelihood of reaching BOP at scale at the end of 2015
Systemic impacts score
Significance per person BOP
Potential for game changing scale BL+3
Low Medium High
Project Scoring against development criteria September 2013 (N=40)
Projects are scoring high in terms of potential for game changing scale in Year 3, and on the significance per person at
the BoP
Projects are scoring particularly low on the number of people estimated to be reached in Year 1. This is a reflection on
the fact that projects, in general, tend to struggle to have a development impact during their first years of operations
Section 7
Additionality of BIF support
This section explores
- the type of technical support was provided by BIF
- What type of benefits were expected from BIF support by recipient organisations
- their feedback on BIF support and an analysis of BIF additionality
- BIF reach that is attributable to BIF
68

69
Types of BIF support
2
2
2
4
5
5
5
7
7
7
12
12
19
- 2 4 6 8 10 12 14 16 18 20
HR strategy, recruitment,…
Marketing
Setting up a pilot
Identify sources of…
Technical development
Evaluation of progress to date
Technical development
Organisational Development/…
Pricing and revenue models
Key performance indicators,…
Demand/market/customer…
Supply chain development,…
Business Planning, financial…
# projects
Type of support provided (counting up to three types
per project) (N=40)
1
1
1
1
2
2
4
6
9
13
- 2 4 6 8 10 12 14
Key performance indicators,results tracking, reporting
Pricing and revenue models
Setting up a pilot
Technical development
Evaluation of progress todate
Identify sources offunding/investors
Organisational Development/governance
Demand/market/customeranalysis
Supply chain development,procurement
Business Planning, financialmodelling
# projects
Primary type of support (N=40)
The most common types of BIF support have been: business planning, financial modelling, supply chain development and
market analysis.
In most cases, however, there was one primary area of support plus one to two other areas. For example, one service
provider identified a technical solution to freeze drying a flower-based traditional drink so that a clean and safe ‘instant’
version can be marketed, while another reviewed the contract farming models that have been tried across the world and
helped the company to identify the one that best meets their needs within their context.

70
Types of BIF input per BoP focus
2
2
2
4
4
4
5
5
7
- 4 8 12
Business Planning, financialmodelling
HR strategy, recruitment,workforce development
Marketing
Demand/market/customeranalysis
Pricing and revenue models
Technical development
Key performance indicators,results tracking, reporting
Supply chain development,procurement
Organisational Development/governance
# projects
Type of BIF input for Producer focused projects (N=21)
2
2
2
3
5
8
11
- 4 8 12
Organisational Development/governance
Supply chain development,procurement
Setting up a pilot
Key performance indicators,results tracking, reporting
Pricing and revenue models
Demand/market/customeranalysis
Business Planning, financialmodelling
# projects
Type of BIF input for Consumer focused projects
(N=18)
• Producer focused projects have mostly required BIF input in the areas of organisational development /
governance, supply chain development and key performance indicators
• Business planning and financial modelling, and demand / market / customer analysis are the most common types
of input provided for consumer-type projects
This analysis looks at all the types of input provided, which can be up to three different types of input per project
Inputs scored by only one project have not been included in the graphs

71
4%
9%
14%
26%
18%
18%
13%
17%
17%
16%
21%
28%
22%
52%
53%
32%
41%
43%
38%
35%
26%
37%
68%
70%
33%
21%
50%
41%
43%
46%
48%
58%
42%
0% 20% 40% 60% 80% 100%
Access to wider resources andexperience from elsewhere
Opportunities to tap into experts fromoutside the company / beyond usual…
Greater profile for the inclusive businessproject within the company
Increased interest and capacity amongcolleagues in inclusive business
Increased capacity to attract investmentfunds
New partnerships
More effective existing partnerships
Increased capacity to understand andadapt to the needs of low income people
Increased capacity to assess, pursueand demonstrate development benefits
Increased capacity to assess, pursueand demonstrate commercial returns
Opportunities to share the company’s experience with others and pass on …
Low Medium High
8%
22%
29%
21%
23%
14%
13%
42%
26%
32%
26%
40%
26%
43%
63%
36%
41%
70%
42%
39%
42%
37%
52%
52%
29%
16%
41%
45%
17%
17%
35%
26%
37%
0% 20% 40% 60% 80% 100%
Expectations, benefits of
collaboration perceived at Baseline
(N=various, between 19 and 25)
Benefit of collaboration perceived at
progress report / project update
(N=various, between 19 and 25)
Company expectations at Baseline on the benefits of BIF
support, and how these have changed
Change

72
What is the businesses’ perception of the impact
of BIF support?
Businesses were asked which statement best fit
their views of the support received by BIF:
1. Without BIF support the project would have not
progressed at all (Essential)
2. Due to BIF support, the inclusive business
project is better designed, or proceeding more
quickly, or bigger than it would have been
(Bigger, better, faster)
3. BIF support was useful to us and made it easier
to progress the project, although it has not
resulted in specific identifiable change compared
to what would have happened (Useful)
4. BIF support made no difference (Irrelevant)
5. BIF support had net negative results (Negative)
0
4
17
18
1
-
2
4
6
8
10
12
14
16
18
20
Negative Irrelevant Useful Bigger,better, faster
Essential
# p
roje
cts
Businesses’ view on the impact of BIF's support (N=40)

73
7.55
8.80
-
5
10
Level of satisfaction Recommend BIF?Av
era
ge s
co
re o
ut
of
10
Feedback on BIF support (N=31)
2 2 1 1
6
19
-
5
10
15
20
0 1 2 3 4 5 6 7
Nu
mb
er
of
pro
jects
Number of categories under which consultants scored 7 or above (out of a score of 10)
Feedback on the BIF consultants (N=30)
How have the businesses rated BIF’s support?
At the completion of BIF support, businesses were asked to
rate their level of satisfaction on a scale from 1 to 10 on the
support provided by BIF
Businesses were also asked to rate the consultants that
provided the technical assistance on the following areas:
• Displayed the technical competence you required
• Brought you fresh insights
• Provided practical advice/ recommendations
• Produced high quality outputs
• Listened and responded to your point of view
• Had courage to challenge
• Was easy to work with
The TA was provided by service providers who were based, for
the majority (around 60 per cent), in the South, but when local
expertise was not available it was sourced internationally.

6
16
18
- 5 10 15 20
Mildly Positive
Positive
Strongly Positive
BIF Satisfaction Index
74
Project scoring BIF satisfaction index, September 2013
(N=40) Similarly to the Commercial Viability Index and the
Development Index, we have also created a BIF
Satisfaction Index. This is a weighted aggregation
of the following indicators:
1. Businesses’ and country managers’ feedback on
BIF additionality
2. Recipient organisations’ rating on the quality of
BIF support provided
3. If businesses would recommend BIF
4. Number of benefits that BIF support has brought
to the inclusive business and how these have
changed over time
Most BIF projects score highly in the Satisfaction
Index
# projects

33%
50%
10%
5%
8%
45%
43%
40%
43%
45%
43%
23%
8%
60%
48%
50%
50%
0% 20% 40% 60% 80% 100%
Low Medium High
75
BIF additionality as
rated by the
recipient
organisations
Rating of BIF
support by the
recipient
organisations
BIF additionality as
rated by the Country
Manager
Would you
recommend BIF to
others?
Number of
benefits BIF has
had a high impact
on
How the
perception of
BIF’s benefits has
changed over time
BIF Satisfaction Index criteria Project scoring against BIF satisfaction criteria, September 2013 (N=40)
Projects are scoring particularly
high on:
• Their recommendation of BIF
(60% of the projects scored 8
out of 10 or higher in this
category)
• How they would rate BIF’s
additionality: 50% of both
Country Managers and the
organisations have rated BIF
highly on additionality *
* We have categorised organisations’ rating as follows: High = ‘Essential’ and ‘bigger, better, faster’, Medium = ‘Useful’, Low =
“Irrelevant’ and ‘damaging’

How many people reached at the BoP can
be plausibly linked to BIF?
76
BIF additionality
Because ascribing a share of results to donor support is so difficult, we note that it seems to be common practice to
simply report 100 per cent of the results achieved by the projects. Despite the challenge of defining causality and
attribution, we have nevertheless reassessed the estimated reach to people at the BoP from the BIF portfolio to
provide a slightly better indication of what can be claimed as BIF reach.
We have therefore further reduced the BOP reach figures by estimating the share that could reasonably be attributed
in some way to BIF support. This has involved three steps (see page 80 for a step-by-step example)
1) We discounted the people that were already reached in Year 0
2) We then applied the same methodology used to calculate the “BoP reach revised for realism”, scaling the reach
down by project progress and our assessment of the over-optimism across the portfolio (see slide #63)
3) Finally, we adjusted the resulting BoP reach by the level of additionality that BIF has had on the projects, using the
following weights
Additionality Weight
Critical 90%
Bigger / Better / Faster 50%
Useful 25%
Irrelevant 0%
Negative 0%

Example: BIF additionality
77
Optimism weight 70%
Project Progress: Flourishing weight 75%
Additionality: “Useful” weight 25%
Year 0 -
latest
Actual /
estimate Year 1
Actual /
estimate Year 2
Actual /
estimate Year 3 Year 4 Year 5
2,100 Actual 2,900 Actual 21,403 Actual 2 120,708 157,548 223,286
Realistic BOP reach
Year 1 Year 3 Year 5
Actual component
Year 1 actual increase from year 0 800 800 800
Adjusted for additionality (25%) 200 200 200
Estimated component
Estimated increase from year 1 (year x - year 1) 0 117,808 220,386
Adjusted for optimism (70%) 0 82,466 154,270
Adjusted for Progress (75%) 0 61,849 115,703
Adjusted for additionality (25%) 0 15,462 28,926
TOTAL BIF additionality 200 15,662 29,126

BIF additionality
78
Notes
• All figures have been rounded to the closest thousand
• 8 projects (20% of total) are either on ice or stalled – these have been excluded from our aggregation as it is assumed that they will not
progress and not realise any of their BOP reach
• *Year 3 and 4 / 5 data is not available for 12 businesses. For these 12 businesses our assessment of current progress is on average slower
than for the 20 for which data is available. To estimate the BoP reach for all 32, the total for the 20 has been multiplied by a factor of 40% (to
reflect the slower increase that we are expecting).
So far 2,000 households at the BoP have been reached by 16 businesses and can reasonably be linked to BIF support.
These figures are estimated to be 325,000 and 727,000 in years 3 and 5.
If we take into consideration all 32 businesses that are currently progressing, after Year 3 and Year 5 the number
increases to almost 0.5 million and 1.5 million households respectively
BIF additionality. All BoP reach is
taken as an increase from year 0
(totals and averages across the
portfolio)
Year 1 (actuals)
N = 16
Year 1 (estimates
and actuals)
N = 29
Year 3
N = 20
Year 4 / 5
N = 20
Total Average Total Average Total Average Total Average
Figures provided by organisations 15,000 863 164,000 5,650 2,060,000 103,000 5,680,000 284,000
Adjusted for progress and
optimism (total) 15,000 863 89,000 3,000 825,500 41,000 2,617,000 131,000
Adjusted for BIF additionality 6,000 345 38,000 1,300 352,000 17,500 1,070,000 53,500
BIF additionality for all 32 projects that are progressing (households) 493,000 15,000 1,500,000 47,000
BIF additionality for all 32 projects that are progressing (individuals) 2,465,000 77,000 7,500,000 235,000

Short projects feedback
As mentioned in the introduction, our M&E system for short projects is less comprehensive
than our long projects. We do, however, have a system based on obtaining feedback from the
various stakeholders. The following pages summarise the feedback received
79
Section 7

Short projects one-to-many feedback
80
3
7
7
27
36
189
21
179
0% 20% 40% 60% 80% 100%
One year follow-up
After workshop
NCS one-to-many feedback
Not useful - I got nothing out of it and was a waste of my time
Somewhat useful - I got something out of it but could have done something better with my time
Useful - I got a lot out of it and was worth my time
Very useful - I got more than I expected out of it and was well worth my time
N = 402
N = 67
Our portfolio of small projects is made of one-to-one TA interventions, and one-to-many workshops and research
projects.
Within our portfolio, 22 projects out of 68 can be considered as as one-to-many.
The vast majority of respondents to our survey consider the support received from the one-to-many projects as very
useful or useful

1
1
7
8
0 2 4 6 8 10
Not useful - I got nothing out of it and was a waste of my time
Somewhat useful - I got something out of it but could have donesomething better with my time
Useful - I got a lot out of it and was worth my time
Very useful - I got more than I expected out of it and was well worthmy time
NCS one-to-one feedback (N=17)
Short projects one-to-one feedback
81
Out of 68 short projects, 46 are classified as one-to-one smaller TA interventions.
Feedback received from the beneficiaries of the one-to-one projects is very positive, with 88% of respondents
reporting that they have found the short projects either useful or very useful
# respondents

Increased engagement with the BoP as a result of BIF support?
82
10
4
33
8
10
2
13
2
0 5 10 15 20 25 30 35
Workshops #67
NCS #17No, there has been no increase in engagingwith/understanding of the BoP
Yes, there has been increase, but this hashappened irrespective of my engagement with BIF
Yes, there has been some increase in engagingwith/understanding of the BoP
Yes, there has been a significant increase inengaging with/understanding of the BoP
As a result of your involvement with BIF have you or your organisation had an increased engagement with/or
better understanding of producers or consumers at the Base of the Pyramid (BoP) that are relevant to your
organisation?
NCS one-to-many NCS one-to one
Interacted with private sectors and built relationship for partnering.
I am now engaging in other inclusive business/BOP -type projects.
Designed a business model that brought
greater benefits to producers by cutting out exploitative middle-men.
We have made sure we can offer the lowest price to our
BoP customer besides those who are engaged in our supply chain process.
We were already very engaged. Some of the
workshops brought greater understanding
mostly through those who gave relevant Zambian examples.
We now source ginger from the Jaba cluster in Kaduna
State which has over 5,000 members, 60% of them are
women. This partnership was as a direct result of the BIF-funded supply chain study.
Example feedback quotes illustrating different types of increased engagement with the BoP as a
result of BIF support

What has been done differently?
83
As part of an online follow-up survey with BIF short project recipients carried out in September 2013, we asked:
“Can you identify anything you have done, or have done differently, as a result of your involvement with BIF?”
69% of all workshop participants and 94% of all NCS one-to-one support provided a tangible example of something
they had done differently.
Example quotes are included in the table below:
NCS one-to-many NCS one-to one
We made linkages with private sector
Planned and funded (and about to implement) the strategy BIF helped us define.
Decided on new research areas following the workshop identifying the need for developing business cases based on business process review.
Through BIF support we identified better machines and are in contact with the makers.
Partnered with two private companies (input suppliers in aquaculture) to help rural fish farmers through providing embedded services.
Through BIF support, we were able to identify and establish linkages with smallholder farmer clusters, develop labels and fliers for its marketing purposes and technical production support for the company
I have successfully engaged the private sector with my project. New strategy for our country programme was heavily influenced by the workshop
We have decided to go into deeper research work based upon BIF support work
The knowledge that I gathered in the training workshop, I disseminated the same for the benefit of our clients.

How could BIF improve?
84
NCS one-to-many NCS one-to one
BIF could share some practical experiences and ideas for influencing the BOP for starting businesses.
Future programmes should have the following in place: 1. A database of investors or financial institutions who would be willing to support commercially viable BIF clients or projects. 2 mechanisms in place upon which progress of the BIF funded projects could be monitored or tracked 3. Continue to involve local consultants or firms 4. BIF could be organising annual event or forum where all its clients and consultants could come together and share experiences. 5. Specific programmes for cooperatives in the agricultural sector.
BIF may invest financially and intellectually on few handpicked projects of which results are guaranteed.
Linking countries - for example we could have linked our work in Malawi and Zambia with other BIF countries.
It would be brilliant if there was a BIF in every country we operate in.
BIF is an innovative project and can help ensuring sustainability of project as farmers are linked to the private sector
We also asked the project recipients for suggestions on what BIF could do to improve. Some of the answers have
been collected in the table below

This report contains the full details of the portfolio of inclusive businesses of the Business
Innovation Facility.
For more information please visit:
The Practitioner Hub on inclusive business: www.businessinnovationfacility.org
BIF Spotlight on Final Findings: http://bit.ly/FindingsSpotlight
July 2012’s Portfolio Review: http://bit.ly/BIFReview2012
Contact:
Caroline Ashley, Director, Inclusive Business Results, Business Innovation Facility: [email protected]
Carolin Schramm, M&E Manager, Business Innovation Facility: [email protected]
Adriano Scarampi, M&E Officer, Business Innovation Facility: [email protected]
Closing slide
The Business Innovation Facility (BIF) is a pilot project funded by the UK Department for International Development (DFID). It is managed for DFID by
PricewaterhouseCoopers LLP in alliance with the International Business Leaders Forum and Accenture Development Partnerships. It works in
collaboration with Imani Development, Intellecap, Renaissance Consultants Ltd, The Convention on Business Integrity and Challenges Worldwide.
This publication has been prepared for general guidance on matters of interest only, and does not constitute professional advice. You should not act
upon the information contained in this publication without obtaining specific professional advice. No representation or warranty (express or implied) is
given as to the accuracy or completeness of the information contained in this publication, and, to the extent permitted by law, PricewaterhouseCoopers
LLP and the other entities managing BIF (as listed above) do not accept or assume any liability, responsibility or duty of care for any consequences of
you or anyone else acting, or refraining to act, in reliance on the information contained in this publication or for any decision based on it. The views
presented in this publication are those of the author(s) and do not necessarily represent the views of BIF, its managers, funders or project partners.

![GLOBAL ENVIRONMENT FACILITY—5 {GEF-5] National Portfolio ...](https://static.fdocuments.net/doc/165x107/5853d6a41a28abfa398f7a13/global-environment-facility5-gef-5-national-portfolio-.jpg)