Review of Maritime Transport 1974 - UNCTAD
120
TD/B/C.4/125/Supp.l ^N ^^£ NATIONS €ON££££N€£ ON T£AO£ ANO 0£¥££0?^£NT Review of maritime transport, 1974 UNITED NATIONS
Transcript of Review of Maritime Transport 1974 - UNCTAD

TD/B/C.4/125/Supp.l
^N ^^£٥ N A T IO N S € O N £ £ £ £ N € £ O N T £ A O £ A N O 0 £ ¥ £ £ 0 ? ^ £ N T
Review of maritime transport, 1974
U N I T E D N A T I O N S

U N IT E D N ^ T I D N ^ C O N F E R E N C E O N T R ^ D E ^ N D D E ¥ E L O ? ^ E N T
G en ev a
Review of maritime 1974
(Reriew of and lon^-te^m aspectsof maritime t^anspo t)
^ ٠٢؛ by the secretariat ٠/ UNCTAD
U N I T E D N ^ T I O N ^
N ew Y o rk , 1975

N O TE
Symbols o f U nited N ations docum ents are composed o f capital letters com bined with heures. M ention o f such a symbol indicates a reference to a U nited N ations document.
TD/B/C.4/125/Supp.l
UNITED NATIONS E U E T I^ T IO N
Sales No. E.75.II.D.1
Price: s u .s . 6.00 (or equivalent in other currencies)

CONTENTS
VI
VII
оО
17
20
20
إق27
27
2930
32
34
Explanatory n o te s .........................................................................................................................................................................
Abbreviations .............................................................................................................................................................................
Paragraphs
I n t r o d u c t io n .................................................................................................................................................................. 1-2
Chapter
I. The development of international seaborne t r a d e ............................................................................ 3-17
A. General d ev e lo p m en t.......................................................................................................... 3-8
B. Oevelopments by types of c o m m o d itie s ........................................................................................... 9-13
C .O evelopm en t by groups of c o u n t r i e s .................................................................................................... 14-17
II. The development of the ^vorld m erchant d e e t .......................................................................................... 18-b3
A. Changes in the world d e e t .......................................................................................................................... 18-21
B. Tonnage distribution by groups o f countries, with particular reference to developing countries . . . . . . . . . . . . . . . . . . . . . . . . . . . . . . . . . . . 22-361. Changes in to tal shares o f groups of countries......................................................................... 23-272. Changes by types o f vessel o f groups o f c o u n t r ie s ................................................................ 28-36
c . tre n d s in types, si^e and age d is t r ib u t io n ....................................................................................... 37-501. T e n d s in t y p e s .......................................... ...................................................................................... 37-392. Trends in s i^ e ..................................................................................................................................... 40-413. Trends in age d i s t r i b u t io n ........................................................................................................... 42-50
D. The productivity o f shipping s p a e e ................................................................................................... 51-53
£. Tonnage on o r d e r .................................................................................................................................. 54-631. G e n e r a l ......................................................................................................................................... .... 54-572. D istribution of tonnage by groups o f c o u n t r i e s .................................................................... 58-63
III. W orld ship prices and the deets o f developing c o u n t r i e s ................................................................. 64-100
A. Changes in prices o f new v e s s e ls ...................................................................................................... 64-69
B. Changes in prices o f second-hand v e s s e l s ..................................................................................... 70-75
€٠ Acquisition o f new and second-hand vessels by developing countries . . . . . . . . 76-100
IV. Trends in sh ip b u ild in g ...................................................................................................................................... 101-132
A. Ceneral developm ents............................................................................................................................ 101-106
B. ?articu lar developments by type of v e s s e l ..................................................................................... 107-1271. Bullc cargo v esse ls ............................................................................................................................. 107-1142. C en tra l cargo and unit load system v e s se ls ............................................................................. 115-1193. D ther v e s s e ls ..................................................................................................................................... 120-127
c . Trends in p ro p u ls io n ............................................................................................................................ 128-131
D. A utom ation and other technological a d v a n c e s .................................................................................. 132
iii

Chapter Paragraphs Page
V. Freight m a rk e ts 133-168 35
A. General developm ents 133-135 1ه
F. Ghanges in freight rates in 1ه?و 36 160-142 1. Gr^ cargo tram p m arket freight r a t e s 142-145 362. Gargo liner freight r a t e s . 146-156 383. T n k e r freight r a t e s 152-160 41
G. Freight rate indices o f selected commodities exported by developing countries . . . . . 161-162 41
D. Fevel of freight rates, laying up and s c ra p p in g 163-165 42
E. F iner freight rates ^s ة percentage o f prices of selected commodities, 145 168-166 . . . . 3? و64-1و
VI. G ther t o p i c s 164 222- و ?
A. Institutional developments in world sh ipp ing 169-190 4?1. G e n e r a l 169-125 422. ?articu lar examples o f institutional d e v e lo p m e n ts 126-190 48
E .G n i t i ^ a t i o n 191-200 491. T e n d s in unit load transport s y s te n r s 191-195 492. Particular developments with regard to unit load systems in liner cargo trades . . . . 196-200 50
G. ? h e prospects for the reopening o f the ^ u e ^ G a n a l 201-202 52
D . ٧ N G ?A ه training c o u r s e s 208-210 521. Fhird training course in po rt management . . ٠ . . . . . . . . . . . . . . . . 208-209 522. Eerth throughput s e m in a rs 210 53
? .A i r t r a n s p o r t 211-214 53
F. ?a n d bridges 215-218 531. ? h e Siberian land b r id g e 215-216 532. ? h e G nited States land bridge 212-218 54
G. W orld cruise h ee t 219-222 54
L IS T OF T A B LE S A N D G R A P H S
?ABLES
ه .1 evelopment o f international seaborne trade, 1965-1923 ................................................................................. 32. W orld seaborne trade in 1965, 1921, 1922 and 1923 by types o f cargo and shares o f groups o f countries 43. W orld seaborne trade, 1965-1924 ................................................................................................................................. 24. W orld shipping tonnage, 1965-1924 ............................................................................................................................ 85. D istribution o f world tonnage (grt) by groups o f countries o f registration 1965 and 192d-1924 . . . . 96. P e rc e n ta g € s h a re o fw o r ld to n n a g e b y ty p e o fv e s s e la s a t l3 u ly , 1965, 1923 and 1924 . . . . . . . . Id2. Percentage share of developing countries in the w orld heet by type of vessel, 1965 and 1921-1924. ٠ . 128. Analysis o f world fleets by principal types in the period 192^-1924 .......................................... 139. ?rends in average si^e o f world fleet by selected types o f vessels, 1922-1924 ................................................... 140. Age distribution of world m erchant fleet by type of vessel ^s a t 1 3uly 1924 ................................................... 141. Estimated ton-miles o f oil shipments per dwt, in 1962-1923, by oil tankers o f 10,000 dwt and above . . 162. Estimated ton-miles o f bulk commodities carried per dwt between 1962 and 1923 by bulk carriers, inclu-
ding bulk/oil carriers o f 18,000 dwt and above............................................................................................................ 163. Gargo carried per dwt of world fleet, 1962-1923 ....................................................................................................... 164. W orld tonnage on order as at 31 October, 1920-1924.............................................................................................. 185. Representative new building prices for bulk carriers and tinkers, 1962-1924 . . . . . . . . . . . . . 20
iv

Page
16. Estim ated prices for new and read)? liner type vessels 11,000/13,000 d ^ t, 1967-1974........................ 2117. TanEers: second-hand prices, average v a i n e s ............................................................................................. 2118. U ry bulk carriers: second-hand prices, average v a l u e s ........................................................................... 2219. Liner type vessels: second-hand prices, average v a l u e s ........................................................................... 2220. The course o f the estimated freight rates and second-hand values for a 38,000 dwt bulk carrier built in
1966 (1,660,000/1,760,000 cubic feet with cranes)........................................................................................ 2221. Estim ated developments o f freight rates and values for a good class 10,600/12,600 dw t shelter-decker 2322. €hanges in the ocean-going m erchant heets of developing countries in 1973: acquisition of new and
second-hand ships by type o f vessel— ocean-going ships o f 1,000 grt and o v e r ................................ 2423. Ueliveries o f new buildings, 1968-1974 ......................................................................................................................... 2724. N um bers of unit load system vessels on order at mid-1973 and mid-1974 ........................................................ 3026. Eiquid gas carriers—type and capacity analysis, January 1974 .............................................................................. 3126. Existing and projected E N G schemes which include the building o f EN G c a r r i e r s ........................ 3227. Trends in propulsion o f vessels under construction and on order a t 30 September, 1972-1974 . . . . . 3328. Ereight rate indices 1970-1974 3729. Nummary of liner freight rate changes and surcharges announced during the years 1972-1974 . . . . . 3930. Indices o f freight rates o f selected commodities exported by developing c o u n t r i e s ........................ 4231. Relationship between changes in freight rates and changes in laid-up to n n a g e ................................ 4632. The ratio o f liner freight rates to prices of selected commodities, 1964-1973 .................................................... 4633. ^hare of cargo moved in containers in the m ajor liner trades to and from the United States o f America,
1 9 7 1 a n d l9 7 2 ......................................................................................................................................................... 6134. Trends in air freight volume and in air freight operating revenues, 1968-1973 ................................................ 6336. Uevelopment o f the world cruise heet, 1966-1974 ................................................................................................... 6436. Flag distribution o f the world cruise heet, 1973 and 1974 ..................................................................................... 66
G r a p h s
1. The course o f freight rate indices and laying-up and scrapping as percentages o f world tonnage, 1968-1974:dry cargo v e s s e l s ................................................................................................................................................ 43
2. The course of freight rate indices and laying-up and scrapping as percentages of world tonnage, 1968-1974:oil t a n k e r s ....................................................................................................... 44
A N N E X E S
I. Classihcation o f countries and territo ries 66
II. W orld seaborne trade according to geographical areas, 1966 and 1969-1972 . . . . . . . . . . . . 68
III. U istribution o f world tonnage by hag o f registration and type o f ship, in order of size o f heets, in grtand dwt, as at 1 July 1974 61
IV. U istribution o f world heet by geographical areas, as at 1 July 1974 67
V. A dditions to and net changes in the m erchant fleets o f developing countries and territories during 1973 69
VI. Am endm ent to the G ECU U nderstanding on Export Gredits for S h i p s 76
VIE Selected maximum and minimum tram p freight rates, 197 1974-ه 76
VUE Liner freight rate changes and surcharges announced during the year 1974 77

EXPLANATORY NOTES
References to dollars ($) are to O nlted State dollars unless otherwise stated.
References to tons are to metric tons, unless otherwise specified.The term “billion” signifies 1,000 million.
Use o f a h^^phen between ؛?ears, e.g., 1965-1966, signifies the full period involved, including the beginning and end ؛?ears.
A n oblique strode (/) between ؛?ears, e.g., 1965/66, signifies a season or crop .ear?؛
Details and percentages in tables do no t necessaril؛? add up to totals, because o f rounding.
* ء*
The following s؛?mbols have been used in the tables in this Review;A full stop (.) is used to indicate decimals.Two dots ( . . ) signif؛? th a t data are no t available or are no t separatel؛? reported. A dash ( - ) signifies tha t the am ount is nil, or less than half the un it used.
٠* *
The description and classification o f countries and territories in this docum ent and the arrangem ent o f m aterial, should no t be considered as implying any judge- m ent by the Secretariat o f the U nited N ations regarding the legal status o f any country o r territory or in respect o f the delineation o f its boundaries, or regarding its economic system or degree o f development. Inclusion o f a particular country o r territory in any economic or geographical grouping (or its exclusion) has been dictated by economic and statistical considerations.

ABBREVIATIONS
Names o f organizations
ASEAN Association o f Sonth E ast Asian N ations€ A IE A Oouncil o f All-Japan Exporters AssociationE E € European Econonric €onm m nit؛?FA O Food and Agriculture O rganisation o f the U nited N ationsFEFU F ar Eastern Freight ConferenceF ^ € F ed era lh la ritiin e C n m riss io n (U nited States)lA T A International A ir T ransport AssociationICAO International Civil Aviation O rganisationOAFEC O rganisation o f A rah Fetroleum Exporting CountriesOECO O rganisation for Econom ic C o-operation and Oevelopnrent0 ? E C O rganisation o f ?etro leum Exporting CountriesU N C TA D U nited N ations Conference on Trade and Development
Other abbreviations
BACAT Barge aboard catam aranC A F Currency adjustm ent factorc.i.f. Cost, insurance, freightd^vt Deadweight tonsf.i.o. Free in and out o f shipf.o.b. Free on boardgrt Cross registered tonsIntascale In ternational Tanher N om inal ScaleEASU Lighter aboard shipL N G Liquefied natural gasL ? c Liquefied petroleum gasn.e.s. N o t elsewhere specifiedOBO Ore/bulL/oilpwc Fahistan white cuttings (jute)R o/R o R o ll-o n , آ0ا1-0ء
RSS R ibbed s m o ^ d sheet (rubber)shp Shaft horse-powerTEU Twem y-foot equivalent unitU LC C U ltra large crude carrierVLCC Very large crude carrier
٢١؛

IN TR O D U C TIO N
1. As ]آل previous years, this revie^v has bee!^ prepared by the secretariat of U N C TA D in accordance ^vith item V o f the program m e o f w ork o f the Committee on Shipping.^
2. 8tatisticai evidence and other inform ation w ith regard to the development o f international m aritim e transport is presented and discussed in the review with a view to relating year-to-year developments to relatively longer-term trends in world shipping, ?articu lar attention is given to factors and developments a^ecting the trade and shipping o f developing countries. In order to keep the size o f the tables within manageable limits, in m ost cases d^ta for the m ost recent years only have been included. D at^ for earlier years can be fou؛ d in the review for 1922 and 1923.2
أ Official Records o f the Trade and Development Board, Fifth Session, Supplement No. 2 (TD/ B/116/Rev.l), annex 11.
2 Review o f maritime transport, 1972-1973 : ؛ ٠٠٢٢ by the secretariat ٠/ UNCTAD (United Nations ^nhlieation. Sales No. E.75.II.D.3).

Chapter I
THE DEVELOPMENT OF INTERNATIONAL SEABORNE TRADE
altered the whole International trade picture, particu- lari)? as regards the trade in oil, ^ r which dem and has slackened.
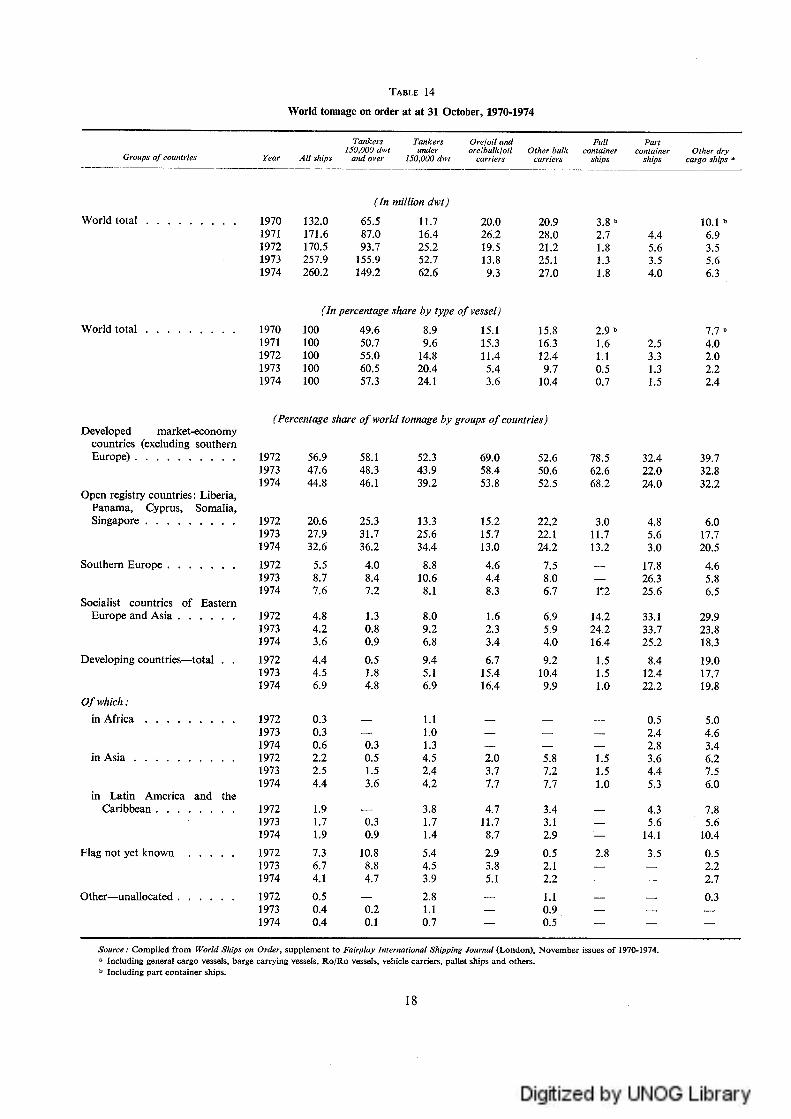
5. The statistical inform ation relating to international seaborne trade in selected )?ears between 1965 and 1973 is found in table 1. Since trade data for 1974 are not yet available, only lim ited reference is m ade in this chapter to the particular changes in international seaborne trade which occurred in 1974 and this is done on the basis of the general inform ation available.
6. A lthough over the long term the volume o f inter- national seaborne trade, as p a rt o f world trade, has followed a rising trend, the annual growth rate has varied considerably. Even when the growth rates ^re averaged over three-ye^r periods huctuations in the rate o f growth remain. The hgures are:
Average annual 3-year period rate o f growth
1962-1964 . . . . . . 9.7 percent1 9 6 6 - 1 9 6 7 . . . . . . 8.3 per cent1968-1970 . . . . . . 11.0 percent1 9 7 1 - 1 9 7 3 . . . . . . 7.0 per cent
A. General development
3. Trade data for a complete review of trade develop- ments in 1974 are no t yet available. Nevertheless the scattered inform ation which is available a t the time of the preparation o f this review conhrm s th a t the e jec ts on world trade o f the im portant developments which occurred a t the very end of 1973 with regard to the supply, and in particular to the rise in prices, o f oil have been apparent throughout 1974.
4. Over the long term international seaborne trade has followed a rising trend, bu t its short-term develop- m ent has been subject to huctuations. A lthough there is a wide range o f factors th a t may a№ ct the course of world trade as a whole, it appears th a t a few industrial countries exert a dom inant inhuence on world trade and consequently on seaborne trade. F o r example, the relatively high rates o f growth in these countries in 1972, and particularly in 1973, were accom panied by high rates o f growth in the volume o f international seaborne trade. Oonversely, the repercussions o f the sharp in- crease in oil prices on the economies of the main industrial countries in W estern Europe and N orth America have
؛trade ،؛1965-1973
T able 1
Development of international seaborn(Goods loaded)
٠٢ ^ cargo
Tota l (a ll goods)
O f which: rrtain bulk
TotalTanker cargo
Percentage Percentageincreasel increase!decrease decrease
over overM illions previous M illions previous
o fto n s ^٠٢ o fto n s year
Percentageincreasel
Percentageincreaseldecrease
overM illions previous M illionso fto n s year o fto n sYear
11
،ة10
4
,ا6?4,؛770910],,؛107,أ312,؛606
,190
16
19
1 9 6 6 . . . . . . 862 9 812 13 3271 9 6 6 . . . . . . 960 10 820 1 3401967 . . . . . . 1,023 8 887 8 3621968 . . . . . . 1,141 12 966 9 3841969 . . . . . . 1,276 12 1,036 7 4191 9 7 0 . . . . . . 1,440 13 1,166 13 488
. 1,626 ء 6 1,173 ء 1 490 . . . . . 1971606 6 ٠ 1,271 7 ٠ 1,646 . . . . . .1 9 7 2
699 10 1,349 12 1,841 . . . . . . 1973
Source: F o r tan k er ear^o , t ه taل d ry ear^o an d all goods: U nited N ations, M onthly Bulletin o f Statistics, ^annary Issnes; ^or m ain bu lk com m odities: F earnley an d Egers C hartering C o. L td ., W orldB u lk Trades, 1973 (C slo, 1974).
٠ Including in ternational cargoes loaded a t po rts o ^ th e G rea t Lakes and St. Law rence system fo r un loading a t ports o f the sam e system, b u t excluding m any bu lk com m odities. Including petro leum im ports im o N etherlands A ntilles and L ^ n id a d fo r refining an d re،export.
١١ D a ta o n iron o re, grain, coal, baux ite/alum ina a n d phosphate .٠ Revised on the basis 0ك revised trade data included in United Nations, Monthly Bulletin o f Statistics, vol. XXIX,
N ٠٠ 1 J a n u a r y ل97ك ), special tab le D .

بم ٩٣١٠
٦٩со ئ
٠د٠٠
٠о٠١
ص 0000ضص
يم
00 ها(N ٠
' 0ا*0 ’
٠ بمS) قي ٠١|
لم ٦٥© بمم©لم
»لآ
أم٠١ 4ه٠١٢٦٩ "ص ص S1يها؟
©
ق
٠٦،٨٠
^٠ها ١٠٥ ٣١
٠٠٠
٠٠١
٠٠٠со أم
و
ج
٨' ٠،
ق ا
ها ي
ات
٠،٠٠
ؤ
I ٩0ة
أ آ
Î I
٣ ٠ ٠ يء ٠
٠١ ٣١ها١٥٣١
٠١لم١٥!
'١٥aؤوء؟؛يمك
00|و
00 ٠١ ١٥ ٠٠* تم
٠ ٣ ١ ة1و جيم٣١ ٠*
i l٩ ٩ص 00
١٥٣١ *ب ،٨*
٠ بءQ ٠
0ة
جق<و0ة>قمحكك
قء
||
,ة
'ء0':دمة
!!أ-٠ °ق1ا4
о Îء0
Й •أ ص
IIÎ

|ق|
{أ
؟1
|ةق
{III:
إ ©ي محا ئ
٢٠١ 00 ي *©
о ٢٠١ ٢٠٠٠' ٧٦
VO بمم ООО
о о ٢٢ <N٢٢ 00* ٢٢ o’
00 ٢٠٠ VO ا-ا*о* о محا ^
بمم о ٢٣١ همо ٢٢٠١ ٢٢
٩٢٢VO о
|ف
ة
جق0а 0
٢٢ ا٢٣١ ا
بمم بمم ٢٢٢٢
٢٢ ٠٨ محا
VD ٠١ 1-Н ٢٢ оо oà ٢٠١ о ٢٠٠؛
р о ٣٦ ٠؟ ٣٦
بمء ٠١ ٠ . о
٢٢٢٢
٢٠١ ^ بم
تو ٢٠١ أم بم
р VO
о о
٢٢
وР آم VO ع ٩ ٢٠١٠
о ٢٣١ رم
٩ ٩٢٠٠ es
о ٢٢٠٧١о VO* آم
&.ق
ا;ك
لإ ئ ئ
ه
٠оо
о.٢٢.
ة8
оج
بم00
أم ج Р ص
as٢٢V©
٢٢
٢٢٢٢.
٩00
!آ
ج ,و
|م
и
م ةأ
ء ةج؛5
!

12. The rem aining 55.6 per cent o f the dry cargoes carried by sea in 1973 consisted o f a great variety of heterogeneous products. M ost were “ general cargo ” , which is transported by liner vessels, including container and other vessels carrying unitized cargo, and also by tram ps and specialized carriers which in many trades compete with liners; the rest consisted o f a num ber of “ m inor ” bulk commodities, which increasingly tend to be transported in bulk and full ship loads. A lthough complete data illustrating the e^act dimensions o f the trade in these “ m inor ” commodities are no t available, some indication is provided by the data showing the volume of “ m inor ” bulk commodities lifted by bulk carriers o f over 18,000 dwt. ء In 1973, 134 million tons were lifted, as against 125 million tons in 1972 and 94 million tons in 1971. Timber, sugar, salt, soya beans, fertilizers, cement, gypsum, sulphur, pyrites, ilmenite, manganese and chrome ores, petroleum coke, scrap iron, pig iron and steel products are included in this group o f commodities.
13. Table 3 gives data reflecting world shipping performance in term s o f ton/miles. Distances, which have played a signiflcant role in the rapid expansion of dem and for shipping services in previous years, do no t seem to have increased substantially in 1974. The increases in shipping perform ance were mainly due to increases in tonnage carried.
c. Developments by groups of counties
14. The percentage shares o f various groups of countries in the volume o f international seaborne load- ings and unloadings o f cargoes by categories of goods in 1965, 1971 and 1972 are shown in table 2. This table also shows the shares o f various groups o f countries in total loadings and unloadings in 1973. Gertain changes in the long-term pattern o f w orld seaborne trade can be observed y following the changes which have taken place in the shares o f goods loaded and un- loaded in the foreign trade o f di^erent groups o f countries.
15. The combined share o f developed m arket- economy countries and countries o f southern Europe decreased slightly from 3fl.6 per cent in 1972 to 3fl.5 per cent in 1973. The share o f socialist countries o f eastern Europe and Asia declined over the same period from 5.6 to 5.2 per cent, wh^le the share o f developing countries increased from 63.8 to 64.3 per cent.
16. In term s o f goods unloaded the share of develop- ing countries showed a slight increase from 17.4 per cent in 1972 to 17.5 per cent in 1973, while the combined share o f the developed m arket-econom y countries and countries o f southern Europe decreased slightly from79.2 per cent to 79.1 per cent over the same period. The share o f the socialist countries o f Eastern Europe and Asi^ rem ained constant a t 3.4 per cent.
17. Table 2 also gives an indication o f the develop- m ent o f the shares o f d i^erent groups o f countries in the
7. The rate o f growth of international seaborne trade, which was less than 4 per cent in 1971 and 6 per cent in 1972, rose to 11 per cent in 1973, which was a year of strong economic activity and trade prosperity despite the continuing m onetary instability and the restrictions in the supplies o f oil applied during the last ٩uartه r o f the year, ?rehm inary estimates, however, point to a new slackening in the rate o f growth o f international seaborne trade, particularly in trade in oil in 1974.و
8. $uch differing and fluctuating rates o f growth of international seaborne trade have direct short-term e jec ts on freight m arkets and also, to some extent, on developments in the supply o f tonnage, as will be discussed in chapter II below.
B. Developments by types of commodities
9. Table 1 also shows the volume o f international trade by m ajor types o f cargo. In 1973 tanker cargo continued to increase faster than to tal cargo traded despite the setback in production and trade which has occurred since Dctober 1973. Tanker cargo grew a t a rate o f 12 per cent to reach a level o f 1,841 million tons, while dry cargo increased by 1 ه per cent to 1,349 million tons. As a result o f this higher growth rate, tanker cargo accounted for 57.7 per cent o f the total tonnage of cargo loadings in 1973 as com pared with 57.2 per cent in 1972 and 5© per cent in 196©. The prelim inary inform- ation available suggests tha t in 1974, however, tanker cargo increased a t a m uch lower rate (1.6 per cent) as against an increase o f about 8.3 per cent in dry cargo trade. ٠ Thus the share o f tanker cargo in total trade is likely to be substantially lower in 1974 than in 1973.
!©. I t can be seen from table 2 tha t the m ajor portion of tanker cargo consists o f crude petroleum , the rem ainder being various petroleum products. In 1972 petroleum products accounted for 19.6 per cent o f to tal tanker cargo as com pared with 2©.9 per cent in 1971 and 28 per cent in 1965. I t has been observed from additional information® th a t the share o f petroleum products declined further in 1973 and 1974, although a t a slower rate. The tendency to expand reflning capacity in oil producing countries a t a faster rate than in past years may help to check or possibly reverse the declining trend in the share of oil products in the coming years.
11. There are no data showing the change؛ in inter- national seaborne trade by all types o f cargo separately. Nowever, the development o f world seaborne trade in the flve m ain dry bulk commodities, i.e., iron ore, grain, coal, bauxite/alum ina and phosphate rock, is indicated in table 1. In the period 1968 to 1973 tr^de in the main bulk commodities grew a t an accelerated rate com pared with earlier years and it appears tha t in 1974 shipments o f these commodities have further increased. Their share in w orld seaborne dry cargo trade was 44.4 per cent in 1973 as com pared with 41.3 per cent in 1972.
Chartering Ce. Ltd., Review, 1974 (Cslo,
,Fearnley and Egers Chartering Co. Ltd., World Bulk Trades ء1973 , 0 وثم/د(ه$ا ), table 30.
Fearnley and ء1974).
٠ Ibid..Ibid ء

T a b l e
World seaborne trade, 1965-1974(In 1,000 million ton-miles)
Totaltrade
OthercargoCoal Grain
Ironproducts
Crudeoil
7,2308,3729,374
13,101
16؛000
1,6001.700 1,800 2,000 2,130 2,200 2,230 2,4002.700 3,030
408380340307
406
380
963 2,480 640 327 216966 2,6^9 700 373 226967 3,400 730 631 269968 4,197 730 773 310969 4,833 760 919 383970 3,397 890 1,093 481971 6,334 900 1,183 434972 7,719 930 1,136 442973 9,171 1,010 1,398 467974 (estimated) . . . . . . 9,330 1,013 1,300 300
s C hartering c©. L td ., Review, 1974 (1974 ه$مهل ) (Revised figures fo r 197^ا by Fearnley an d ]
commodities in terms o f goods loaded, while in term s of goods nnloaded their share increased with respect to crude petroleum and petroleum products and decreased
1971 cargo from 78.4 per cent in ؛?with respect to dr to 77.6 per cent in 1972. The shares o f the socialist countries o f Eastern Europe and Asia decreased with
pe$ o f goods loaded; while their؛?regard to all three t with regard to ؛?share in unloadings increased slightl
with respect to?؛ dr ؛?crude petroleum and signihcantl with respect to petroleum ؛?,cargo, and decreased slightl
.products
1971 pes o f goods loaded and unloaded from؛?various t to 1972. The share o f developing countries in loadings
o?؛ cargoes changed onl?؛ slightl?؛ f crude petroleum and dr while their share o f petroleum products loaded declined from 64.1 per cent to 61.8 per cent. In terms o f goods unloaded the share of developing countries decreased
with respect to crude petroleum and petro- !؛?significant leum products, while their share in the unloadings of
cargo showed an increase. The shares o f developed ؛?dr countries and countries o f southern ؛?m arhet-econom
pes o f؛?Europe tahen together increased for all three t

Chapter II
THE DEVELOPMENT OF THE WORLD MERCHANT FLEET
num ber and tennage capacity o f certain types o f vessels included in this category, e.g., small-size and specialized vessels, are increasing rapidly, although the relevant developments are no t re jected in the aggregate tonnage figures discussed here. Certain developmeس s are dis- cussed further in section с below.
21. The tendency for the dw t/grt ratio to increase has persisted during 1974. This is shown below, where the ratios in selected years are com pared with those of 1974:
Estimated dwt/grt ratios fo r tankers and bulk >->•>>»■.
Tankers B u lk carriersYear
1965 1.58 1.531 9 7 ^ 1.79 1.69
1973 1.8^ 1.7ه1 9 7 4 . . . . . . . . . . . . . . . . 1.84 1.71
Since the grt is calculated on the basis o f the cubic space o f vessels and, hence, is related to vessel dimen- sions, and dw t refers to the carrying capacity o f vessels, the increased dw t/grt ratio implies rising productivity o f t a n ^ r s and bul^ carriers.
A. Changes in the world fieet
18. Between mid-1973 and mid-1974 the world active sea-going m erchant fieet increased by 7.7 per cent in grt o r by 9.5 per cent in terms o f dwt, as com pared with an increase o f 9 per cent in grt and 10 per cent in dwt in 1972-1973, and 9.1 per cent and 10.7 per cent, respectively, in 1971-1972 (see table 4).
19. Tanker tonnage grew more rapidly than tha t o f non-tankers in 1973-1974. Tankers registered a rate of growth o f 13.8 per cent in term s o f dwt as against an increase o f l l .b per cent in 1972-1973 and 10.9 per cent in 1971-1972. The growth o f non-tanker tonnage slowed down to a rate o f 5.7 per cent in 1973-1974 as com pared with 8.6 per cent and 10.4 per cent in the two preceding years. However, within this group, bulk carrier (includ- ing combined carrier) tonnage recorded a relatively high rate of increase (10.3 per cent). This, however, represents a considerable slow-down in the growth rate from the figures o f 16.1 per cent in 1972-1973 and 21 per cent in 1971-1972.
20. In 1973-1974, as in previous years, “other ships” showed relatively small increases. Nevertheless, the
T able 4
World shipping tonnage,“ 1965-1974 ه
(Mid-year figures)
TotalOther shipsB ulk carriers ٥Tankers
M illion grt M illion dw t M illion grt M illion dw t M illion grt M illion dw t M illion grt M illion dwtYear
Sources: L lo yd 's Register o f Shipping: Sta tistica l Tables (London), 1965-1974, and supplem entary data regarding the U nited S tates Reserve fleet and the G reat Lakes fleets 0؟ the U nited States and C anada published by the U nited States D ep artm en t o f Com m erce, ^^arhim e A dm inistration . F igures in dw t up to and including 1969 figures in dw t a r^ b ase d , regarding ^ a n ^ ^ s , o ^ d a ta from the In stitu te o f sh ipp ing Econom ics, Shipping S tatistics (Brem en), an d regard ing bulk carriers on d a ta published in Fearnley and Egers C hartering Co. L td ., Review, 1973 (Gslo).
tab ؛ le 5, no te a, fo r various estim ates o f theseإ R eserve fleet and th e G reat La^es fleets o f the U nited S tates o f A m erica ٤
969, figures in g rt a re n o t stric tly com parable w ith those in dw t, as the grt series refers to all com m ercial vessels (including e.g. fishing and above, while the dw t series includes only sea-going cargo an d /o r passenger-carrying vessels and tonnage fo r eom m ercial purposes o f 300 g rt
ft, as the dw t figures refer to bu lk carriers o f 10,000 dw t an d above ؛١ n o t strictly com parab le w ith those in ; 1 above.
' figures in dw t أ
٠ Excluding the U nh ed ة
١١ U p to and including ] research ships) o f 100 g rt anc and over.
٠ U p to and includingthe g rt figures refer to bu l^ carriers o f 6,000 g^t أ

IH- وآ й>
■Л гл го ة ه زم ٠٠٩•
٥٠
؟ءق
٢ ٢ ٢ ٢ 00 ٢٢١ 00 ٣٠١ ٢٠١
بما بما ٢٩ ؟© ٠٩ بم ٢٦
٠ ءا 00 ٢٢ ٢٣ ٧٦ ١ Оо о ام ٢٣ о ٠١ ٢٢
٠١ ٢٢ ٢٢ ٢٦ ٢٠٠ 00 ٢٢ N О О٢٢ ٢٠٠٠ ©٠ ٢٢ ؛
I ة0ةبمأ قم ،٨ ه © ب م آ ي
ا ح oôvoorSo'i م
٢٠٢٣٢٢٢٠١٢٢ ما
٨،محابي ئ ٢٢١* ثم ر ؛ء
^ محا ئ ٢٢؛ ثم ا ئ
٦ 00 ٩ ٢٦ ٢٢
q ٢٦ I о! س ©٠ صا
٧٦٠١ك أم
٩^ ام ٠١
٢٠١٢٦ي ٠
ام
ج 00يم
q ٢٢00 ٠١
o p00 ٧٦
بم ٧١ q ^بماإما؟^لآ٢٣ о •٢٢ ٠١ ٢٠٠ 00 ٧٦ f o-؟
' ٢٣ ٠١ VO
O P ٢٦^١٠ ٢٠١١يم ا *ص *يم شمأي*يم0نحامح ا ٧١ يم ^
ه
٣٠ 00 о ٧١ ٧٦ غ ^ ك 00* ٧١* ا
مارمامامم\م ١٠٠о 0* ٧٦ ٢٢ ر ئ о
1|
>ق *ج
جء
!ا
وئ
'!أ
هء؟
ة ،ق
qيم
qО
يم٧١
٢٢٢٢
يم
٠VO
صо
فهئа
ح!ج
IIةة
■■ائ
ة ق .ء ة '
sقأأ■•اامءصءة||ء
بم|تم
qP
|.ة
I
ة
Л141
S٦٠
!

23. The particular tonnage changes from 1973 to 1974 were similar to those observed in previous ؛/ears. The share o f tonnage general!؛/ regarded as being bene- ficially owned in developed m arket-econom y countries, including southern Europe, increased from 84.6 per cent in 1972 to 85.2 per cent in 1973 and 85.3 per cent in 1974.
أ countries /٠ groups /٠ Changes in total shares . ل
أ Whenever particular country data are used in this discussion, they are derived from Lloyd's Register ٠/ Shipping: Statistical ? ءء/هءآ (London), various issues.
B. Tonnage distribution by groups of countries with particular reference to developing countries
22. Annex II! below gives the distribution o f world tonnage by flags o f registration and by type o f vessel. The distribution o f world tonnage by groups o f countries is summarized in table 5 while table 6 gives inform ation concerning the distribution by groups o f countries for di^erent types o f vessels in selected years. Gountries are classifled in accordance with the classiflcation given in anne^ I.
at 1 July, 1965, 1973 and 1974■
T a b l e 6
Percentage share of world tonnage by type of vessel a(In terms o fg r t)
Barge carryingvessels O ther ships
carriers including General ContainerA ll ships ^ Tankers combined carriers cargo ء shipsYearCroups o f countries
ndex o f tonnage increase: 1965 = 100
S.9
50.6
6.97.5
4.9 4.8
30.030.5
6.0
0.80.8
3.0
0.40.4
0.30.3
100.0100.0
64.61.0
6.7
0.5
5.4
91.594.9
4.53.4
0.8
1.7
1.7
23.8
41.7
18.216.4
14.5
3.0
0.91.0
25.1 24.511.1
ة:ةق11.510.36.2
20.32.9
4.33.7
1.00.30.50.6
42.240.5
.;53
62؛؛
4.930.930.323.8
3.74.5
0.7
0.20.20.1
0.71.9
3.00.20.30.1
100.0100.0100.0
50.9
61.810.1
8.0
24.323.2
5.0
6.06.07.3
0.50.40.4
0.40.50.5
974973
974973 965974973
974973
974 973
974973
974
لآ 9ق974973
ة7لآ973
974 973
W erld total
O f which:Developed market economy countries (ex-
eluding southern E u ro p e ) .............................
Southern Europe, excluding Cyprus . . .
Open registry countries
Socialist countries of Eastern Europe and Asia
Developing countries, excluding Liberia, Panama, Singapore, ^onralia. . . . . . .
O f which:in Africa . . . . . . . . . . . . . . .
in A s ia ..............................................................
in Latin America and the Oaribbean
Other—unallocated
Source ; C om piled from L lo yd ’s Register o fS h ip p in g .- Statistical Tables (London), 1965, 1973 and 1974, and supplem entary inform ation on tlte U nited S tates Reserve fleet an d the U nited S tates and C anad ian fleets.
Rxeludin^, respectively, in ء 1965, 1973 and 1974:(!) U nited S tates Reserve fleet o f ab o u t 10.4, 2.5 an d 2.0 million grt.
(ii) U n ited S tates G rea t Lakes fleet o f ab o u t 2.0, 1.7 an d 1.7 million grt.(iii) C anad ian G rea t Lakes fleet o f ab o u t 1.2, 1.5 and 1.5 million grt.
٠ G re an d bu lk carriers o f 6,000 g rt and m ore, including com bined ore/oil and ore/bu lk /o il carriers; com bined carriers am ounted in :1974 to sbips with a ر،محمح to ta l tonnage o f 2 2 , 0 3 2$ أ,ج g rt;1973 to 349 ships w ith a tom l tonnage o f 19,53S,?46 g rt;1965 to 90 ships w ith a to ta l tonnage o f 2 , 5 , 0 0 0 ة ل g rt (U N C T A D secretaria t’s estimate).ه This ca tegory includes passenger/cargo vessels (bo th liner and tram p).
10

28. It can be seen from table 6 tba t from 1973 to 1974 there was a farther Increase in the relative im portance o f tankers and bulk carriers in to tal world tonnage, while the downward trend in the relative share o f general car§0 tonnage persisted. W ith regard to the shares of groups o f countries in the d i^erent types o f vessels, the trends observed between 1965 and 1973 persisted in 1974.
29. The combined share of flags o f developed m arket- economy countries, countries o f southern Europe and open registry countries, in world tanker tonnage increased slightly from 1973 to 1974 while their share in bulk carrier tonnage declined by 0.9 per cent. As a t 1 July 1974,92.6 per cent o f tanker tonnage and 92.3 per cent o f ore and bulk carrier tonnage (including com bined carriers) was registered under the fiags of these three groups o f countries.
30. On the other hand, their com bined share in general cargo vessels declined by 1.3 per cent from 1973 to 1974, and their share in container tonnage decreased from98.3 per cent in 1973 to 97.6 per cent in 1974 to the beneht o f socialist countries whose share in container tonnage, although still very small, increased from 0.1 per cent in 1972 to 0.8 per cent in 1974. All barge-carrying vessels and virtually all vehicle carriers continued to be registered under the fiags o f developed m arket-econom y countries.
31. A part from their increased participation in container tonnage, ١١ some other signihcant changes have been recorded in the percentage shares o f fiags o f socialist countries o f Eastern Europe and A sia in the world fieet by type of vessel between 1973 and 1974 and in earlier years. The percentage shares by type o f vessel were as follows : ١؛
٠ // O rejbulk eral Container Other Share ٠/ (،>،،>/ tankers carriers cargo ships vesseis w orld fieet
2. Changes by types ٠/ vessel and groups o f countries
(Percentages)
13.9 0.1 30.7 8.714.5 — 30.5 8.315.7 0.8 30.0 8.3
2.3 4.4 ٠ . . . . 19712.4 4.2 . . . . . 19722.5 3.7 . ٠ ... 19732.9 3.6 . . . . . 1974
The tendency to increase activities in the field o f bulk carriers can again be observed.
32. Table 7 shows the share o f developing countries by type o f vessel, container ships and general cargo tonnage, also the relative shares of the various regions within the group o f developing countries by type of vessel in 1974, as com pared with selected earliers years. I t can be observed from the table tha t the trends noticed in earlier years persisted in 1974.
33. F o r instance, the share of developing countries in general cargo tonnage continued to increase during 1974, although in absolute term s general cargo tonnage under the flags o f developing countries rem ained constant
١١ Container tonnage nnder the flag of the USSR increased from 7 vessels of 35,2flO grt in 1973 to 9 vessels of 48,156 in 1974 (Lloyd's Register o f Shipping : Statistical Tables (London), 1973 and 1974).
١؛ D ata derived from table 6, except for 1972 and 1971 data which are derived from Review ٠/ maritime transport, 1972-1973 (op. cit.), table 7م
A lthough the share of the group was constant between 1973 and 1974, w ithin it the share o f tonnage under the fiags o f open registry countries increased from 23.2 per cent in 1973 to 24.3 per cent in 1974.
24. The popularity of fiags o f open registry countries has continued to grow. ® A t mid-1974 a total o f 74.5 mil- lion grt was registered under these fiags; this shows an increase o f 12.9 per cent over the previous year. Trade unions are becoming increasingly reluctant to accept this move towards fiags o f open registry countries.®
25. W ithin the group o f open registry countries, the share of Liberia declined further from 75.6 per cent in 1973 to 74.2 per cent in 1974, bu t a t a m uch slower pace than from when it was 79.3 per cent, to 1972, 1973, while the share o f the fiag o f Singapore increased from 1.5 per cent in 1972 to 3 per cent in 1973 and 3.9 per cent in 1974.
26. The share o f world tonnage under the fiags o f the socialist countries o f Eastern Europe and Asia rem ained unchanged from 1973 to 1974.
27. The share o f fiags o f developing countries also rem ained unchanged in term s o f grt during the same period, although a very slight increase (0.1 per cent) has been recorded in their share in terms o f dwt. The per- centage share o f developing countries in the world fieet in term s o f dwt was: ١٠
1970 1971 1972 1973 1974
(Percentages)
A s i a .................................................. 4 0 3 .3 3 3 3.0 3.0A f r i c a ............................................. 0 3 0.3 0.3 0.3 0.4Latin America attd Caribbean . ٠ 2.6 z.z 2.1 2.0 2.0
Total developing countries 6.9 5.8 5.5 5.3 5.4
In 1974, for the first time since 1970, the share of developing countries did no t decline. The years to come will show whether this declining trend has been checked. However, during the first four ^ears o f the Second U nited N ations U evelopm ent Uecade, no t only have developing countries been unable to increase their share in world m erchant fieet tonnage bu t their share as a group has declined from 6.9 per cent in 1970 to 5.4 per cent in 1974. Similarly, in respect o f tonnage according to types o f vessel no significant changes have occurred in the position o f developing countries, as can be seen from sub-section 2 below.
راةIt is reported that Japanese shipowners are increasin ء ? starting operations under the fla^s of open registry eountries. They are, for example, increasingly makin§ use of the possibility of transferring or registering tonnage under such flags and of chartering back the ships. According to a survey of the Japanese ^^inistry o f Transport a total of 1,145,سم grt was operated under such conditions at the end of March 1974 (Japan Maritime Gazette (Tokyo), June 1974.)
It is also reported that about 200 vessels aggregating 1.2 million tons are currently registered by shipowners in the federal Republic of Uermany under flags o f open registry countries. These ships are mainly in the size range of 6,000 to 7,000 tons and are especially labour-intensive (Shipping and Trade News (Tokyo), 12 August 1974).
It has been reported that, in an attempt to ء improve relations with the trade unions and to improve the negative image of the Uyprus fleet, a Uyprus Shipowners’ Association has been founded. (Lloyd’s List (Lobdon), 15 June 1974, and Shipping and Trade News (Tokyo), 19 June 1974.)
١٠ Derived from Lloyd’s Register o f Shipping : Statistical Tables (London), various issues.
11

Percentage share of developing countries in the world fleet by type of vessel, 1965 and 1971-1974(In g rt)
T a b l e 7
1974197319721971
(Percentages)
1965
CountriesType o fsh ip
0.2
1.9
4.3
1.6
»?
2.7 1.0
1.7
1.7
0.21.3
0.1
:؛ة2.0
2.0
»?1.62.0
4.3
1.1
0.10.73.0
?»0.3
Total developing countries O f which:in Africa . . . . . . .in A s ia .............................in Tatin America. . . .
Tankers
Total developing countries O f which:in Africa . . . . . . .in A s ia .............................in Latin America. . . .
Total developing countries O f which:in Africa . . . . . . .in A s ia .............................in Latin America. ٠ . .
©re a^d bulk carriers, including combined c a rr te rs ..............................................................
©ontainer ships
13.0
7.34.3
0.8
3.0
7.0
6.0
0.8
2.4
1.0
4.3
3.7
0.82.4
12.0
0.96.94.2
0.92.4
0.33.4»
Total developing countries O f which:in Africa . . . . . . .in A s ia .............................in Latin America. . . .
General cargo slri^s
Total developing countries O f which:in Africa . . . . ٠ ٠ ٠in A s ia .............................in Latin A!rrerica. . . .
Other ships
Source: T ab le 6, except fo r the years 1971 and 197^, the data fo r which were derived from Review o f m aritim e transport, 1972-1973 (op. c it.) , tab le i Less than 0.05 per cent.
Refers to ظ “general cargo ships” and “o ther ships” .٥ See figures fo r “general cargo ships” .
have not been able to adapt their fleets to world trends bulk ؛?in seaborne trade, which favonred oil and dr
other cargoes. ؛?cargoes more than an
While the share o .35?؛ f tanker tonnage owned b developing countries as a group has remained unchanged
declined since ؛?ears and has actuall؛? over the last three 1965 and the share of bulk carrier tonnage has done no
m ore than return to its 1971 level, there have been improve- ments in the relative position o f individual countries, ft can be seen from table 7, however, tha t the comments made in the preceding paragraphs on the participation of
developing countries in world tonnage are also general?؛!valid with regard to the regional groups o f developingcountries.
36. Some indications o f possible future improvements pe com position o f the fleets o f developing coun؛ ? -in the t
tries are discussed in chapter III below. Uowever, it remains to be seen w hether these developments will increase the share o f developing countries in world
.pe o f vessels؛?t ؛?tonnage b
at 8.7 million grt. Therefore, the increase in their share is due to the contraction in world general cargo tonnage, ©n the other hand, although liner shipping has in recent ؛?ears been undergoing a process of change which has led to dom ination of m an؛? o f the m ajor liner trades b؛? unit load vessels, the participation o f devel- oping countries in this new t؛?pe o f tonnage is still negli- gible. Therefore the increase in the developing countries’ share in the world tonnage of genera! cargo vessels does no t mean their increased participation in liner shipping.
34. The participation of this group o f countries in tanker tonnage remained unchanged in 1974, bu t their share o f bulk carrier tonnage returned to the 1971 level o f 4.3 per cent after having fallen in 1972 and 1973. A lthough this is an encouraging sign, the share o f devel- oping countries in the world tonnage o f tankers and dr؛? bulk carriers remains substantial!؛? below their total share o f world tonnage, and this shows th a t to date the؛?
Register ٠/ Shipping : Statistical Tables (London),ءأ Lloyd’s !974.

40. The average size of different types o f existing ships and the average size of vesseis on order for 1974 as com pared with 1973 and 1972 are shown in table 9. I t can be seen th a t the tendency for the size of vessels—parti- cnlarly o f tankers and o f bnlk carriers—to increase in recent years persisted in 1974. Nevertheless, the da ta on the average size o f vessels on order in 1974 suggest th a t in the next few years the tendency to bnild even larger tankers and bulk carriers is likely to slow down.
41. The data on the average size of vessels in service do no t fully reflect the rapid and continuing changes in the actual size o f vessels built, particularly with regard to the distribution o f tonnage by si^e groups o f vessels. F or example, in 1974 abou t 52.3 per cent o f tanker tonnage was in the size group o f 80,000 dwt and above, as com pared with 47.2 per cent in 1973 and only 4 per cent in 1965. The share o f tanker tonnage o f 200,000 dwt and above increased from 30.6 per cent in 1973 to 36.1 per cent in 1974. Similar trends have been observed with regard to the size o f bulk carrier tonnage. In mid-19749.6 per cent o f the ore and bulk carrier tonnage and74.2 per cent o f the com bined carrier tonnage in service were in the size group o f 80,000 dwt and over as com pared w ith 8.6 per cent and 71.3 per cent, respectively, in 1973.
2. Trends in size ،٠
محمر،/ء’ء The discussion is based on data derived from ءأ Register ٠/ Shipping: Statistical Tables (London), corresponding issues uniess otherwise stated.
1. Trends in types
37. The long-term trend towards specialization of tonnage has continued in the period 1973-1974.
38. Table 8 shows in m ore detail the trends in the com position o f the world m erchant fleet by different types o f vessels from 1973 to 1974, and also in the period 197 -ه1974م I t can be seen from the table tha t there continues to be diversiflcation o f world tonnage in response to a growing dem and for specialized tonnage in world trade, and also in response to the necessity for carriers to seek versatility and/or efficiency through spe- cialization and adoption o f technological advances.
39. It can also be seen from the table th a t higher rates o f expansion have been recorded in 1974 for vehicle carriers, barge carriers, chemical carriers, combined carriers, oil tankers, and ore and bulk carriers, in tha t order. Surprisingly enough, the increase in liquefied gas carrier tonnage has been m oderate (6.1 per cent), while container ship tonnage increased by only 6.6 per cent as against a corresponding increase o f 36.9 per cent i^1973. The com inuing decline in the w orld tonnage of general cargo, miscellaneous cargo and passenger vessels is signiflcant. The decline in passenger tonnage is hkely to continue as vessels are retired because their operation is uneconomic a t current bunker prices.
c . Trends in types, size and age distributinn
the period 1970-1974
T a b l e 8
■by principal types i ا(In 1,000 grt)
Analysis “ o f worid ا
Percentagechange
1973Ц97419741973197219711970
14.7
129,4912,415
748122
57,40368,674
3816,291
115
53,110
574
ъьъ 666 17.8359 469 36.6
16,275 16,683 4.6
3,361 2,851 -1 3 .64,189 4,341 3.64,562 4,756 5.5
,؛146 96,141 165,129,356 1,622 1,887451 557 551
126;,317 16,673 15,673;,334 43,124 48,415,؛396 71,931 76,591
547,968 2,781 4,316
484
',864 9,637 9,626
,991 3,6623,787
,799 8,335 4,281
Oil tankers......................................................Liquefled^as carriers، . . . . . . . .€lremical carriers.........................................Miscellaneous tankers . . . . . . . . .Bulk/oil c a r r i e r s .........................................Ore and bulk carriers . . . . . . . . .Oeneral car^o (including passenger cargo) Miscellaneous cargo slri^s . . . . . . .?ontainer ships (fully cellular) . . . . .Barge-carrying vessels . . . . . . . . .Vehicle carriers .........................................Fishing factories and carriers 1 Fishing (including trawlers) رFassenger l i n e r s .........................................Ferries and other passenger• vessels . . . All other v e s s e l s » .....................................
Source: L lo yd ’s Register o fS h ip p in g : Sta tistica l Tables (L ondon), 1970-1974.٠ T he presented In th is tab le are n o t com parab le w ith the d a ta in tab les 4 and 5, because the U nited $ ta tes Reserve fleet and the U nited $ ta tes an d C anad ian
G rea t Lakes fleets are included in the d a ta in th is table.١١ T he term “l^ u efled gas carriers” refers to ships capable ٠٢ transporting i٩uل id na tu ra l gas (L N G ) o r liquid petro leum gas (L ?G ) o r o ther sin^ilar hydrocarbon and
chem ical products which a re all carried a t pressures g rea ter than atm osphere o r a t sub-am bient tem perature o r a com bination o f both.٠ Including livestock carriers, supply ships and tenders, tugs, cable ships, dredgers, icebreakers, research ships and others.

of world fleet by selected types of vessels, 1972-1974 ؛
T a b l e 9
Trends in
197419731972
Oil tankers of 100 grt and above in grt 16,270 17,460 19,083Equivalent average size in d w t 29,016 31,740 33,136Ore/bulk carriers of 6,000 grt and above (including bulk/oil
carriers) in g r t 20,830 21,990 22,733Equivalent average size in d w t 33,203 37,330 38,832©ontainer ships of 100 grt and above ط grt . . . . . . . 13,810 14,970 13,270Liquefled gas carriers in g r t 3,370 6,090 6,032All other ships of 100 grt and above ط g r t . . . . . . . . 1,980 1,920 1,870
Estimated average si^es oe vessels on order
A t end o f A t end o f A t end o f 1972 1973 1974
Estimates ٠/.•Tankers of 10,000 dwt and above in dNvt 163,720 170,370 162,414Ore/bulk carriers of 10,000 dwt and above in dwt . . . . . 63,020 33,830 33,209©ontainer ships in dwt (vessels of capacity of 300 or nrore
containers) 18,380 17,090 18,783Liquefled gas carriers in dwt (vessels of 12,000 dwt and over) 26,330 31,620 33,123All other ships of 1,000 grt and above in d w t . . . . . . . 9,670 9,820 10,497
Sources ; E x isting flee t; estim ated by the U N C T A Ü secretariat on the basis o r d a ta published in L lo yd 's Register ٠/ Shipping ا،ءك،،ء'،،محء ; Tables (L ondon), 1972-1974.
N ew O rders: estim ated by the U N C T A D secretaria t from d a ta given in Eearnley and Egers C hartering C o. L td., 1974 , ءء»ء ءء^ (Oslo, 1974), fo r oil tankers, bull، earriers an d o ther sh ips; size estim ates o f con tainer ships ' " gascarriers were based on data given in W orldSliips ٠« Order, supplem ent to >،؛،م«/م ء International Shipping Journal, N ovem ber issues o f years 1972-1974.
T able 10
distrlbutinn of world merchant flee! by type of vessel as at 1 July !974 ؛(Percentage o f total tonnage (grt) o f each group)
) years Id over
5-9 10-14years years
0-4yearsType o f vessel Total
2219
14
29
30 27
18
21201030
World t o t a l .......................................................... All vesselsTankers ^ulk carriers
©eveloped market-economy countries (ex- eluding southern Europe) . . . . . . . All vessels
Tankers Bulk carriers
Southern E u ro p e ..................................................All vesselsTankers Bulk carriers
Open registry c o u n tr ie s ......................................All vesselsTankers Bulk carriers
Total of all three g roups......................................All vesselsTankers Bulk carriers
Socialist countries of Eastern Europe andA sia.......................................................................All vessels
Tankers Bulk carriers
Oeveloping countries * ......................................All vesselsTankers Bulk carriers
Source: L lo yd ’s o f Shipping : Statistical Tables (L ondon), 1974, and supplem entary info rm ation provided totire seeretariat o f U N C T A D by L loyd’s Register o f Shipping.
* T he data fo r the age d is tribution o f developing countries refer to all developing countries an d hence are n o t com - parable w ith the d a ta presented in Review o f m aritim e transport, 1972-1973 (op. cit.)y tab le 11.
!4

9 and 19 per cent, respective!)?, tbe figures for 1973 being 9 and per cent.
48. Gomparlng the age distribution for tankers o f the various groups o f countries. It can be seen th a t the tankers o f developed m arket-есопош)? countries and o f open registry countries tend to be m uch younger than those o f any other group o f countries. The m ain reason for this can be found In the com position o f sizes of tankers operated under the fiag o f countries o f these groups. While developed m arket-econom y countries and countries o f open registry Operate a large fieet of U LCCs and VLCCs, which tend to be relatively new, the partiel- potion o f the other groups o f co u n tie s In these types of vessels Is relatively small, especially In the case o f the socialist countries of Eastern Europe and Asia, where only 13 per cent of the tanker fieet Is less than five years old.
49. The point m ade regarding tankers Is to a large extent also valid for bulk carriers. The newest and largest vessels are owned mainly by developed m arket- economy countries, thus explaining the exceptionally high share o f 53 per cent for bulk carriers in the age bracket o f under five years owned by those countries. The share o f bulk carriers in this age group is 45 per cent In southern European countries, 42 per cent in open registry countries, 44 per cent in developing countries and 28 per cent in socialist countries o f Eastern Europe and Asia. Owing to the comparatively late emergence o f specialized bulk carriers, only very small proportions o f bulk carriers are in the age group o f 15 years o r over.
50. Oomparing the age distribution o f the fieets o f developing countries w ith tha t o f the to tal world fieet, it can be seen tha t the developing countries’ fieets are substantially older. This occurs in spite o f the very favourable age com position o f their bulk carrier tonnage and the relatively good age com position o f their tanker tonnage. Gbviously it is the age com position o f other than bulk carrier and tanker tonnage, in which general cargo tonnage is included, which creates this unfavour- able picture.
D. The productivity of shipping space
51. The development o f productivity o f tankers o f10,000 dw t and above and of bulk carriers o f 18,000 dw t and above m easured by the num ber o f ton-miles of cargo carried per year per deadweight ton o f the existing active fieet is given in tables 11 and 12.
52. There was a tendency for tanker productivity to increase in 1973, when it rose by 4 points relative to 1972, while bulk carriers productivity rem ained un- changed. This tendency is unlikely to persist in 1974, in view o f the corrective action taken by tanker operators in response to the reduced dem and for tanker tonnage resulting from the new energy situation. ١®
53. I t is no t possible to com pute productivity figures for the total world fieet similar to those for oil tankers and bulk carriers. Table 13, however, gives an index based on the num ber o f tons of cargo carried per dw t o f the total world fieet. After• having dropped in 1972 to the
42. The age distribution o f the world m erchant fieet in mid-1974 by groups o f countries and by type o f vessel is shown in table 10. I t can be observed that the rela- tively younger fieets are to be found in developed m arket- economy countries.
43. In the period 1973-1974 the age com position o f the world fieet rem ained fairly constant, © f total world tonnage, in 1974 38 per cent was less than five years old as against 39 per cent in 1973.١؛ The share o f tonnage in the age bracket o f 15 years and over increased slightly from 21 per cent in 1973 to 22 per cent in 1974.
44. In 1974, as in previous years, the tonnage registered under the fiags o f developed market-econom y countries had the largest proporfion o f vessels less ^ a n five years old. As in 1973,45 per cent of the fieets o f these countries were in this age bracket. A t the other end o f the scale,i.e., vessels o f 15 years or older, 14 per cent in 1974 (15 per cent in 1973) o f the tonnage under the fiags of developed m arket-econom y countries was in this age bracket. I t can also be seen, however, th a t the age com position o f the fieets o f developed m arket-economy countries diners significantly from the age composition o f fieets o f southern European countries and o f those sailing under the fiags o f open registry countries, ©nly 31 per cent o f the fieets o f southern European countries and 37 per cent o f the fieets o f open registry countries were less than five years old. ©n the o ther hand, 31 percen t o f the tonnage under fiags o f countries o f southern Europe and 2ه per cent o f tonnage under fiags o f open registry countries were 15 years or older. I t appears th a t the reason for the significant di^erences in the age com position o f the tonnage registered in developed market-econom y countries on the one hand and in the countries o f southern Europe and o f open registry countries on the other may be due to the fact tha t the latter countries have com parably lower labour costs, thus enabling owners to m aintain under these fiags older vessels—which are labour intensive—in operation.
45. In 1974, only 23 per cent o f the fieets o f socialist countries o f Eastern Europe and Asia were below five years o f age as com pared with 27 per cent in 1973 and 38 per cent o f the world average, ©n the o ther hand, 21 per cent o f the tonnage o f this group o f countries were 15 years or older as against 18 per cent in 1973.
46. Finally, 3ه per cent o f the fieets o f developing countries were less than five years old, which is substan- tially smaller than the world average (38 per cent), while 30 per cent o f their tonnage belonged to the bracket of 15 years and over, which again was much less favourable than the world average (22 per cent).
47. W ith regard to the age com position o f di^erent types o f vessels it can be seen th a t 47 per cent o f bulk carrier tonnage is under five years o f age (48 per cent in 1973) while the percentage for tankers in this age bracket was 43 per cent in 1974 (42 per cent in 1973). ©n the other hand, the share o f bulk carriers and tankers o f 15 years or older on the corresponding to tal fieets was
3. Trends in age distribution
١٠ See para. 137 below.
١٠ ^ o r 1973 figures used rhroughou؛ the discussion in this sub- seetion, see Review ٠/ maritime transport, 1972-1973 (op. ءء'ء.ر , table 11.

T able
Estimated ton-miles of oil shipments per dwt, in 1962-1973, by oi! tankers “ of 10,000 dwt and abo^e ء
Index o f activeflee t
productivity (1962-=100)
Ton-miles per active
(in thousands)
Totalactive
(million dw t)
Total
(million dw t)
Estim atedton-miles
o fo illgra inshipments(thousand
millionton-miles)
Totaloiljgrain
shipmentsGrain
shipmentsO il
shipments(million tons) (million tons) (million tons)Year
Source ; C om piled o n the basis o f F earn ley an d Egers C hartering Co. E td ., Review, 1974 and World B ulk Trades, 1973 (Oslo, 1974).٠ E stim ated grain shipm ents in ton-m iles have been included.Since oil an ء d grain shipm ents o f oil tankers—e.g. excluding com bined carriers—only are taken in to consideration, the figures are n o t directly com parable to those
recorded in Review o fm a ritim e transport, 1972-1973 (op. c it.) , tab le 12, a lthough the trend d id n o t change.٠ Revised figures.
Table
Estimated ton-miles of bulk commodities carried per dwt,، between 1967 and 1975 by bulk carriers, including bulk/oil carriers of 18,000 dwt and above
Total Ton-miles Index o factive p e r active a c tive flee tءءءم dw t productivity
Total
Estim ated ton-miles ٠/ bulk cargo
carried, including ٠//
(thousand million
Total bulk ٠٠^٠٠٢ including ٠//B ulk cargo ٠ // cargo
(million tons) (million tons) (million tons) ton-miles) (million dw t) b (m illion dw t) (in thousands) (1960 = 100)Year
1,330 33.2 33.2 40.1 1191,903 44.0 44.0 43.3 1282,2^5 53.3 53.3 41.7 1^32,636 ة2.2 62.2 42.4 1253,043 72.8 72.5 42.0 1243,632“ 87.9 86.6 42.0 1244,411 106.1 105.4 41.9 124
ج433500555
779
29أة549 7
166
374439
613
967.968.969.970.971.972.973.
«٨٨ 1970; an d W orld B ulk Trades, 1973 (Oslo, 1974),
.Revised figure ء
Sources ; Com piled on ؛١١؟ basis o f Fearnley an d Egers C hartering Co. L td., Trades ٠/ W orld B ulk Carriers, 19fi9 ١ o n info rm ation com m unicated by th e source to t^ e U N C T A D secretariat.
“ Including oil cargoes in com bined carriers. ، M id-year figures. ٠ Estim ated by the U N C T A D seeretariat.
E. Tonnage on order
1. General
54. During the 12-month ^er!o،f ending oh 31 O ctober 1974, world tonnage on order increased by 2.3 million dwt or by 0.9 per cent as com pared with an increase o f 87.4 million dwt or 51.3 per cent in the corresponding period ending on 31 October 1973. The changes in tonnage on order between 31 October 1973 and 31 Oc- tober 1974 are given b e lo w أ-ل:
ء/-مح Compiled on the basis of ءأ ام Ships ٠« ءءمح-ءم ■, supple-ment to Fairplay International Shipping مر«ا-س / (London), various issues.
lowest level r e o rd e d since 1961, the index recovered slightly and rose in 1973 to 1^5 points.
T a b le ! 3 • dwt of world fleet, 1967-1973Cargo carried ا
Cargo carriedW orld flee t ء Total carried cargo دا per dw t Index
Year (million dw t) (million m etric tons) (m etric tons) (1960 = 100)
1,910 7.92 1162,107 8.04 1172,312 8.02 1172,605 8.00 1172.697 7.38 108
2,866 ء 7.08 1033,190 7.17 105
240.9
404.2444.6
967.
970. 971 ;
973.
figure.T ا aken f™ m tabie 4. ٠ T aken from tabie :
16

Bulkcarriers
(includingA ll Change Change combined Change Other Change
ships (per cent) Tankers (per ء«ءء ءءم) (carriers ر • cent) ships (per cent)
2.9 +
+ .!و
+ 4.ء
6.1 +
16.4
16.7
10.9
11.4-0 .3
8.4
8.4
6.4
+ 2.0
36.3
219.9
223.7
218.0
211.8
+ 4.1
+ 1.7
-2 .6
257.9
273.0
Tonnage on order as ٠؛ ;
31 1973. .
31 January 1974 . .
30 April 1 9 7 4 . . .
31 July 1974. ٠ . .
31 October 1974 . .
the above groups o f coutitrles, the share o f the flags o f the three groups combined would am ount to 89.1 per cent for 1974, 9^.9 in 1973 and 9^.3 per cent in 1972.
59. Table 14 also shows that, in relation to the dis- ffibution o f tonnage on order by vessel type, there h^ve been some changes for the combined group o f flags of developed m arket economy countries, countries of southern Europe, open registry countries and “flag not yet ^now n”. While the share o f this combined group for tankers over 150,000 dwt showed a slight decrease from 97.2 per cent in 1973 to 94.2 per cent in 1974, their share o f tankers in the size group under 150,000 dwt increased further to 85 ة. per cent in 1974 as com pared with 84.6 per cent in 1973. Their share in ore/oil and ore/bulk/oil carriers decreased further to 80.2 per cent as com pared with 82.3 per cent in 1973.
60. The decline in the combined share o f the three groups o f countries in container tonnage in 1973 was reversed in 1974, when this group o f countries accounted for 82.6 per cent as com pared with 74.3 per cent in 1973.
61. The share o f the socialist countries o f Eastern Europe and Asia in tonnage on order was 3.6 per cent in 1974 as com pared with 4.2 per cent in 1973 and 4.8 per cent in 1972. Uowever, there is an uneven distribution according to types of vessel. While p a rt container ships ordered by these countries accounted for 25.9 per cent of to tal world tonnage on order o f this type, tankers of over 150,000 dwt and bulk carriers accounted for only 0.9 and 4 per cent respectively o f the respective total world tonnage on order. The corresponding flgures for 1973 were 33.7, 0.8 and 8 per cent.
62. There were some noticeable changes the share of developing countries in tonnage on order in 1974. The developments within the different types o f vessels are given below:
1971 1972 1973 1974
Oil tankers above 150,000 dwt . . . . . 0.8 0.5 1.8 4.8Oil tankers under 150,000 d w ،. . . . . 7.2 9.4 5.1 6.9Ore/nil and nre/bulk/nil carriers . . . . 4.3 6.7 15.4 16.4Offier bulk carriers 6.5 9.2 10.4 9.9Full container s h i p s 1.5 1.5 1.5 1.0Fart container s b i p s 11.1 8.4 12.4 22.2Other dry cargo ships. . . . . . . . . 12.7 19.0 17.7 19.8
I t can be seen from these data tha t some signiflcant changes occurred in the shares o f developing countries by types o f vessels on order. Their continuing prefer- ence for liner type vessels is noticeable, bu t the increase
55. It can be seen from the data above tha t the over- all increase in total tonnage on order between October 1973 and October 1974 did no t follow a steady pattern. Ouring the quarter ending on 31 lanuary 1974 there was an increase o f 1 5 ه. million dw t (4.1 per cent), bu t in the following quarter there was a distinct slowing down in the rate o f increase which declined to 1.7 per cent. This declining tre^d persisted during the next two quarters, ending on 31 July and 31 October 1974 respectively, during which total tonnage on order also declined in absolute terms.
56. The volume o f tonnage ordered in the third quarter o f 1974 declined to the lowest level recorded since the quarter ending in September 1972. M oreover, the volume of tonnage delivered exceeded new orders in the second and th ird quarters o f 1974. This points to a distinct slowing down in future shipbuilding acti- vities. ءل
57. The absolute decline in tonnage on order that has been observed since the quarter ending in July 1974 was caused by a decline in the order books for both tankers and bulk carriers (including com bined carriers). By further differentiating between various sizes and types o f vessels it may be observed th a t in the case of tankers there was a decline in the size group o f 150,000 dw t and over, while the tonnage in the size group under150,000 dw t showed a steady increase. Uowever, this increase was no t strong enough to offset the decrease in orders for larger-sized tankers. In the case o f bulk carriers (including combined carriers), the decline was due to decreasing orders for com bined carriers.ل ء
2. Distribution o f tonnage by groups ٠/ countries
58. It can be seen from table 14 tha t the flags of developed m arket economy countries, countries of southern Europe and open registry countries taken as a group accounted for 85 per cent o f tonnage on order on 31 G ctober 1974, as com pared with 84.2 per cent in 1973 and 83 per cent in 1972. The percentage on order recorded under “flags no t yet know n” for each o f the corresponding years was 4.1 per cent, 6.7 per cent and7.3 per cent respectively. Assuming th a t the tonnage recorded under “flags no t yet know n” is for owners in
Lloyd's Register o ءأ fSh ipp ing: Merchant Shipbuilding ^ ،،؛٢ « (London), several Issnes.
١٠ For farther dis№ssion of these points, see chap. !٧ below.
17
T a b l e
on order at at 31 October, 1970-1974World 1 ؛
Tankers Tankers O reloil and Full PartISO,ООО dwt under orefbulkloil O ther bulk container container Other ٢٠ ^
and over 150,000 dwt carriers carriers ships ships cargo ships ءYear A ll shipsGroups o f countries
10.1 ь2.7 4.4
4.0
20.S8.0
2ل.22و.ل
7.0
20.026.219.5
(In million dwt)
11.716ؤ
52.7 62.6
65.587.093.7
155.9149.2
132.0171.6170.5
260.2
19701971197219731974
World total
7.7،4.02.0
2.4
2.9 ه
1.10.50.7
16.3
9.710.4
(In percentage share by type o f vessel)
11.45.4
14.820.424.1
49.650.7 55.0 60.5
197© 1001971 1001972 1001973 1001974 100
World total
(Percentage share ٠/ ٠٧٠٢ ^ tonnage by groups ofcountries)
39.732.8 32.2
6.017.720.5
4.6
29.9^3.818.3
19.017.719.8
5.04.6
1o!40.5
2.7
0.3
32.422.024.0
4.8
3.0
17.826.3 25.6
33.1
25.2
8.412.422.2
0.52.4
4.4
i؛:
78.562.6
3.011.7
14.224.2 16.4
1.0
1.0
;ة
22.222.1
7.58.06.7
4.0
1ء4
7.27 7
0.5
0.90.5
9.08.4
4 4
16.4
2.03.7 7 7
4.7 11.7
2.9
5.1
52.343.939.2
25.634.4
8.09.2
9.4
1.0
4.52.44.2
1.71.4
5.44.5
؛:؛
25.3
36.2
4.08.47.2
0.80وم
0.5
4.8
0.30.5
0.30.9
10.8
4.7
0.20.1
56.و47.6
20.6
87
4.8ت4.24.5
0.30.30.6
2.54.4
1.7
7.3
4.1
0.50.40.4
972973974
972973974
973974
972973974
973974
973974
972973974
972973974
Developed market-economy countries (excluding southern Europe) . . . . . . . . . .
Dpen registry countries: Eiberia, Panama, Cyprus, Somalia, Singapore . . . . . . . . .
Southern Europe . ٠ ٠ . . . .
Socialist countries 0 Eastern Europe and Asia . . . . . .
Developing countries—total . .
O f which: in Africa . . . . ٠ . . ٠ ٠
Asia . . . . . . . . . .
in Latin America and the Caribbean . . . . . . . .
?lag not yet known . . . . .
Dther—unallocated . . . . . .
Source: C om piled from W orld Ships ٠« Order, supplem ent to Fairplay Internatiorml Shipping Journal (London), N ovem ber issues 0( 1970-1974. Including general cargD vessels, barge carrying vessels, R ء o /R o vessels, vehicle carriers, pallet ships and ©thers.١١ Including p a r t cpn ta iner ships.
18

63. A n im portant increase has been recorded in the share o f developing countries in oi! tankers o f 150,000 dwt and above, while their share in oil tanker tonnage nnder150.000 dwt has also increased bu t a t a m uch slower rate. T e s e developments give evidence o f the efforts o f oil producing countries to expand their activities in the carriage o f the oil trade which they generate themselves. Indeed, K uw ait accounts fo r about 40 per cent o f the developing countries’ share o f tankers o f m ore than150.000 dw t on order, and for about 27 per cent o f all tankers on order for developing countries (11.4 mil- lion dwt), while Iraq accounts for 14.6 per cent, the Libyan A rab Republic for 6.6 per cent and Iran for 4 per 06لق.مح
in their share o f p art container ships on order (22.2 per cent in 1974 as com pared w ith 12.4 per cent in 1973) is indicative o f a move tow ards m ore m odern types of vessels, ^ i t h regard to the combined (ore/oil and ore/bulk/oil) carrier tonnage on order, the share of developing countries has increased to 16.4 per cent in 1974 as com pared with 15.4 per cent in 1973. Further inform ation available ؛٠ shows th a t India and Brazil accounted for slightly m ore than 90 per cent o f this tonnage. The trade o f both countries appears to offer good chances for combined operations which could help them to reduce their transport costs, particularly for products such as iron ore.
.Ibid ؛١،World Ships ٠« اءمح-ءم ■; Fairplay International Shipping
Journal (London), No. 41 (November 1974).
19

Chapter III
WORLD SHIP PRICES AND THE FLEETS OF DEYELOPINC COUNTRIES
to the levels they reached in 1973, also In 197ه , particularly for the types o f vessels m ost in dem and. '
67. A dditional evidence regarding the course of shipbuilding prices in the hrst half o f 1974 as eom pared with December 1973 for vessels seheduled for delivery in :can be found below ؛؛؛؛ 1976
D ecember JuneSize 1973 1974 Percentage(dw t) (thousands o f pounds sterling) change
16.000 3,000 4,20016.000 2,500 3,00028.000 4,000 4,500
100,000 11,000 12,000170,000 18,000 20,000
Ore/oil . . . . . . 120,000 14,000 16,000Tanker . . . . . . 250,000 18,000 22,000Container ship (30"/o
ree^ r container) . 2 5 ,0 0 0 13 ,5 0 0 20 ,0 0 0
40.020.0
9.011.114.322.2
Vessel type
Dry cargo . . Bulk carrier . . Bulk carrier . . Bulk carrier . . Dre/bulk/oii .
68. A ttention should be drawn to the fact tha t prices for different types o f vessels developed d i^ re n tly . Prices increased much faster for dry cargo and container ships than for bulk earriers and tankers, and the di№ rence in price movements within the last two categories of vessels cannot easily be explained on the basis o f eons- truction costs alone.
69. Tahle 16 shows the evolution o f new huilding prices for liner-type vessels ءء from 1967 to 1974. I t is signihcant tha t from 1973 to 1974, when there was a very
Extracted from Fairplay International Shipping Weekly (Eondon), vol. 252, No. 4714 (4 3uly 1974).
-The Fairplay data refer to a hypothetieal closed/open shelter ءءdecker o f 11,000/15,000 dwt, propelled by a 7,000 b.h.p. diesel engine giving a speed of 15 knots. The ship is for delivery within the year and the quoted price does not include interest on loans.
A. Changes in priees of new vessels
64. Bhipbnilding prices rose further in 1974 but the rates o f increase differed widely for different classes and sizes o f vessels. Table 15 gives the development of prices from 1967 to 1974 for tankers and bulk earriers (including combined earriers), based on actual contracts.
65. I t can be seen from tahle 15 tha t prices in United $tates dollars for all except the very large crude earriers rose farther in 1974, bu t a t a much slower paee than in1973, while prices in U nited States dollars for VLCCs deelined by slightly m ore than 1 ه per eent. As contracts are usually made in the currency o f the country o f build nowadays, the expression o f the contract prices in United States dollars makes it very difficult to know the extent to which the price changes shown are due to changing eosts or to changes in exchange rates.
66. The high rates o f inflation in m ost shiphuiiding countries have nndouhtedly had their im pact on the evolution o f shipbuilding prices in recent years. In addition to inflationary pressures, the boom in the dem and fo r ships exerted pressure on steel prices and thus eontrlbuted to rising eosts. However, the sharp increases in shipbuilding prices in the last few years should no t be seen solely in the light o f world-wide inflation and rising eosts, bu t should also be ' 'in conjunction with the fact tha t since 1969 shipyards have been fully booked for a num ber o f years ahead, thus enabling shipbuilders to take advantage o f a very tight supply situation. The very strong freight m arket eondi- tions in 1973, which eontinned during the flrst ha lf o f1974, with regard to varions types o f tonnage created a sharp dem and for new buildings. U nder such conditions it is no t surprising tha t shipbuilding prices were pushed
T a b l e 15
Representative new building prices for buik carriers and tankers, f96?-19?4 *(Prices in millions ofdollars at year لمح«ء
1974197319721971197019691967
16.5
42هم
12.م25.929.047.0
7.515.0
2ل.031.0
5.4
ة17.323.031.0
18,000dwtbu]k . . . . 3.8 4.3 4.630, س4^ا bulk . . . . 4.9 5.4 5.787,000 dwt tanker . . . 9.0 9.4 10.096,000 dwt D B D . . . . 10.0 11.0 12.0210,000 dwt tanker . . . 14.7 16.6 19.0
.17 tab le :Source: Fearn ley an d Egers C hartering c©. L td., Review, 1974 (C slo, 1974).* F o r the years 1963-1966, see Review o fm a r itim e transport, 1972-1973 (op. ،
20

steel prices. Generally, steelmakers felt uncertain about tire industry’s prospects in 1975 ءء and there appears to be little doubt tha t the boom in the steel industry and steel prices have reached their peak. I t is for such reasons th a t certain observers felt th a t there would soon be a return to fixed prices for building berths rem aining open for 1976-1977. ءء
В. Changes In prices of second-hand vessels
The course o مه7 f prices for second-hand, tanker, bulk carrier and liner type vessels is given in tables 17, 18 and 19 respectively.
71. © uring 197d the m arket for second-hand tonnage has been characterized by significant di^erences in the level of activity, depending both on the time o f transaction and on the type o f tonnage. Generally, there has been a relatively limited am ount o f tonnage for sale, particular- ly in the case of bulk carriers and shelter-deckers, the dem and for which has rem ained a t very high levels. ءء
7^. By com paring the data given in tables 17, 18 and 19 with the data on the development o f freight rates given in chapter ٧ it can be see© th a t the prices o f second- hand vessels are strongly infiuenced by movements in the levels of freight rates. أء ?rices for all types and sizes of tankers had fallen sharply by theen d o f 197d as com pared with 1978, whereas for bulk carriers they had remained stable and for liner type vessels had further increased. I t can be observed from tables 20 and 21 th a t the prices for bulk carriers o f 88,000 dwt and shelter-deckers of
؛٠ See M etal Bulletin ; World Steel and Metal News (London), No. 5933 (18 October 1974), p. 31, where the annual meeting of the International Iron and Steel Institute is reviewed.
٠٠ See Lloyd’s List (London), 5 November 1974, p. 3, where a report by the Norwegian firm p .p . Bassoe A /s is reviewed.
Shipping World and Shipbuilder (London), vol. 167, No. 3895 ءء(July 1974).
Bowever, in the short term this link may be somewhat less أءclear than it is in the long term.
high dem and for this type o f vessel, the increase in prices is estim ated a t 55 per cent. Such a high percentage cannot be explained w ithout including the boom in the dry cargo freight m arket (see table 28) as the m ost im portant causal factor. T hat current levels o f ship- building prices have been strongly infiuenced also by m arket factors is further supported by the evidence (table 15) th a t shipbuilding prices for ¥LC G s dropped a t the end o f 1974 despite accelerating infiation pressures.
T able 16
Estimated prices for new and ready liner-type vesseis 11,000/13,000 dwt, 1967-1974
ClosedP rices fo r shelter-
constructing deckernew vessels per dw t Change
(pounds sterling) (percentage)
M id-Y ear
.................................................. 1,095,500 84.25
. . . . . . . . . . . . . 1,165,000 89.606ام
- - 1,200,000 92.103,ا
................................................. 1,350,000 100.80
1,600,000 . ٠ . . . . . . . . . ٠ . 123.0018.:
- - - - - - - - - - - - - 1,900,000 146.1518.:
. . . . . . . . . . . . . 2,250,000 165.3818..
3,500,000 . ٠ . ٠ . ٠ ٠ . . . . . . 269.2355..
Source: Fairplay International Shipping Journal (L ondon), m id-year issue, ; July 1972, ^8id-year issue, 5 July 197$ an d m id-year issue, 4 July 1974.
Gn the other hand, cancellations o f new orders o f drop- ping o f berth reservations, leaving gaps in the production program m es, particularly o f medium-size yards, tend to ease dem and for steel and this in its tu rn should infiuence
T able 17
Tankers: second-hand prices, average values/ ء-ءم'ءءء in millions همح/م،//ءأ-ء at end ofyear)
dwt Built 1970 1971 1972 ل/ءا 1974
15/16,000 ............................. . . . . . . 1951/52 0.9 0.5 0.4 1.5 0.518,س................................. . . . . . . 1952/53 1.ت 0.8 0.7 1.9
19/20,000 ............................. . . . . . . 1959/60 3.3 2.0 2.0 4.025,000 ................................. . . . . . . 1958/59 4.0 2 2 >(.؟،2. .2
35,000 ................................. . . . . . . 1958/59 6.0 3 .5 3 .5 7 .5 3.550,000 ................................. . . . . . . 1963/64 10.0 7.0 6.0 13.060,000 ................................. . . . . . . 1964/65 12.0 8.5 7.5 16.080,000 ................................. . . . . . . 1966/67 19.0 12.0 10.5 25.0100,000 ................................. . . . . . . 1967/68 26.0 16.0 13.5 30.0 11.0200,000 ................................. . . . . . . 1969/70 40-45 30.0 30.0 52.0 23.0
٠ ٠ ٠ . ٠ ٠ . . ٠ 300,000 . . . . . . 1971/72 - -42.0 78.0 36.0
Source: Fearnley and Egers C hartering Co. L td ., Review, 1974 (Cslo, 1974).N o te : T he ^riee$ are m arket-value estim ates a t existing exchange rates fo r a charter■!
and w ith fairly p ro m p t delivery on cash basis.tan ؛ k er in good condition

Dry bulk carriers: second-hand prices, average vaines(Prices in millions o f dollars ٠؛ end o fyear)
T a b l e 18
1969dwtم/ءا1972 197419731971
7.29.0
13.017.0
11.517.0
3.1 4.13.7 4.95.7 7.0
4.86.09.0
11.0
963 2.1
965 4.0967 5.0 5.2972 — —
4.2
18,00025,000
35,س50.00060.000
Source: A s fo r tab le 17.N ote : T he prices a re m arket-value estim ates a t existing exchange rates fo r a charter-fi
w ith fairly p ro m p t delivery on cash basis. Bulk carriers o f 50,000 dw t and over are gearvessel in good condition ؛ and
T able 19
Liner-type vessels: second-hand pvlces, average vaines (Prices in millions ofdollars at end o f year)
1973 1974
3.4
1972197119701969Builtdwt
0.77 0.79 1.0 0.89 0.88 1958 6,6000.95 0.85 1.5 1.4 1.4 1956 . . ٠ . . . . . 1ة50م ٠ ٠ .
1.40 1.2 1.7 1.6 1.6 1959 13,5002.50 2.3 3.0 2.8 2.4 1963 16,000
Source: ^ s fo r tab le 1?.N o te : T he prices are m arket-vaiue estim ates a t existing exchange rates fo r a charter-ft
w ith fairly p rom p t delivery on cash basis.Î vessel in good condition and
T able 20
The course of the estimated h-eight rates * and second-hand values for a 38,000 dwt bulk carrier built in 1966
(1,650,000/1,750,000 cubic feet with cranes)(Values in thousands ofdollars)
197419731972
Freight rate (dollars) Value
9.4009.400
11,000 11,00011.50011.500
ValueFreight rate
(س،،/رءأFreight rate
(doiiars) Value
6.206.25
6.50 7.106.50
5.400 6,9006.4006.500 7,0007.500
4.204.204.504.50
5.40July . . . . . . ٠٠ . . . . . 1.65 3,300 5.80 8,100 5.50 11,000August . . . . . . . . . . . 2.10 3,600 6.50 8,500 5.50 10,500Septenrber . . . . . . . . . . 3.00 4,000 7.00 8,650 5.75 9,750October - - - - - - - . . . . 3.65 5,000 6.75 8,650 5.85 9,750Novenrber - - - - - - . . . . 3.45 4,900 6.00 9,500 6.00 9,750December - - - - - - . . . . 3.85 5,000 6.20 9,500 5.50 9,750
A s ،،/ end ٠/;
January , February March . , April. . May . ٠ Ju n e . .
Source: V arious issues o f “Sale and purchase m onth ly rep o rt fo r ^ a y 1973” , published by R . s. ؟ la ton ٨ /$ (Gslo) ٠ Bstim ated ra te fo r 1^-m onth tim e charter pe r dw t per m o n th .
22

Estimated developments of freight rates * and vaines for a good-class 10,500/12,500 dwt sheiter-deci،er(Values in thousands ofdollars)
T a b l e 21
1974
Values fo r vessels built in
I960
Freightrate
1973
Values fo r vessels built in
1960 (dollars) 1956
Freightrate
(dollars) 1956
1972
Values fo r vessels built in
56 1960
Freightrate
(dollars)l o f :A s at <
2.5002.500 2,6503.0003.2003.2003.1003.0003.0003.1003.500 3,400
1.7001.700 1,850 2,0002.4002.4002.300 2,200 2,2002.3002.400 ^,300
8.50 8.00 9.00
10.0010.7510.50 10.001 0 .0 0
10.5010.50 10.2510.00
1,5001,700
1,8002,1002,1502.3002.300 2,450 2,600 2,600 2,550
1,2001,2001,3501,4001.5001.500 1,600 1,800 1,800 1,750
5.50 6.00 6.10 6.10 6.10 6.40 6.70 6.907.507.50 8.00 8.00
0»r3؛؛,
1,2001,1501,1001,1001,100
1,4001.4501.450
800800750725725725725850900900
Jan u ary .................................................................. 3.50F e b ru a r y .............................................................. 3.40M a r c h .................................................................. 3.30A p r i l ...................................................................... 3.30M a y ...................................................................... 3.20J u n e ...................................................................... 3.30J u l y ...................................................................... 3.30A u g u s t .................................................................. 3.30S e p te m b e r .......................................................... 3.40October .............................................................. 3.65N o v e m b e r .......................................................... 4.60D ecem ber.............................................................. 5.00
Source : A s fo r tab le 20.٠ Estim ated ra te fo r 12-m onth tim e eharter.
might be created by the reopening o f the Suez Ganal. G ther factors affecting the dem and fo r vessels o f this size group are discussed in paragraph 110 below.
75. The extent to which interest in the different types and sizes o f vessels varies is reflected in the prices fo r the corresponding types o f tonnage. F o r instance, as is shown in table 17, p^ces for tankers o f the size groups 200,000-299,000 dwt and 200,000 dw t dropped further below their 1972 levels than could be accounted fo r by greater age, while prices for tanlcers in the 50,000-100,000 dwt size gronps were around their 1972 levels and those for smaller sizes rem ained a t higher levels than in 1972. These price developments appear to he very m uch in line with the movements in tanker freight rates n 1974 described in chapter V below.
c. Acquisition of new and seeond-hand vessels by developing countries او
7b. Inform ation regarding the to tal additions o f newly bnilt and second-hand vessels to the m erchant fleets o f developing countries in 1972 is given in table 22. T otal gross additions to these fleets am ounted to 192 ships, aggregating 2 million dwt.®^
77. ^ixty-eight newly built vessels aggregating 1.9 mil- lion dwt were acquired in 1972 by developing countries, as com pared with 72 vessels o f 1.1 million dw t in 1972. As in previous years the new vessels were mainly acquired
٠١ The discussion in this section is based on data communicated to the N N €TA D secretariat by the N n i^d States Department of €ommerce، Maritime Administration.
٠٠ Since information re^ardin^ the acquisition of new and second- hand vessels by developing countries in 4?9ل is not yet avaiiable, some scattered information which has been extracted from published sources Is given in paragraph 90-99 below.
10,500/12,500 dwt reached very high levels during the first half o f the year when freight rates also reached their highest levels, and as the dry cargo freight m arkets rem ained firm till the late m onths o f the year, prices of these vessels also rem ained firm, although a t lower than the peak levels reached during the flrst ha lf o f the year.
72. The m arket for second-hand tanker tonnage developed quite differently. The weakness o f the tanker freight m arkets, coupled w ith uncertainty regarding the prospects for these m arkets and difficulties in the inter- national m arket capital, exercised a downward pressure on dem and for second-hand tankers from the early m onths o f the year. This pressure was conseqnentiy ffilt in the prices paid for such vessels. I t appears tha t the expected reopening o f the Suez Canal has also caused some hesitancy am ong potential bnyers.
74 W ithin each broad sector o f the second-hand tonnage m arket (tankers, bnlk carriers, etc.), particular dem and conditions and different levels o f prices are found, depending again on the corresponding dem and conditions in the freight m arkets. F o r instance, the dem and fo r dry cargo tonnage has been particularly concentrated on shelter-deck tonnage which coffid also be ns^d in liner trades where boom conditions prevailed th roughou t the year, and on bnlk tonnage in the Fanam ax60.000 dwt ٠٠ size range which has been considered ad- vantageous in the light o f the expected reopening o f the Suez Canal. ٠٠ In addition, dem and for tankers o f up to150.000 dw t ٠٠ has been stronger than for ATCCs, and this may also reflect the new m arket conditions which
the Panama Canalwhieh ean٠٠ Maximum size ه ( VI
٠٠ Shipping World and Shipbuilder (London), vol. 167, No. : July 1974.
٠٠ /ء؛ممح
22

Changes in the ocean-going merchant fleets of developing eoantries in 1973:، of new and seeond-hand ships hy type of vessei—oeean-going ships of 1,000 grt and over
(In number o f ships and 1,000 dwt)
T a b l e 22
س/م'/ااء;
O ther ships
N um ber dwt
FreightersB ulk carriers
dw t N um ber dwtN um ber
TankersA ll ships
N um ber dw tdwtNumber
30987
49
4
?٨?
35
29
17
56181
970496
20571
21010
474
102137235
ة3212076
30
30
11
7 149
13 4756 59
3 47
3 12
7 416
( - ! ) * 18
916
206
17136
978
1810
23
.إ
1,062
ء 3,ة810
215
14,؛217
153,315749
New b u ild in g s 68Flag changes 104Gther additions 20G r o s s a d d i t i o n s 192D e d u c t i o n s 101
o f which:
losses ! ! : 1 ت ! : : : !ت ! 8 serappings 39
Other d ednc tions 7
N e t A D D IT IO N S 91
o f which:in A f r i c a 19in A s i ^ 36in Latin America and C a r ib b e a n 36
Source ; Com piled from data on tonnage additions and deductions w hich were m ade available to the U N C T A D secretaria t by the U nited S tates D ep artm en t o f Com - merce, M aritim e A dm inistration.
٠ T he m inus sign indicates net deductions in the num ber o f vessels, which does n o t necessarily lead to a deduction in tonnage, because o f the increased size o f the vessels added to the fleet.
80. By com paring the in fo raa tio n given in table 22 w ith the coTTCsponding Bata for 19?2 وء it can be seen th a t there have been noticeable changes in the type anB size com position o f the net aBBitions to the fleets o f Beveloping countries. F o r instance, in 1973 o f tankers1.2 million Bwt anB bulk carriers o f 0.5 miiiion Bwt were acquircB, as comparcB with tankers o f 0.3 million Bwt anB bnlk carriers o f 0.3 miflion Bwt in 1972. In the case o f tankers the average size o f the acquisitions increascB from 16,600 Bwt in 1972 to 39,500 Bwt in 1973, anB in the case o f bnlk carriers from 2^,200 Bwt in 1972 to 36,500 Bwt in 1973.
81. Faken as a whole, the various Bata on the Bevel- opm ent o f the fleets o f Beveloping countries point to the possible emergence of a new trenB. This is shown by the annual percentage rates o f growth over the last four years, which are:
ا970-1و7ا . . . . . . 4.8»/» 4.6 . . . . . .9 7 2 إ97ل-ل »/o t972-t973 . . . . . . 6.3»/o1 9 7 3 - 1 9 7 4 . . . . . . 9.5»/o
W hile current orBers for new tonnage are not sufficient to increase the share o f Beveioping countries in the worlB fleet, as table 22 shows the purchase o f seeonB-hanB vessels is m ore im portant as a source o f fieet expansion. Hence, Bespite the eviBenee from new orBers, the increas- ing growth rate o f the fieet o f Beveloping countries.
.24 table ,ء'،ء.ر.Review ofmaritime transport, 1972-1973 (op ؛
from shipyarBs o f other than Beveloping eountries; 35 vessels o f 1.4 million Bwt were built in BeveiopeB market-eeonom y eountries anB 10 vessels o f 0.1 mil- lion Bwt in soeialist eountries o f Fastern Furope anB Asia. The tonnage o f vessels built a t shipyarBs in Beveloping countries inereaseB only marginally from0.31 million Bwt in 1972 to 0.34 miflion Bwt in 1973; in relative terms a Beerease occurreB between 1972 anB 1973 anB the share tonnage bnilt a t own yarBs BecreaseB from 27.5 per eent in 1972 to 18 per eent in 1973.
78. The seeonB-hanB tonnage acquireB increaseB from 95 vessels o f 0.76 miflion Bwt in 1972 to 104 vessels o f 1.1 miflion Bwt in 1973. A t in previous years these vessels were mainly acqnireB from BeveiopeB m arket- eeonomy countries anB open registry eountries (93 per cent o r 1 miflion Bwt); only 1 per eent (10,000 Bwt) was aequireB from socialist eonntries of Fastern Fnrope anB Asia, while the balance of 6 per eent (59,000 Bwt) repre- senteB flag ehanges within the gronp o f Beveloping countries.
79. After allowing for Beietions, the net aBBitions to the fleets o f Beveioping eountries in 1973 were 91 ships totalling 2.2 miflion Bwt as eompareB with 97 vessels o f 1.2 miflion Bwt in 1972. © f this tonnage, in 1973 Beveloping countries in Afriea acquireB 19 vessels o f0.2 miflion Bwt, in Asia 36 vessels o f 1.3 miflion Bwt anB in Latin America ^nB the Garibbean 36 ships o f 0.7 mil- lion Bwt. The corresponBing tonnages for 1972 were0.1, 0.6 anB 0.4 miflion, respectively.
24

raid-1977, would cost an estimated $11ه million.®؟ In order to appreciate the dimension o f the hnancial require- ments for future investments in L N G carriers, it is w orth noting th a t the capacity o f the world L N G fieet is expected to he between 8.2 million and 9.7 million cu m by the end o f 198fi as against an existing fleet o f2 .fi mil- lion cum at the heginning o f 1973.مق A t c u r re ^ building prices, event a t the lower level, the investment require- m ent is roughly $5,000 million. The very high costs o f building T N G carriers m a^e it increasingly d i^ c u lt to finance investments in such vessels. Aecording to press reports, hanks find it di® cult to provide the capital required for such investments w ithout additional safe- guards. I t is perhaps for such reasons tha t the financing o f the supply of tonnage required to carry L N G to its destinations is inereasingly becoming an integrated part o f the development projects concerned and is additionally guaranteed by the whole operation.®؟
88. © oubts have been expressed in the press ®و as to whether India wiil he able to Implement its national plan program m e o f expanding its m erchant fleet to 8.fi mfi- lion grt within the next five years, because o f di®eulties in raising the capital tha t is required to expand the m erchant fieet by ahout 1 million grt per year, as called for in the plan.
89. R c e n t developments in the availahility o f capital in oil producing countries have eased di®culties regarding the financing of investments in shipping tha t previously existed also in these countries.®® Thus a num ber of investments in shipping projects have heen announced in 1974, while in other eases prospects for the development o f natural gas resources in developing countries have also included plans for investments in the transport of natural gas. Available inform ation regarding these and other cases o f ship financing in developing countries is given helow.
90. The A rab M aritim e ?etroleum T ransport Gom- pany (A M ?T €), form ed in 1978 hy the Governm ents of eight A rab States under the auspices of G A ? £ € , ordered its first vessels at the beginning o f 1974. Two crude carriers o f 275,000 dwt were ordered iu France for delivery in 1977 and 1978 respectively, and two crude carriers of 313,000 dwt, and also one of 38fi,000 dwt, were ordered in the fed e ra l Republic o f G erm any for delivery in 197fi and 1977. Total costs o f these order s are reported to he $320 million.“ In the second phase
٠٠ ^N ٠ : 1974-1990—Marine ©^eraiion an4 market prospects for liquefied natural ^as-publislred by the £©onomk Intelligence Ifnlt; reviewed in Fairplay Internatiorml Shipping Weekly (London), vol. 252, No. 4742 (11 July 1974), p. 6.
٠٠ /مهءه٠؟ ا،،مر؛،«■ / de la marine marchande et de la navigation ءسء'ءمحه
(Paris), 56th year. No. 2836 (25 April 1974), and محما،/ء’ء List (£ondon), 14 Novenrber 1974. See also para. 123 below.
٠٠ Lloyd's List (London), 11 June 1974, and Shipping and Trade News (Tokyo), 17 June 1974.
٠٠ According to press reports, the total tanker tonnage on order by developing oil produeing countries in Asia and Afriea anrounted in 1974 to 5.74 nriiiion dwt including the tonnage ordered for the Arab Maritime Petroleum Transport Lompany; LPG/LNG and chemieal carriers of 1.3 milhon cu m, were also on order (Norwegian Shipping News (Oslo), vol. 30 No. 19 (11 November 1974).
٠® The Petroleum Economist (London), vol. NLI, No. 8 (August1974), and أ'ءه'مح ., No. 9 (September 1974).
cnupled with the arrest ©f the decline in their share of world tonnage, may indicate tha t a new trend is emerging. I t is clear, however, th a t m ueh m ore would be needed —virtually m ore than is possible—if the objectives of the In ternational ©eveiopment Strategy for the Second U nited N ations ©evelopment ©eeade are to be attained.
82. $ome individual developing countries were able to add substantial am ounts o f tonnage to their existing fieet in 1973 (see annex V). fu rtherm ore , as the iufor- m ation given in paragraphs 91 to 99 below indicates, qualitative changes in the fieets o f individual developing countries are e^peeted. However, the general picture for developing countries as a whole remains gloomy and there appear to he only a very limited num ber ofcountries able to bring about significant improvements o f their fieets.
83. One o f the m ain obstacles preventing developing countries from signifieantly increasing their share in world tonnage is the fact tha t insu®cient capital is available to them on suitable terms. As is pointed out above, developing countries acquire vesseis mainly from foreign countries and thus they m ust have access to foreign credit on suitable terms for any significant im- pr©vemeس s to be m ade in their fieet as a whole. Exist- ing evidence, however, reveals tha t financing the acqui- sition o f new vessels has become m ore d i^ c u lt in 1974 than it was in earlier years.
84. I t is for snch reasons that, in the financing of new and second-hand tonnage by developing countries, attention is being focused on the role o f international financial institntions as suppliers of capital for shipping investments developing countries. Uevelopments appear to be very slow in this direction. In 1974, the W orld Bank g ra c e d the ?hilippines a loan o f $12fi million for the acquisition, conversion and repairs o f ships in order to improve the inter-island fieet servicing in the ?hilippines.
85. In July 1974 the OEG© shipbuilding countries amended their export credit term s for new ships and made them considerably less attractive for shipowners than before. The am ended OECD terms o f ©redit for ships, the text of which is reproduced in annex VI, eoupled with increasing priees for newly built vessels, made it even m ore di® cult for developing countries to build up substantial and productive m erchant fieets by acqniring new ships.
86. W ith the tightening o f shipyard credits, ship- owners increasingly have to tu rn to banks for loans, hut hanks have hecome increasingly hesitant to finance new tonnage and show a more discriminating and selective attitude towards borrowers.®* This is particularly im- portan t when it comes to investments involving very large capital requirements, as for instance ultra-large ©rude carriers, liquefied natural gas carriers and large container vessels.
87. For instance, a LN G vessel o f 125,000 cu m carrying capacity, if ordered in mid-1974 for delivery in
٠٠ “Ship finance hit by banking problems”, Lloyd’s List (London), .October 1974 ة
25

de Desarrollo, the governm ent-controlled development hank In Argentina.
97. N ational and G rindlays Bank in London has provided two loans o f abont $7.7 million each to the India Steamship Go. o f Galeutta for the purehase o f two second-hand dry cargo vessels, ? rio r to this loan agree- ment, the same bank signed a loan for S20 million to finance two new ships for an Indian shipping company.^؟
98. The M alaysian In ternational Shipping Gorpora- tion has reached an agreement with an international consortium o f banks for a loan o f $600 million. The loan will be used by the M alaysian national shipping line to bnild up a fleet o f liquefied natural gas tankers and oil tankers.^® The current practice o f treating the financing o f investments for L N G carriers as an inte- grated part o f development projects for L N G production is so widespread th a t surprise has been expressed in a press report tha t no decision has yet been reached regarding the eventual employment o f the flve LN G carriers, which are due for delivery in ل978.ءه
99. On the other hand, in 1974 there has been an example o f domestic flnancing for investments in shipping in a developing country. Contracts for 45 vessels o f varions types and sizes w orth about £25fl million have been granted to the shipyards Com panhia Comercio e N av eg a^o (CCN) o f Brazil for Brazilian owners. The delivery o f vessels is to be spread over the period 1976- 1980 and the flnancing has been secured through loans by the Brazilian G overnm ent, repayable in 15 years a t 8 per cent interest.؛“
100. These examples illnstrate the possibilities and also the problem s th a t developing eountries have encountered in raising the capital required for the extension o f shipping activities. In the light o f the increasing difficulties experienced by developing countries in financing the acquisition o f vessels, the Committee on Shipping, in resolution 21 (VI) adopted a t its sixth session, reqnesffid improvements in flnancial terms and conditions for the purchase o f ships by developing
أي Journal o f Commerce (Liverpool), 13 April 1974..Financial Times (London), 28 Noveniber 1974 ءي٠٠ Lloyd’s List (London), 11 December 1974.؛٠ Seatrade (Colchester U .K.). vol. 4, No. 12 (December 1974),
and Journal de la marine marchande ءه de la navigation aérienne (Paris), 56th year. No. 287b (19 December 1974) and No. 2871 (26 December 1974).
٠٠ For tbe text of resolution 21 (VI), see Official Records o f the Trade and بم»ءء«ء ءء/ر ^ ء Board, Fourteenth Session, Supplement No. 2 (TD/B/521), annex I.
of its operations, A M PTC plans to order six new tankers in the size gronp 40,000-150,000 dwt, and in the third phase orders fo r gas carriers, especially L ? G vessels, are envisaged.،^
91. The M iddle East Gas and ?etrolenm Company, in which K uwaiti interests hold a m ajority share, is reported to be planning to bnild up a large LEG carrier fleet. I t will be assisted by its largest foreign share- holder, the Liberian-registered M ultinational G as and Eetrochemical Company. The assistance offered will be in the flelds o f construction and design o f the fleet, transport, m arketing and term inal operations.^؛
92. A n agreement to set up a jo in t tanker company between a D utch firm and the United A rab Em irates was reported to have been reached in September 1974. It will be known as the U A ET T n k e r Com pany and it intends to build up a fleet o f ULCCs. The eom pany is no t expected to become operational immediately .٠٠
92. The $audi A rabian M aritim e Com pany ($amarco) has been set up as a jo in t venture o f $audi A rabian and United States interests. According to press reports, immediate acquisitions o f vessels will am ount to approxim ately 600,000 to 800,000 dwt of tanker tonnage and additional vessels will be added a t a rate of 750,000 to 1 million d ^ t per year for several years.^،
94. Some other developments, in speciflc circum- stances, which have also helped to widen the sources of capital for flnancing and enabled developing countries to acquire ships, are noted below.
95. India and Iran are to set up a jo in t shipping line under the titie Irano-N ind Shipping Com pany in which Iran will have a 51 per cent share and the Shipping C orporation o f India a 49 per cent stake. The Govern- m ent o f Iran will provide credit for buying ships.،؛
96. In June 1974, a group o f 41 international banks announced in London tbe signing o f a loan agreement with Em presa Lfneas M arftimas, s.A. (ELM A) of A rgentina for $152.5 m ilhon repayable over eight years. A ccording to press reports,^® a to tal o f 12 cargo vessels were being ordered bu t the loan is no t speciflcally tied to the vessels, since it is guaranteed by the Banco N acional
٠٠ Norwegian Shipping News (Oslo), vol. 30, N٠. 19(11 Ncvemb^r 1974).
ء’ء ٠٠ محمم/ List (London), 25 Febrnnry 1974.٠٠ Ibid., 5 October 1974.٠٠ Financial Times (London), 4 D eem ber 1974.1 ,. ٠٠ /ءه’مح November 1974, nnd ءمحه-ءسءك (Colchester U.K.),
vol. 4, No. 11 (November 1974).ء’ءء/ء؛ ٠٠ محمم/ (London), 11 June 1974.
26

Chapter IV
TRENDS IN SHIPBUILDING
103. As In previous ؛?ears, Japan dom inated the shipbuilding scene. A t the end o f September 1974,45.1 per eent of the to tal world order boo^ was placed with Japanese ؛?ards, as com pared with 43.6 per cent on 30 September 1973.قء Sweden, the second largest shipbuilding countr؛?, accounted for onl8 ?؛ per eent in 1974 and 9 per eent on 30 September 1973.
104. © f the gronp o f developing countries, 21 coun- tries are recorded as being current{؛? engaged in ship- building activities,®* bu t a t the end o f September 1974 the combined share o f these countries in the to tal world order book had deelined to 2.2 per cent as eom pared with3.1 per eent a t the end o f September 1973. I t is w orth adding th a t each o f the 10 m ajor shipbuilding countries accounts for a higher share o f tonnage on order than these 21 developing countries as a whole.
105. I t can be observed from the preceding para- graph th a t shipping enterprises o f developing countries
However, out of only nine new orders for VLCCs and ULCCs ؛؛؛placed thron^hont the world during the first nine months of 1974, none has been placed In Japan {The ^،>?٠٢ Ship (London), vol. 55, No. 652 (November 1974)).
Lloyd’s Register ٠/ Shipping .■ Merchant Shipbuilding Return, third quarter, 1974. The countries and ^rrltories registered are; Angola, Argentina, Bangladesh, Brazil, Fgypt, Ti)i, Guyana, Hong Kong, India, Indonesia, Israel, Kenya, Lebanon, Malaysia, Mauritius, M exko, ?akistan, Bern, Bhilippines, Republic of Korea and $ingapore.
A. General develnpmenl
101. © uring 1974 the world’s ship؛?ards delivered 1,251 vessels with a total tonnage o f about 58 million dwt, thus exceeding the deliveries o f new buildings in 1973 b؛? about 6.1 million dw t although 31 fewer vessels were delivered. Table 23 gives a surve؛? o f the num ber and tonnage o f ships delivered in the ؛?ears 1968-1974 according to types o f vessels built. Because o f the high volume o f vessels currently on order the tendency o f deliveries to rem ain a t high levels should continue at least until 1976, unless large-scale cancellations ocmtr as a resnlt o f freight m arket ehanges.
102. As in the preceding years tankers made up the greatest proportion o f newly delivered ships in 1974 and accounted for 67.6 per eent o f to ta l deliveries in term s o f tonnage. F o r the hrst time since 1969 a deeline was recorded in the deliveries o f combined earriers. A declining trend also in new orders suggests tha t there will be a further decline in new deliveries o f eombined tonnage in the next few years. Deliveries o f bulk earriers (ineluding ore earriers) in 1974 also decreased as eom pared with 1973. The share o f bulk earriers in to tal deliveries dropped from 18.4 per cent in 1973 to 13.8 per cent in 1974.
Unless otherwise stated, the discussion in this chapter is hased on data given In Lloyd's Register ofshipping .• Merchant shipbuilding Return, various quarterly issues.
T able 23
Deliveries of new buildings, 1968-1974 '(In thousand dwt)
Total
dwt
26,5143©,41235,83439,77344,280
58,000
Num ber
1,0201,0641,0491,0801,102
1,251
اءه،م■ ءا>/ء؛.
dwtNumber
4,8006,000716
^14780
B ulk carriers » (including
٠٢» carriers)
8,1549,179
8م00
Number
200185214243
200
Combined carriers ء
dwt
2,7202,028
5,6347,7748,2554,700
Number
3^233042505434
Tankers ٠
11,097
20,12220,397
Num ber
142542
ج
Year
19681969197019711972 1973' 1974
Source: Fearnley an<t £^er$ C hartering Co. L td ., 1974 ,' ءمح ااءا (Oslo, 1974), tab le 4.F ء o r da ta referring to earlier ^ears, see Review o fm a r i t im e ء،آر«ءسمهءء, /ئحو-ءا/ل (ءه . c i t.) , tab le ; Vessels over 10,000 dw ء t.٠ A ll seagoing cargo-carrying vessels over 1,000 grt.» Revised figures.
27

١٧ $ the result ص cancellations o f a nnnrher of contracts ءء for tanlcer new huiidings and a net fall in the nnnrher of VLCCs on order, whieh was no t o ^ e t by the increased orders for tankers nnder 150,000 dwt. In faet, hetween 1 Novem ber 1973 and 31 October 1974 the to tal order hook for tankers increased by a mere 1.6 per e e n t“ as com pared with an increase o f about 75 per cent in the corresponding period ending O ctoher 1973. However, this charge should no t substantially affect deliveries of new tankers in the next few years, since the tonnage under construction had further increased to 20.4 mil- lion grt a t the end o f September 1974 as com pared with 15 million grt at the end o f September 1973.
108. The rapid increase in the num her o f tankers on order in the size group o f 400,000 dw t and ahove, which was a characteristic o f the order book in 1973, did not continue in 1974. After having Jnmped from 36 at 30 September 1973 to 66 a t the end o f 1973, the num her o f tankers on order in this size group rose slightly to 70 in the first quarter o f 1974, hu t deehned to 69 at mid-1974 and rem ained a t 69 a t the end o f the th ird quarter of لم.1974 Nevertheless, within the size group o f 400,000 dwt and ahove there is still a preference for tankers o f over500,000 dwt, the num ber of which on order increased from 7 a t the end o f M arch 1974 to 10 a t the end of Septeraher 1974.
109. The emphasis in new orders for tankers during 1974, however, was on tankers o f under 150,000 dwt. A renewed interest in tankers o f this category was already apparent during 1973. Indeed, between 1 No- vember 1972 and 31 Cctober 1973 the tonnage on order o f this size o f tankers douhled (25.3 million dwt in 1972 and 52.6 million dwt in 1973). In the period from 1 Novem ber 1973 to 31 C ctober 1974 the order hook for tankers under 150,000 dwt registered a further increase to 62.6 million dwt.®®
110. There appear to be several reasons for the interest in tankers o f under 150,000 dwt. Cne o f them is the comparatively unfavonrable age distribution of this fieet. While alm ost all the tonnage o f the size group 150,000 dw t and above is less than 10 years old, about 32 per cent o f tankers below 150,000 dw t were 15 years and older a t mid-1974.®® A nother reason is the fact that the Suez € an a l is scheduled to reopen in 1975, when it is planned to accom m odate in the first stage ships o f about 60,000 dwt loaded and 110,000 dw t in hailast.®، Linally, there appears to have heen a very rapid growth
٠٠ Twenty-four contracts for ^ n k e r new buildings amounting for 4.5 million dwt were cancelled between 1 November 1973 and 31 October 1974. World Ships ٠« Order : Fairplay International Shipping Journal (London), Nos. 38 to 41.
٠» Ibid., N o 37 (November 1973) and No. 41 (November 1974).٠١ Quite a number of orders for ULCCs of tbis size group refer
to restricted draft vessels o f about 73 feet drafi for 400,000 dwt vessels {Fairplay International Shipping Journal (London), vol. 253, No. 4757 (24 October 1974).
٠٠ World Ships ٠« Order .• Fairplay International shipping Journal (London), No. 37 (November 1973) and No. 41 (November 1974).
٠٠ Lloyd’s Register ٠/ Shipping: Statistical Tables (London), 1974.
ean turn to national shipyards for the eonstruetion of new tonnage only to very limited extent, ^ o r the present and also for the foreseeable future, m ost develop- ing countries will have to depend entirely on foreign shipyards, and this will tend to accentuate their balance- of-payments problems. A few encouraging changes, however, have heen observed in recent years. Brazilian shipyards are increasingly active in supplying tonnage for Brazilian owners and it is heing suggested th a t in the foreseeable future they may have to tu rn to the inter- national m arket to seek employment and thus become an export industry.؛؟ A nother example is the founda- tion o f the Hyundai shipyard at M ipo Bay, Republic of Korea, where in Lebruary 1974, only 21 m onths after construction o f the yard had started, the first 259,000 dwt tanker was com pleted. ؟٥
106. The long-term prospeets for the shiphuilding industry depend on the outcom e o f several faetors which cannot yet be fully evaluated. In addition to the monet- ary problems th a t still rem ain unsoived, a nnm her of other problem s have arisen. The world energy situation and increased bunker costs could have an im pact on future dem and for tonnage, thus slackening the dem and for yard capaeity. In this connexion several reports predict a slowdown in the rate of increase in the dem and for oil and vast surpluses o f oil tanker tonnage; if this occurred, it would certainly have serious repercussions on the dem and for shipyard capacity. A t the same time, general économie forecasts also give a rather uncertain if no t gloomy picture o f the future economic situation in several o f the m ajor industrial eountries, which, if realized, would aifect world trade and its pace of expansion and thus the dem and for tonnage. O n the other hand, experience has shown th a t it beeomes more and m ore d i^ c u lt to forecast even short-term economic developments with a reasonable degree o f reliability. I t seems, however, th a t there are bu t few indications, if any, tha t the world shiphuilding industry is likely to know a period o f prosperity in the late 197fis ؟؟ compar- able to tha t experienced since 1969 to date.؟®
B. Particular developments by type of vessel
1. Bulk cargo vessels(a) Tankers
1^7. $ince the early 196fis there has heen a trend towards the dom ination of tankers and dry bulk carriers (including com bined carriers) in the to tal order book, as well as in deliveries of new buildings. In 1974, for the first time in recent years the share o f tankers in the to tal order book did no t increase significantly. This
also ?aras. 261-267 b^lo^y on tbe reopening of tbe SueCanal.
٠٠ Seatrade (Colchester U .K.), vol. 4, No. 12 (December 1974).٠٠ Lloyd’s List (London), 15 April 1974.٠؟ Lloyd’s List (London), 26 October 1974.
٠٠ Japanese ship exports In August 1974 were down 71.6 per cent from the corresponding month in 1973 in terms of contracts awarded. It is also interesting to note that between the beginning of the fiscal year 1974 (1 April) and August 1974, Japanese yards did not recei¥e any orders for either ALCCs or ULCCs {Shipping and Trade News (Tokyo), 12 September 1974).

costs. The extremely rapid grow th o f such tonnage in the last 1ه years occnrred in response to the advantages o f the newly adopted concept o f combined operations. Snrely, only part o f the dem and for shipping services will be o f a type which could be subject to combined operations and hence future orders for such tonnage will be to satisfy new specific requirements, fn this connexion, it is w orth noting tha t beetwen 1972 and 1974 the great redaction in new orders was for ore/oil carriers o f 150,000 dwt and above (16 in 1974 as com pared with 52 vessels in 1972), while the order boolc for bulk/oil ( ه^ه ) carriers o f up to 150,000 dwt declined only by $i^ vessels in the same period (38 in 1974, as com pared with 44 in 1972) These data suggest tha ةء. t the level o f new orders is well sustained for the tonnage which offers the widest fiexibility o f operation to the owners. The operational fiexibility o f this medium-sized combined tonnage is dem onstrated by recent shifts o f such vessels from the oil to the dry cargo m arket. In the meantime, the idea o f a new type o f com bined carrier was intro- duced, the so-called PROBO.®“ It is proposed tha t this vessel should be in the size group o f 96,000 to 126,000 dw t and should be able to carry products, crude oil, bulk cargoes and ore. ^h e smallest size vessel is planned to carry 96,000 dwt on a draught o f only 12.8 m, which will make it suitable for shallower waters.؛؟• Tike other product carriers, it will be able to carry nine different kinds o f products.
2. General cargo and unit load system vessels
115. The tendency observed in p re v io u years for general cargo tonnage on order to decrease was reversed between September 1973 and September 1974. The data for the period end September 1972 to September 1974 for ships o f more than 2,000 grt are: ٢٠
change
D elivered during
preceding Î2 months
(million grt)
Under
struction Per- (million centage
g r t) change
Per-
Total tonnage
on ٠٢ءمح٢(million centage
grt) change
4.0 4.3
-16 .3-1 6 .0+ 19.6
End o f:
September 197^ . 6.5
September 1973 . 5.6
September 1974 . 6.7
116. Detailed data concerning the particular changes in each type of vessel included in the group “genera] cargo vessels” are not available. F o r “unit load vessels” , too, only partial inform ation is available and is given in the following paragraphs.
117. A t the end o f September 1974 total container tonnage on order am ounted to 1.25 million grt, repre-
o f trade in petroleum products, which has led to increased orders for vessels o f the appropriate type.؛؟ Am ong the m ajor factors infiuencing the dem and for product carriers is the planned expansion o f refining capacities in oi! producing developing countries.
(b) D ry bulk carriers and combined carriers
111. Since early 1973 there has been a considerable decrease in the tonnage o f bulk carriers (including combi- ned carriers) under construction, which dropped from 8.38 million grt at the end of the first quarter o f 1973 to 5.4 milhon grt a t the end o f the third quarter o f 1974. There was also a decrease in the tonnage o f bulk carriers delivered. Between 1 Dctober 1973 and 30 September 1974, 8.2 m ilhon grt were delivered as com pared with 9.3 million grt in the 12-month period ending S e p te t- her 1973.
112. The to ta l order book for bulk carriers and combined carriers together decreased only slightly. A t the end o f September 1974 the order book stood ^t 18 million grt as eom pared with 18.7 million grt on30 September 1973. In relative terms the share o f dry bulk tonnage in to tal tonnage on order decreased from 16.4 per cent at the end o f September 1973 to 14.1 per cent ^ t the end o f September 1974.
113. Gonsidered separately, however, the trends in buik carriers and combined carriers diverged. The tonnage on order for com bined carriers continued to decline: a t the end o f October 1974, 9.3 million dwt were on order, as com pared with 13.8 million dwt a t31 Gctober 1973. Gn the other hand, the tonnage of o ther bulk carriers on order increased from 25.1 million dw t a t 31 G ctober 1973 to 27 million dwt a t 31 Gcto- ber ل974.هء
114. W ith regard to the decline in orders for com- bined carriers, there appears to be a confiict o f views as to the future dem and for such vessels. Some observers felt tha t the boom in construction o f com bined carriers occurred only because o f the extremely low bnilding prices for vessels in the 196fis. This argum ent is not, however, supported by the available evidence. Ship- building prices have risen sharply since the late 1960s,• nevertheless, the tonnage o f combined carriers on order rose from 6.9 million dwt in 1969 to 21.6 million dwt in ء.1972 th أ e refo re , the decline in the tonnage o f com- bined carriers on order since 1972 is m ore likely to be due to the fact that existing and foreseen dem and for sudh vessels has been m et rather than to rising building
٠٠ /ه،ممح٠٠ Journal de la marine marchande et de /٠ navigation aérienne
(Paris), 56(h year. No. 2847 (I I July 1974), ? ٠ 17П5, and ibid.. No. 2851) ه August 1974), p. 1945.
٢٠ The Motor Ship (London), vol. 55, No. 652 (November 1974). ٢١ Lloyd’s Register o fSh ipp ing: Merchant Shipbuilding ^£ ،،؛٢ «
(London), third quarter issues for 1972, 1973 and 1974.
٠؛ Aceording to a report published by Terminal ©perators Ltd. (as quoted in Shipping and Trade News (Tokyo), 13 June 1974), on the basis of produet earriers now on order and on different rates of scrapping of existing tonnage, between 895 and 1,119 vessels of 39,9س dwt equivalent will be in service in January 1977 while demand should be between 1,399 and 1,599 vessels o f 39,999 dwt equivalent based on growth rates of 7.8 and 19 per cent In the trade.
٠٠ World Ships on Order: Fairplay International Shipping Journal (London), No. 37 (November 1973), No. 49 (Angus( 1974) and No. 41 (November 1974).
٠٢ Fearnley and Fgers ©bartering Co. Ltd., World Bulk Carriers, January 1969 (©s!o), table 8, and World Bulk Fleet, January 1972 (Oslo), table 19.
29

3. Other vessels
(a) Liquefied gas carriers120. Advances condnued to be very rapid in 1974
with regard to the tonnage o f liquefied gas carriers, the tonnage on order and the si^e o f the vessels. An increasing num ber o f shipyards in western Europe, the U nited States o f America and Japan have by now orders on hand for this highly speeialized and capital- intensive type o f vessel. Developments and prospects regarding the rapidly increasing dem and ءآ for liquefied gas suggest th a t transport requirem ents for liquefied gas will further a ttract the interest o f shipyards which have the advanced technology required.
121. D nring 1973, both the existing fieet o f liquefied gas earriers and the tonnage on order increased consi- derably. In January 1974, the existing fieet had a capacity o f 3.3 million eu m (see table 25), as com pared with 2.6 million cu m a t the beginning o f 1973, while the eapaeity o f the fieet on order rose from 3.4 million cu m to 6.2 million cu m during the same period.
122. Advances have also been very rapid with regard to the carrying capacity o f L N G earriers. While, about 10 years ago, the first generation o f L N G ships was in the size range o f 25,000-40,000 cu m, this was followed by an increase to between 70,000 and90,000 eu m .’® I t ean be seen from table 25 th a t new orders are now concentrated on vessels o f 100,000 cu m and above. A bout 90 per eent o f the tonnage on order a t the beginning o f 1974 belongs to this size group.
123. It has been noted in chapter III tha t because of the volume o f finance required for m odern LN G earriers, their financing is increasingly beeom ing a p^rt o f the respective developments o f gas resonrees rather than an independent activity. Table 26 lists a num ber o f L N G schemes in which the financing o f the carrying vessels has been integrated.
ء) ) Push-barge vessels124. Interest in push-barge systen^s is developing
slowly. In 1973 reference was made to the commission o f an ocean-going pnsh-barge vessel o f 23,000 m
France. In 1974, it has been announced th a t a pnsh- barge vessel system has been suceessfnliy tried on a round trip between Japan and China. As a result two barges o f 4,000 dwt each and a pusher have been ordered in Japan ؟’.
BACAT-vessel ((ء
125، A new type of barge-earrying vessel for short sea trades has been eonstrneted in D enm ark, ^ h e
F ءأ er example, by 1980 the United States of America can he expected to import between 46,000 milhon and 64,000 million cu m from various sources, which is more than 10 times the volume of gas moving under existing contracts. In 1980 also ^ p a n should be receiving ^4,000 million to 34,500 million cu m as against ab^ut9,000 million cu m by 1975. Besides that, movements of L ?G could reach 17.5 milhon tons, as compared with 7.^ million tons in 1972. (€f. و'ءئ«ء'مح Gas Carrier Register, 1974, compiled by H. U larkon and €o . Ltd, London).
؟٠ Petroleum Review (London), vol. 28, No. 331 (July 1974).” Zoseti (T o ^ o ), vol. XIX, No. 1 (April 1974).
senting 18.8 per cent ©fall general cargo vessels on order, ^h e com parable figures a t the end o f September 1973 were 1 million grt and 17.8 per cent, respectively. These totals were lower than a year earlier and had indicated tha t perhaps the container ship boom was ending.
118. The trend in recent years for the shipbuilding industry to provide m ore flexible and diversified unit load tonnage persisted in 1973-1974, as shown in table 24. There was an increase in the num ber o f part container ships, full container ships, container/trailer ships, vehicle carriers and pallet ships, while the num ber o f vessels on order o f ah other types of unit load systems deelined.
T a b l e 24
Numbers of unit loBd system vessels on order ء at mid-1973 and mid-1974
1973 1974Type o f vessel
Bart container ships » 393 499Fuh comainer ships ء 78 69 Uontainer/trailer sh ip s 58 66Container/part refrigerated ships . . . . . . . 44 34¥ehic]e carrie rs 28 35Buk-vehicle c a r r i e r s 37 26Bulk container s h i p s 29 23Barge c a r r i e r s 10 9B a l l e t s h ip s 1 3Container/barge carriers . . . . ٠ . . . ٠ ٠ . 4 3
Source: C om piled fi-om W orld Ships ٠« O rder: م>رمء/مه ،«/اء«-ه،ء'ه«ه/هث/ءمم«ء Journal (L ondon), N o . 40 (A ugust 1974).
Including con ،؛ tracts pending o r under negotiation .١• ؟ resumaEi^؛ som e 0( titese ^esseis a re w hat a re usuaiiy eaiied m ulti-purpose
yesseis.٠ Including 24 »essels with a con ta iner capacity 0( less than 200 TE U .
119. The yearly increase in size and speed o f container ships on order tha t conld be observed up to 1973 was no t present in 1974. Gn the contrary, from July 1973 to In ly 1974 the average capacity o f fully ©ellular vessels on order decreased from 1,©65 T E U ؟٤ to 1,002 T E U per vessel.’® The largest vessel on order a t mid-1974 had a carrying capacity o f 2,274 ^ E U , as com pared with 2,804 T E U for the largest vessel on order a t mid-1973. In this connexion, it is worth noting tha t there have been warnings from British shipowner circles against the construetion o f very large container ships.’* The sub- stance o f the warning was tha t there should be a balance between the desire for a certain frequency o f service and for inoreasing vessel sizes, the m ore so sinee the loss o f a very large container ship would have disastrous effeets on the trade, whieh already has a tight balance between space offered and space required.
T£U = Twenly-foot equivalent unit.Birm orders of lift-on lift-off fuil container ships of more than
300 TFU capacity are taken into consideration. Diseussion based on World Ships ٠« Order: Fairplay International shipping Weekly (London), No. 36 (23 August 1973), and ءهئ'مح ., No. 40 (22 August 1974).
’* Shipping and Trade News (Tokyo), 8 Apri! 1974.
30

ها0
٢٠٠ذؤو٢٨ ا0
o\ss؛
àl
ج о حTf ،٢٢
4ممء• هاج .ها 0
|ممم 00ح صя محآمحا OS
١٨ ٠ء
ه
ق ق ة ة و | ؤ ق
ا ح م ي ت | ة ح م ح م ح م ج
0ها OOTf بم،ءء وص 0 ٠اق1
.ة تف
صو«Nا| 1 | 1 1 | | ا I I I I
ء أ I ا I I I ب 1ا 1 ا ن ب |
ة
см
٠٠
م g I I I ا I
ü*d
I ٨٠٨• !
؛4 ٠١ ٣ 00о ي ■
ء
<N I r i ^ г ч ء يم
٠١٠٠٢٢١
I I N I I 1 ا ق
SS.
|ق00
٢٢١ ٢٢١ص I أم
ق ا ة " ا ا ا ا ا ا ا
ء
I Iق §وو
ءء
-0S
Ç\٠٢
OS
ilبمم ٢٠٦
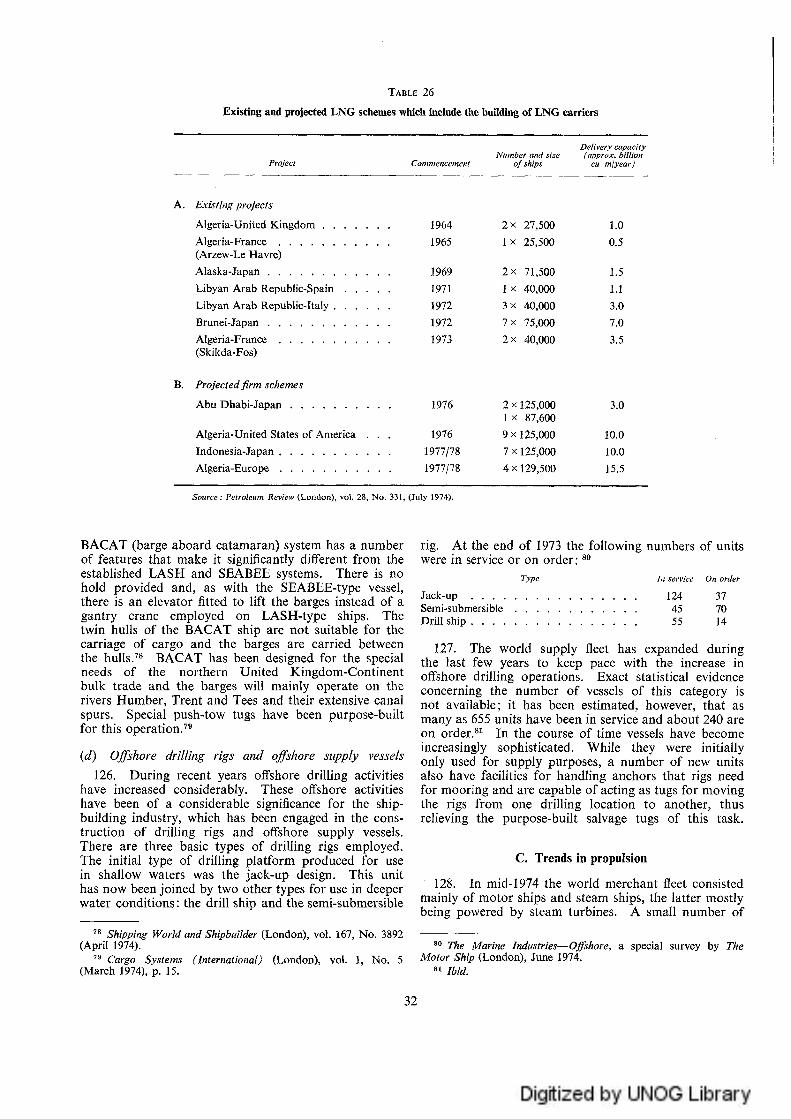
building of LNG carriers ؛
Table 26
Existing and ?ro؛eeted LNG schemes whicb include (
Delivery capacity (approx. billion
cu m iyear)Num ber and د
Commencement o fsh ip sProject
1.0
0.5
3.0
7.0
A. Existing projects
Algeria-United Kingdom . . . . . . . 1964 2 ^ 2 7 ,5 0 0A lg e ria -F ra n c e ......................................... 1965 1 ^ 25,500(Arzew-Le Havre)A lask a -Jap an ............................................. 1969 2 x 71,500Libyan Arab Republic-Spain . . . . . 1971 1 X 40,000Libyan Arab Republic-Italy . . . . . . 1972 3 X 40,000B ru n e i-Jap an ............................................. 1972 7 x 75,000A lg e ria -F ra n c e ......................................... 1973 2 x 4 0 ,0 0 0(^bllrda-Fos)
3.0
10.010.0
2x1^5,000 i x g7,600
9x125 ,000
7X125,000
4X129,500
Projectedfirm schemes
Abu Dbabi-Japan . . . . . . . . . . 1976
Algeria-United States of America . . ٠ 1976In d o n es ia -^ p an ................. 1977/78A lg e ria -E u ro p e ................. 1977/78
،Source; Petroleum Review (London), vol. 28, N o . 331, (July 1974).
rig. A t the end o f 1973 the following num bers o f units were in service or on o rd e r ; م®
Type In service On order
J a c k - u p ..................................................... 124 37Se،nl-subm erslb le ..................................... 45 70Drill s h ip ...................................................... 55 14
127. The world supply fieet h^s expanded during the last few years to keep pace with the increase in onshore drilling operations. Lxact statistical evidence concerning the num ber o f vesseis o f this category is not avaiiahle; it has heen estimated, however, tha t as m any as 655 units have been in service and about 240 are on order.®^ In the course o f time vessels have hecome increasingly sophisticated, ^ h i le they were initially only used for supply purposes, a num ber o f new unitsalso have facilities for handling anchors tha t rigs needfor m ooring and are capable o f aeting as tugs for moving the rigs from one drilling location to another, thus relieving the purpose-huilt salvage tugs o f this task.
c. Trends in propulsion
128. In mid-1974 the world m erchant fieet consisted mainly of nrotor ships and steam ships, tim latter mostly being powered by steam turbines. A small num her o f
BACAT (barge aboard catam aran) system has a num ber o f features tha t make it significantly di^erent from the established LASH and SLABLL systems. There is no hold provided and, as with the SLABLL-type vessel, there is an elevator fitted to lift the harges instead o f a gantry crane employed on LASH-type ships. The twin hulls o f the B A €A T ship are no t suitable for the carriage of cargo and the harges are carried between the hulls.؟® B A €A T has been designed for the special needs o f the northern U nited ^ ingdom -€on tinen t bulk trade and the barges will mainly operate on the rivers H um her, Trent and Tees and their extensive canal spurs. Special push-tow tugs have been purpose-built for this operation.؟®
{d) Offshore drilling rigs and offshore supply vessels126. D uring recent years onshore drilling aetivities
have increased considerably. These o ^ h o re aetivities have been o f a considerable significance for the ship- building industry, which has heen engaged in the cons- truction o f driliing rigs and olfshore supply vessels. There are three basic types o f drilling rigs employed. The initial type o f drilling platform produced for use in shallow waters was the Jack-up design. This unit has now been Joined by two other types for use in deeper water c o n d itio n ; the drill ship and the semi-submersihle
special survey by The٠® The Marine Industries— Offshore, Motor Ship ( ا©هههأا ), June !974.
٠١ Ibid.
؛Shipping World and Shipbuilder (London), voi. 167, No. 38 ؟؟(Apri! 1974).
؟٠ Cargo Systems (International) (London), vol. 1, No. (March 1974), p. 15.
32

о о p p 00 ٢٠٠ ٢٢
s s s ^ ^ |ة١٥
asГА
р О О ٥٠о о о ٠١
р ص 00 ٦ р )٠
^ ٣ ٦ 40 Tj ٧ ٣ ٦ ٦ؤو
р р р
ة
ء|ة؛ء |ة
р р р 00 ٧٦ ٢٠• ١٨
؛؛ §|تع
о ٠ о (N ٠٠١
ةقةنحا©0 ٣٦
00
ءيو
о о ٠٠ о M٩هه٥
وئ
ص ص ٧٦ م -مو و ت يم ة
О О О
لآI1
مه ٠؛ ؛.و
٩٦٩٠١آه٠١
|||
١٥ — ١٥ ٢٠Р ٣٠١ ٠١٣٦ ٢١١ ٢١١ بمء
(ة ء دأ
أ I ة١٨ о о ^ ت-م
33

clarified whether international and local agreements on safety standards will allow the vessels the norm a! nse o f territorial waters.؟’ A nother problem tha t arises with norm al operation o f nuclear-powered vessels is the question o f liability in case o f damage. Agreements hased on the Brussels ©onvention on the liability o f shipowners lay down tha t the operator is liahle up to a limit o f about DM 350 million, regardless o f whether he is at fault. F o r claims exceeding this limit the licensing ^tate has to guarantee coverage. However, there is no international law regulating in a precise w^y the question o f liahiiity o f owners and o f the licensing State for c^lls in foreign ports, and in the meantime bilateral agreements have to suffice.؟؟
131. Nevertheless, the GKSS ؟٠ o f the Federal Repu- blic o f Germ any, in co-operation with shiphnilders and shipowners, is planning a nuciear-powered container ship o f 80,000 shp and an operational speed o f 28 knots for the N orth W est E urope-F ar East run, and is aiming to reaeh a deeision on the construetion o f such a vessel by mid-1975.؟® Also, Japan is considering the eons- truetion o f a second nnelear-powered vessel, either a container ship o r a ta n k e r but in the light o *ء, f increasing difficulties in the operation o f the “M utsu” it is doubtful whether any concrete steps will be taken in the near future to pursne this project.
D. Automation and other technological advances
132. Further specific developments have no t been reported in 1974 but additional studies have been under- taken to reduce the num ber o f crew m embers by means o f autom ation and reorganization. In this connexion, it has been claimed in a study carried ou t by the H ansa Shipping Gompany in Bremen tha t a crew o f 12 could suffice for a ©ontainer vessel serving the trade between Fnrope and the F a r East w ithout affecting the operation o f a vessel or its security, under the assum ptions that the sea/port ratio would be 94.2/5.8, frequent p o rt calls would be o f an extremely short duration, the supervision o f cargo would be confined to inspecting the holds, refrigerated eontainers and containers loaded with dangerous eargo.“®
ء In أ (his connexion, it is worth referring to the difficulties faced at sea hy the Japanese nueiear-powered vessel. Because of radioactive leaks, it was refused access to ports anywhere and only after drifting six w eek in the Pacific was it allowed to enter its home port.
Fairplay International Shipping Weekly (London), vol. 253 No. 4754 (3 October 1974).
؟٠ Association for the utilization of nuclear energy in shipbuilding and shipping.
٠٠ Journal de la marine marchande ؛ءمح £ la navigation aérienne (Paris), 56th year. No. 2841 (3ه May 1974), p. 1317. Also Fairplay /«، ءء«-ءس'سه / Shipping Weekly (London), vol. 253, No. 4754 (3 October 1974).
٠* Seatrade (Colchester U.K.), vol. 4, No. 5 (May 1974).٠® Journal ،ءا la ء«'،-ءءس marchande ءج de la navigation aérienne
(Paris), 56th year. No. 2847 (11 July 1974).
vessels are propelled by gas turbines. The num ber of truclear-powered vessels In commission rem ains constant a t three ships. The great m ajority o f the vessels under eonstruetion a t the end o f September 1974, i.e. 2,194 ships out o f a to tal 2,333, were m otor ships. However, in term s o f tonnage the share was 52.7 per eent for m otor ships and 47.3 per eent for steam ships.؟®
129. The diesel engine remains the predom inant form o f m otor pow er for ships below 100,000 grt. G f ships nnder construction o r on order a t the end of September 1974 virtually all o f those under 30,000 grt were m otor vessels, as can be seen from table 27. In the size group between 30,000 grt and 99,999 grt the dom inance o f diesel propnlsion was somewhat less noticeable than in the previous two years. Jn the size group o f 100,000 grt and above, steam turbines remain the predom inant form o f propulsion.؟® The prices of diesel oil and fuel oil have evolved qnite differently since the end o f 1973, and this may entourage the adoption o f diesel engines in the size range o f 100,000 grt and over either through the use of twin screws or through improved engine technology. A n indication o f this is given in press reports th a t several shipowners who had ordered steam turbine-powered ships have attem pted to renegotiate their contracts to have diesel engines installed. Diesel engines o f 50,000 bhp per ship have been ordered for five 23-knot container ships and it is considered tha t the increasing costs o f operating these vessels— mainly fuel costs—in a long haul snch as from Europe to A ustralia have infineneed the shipowners’ decision to install diesel propulsion.؟*
130. ^inee the rise in bunker prices and the new danger o f euts in supplies, interest in studies of nuelear power as an alternative to fossil fuel in ship propulsion has been revived. It has been calculated that, a t early 1974 bunker prices, a nnelear-powered ©ontainer ship with a eapaeity o f 1,000 oontainers would break even with a fossil-fuelled vessel a t 24 knots and 33,000 shp.؟® However, similar optimistic calculations were also made on several occasions in the past, bu t have subsequently been revised, particularly as a result o f increasing costs for the eonstruetion o f a nuclear-powered vessel.؟® M oreover, if nuclear-powered vessels come into ope- ration, no t only have the questions of eeonomic supe- riority and o f regular m anning o f an increased num ber o f sueh vessels to be answered, bu t it also has to be
٠® Lloyd's Register o fsh ipp ing : Merchant Shipbuilding Return (London), third quarter o f 1974.
٠® On 39 September 1974, 7.4 per cent of the number of vessels on order in the size ^roup of 100,000 §rt and above were motor ships. The corresponding share on 30 September 1973 was 8.3 per cent. {Lloyd’s Register ofshipping .• Merchant Shipbuilding Return (London), ءorrespondinج issues.)
٠* The Motor Ship (London), vol. 55, No. 649 (August 1974).Fairplay International Shipping Journal (London), No. 25
(Ju[y 1974).٠٠ Congressional Information Bureau (l^ashin^ton مه €.), vol. 78,
No. ^31 (29 November 1974).
34

Chapter ¥
FR EIG H T M ARKETS
ments in the freight m arkets in N ovem ber and December clearly dem onstrated th a t the boom in the dry cargo m ar- ket which began in the last quarter o f 1972 has well passed its peak.
135. The prospects for the dry cargo m arket appear to be riddled with uncertainties. M uch depends on how far infiation and the rise in oil prices will affect economic growth in industrial countries, consequently also their dem and for im ports, particularly o f industrial raw m aterials.؛؛ Nevertheless, some observers؛® felt tha t world consum ption o f raw m aterials will begin to expand in 1975, particularly if oil prices stabilize. In addition, since the dry cargo m arket is substantially influenced by grain movements, the prospects for the next few m onths also depend on the am ount o f grains traded. The concern a t the end o f the third quarter o f 1974 regarding the relatively poor crop yield in the U nited States and the cancellation o f certain sales con- tracts with the U SSR increased the uncertainty in the m arket. However, against this, reference should be made to the new contract for the sale o f grains concluded in Dctober 1974 between the U nited States and the USSR, and also to increased movements o f grains from Argentina.
136. The situation in the tanker m arket differed sharply from that in the dry cargo m arket throughout the year. A t the beginning o f 1974 the tanker m arket was weak and these weak dem and conditions persisted until towards the end o f the flrst quarter o f the year. Some im provem ent was observed in M arch 1974 after the lifting o f the oil embargo, bu t it was short lived and the m arket was no t effectively activated. A similar tem porary recovery also occurred a t the end o f the third and the beginning o f the fourth quarter o f 1974, perhaps because o f speculatiou th a t OPEC countries wonld decide to increase the royalty payments from oil com- panics from 1 October, and also because some oil supplies were m ade available a t reduced prices by a few G ulf States in August and September 1974.؟؛ A dded to
A. General developments
133. In the dry bulk and tanker cargo m arkets, the uncertainty created by the sharp rise in oil prices and im position o f restrictions on oil shipments in the last m onths o f 1973 was felt in the early m onths o f 1974. However, after a tem porary panse the dem and for dry cargo tonnage recovered and strong dem and conditions characterized the m arket till well into the fourth quarter o f 1974. The ability o f the m arket in the flrst ha lf o f 1974 to sustain the im pact o f an alm ost continuous transfer o f combined carriers and tankers ؛؛ to the dry cargo trades w ithout this having a depressing effect on the level o f freight rates, was indicative o f its strength.
134. The strength o f the dry cargo m arket in the flrst ha lf o f 1974 was derived from a wide movement o f all m ^jor bulk commodities, particularly grain, ore and coal following the upheaval created by the oil situation. Voyage and time charter rates for m ost classes o f tonnage help up a t rem arkably high levels, ^here were, however, noticeable fluctuations in the rates dnring the flrst six m onths o f 1974 ^nd voyage charter rates reached their highest level since the 196ds in the flrst quarter o f the year when the relevant freight index reached 245 points. The m arket was relatively weaker in the second h a lf o f the year and freight rates deelined. The weakening o f the m arket in the mid-year m onths is fairly norm al in the case o f both bulk and tanker cargoes. However, ^part from seasonal factors, this weakening o f dem and may be partly attributed to the tonnage requi- rements for the transport o f grains as com pared with earlier in the year. D em and for tonnage for the transport o f grains was reactivated in O ctober and to ta l voyage and consecutive voyage fixtures during this m onth were a t alm ost the same levels as in the corresponding m onth in ل973.مو A t the beginning o f the last quarter o f the year there was, also, a significant reactivation o f the time charter m arket. However, snbseqnent develop-
٠؛ Fears were expressed throughout 1974 of a possible recession in the economic growth of the industrial countries as a result of higher oil prices. See The Petroleum Economist (London), voi. XLI, No. 1 (January 1974), The Shipping Statistics and Economics: S ix Monthly Review (London), June 1974, published hy H. p. Drewry (Shipping Consultants) Ltd., London, and OECD Economic Outlook (Paris), No. 15 (July 1974).
٠٠ Lambert Bros Shipping Ltd., World Trade Review and Outlook, No. 9: A Review o f Developments in World Trade and Their Effect ٠« the Shipping Market (London, September 1974).
٠٢ Westinform (London), No. 135, September 1974. See also Zosen (Tokyo), vol. XIX, No. 5 and (August 1974) Journal ٠/ Commerce (Liverpool), 27 September 1974.
٠٠ During 1972/1973, 80 per cent of the deadweight of the combined carrier fleet was in operation in the oii trades. It dropped to 71 per cent by the end of 1973 and was at 60 per cent throughout the first half o f 1974. The volume o f tankers operating in the grain trade grew from 660,000 tons in December 1973 to 1.8 million tons in June 1974. (John I. Jacobs and Co. Ltd., World Tanker Fleet Review (London), June 1974). Also from mid-September to the end of Dctober 1974, tankers o f 5 6 1 ,0 س dwt were chartered for the transport of grains as compared with 126,000 tons in the corresponding period of 1973 (Westinform (London), No. 44, 2 November 1974, and ؛ه؛مح ., No. 44, 3 November 1973).
٠٠ 7,922,000 tons in October 1974 as compared with 7,913,000 tons in Dctober 1973 (Westinform (London), No. 44, 2 November 1974, and ،■ ه'،مح ., No. 44, 3 November 1973).
35

o f 1975, rising to 160 million tons in the following two )?ears, w^s heing serious!)? predicted.“ ،
139. The nncertaint)? regarding the immediate future o f the tanker m arket is further aggravated by the like- lihood of the reopening o f the Suez Canal in 1975. It has heen estim ated tha t this would reduce the dem and for tankers by 10 per eent.^®؟ f t appears therefore that, unless something extraordinary happens, in the next few m onths m ajor steps are likely to be taken to reduce surplus tonnage through increased laying up, scrapping, and the caneeliation o f orders.
140. Currency instability, whieh was so m arked in 1973, persisted, although with less intensity, in 1974. This, coupled with high rates o f iufiation, raised the question o f the elhcacy o f the long-term charter arran- gements which are such a hasic feature o f world trade in oii and other hasic commodities. A solution to world m onetary and other économie problem s is, o f course, the m ost desirable way o f resolving the doubts ahout the future o f long-term chartering. Alternatively, ways m ight he sought o f adapting chartering to the unstahle m onetary and economic conditions by, for example, some form o f indexation o f eharter rates.
141. In the liner trades, a num ber o f freight rate increases th a t were announced in late 1973 came into e^ect early in 1974, and further freight rate increases were announced during 1974. Gonsequently, the liner freight index Jumped by 21 points in the hrst quarter (see table 28). Tiner freight rates showed a rem arkable and consistent rise for the rest o f 1974. By the end of July the freight index had increased by 35 points over the end o f 1973 figure (134) and stood a t 189 as against 139 points for the corresponding date o f 1973. The index rose further to 194 points in the th ird quarter o f the year, and to 197 points at the end o f December.
B. Changes in freight rates in 1974
1. D ry cargo tramp m arketfreigh t rates
(a) Voyage charter freight rates142. The developments in the dry cargo m arket
discussed in section A above are refiected in the m onthly freight rate indices for 1974 shown in tahle 28. It can he observed from the table tha t the m onthly index for dry cargo voyage charter freight rates rem ained a t very high levels during the first ha lf o f 1974, although a t the end o f June it stood a t 226 points as against 241 a t the end o f December 1973. A further decline was registered in the third and fourth quarters o f the year, hu t no fundam ental change is in sight a t the time o f writing (December 1974). A lthough such a ehange cannot be excluded, because o f the sharp increase in bunker costs it is difiicult to envisage freight rates declining to the levels which prevailed hefore the upsurge in the last m o ^ h s of 1972, unless there were a m ajor world economic depression. By way o f com parison, selected maximum
this, winter came early in certain parts o f the N orthern hemisphere. A t the time o f writing this Review (December 1974) the oil freight m arket situation is gloomy, with freight rates again following a downward trend. In particular, freight rates for VTCCs reached a new low point in the world scale (32ظ ) in December The relative decline in oil consum قء.1974 ption in m ost o f the m ajor consuming countries ءء caused the dem and for tonnage to be relatively low during 1974; for example, only 117 time charter fixtures were reported in the first half, com pared with 276 in the same period in 1973.١٠٠ This low dem and failed to m atch the inerease in supply through substantial new deliveries, am ounting to an increase o f 8.6 per cent in tanker tonnage in the first six m onths,“ ، thus leading to a weak m arket.
137. The situation tha t prevailed in the tanker freight m arket triggered various corrective aetions from tanker operators, sueh as switching tankers and combi- nation carriers to the dry cargo trades and deliberate under- utilization o f tonnage through slow steaming and indueed w aiting ل٠ق. I t has heen estim ated tha t the whole world tanker fieet is being operated a t a speed two knots lower than norm al, which gives an economy in hunkers o f 25 per cent; it also reduces the transport capacity o f the fieet by 8 per عء0ا.قمل A bsorption o f surplus tonnage through reducing productivity by slow steaming and induced waiting goes some way to explain why, in a situation with apparent over-tonnaging, there was a surprisingly low level o f laid-up tonnage in 1974 (see paragraph 164 helow).
138. The future prospects for the tanker m arkets are not very encouraging. M uch depends on the levei o f oil consum ption by industrial eountries, which in the short run is dependent on the level o f economic activity and in the longer run on the outcom e o f urgent studies which countries are m aking on how to diversify their sources and types o f energy used. In general, however, dem and for tankers is no t expected to recover quickly, while at mid-1974 there were nearly 195 million dwt o f tanker tonnage on order for delivery in the next few years. Assuming no suhstantial caneeiiation of orders, a surplus o f 25 to ه8 million tons by the end
١٠٠ John I. Jacobs and €o . Ltd., World Tanker FleetReview (London), 30 June 1974.
١٠٠ OECD Economic Outlook (?ar!s). No. 15 (July 1974).
٠٠ Lloyd’s List (London), 5 December 1974.٠٠ See OECD Economic Outlook (Paris), No. 15 (July 1974),
The Petroleum Economist (London), vol. XLI, N o 7 (July 1974), and Fairplay International Shipping Weekly (London), vol. ^5^, No. 4752 (19 September 1974).
١٠٠ Fairplay International Shipping Weekly (London), vol. 252, No. 4745 (August 1974).
١٠١ Lambert and Bros Shinning Ltd., World Trade Review and Outlook, No. 9: A Review o f Developments... (op. . ر.؛'،ء
١٠٠ Shipping World and Shipbuider (London), vol. 167, No. 3895 (July 1974). At the last week o f November, about 2 million tons of tinkers were idle in the Persian Gulf area and this tonnage increased to about 4 million dwt at the last week of December 1974. R.S. Platou, ‘T anker: Weekly Tanker M arket Renort” (Dslo), 27 November 1974 and 22 January 1975.
١٠٠ See Journal de la marine marchande et de la navigation aérienne (Paris), 56th year. No. 2856 (12 Sentember 1974), П• 2367, where an article by Svensk Sjofarts Tidning, organ of the Swedish Shinowners Association, is reviewed. According to another estimation, by cutting the s n ^ d of a ¥ L € € 25 ner cent, 59 ner cent of bunkereonsumntion could be saved. (John 1. Jacobs and Go. Ltd., World Tanker Fleet Review (London), 39 June 1974.)
36

0ك
■&
I I يء
هي &
د ء ه
. 0ر .ة
0 ئ
ا ا ! ا
ا » أ
اق
■ة ة
H - ء
< 0
٠١ ٣٦ о يم
٣٦ Х-Н ^ م يم يم
٢٢ ٢٢ ١٠ ١٠
© ي ٢٠٠ ي ص يم ج 0О ٠١ ٠١ ٢٣ ٣٦ 00 00
о 2 ٠ ج 00© ©
ص ج
نت ^ ؟ب ١٠ يم يم يم ٣
٠ ة
يم00
يم00
١٥و
ج[مح0آ00 ة م ت 0و ءتأ00 0ة0 ت ء
دم ٢٣١ ٠
٣ ٠٠ ١٠ ©
هi
aأ|ق ة <له| | |
ؤ !ا
تية
3?

and minimum tram p freight rates in the ؛/ears 1970 to year to 257 points (see table 28). However, this over-all1974 are shown in anne^ VII. picture of the time charter m a r ^ t does no t accnr^tely
reflect the particular developments with regard to the(b) Time charter fre igh t rates main size groups o f tonnage covered by the index. This
143. The time charter freight inde^ had also declined is shown below: ١٠®from 358 points in the fourth quarter o f 1973 to 322 pointsin the second quarter o f 1974 and 251 i n h؛ e th r؛ d q u ؛ rter loe Based ٠« (he time eharter index numbers compiled by (heof 1974, bu t it rose shghtiy in the fonrth quarter o f the United Kingdom Uhamber of Shipping.
Tonnage groups indexCom bined
index
Change
175
212
267
307
322
251
257
Change Change (Per cent) صص (رءم■ cent) Over مر،
186
216
312
317
212
223
+ 22.5
+ 17.9
+ 34.1
+ 7.1
+ 2.82
Change (Per cent) د٠م
178
218
261
350
310
335
+ 29
+ 11.8
+ 26.6
+ 8.7
- 4.7
ء ء/-ام ،م Quarters ما
138 . . . . . .1 9 7 3 1st
178 . . . . . 2ndl973
199 . . . . . 1973 3rd
252 ٠٠... 1973 4th
277 ٠٠. . . . 1974 1st
296 . . . . . 1974 2nd
282 . . . . . 1974 3rd
271 . . . . . 1974 4(h
т а г у o f freight rate changes is given in table ^9, together with corresponding flgures for 1973 and 1973.
147. It can be seen from the above flgures tha t the nnm ber of straight liner freight rate increases in 1974 (143) was signiflcantly lower than in 1973 (194) but, as is shown below, the size o f increases was substantially greater than in 1973.١٠®
! in freight tarriffs *Summary nf straightforward in
ا1974 ل/ء
N um ber Percentage Num ber Percentage ٠/ o f total ٠/ م،/م،س
increases increases increases increases
روم
(12.1) 8 (6.3)(5.1) د (2.3)
(49.8) 26 (29.3)(16.6) 13 (19.2)(17.2) 59 (46.1)
(5.7) 19 (14.8)
419
6426
S ize group o f increase
Under 5 % . . . . . . 5 and less than 7.5“/لا 7.5 and less than 10.0"/©
10 and less than 12.5"/©12.5 and less than 15.0"/© 15 and less than 20.0"/© 20"/© and o^er . . . .
157 (100.0) 128 (100.0)
* Excluding announcem ents which (a) referred to a flat inerease in te r؛tt$ o f am oun t o f m oney ^٠٢ u n it o f cargo (there were 13 such announcem ents in t^e year 1974 as against 11 in 1973); (،>) d id n o t specify the percentage increase (there was one such announcem ent in 1974 as eom pared w ith 26 in 1973).
It C^n be seen th^ t 6^.9 per cent o f the totul num ber o f increases in 1974 were o f 15 per cent o r more, as com pared with 33.9 per cent corresponding increases in 1973 ^nd only 9.8 per cent in 1973. The m odal size o f increase
Review o f maritime١٥؟ ^ o r the corresponding data for 1972, ؛ transport 1972-1973 (op. cit.), para. 175.
144. It can be observed from these data th a t the indices for the three size groups eaeh followed quite a different course, particularly dnring 1974. In fact, the index for 9,000— 16,000 dwt vessels reached its highest level only in the middle o f 1974 and dropped only slightly during the second h^lf o f the year, whereas at the o ther extreme the index for bulk carriers o f over40,000 dw t lost 186 points between the fourth quarter o f 1973 and the th ird quarter o f 1974 and, although it rose slighly dnring the last quarter, it came back to a level only slightly higher than in the second quarter o f 1973. Between the two extremes, the index for vessels o f 30,000—40,000 dwt also reached its peak in the fourth quarter o f 1973, bu t declined less sharply during the flrst three quarters o f 1974 than the index for vessels o f over 40,000 dwt and rose slightly in the fonrth quarter.
145. The developments in the time charter indices described above dem onstrate a relative increase in dem and for small, mostly multideck, vessels, suitable for carrying general cargoes and employm ent in liner trades, and also for medium-sized carriers offering a wide flexibility with regard to both routes in which they can be employed and cargoes they can carry. I t remains to be seen whether the developments which occurred in the freight indices during the last quarter o f the year point to the beginning o f a change in the pattern observed to date.
3. Cargo linerfreight rates146. The changes in liner rates and surcharges ١٠؟
announced in 1974 are shown in annex VIII. A sum-
١٠٢ ?o rt congestion surcharges not being of general application in a tra4e are not inelu4ed among the liner freight rate changes listed in annex VIII.

Table 29
Summary of liner freight rate changes and surcharges announced during the years 1972-1974
^changes ،،?،٢ N um ber a ffre ig h t
197419731972
142
311
194
11
348
29
11911816812
166155
47
457
16
185
553
1617
33
Type a ffre ig h t rate changes
General Increases in freight tariffs . .General freight increases partly offset by
incorporating into the tariffs part or al of pre-existing surcharges . . . . .
Announcements o f new surcharges or 0 increases in pre-existing surcharges، CAF (currency adjustment factors)B u n k er..................................................Bunker/CAF combined . . . . . Others (preshipment, emergency, hand
ling, ianding, storage, etc.) . . .
Sub-total
Oases where pre-existing surcharges were incorporated into tariffs through cor- responding increases in tariffs . . . .
Cases where surcharges were reduced or cancelled without being incorporated into tariffs
T o t a l
Source: Com piled on the basis o f annex V ÏII مظ0ا^م اThe num ه ber o f freight ra te and surcharge changes sum m arized (658) is g reater than the num ber o f announcem ent^
(607) show n in annex V III because, as in previous years, in several cases one announcem ent carries m ore th a n one change.١١ In 1974 there were 1^ announcem ents o f new com bined C A F and bunker surcharges o r o f increases in pre-existing
surcharges th a t are n o t show n in the table.
However, 1إ may be doubled whether the butrker price situation is yet stabie enough to justify this action, and the incorporation o f bunker surchar§es at the !evels a t which they existed in 1974 may weli be prem ature.
150. Shippers in certain trades have com plained tha t shipowners reacted m uch too severely in their im position o f bunker surehar£es *٠® and tha t the maiffienance o f these surehar^es by conferences eould only be expi^ined as a means o f enhancing shipowners profitability .**٠ In the trades o f one country a t least, a specific form ula has been agreed upon *** by liner operators and shippers for the assessment o f a proper level o f bunker surcharges, bu t generally it does no t appear tha t a solution has been found whieh could satisfy both sides, partieuiarly in
*٠٠ In م/ئ’ء محر List (Tenden), 21 February 1974, it was stated that a resulutien was passed 15 shippers councils in Furope appealing to shipowners to keep bunker su r^arges as low as possible as these surcharges had reached a levei where they have become prohibitive to the trade on various routes. See also 1«،/ ءس«مء'م«ه
و؛ه/ر مر«ه/ (م^ءء-ممءء ءء » -اآ-ء آ ءممتس (Basei), 35th year. No. 1ه (8 Mar^h 1974), p. 1 ه51م
"ءس'ءجءء ،ر ا لل سمأ Gazette (То^уо), 5 August and 29 August 1974.
*** The Central Freight Bureau of Sri Lanka reached agreements with the Ceylon/United Kingdom and the Ceylon/Continental Conferences providing that in the future the eonferenees will adopt a mutually aeeeptable formula for ealculation of bunker and CAF smeharges. Furthermore, the conferences are to furnish infor- motion and supporting data to justify sueh sureharges {Seatrade (Colchester U.K.), vol. 4, No. 7 (July 1974)), p. 78.
in 1973 was in (he size grcup ١٠ per cent and )ess than12.5 per cent, whereas in 1974 it was 15 per cent and less than 20 per cent.
148. As in 1973 the changes in liner freight rates, particularly during the first quarter e f 1974, were charge- terized by the great num ber ©f bunker surcharges imp©sed. In to tal, there were 168 announcem ents o f new or increased banker surcharges in 1974 as against 155 in !973. In addition, 12 new or increased combined bunker/C A F surcharges were announeed in 1974. Furtherm ore, the bunker and combined sureh^rges imposed were relatively high; for example, m ore than half o f the announcem ents o f bunker surcharges stated as a percentage o f freight rates fell w ithin the rang© of 15 per cent and over, while the eombined bunker/C A F sureharges all fefi within the rang© o f 25 per eent and over. There was, however, a noticeable slowdown in the num ber o f announcem ents after the first quarter o f the year; (here were, in addition, 88 announcem ents o f decreased bunker surcharges and one bunker sur- charge was ^boiished w ithout having been incorporated in the tariff
149. In the latter p art o f the year there was an evident tendency for bunker surcharges to be incorporated in the tariffs. In all, 19 bunker surcharges were ineorpo- rated, 14 o f these during the last quarter o f the year. Such a development indicates an aeeeptanee th a t inere^sed bunker prices can no ionger be regarded as temporary.

However, the increased orders for générai cargo and multi-purpose vessels since 1973 may alleviate this risk.
153. fn 118 cases, currency adjustm ent sureharges were introduced or increased as a result o f the weakening o f the dollar vis-à-vis other currencies during 1974, This action in itself raised strong objections from shippers, who argued th a t the world m onetary situation in the first h^lf o f 1974 h^d stabilized enough to allow confer- ences to abolish o r reduce currency In fact, 87 reductions o f currency adjustm ent factors were announced during 1974.
154. The very frequent and sharp increases in liner freight r^tes in the last two years have caused grave concern am ong shippers, particularly in developing countries, who in the last analysis are the ares th a t hear the brunt.^“ ^ i t h liner freight rates changing at frequent intervals, shippers have increasingly found that one o f the supposed advantages o f the conference system, namely stability o f freight rates,^^® has hardly existed. While bunker costs, com bined with general infiationary trends, have undoubtedly contrihuted to the rise in liner freight rates, it is d i^ c u lt to accept that such a consistent rise can be explained purely by these two factors. M any shippers, faced with rate increases o f over 15 per cent plus surcharges, m ust have found their freight bills increased by as much as ^5 to ه3 per cent, ©ne cannot help thinking tha t the rise in liner freight rates cannot be fully explained w ithout taking into account as an im portant element the strong dem and conditions which have generally characterized all dry cargo m arkets since1973. I t has heen reported th a t shipper’s eouneils o f countries members o f the A ssociation o f South-East A sian N ations (ASEAN) have asked their respective governments to conduct a prohe into the activities o f the F a r Eastern Ereight ©onference (FEFC), which would no t he restricted to the question o f ta rilf increases alone,،®®
conventional tonnage had rednced the fiexibilit^ and restricted the operation of sonre shipowners. According to another press report, steel producers in Europe have also been complaining that, because of investment policies by shipping companies in eontainer ships, they have been experiencing shortage of conventional tonnage space, particularly ^ r those commodities that cannot be transported in containers {International Ttransport Journal (Overseas ء ؤ؛ ء ئ ء ر (Basel), 35th year. No. 46 (15 November 1974)), p. 5393.
For example, the Freight Gommittee of the Council of ؟،،All-Japan Exporters Association (CAJEA) demanded that the conferences reduce or aboiish their currency surcharges because the value of the yen had stabilized at a lower figure than Y 300 to the dollar. Japan Maritime Gazette (Tokyo), 8 February 1974.
١١٠ According to press reports and other information, shippers organizations in several countries, including Japan {Japan Maritime Gazette (Tokyo), 13 and ^0 August 1974), Malaysia and Singapore ( List (Fondon), 24 September 1974), Australia {Fairplay محمماء’ءInternational Shipping Weekly (Fondon)), vol. 251, No. 4734 (16 May 1974), Hong Kong {Shipping and Trade News (To^^o), 22 July 1974), have strougly reacted to proposed liner freight rate increases in their trades.
١١؛ It was reported in ء’ء / محمم List (F ondo^ , 23 August 1974, that Indian shippers complained that conferences were impeding the export trade of India and did not e^ctivei^ perform their primary functions o f providing regular and frequent services to the trade at stable prices.
١٠® هم؛،ر/ي Maritime ء،،هممم (Tok^o), 28 ©etober 1974. See also ء’ء / محمء List (L ondo^, 5 September 1974, where it has been reported that a common front was sought b^ the Shippers councils of ASFAN countries.
view o f other qdditiooql eorreetive measures t^keu by litter operators to reduce the e ^ c t o f the increased bunker costs.
151. $uch measures as’ reducing curtailing the num ber o f sailings and the num ber o f calls made at ^orts, as well as no t calling a t interm ediate ^orts, have significantly altered the e jec ts o f rising bunker prices, while they have also changed the over-all cost/ revenue relationship o f the liner operators concerned. Indeed, reduced speed means longer round voyage times, partly o^set by the curtailing o f the num ber o f po rt calls. Buch measures also tend to increase space utilization. A reduction in the num her o f sailings should also free carrying capacity for employment elsewhere, perhaps in the open m arket. F o r sueh reasons, while it is clearly possible to assess the position i^ an individual trade, it is very difficult indeed to Judge the reasonableness o f the levels o f banker surcharges in general. I t is w orth noting, however, tha t according to press reports liner operations have recently shown increased profitability and that, in the case o f Japanese liner companies, increased profitahility was stimulated hy “rationalizing” their operations, by cutting down their sailings and limiting their ports o f 03 ا1.قلل
152. The corrective measures taken by liner operators, coupled with delays in ports and increased dem and for liner services, resulted in m any trades in a very tight tonnage situation. Particularly during the first and second quarters o f 1974, a general shortage o f tonnage developed, causing serious problem s to shippers .١١٠ The argum ent advanced by shipowners to defend their position was tha t the scarcity o f tonnage w^s the direct result o f port congestion and slow tu rnround o f ships a t
اآ للمة ء0ة ^ h i le there was undoubtedly some deterio- ration in the perform ance o f certain ports, it is difficult to accept th a t this could h^ve been sufficient to have caused a shortage o f tonnage as widespread as that which existed. I t appears tha t the previous tendency for liner operators in industrial countries to shift to containerization o f their m ajor liner trades, so th a t the building o f conventional liner tonnage was neglected, threatened to reduce below any desirable standards the fie^ibility o f shipping services in the liner 1 هكعك8.ءلل
ا1 ١١٠ was reported that speeds were reduced by 1 to 1 knots ت/'and estimated that in this ^ ay a 16/17 knot cargo liner ship could cut consumption by about 20 per cem, because It is at the higher range of speeds that fuel concumption accelerates significantly {Fairplay International shipping Weekly ( London), vol. 250, No. 4724 (7 March 1974).
١١٠ محمم/ء’ء ءء’ءء (London), 31 Gctober 1974. Bee also ر،ما،ا « Maritime Gazette (Tokyo) II November 1974.
١١١ F or example, by the end of August 1974 it was estimated that there would be something li^e 60,000 tons or more of goods waiting for shipment from the United Kingdom to Australia and New Zealand alone. Journal ءسمء -ا ٠/ ءء (Liverpool), 22 July 1974. €f. also ibid., 13 February, 19 May, 20 May, 8 July and 22 July 1974, /ئ’ءء/مح محمم (Londoffi, I I June 1974, and Shipping and Trade News (To^yo), 2 August 1974.
ءمر-س/ ٠ ١١٠ ء/ / Commerce (Liverpool), 28 May and 17 Gctober 1974, a n d محمماء’ءء'،ء؛ (London), 25 May and 20 July 1974.
١١٠ I t was reported in the Journal ٠/ ءء-اءسهء (Liverpool), 19 May 1974, that the shortage o f shipping space that developed in the first half of 1974 was a worldwide problem and partly attributed to ffie containerization of major trade routes. The replacement of

(й) VLCC and U LC C (about 150,000 dwt and larger);ء) ) Medium-size crude carriers (about 60,000 dw t to
around 150,000 dwt);Small crude carriers ^nd product carriers (about (ء)
30,000 dwt to 60,000 dw t);{d) Handy-size dirty (up to about 30,000 dwt);H^ndy-size clean (up to (ء) about 30,000 dwt).
159. According to the source *®م several reasons mad© this ehange desirable; for instance,, developments in recent years have cleariy shown tha t VLCCs and ULCCs will increasingly dom inate the tanker freight m arkets and it appears tha t the present !evel o f freight rates for these sizes o f vessels m ust be regarded as m ore “norm al” than the level o f rates whieh prevailed in the m arkets in the reeent past. the other hand, freight rates for the variouscategories o f smaller size groups tend to follow different patterns and it appears likely th a t gaps between the rates for the various size groups m ay widen further in the future.
16d. Lhe new indices are shown separately in table 28. f t can be seen from the table th a t ah five indices deelined during the period January-A ugust 1974, but w ithout all following the same pattern. In addition, the rate of over-all decline in this nine-m onth period varied between the indiees for different size groups. In September 1974 the index for V LCC/ULCC dropped by 52.1 per cent from its end-of-January lev©!, as eom pared with a deciine o f 49.3 per eent for handy-size ©lean tonnage, 44.5 per cent for medium-size ©rude carriers and around 38 per cent for smail ©rude and produet earriers, and handy-size dirty carriers. Lhe inere^se recorded in October 1974 w^s only short-lived and in N ovem ber all indiees drop- ped weil below their September 1974 levels.
and also to give fuh support to the shippers’ councils’ counter-proposals to the FEFC.*®* The Governments o f M alaysia, Philippines and Singapore have sent protest notes to the FFFC.*®® The F E F C postponed tiii 1 January 1975 the entry into force o f the announeed freight increases so th a t farther consultations could be held.*®®
155. The resistance o f shippers to increases in liner freight rates has been m ore effeetive in trades where relatively few large shippers are involved or where dem and for their services is eonsoiidated. Proposed freight rate inereases by a num ber o f shipping confer- enees *®* in the export trade o f Japan have, up to the tim e o f writiug, been blocked by the strong resistance of the Japan A utom obile M anufaeturers’ Association, whieh pressed to have the rate o f car exports declared open. In addition, the A n tr a l Freight Bureau o f Sri L anka has stipulated th a t freight has to be paid loeally and has been blocking m ore than $500,000 o f freight charges as a result o f disagreements on the level o f bunker surcharges im posed by the Ceylon/USA Gonfer- once.*®ء The Central Freight Bureau reacted strongly to a deeision o f the C ey lo^U S A Conference th a t freight rates m ust be paid a t destination rather than loeally. Aeeording to press reports, the Bureau withheld cargo from operators in (he conference until the operators complied with its decision.*®®
156. I t has aiso been observed that, in trad© routes where there has been a relative oversuppiy o f liner tonnage, earriers have been com peting for cargoes at rates lower than those set in the tariffs.*®’ I t may be tha t com petition may also develop where shippers can eonsolidate their e^rgo shipments with the aim o f m aking them attractive also to nomconferenee tonnage operators.
c. Freight rate Indices of selected commodities exported by developing eonntries
161. The Committee on $hipping o f U N C TA D at its sixth session in July-August 1974, after considering a secretariat report entitled “Freight rate indiees”,*®* requested the secrétariat to ©ontinue the w or^ on the freight rate indices for four selected commodities exported by developing eountries, i.e. eocoa, eotton, rubber and tea, and to publish them regularly in the Review o f M aritim e Transport.
162. The updated freight rate indiees for (he four selected commodities as well as the com bined inde^ through the third quarter o f 1974 are contained in tabie 30. As can be seen from (able 30 the combined index rose by 29 per eent o r from 159 to 205 between the end o f $eptem ber 1973 and $eptem ber 1974. The indiees a t the end o f the period (base 100 = 968؛) were as follows:
€ ٠٥٠^ 193C o t to n 224
3. Tanker freight rates
157. The weakness o f the tanker freight m arket and the fiuetuations observed in !974 in chartering aetivities are refieeted in the tanker freight index. The index fel! from 390 *®® in October 1973 to 98 in August 1974, but rose to 115 in $eptem ber 1974, the last m onth for whieh inform ation based on this index is available.*®®
158. As from January 1974 the index was replaeed by separate indices for five tonnage categories;
Information communicated to the UNCTAD secretariat م®*by Norwegian Shipping News (0$!o).
*®* TD/B/C.4/111 and Corr.l and Add.l.
*®* Lloyd's مح'،ء (London), 12 October 1974.*®® Financial Times (London), 29 October (974.*®® Lloyd's List (London), 9ل October D74.*®* Japan Maritime Gazette (Tokyo), 13 November 1974.
The Conferences involved are the Australian/New Zealand/Eastern Conference, the Japan Thaiiand Erei^ht Conference and the com ferences serving the trade routes Japan/Africa and Japan/Latin America.
.Ceylon Observer (Coiombo), 25 October 1974 ؛®** 3 1 ,. ؛٠ /ه/مح October !974.*®’ Japan Maritime ءصه ءء؛ (Tokyo), 13 November 1974.*®® A t 399 points the index had reached its highest level since
the Korean war.*®® Information compiled and communicated to the UNCTAD
secretariat by Norwegian Shipping News (Oslo), for the purposes of the Review.
41

T a b l e 30
ites of selected commodities exported by developing conn(r!<؛s(Indices at end o f quarter. 1968 = 100)
Indices of 1
Combined
Commodities
RubberCottonCocoaQuarterYear
99.5
100.9
102.2102.6103.4103.5
104.8104.9107.3108.5
113.3115.0121.6125.1
133.^132.7134.1 135.5
193.7*200.7*204.9*
100.0100.3
102.6102.6102.6101.2
101.1101.1105.5105.9
106.3111.4 118.3120.7
129.9129.0130.7131.1
190.7195.4191.3
103.3103.7103.1102.3
103.4103.5104.6105.1
112.5113.0 116.3119.8
132.2131.1133.6130.6
200.8*200.4*
100.199.6
100.1100.1
100.1100.1103.1104.8
106.4 106.6107.9 110.^
115.1116.7127.1130.4
135.5 136.0136.7 137.3
101.8
103.9105.2105.8106.9
109.8109.8114.9 116.1
120.7120.9 126.1 131.5
135.1134.2134.4135.5
IIIII!٧
IIIIIIV
IIIIIIV
207.7187.3192.4192 .5
IIIII
1968
1969
1970 T11 . . . . . . .
TU -I V . . . . . . .
1971 III . . . ٠ . . .
I l l ٠ . . . . . .I V . . ٠ ٠ . . .
1972
1973 T 147.6 153.0 143.0 142.6 146امII . . . . . 157.7 162.4 146.1 147.1 153.:
Ill . . . ٠ . 159.7 166.7 157.0 147.5 158.(IV ٠ . . . . 165.0 175.1 168.1* 163.9 170.(
1974
Sources: Compiled on the basis o f trade data and freight rates supplied to t^e secretariat by the Governments or trade organizations, conferences and shipping lines concerned, and on trade data from the following publications; Annual Bulletin o f Statistics, published International Tea Committee (London), various issu؛؟ ;Rubber Sta tistica l Bulletin, published by t؛te secretariat o f the I^ernationa! Rubber Study Group (London), various issues;
Co^îon^wôrlfsïad^Ucs, ^uhi^shed h؛>^he؛ inte؛-natio^ai Cotton Advisory Committee (Washington, 0 .C .), various issues.
٠ Provisional.
between the changes in the level آه freight Tates and changes in the level o f laid-up tonnage in the short as well as in the long term and this is illustrated in graphs 1 and 2 covering the ؛/ears 1968-1973. The freight rate indices are shown on the right-hand vertical axes and the corresponding changes in laid-up and strapped tonnage as percentages o f world tonnage on the left- hand vertical axes.
164. The relationship between laid-up tonnage and freight rates in the tanker m arket did no t conform to this usual pattern in 1974. The am ount o f laid-up tonnage decreased in the h rst and second quarters o f 1974 at a time when freight rates declined snbst^ntiall؛/. A t the end o f the second qnarter, laid-np tanker tonnage as a percentage o f the world fleet stood a t 0.08 per cent w ith the tanker freight rate inde^ at 103, while for the corresponding period in 1973 laid-np tonnage was0.27 per cent and the freight rates index 267. A t the
R u b b e r 200 *
Combined . . . . . . . . . . 205 *
* Provisional.
This over-all increase was partieularl)/ sharp between the end o f the th ird quarter o f 1973 and the flrst quarter of 1974 (22 per cent in the combined index), reflecting to a considerable extent the introduction o f new or increases in pre-existing bnnker surcharges in the course o f these quarters, as can also be seen from annex VII.
D. The level of freight rates, laying up and scrapping
163. f t has been generally observed tha t the am ount o f laid-np tonnage will be low when freight rates ^re at a high level and vice versa. A negative relation exists

G raph
! ofvrorld tonnage, 1968-1974
٠٢ ^^ cargo charter freight ra te indices ٠
:35
235225
The course of freight rate indices and laying-up and scrapping تDry cargo vesseis
? e r cen t o f w orld dry cargo fleet
0.30
0د5
0.20
0.15
0.10
0 * L t 973 '1974 — j
N orw egian $h i^^ing N ٥١ ^: dry cargo voyage charter freight ra te index (July 1965- Ju ly ء 100 1966 )L aid -u^ dry cargo tonnage as a percentage o f w orld d r^ cargo fleetC ham ber o f Shipping o f U nited K ingdom : dry cargo voyage cha rte r freight rate index, d iscontinued since 1969 (I960 = 100)S crapped dry cargo tonnage as a percentage o f w orld dry cargo fleet
٠ C ham ber o f Shipping o f the U nited k in g d o m index: (1969 100 ء ) N orw egian Shipping News index: (July 1965—July 1966 = 100).
Sources:(٥) Freight rate indices ; T ab le 31.ءه Laid-up tonnage (ء) com ;<،آ piled by the U N C T A D secretaria t o n the basis o f da ta provided by
the C ham ber < f Shipping o f the U nited k in g d o m regarding la id-up tonnage (given by the source as o f the beginning o f ^ c h m on th to ه ا ?و0 جةبء o f the end ^ e a c ) ! ؟؟ ©nth from 1971 on>^ard$), an d on the basis o f w orld fleet tonnage as published in In stitu te o f Shipping Econom ics, Shipping S ta tistics ...
( ء ««م )ء ^٢٠^^ ءكه ra tio : com piled by th؟ secretaria t o n the l>asis o f scrapped tonnage and world deet tonnage as published in Institute of Shipping Econotnics, Shipping Statistics... (op. ء //. مر
43

G r a p h
e, 1968-1974
T anker freight ra te index (Intascale = 100 and W orldscale = 100)
The course affreight rate indices and laying-up and scrapping as percentages of world ١Oil tankers
P er cent o f world oil tanker fleet
1Э72— — 1973-1970——►-،Г— 1971-1968 1909
T anker freight ra te index (W orldscale = 100)
T anker freight ra te index (Intascale = 100)
- — — — — — — — Laid-up tanker tonnage as a percentage o f w orld tanker fleet
--------------------------- $crapped tanker tonnage as a percentage o f w orld tanker fleet
Sources:(a) Freight rate index: T able 31.Laid-up tonnage ra (ظ) tio : com piled by the U N C T A D secretariat on the b^sis o f da ta provided by the C ham ber o f $hipping o f the U nited R ingdom regarding laid-up
tonnage (given by the source as o f the beginning o f each m onth up to 1970, and as o f the end o f each m onth from 1971 onw^r،]s), and on the basis o f w orld fleet tonnage as published in Institu te o f Shipping Econom ics, Shipping S tatistics ... (op. . /ع رمء
Scrapped tonnage ratio : compile،! by the secretariat on ((ء tlie basis o f scrapped tonnage an d w orld fleet tonnage as published in Institu te o f ^hip^ing Econom ics, Shipping Statistics ... (op. c i t.) .

168. The improvement oh^ervefi w ith regard to the nine commodities shonid be welcome, provided it is no t short-hved; however, priee booms generahy do no t last for long, while the upw ard movement o f liner freight rates is apparently continuous. $een from this angle, it is useful to note that, in spite o f the im provem ent recorded in 1973, in the long run (decade 1964-1973) a reduetion in the freight/price ratio has been observed with regard to only hve commodities. D uring 1974 eom m odity prices appear to have stabilized and some even declined significantly, while large freight rate inere^ses were e jec ted during the same year; so it is expec- ted, therefore, tha t the relationship between freight rates and prices will once again deteriorate.
Freight ratio changes between 1972 and 1973
Freight ratio changes between 1964 and 1973
Increase Decrease Increase Decrease
/«’'12.4 + + 23.2ام0+ 4.و/»م
-44 .7%
-4 (
- 2
ء/م
%
/«٠
%
/«٠
ام0
7.1% -
«/«14.0-
-24.2ء/م
«/«19.8-1.ك»ا0 5-
- 7م1/»م
«/«4.4 -
Jute . . . . . . . . . ا0«81.6+
Coffee (from Brazil) . . +42.9»ئSisal hemp . . . . . . +19.6»/»T in +16.7»/»R ubber. . . . . . . . +15.0»/»Coeoa beans (from
Ghana) . . . . . . . + 0.0»/oB a lm ^rn e ls . . . . .Goeoa beans (from
Brazil) . . . . . . .Copra . . . . . . . .Coffee (from Colombia-
Atlantie ports) . . ٠ Coffee (from Colombia-
Baciffe ports) . . . .
end o f the year, however, the situation had changed somewhat and laid-up tonnage rose to 1.6 million dwt com pared with 0.15 million dw t in lu n e 1974. This delay in the response o f the level o f laid-up tonnage to declining freight rates can be attributed mainly to the measures taken by tanker operators to offiset increased unker prices^ reduced operating speeds, including؛7induced w ؛ا itingر and diversion o f tonnage t؟ the dry cargo m arket. A nother factor was th a t freight rates for the smafi-size groups o f tankers remained relatively high, and thus enabled carriers to continue their opera- tions with some m argin o f profit.
165. The level o f laid-up dry cargo tonnage remained very low as a logical consequence o f the generally high levels o f freight rates for dry cargo tonnage throughout1974.
E. Liner freight rates as a percentage of prices of select(] co!nmodities, 1964-1973
166. Tahle 31 gives the “freight ratios” o f liner freight rates to export prices o f 13 selected prim ary commodities exported from developing countries to Europe for the years 1964 to 1973. F o r one additional commodity similar data are presented up to 197©.
167. The year 1973, which has hecome known as the eom m odity price hoom year, witnessed increases in prices for all bu t two (jute and tea) o f the commodities listed in the tahle for which d^ta were available. W ith regard to nine commodities, prices rose faster than freight rates. Hence freight ratios for these commodifies declined, in some cases very substantially, but increased further for ju te and tea and also for coffee in the Brazil to Europe trade.
Table 31
Relationship between changes in freight rates and changes in laid-up tonnage
D ry cargo vessels
Laid-up /؛٢tonnage مك-ءءهء
as a percentage world dry رك/
cargo ء
ه ' لا tankers
D ry cargo voyage charter freigh t
rate index (July 1965-June 1966
= 100) ء
Laid-up tanker tonnage as a
percentage ٠/ w orld fieet ١١
Tanker freigh t rate index
(Intascale = ^٠٠
15 Septem ber 1969, Worldscale
fro m 15 Septem ber 1969 ^E nd o f quarter
1st qnarter — 1973 . . . . 152 0.51 121 0.662nd quarter — 1973 . . . . , 268 0.27 149 0.453rd quarter — 1973 . . . . 346 0.17 183 0.394th q n a r ^ r — 1973 ٠ . ٠ . , 216 0.22 241 0.36
1st q ^ r t e r — 1974 . . . . , 221 0.11 245 0.372nd q n arte r— 1974 . . . . , 104 0.08 226 0.323rd q u a rte r— 1974 . . . . . 115 0.25 205 0.294th quarter — 1974 . . . . . 108 0.70 193
Source:F ء o r freight indices, see tab le 28.١١ Laid-up tonnage, com piied on the basis o f da ta o n laid-up tonnage fo r tankers an d d ry cargo vessels published by
the Chamber ofShipping o^the United Kingdom, and on world tanker and dry cargo fleets published in Institute ofShipping Econom ics, Shipping S ta tis tic s: Facts and Figures about Shipping, Shipbuilding, Seaport and Sea-borne Trade (Bremen).
45

The ratio of liner freight ra^B to prices of selected commodities, 1964-1973
T a b l e 32
1972 1973
Freight rate as a percentage o fp r ic e ه ١١
1966 1967 1968 1969 1970 19711964 1965RouteCommodity
1.49.3"
1ه.17.07.2 3.9
4.3
ق18.13.9
14.5
6.716.9 4.2
10.7 5.0
10.5 14.6
16.8
1о'б
11.24.8
10.65.0
14.0»33.212.1 »
19.52.4»8.9
4.2 '7 .4 '4.5
1.3
29.511.118.91.7
6.4
4.45.4
10.91.4
10.8
19.72.17.6
6.27 -7
5.06.45.4
11.4
10.917.0
7 -7
3.0
1ة
8.74.68.04.9
1.29.0
25.4
4.07.26.34.77.3 4.5
4.8
ة:ن20.7
8.4
4.9
4 . 2
4 . 5
Rubber . . . . . . . . Singapore/Malaysia-EuropeT i n Singapore/Malaysia-EuropeC o p r a . . . . . . . . . Philippines-EuropeHemp . . . . . . . . . ?hilippines-EuropeJ u te Bangladesh-EuropeSisal hemp . . . . . . . East Africa-EuropeCocoa beans . . . . . . Chana-EuropeCoconut oil . . ٠ . ٠ . Sri L ank-E uropeT e a Sri Eanka-EuropeC oflee. . . . ٠ ٠ . ٠ . Brazil-Europe?aim kernels . . . . . . Nlgeria-EuropeC olfee. . . . . . . . . Colombia (Atlantieports)-EuropeCocoa beans . . . . . . Brazil-EuropeC offee Colombia (Paclffc ports)-Europe
ء-ءء «م ا ; D a ta supplied by th e ^ p y a ] N etherlands Shipow ners’ A ssociation.c ء .i .f . prices were quo ted ^ r ruhber (L o n d o n ^ S S ), tin , copra, {ute (U K -pw c grade), sisai hem p, eoeoa beans (G hana-E urope), palm kernels. F o r cocoa heans
(B razil-Europe trade), coffee (C olom bla-E urope), coffee (B razil-Europe), un it values оГ exports were quoted . Friees o f the rem aining eom m odities a re quo ted on f.o .h . te r^ s .
٠ F re igh t rates include Suez Cana] varying su^eharges, when appiieable. W henever a eonversion o f freight rates to o ther eurreneies has heen neeessary fo r 1973, this w as based o n eurrene^ parities as published in D nited N ations, M onth ly ع/م،،ء،،ءء ء ء//«ءء«'، ه —A ugust 1974, dnd valid as a t the end o f 1973. F o r earlier years see corres- ponding issues o f th e Review.
» A nnual freight rates were eaieulated by tak ing a weighted average o f various n-eight rates quo ted during the year, weighted by the ir period o f dura tion .» R a tio o f liner freight rates to price fo r the period ffom 1 )an u ary 1973 to 16 O etohe^ 1973.

Chapter VI
O TH ER TO PIC S
objective, namely, to increase efficiency in the employ- ment o f tonnage by cutting down on ballast voyages, and also to strengthen the position of bffi^ tonnage operators vis-à-vis the big industrial concerns whieh use their servmes.
173. Reeent developments in eontaineri/ed trades have further dispeiled fears ^nd eontroversy about the existence o f overtonnaging on eert^in routes. A lthough the pooling arrangem ents whieh have been sought for some time by the operators concerned in certain m ajor trades have not yet been institutionalized, tight supply or even seareity o f tonnage rather than oversuppiy characterized the containerized trades in 1974. This tends to conhrm tha t possibiiities for m onopohstie aetion in highly eontainerized liner trades have increased rather than declined.
174. I t further appears th a t liner operators, taking advantage o f the tight tonnage supply situation and high dem and conditions in the dry eargo m arkets in 1974, diverted conventional liner tonnage to the open m arket in order to take advantage o f the very high level freight rates whieh prevailed. Shippers in some liner trades have found it diffieult to secure spaee for their cargoes and signiheant delays in shipments o f eargo have been observed, particularly in some trades from developing countries.*®* In some eases this has arisen beeause liner operators have diverted vessels from their norm al liner schedules to the m ore profitable market.
175. As the eosts o f operation o f liner services increase, efforts to curtail oversupply o f tonnage, dupli- cation o f services or waste o f vessels’ time should in principle be weieome, provided tha t adequate services are m aintained and eeonomie savings are reflected in the level o f freight rates. The resistance o f shippers to inereases in liner freight rates may lead liner operators to look m ore effectively into the question o f rationalize- tion o f services and inereased operating efficiency as a means o f lowering or stabilizing their operating eosts. Both government and private interests, particularly in developing eountries, have beeome increasingly aware tha t for such pressure to beeome effective there is an urgent need to strengthen their negotiating power as users o f liner serviees.
A. Institutional developments in world shipping
1. General
169. The new situation which has been in being since the autum n o f 1973 as a result o f the rise in oil priees has no t yet settled down. A lthough bunker prices may fall in the long run, it is likely th a t they will remain high enough to activate the seareh for means and m ethods of reducing their im paet on the eeonomies o f ship opera- tion. I t is likely, too, tha t the increased significance of fuel costs on to tal eosts wifi affect the design and size o f new ships and prom ote the seareh for alternative propulsion systems. D perationai m ethods and the organization o f maritime transport in the m ajor liner and bulk trades will also be affeeted. I t is to be expeeted th a t the urgent need to eom bat infiation, in addition to pressures from the users o f shipping serviees, wifi mo- tivate the search for economies through efficiency of operation.
The teehnologieai change whieh eharaeterized مه17worid shipping in the post-w ar period, and whieh, partieularly sine© the late 1960s, aimed a t labour cost savings and increased effieieney through faster turn-round o f ships, is expeeted to continue in the eoming years, bu t the seareh for eeonomies in fuel eonsum ption and ؟ osts wifi, perhaps, be given relative priority over other issues.
171. The trend to unitization will obviously continue for the rem ainder o f this decade as the seareh widens for ways ^nd means o f reducing to tal operating eosts. However, so long as building costs rem ain at their present very high levels, or if they increase in the future, addi- tional eonsideration may be given to those forms o f unitization which appear to be less eapital-intensive than others and whieh provide for increased fiexibility o f operation.
17^. €o-operation am ong liner operators to regulate the supply o f tonnage through pooling and other devices continues to be eharacteristie in the containerized trades and also in the conventional liner services.*®® $h!p- owners in the liner trades appear to be looking increas- ingiy for means o f strengthening their power to eontrol the m arket. In the bulk trades the expanding praetiee o f creating “tonnage pools” *ء appears to أ have a twofold
وء* ء«هر-س / o f Commerce (Liverpool), 13 February, 19 May, ^9 May, 28 May, 14 June, 8 Juiy, 17 and 22 October 1974;
محمم/ء’ء List (London), 25 May, 11 June, 29 Ju!y and 23 August 1974; Seatrade (Colchester U.K.), vol. 4, No. 5 (May 1974) and Shipping and Trade News (Tokyo), 2 August 1974.
.See sub-section 2, a, below ®ء* ,See Fairplay International Shipping Weekly (London) وء*
vol. ^59, No. 4726 (21 March 1974).
47

ber 1974) no decision on the pooling ngreen^ent h^s been announced.
(iv) Rationalization schemes in conventional liner ser- vicesfrom and ؛٠ the Far East
!79. Japan line and M itsui O SK lines have reached agreement on a p lan for rationalization o f conventional ship services on the Japan/N ew Zealand route for enforcement from the September 1974 sailing. The plan includes a rednetion in the nnm ber o f ports o f discharge on the trade ronte and calls npon shippers to palletize their cargoes in order to reduce the time spent by ships in ports in Japan and New Inaddition, the Japanese lines serving trade hetween Japan and South Africa were expected to start discussions in mid-1974 for a freight pooling on their conventional liner services in this ronte. A t the initial stage the pool was planned to cover ontbound freight only. Reassign- ment o f ports o f call and eo-ordination o f sailings were points to be covered by the proposed Thelines serving the trade between Japan and New Guinea are also planning to proceed with rationalization plans in this trade.^®
(v) Joint shipping venture by / ٢«« and Pakistan180. It was reported in A ugust 1974 tha t Iran had
proposed to ?ak istan th a t they should set up a jo in t tanker company with a working capital or $4^ million. This company wonld serve as a subsidiary o f tbe national shipping corporation o f ?ak istan in jo in t ownership with the G overnm ent o f 1مهل.أاعآ Besides carrying some o f Iran ’s oil exports to other countries, the tankers of the proposed com pany eould carry ?ak istan ’s entire crude oil im ports o f over 4 million tons annually.
(vi) Other information181. The request by “K ” Tine o f Japan to jo in the
Trio G ronp, which is engaged in container service on the Japan/Europe route, has faced strong opposition from other members o f the Trio Group.^،؟ In O ctober it was reported that, if the line’s attem pt to enter the conference fails this year, admission will be songht again next y ^ r ^°
(b) M aritime agreements between governments
(i) U SSR— Argentina shipping agreement18^. A shipping agreement between the U SSR and
A rgentina was signed in September 1974 in Buenos Aires. The agreement provided for the equai participation of the m erchant fleets o f the two eonntries in the carriage o f trade between the U SSR and A rgentina. I t also provided for the reciprocal granting o f m ost-favoured-
١٠١ Japan Maritime Gazette (Tokyo), !ه July and 18 July, 16 August and 27 September 1974.
١٠١ Ibid., J1 July and 21 August 1974, and Shipping and Trade (To^^o), 26 July 1974.
١٠٠ Japan Maritime محممم ء، (Tok^o), 6 August 1974.١٠٠ Lioyd's List (London), 28 August 1974.١٠٠ Japan Maritime Gazette (Tokyo), 21 August 1974. See also
Shipping and Trade News (Tokyo), 22 June 1974.١٠٠ Japan Maritime Gazette (Tokyo), 17 October 1974.
2. Particular examples ٠/ institutional developments
(a) Consortia, pooling agreements and jo in t services.Opposition to new entries in trades
(i) Pooling schemes in liner services serving Japan and North and South America ١؟®
176. A pool agreement for the Japan/G entral Amer- ica/Garibbean sea route was concluded in January 1974 by four Japanese lines and two other flag carriers. A similar agreement for the Japan/Sonth Am erican ^ e s t Coast trade, including lines from Ghile, Ecuador, Eeru and other lines, was under consideration in June 1974. In addition, the freight conferences serving the Ear East/N orth Am erica trades have been studying the possibility o f adopting a freight pooling system covering the entire F a r E ast/N orth America trade routes. N o deflnite decision has been announced a t the time of writing this آ0ء0آ1.مقل
(ii) Pool agreement / ٠٢ the Continental EuropejRiver Plate liner /٢٠^
177. A pool agreement between $outh Am eriean and European lines in the Gontinent and A rgentina/U ruguay trade came into force on 1 April 1974. The pool agree- m ent is based on the principle o f 50:50 cargo sharing between South Am erican and European
(iii) The North Atlantic container pooling agreement178. In Novem ber !971 seven container ship com-
panics which operated 70 per cent o f the N o rth A tlantic lines capacity petitioned the FM G to authorize the N orth A tlantic container pooling agreement. In 1973 the Gfficial American H earing Gouncil recommended the U nited States Federal M aritim e Gommission to approve and authorize the pooling In June !974when the approval o f the FM G was considered to be im m inent it was reported th a t the A tlantic Gontainer Lines (AGL), a m ajor participant in the pool agreement, had w ithdrawn from the proposed pool ®١؛ because it had been earrying a greater share o f the traffic than that allocated to it in the proposed agreement. I t therefore expected to renegotiate the term s so as to increase its share from the 20 per cent allocated to it in the agree- m ent to 25 per A t the time o f writing (Decern-
١٠٠ shipping and Trade News (T©kyo), 22 January !974, Japan Maritime Gazette (Tokyo), 6 Juno 1974, and Lioyd’s List (London), 13 August 1974.
١٠٠ I t is worth noting in this connexion that according to a nress report, flve Japanese lines operating container servies on the Japan- New-York liner trade route had decided to introduce a freight pooling systenr (Lioyd’sList (London), 19 Decentber 1974). Aecord- ing to another report, American container ship operators on the Japan/U.S. liner trade route have been studying the possibility of adopting a pooling system ]ointly with their Japanese counterparts on the U.S./Japan liner trade routes (/،?٣ « Maritime Gazette (Tokyo), 17 Decemher 1974).
١٠٢ Journat ا،م«سم te transport internationai (Base!), 35th year, No. 16 (19 April 1974), p. 1769.
١٠٠ /ه؛ممح , No. 1 (4 January 1974), p. 43.١٠٠ /محئه ., No. 24 (14 June 1974), p. 2737.
١٠٥ Journai de /،؛ marine marchande et de ta navigation aérienne (Paris), 56th year. No. 2845, (27 June !974), p. !588, and ibid.. No. 2849 (25 July 1974), p. ]843.

will serve as a central freight booking office for all cargoes exported by the conntry.
(d) Actions by governments
187. The Sultanate o f Om an announced its intention o f preparing a maritime !aw tha t wouid enable ships to be registered under its fiag. This conntry, which has no fieet a t present, intends to a ttrac t shipowning companies from outside the country which may no t he required to he incorporated inside O m an hu t may need fulfil certain standards. Exem ption would he granted from all revenue taxes; registration fees would be low, bu t a tonnage ta^ would be ءصإ0كهة.مءل
188. A United States conrt has ruled th a t a LASH barge is no t a “ship” or a “vessel” under the provision o f the Hague Rules, which are incorporated in the United States Oarriage o f G oods by Sea Act. Gonsequently, a LASH barge in transit becomes the responsibility o f the m other ship.،؟؟
189. According to press reports ء؟ل a national m^rl- tinre com pany under the name o f “Gam eroon Shipping Lines” has been recently established under new legis- lation in the U nited Republic o f Cam eroon to undertake all types o f activities in m aritim e transport, ship opera- tions and chartering. The purpose o f the legislation is to reduce the country’s dependence on foreign shipping services whieh are heyond any direct eontrol by the Governm ent. I t also provides for the cargo sharing form ula o f 40-40-20 to be applied, so tha t the new com pany will be assured o f carrying 40 per cent of the country’s trade.
190. The Energy Transportation Security A ct of an ؟؟،,1974 agreed version o f which has been voted by the Congress, was no t agreed by the ?resident o f the U nited States.،؟؟ The A ct would have required up to 30 per cent o f oil im ports into the U nited States to he carried on American-fiag vessels.
B. Unitization
' transport systemsTrends in unit
191. The acceleration o f the trend towards unit load systems over the past few ye^rs has resulted in shippers presently heing offiered a wide range o f vessel types for the earriage o f unitized cargo, including full cellnlar and part container ships, roll-on/roll-offi vessels, barge carriers, pallet carriers and m nlti-purpose vessels.
192. Containerization has undoubtedly fulfilled its original purpose; the speeding o f cargo throughput
nation treatm ent and, in some cases, even o f treatmeffi as nationals in the servicing o f ships and cargo handling. The agreement included a clause on the mechanism o f regular hilateral consultations on questions o f shipping.،^؟
(ii) Japan/China and Japan!Republic o f Korea shipping agreements
183. fn conclusion o f n eg o tia tio n begun in Tokyo in July 1974 hetween the Governm ents o f China and Japan, a shipping agreement was signed in N ovem ber1974. Tire agreement, which will he in force for three years and will be renewed if no t abrogated, calls for the holding o f governmental consultations, guarantee o f rem ittance o f revenues o f shipping firms, granting o f most-ffivoured-nation treatm ent ^nd eo-operation in rescue operations at sea. Jt was also reported th a t a eonsultative body is to he set up to decide the shipping rates and the loading shares.،٠؟ Negotiations for a shipping agreement have also been undertaken between Japan and the Repuhlie o f ^orea,،^® bu t the outcome is no t known a t the time o f writing this review.
(iii) Shipping agreement between China and Bulgaria184. A shipping agreement was concluded in early
$eptem her 1974 hetween the ?eop le’s Republic o f China and Bulgaria.،؟® The details o f the shipping agreement had no t heen made public by the time o f drafting this rev)ew.
(c) Freight booking and shippers’ councils
185. In June 1974 the form ation o f an Irish Shippers’ Council was announced in Ouhlin. Its main objectives were to co-ordinate the activities o f m em her organizations in form ulative policies on transport and ancillary services. I t was reported tha t the need to eo-ordinate the interests o f all users o f transport services arose mainly from the fact th a t services available to Irish shippers “often left m uch to he desired” , and also from the need for a shippers’ conseil to have a strong say on m atters relating to transport costs, standards o f services and p o rt facilities.،؟،
186. According to press reports,،؟® the U nited Repu- hlic o f Tanzania is to set up a freight hureau similar to the Central Freight Bureau o f $ri L anka.،؟® The emphasis at the outset would probably he on reservation o f cargo space, cargo aiiocation and rationalization o f shipping services, bu t in due course the new freight bureau’s activities will be extended to eover all those carried out hy the Central Freight Bureau o f Sri Lanka. W hen in full operation the Tanzanian Ereight Bureau
،٠١ Seatrade (Colchester U.K.), vol. 4, No. 5 (May 1974). ، ٠٠ Fairplay International Shipping Weekly (London), vol. 252,
No. 4743 (18 July 1974).،٠® Article hy Cameroon Tribune as quoted in Marchés tropicaux
méditerranéens (Paris), 30th year. No. 1520 (27 December ءء1974).
٠؟، Congressional Information Bureau (Washington D.C.), vol. 78, N ٠ . 199 (11 Dctober 1974) and ibid., N ٠ . 196 (8 ©ctober 1974).
Journal o ؟؟، f Commerce (Liverpool), 2 January 1975.
١؟، Journal ٠/ Commerce (Liverpool), 10 September 1974.٠؟، Shipping and Trade News (Tokyo), 3 Angust and 14 November
1974.،٠® Japan Maritime Gazette (Tokyo), 23 July 1974.، مم/ء’ء ٥® مح List (London), 10 September 1974.؛، ، International Freighting Weekly (London), No. 221 (19 June
1974).،٠® Seatrade (Colchester U.K.), vol. 4, No. 11 (November 1974).،٠٠ F or information regarding the Central Freight Bureau of
Sri Tanka, see “Central freight Booking ©®ce, Sri Lanka: report prepared for the UNCTAD secretariat by Mr. D. Soysa, Ministry of Shipping, Sri Lanka” (TD/B/C.4/108).

required for investm ent in infrastructure for one parti- cular m ethod as against others, until the stage is reached when it heeomes clearer whieh m ethod is the m ost eeonomiea! and beneheial to developing eonntries in the light o f their particular transport requirements and their socio-economi© eonditions.
2. Particular developments with regard /٠ unit load systems in //«£٢ cargo trades
196. A large part o f liner cargo in the m ajor trades is now nnitized. There is, however, no inform ation showing the com parative positioh o f each unit load stem. ?artia?؛$ l inform ation on the share o f container- ized eargo—irrespeetive o f the t؛?pe o f vessel used—in the 1ه m ajor hner trades to and from the U nited States ءإ* suggests tha t in 1972 (table 33) about 44 per eent o f the liner cargo (11.5 million tons) moved in coffiainers (though no t neeessaril؛? on ©ontainer vessels). I t was also reported *٠® tha t 52 per eent o f the E urope/Far East liner trade route and 54 per cent o f the F a r East/Europe route moved in eontainers in 1973, bu t again no t neeessa- ril؛? on ©ontainer vessels. There is no reason to believe th a t the situation on the m ajor routes to and from other developed eountries is substantial[}? different. I t is w orth noting however that, in other than the 10 m ajor trades to and from the U nited States, the share o f cargo earried in eontainers in 1971 was only 3.4 per eent (the source did no t give the eorresponding share in 1972). W hile unitization is im portant in m ost trade routes to and from lap an , it has been reported *ء th أ a t in 33 trade routes o f ^ p a n abou t 2,500 yearly sailings o f conven- tional liner ships still occur. Also, in the F a r East/ Europe and E urope/F ar East liner trade routes ءأ* in 1974 there was an average o f 774 annual sailings of eonventional and com bination container/break-bulk (COMBO) vessels. Olearly, although the expanding use o f eontainers on the m ajor hner trades affects a very substantial portion o f liner eargoes, other forms of unitization o f eargoes and conventional m ethods o f packaging and handling general cargo are also used for a great part o f liner eargoes. M oreover, the use o f con- tainers by no means imphes transport on ©ontainer vessels only.
197. On the o ther hand, new announeem ents are m ade from time to time by groups o f earriers o f their deeision to eontainerize eertain trades, as for example Europe to $outh Africa,*®® Europe to New Zealand,*®®
*٠* Foreign Oceanborne Trade o fthe United States : Containerized ٠٧٠٢ ٠«ءه/ح؛محء Trade Routes, 1971, issued by tbe United States
Department of Comnnerce, Maritime Administration (3¥a$hin^ton, D.C., February 1973) and Containerized Cargo Statistics, 1972, issued by the United States Department o f Commerce, Maritime Administration (Washington D.C., ^ n u a ry 1974).
*٠® FEFC Facts مح«ه Figures, No. 5 (January 1975).*٠® Lloyd's List (London), 31 October 1974.*٠٠ FEFC Facts and Figures, No. 5 (January 1975).*٠٠ Containerisation International (London), voi. 8, No. 4
(April 1974), and Journal de /٠ marine marchande ءء de la navigation aérienne (?aris), 56th year. No. 2849 (25 Jffiy 1974).
*٠٠ Containerisation /« ءءء«-س'،سم / (London), voi. 8, No. 7/8 (Jnly/August 1974), and Seatrade (Coichester U.K.), vo[. 4, No. 8 (August 1974).
and ship operation and an inerease in levels o f produe- tivity; bu t it is not neeessarily the m ost eeonomieal m ethod o f unitization in every circumstance. It wih take some time to know whieh particular m ethod of unitization is the m ost suitable and eeonomieai for eaeh specihc trade;*®® it may be tha t several methods need to be used together in trades where there is a large variety o f goods. I t is w orth noting th a t the repercus- sions o f higher fuel eosts on the operating costs o f various types o f unit load systems cannot yet be clearly seen and evaluated, particularly in view o f th e short time that has elapsed and o f th e boom conditions whieh prevailed in the dry cargo m arkets and liner shipping in 1974.
193. In the particular ease o f developing countries, there is growing evidence th a t hexible un it load systems may best serve the heterogeneous eharacter o f their trade. F o r exampie, the us© o f shipper—paeked units can result in substantial savings in the eost o f handling eargo from production point to the m arket. U nits th a t may be built a t producers’ premises by securing the goods paeked in bags, eartons or other forms o f p ack a^n g to pallets may ereate substantia[ savings, w ithout undue pressure on ports in developing countries to invest in the ©apital-intensive and teehnieally sophis- ticated handling equipm ent necessary for container operations. The advantages o f using shipper-paeked units inelude the faet th a t they are eonvenient to handle and store at the producers’ premises and they reduee the eosts o f handling, inland transport and loading, while loading and discharging times a t export and im port terminals are also redueed, as com pared w ith break-bu!k transport.
194. Cenerally speaking, international seaborne trade and the particular requirements o f different eountries and regions are too heterogeneous to be served by only on© transport o r handiing system. W hatever the advantages o f one or another system may be, the requi- rements o f world trades necessitate the objeetive selection from am ong a rang© o f unit load systems o f th e one best adapted to the partieular eireumstanees. I t is interesting to note in this context th a t in 1974 the Elder Dem pster Line, a mem ber o f the U nited K ngdom /W est Africa Liner Jo int Service, pu t into service three m ulti-purpose semi-eontainer vessels eaeh o f 41B T E U *٠٠ th a t are equipped with on-board ©ontainer handling faeilities. $uch ships do no t require heavy eapitai outlays in eomplex equipm ent by the ports served.
195. There appears to be growing interest in vessels offering versatility o f serviee. I t has been seen from table 24 tha t the emphasis in new orders for unit load system vesseis is on o ther than fuh ©ontainer vessels. A dopting a hexible attitude in the use o f un it load transport systems heips to reduce the am ount o f capital
*٠٠ According to a study covering the Live^nooi/Lagos/Ap^a^a trade carried out hy the Fconomist imehigence Unit, London, containerization is only 15 per cent cheaper than break-buik trans- port, whereas shipper-paeked unit operation can show as much as 25 per eent saving on eonffiiners. The Fconomist Intelligence Unit Ltd., Container Handling مح«ه Transport Costs (report prepared for the Unit Load C u n c il (London, July 1973).
*٠٠ Twenty-foot equivaient unit.
؟٨
Table 33
Share of cargo moved in containers in the major liner trades to and from the United States of America, 1971 and 1972
(En million long ء«مء and percentages)
19721971
Percentage o f cargo
General cargo m oved incarried containers
Percentage o fcargo m oved in containers
General cargo carriedTrade route
20.5
30.747.6
34.5
53.6
39.249.1
44.4
T53
ؤ941
ئ:ئ0.877
!4.6
30.445.1
1.47
0.8
0و44
4.5
36.525.2
U.S. N orth Atlantic/Carribbean . . . . U.S. N orth Atlantic/U.K. and Uontinent U.S. N orth Atiantic/Seandinavia and
Baltie ......................................................U.S. N orth Atiantic/Mediterranean ٠ . U.S. Sonth At!antic/U.K., Ireland, Uonti-
п ета ! Europe, N orth of Portugal . .U.S. Atlantic/Far E a s t .............................U.S. A tom ic and Uu!؛/Far East . . . . U.S. Gulf/U.K. and Ire!and, Gontinenta!
Europe, N orth of Portugal . . . . . U.S. Pacific/U.K. and Gontinent . . . . U.S. Pacific/Far East . . . . . . . . .
T otal
Source ; C om piled ^•om Foreign Oceanborne Trade o f th e United S ta tes ; Containerized Cargo ٠« Selected Trade Routes 1971 (op. cit.)y and Containerized Cargo Statistics, 1972 (op. c it.) .
increasingly used for carriage o f dry cargo no t snited to the 20 ft. or 40 ft. containers. Siinilariy, LASH ships, which may no t be eompetitive in serving m odern ports th a t have sophisticated handling facihties, wili flnd greater empioyment in shahow estuaries, less devel- oped harbours ١٢؛ and some ports o f developing conn-
E or example, LA SH ships were expected to start calling a t the ports o fK an d la in fndia from July 1974. In A ugust this year a LASH service started between the U nited States G ulf ports and the Singapore/Saigon/ M alaysia/lndonesia/Ehilippines area.
200. A lthough palletization has proved to be an efficient and cheap m ethod o f nnitization, speeiahy constructed pailet ships have no t as yet m ade the break- through th a t was expeeted when palletization was first introdnced. I t appears th a t palletization is encouraged by liner operators, particularly in trades in whieh no o ther form o f unitization has been I tseems, however, th a t shippers may no t be given sufficient incentive to palletize their cargo in afi trades where this is commercially or teehnically possible. This may be assumed from a report ١٢؛ th a t the Japan M achinery Exporters’ Assoeiation (JM E A )has requested 28 confer-
١٢؛ /ه-،ممح , No. 3 (March 1974).١٢٠ It has been claimed by the interested parties that LASH
system vessels have proved nartieuiarly successful in the route between United States G ulf ports and Indian Ocean/Persian Gulf ports, mainly because these vesse!s can be ofl-loaded while at anchor and are thus not affected by the limited berthing capacity of, and the congestion conditions existing in, these Asian ports. (Shipping and Trade News (Tokyo), 18 Getober !974.)
١٢٠ Japan Maritime Gazette (Tokyo), 16 August 1974.١٢؛ Ibid., 12 November 1974.
Japan to H ong K ong and New ^eaiand , aiso some other destinations in the F a r E ast. ءل٢ Jn addition, fully cellular container services began operation in 1974 in certain other trades from Japan as fo r example to the Republic o f K orea and to M alacca Straits ء0آ1ة.قءل
198. I t is interesting to note however, that, whiie the lines serving the Europe/N ew Zealand trade have opted in for full containerization o f the trade, the shipping lines serving the trade between A ustralia, New ^eaiand and N orth Am erica have sought increased diversifieation o f m ethods o f unitization and the shippers are offiered a wide choice o f nnitized cargo systems, e.g. R o/R o, LA $H vessels, full container ships, sem i-eontainer ships and conventional vessels, ١ءء although shippers in Aus- traiia earlier expressed doubts about the future prospects for conventional ١٢٠
!99. Generally speaking, fully eellnlar container ships appear to be snbject to increasing com petition from other types o f un it ioad systems, partic^iariy ocean-goingRo/Rovesse!s. In 1974therew ere6© R o/R o vesseis either in service o r on order, the m ajority o f which are designated to containerized trade routes. Since 1967 an increasing num ber o f operators have been incorporating R o/R o vessels either as supplements o r as alternatives to the eeilular container-carrying system ل٢ل. Jt is expeeted th a t R o/R o vessels will be
١٠٢ Shipping and Trade News (Tokyo), 22 June 1974.١٠٠ Shipping and Trade News (Tokyo), 11 and 22 July 1974. ١٠٠ Containerisation International (London), vol. 8, No. 8
($e?lember 1974).١٢٠ Ibid., No. 3 (Mareh 1974).١٢١ /^•،^., No. 5 (May 1974).

and the dem and for oil tonnage by 10 per cent or even m ore.،؟®
205. Any assessment o f the Impact o f the reopening o f the Suez Canal on the International shipping scene is subject to lim itations because o f the m any unknow n fav o rs in the reopening equation tha t would ultimately determine the final im pact, such as the scale o f charges and Canal dues, political stability in the area, waiting time a t the two entry gates, level o f world bunker prices and capacity lim itation o f the Canal. Nevertheless, in terms o f shorter stemming time w ith savings in fuel consum ption and inereased utilization o f carrying capa- city in terms o f m ore voyages per year, the Suez ronte should have considerable advantages over the Cape route. The distance saving from using the Suez Canal can be seen from the following :
Persian Gulf- M arseilles
10,000 km ^2,000 km
Colombo-Marseilles
9,000 km ^0,000 km
Persian Gulf- L e Havre
12.000 km21.000 km
Colombo- L e Havre
H ,000km^0,000^m
Route
Cape.
Source: Norwegian Shipping News (3 ه)ء ها$ M ay 1974.
206. The reopening o f the Suez Canal would reduce the lengffi o f three o f the principal oil transport routes by as much as 30 to over 55 per cent, as indicated in the figures helow;
Persian Gulf- Persian Gulf-Northwest Europe us East Coast
Persian Gulf- MediterraneanRoute
8,3002,000
(In nautical miles)
4,700 6,40010,800 11,100Cape
Source: O EC D , M aritim e Transport 1 9 7 3 ... ( م ء . c it.) .
207. Because o f the costs o f clearing and reeons- truction o f the Canal it is expected tha t the C anal dues will he substantially higher than those which prevailed in 1967. However, if the increase in Canal dues proves to be lower than the increase in fuel costs, then the economic savings o f using the Canal may be o f greater significance than hefore the closure. Thus it may become attractive for m any ship operators to reorganize their ship operating arrangem ents, although some trade patterns established after 1967 may no t change or may take time to adapt to the new situation.
D. UNCTAD training courses
1. Third training course in port management
208. A fter the po rt m anagem ent training courses held in G othenburg in 1972 and in Algiers in 1973,م؟ل U N C TA U organized a th ird such course which took place in G othenhurg from 8 July to 6 September 1974. Tire course, which was finauced by the Swedish Inter-
،٠٠ OECD, Maritime Transport 1973: ه study by the Maritime Transport Committee (Paris); see also The OECD Observer (P^ris), No. 7t (August 1974).
،٠٠ See Review ٠/ maritime transport, 1972-1973 (op. cit.), paras. 296-293.
ences o f those serving the trade from Japan to enlarge the palletized cargo allowance, which they find currentlyinsufiicient.
c. The prospects for the reopening of the Suez Canal
201. The Suez Canal was one o f the m ost vital trade .1967 links between East and W est hefore its closure in
and ،؛؛؟ A hout 14 per cent o f to tal world seaborne trade approxim ately one-third o f European seaborne im portspassed through the C anal.
202. In M areh 1974 the first stages o f work in reopen- ing the Canal hegan with the clearing o f mines, explo-
sives and obstacles. By the end o f June 1974 a British mine-sweeper crossed the Can^l. The to ta l bill for the reconstruction o f the Canal was estim ated a t $1,000 mil-
Financial loans were m ade available to Egypt .،؟؟lion by the W orld Bank and hy industrial countries, including
and the U®؟،. nited States ،؟؟ Japan
203. The first stage in the reopening o f the Canal would include dredging up to 38 feet to allow access for vessels in the range o f 60—70,000 grt, while the second stage woffid involve widening and deepening the
A ccord- .،؟®Canal to allow entry to 150,000 ton vessels ing to the plans, in the final stage the canal will he enlarged to accom m odate ALCCs/UECCs o f over
200,000 tons in the 1980s.
204. I f the program m e o f w ork is carried ou t a.s planned, hy the heginning o f 1975 the first stage o f reconstruction should have heen completed and by the
the Canal would become ،1975 ،؟ beginning o f M arch fully operative to accom m odate, as an upper lim it, tankers o f 70,000 dw t fully loaded and 110,000 dwt in
the am ount o f ,،؟®ballast. A ccording to press reports cargo expected to pass through the Canal in 1975 is ahout 50 million tons o f dry cargo and 70 million tons o f oil. A ccording to another estim ation, if the Canal dues are fixed at levels which make the transit an economic proposition for all dry cargo ships, whieh could save substantially on voyage distances and time, the dem and for dry cargo shipping m ight he reduced by 5 per cent
، ؟٠ The economic effects o f the closure o f the Suez Canal: محءءمح>' by the secretariat ٠/ UNCTAD (United Nations publication, $ales No. £.73.tt.D .t3), para. 9.
.Seatrade (Colchester U.K.), vol. 4, No. 4 (April 1974) ؟؟،، ؟٠ Fairplay International Shipping Weekly (London), vol. 251,
No. 4728 (4 April 1974)..Lloyd's List (London), 7 August 1974 ®؟،،٠® In October 1974 a provisional contract was concluded
between the Suez Canal A u thori^ and a Japanese construction company to widen and deepen the Canal so as to accommodate 150,000 ton ships. It was reported that work to increase the Canal’s depth Irom 15 to 19.5 metres and the width at the water’s edge Irom 90 to 160 metres would start in the latter hall of 1975. Lloyd’s .16 October 1974 ,(London) مح'،ء
،٠، Suez Canal Authority, September 1974. However, according to press reports it was stated by the Egyptian Government that even if the Canal becomes physically operative its reopening to world shipping will be dependent on the political settlement in the area.
مح«هءك،«'،ءء'س Shipping Gazette (Copenhagen), vol. 58, No. 11 (November 1974).
،٠® Norwegian Shipping News (Oslo), 3 May 1974.
52

213. Increased use has been m ade o f (he unit load system and in particular o f containers in air cargo traffic. The ability to introduce the unit system into air freight operations has been facilitated by the advent o f the new generation o f wide-hodied aircrafts, such as the Boeing 747, whieh was the hrst aircraft to carry 40 ft containers. Specialists in air transport now claim th a t air cargo rates are competitive with surface rates. However, while they have established a firm foothold in international interm odal traffic, airline operators have no t been able to agree on ju st how “interm odai” they should be.*؟®
214. Furtherm ore, despite a noticeable annual increase in the volume o f goods transported by air, the air eargo industry has not m ade the breakthrough th a t was foreseen in this seetor a few years ago. The resistance o f shipping to air com petition has been m uch stronger than was originally foreeast. W eaknesses have also been found in the organization o f goods transported between airports, laborious documentation,*؟® procedures and delays which sometimes offiset the m ^jor benefit o f air transport, i.e. the quiek transit time. M oreover, in 1974 airline operators suffiered a setbaek because of increased fuel costs, the particular im pact o f which was greater for air transport than for sea transport.
F. Land bridges
1. The Siberian
215. !m erest in the use o f this land bridge appears to be increasing in ©ontainer traffic. A ccording to press reports,*؛’ in 1974 about 4,000 eontainers were transported m onthly to Europe via the Siberian route, as against 2,000 eontainers transported in A ugust 1973. O ther inform ation *؟؟ suggests tha t the costs o f transport through the Siberian land bridge have been as much as 30 per cent iower than the sea link-up. However, a proposed 15 per cent rise in the Siberian land bridge (SLB) container freight rates on 1 Oetober 1974 cam© under strong eriticism from the Japanese M aehinery Exporters Association and five m ajor Japanese non- vessel-operating eom m on earriers (N^OOOs),*؟® who believe tha t the rise in rates will inhibit expansion in the utilization o f th e land bridge.
216. A new land-sea-land groupage serviee for the F a r E ast container traffie from Europe whieh started in 1974 will use the Soviet land bridge, ^h e Fom pre- hensive Shipping Com pany (with the ? o r t o f London A uthority holding a 75 per eent stake) was developing the serviee with M A T Transport (Cverseas) for the Anglo-Soviet Shipping Company, the U nited Kingdom
*٠٠ Container News (New York), voi. 9, No. 6 (June 1974), in which an account was اج ven on discussions organized by this ^ubiication in w hkh five airhne car$o s^eeialists participated.
*٠٠ N٠٢١٧؛? /،?« Shipping News (Dslo), 16 May 1974.*٠’ Japanese Maritime Gazette (Tokyo), 16 October t974, and
Shipping and Trade News (Tokyo), 16 November 1974.*٠٠ Lloyd's List (London), ^9 May 1974.*٠٠ Shipping and Trade News (Tokyo), 2 August 1974, and ء.ءص م/ List (London), 14 September 1974.
national D evelopm ent A uthority, was conducted in English and was attended by 25 partieipants from 19 developing countries.
2©9. The ©ourse program m e eoneentrated on four m ajor subjects: po rt planning, p o rt productivity, financial m anagem ent and the application of m odern m anagem ent techniques to po rt operations. In addition to leetures, discussion groups and seminars, frequent use was made o f business games and case studies written specifically for training ©ourses o f this nature, and visits to the port o f C othenburg, stevedoring, shipping eompanies and transport undertakings in the area were organized. In addition, study tours were made to the ports o f H am burg, London, Dslo and Stockholm, in order to give the participants an insight into how po rt problem s were being taekled in diffierent countries.
2. Berth throughput seminars
ه21 h^ م is new activity, which was started in 1973 with a view to assisting in the dissem ination o f the results o f U N C T A D ’s ports research w ork directly to port m anagers in developing countries, was continued with the organization o f two further seminars in Calcutta and D ar-es-Salaam in February and M ay 1974 respectively, whieh were attended by a to tal o f 45 parti- eip^nts from 23 ports in 16 countries.
E. Air transport
211. Table 34 illustrates the trend in air freight volume for the period 1968-1973 and the trend in air freight operating revenues for the same period.
212. The percentage increase in freight volume during 1973 was 17.2 per cent, which was significantly higher than the 14.1 per eent recorded in 1972, or the 9.3 per eent reeorded in 1971. I t is w orth noting tha t between 1968 and 1973 freight traffic, in terms o f ton kilometres, increased substantially m ore (86.2 per cent) than passenger traffie (64.6 per eent) and m any times faster than airmaii (6.3 per cent).
Table 34
Trends In air freight volume and in air frei^bt operating revenues, 1968-1973
(Scheduled operations ه/م/>ء«'ءء ء o f ICAO member States) “٠
Freight operating revenuesFreight volume
TotalTon- Per- revenue Per ton- Per-
kilom etres centage (m illions o f kilom etre centage(m illion) change dollars) (U S cents) changeYear
(968 . . . . 8,320 27.4 1,401 16.8 + 2.41969 . . . . 9,970 18.8 1,650 16.5 -1 .81979 . . . . 10,600 6.3 1,745 16.5 -0 .6197! - li,590 9.3 1,983 17.1 + 3.6
ا972 - ]3,220 ل4.ا 2,277 17.2 + 0.61973 . . . . . . 15,490 17.2 2,676» 17.3 + 0.6
Source: lA T A , World A ir Transport Statistics, 1973.D ء om estic and in tefnationa! scheduled services; m ajor exclusions, U SSR and
China.١١ F igures revised by source, w hich do n o t m atch those in Review o fm a r itim e
transport, 1972-1973 (op. ء/ء.مر tab le 45.٠ IC A D prelim inary estim ates.
53

the land/m ini bridge shipments to continue until the question has been settled^؛^
G. World cruise fleet
219. The developm ent o f the world crnise fieet during the period 1965-1974 is shown in table 35. أل ةمI t can be seen from this table th a t over this 10-year period the world cruise fleet has shown only a modest increase from 58 vessels totailing 1.25 million grt in !965 to 68 vesseis to tahing 1.35 million grt in 1973. The table shows, however, th a t there have been signiheant qualitative changes from year to year in the fleet. These changes were accounted for by the yearly deliveries of new buildings and deietions o f lost and strapped tonnage. The world cruise fleet provided 25,471 cabins and 45,529 berths for cruise passengers as o f 1 lan u ary 1974. ءل ء
220. The flag distribution o f the world cruise fleet for 1974 as eom pared w ith 1973 is given in table 36. It can be seen from the table that, in term s o f tonnage,69.5 per cent o f the cruising capacity is offered by only flve countries, namely the U nited K n g d o m , Norway, Greece, Italy and ?anam a.
221. A t the beginning o f 1974, 36.4 per cent o f the to ta l tonnage beionged to the age gronp o f 15 years and above, while only 20.5 per cent had an average age o f less than 10 years, inciuding the Norwegian tonnage, which has an average age o f only two years.
222. The w ea^ dem and conditions which had been experienced by the cruise industry since !972 persisted in 1974. D uring this year, partieniarly as a result o f
١٠٠ Fairplay International Shipping Journal (London), voi. 252, No. 4749 (29 A u g u st ا974)م
١٠٠ ^o r earlier years see Review ٠/ Maritime Transport, 1972-وثم/مح(مم. ؛■« .) , table 47.
١٠٠ Fearnley and Egers Gbartering Go. Ltd., World Cruise Fleet, January 1974 (Oslo).
operators o f the Russian Trans-$iberian Container
2. The United States land brige
217. This land bridge whieh in the business world is know n as the “mini bridge” has been developed to serve goods moving between the A ltantic coast o f the U nited States and the E ar East in order to avoid the all-water route. F o r varions reasons it has been nnder flre, particularly from ports on th^ A tlantic coast o f the U nited States and other However, whilethe right to offer direct-link services between the East, G u lf and W est eoasts o f the U nited States is heing strongly contested before the fed e ra l M aritim e Commis- sion (FM G) and the Courts, the volume o f nn it trains providing such service has shown a steady growth. O n the U nited States East coast alone m ore than 30 U nited States and foreign ffag operators now offer land bridge and mini bridge services c o n n c tin g Europe and the F a r East ports via a cross-conntry rail link to W est coast آ ةا م ل م ء0ق
218. The disputes th a t arose eoncerning the mini bridge in 1973 remained unresoived in 974ل. G f interest is the fact th a t in June !974 ١٠® the G utboard M arine C orporation urged the EM C to overturn a recent initial decision by an adm inistrative iaw judge in which it was determined th a t an application by the Eaciflc West- bound Conference to extend its exclusive patronage (dual rate) contract system to include its overland com m on poin t (G C ?) territory should be approved. However, while the interested parties are putting their respective argum ents to the EM C, a eourt ruiing aflows
١٠٠ Seatrade (Golcbester U.K.), ٧٥]. 4, No. 8 (August ]974). ١٠١ See Review ٠/ Maritime Transport, 1972-1973 (op. cit.),
para. 308١٠٠ Fairplay / ءءص«-ءمم،'ر،«ء / shipping Weekly (London), voi. 252,
N٥٠ 4749 (29 August 1974).١٠٠ Congressional Information ء«ا-هء « (Washington D.G.),
voi. 78, No. 123 (25 June 1974), p. 10.
T able 35
Development ofthe world cruise fleet,* 1965-1974
Lost ٠٢ scrappedNewbiiUdings deliveredE x is tin g jlee t 1st January
grtNum bergrtNum bergrtNum ber^،?٠٢
1 9 6 5 . . . . . . . 58 1,250,098 3 65,6971 9 6 6 . . . . . . . 58 1,268,215 4 78,8351967. . . . . . . 61 1,334,238 — —1 9 6 8 . . . . . . . 59 1,301,084 1 25,022
1 9 7 0 . . . . . . . 62 1,406,969 1 18,4161 9 7 1 . . . . . . . 62 1,408,462 5 89,0051 9 7 2 . . . . . . . 65 1,394,641 4 71,9211 9 7 3 . . . . . . . 74 1,473,^78 4 76,7791974. . . . . . . 68 1,349,425 — —
ءممح،ر-ءء .• Fearnley and Egers C hartering c©. L td ., W orld Cruise Fleet, January 1974 (Osio).٠ F earn ley and Egers deflne a cruise ship as an oeean-g©ing passenger vessel © (over 0و, مه g rt w ith !؟ signiflcant cargo
space and s n i t ^ i e to ea ter (o r holiday-m aking passengers spending ؟ rore th a؟ tw o days on board . Ferries, piigrim ships, tro o p earriers and passenger vesseis h u itt be(ore 1945 a re e^ciuded unless the la tte r have been extensively refltted since I960. P assenger vessels registered in soeialist countries 0( Eastern E urope are also excluded.
47,58012,81233,154
102,82657,00371,057
54

T able 36
Flag distribution of the world cruise fleet, 1973 and 1974
Average age per vessel
1973 1974
11
،ة1816
22
179
19172314
11
19
24
Potential annual passenger days ٠
1973 1974Num ber o fberths
1973 1974grt
19741973
870,900،,,؛428,470929,180,512,390,199,880,777,440,750,090840,840287,430381,810194,700162,360207,240
4,938,7801,887,2701,929,1801,512,3901,179,7501,045,440
912,450916,740287,430827,970777,150
207,24081,840
11,730
4,5833,636
2,273
8711,157
590
16,503,630 15,024,570 14
14,9665,719
3,5753,168
2,76ف‘2,778
8712,509
316,277241,852138,927135,518104,894100,77791,876
49,235
أ":ة18,739
5,812
411,547
142,127135,51898,13792,077
110,61573,59449,23587,97781,502
11,3025,812
Num ber o f vessels 1973 1974
12 ( + 3)
I j4 ( - l )
Country
( + 1) -
( - 6 ) 1,473,369 1,349,125 50,011 45,5
United Kingdom . . . . . 16Norway . . . . . . . . . 9G re e c e ......................... 10I t a l y ............................. 7Panama . . . . . . . . . 4N e t h e r l a n d s . . . . . . . . 4F ra n c e ......................... 4L ib e ria ......................... 5Sw eden......................... 2Federal Republic ©؛ Germany 5United States of America . . 5Singapore . . . . . . . . —Y u g o s l a v i a . . . . . . . . 2Ganada . . . . . . . . . 1
T o t a l 74
ء مسمسء«ه 1974. ءءا ،, and W orld Cruise (,؛؛م مم 1973 ها «« C, ا، hartering C o. L td ., W orld Cruise Fleet ؛.Г days is num ber o f berths m ultiplied by 330 days in o pera tion؛
Source: Fearnley and ل ٠ Poten tial annual pas؛
m arket has been hit by severe financial troubles and tha t bankers have shotvn increasing reluctance to finance this type o f tonnage. The revival o f the cruise m arket depends largely on the in ternational eeonomic situation, b u t w ith high rates o f infiation becoming world-wide and with the fluctuating m onetary situation the prospects do no t look particularly encouraging.
sharply increased bunker costs, several o f the older well-known ships in the cruise m arket were w ithdrawn from service. I t appears th a t the tendency in the industry is for building relatively smaller pnrpose-huilt cruise ships which carry an increased num ber o f passengers per ton and which are consequently m ore economical to operate. Generally, it appears tha t the cruise
55

ANNEX I
Classification of countries and territories ‘
ANNEXES
Code 2— Japan Code 3— Australia and New Zealand
Code 4— Northern and Western £،،همم-ء
ttalyMonacoNefiierlandsNorwaySweden(Switzerland)United Kingdom of Ureat Britain
and Nortlren Ireland
(Austria)Belgium Denmark Faeroe Islands Finland FranceGermany, Federal Republic ofIcelandIreland
Code 5— Southern Europe
Gyprus FortugalGibraltar SpainGreece TurkeyMalta Yugoslavia
Code 6— Central and Eastern Europe (excluding Union o f Soviet Socialist Republics)
Albania (Hungary)Bulgaria ?©land(Czechoslovakia) RomaniaGerman Democratic Republic
Code ?— Union ؛ ’ء ^ /م، مك Socialist RepublicsCode 8— China, Democratic ء/مءءم’ء Republic ofKorea,
Democratic Republic ٠/ Viet-NamCode 9— Asia, n.e.s.
Western AsiaLebanon©manQatarSaudi Arabia Syrian Arab Republic United Arab Emirates Yemen
Maldives ?aklstan Philippines Portuguese Timor Republic of Korea Republic of Vlet-Nam Ryukyu Islands Singapore Sri Eanka Thailand
BahrainDemocratic YemenIranIraqIsraelIordanKuwait
9.2 Southern and Eastern AsiaBangladeshBhutanBruneiBurmaHong KongIndiaIndonesiaKhmer RepublicMacaoMalaysia
Notes
Note I
This classification is designed to be applied to statistics on seaborne trade and merchant fleets. Seaborne trade Is recorded at ports of loading and unloading. The trade of the ports of a country or territory may therefore include goods originating in or destined for another coumry or ^ rrito r^ , such as a neighbouring land- locked country or territory. The trade of land-loeked eountries or territories cannot be identified in seaborne trade statistics, and these countries or territories are not explicitly ineluded in the trade elassification. However, when the classification is appiied to regis- tered merchant fleets, land-locked countries or territories possessing merchant fleets are Ineluded in the appropriate geographical groups of countries or territories.
Note 2
The groups of eountries or territories used for presenting statistics In this review are made up as follows;
Developed market-economy countries, excluding $outhern Europe: Godes 1, 2, 3, 4 and 10.4.
Southern Europe; Gode 5.Socialist countries of Eastern Europe and Asia: Codes 6, 7 and 8.Developing countries, total: Codes 9, 10 (excluding 10.4), 11
and 12.
O f which:In Affica: Godes ]0.1, 10.2 and 10.3. in Asia: Codes 9.1 and 9.2.in Eatin America and the Caribbean; Codes 11.1, 11.2, 11.3,
in Dceania: Code 12.Note 3
In annexes and tables showing statistics of shipping tonnage by groups of countries, however, Cyprus (included in 5), Liberia (included in 10.2), Panama (included in 11.2), Singapore (inciuded in 9.2) and Somalia (ineluded in 10.3) have been exciuded from the appropriate groups and shown in a separate group, for reasons explained in paragraph 40 of the Review ٠/ maritime / 7 ء-اممسه , 1972-1973.'■
Classification of coa^rics and territories °
Code 1— North America
St. Pierre et Miqueion United States of America
BermudaCanadaGreenland
The classification of countries in this annex is intended for ءstatistica! convenience and does not necessarily Imply a judgement regarding the stage of development of any particular country.
، United Nations publication. Sales No. E.75.II.D.3. Countries shown in parentheses are land-locked countries ء
with merchant fleets (see note 1 above).

St. Kitts-Nevis-Anguilla St. Lucia St. VincentTurks and Caicos Islands Virgin Islands (United Kingdom) Virgin Islands (United States)
HondurasMexieoNicaragua?anama
Cayman IslandsCubaDominicaDominican Republic Grenada Guadeloupe Haiti
11.2 Central America
Canai ^one Costa Kica El Salvador Guatemala
Code 10— Africa
[ Tobago
11.3 South America-Northern seaboard Guyana Surinam
Trinidad ai Venezuela
Erench Guiana Netheriands Antilles
11.4 South America- Western seaboard Chile Ecuador
?eruColombia
11.5 South America-Eastern seaboard Argentina (?araguay)Brazil UruguayFalkland Islands [Malvinas]
-Oceania, n.e.s.
New Guinea New Hebrides ?apuaSolomon Islands Tonga Wake Island Western Samoa
Code .
American Samoa Christmas Island
E ^nch Bolynesia Gilbert and Ellice Islands Guam NauruNew Caledonia
Libyan Arab BepublicMelillaMoroccoTunisia
NigeriaPortuguese Guinea St. Heiena Islands Sâo Т отб and Principe
Islands
Sierra Leone Spanish Sabara TogoUnited Kepublie o£ Cameroon Zaire
MozambiqueRéunionSeychellesSomaliaSudan(Uganda)United Republie of Tanzania (Zambia)
10.1 Northern Africa AlgeriaCanary IslandsCeutaEgyptIfni
10.2 Western Africa AngolaCape Verde IslandsCongoDahomeyEquatorial GuineaGabonGambiaGhanaGuineaIvory CoastLiberiaMauritania
10.3 Eastern Africa (Burundi)Comoro Islands EthiopiaFrench Territory of the
Afars and Issas Kenya Madagasear Mauritius
Code 11—Latin America
lam aicaMartiniqueMontserrat
10.4 Southern Africa South Africa
I I . 1 Caribbean Antigua Bahamas Barbados
57
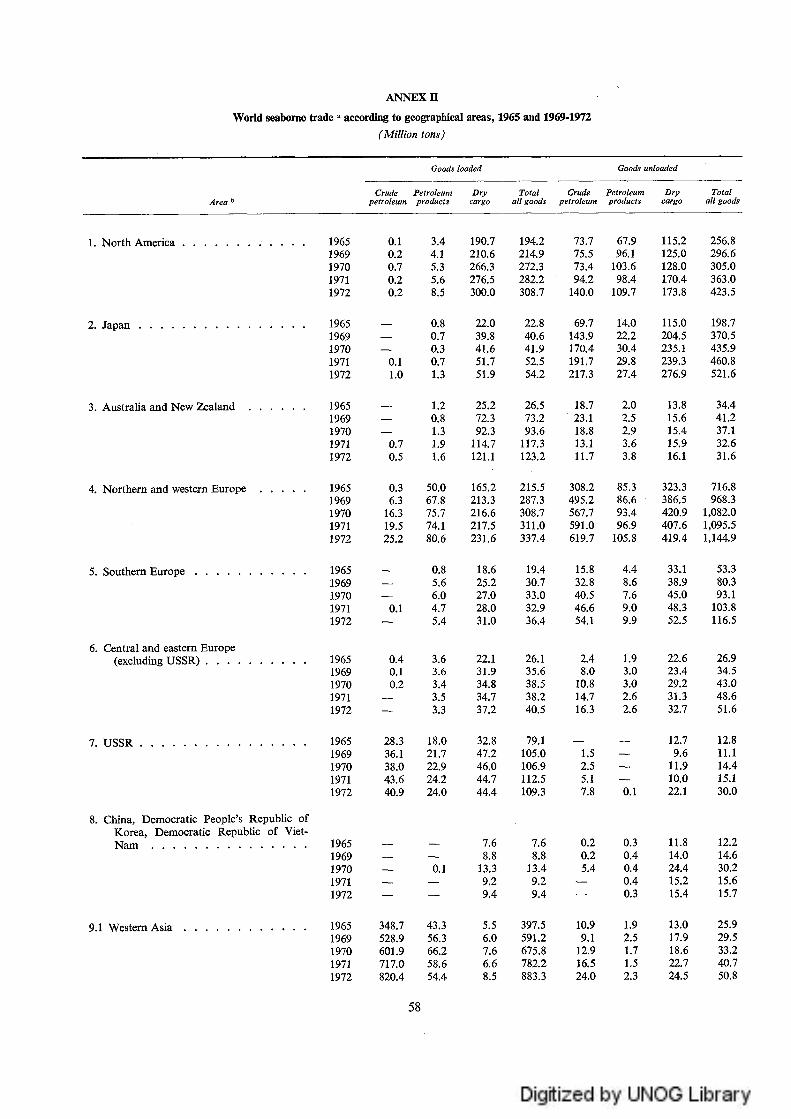
and 1969-1972 أ
ANNEXп
according to geograplii ؛ ء((Million tons
World!
٠٠٠ ^ unloaded
Total all goods
D rycargo
٠٠٠ loaded
Total Crude Petroleumall goods petroleum products
D rycargo
Crude Petroleum petroleum productsArea ١١
305.03ة3.0
3?0.5
m l521.6
34.441.2
i.م95.5
144,9:,
93.1163.8116.5
26.934.543.6
51.6
115.2125.0128.0170.4 173.8
115.0204.5
^76.9
16.1
323.3
420.9407.6419.4
33,1
45.0
52.5
^2.623.429.2
32.7
I109.7
14.022.230.4
27.4
2.0
7.69.09.9
3.03.0
2.6
12.7 12.89.6 11.1
11.9 14.410.0 15.122.1 30.00.1
140.0
143.9170.4191.7 217.3
18.7 23.118.8
11.7
308.2495.2567.7 591.0619.7
32.8
46.654.1
2.48.0
10.814.716.3
2.5
I40.641.952.5 54.2
26.5
93.6117.3 123.2
215.5
308.7311.0337.4
19.430.7 33.0
36.4
40.5
79.1105.0106.9112.5109.3
190.7210.6
30o!o
22.039.841.6
51.9
25.2
92.3 114.7 121.1
165.2213.3 216.6217.5231.6
18.6 25.227.0
31.0
22.1
34.834.7
47.246.044.744.4
3.44.1
0.80.70.30.7
0.8
50.0 67.8
74.1
0.8
6.04.75.4
3.6
3.4
18.0
22.9^4.224.0
0.10.20.70.20.2
0.11.0
0.70.5
0.3
1б!з19.525.2
0.1
0.40.10.2
36.1
43.640.9
970971
970971972
970971972
970971
970971
969970971972
970971
1. N©rth America
2. Japan
3. Australia and New Zealand
4. Northern and western Europe
Southern Europe
Central and eastern Europe (excluding USSR) . . . .
7. USSR
14.630.2
11.814.024.4
15.4
0.30.40.40.40.3
0.20.25.4
7.6
3.4
9.4
7.6
9.4
0.1
19651969197019711972
8. China, Democratic People’s Republic of Korea, Democratic Repubiic of Viet- N a m ..........................................................
25.929.533.240.750.8
13.017.918.622.7^4.5
ia 9
16.524.0
5.5 3976.0 591
348.7 43.3
601.9717.0820.4
19651969197019711972
9.1 Western Asia

ANNEXEE (continued)
(Miiiion tons)World seaborne trade ؛
Goods loadedه٠٠ض محءههم/س
Total ٠// goods
ه٢مcargo
Total Crude Petroleumpetroleum كمحممك//ءء products
Drycargo
Crude Petroleum products ا،ءء-م/ءه»<ءArea ه
98.5142.7139.9153.3178.0
31.132.833.834.836.9
19.922.423.323.3
67.861.9 67.4 79.7
16.316.917.919.021.1
9.912.114.816.015.2
17.023.1
3.9 5.65.9 4.5 4.4
4.6 4.3 4.0
3.7
23.3 51.8 54.763.4 76.3
10.910.3
11.311.4
1.5
3.63.84.4
93.3132.5 148.0 155.4181.6
117.2238.1255.4211.9197.8
56.190.8
123.0140.7159.2
65.584.5 89.390.2
101.3
29.2
28.3 26.9 27.8
41.1
61.558.1
1965 14.6 13.11969 29.3 18.81970 35.0 23.71971 39.5 25.71972 51.9 28.4
1965 84.6 3.41969 202.9 6.71970 221.4 5.61971 179.2 5.81972 161.9 8.1
1965 14.7 0.31969 32.9 1.41970 60.5 1.01971 81.1 1.41972 98.4 1.6
9.2 Southern and Eastern Asia, n.e.s. . .
10.1 Northern Africa
10.2 Western A hica
13.214.9 16.418.9 17.6
6.27.08.3
10.38.7
3.0
6.16.1
1965 — 0.5 11.0 11.51969 — 0.8 14.8 15.71970 — 1.2 16.1 17.31971 — 1.1 16.8 17.91972 — 1.0 16.9 17.9
10.3 Eastern Africa
1965 — 0.3 8.3 8.5 4.7 1.5 6.2 12.41969 — 0.1 12.1 12.2 7.7 2.4 4.2 14.31970 — — 13.1 13.2 8.8 2.6 6.2 17.61971 — — 15.2 15.2 12.5 3.3 7.8 23.61972 — — 17.8 17.8 11.8 2.1 6.7 20.6
10.4 SouthernAfrica
1965 — 0.2 20.4 20.6 4.8 3.0 7.2 15.91969 — 0.2 22.0 22.3 6.3 4.0 7.6 17.91970 — 1.4 28.4 29.8 23.5 4.5 11.2 39.21971 2.6 26.6 25.9 55.1 51.4 5.8 11.8 69.01972 2.8 25.5 24.2 52.5 32.9 5.5 10.6 49.0
11.1 Caribbean .
1965 1.0 2.6 9.9 13.5 3.5 3.4 4.1 10.91969 — ١٦ 12.0 14.8 5.9 4.7 5.5 16.01970 — 3.7 11.9 15.6 6.0 5.5 6.5 18.01971 — 2.3 13.3 15.6 6.9 6.4 6.7 20.01972 — 2.2 14.3 16.5 8.4 6.7 6.9 22.0
11.2 Central America
1965 123.3 99.2 27.7 250.2 53.9 3.0 4.7 61.61969 132.3 102.7 33.6 268.5 57.0 4.1 5.9 67.01970 131.1 111.8 36.0 278.9 63.1 3.0 6.7 72.91971 121.5 80.8 36.2 238.5 41.0 2.8 6.3 50.11972 111.8 72.5 38.1 222 4 40.5 3.2 6.9 50.6
11.3 South America, northern seaboard . .
1965 6.0 0.8 25.9 32.7 1.1 1.5 5.1 7-71969 5.4 1.7 28.4 35.6 4.0 1.0 6.4 11.31970 4.6 1.6 29.8 35.9 4.1 1.5 5.9 11.51971 3.8 1.7 30.2 35.7 5.8 0.9 5.7 12.41972 5.5 2.2 25.8 33.5 6.5 0.6 6.0 13.1
11.4 South America, western seaboard ٠ .
59

land 1969-1972
А Ш Е Х и (concluded)
(Million tons)World seaborne ^ade '
Goods unloaded
Total a lt goods
م-اه؛،»٠٢
Crude Petroleum petroleum products
Total all goods
Goods /محءمحهم
D rycargo
Crude Petroleum petroleum productsA re a "
29.8
39.645.2
!?.?19.8 19.320.9
1.4
1.03.72.4
17.118.82 .225.5
35.343.4
34.443.254.3 56.953.4
0.80.2
0.60.10.71.1
19651969197019711972
11.5 South America, eastern seaboard
I0.91.4
1.70.69.5
9.20.20.40.50.1
19651969197019711972
12. Oceania, n.e.؛
637.2,,؛223.7.,؛490.7 i
1,133.71,218.6
22L7277.4
317.5
1,101.21,198.71,316.2
1.632.9
2,566.62.691.9
1,124.21.162.51.221.5
1965 67?» 242.31969 974.5 296.fi197» 1,هل9.9 332.51971 1,2©9.7 319.71972 1,321.7 322.3
W o r l d t o t a l
D ; ءءسم>،ء ata communicated to the UNCTAD secretariat by the Statistieai Office 0( the United Nations; estimated data: the world totais do not correspond exactly to the rounded total لn tahle 1 In the text.
٠ Excluding international cargoes loaded at ?orts oflthe Great Lakes and St. Lawrence system ^or unloading at ^orts oflthe system. Including petroleum imports into Netherlands Antilles and Trinidad for refining and re-export. Great Lakes and Sc. Lawrence trade (in dry cargo) amounted to 37 million tons in 1965, 37 million tons in 1969, 42 milhon tons in 1970, 37 milhon tons in 1971, and 39 mihion tons in 1972.
١١ See annex I for the composition o f these groups.

ANNEXшDistribution of world tonnage by flag of registration ء and type of ship,
in order of size of fleets, in grt and dwt, as at 1 July 1974(dwt figures are shown in parentheses) ٠
Other ships
O f which:
Bulk carriers ٠ General cargo ء Container shipsTankersTotal tonnage دi; o f registration^
208,850 50ل,00ل
3,631,694 026,067,
2,42],753
22,046
23,747
2,4لة
187
7,394
114
149
1,490,587
673,484
7,095,191
738,947
1,677,915
699,261
1,264,303
49 4 ,9 2 3
,351,9
1,019
37,313
48,156
17,930
,843,409
138,770
97,199
62 5 ,6 7 2
3,402,731
5,442,698
5,024,576
30,927
111,097
1,500
3,602
4,916
537
192
1,323
978
949
1,518
620
904
1,968,634
6,361,392
6,854,104
3,711,791
17,459,426(31,830,506)
(20,696,092)
7,564,706(12,885,032)
^78,402(451,170)127,641
(211,225)
26,793(38,667)
9,138,201(15,573,303)
7,12?,608(12,385,431)
520,442(797,236)
1,852,802(3,059,875)
(828,814)
1,169,041(1,977,409)
3,142,666(5,382,088)
2,066,815(3,525,012)
33,749,633(66,070,9??)
16,012,234(29,585,885)
15,203,281(27,898,861)
(11,705)
(2,700)
(23,126,803)
(835’,13,’б17)
3,658,025(5,400,699)
4,681,757(8,405,299)
(8,257,353)
(б’,411؛0?2)
2,140,635(3,945,852)
1. L ib e r ia 55,321,64!(103,744,205)
(62,175,855)3. flnhed Kingdom of Creat Britain
and Northern Ireland . . . . . . 3!,566,298(50,345,001)
(25) B e r m u d a 1,153,280
(49) H o n g k o n g . . . . ٠ . . ٢ ’269 ث945ل(375,388)
(82) Cayman Islands . . . . . 39,717
(90) C ibrahar . . . . . إ8ئ293ر . ٠ ٠(40,823)
(110) St. V incent 4,808
(111) New Hebrides . . . . . . ئإ91رة
(115) Falkland Islands (Malvinas) ؛ئ93را?
(118) Seychelles . ؟ئ90لا . . ٠ . . ٠ ٠(3,050)
(121) Tur^ I s l a n d s . . . . . . . 1,572
(D 4) Virgin Islands (U K إاا127ر .( . . ٠
(125) Montserrat . . . . . . . 949
(127) Cilbert and Lllice Islands . ، ئا518ل
(129) Belize . . . . . . ا620ر . .٠ ٠
(131) Solomon Islands . . . . . 629(483)
( 1 3 5 ) S t .U u c ia 904(140)
(136) St. Kitts, Nevis and Anguilla 256
4. N o r w a y . . . . . . . . . . . . 24,852,917(42,765,686)
5. C r e e c e 21,759,449(35,975,152)
6. Union of Soviet Socialist ^epublies 18,175,918(19,037,489)
7. P an am a 1 1 ,3 ,2 2 7 س(17,572,996)
8. United States of America(estimated active sea-going fleet) 10,?6?,6?9
(15,147,875)
9. F r a n c e 8,834,519(14,462,495)
10. I t a l y 9 ,3 2 1 5 ة م(14,085,675)
11. Federal Republic of Cermany . ٠ 7,980,453(12,467,278)
61

ANNEX ш (continued)
Distribution of world tonnage by flag of registration ء and type of sbip,in order of size of fleets, in grt and dwt, as at 1 July 1974
(dwt figures are shown in parentheses) ٠
O f which:
Bulk carriers ء رء«ءه-ه;اهء-مء ء Container ships o th e r ships
423,046
783,890
40ل!,49
37,374
42,434!
!90,53
323,849
5,138
57,341
52,819
193,633
173,793
105,008
135,811
2,829(2
165,518
5,494
218,606
109,445
40,965
TankersTotal /
153,998
153,181
20,938
178,694
8,014
57,179
1,036
6,336
83,123
1,060,981
998,143
1,145,260
7,279
1,311,305
2,327,953
956,084
1,105,406
1,409,550
1,342,826
977,436
513,917
372,852
303,139
627,472
401,743
222,307
11,850
2,443,635(4,165,165)
468,036(756,491)
(1,533,937)537,122
(897,704)
1,495,942(2,562,071)
381,612(578,714)745,555
(1,230,311)496,800
(894,783)824,819
(1,274,168)364,056
(578,328)194,182
(315,906)497,772
(8^4,609)64,355
(93,850)204,224
(332,891)442,002
(753,865)124,799
(192,871)73,204
(117,063)442,011
(686,005)
(4,057,189)2,514,003
(4,497,327)2,260,109
2,197,994(4,160,358)
527,056(889,782)601,362
(944,671)
885,557(1,514,827)
38,244(56,084)137,529
(225,199)276,218
(428,759)250,396
(423,480)
(1,20ة!937)462,126
(832,373)333,522
(548,901)520,047
(763,847)549,016
(976,055)255,408
(414,223)
(165)172,078
(293,908)207,187
(318,457)625,998
(551ئ379)D0,241
(186,527)366,770
288,567(460,358)
196,532(277,061)
270,395
423,740(793,637)115,719
(178,669)44,431
(76,718)565,372
(1 1 1 ,’з21)
62
(9,250)592,499
(9,885,974)5,500,932
(8,302,180)4,949,146
(7,389,000)4,460,219
(7,119,616)
(25,149)3,484,751
(4,966,760)2,878,327
(4,396,079)
s ) ؛2,292,318
(3,119,309)1,916,273
(2,881,668)1,870,567
(2,691,458)1,778,423
1,507,582(2,090,558)
1,225,679(1,858,550)
1,214,707(1,807,302)
1,408,129(1,798,802)
1,243,128(1,753,954)
(1,577,412)
(18,740)1,223,859
(1,555,340)971,682
(1,304,503)864,939
(1,209,392)
(1,132إ134)766,478
(1,017,142)762,278
(928,727)
Fiag ٠/ registration ء
12. Sweden . . . . . . . . . .
13. Netherlands . . . . . . . .
14. Spain . . . . . . . . . . .
15. Denmark . . . . . . . . .
(96) Faeroe Islands . . . .
India . . ٠ . . ٠ ٠ . . . ٠
Cyprus -
Singapure . . . . . . . . .
Brazil ٠ ... ٠ ٠ ... ٠
?©land . . . . . . . . . .
s© m alia. . . . ٠ . . ٠ . .
China . . ٠ . . . ٠ ٠ . .
Yugoslavia . . . . . . . .
Finland . . . . . ٠ ٠ . . .
^epublio of ^ o rea . . . . .
Belgium . . . . . . . . .
Argentina . . . . . . . . .
Portugal ٠ . . ٠ ٠ . . . ٠
Australia . . . . . . . . .
(100) New Guinea . . . . .
31. German Democratic Republic
32. Turkey . . . . . . . . . .
33. Bulgaria . . . . . . . . .
34. Kuwait . . . . . . . . . .
35. Philippines . . . . . . . .
36. In d o n e s ia
16,
17,
18,
19,
20,
22.
23.
24.
27.
29.
30.
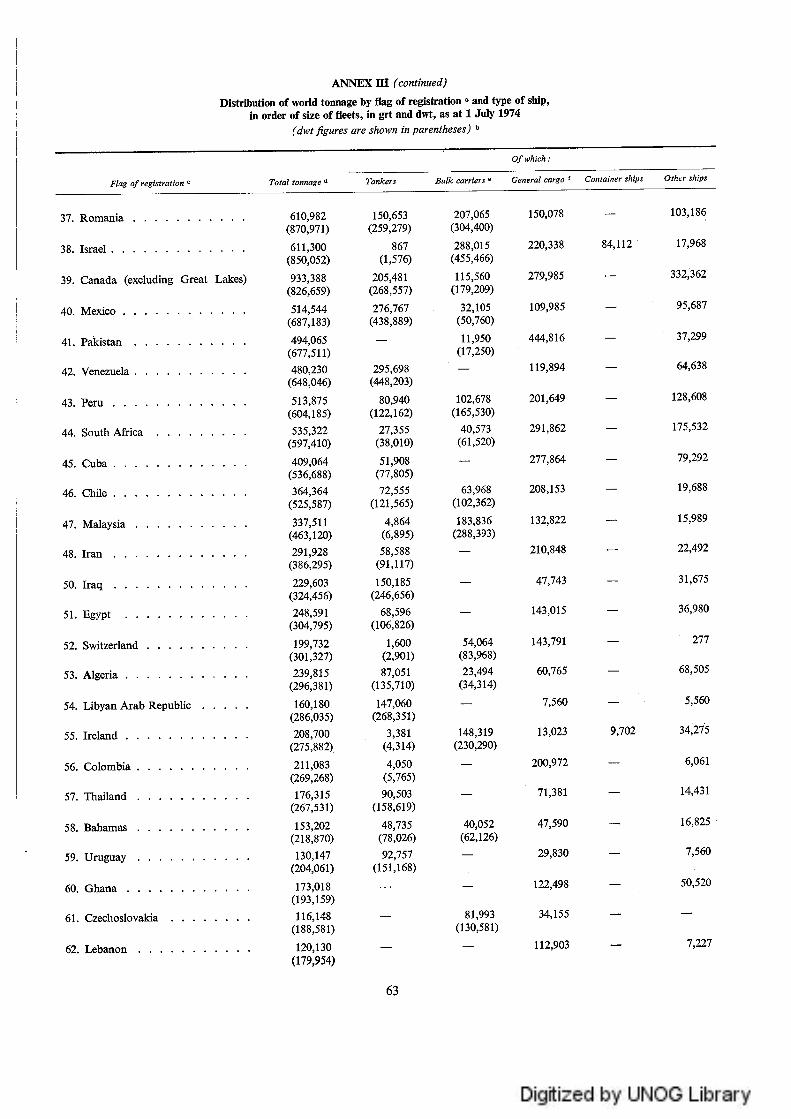
ANNEX ш (continued)
Distribution of world tonnage flag of registration ء and type of ship,in order of size of fleets, in grt and dwt, as at 1 July 1974
(dwtfigures are ^ ٠١٧« in parentheses) ”
103,1
17,9
33ة3
95,e
128,608
175,532
31,675
277
68,505
5,560
34,275
6,061
14,431
50,520
O fw h ic h :
B u lk carriers ء General cargo ؛ Container ships o th e r ships
4,112
9,702
150,078
220,338
279.985
109.985
444,816
119,894
201,649
291,862
277,864
208,153
132,822
210,848
47,743
143,015
143,791
60,765
7,560
13,023
200,972
71,381
47,590
^9,830
122,498
34,155
112,903
207,065(304,400)
288,015(455,466)
115,560(179,209)
32,105(50,760)
11,950(17,250)
102,678(165,530)
40,573(61,520)
(102,362)
183,836(288,393)
54,064(83,968)23,494
(34,314)
148,319(230,290)
40,052(62,126)
Tankers
150,653(259,279)
(1,576)
205,481(268,557)
276,767(438,889)
(448,203)
80,940(122,162)
27,355(38,010)
51,908(77,805)
.(ة:ةئ(6إ895)
أ:ق) ئ أ150,185
(246,656)
(10ا’826)
1,600(2,901)
87,051(135,710)
147,060(268,351)
3,381(4,314)
4,050(5,765)
90,503(158,619)
48,735(78,026)
92,757(151,168)
Total tonnage ءد o f registration ء
.(ة;ة)
610,982(870,971)
611,300(850,052)
933,388(826,659)
514,544(687,183)
494,065(677,511)480,230
(648,046)
513,875(604,185)535,322
(597,410)
409,064(536,688)364,364
(525,587)
337,511(463,120)291,928
(386,295)
229,603(324,456)248,591
(304,795)
199,732(301,327)239,815
(296,381)
160,180(286,035)208,700
(275,882)
211,083(269,268)176,315
(267,531)
153,202(218,870)130.147
(204,061)
173,018(193,159)116.148
(188,581)
120,130(179,954)
37. Romania . . . . . . . . . . .
38. Israel . . . . . . . . . . . . .
39. Canada (excluding Great Lakes)
40. Mexico . . . . . . . . . . . .
41. Pakistan . . . . . . . . . . .
42. Venezuela . . . . . . . . . . .
43. Peru
44. South ALica . . . . . . . . .
45. Cuba . . . ٠ .. ٠ ٠ . . . . .
46. Chile . . . . . . . . . . . . .
47. Malaysia . . . . . . . . . . .
48. Iran . . . . . . . . . . . . .
50. fraq . . . . . . . . . . . . .
51 .L gypt . . . . . . . . . . . .
52. Stvitzerland . . . . . . . . . .
53. Algeria . . . . . . . . . . . .
54. Libyan Arab Republie . . . . .
55. Ireland ٠ . . . . . . . ٠ . . ٠
56. Colombia . . . . . . . . . . .
57. Thailand . . . . . . . . . . .
58.R aham as . . . . . . . . . . .
59. Uruguay . . . . . . . . . . .
60. Ghana
61. Gzeehoslovakia . . . . . . . .
62. L e b a n o n

ANNEX ш (continued)
Distribution of world tonnage by flag of registration ء and type of ship,in order of size of fleets, in grt and dwt, as at 1 July 1974
(dwt figures are shown in parentheses) »
O f which ;
Bulk carriers ء General cargo أ Container ships Other shipsTankersTotal /Flag o f registration ٥
Austria . . . . . . . . . . . .
New Zealand . . . . . . . . .
Ivory Coast . . . . . . . . . .
Eeuador . . . . . . . . . . .
Nigeria ٠ . . . . . ٠ . . . . ٠
Iceland . . . . . . . . . . . .
Maldives . . . . . . . . . . .
Saudi Arabia . . . . . . . . .
M adagascar . . . . . . . . . .
Albania . . . . . . . . . . . .
Honduras . . . . . . . . . . .
N auru . ٠ ... ٠ ٠ ... ٠ ٠
Burma - - -
Hungary . . . . . . . . . . .
Sri Lanka . . . . . . . . . . .
Republic of Viet-Nam. . . . . .
Morocco . . . . . . . . . . .
Sudan . . . . . . . . . . . .
Zaire . . . . . . . . . . . . .
Democratic People’s Repubiic of Korea . . . . . . . . . . . .
M alta . . . . . . . . . . . .
Nicaragua . . . . . . . . . . .
Mauritius . . . . . . . . . . .
C a b o n
47,233
6,101
12,807
16,001
89,951
3,931
300
3,503
7,950
10,026
1,120
4,320
41,290
4,961
116,166
113,737
106,027
56,310
37,816
57,068
38,701
45,449
49,150
42,619
35,918
39,799
34,646
20,544
30 ,883
22,712(34,188)
19,564(31,953)
8,670(10,917)
10,503(15,537)
(112,’810)
2,467(3,443)
(14,’258)
2,434(3,756)
(31,744)20,179
(31,626)
(1,703)
1,478(1,709)
1,454(2,084)
5,016(8,531)
(1,015)
ة) .<ة:نأ27,442
(44,242)4,026
(6,107)
347(258)
97,067(176,457)163,399
(174,052)
121,276(173,103)128,473
(170,836)
121,301(157,772)115,612
(157,098)
148,695(122,039)
78,663(98,358)
61,275(83,241)53,409
(82,219)
(78,’oOO)69,561
(75,549)
(73,’882)54,877
(72,711)
49,150(68,119)54,099
(65,748)
(63,224)52,564
(63,139)45,943
(58,863)
(أق:ةأ)60,347
(55,458)38,011
(51,791)33,240
(48,190)33,281
(45,126)33,159
(44,508)
63.
64.
65.
67.
70.
71.
74.
76.
77.
78.
79.
81.

ANNEX ш (continued)
Distribution of world tonnage by flag of registration ء and type of sbip,in order of size of fleets, in grt and dwt, as at 1 July 1974
(dwt figures ،؛re shown in parentheses) ٠
O f which:
Buik carriers ء Générai cargo ' Container ships Other shipsTankersTotal ،ownageءFlag o f registration ٠
89. United Arab Emirates . . . . .
91. Tunisia . . . . . . . . . . . .
92. United Republic of Tanzania . .
93. Monaco . . . . . . . . . . .
94. Kenya . . . . . . . . . . . .
95. Ethiopia . . . . . . . . ٠ ٠ ٠
97. Paraguay . . . . . . . . . . .
99. Guinea . . . . . . . . . . . .
01. Dominican Republic . . . . . .
02. Guyana . . . . . . . . . . . .
03. Trinidad . . . . . . . . . . .
©4. Guatemala ٠ . ٠٠ ٠ ٠ . . . .
©5. Tonga . . . . . . . . . . . .
06. Uganda ٠ . . . . . ٠ . . . . ٠
07. Zambia . . . . . . . . . . . .
08. Démocratie Republic o f Viet-Nam
09. F i j i . . . . . . . . . . . . . .
12. Jam aica . ٠ ٠ . . ٠ . . ٠ . . .
13. Bahrain ٠ . . ٠ . . . . . ٠ . .
14. Sierra Leone . . . . . . . . .
1 6 .G o s ta ^ ic a . . . . . . . . . .
17. Démocratie Yemen . . . . . . .
19. Khmer Republic . . . . . . . .
20. Syrian Arab Republic . . . . .
2,333
3,429
10,578
642
2,101
4,719
5,651
250
2,^54
1,168
1,971
210
10,994
16,874
25,593
10,947
21,759
6,045
4,13^
9,188
10,027
7,195
6,827
5,510
5,513
6,094
3,033
1,213
1,657
10,764(15,290)
15,118(22,509)
(9,’б00)
(261)
(35,331)3,197
(5,054)
2,051(2,980)2,935
(4,114)
(ث’,246)
674(1,609)
943(1,202)
(3,440)
314(500)
(400)
433(575)165
(150)
(41Д81)
28,561(38,545)
28,371(37,262)
(35؛840)
مةة:!ق25,034
(31,400)21,930
(23,619)
20,499(20,554)
(20ئ108)
(16م48)
؛(أ:ق؛إ15,574
(12,331)8,222
(11,022)9,081
(9,939)5,510
(9,115)
(أأ؛ة)9,151
(2,515)
7,041(6,521)
6,740(6,064)
5,140(6,054)
5,045(5,368)
5,603(5,050)
2,180(5,113)
2,090(2,862)
2,643(2,807)
65

т т х ш (concluded)
Distribution of world tonnage by flag of registration “ and type of ship,in order of size of fleets, in grt and dwt, as at 1 July 1974
(dwtfigures are shown in parentheses) ا>
O f which:
Other shipsBulk carriers ٠ General cargo ء Container shipsTankersTotal tonnage^Flag o f registration ء
696
3,199
728
1,681
474
291
3,897ا534 ,
200
70,461
135,038,
1,023
1,260
641
200(350)
7,6
3,404
620,606
;,865,077
386,403(631,698)
76,641,897(131,204,357)
331,741(587,741)
9,2038,680)
129,2(237,9
2,249(2,125)
(1,850)1,337
(1,065)3,199(933)
(525)
(340)
(334)474
(150)291(55)
1,534200
1,416,833(2,110,699)
306,134,619(486,931,263)
122. Oman . . . . . . . . . . . .
123. Yemen . . . . . . . . . . . .
126. Gambia . . . . . . . . . . . .
128. United Republic of Cameroon . ,
130. . . . . . . . . . . . .
132. Grenada . . . . . . . . . . .
133. Mauritania . . . . . . . . . .
134. Dahomey . . . ٠ ٠ . . . . . .
137. £1 S a l v a d o r . . . . . . . . . .
138. B a rb a d o s 139. C o n g o 140. Jordan . . . . . . ٠ . . . ٠ .
Other (unallocated) . . . . . . . . .
W o r l d T O T A L؛
Source: L lo yd ’s Register o fS h ip p in g : Sta tistica l Tables, 1974 (London), nnd supplem entary d a ta regarding ؛؛١٠ G reat Lakes fleets o f the U nited S tates o f A m erica and C anada and regard ing the U nited S tates Reserve fleet.
٠ T he designations em ployed in this tab le refer to flags o f reg istration and do n o t im ply the expression o f any opin ion by the Secretaria t o f the U nited N ations con- eerning th e legal status o f ny eounق tr^ o r te rritory , o r o f its authorities, o r eoncerning the delim itation o f its frontiers.
G ء r t figures are show n o n the first line; w here available, dw t figures are show n in parentheses on the second line.٠ In the ease o f flags o f hom self-governing territories, whieh are listed o n t o f ran k order, the num ber indieating ran k orde^ is show n in parentheses.ه Ships o f 100 g rt an d over, exeluding the G rea t Lakes fleets o f the u ^ t e d S tates o f A m erica an d C anada an d th e U n ited S tates Reserve fleet (see also n o te g).٠ O re an d b u lk carriers o f 6,000 g rt and over, ineluding o re/bu lk /o il carriers.
ء«؛ء /س » ء ه ;(!) U n ited S tates G rea t Lakes fleet estim ated a t 1,661,397 g rt (2,689,323 dw t), o f whieh tankers: 40,914 g rt (69,553 dw t); o re and bn lk carriers; 574,787,؛ g rt
(2,619,770 dw t);(ii) C anad ian G rea t L a^es fleet estim ated a t 1,526,610 g rt (2,057,175 dw t), o f w hieh tankers; 58,629 g rt (99,669 dw t); o re an d bu lk ca rriers: ا22ا,28ة, grt
(iii) U n ited S tates ^؛eserve fleet esti;na؛ed a t 2 m illion g rt (2,308,000 dw t), o f w hieh tankers; 162,700 g rt (251,700 dw t); general cargo vessels; 1,809,300 g rt (2 أ014,2هم ) dw t.
T he figures fo r the U nited S tates Reserve fleet apply to vessels o f m ore than 1,000 g rt and are thus n o t directly com parab le w ith the figures fl-om w hieh they have heen dedueted (bu t the statistical discrepancy is very sm all, since few ships o f less th a n 1,000 g rt a re included in the Reserve fleet).

Distribution of world fleet by geographical areas, as at 1 July 1974
(Vessels ٠/1 0 0 grt and above / in ^ ٢؛ and dwt) ء
ANNEX IV
O f which:
B u lk carriers General cargo Container ships Other shipsTankersArea Total tonnage
1 .* N ه rه A] ١آ erica . . . . . . . . 12,854,347(17,941,085)
2. Japan 38,707,659(62,175,855)
3. Australia and New Zealand ٠ . . 1,331,766(1,751,464)
4. Northern and Western Europe ٠ . 102,192,440(164,268,459)
5. Southern E u ro p e 30,768,132(49,164,967)
6. A n tra l and Eastern Europe(excluding USSR) . . . . . 5,214,764
(7,089,712)
7. U S S R 18,175,918(19,037,489)
8. Clrina, Démocratie People’s Repub- lie of Korea, Democratic Republico f V iet-N am 1,940,065
(2,754,431)
9.1 Western A s i a 2,038,973(3,013,787)
9.2 Southern and Eastern Asia ٠ . ٠ ٠ 7,865,565(11,670,385)
10.1 Northern A f r i c a . . . . . . . . 729,711(988,895)
10.2 Western Africa . . . . . . . . 536,027(674,204)
10.3 Eastern A fr ic a 220,791(307,946)
10.4 Southern Afriea . . . . . . . . 535,322(597,410)
11.1 C a r ib b e a n ' 649,999(860,925)
11.2 A n tra l A m e r i c a . . . . . . . . 632,081(827.849)
11.3 South America: northern seabord 495,919(663,559)
11.4 South Ameriea: western seabord . 1,217,795(1,569,876)
11.5 South America: eastern seabord . 3,997,109(5,783,709)
12. D ceania 99,055(116.849)
2,032,323
3,631,694
212,751
8,148,524
755,386
7,095,191
102,179
129,784
571,773
128,127
97,520
20,013
175,532
111,714
101,702
69,357
160,458
244,725
10,976
1,843,409
1,026,067
83,123
64,587
8,156
4,11^
20,6
1,019
2,419,350
338,473
2,292,240
6,854,104
1,357,381
868,403
3,896,349
268,013
410,385
173,517
291,862
393,169
207,588
129,921
660,612
68,007
(1,459,193)
442,011(686,005)
27,261,674 17,291,324(46,358,365)
(15,086,234)
(2,304,667)
520,442(797,236)
194,182(315,906)
288,015(455,466)
2,074,6083,497,798)
23,494(34,314)
(30,827)
40,573(61,520)
40,052(62,126)
40,775(61,677)
166,646(267,892)
621,599(1,087,654)
(31,953)
5,706,370(9,985,177)
16,012,25,885) (20,696,092)
255,408(414,223)
46,691,264(86,110,542)
10,981,401(19,606,148)
3,658,025(5,400,699)
286,323(445,069)
1,302,137(2,215,946)
310,077(521,502)
(9,097)
27,261(42,621)
(38م10)
104,045(160,880)
282,016(446,699)
296,641(449,405)
230,079(362,302)
1,501,296(2,433,956)
(565)
6?

Distribution of world fleet by geographical areas, as at 1 July 1974
(Vesseis o f 100 grt and above / in grt and dwt) ؛ ،
ANNEX IV (continued)
O f which:
Bulk carriers General cargo Container ships O ther shipsTankersTotal tArea
501,001
738,947
5,138
1,386,980
70,461
27,135,038
208,850
17,930
7,179
7,6
3,404
3,402,731
3,711,791
1,286,969
1,409,550
12,138,994
620,606
$6,865,077
17,459,426(31,830,506)
(3,059,875)
381,612(578,714)
745,555(1,230,311)
364,056(578,328)
20,803,451(3?,27?,?34)
386,403(631,698)
76,641,897(131,204,357)
33,749,633(66,070,977)
4,681,757(8,405,299)
601,362(944,671)
729,685(1,258,274)
137,529(^25,199)
9,9664,420)
39,8(76,9
331,741(587,741)
129,^29,203(237,978,680)
55,331,641(103,744,205)
11,003,227(17,572,996)
(4,966,760)
2,876,3^7(4,396,079)
1,916,273(2,881,668)
74,514,348(133,561,708)
1,416,833(2,110,699)
306,134,619(486,931,263)
Open registry countries ;
Liberia (not included in 10.2) .
Panama (nnt included in 11.2) .
Cyprus (not included in 5) . . ٠
Singapore (not included in 9.2) ٠
Somalia (not included in 10.3) .
Total of open registry countries
Other (unallocated) . . . . . .
W o r l d t o t a l
Source: C om piled from annex II I above (see notes to th a t annex).٠ D w t figures, w here available, a re show n in parentheses o n the seeond line.١١ Ineluding 269,945 g rt (375,388 dw t) whieh according to the source fiies the fiag o fH o n g K ong, p a r t o f w hich tonnage is believed to be contro lled by foreign interests. ٠ Including 153,202 g rt (218,870 dw t) registered in the B aham as; the location o f the effective con tro l o f this tonnage is uncertain .٠ F o r an explanation o f the code num bers, see annex I above.

ANNEX V
' s in the merchant fleets nf developing countries and territories during 1973؛(Thousand dwt / vessels م،ما/ مئ grt and over)
Additions to and I
Others ships
dwtNumber
0 /w h ich :
Bulk carriersTankers
dwtNumberdwtNumberdwt
All ships
NumberdwtNumber
160!60!60
!60!60!60
2,3002,2ص
186
186
254
!057242
764
764
- 6 4 !
!35!35
116
آ5
ا0!5 ,35!35!
,074
4082640
-109
- 7
ل0
7
ب7
11
4"
377
377
377
377
ا572 ,
,,ج
2,0182,0182,0!8
,ل4041,404
,ل404
1.437 !,4371.437
!7
17
1,027
-134
2.3002.3002.300
444
79733
797
ا404 ,404!,404!,
537!60-ل04
135ل35
— 116
2,989,ل732
2,109
503
503
6,361
5,369
2,594
2,!232,090!,95!
!8
23
!!
W ه 9.1 estern Asia
/٢٠«A dditions.........................................o f which: new deliveries . . . . Net additions - - - - - - - -
/٢٠؟A dditions.........................................o f which .■ new deiiveries . . . . Net additions . . . . . . . . .
IsraelA dditions.........................................o f which: new dehveries . . . . Net additions - - - - - - - - -
KuwaitA dditions.........................................o f which: new deliveries . . . . Net additions - - - - - - - - -
Saudi ArabiaA dditions.........................................o f which: new deliveries . . . . Net additions - - - - - - - -
Sub-total: Western AsiaA dditions.........................................o f which: n e^ deliveries . . . . Net additions . . . . . . . . .
9.2 Southern and Eastern A sia
ه ح م ء هم/هء » كA dditions o f which: new deliveries ٠ . . ٠ Net additions - - - - - - - - -
«/مح؛هA dditions
ء م/ءس'ه .■ new deliveries . . . . Net additions . . . . . . . . .
«/همح«همحءA dditions
م/س،’ء/ء .• new deliveries . . . . Net additions - - - - - - - - -
Republic ofKorea A dditions o f which: new deliveries . . . . Net additions . . . . . . . . .
MalaysiaA dditions
م/ءس'مهء • new deliveries . . . . Net additions

/مع«ئء«ء،رمحء ANNEX V
' 1973 n the merchant fleets of developing cowtries and territories during! ؛$(Thousand dwt ,■ vessels oflfiOO ءآك and اج^م-ر
Additious to and net (
Other ships
dwtNumber
O fw hich:
FreightersBulk carriersTankers
dwtNumberdwtNumberdwt
A ll ships
NumberdwtNumber
2 134 — — — — 2 134 — —
9 349 — — — — 8 344 1 5
13 - 2,027 - 1 -9 6 2 - 2 - 434 - 7 -5 8 9 - 3 - 4 2
1 27 1 27 — — — — — —
5 462 — — — — 5 462 — —
5 46^ — — — — 5 462 — —
6 1,437 2 1,241 — — 4 196 — —
4 1,185 1 1,075 — — 3 110 — —
3,018
i S
3,17814
4,014815
1,167
5,029950
1,302
61
3,5902,7043,156
3,967^,7043,533
5,0103,327
6,4474,7645,049
14
10
219219219
9,27510,624
11,00712,733
317317317
19
45 — — — — — — 1 45
45 — — — — — — 1 45
7ه
MaldivesAdditions . . . . . . .ofwhich ; new deliveries Net additions . . . . .
PakistanAdditions - - - - - - -ofwhich -• new dehveries Net additions - - - - -
PhilippinesAdditions . . . . . . .ofwhich ; new deliveries Net additions . . . . .
Republic ofV iet-N am Additions - - - - - - -ofw hich: new deliveries Net additions - - - - -
Sri LankaAdditions . . . . . . .ofwhich ; now deliveries Net additions - - - - -
ThailandAdditions . . . . . . .ofw hich: new deliveries Net additions - - - - -
Sub-total: Southern and Eastern Asia Additions . . . . . . .ofw hich: new deiiveries N et additions - - - - -
TOTAL A$IA
Additions - - - - - - -ofw hich: new deiiveries Net ad d ition - - - - -
10.1 N o r t h e r n A f r i c a
AlgeriaAdditions - - - - - - -ofw hich: new deliveries Net additions - - - - -
Libyan Arab Republic A dditions. . . . . . .ofw hich: new deliveries Net additions - - - - -
MoroccoAdditions . . . . . . .ofw hich: new deliveries Net additions - - - -

ANNEX V (continued)
٠ s in the merchant fleets of developing eountries and territories during 1973؛(Thousand dwt / ٠/ (grt and over دمح؛دءء: 1,000
Additions to and ل
O thers ships
dwtNum ber
O fw h ic h :
FreightersB ulk carriersTankers
dw tNum berdwtNum berdwt
A ll ships
Num berdwtNum ber
171
.ة
152152152
152152152
3 219 26 314 3
23
23
155
155
510 —
478 —
594155
155
-181 —
244 1
2 4 4 1
62
62
317440
155 —
510 —
478 —
152152152
901152
-110 —
-1 8 1 —
EgyptA dditions 2o f which : new deliveries . . . . —Net additions ٠ . ٠ . . . ٠ . . 2
Sub-totai: North Africa A dditions 11o f which: new deliveries . . . . 5Net additions . . . . . . . . . 9
10.2 Western Africa
GabonA dditions 1o f which ٠• new deliveries . . . . —Net additions . . . ٠٠٠. . . 1
Ivory CoastA dditions 6o f which: new deliveries . . . . —Net additions . . . . . . . ٠٠ 5
NigeriaA dditions 1o f which : new deliveries . . . . —N et additions . . . . . . . . . 1
ZaireA dditions 1o f which: new deliveries . . . . 1Net additions . . . . . . . . . 1
Sub-total: Western Africa A d d it io n 9o f which: new deliveries . . . . 1Net additions ٠ . . . ٠ . ٠ . . 8
10.3 Eastern Africa
EthiopiaA dditions —، ا/س؛هء .• new deliveries . . . . —N etadditions . . . ٠ . ٠ . . . - 2
MadagascarA dditions —o f which .• new deliveries . . . . —Net additions ٠ . . ٠ . . . . . - 2
MauritiusA ddirions. ٠ ٠ . . ٠ . . . . . 4o f which: new deliveries . . . . —Net additions . . . . . . . . . 4
SudanA dditions 1o f which: new deliveries . . . . 1Net a d d it io n s —
71
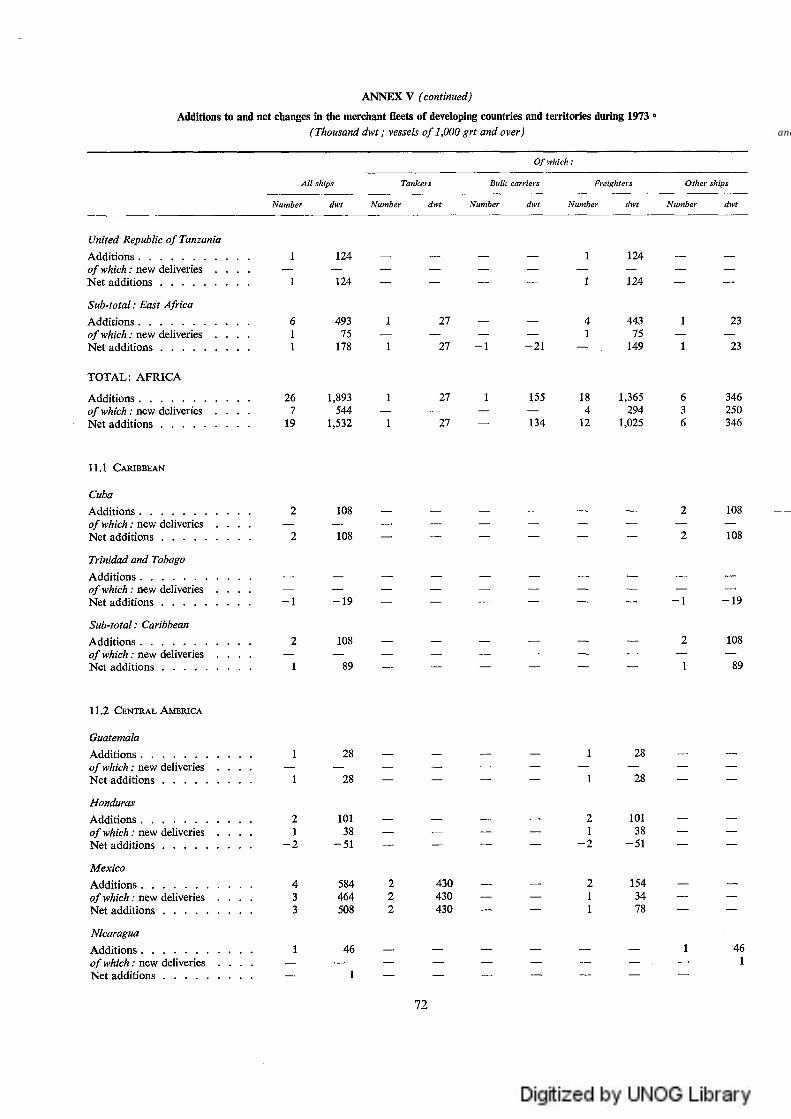
(ANNEX V (continued
' 1973 s in the merchant fleets of developing countries and territories during؛(grt and over ١٧؛ / /م7ممم،! Thousand)
Additions to and)
O f which:
Other shipsFreightersB ulk carriersTankers
dwtNum berdwtNum berNumber
A ll ships
Num ber؛،١٧؛Num ber
23
23
346250346
أ24
إ24
443
ا49
294!م25
— 27
-2ل —
18155
134
— 101
1543478
430430430
124
124
493
178
5441,532
— 101
464508
26
19
108 2 — — — — — 108
108 2 — — — — — — 108
19- 1- — — — — — — 19-
108 2 — — — — — — 108
United Repubiic o f Tanzania A dditions
ofwhich : new deliveries . - - - - - - N et additions
East Africa /.•ك؛-ءم،ء » ه
A dditionswhich ; new deliveries . /٠
Net additions - - - - - -
TOTAL: AFRICA
A dditionswhich ; new deliveries . /٠
N et additions - - - - - -
11.1 Caribbean
Cuba A d d itio n
٠ ofwhich .• new deliveries Net additions - - - - - -
Trinidad and ^هم،مكء A dditions
which ; new deliveries . /٠ Net ad d ition - - - - - -
Sub-totai : Caribbean A d d itio n
new deliveries . .• ■،;٠/ ١٧^١ Net additions - - - - - -
11.2 Central A merica
Cuatemaia A d d itio n
٠ which .• new deliveries /٠ N et ad d itio n . . . . . .
Honduras A d d itio n
new deliveries . ■٠ ofwhich Net additions . . . . . .
Mexico A dditions
new deliveries . .•لا/م’ا؛!هء N et additions - - - - - -
Nicaragua A dditions
which ; new deliveries . /٠ . . . . . . Net additions
72
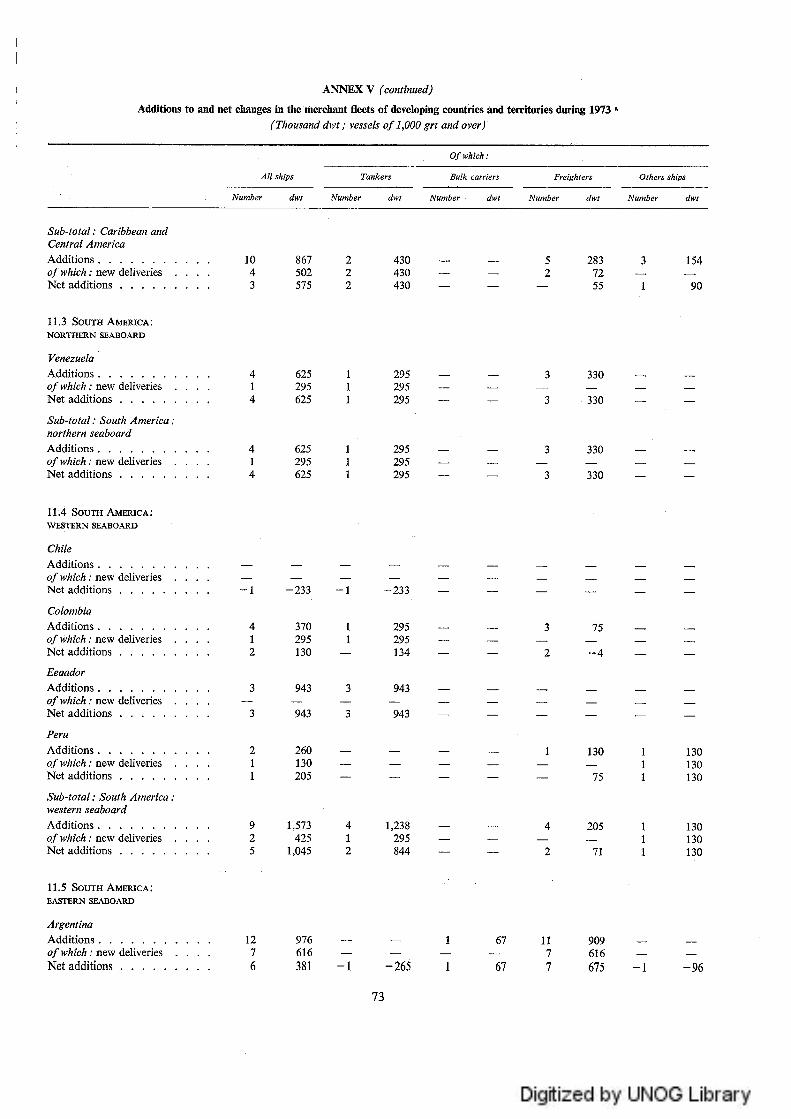
m m s .\(continued)
' s in the merchant fleets of developing countries and territories dtiring 1973؛(Thousand dwt / vesseis م/ مممئ grt and over)
Additions to and net ا
O fw h ic h ;
Others shipsFreightersء٢٢(‘مم٢ك Buik ه
dwtNum berء>اامحNum berNumber
TankersA ll ships
dwtNumberdwt•اءهء»س
154
90
430430430
502575
10
Sub-totai : Caribbean and Centrai America Additions . . . . . . .ofw hich: new deliveries Net additions . . . . .
330
330
330
330
11.3 South America:NORTHERN SEABOARD
VenezuelaA d d itio n 4
م/ءس'ء/ء .■ new deliveries . . . . 1Net additions . . . . . . . . . 4
Sub-total: ^»٠؛ ^ America :northernمح-اسمحءءA d d itio n 4ofw hich: new deliveries . . . . 1Net a d d i t i o n 4
-2 3 3 —
134 —
130130130
130130130
130
4 1,2
844
-2 3 3
370
130
943
260130205
;,573425,045
11.4 South America:WESTERN SEABOARD
ChileAd d i t i o n - - - - - - -ofwhich ; new deliveries Net add ition . . . . .
ColombiaAdditions . . . . . . .ofwhich .• new deiiveries Net additions . . . . .
ءا،محسءء•Addi t i ons - - - - - - -ofw hich: new deiiveries Net additions . . . . .
PeruAdditions . . . . . . .ofw hich: new deliveries Net ad d ition . . . . .
Sub-total: South America: western seaboard A dd ition - - - - - - -ofwhich .■ new deliveries Net additions . . . . .
- 1
909616675
67 11
67 7-2 6 5
976616381
?
11.5 SOUT^ A merica:EASTERN SEABOARD
ArgentinaAdditions . . . . . . .ofwhich ; new deliveries Net additions . . . . .
73

■ 1973 « in the merchant fleets of fleveioping countries anfl territories flm^ng/م grt ممح«ه^رمء / dwt مممئ vesselsاآ،محسسم)
A N N E X y (concluded)
Allaitions to and ا
Other ships
dwtNumber
O fw hich:
FreightersBulk carriersTankers
dwtNumberdwtNumberdwtNumber
A ll ships
dwtNumber
136120136
13612040
420250
19
19
34
34
1,516
1,204
,964,879
:؛س,؛335
49
49
19
19
1611
ة16
3920
111
313246178
313
178
312312312
3,407
3هث07
,ا407,ا3?3
,ا142
5,3704,3934,711
312312312
10
4,747 12© 9,?©5 29 3,9783,262 32 3,28© 12 3,©894,157 44 4,73© 17 3,489
11,8449,1579,787
301823
5,3055,0874,8
6,2815,703
9,346
7,484
331312331
— 64
19
19
414312414
30,274
22,163
1918
402624
6333
1ثث
91
Brazil A dditions
ofw hich: new deliveries . . . - - - - - - - - Net additions
: South America ;ه،،ك-سءمء seaboard •»ءء؛ممء
A dditionsnew deliveries . . . ;ءءآس/م Net additions - - - - - - - -
TOTAL: LATiN AMERICA AND CARIBBEAN
A dditionsnew deliveries . . . ;ءس/م'ه/ء Net additions - - - - - - - -
12. O c e a n ia
»٢، ؛ »N A dditions
. ٠ . ofw hich: new deliveriesNet ad d ition - - - - - - - -
Tonga A dditions
new deliveries . . . !.•اطءس/م- - - - - - - - Net additions
Samoa •»ءء؛ءء^ A dditions
ofwhich .• new deliveries . . . Net additions . . . . . . . .
Sub-total: Oceania A dditions
new deliveries . . . .•س/م؛هءNet additions . . . . . . . .
Total: developing eomitries and territories
A dditionsofwhich : new deliveries . . .
Net a d d it io n s
ك٠ءءسم .• C om piled fi-om d a ta te^ard io^ additions and deductions to m erchan t fieets which were m ade availahle to the U N C T A D seeretaria t bv the U ffited S tates D epartm en t o f Com m erce. M aritim e A dm inistration .
F ء igures fo r the acquisition o f second-hand ships fo r eaeh coun try m ay he ob ta ined hy deducting “new deliyeries” from “additions” .٠ F o r an exp ianation o f the eode num bers, see annex I above.
74
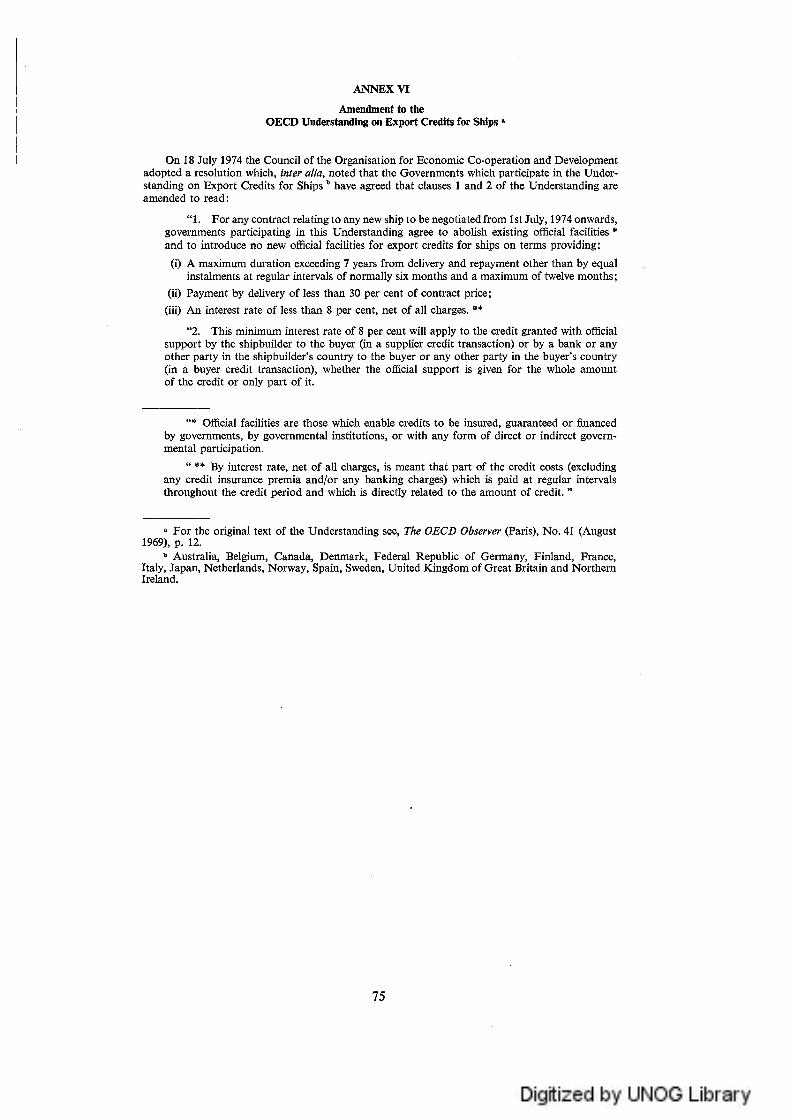
Amendment to the OECD Understanding on Export Credits for Ships •
On 18 July 1974 the Council o^the Organisation for Economic Co-operation and Development adopted a resolution which, inter ٠/،'«, noted that the Governments which participate in the Under- standing on Export Credits for Ships ء have agreed that clauses 1 and 2 of the Understanding are amended to read:
“1. For any contract relating to any new ship to he negotiated from 1st July, 1974 onwards, governments participating in this Understanding agree to aholish existing official facihties * and to introduce no new officia! fficiiities for export credits for ships on terms providing:
(i) A maximum duration exceeding 7 years from delivery and repayment other than hy equal instalments at regular intervals of normaily six months and a maximum of twelve months;
(ii) Payment by delivery of less than 30 per cent of contract price;(iii) An interest rate of less than 8 per cent, net of all charges. ٠*
“2. This minimum interest rate of 8 per cent will apply to the credit granted with official support by the shipbuilder to the buyer (in a suppiier credit transaction) or by a bank or any other party in the shipbuiider’s country to the buyer or any other party in the buyer’s country (in a buyer credit transaction), whether the offieial support is given for the whoie amount of tire credit or only part of it.
ANNEX VI
“* Official facilities are those which enable credits to be insured, guaranteed or flnanced by governments, by governmental institutions, or with any form of direct or indirect govern- mental participation.
“ ** By interest rate, net of ail charges, is meant that part of the credit costs (excluding any credit insurance premia and/or any banking charges) whieh is paid at regular intervals throughout the credit period and whieh is directiy related to the amount of credit. ”
سمءءهم Eor the original text of the Understanding see. The ء م ءء ءء ه • (Paris), No. 41 (August 1969), p. 12.
١٠ Australia, Belgium, Ganada, Denmark, Eederai Republic o f Germany, Finland, France, Raiy, Japan, Netherlands, Norway, Spain, Sweden, United Kingdom of Great Britain and Northern Ireland.
75
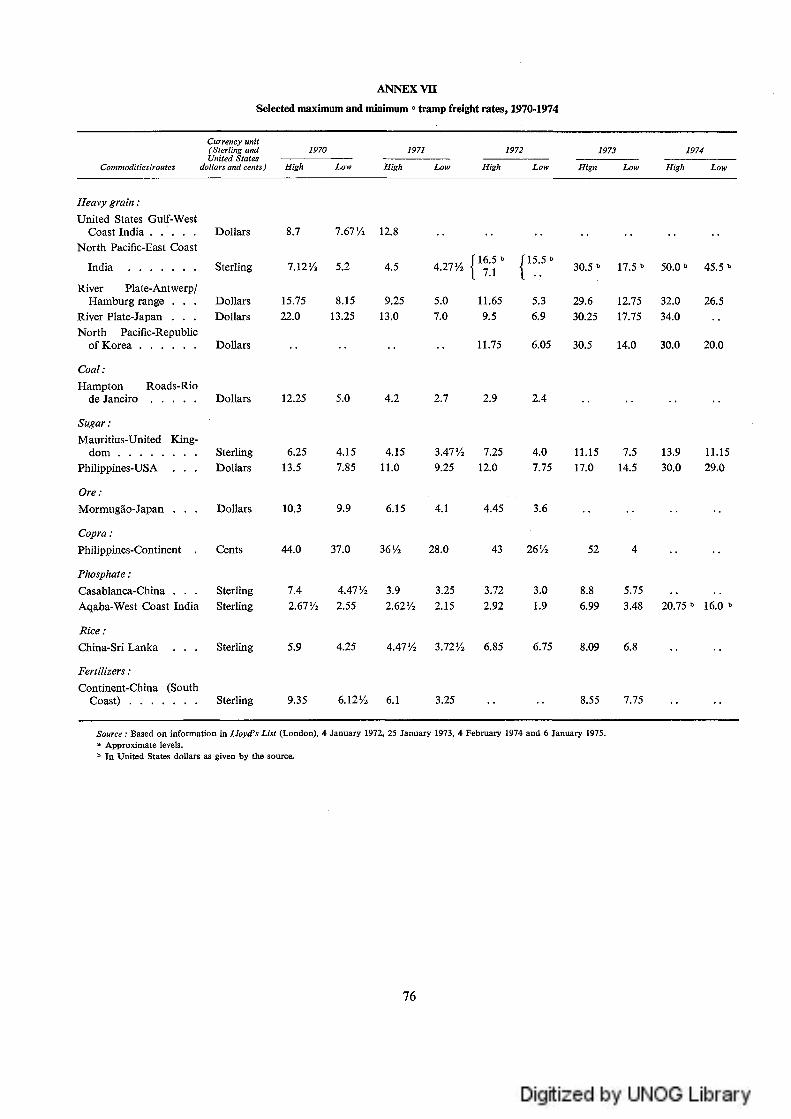
ANNEX v n
Selected maximum and mlnlmmn ء tramp freight rates, 1970-1974
Currency unit(Sterling and 1970 1971 1972 1973United S ta tes - -
Commoditiesfroutes dollars and cents) H igh Low H igh L ow H igh Low H ign
Heavy grain ;United States Gulf-West
Coast I n d i a . . . . . Dollars 8.7 1.61 Vi 12.8N orth ?acihc-£ast Coast
India . . . . . . . Sterling 7.12% 5.2 4.5 4 .2 ? % |ةل'مق 30.5» 17.5 ه 50.0، 45.5ء لا أ أ ط
^iver Plate-Antwerp/Haniburg range . ٠ . Dohars 15.75 8.15 9.25 5.0 11.65 5.3 29.6
River Plate-Japan . . . Dollars 22.0 13.25 13.0 7.0 9.5 6.9 30.25N orth Paeiflc-Republic
of Korea . . . . . . Dollars . ٠ . . . . . . 11.75 6.05 30.5
Coal:H ampton Roads-Rio
delane iro . . . . . Dollars 12.25 5.0 4.2 2.7 2.9 2.4
Sugar :Mauritius-United King-
d o m . . . . . . . . Sterling 6.25 4.15 4.15 3.47% 7.25 4.0 11.15Phihppines-USA . . ٠ Dollars 13.5 7.85 11.0 9.25 12.0 7.75 17.0
Ore:Mormugâo-Japan . . . Dollars 10.3 9.9 6.15 4.1 4.45 3.6
Copra :Philippines-Continent . Cents 44.0 37.0 3652 ؛تا 28.0 43 26/؛ء
Phosphate .•Casablanca-China ٠ . . Sterling 7.4 4.47 8.8 3.0 3.72 3.25 3.9 ؛ء/Aqaba-West Coast India Steriing 2.67% 2.55 2.62% 2.15 2.92 1.9 6.99
C hina-Sri£an^a . ٠ ٠ Sterling 5.9 4.25 4.47% 3.72% 6.85 6.75 8.09
Fertilizers:Continent-China (South
Coast) . . . . . . . Sterling 9.35 6.12% 6.1 3.25 ٠. . . 8.55
Source ; Based on in fo rm ation in L lo yd ’s L is t (4 , ا0هه0ص January January و2 ,1972 1973, 4 F ebruary ؛974 an d 6 Jan u ary 1975.“ A pproxim ate leyels.، In U nited S tates dollars as given th e source.
1974
LowH ighLow
32.0 26.534.0
30.0 20.0
30.0 29.0
،1 6 .0 ٠ 20.75
12.7517.75
14.0
76

ؤ1||1
■ й
|;ق
ااةإ آ
، § ة
|ؤ
و
!أقى
1 + ث8 §1ء ٠. ب
م ء
ء ة ، §
|أ٠
и قءقةء م أ د ق ء ة ة ل . ء ث ص
I
؛ص٣٣ 0
٩٢ ٢
ض
.ج
أ
إ
1ؤilо dا
إ
ÜM
s جi lII
ج؟،
أ؛إ■أ!
>
| :
ه صل Щ ص0 ه
P
ئء
ص©
و
оص
ة
وء
ةS
،4 •ة
K ' ï
ص٧م
иQهو
٥ ٠©
ة1!ق
ا لئء л" ص ة !ا ؟
I
مء.و
ه
Йه
§IوШو
Ï ؤ §ق
I قI Й
ق II
11
ء1مH وج Й و ه
1 1 ^
о II
1ة
^٥
Üد ء
ء II II .
1تء 1
ء
٦٦

ءة■ ء ؛ ؛
جه
s i l
§1ةة
مح5ء »
ةg ةجة ق ق
о؛ق
II|ة
ج »
H ه Й Й
mi٣Iи
م ء
I Iق«ة
iه يه
gяج
1 - 3ق صIو
I IЯ Я
II IIء أى٠٢٢ ٢٢
ء٠و٠٢٢
ة ؤ- ل
ئء
ciء
؛إص
ه
gص
هءوئ
ج و
لا بم_|1
ق
"м'Sء
S؛3
»ه
î î i
ق1 ج ا
1III
٠ ء٠
illه تсо
I
ق
ةج»هء
!١0W
إء ،و و رمهء
و1

о ج ء
I Iق ق
Im
H
т~нО
IصЛ
وء VC وء
أ
٦<ي
ا!ل؛أ
On
ه ه لا 6ا
О ص
ي ا ح م
IIs
ق ء
.1 я и
I
٢٢»в
Iه№б
I I I© ١٠٠• ٠
!إ١١١١!
ق
ci
| 1
أ ق ا
3ا | |
IIة!!
Ш!ه
لآ
٠и
! |
i ë 1 8 ,
و و و
؟
-ق о ة
I
I
I
i lةا
I
§ق
ة
«S٣ ١
.ءة|
I
ء
ج
م !
79
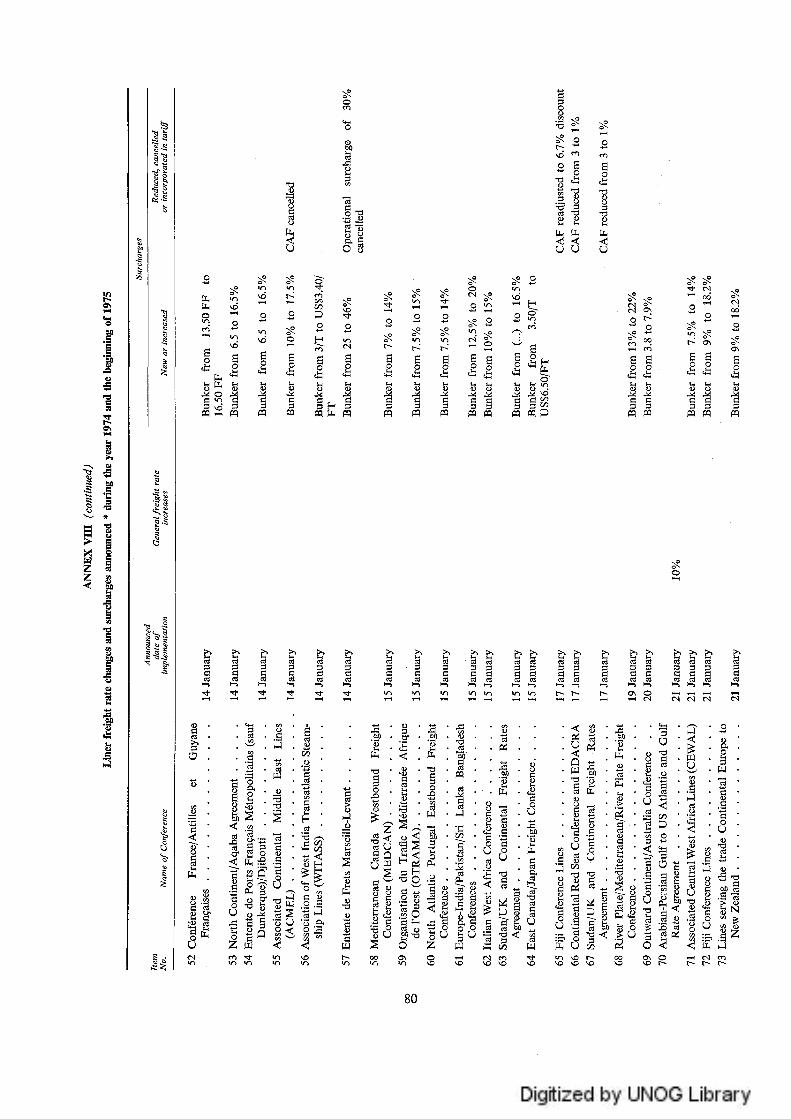
؛ة
ص ٣١
؟ظ
S)ص
ق |
مجظо
ь ه и бo i
ON
Iدو
ق
٢ ٢ rq
1قЙ Йه و
ق ق
I|ق I d я
ء ،ة §
ق 1ء
ج
ق
أ
جО
ضدء
4 0٠ ٢ ٢
Я & Я
ج
٠
Iя
ص
©هظо
،§я ،2 ،§
Йя ة §و §٠م محا яد وء W
ظئ
ه
• ج م
!'ق
I
ئلوТЗТ5|1
|اإ
صصة
جء
■1! ا ة
لإ ا
ج٠ ٢ ٢
.§

جо
«
dة
в в
إ0ق
* ؛ة:
||ظ||ظ|ة|ة|ة|ة|||I I لا•И pq
١ ٩ ١ ٩I ق
q؛ ه ء
ق |
ة1
О
Р Рض ء
ء ء
ء و و و جء ٠٦ ٠٦ ١٦ ٠٦ م ب
Р ق ء ! ه
m m
حه
bة
ة
i l l
S
» ٠ ة0
م |
|إ|
ء م

ألآ
ri
4ء وء
م ت ه ج ية-بم
ء ه ء ه
о تإ
Р оهء ق
ي ؤ
nI«
êIIй й
й ء й
ه
وة
1 1ة |
ةق|ةIة ه؛ض
٠ ٠ص٠
ؤ
|;1
6ق
ة
о*■>
م ء ث
|هق و
ة |
ج و
!IIك و
оشه
©
ÇO
I|ةя ص
йVi
1ؤ я ض
g
I |ج ة ئ و ج وء ص
إ
| |
|إ
ة
هÎ ,
٤ ٤
I
أ1
ث ;ؤ ق ق ة
I I I
gçsج
Sя
й й
جأى
СО
s.م
ق ؤ
•ة ه
!□صص
أа
و
٠ ٠
С
مد
<
èIم٠٠
جء
و
%©иصص
ق
و
I

ة-بمء
6яه
قي
ق
وء
ج و و
و ء ر||آ
||ةم
00“أ ح 2م
ج ق11وتتق ٠ ؛٢١ بت.
م ة ة ن
وО
!إ
٥ S
'ه د
' Яءأ
Ц)ء٠س
ا ق
ة ا
Hه
о
|و«ى
I1ت
И Й
|قi l
,11Iء قة
I
• ى
Iبمء؛قةجIIIء I
ГЯ n
ئ
II
ÇO©وI
ت
N40 ح م0 ح و
S و
Iة
•ء ٠٠
قة

م ية© ا ق
م وم م
٢ ٢ا
fS*؟
قIm
ة-بمي ي ب
Ü ü l
Iة
ق ا و أ
3ةأاإ | ؛ إ
؟؛•؛م اد م يه
sء ق و ق ق
00;؛ج
ء ق
؛«ي
b م ء
Im
1إ!م | ا ج
ة' 1ئ
•ء>٠٠ ' ص
H ض؛ك ق
dه|I l s
ق1O d٠ ٠ |ؤ٠ Mق11ة s
1م
'I
I»ء
وقЛ ؟ وء о ٢٢
وه مء
II
ص وة٨ ٠
|ق
IIءءةمIIIIة I Iقص
ؤSЙة
I00٢٢
٠٠٠
I أ I ثIg ئ
|ل
صق
؛1ة|| |قق’ق1|ؤ
ةء مء
ء ;<
قIII
وة
•S
и
هذج
I
هء
حه
٥ ٥
|ةءة
قؤd٠٠٠
وؤة و
0 «
!ث
د
د
Iة٠٠
IÜإ ى و b
Й
ؤ
حه
I
О ص ٠٠>Щ ق
II
о.و
ا!ق تؤ ء
د هءS Ü
إ دb
Ü
ء
١١١
Iق

ق و|و
م ء-ب
هON
Й
ه o' P
و ٠)
§ خ ع ع
и ء Я ة ة
On
Iя
I I
II
؛؛ؤ
я
iiق
ه ي ل
Я ^1
وق و
؛؛IIأ؛إإ
ة قةه
ح م |
|قج و
و ق
و Я؛ ةد|||ق
ء0أ0 م؟ةت أ م آ
•٠§
I
أ
|1
دوء
لإ
!ؤ٣١ о ء م بب

ةя
ق
ة
ؤ
٠■
6ت
سا 5ء ح ؛ م <
mu
ЧII!ق
i l
I II I
هء اء
ط о P
٢٦ ص ؛أ7ع
я ةة ة 'ؤ ة
ق
ق
I
ج و
ة
ق ، ةЙ ؛5
Я Я
صЙبяJiة
جق
Iя
أ و وI Iء ق!قIءه Iق
ق §أث
٠م ٠
ةة٠ ٠
I
■§
ى ء
i lؤ
ءا ة
1 1ه
<
جص
٠ه
ةبمء بمم

S o
IهI«
I ،§IIЯРЧ
ة-بم
j؛tи
ة| ء|أ | | ة
l l iة ؛ ؤ ق
لآءة
й ق ء ة s ^ S ' B
« S u
a؛ص٠
ي©إ
ه مأ
f f l ê â
ج6
م ا
ه
Iمؤ ء
٠ وي وء٧«
ج©
وء
ج
!
'ةة 2ؤ
د
ق
٠٠ Щ
؛٧
I I
||؛
م
ه
ؤ
ق
a<ءЙ
Pi
<
٠١٠١٠ ١ ٠١ ٠
Iة
p p

и ؛ ؟
е|ة؛و йق ا
S o pق أح ج ٠ ن
ê à ة 1ج ق
|ف 1ة| ج1
H
؛ؤ ق ت تقص
أأ؛اإ؛؛ مح1
оق:'V : Т5
Рчб
ق ا .
و؛ و
ص ء
6|:1
ؤ دم ه ■
ق
я
ي ء я.
я وIIя ةس ' |
яо
إيi û ،sى ٠ <
ى1
||إإ ق1 |ءة ج ٠ ؛ ؤ' ع ة ة
٠٠
||
g ■§
Cü صة ة
ةم؛١ةصي
ؤؤو I٠٠!ةص و
I
ؤ
ةء
!I Iج وء
I
و
ؤ1
قؤQ
ج
ج
ة
قT3٠ه ٠
ا أ
1 Ы.
я ج■3 وя ء
Йث هق
ج|ق1

оо٠
О й
ة
ص
ة Iو
о
p
ü
1 ٠ ٠
!إقر؛إ\؛!أوب к :
ءfflU
iP iI
6ا6ا
л ٣١ م ئ م тз: ق1■
م ا ق
O Sوء
1ء
؟ ق؛
وة
إ | إ
I I I Iهة
I٢٠٢٠ة
ص
d٢٠و
٢٠
ء'ة
Î Ï Is i i'• ؟ 'g o
II؛و
يN
اإ
ة8
II١٠ ٠ ٠
IIII I I
قT5
،ل
•5 0rillح 00 ح و
(S СЯ ،S СЦ
II•S
II
I
ة
|قه ت
и
I
H(Sم ي

0ق
أ| 'د
1!ء
؛أО
I
ا 1ق?ه.?
b
оتق ة ، §
b bة6ة ة ه ق |
ه
ê
Q
٠ ■OV
و ق
о ٢٠
il
aه
isوه
و ء
ج0و
ج p.لاء
ء ة إ
b ه ه أ و :ء
ء ز
I Iة ؤ
II II٥ ٥ !أ^و
I٠«
مم1٠.
И 1
I
I
ا ا ا
Ш
|إ|ه
ق
ها ب
1
ةق و
о نجء
а
إلص بمء
I Iهه
bО
bأ و
ш00م ي
١pqSدء
йة|pqة §
؛3 ؛<
!ة
|قIIأ ء
||IIIVO
م ي
أ
ةوج
1
|لة ؤ
I

â\ ON 4ق٣١٣١٠٢٢
B B S0ا ص ه ه
I I II I Iм я т
وة
II|وЙ ص ©
м т б я бi l
ددة ء
و ءC4 لآء0نء
»|أIII
٩٥٥0
1ن
|1ق.
II|أ
|ئ|ج
ع ي4H ؛ 00
ل1
113ه .
|ج
|ةl bع وء
l oض؛ 1^0هة
ة ق أ قق1أ أ
:1 |1ة11ء ة ق ' م ء لآ ة ق ف
إم وزم ٠
حح 0م
яةЯ
< -t ؤ ■t1
ة |
I I
I|ف
؛ح؛ض
Г4 N СЧص،S
قهIIقءه
، 4
I
Iء ه
||و
Ï
91

ج
p
ت ن و
« и
о٣١ه
ا ه
I l l l
٠د >م. -ص'
٩ها40اا
1
ة ق § ة
ة |II
لآ; |ق
'111
IIIM b “
|قوو ذ م ؟
§لآ
ة ق ة 1111ةء ء أ
ة
00
|ق
U Ü
م يP
P٣ ١
ق1Й ه
Ü Ü
م يо
Р Р
I Iм мбб
ص
цحО
ص
и м я
©
IIةp
I
1٠٠٥٠^٠
> > ؤ ٧١ ٠١ ٠١
II٠ ٠ ٠م٠
■§<я
I؛ ؟
ق
О٢٠
ه
٢٠ш٢٠٠ ٠
قيمء
ة
IяÉ
| i
м

مظ صو
إ٠
ق
I'ءو
Йه§
II:ة
ء a iه لآم ءء ج
0иه
о ٢١ ةة
!ق
ق ؤ
ة ق
١
VO٠
ة
0"-ق1لإتث|
ق ج 0لآ 0ا0هء ٠
b Sه1 ة1ة
أ؛إ؛إ■؛؛و
ة٠
Iء
٠٠d
i l lو1
ONا
٠٠aء ,
1 ا1 ق
ق ذ
I IH
٠ ٠1٥ ٥ص ص
٥ص
ق
؛إ|ضئص
|إ|
§لآ
ث
ق1ة ء
ق1٣
م يONم ي
Iلا
ا ة
ق1وو
و
وءه ه ل ل сЗ لإ
K g
ه
ه ء ت00 ٢٠٠ م0 00 م4 ي ء
H.ج
,٠٠ه
H م
bcep.
I
ء
ع ء أ » § و لآ
i '- sgلآ !
وء
0٢ م٢00 ي
IةÎ
0
م00 ي
Iهظa
i ؛٠: §
م يمصي
93

٠ ٠çs
ق٢ ٢
ق ؤ
م -ب ق
و Iء«
م ٠٠
l l l l fوء
٢٠، ؛٠٠
كО ص !
٧١ بمء40 о
i
٠٠٢٠ВI
и
ةق | |ج
لآ |’О
■ I
ء ه
и
ة
ي |ت
خ ج ٤٠ ن\زء ء .
! لآ“
0؛؟ ٠٠Г- ه
W со
ج ؛
2 ;1ة|
,О Й
I p ■٧١ ^
, 00 .ة il
ج٢٢
ق|ق٢٠ ٢٠ ٢٠٢٢٢٢١٠
٢٠
م يقة
I
I
<u00 4؟ه ة
و أة ق
IIIح |م
X بمم ٣١
•3.1
•S •Cء ء
94

ه
٠ ٠
§ه
I»ق
ؤ
ة
I II I« «
§1؛
ق . |
ء هء ء ه
ة0ءخ
؟ةوء1
II أةق ا0ق ه ؤ
я
هءء
|||ة | |
ة ٠
яة
яة
Iя
Û U
ا ح م
Iии ъ й
•а٠
و•M
ا ا cb آ|لآق5؛بم
та таة ة
(b таص
ةطص
٠ ٢ ٢
ؤ ؤ ؤ
٣ ٢٠٦ ٢٢١ ٦
ص
٣١
ة
٠و ٠
ة |ق
٣١و
Iد
Iج
٣ ١
95

خо
pج
قi lm m
قIةm
١ ٥، s
،gb
ق
ة 1لآ
لآ
1 1
II”ëS .ئ
pa i
ة ءةق § م
ص ٠٠ '
م أ
إا؛أ|!و
هم ة
ء1
ق |أbة؛
أ ة | '
'ص :ا,
со٠ آ. ن
ق1 |
I Iو
§٠٦
СЛÜ
H.قو ؛
H ئ
I
!وة
||||
II
|1i lظ |ص Iو I
■٠ ص
1ة|1و
I I I
■ج ء1 !
J i l l
I
ا8و §
Iة
ة
II
Iض
هه
иjS H
II1 1d •
<
d ٠s s
م و ي
مи ج a s
ة
03 ص د ج د ن ه
I
■Sa
و ق 1ق00 со ٧١١٥ ٢١٣٦
ة؛3Q
ق
I٠٠
ولاء
1 ؟II
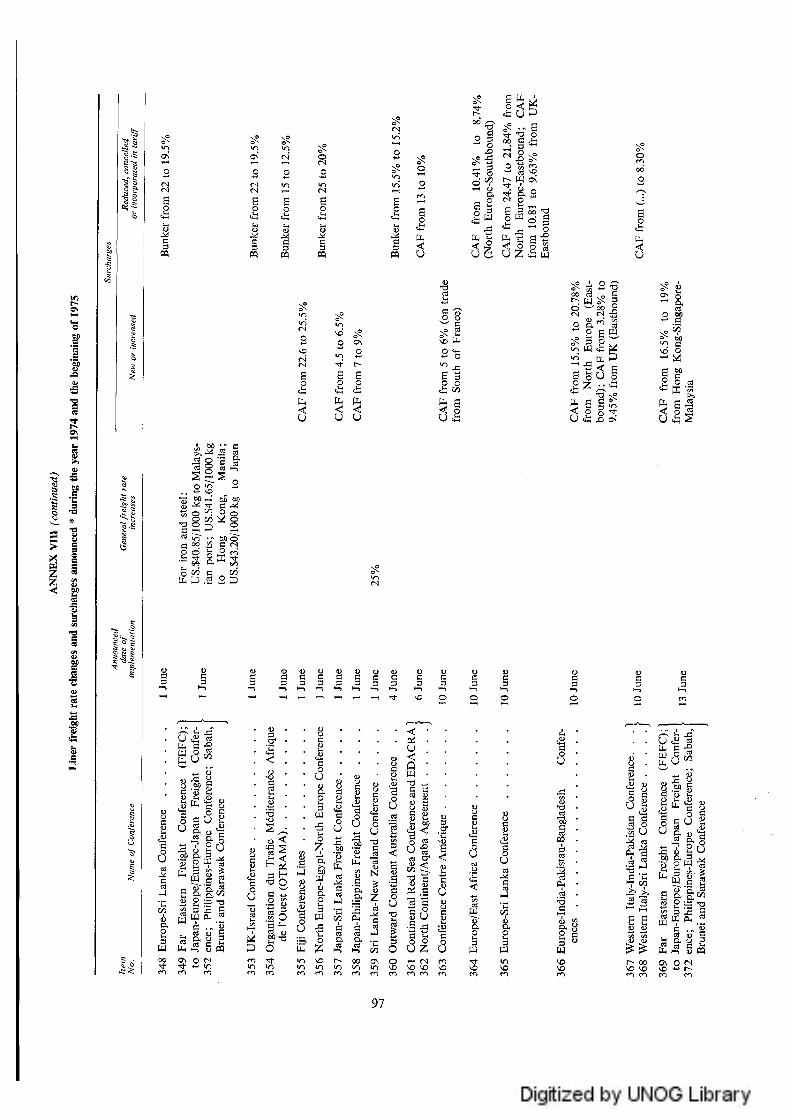
٠
о
هб
ث0و
' م
4D ;٠١:
؟ه;>ممع٢٢٠ ٦٠ ؤ
؛راأأى
ه لإ0؛
ح٠
ظة6 ة
يممم٠
قهة
٠١٠
قق
ة ا
ج لإР ٠ ءءء ء •جظ ج و
6 1 1
1 Шة| ي|
||ة|ء6||ة
оأ
|ق٠ ٠со ءه ءÜ'
١٠٠
I Iه ء
6 6
٠يم
ظ6
غ'■ ق < ف
î lî||ق|| ء ك
ق 1ةم و
1 | '
POة غ•
٠ت ٦о
٠٦٠ديо
٠٦٠٦تده٠٠٠٠٧ ٣٦ ب٢٢ص ١٥ о о
٠ ٧ ٠٠٦ ٣٦ ٣٦
I
m1قج0يم
ة |؛ق0
Уؤ ا
٠٠
ة
جص٢٠
قي ف0 ■
ن١ص ٥٣ ١
ة
ق
ص>٨
ة1 ،
ق
هи
هم س
م ع ؛ب م
ة و
ة1 ة
^يم ٣١ ١٥١٥ ١٥
l i ï i l0٢٠ه٦؟
ق0 04
Ы) ة _
وهN لإ
ف
§Ù٢٠ه.
ق
ء
٢٠hJ
Г- 00٧٦ ٧٦
٠ى
S ه
و
ء |ه
I م0
| | |
ما ما ٣١ ٢٢
ة د | قS6-
وق.٥٠ قة1
|ة:يء|Ы ٥٠
Р/٠- بص
|إو
هق •ئ
يсоةه٠ق
وءو

,ة
له
،ج
IIя ق6م
о جئ بنم
Soه
со
IIIهбه ل
Icb
ш
ج و
£قة و
II
ف о
ت حج ىقظ ءفه مفه م
نة ة
ج §
٠٠م
© § ؟٠
|ةئق|ة
ة دم
ه م ОСg•ب o
!ة
|لآS م !أу о|لإ ~ i؛ l
ى لآ '
о
i l lо c5
!ق©ة
ظ
11ه
•S
هه ل•Sء
ء |
ئ ج
ده ه
. ئ
ءؤII
.2٠ ء٠ ء
ة
| §ه
и
I f٣١ ٣١
.ءم
،0«
<
0ئ
:ةق
٠٠
i l •о I
II
ءإا ج
ها*5 ح
ص٣١
Iئяя
؛؟(
§
й§û
Я
ئ
I■ة
s
ؤ
٣ء ١
Iه ه

هه
ى ء بСиءأ ت م ؤ ب ب
ق '؟؛
أاأ ه ي
ت ء
ة6 ق|
!قا; ق b §■ ئ
- .ة§ص
b؟
لا |
ه .و
ء сз <u
111ء م ت ؤ ل 0ق
i l l s '
о ة٨©
و ءb م
« о
ةо
ا م م
II
l ' Iة ء
ا ق إIII
■!ة
ثه
ء٠١
bÜ
ce؟
ة
ئ1ق СО; هء
أإإإ٠ Ш b و,
||ة”|
M È
أقil
|ة
оО
PON ON
С
ت
٢۴٠١
ه ءI ■иؤ ل
؟3 ة
оءи
ة م ث
СЗВсо
حء
с н
l iСО) о .ح
٧сЗ
ه
jON0 0 ٠١
0م00
СО
о
СЗ
й о 1Оо.
II
ة
٠٩ م
!ة ! ٣٦ ٠١ Ш
b 0«

;دو:•о:'О
|تق ق
I
00 ؤ
С о1أ
1 1 w ض
ء
قهإ•ء٠
ء4ق■
о
آظÜ
٠ ٢ ٢о
ظи
يо00
٥
оضهقة
1ÎIIه .ه و م ة
ه ل
■ظ؛ة
ТЗ ТЗ
|ق'
؟ةсо ص
ق1
ة | | قJill
ة أ |؛|| |قة ء
6 Î اق1:1ء1؛ا.
٧ ١٠١
о
Рهء 'с
ق0
^٠ ٠أ *0 ؛؛5
ج
IIIه
IدةZ<
OVя
IО و
ي ب
-0ТЗ
I
جهة
Û•Sم
0
١١
|ل
I ؤ ؛ق
إ'gظ
aه
آه ^٦ ١٦© و ٣١ جب ٠٢٢
ن S S
ه ه هأ ت и د§؛W
قء
؟ؤО О
٠٥ Г•ه .ق
أ |
ج ء ق ء
صئ :ع
ةة ء ق
ق
عоءи
قأ
ق٧"р•о
ئ6 |
سهم
0لإصSه
il40٠٠٢٢
Iد
100
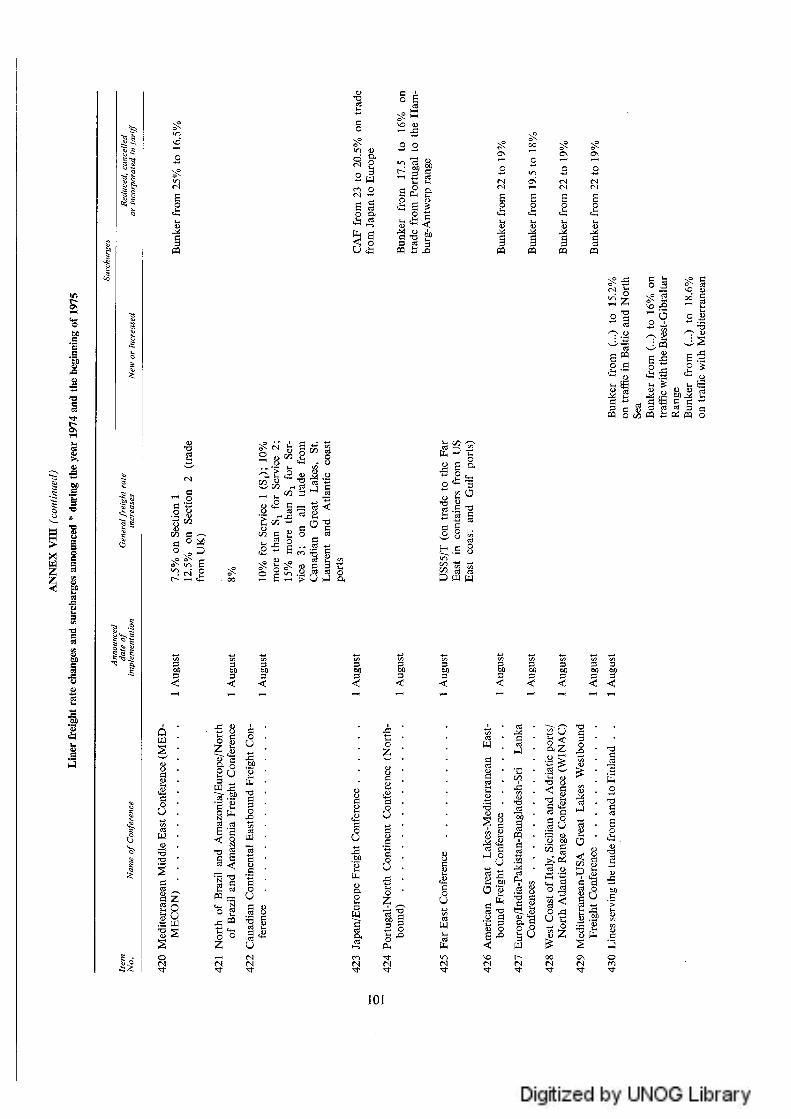
çsه
Pوء
م
Pق
،S ء
III
SIقءةج ©٥٠ء
ه ء
ص©
P
ة |ة ء.؛1
؛م
I
0ق
ة ||يل ءء ج
ق . ق
٠؟ ٢٠
٢٠c Pء ءء ' ت
لآق
ه٧©ق ,
» ٨
IIIء
ة11
أ1 :أ إ؛أإ؛؛|إ|أ|
ه ٢٠ بميم ء د
S ي ئ
ؤجؤ و ؤر ر<
وج
٢٠؟
ه©و
د٠٣١٢٢
1ة
٢٠ О
ة-ق“؟ه
و
٢٠م
соع
بمي .ء
٢٠د . ح ٢٠ن
СЛ هم هء ة ||
|قإ |
00 -Г ١٥ م م ي ي م ي ٢٢ ٢٢ ٢٢
هО
ققو
I©О
IIؤ
I Iةة
٢٠ة
م ٢٢ي
و8ح0 قم
ة ا
؛أ ؛ I ;
i؛ l lГ"1ائ11و و
ه
لاءج
Z
لآ
101

|| ٣٣ ص٥ .و
ج و
!!أI I n
يи
p 'sء ح
?؛ة
'ق ءأص
ؤÜ
ة 1؛
أ!إأأ!ة ق ة ة 6ق
ء
ع ؤم |ةСО هء
ا8а д е
ن ص
I؛١Я
| |٠؟ب ص
ة ؛ ج§ؤ
ا ج -
؛ق ء ت
° я
I I
ق
1ع
قÈ
قه ق ب ق
لإ لإ حؤؤع
6иجى .وفه
Iئ ن
ق
I I
I|ق I
"a■5ظ
هلاهЩ ■a «i s
i l l
ؤ اi
و
U ’i
IIIة|لآت| |
لآبه٠٠ ء.هء
.هи
قج
IبههIقيه
وج
هи
I
§CQ
|قа ؛د أ1
аЙظ
.و٦٠
ؤه ب
ة S,وة
!ءI ٤؟ بهة
٢٢
со'
00٢٢
0
ТЗсЗء
ة
ح5 ةم
II
ظ | ة
§§جÆ S s
1 وؤؤم ت
«N؛
ة | ةСЗ Q ,
م ) ظ ة•لإ-§ق
ء ق |i l l
ة |ة
b i s٧١٠٠٥
٢٢٢٢٣ О ب ٣
٠ء حءه
d
102

م أ?
.يم د
أ I ЛءT3 ,
؛٠٢٢:ا
1 ، :i l T '
و؟
ة: |ق! !ة؛
и м
ة1'
ج00
( L bи б
،ق ؛بم ق я
؛
ج٠ ٢ ٢
Ib
Ü
ÇS•0Йه
§ؤ
- P
®هغ1
ق1: Яئر م
^ Яة ق 3ق ق ص ن
«
ء ^ه
«لآ ة
II 6ة § ة
هه
لإ
!ق§ صه0
ققههه
Iهو
IقIهء
I I! I ض ء0
إIؤ
ب
هb
قق•0؛0
b о• ج .ة
ص
م
IIيص
هи
I
gو
ةi*Sإя
ة1قIII1قق
■ق | |
III1ق1
أ ص ق م
:1ق1٠, ٠ ٠ ٧١ ٧١ ٠ ؛0هبp\ 'ه
103

ص ،ل ؛
II؛siО
١٠١ ٥
أ |ة|! ء ده
ج ق 00ق!ق
ةاة11ة11
م يО
6ه
о
6ه
ج٥وحه
Lؤق وق
TJ ٠ ء ©а
©
111ه ه ؛ اo u i
ق و |»ه .
٥٠١٢ ٢
"д .ج٢٠هТЗأ ج
■م'
٢٢ا
ظÜهأق!«أ ا
ق ق
“ه؟ء م ه
ح0. .
ا1أ !
٧١OSОp
م٥٥
I
ق ق
соلهح١٥
قi
Iحق٨،
٥٠٠
Iص
!СО
-0٢٠٠٨ه§
؟1؛•Sp. وق
| u
ء
لاهه»مي م
٠ ٠
د1٢٠ج د ا
وجو ء .ه
ق1•ء ء
ا ة
Gحء
с
ي آ ب
1إه
• ٠
IIIه٢٠
Й
|1ؤIîi
٢٢٢٢ ٢٢
.٠ Z ٠ ‘ق هء ه د
؛؛ ؟و
ة
1
||
ه٠I©и
-0
I,8
ق
ق
ة6اi î i
|ق لا| ةl i i î iم م ي رم
؛ة؛٢ء ٢
•Sلا
104

م ح0ب وؤ| Щ|ق
11ق1ةôp1!1P ÇO
محم
!!ص.
IIО Я
!ق
•оحه
م ؟ ج ص إ3
ق ق
ед^О;|ق
ئ0
§مء ء
مح بم'
أ |دя
II لاة ة |
§ة | ق
| |ج|я . й ' ^ я
ق ة 6ن
ة
ة1ص و
О ه —٧٦
|إإغ و ؤ
|ق1 II ء
|||||ة
ق •S gsم ب
I I I
ة ء |:ÏI1
؟
ه
<
II IО О ОهоIج٥ I Iق ق
о ؤ
Iق
ملوbءоم أ إ
ة | ة
||bق
W ئ 0* م م
I Iة |Ii
م0
أ
أ ؛له .ئ
0O٠١ف تء
ج о
ي f*؟
ةقя
и٠ء ٠
b
I
i lbоح
و
1ق
٥b
s•о
ه
ةهء
N
il!ق و
0ء.ء
.؛ؤ
ЦI I
م
ة
Л
bم
00 00
Л
٠ه٠0
ته
ل0ئ

Iя
M
٠ ١٢© w ص
S o
я ؛ة ٠١ء ت ه
b أ م ب
b
Я3 0я ،й
هق
О Я о
N؛
ق ق ه ه
я ي ء
قd
III« ٠
I
و٧ 00 سح ٧ ٦ ج ١
أد1أ1
ص و
gه
ة
جQ
1ق
llplgة1ة|ة1
©م
قملإق٠٠٠PQ
أ ؛IهW
ؤ ؤо О
I
قd
-Sه
о
bб
bб
М ПS o
в
ظ
ؤةI I
أج
ج ءb<и
аء
i l
I IO o ة ة
صق ؤ !ق . ! :
ة1م ج ؤلإ
щи
оق
Ô ت ن
ت ق ح م ة
ج ح م ا ? ت
؛1È6
بءلإÜ ض
116ة
قة
؟ق ق صوء لСЛ ة ة ف
Р ء3ؤ لآ
ة ||ق
II ءII
©
ق ؤ
|ؤ|وص ا د ء ا د
U h
؛اح ج1م ق
1||||ق | |
I
I
ل0ؤ

و أ
آإهة
!أJ S
٠٠ جs a
و ٧
I Iîël!f f l S w. Sص .ة
5 م؛ه§
ء حءلهРههг_лضГ7 СОه
ء٣١ج 5
ح| -م ةS “ M
illق|ة
'جمم©ق
о
|قM ’S
6ق
О
,ض'СО
ءه
ةء ع ءفمم، م م د٥٠ لآق© Си о
ب٠ ه S00 بصص
ه ٠٠٥ن يم о
ج..بم
IIIق|ق،ء
٢ ٠
| .٢ ٠-§•и
هи
٠٠
و
٢٠ح٢٠ج
H
©ذممق٠٠٢٠لهd
قت
соص00
ئو •ةق
ح |م I ق ق ه ة
Z 2;2ة
I٠
ق قb2
ق2
!
ئمد
H
م.ؤو
Iة٢٢أء
إمم
همق
0 . ق
ه
T31 3
So S لا
1،
:ج:م
ILi l1ا
ؤؤ٠١
ء ٥٠٢؟
111ill
ة1و
٤I
ئ ئ ممء
و ء ٥٠№ ة S
م 1 ه
ح ئص ٢٦ه بمم
فهص 1
أ S§ صه • M٢٦دم 0 ح
§ا
|إإ1(N Ы
ئ1
هو٠ ٠§
I ؤ6ق
ص و
!ق•ه عمحاو
О ٠١
I
ق و
10?

л ٢٠٠٠
ص ٧٦
о ؛ص
ء •و جأ
ؤم ТЗ
s - a .ء § إЯ ро | .
КС وء
оح
ح؛شة ؤ
Ô40
!إ؛ؤ
ة ا
Q٠١٠
'o ت.
ة11م ت ق
و د
ههЙ
ص
ق |ه ء
II Й ؛ S O S ' S • ه
! ؛ؤ W ГМء٠ ١ ٠ص
ق- ق 1قь ئ я я ج ل
6ق6 ق6|
٤ةة
О О О١ ■ء ٥
•وي
قاهظ
ة !
S w
و |
،ق и ثذ
6ج ق
я
Ü
i t t
ج
|| مء Л و
Сciم
tuكقء 0ة
م
IC9
11 ق 1
ة
٠О
ب
b
٣٦
b
ق |م
ق
ЫÇQ
نحف
b
أ
ء
I
я
و
أ1ء ه
مء ص:ه
ة مS Z
ة بآه ج
!|ا
•О٠٠
I
|إة |
I ه
ؤ ق
•ة 0
я
Iя
جЯ
لهقя
я Я ■у Я
•so.
Iя
108
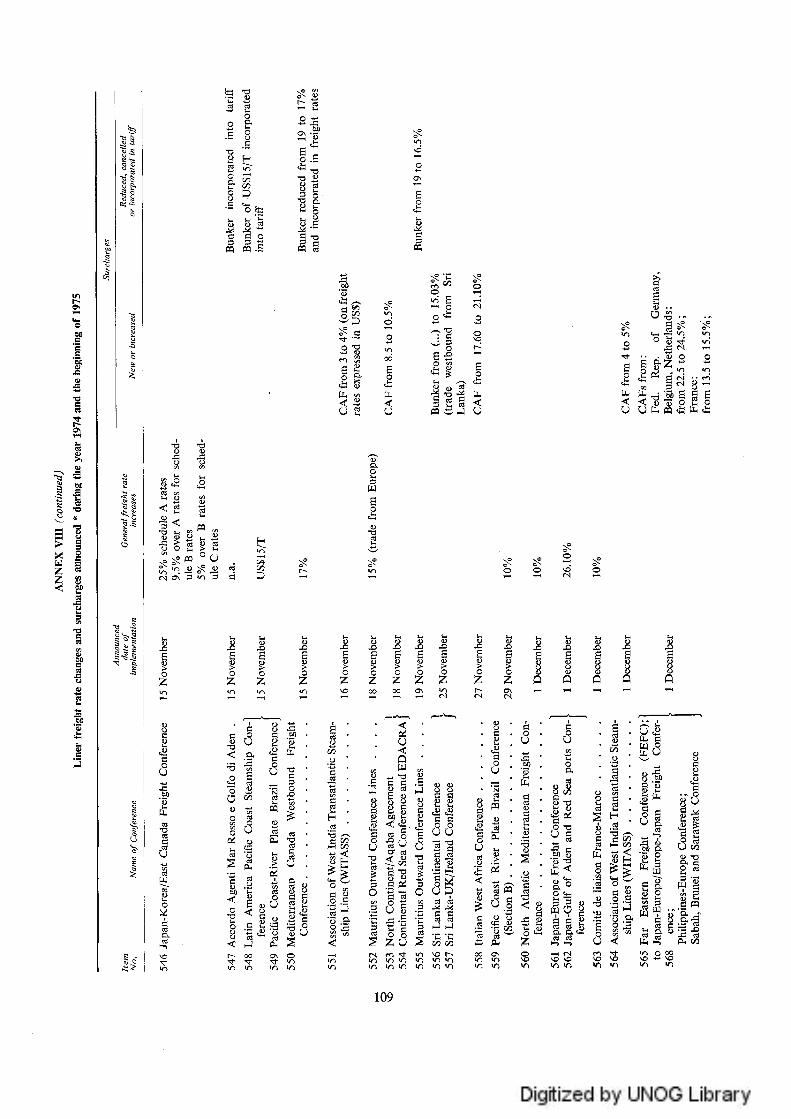
SIсЗ ج о٥ ٥
H ئ J s
ه .ة
и
s s
I قII
٤ ج
о ta • ؛ ؛й Й й
.ة » »
مو ٠•
-
مح|م
ا| أ°٢٢
М ء هلا ة ء ة ء | ) ةإ
يم©
ه
Ü
§
وص
ج
ة ئ
III
ج©
ة6
ق |S ء& ©
6ج
ء
1
دةة
Яوه
!
ا إ
و ءS S
ده
ج نم
ة0
II I قعق| |
٠١ 00
Iо
II^;٠ و أ ء
§ق
ص دء11
ه■ج
ج
ه٦٩
сЗ
ه ة
СЗ
ص
!*S'
.ة نه
ة
٧١٧١
إ|إ٧١و
©©
ةظ
تةсЗ
٠٠©
٢٢
ة
ÜHяة1
Iصم١٠٠٢٢
■§<ج
109

ظ لا
ؤ٧
ءلا
I
و00
ه٧
<م
ء ق
f!6 1
оо
ьС٧
liîife٠٠
ق ا ا ق ق اإiو
اأО۵
٠٠С٢٠
ء٢٠لآ
ءء
1ه!أق|ق|
ة-ج
IS
I«
М ق
٠I ه|ق
ةة
|إق
ifg sIIة ؛ء
ئ0
8س |ة
قО دا
II ي،ذمق
ق: ا 0ء
إ0٠ ,
حء
I
1 IО قوم
||ة
ق،ج
د>
ة
ةو
ق
о
٠оهи٢٠
ة1ق٠٠ يم ■دؤ ق
له٠٠٠؛٠
I ةااI Î1 J
٠٢٠ ٠
l Î P i
110

It
لآ |IIد لو؛م ما
ج
I
ءء
ص د
ءم لو
«له مم!ا
-p
ب Лء ص ^to
11ث|إ
.ة ق
W س С оa> ه
I I
' IlО Vi
I .ئ
لآ
5
ة
د دء ص
I ثققЙ
II?٢١
аIةCS ص دص د دci ءصيميميمص «
له
I
دءء
ة
Щ؟أ!!
ON ON
W)
II
ON
ION ON
٧٦ ٧٦
ع
s
I
я٠٢٢ON
قяهص
I٠٠свء
Iتي ق،
قON٧٦
iةI،للIن
ص
ON
!
.اION٧٦
3■SIق
II
я
и
!p* إ
i l l*I ةON00
ئ
Iة
ظ
ق ٤
|أق ة.ي ةя و
N Щ
دء
I I
I
هZ
ة8
إ
و
وج0000
ل 1ل

|ق
a i
s؛ ؟
II
;iو .لإ ء I
giو
сЗة
1IIضق
٠٥
1
0م1
ق |
ؤ و *OсЗ
ق
"ة
§*0
I
ثه؟3со.ج؟СЗ
!إ
со
هصه©•
|لآ|ة
Р٢١
Hمdصحلم
ق
ء

لعصول كيآ دات صل ا م منثو لا سد ا ؛اد سكن لمر لام شتدرات ض ا تجات ش اس ا لتدذع دددد ا ا
كبالى أد 'ا لم ؛' مص عه ايع ا جد ادض منح.؛ .ط-ا صع JUI ؛ . ظم ز الخي الكمة ن مها ا .تا
HOW то OBTAIN UNITED NATIONS BUBUIUATIONB
U nited N etien^ publications m ay be o b ^ in e d from bookstores and d istributors throughout th e world. Uonsult your bookstore o r write to: U nited N ations, ^ales ^ c U o n , New York or Geneva.
NATIONS UNIEBCOMMENT SE PROCURER UES PUBLICATIONS ل
Les publications des N ations U nies son t en vente dans les librairies e t les agences dépositaires du m onde entier. Inform ez-vous auprès de votre libraire ou adressez-vous à ; N ations Unies, Section des ventes, New York ou Uenève.
К А К П О Л У Ч И Т Ь И ^ ^ А П П Л О Р Т А Н П ^ А ^ П П О В -Ъ Е Д И Н Е Н Н Ы Х Н А П ^ П
И з д а н и я О р г а н и з а ц и и О б ъ е д и н е н и и ^ И а ц и ^ м о ж н о к у п и т ь и К Н И Ж Н Ь ! К м а г а - з и и а к и а г е и т с т и а к ио в с е х р а ،1 о и а х ^ и р а . Н а в о д и т е с п р а в к и об и з д а н и я х в в а ш е м к н и ж н о м м а г а з и и е и л и и и т и т е п о а д р е с у : О р г а н и з а ц и я О б ъ е д и н е н н ы х Н а ц и й , О е к ц и я п о п р о д а ж е и з д а н и и Н ы о - И о р к и л и ^ Е еи е в а .
COMD CONSEGUIR PUBLICACIONES DE LAS NACIDNES UNIRAS
L as publicaciones de las Naciones U nidas estén en venta en librerias y casas distri- buidoras en todas partes del m undo. Consulte a su librero о dirljase a: Naclones Unidas, Secci6n de Y entas, N ueva York о Ginebra.
United Nations pnbli«ttion Sales N o.: E.75.II.D.13
P rke: $u.s. 6.00 (or equivalent in other currencies)
Printed in Sw it^rland GE.75-46012(5636) September 1975—3,405