REVIEW OF MARITIME TRANSPORT 2009ii Review of Maritime Transport, 2009 NOTE The Review of Maritime...
221
UNITED NATIONS CONFERENCE ON TRADE AND DEVELOPMENT Geneva REVIEW OF MARITIME TRANSPORT 2009 Report by the UNCTAD secretariat UNITED NATIONS New York and Geneva, 2009
Transcript of REVIEW OF MARITIME TRANSPORT 2009ii Review of Maritime Transport, 2009 NOTE The Review of Maritime...
UNITED NATIONS CONFERENCE ON TRADE AND DEVELOPMENT
Geneva
REVIEW OF MARITIME
TRANSPORT
2009
Report by the UNCTAD secretariat
UNITED NATIONSNew York and Geneva, 2009
Review of Maritime Transport, 2009ii
NOTE
The Review of Maritime Transport is a recurrent publication prepared by the UNCTAD secretariat since 1968
with the aim of fostering the transparency of maritime markets and analysing relevant developments. Any factual
a corrigendum to be issued subsequently.
*
* *
symbol indicates a reference to a United Nations document.
*
* *
The designations employed and the presentation of the material in this publication do not imply the expression
of any opinion whatsoever on the part of the Secretariat of the United Nations concerning the legal status of any
country, territory, city or area, or of its authorities, or concerning the delimitation of its frontiers or boundaries.
*
* *
Material in this publication may be freely quoted or reprinted, but acknowledgement is requested, with reference
to the document number (see below). A copy of the publication containing the quotation or reprint should be sent
to the UNCTAD secretariat at the following address: Palais des Nations, CH-1211 Geneva 10, Switzerland.
UNCTAD/RMT/2009
UNITED NATIONS PUBLICATION
Sales No. E.09.II.D.11
ISBN 978-92-1-112771-3
ISSN 0566-7682
Contents and Executive Summary iii
ACKNOWLEDGEMENTS
The Review of Maritime Transport 2009 is prepared by the Trade Logistics Branch of the Division on Technology
and Logistics, UNCTAD. The principal authors were Regina Asariotis, Hassiba Benamara, Jan Hoffmann,
Eugenia Núñez, Anila Premti, and Vincent Valentine, who also leads the team of authors.
Contributions on various issues were also prepared by LilianaAnnovazzi-Jakab, Bismark Sitorus and Birgit Viohl.
Desktop publishing and administrative support was provided by Florence Hudry. Graphic support was provided
by Nadège Hadjemian and the publication was edited by Daniel Sanderson.
Various parts of this publication were peer-reviewed by UNCTAD colleagues: Deepali Fernandes, Mina
Mashayekhi, Anne Miroux, José María Rubiato and Frida Youssef.
This publication was peer-reviewed by the following persons from civil society, according to their particular
expertise: Alf Baird, Tom Butterly, Pierre Cariou, Mahindokht Faghfouri, Matthew Flynn, Hercules Haralambides,
Ki-Soon Hwang, Harsh Khare, Mohamed Abul Kheir, Shashi Kumar, Heather Leggate, Socrates Leptos-
Bourgi, Nora Neufeld, Melissa-Dawn Newhook, Adolf Ng, Thomas Pawlik, Aleksandra Pieczek, Derek Prentis,
Sheri Rosenow, Wayne Talley, Beatriz Tovar de la Fe and Les Ward.
Review of Maritime Transport, 2009iv
CONTENTS
...............................................................................................................................................Page
Acknowledgements......................................................................................................................................... iii
...................................................................................................................... vi
Abbreviations and explanatory notes.............................................................................................................. x
Vessel groupings used in the Review of Maritime Transport.......................................................................... xiii
Executive summary......................................................................................................................................... xiv
Chapter ...............................................................................................................................................Page
1. Developments in international seaborne trade ............................................................................. 1
A. World economic situation and prospects............................................................................... 1
B. World seaborne trade............................................................................................................. 6
C. Sectors of world seaborne trade ........................................................................................... 13
D. Maritime transport and the climate change challenge........................................................... 26
................................................ 37
.................................................................................................... 37
................................................................................................. 52
C. Registration of ships.............................................................................................................. 54
D. Shipbuilding, demolition and the second-hand market......................................................... 57
................. 75
A. Operational productivity ....................................................................................................... 75
B. Supply and demand in world shipping.................................................................................. 79
.............................................................................. 81
4. Trade and freight markets ................................................................................................. 85
A. Crude oil and petroleum products shipping market .............................................................. 85
............................................................................................................. 90
C. Dry bulk shipping market...................................................................................................... 92
D. The liner shipping market ..................................................................................................... 98
E. Container production............................................................................................................. 103

Contents and Executive Summary v
5. Port and multimodal transport developments .............................................................................. 109
............................................................................................................. 109
B. Improvements in port performance....................................................................................... 114
C. Recent port developments ..................................................................................................... 114
D. Inland transport developments .............................................................................................. 117
E. UNCTAD Liner Shipping Connectivity Index 2009............................................................. 121
6. Legal issues and regulatory developments .................................................................................... 123
A. Important developments in transport law.............................................................................. 123
B. Negotiations on trade facilitation at WTO ............................................................................ 130
C. Other legal and regulatory developments affecting transportation ....................................... 133
D. Status of conventions ............................................................................................................ 148
7. Review of Regional developments: Africa ..................................................................................... 159
A. Economic background........................................................................................................... 159
B. African ports: some improvements and more expected........................................................ 163
......... 166
D. Trade facilitation issues in Africa.......................................................................................... 169
E. Special case: transit and inland transport for landlocked developing countries in
Africa.................................................................................................................................... 174
Annexes
.............................................................................. 181
II. World seaborne trade by country groups............................................................................... 185
types of ship, as of 1 January 2009 (in thousands of GT).................................................... 187
types of ship, as of 1 January 2009 (in thousands of dwt) ................................................... 193
IV. UNCTAD Liner Shipping Connectivity Index...................................................................... 199
Review of Maritime Transport, 2009vi
LIST OF TABLES, FIGURES AND BOXES
Table ........................................................................................................................................................... Page
1. World economic growth, 2006–2009.................................................................................................. 2
2. Growth in the volume of merchandise trade, by geographical region, 2006–2008 ............................ 6
3. Development of international seaborne trade, selected years ............................................................. 8
4. World seaborne trade in 2006–2008, by type of cargo and country group ......................................... 9
5. World seaborne trade in ton-miles, selected years ............................................................................. 14
.................................................................. 26
7. Estimates of fuel consumption, CO2 emissions from international shipping, and projected growth.. 29
................................................................... 39
.......................................................................... 39
10. Geared and gearless fully cellular container ships built in 2007 and 2008......................................... 40
.......................... 41
......... 53
... 55
14. Distribution of dwt capacity of vessel types, by country group or registration, 2009........................ 56
................. 58
16. Deliveries of newbuildings, selected years ......................................................................................... 62
17. Tonnage reported sold for breaking, by vessel type, 2000–2008........................................................ 64
18. Average age of broken-up ships, by type, 1998 to 2008..................................................................... 65
19. World tonnage on order, 2000–2009................................................................................................... 66
20. Representative newbuilding prices in selected years.......................................................................... 69
..................................................................... 69
22. Newbuilding contract terminations..................................................................................................... 71
selected years ..................................................................................................................................... 76
(tons carried per dwt) ......................................................................................................................... 76
(thousands of ton-miles performed per dwt)...................................................................................... 77
........................................................ 79
Contents and Executive Summary vii
27. Analysis of tonnage surplus by main type of vessel, selected years................................................... 80
28. Maritime engagement of 25 major trading nations............................................................................. 83
29. Tanker freight indices, 2007–2009...................................................................................................... 86
30. Tanker market summary: clean and dirty spot rates, 2007–2009 ....................................................... 88
31. Dry cargo freight indices, 2006–2009................................................................................................. 97
32. The 20 leading service operators of container ships at the beginning of 2009................................... 100
33. Container ship time charter rates ........................................................................................................ 102
34. Freight rates (market averages) per TEU on the three major liner trade routes.................................. 104
35. Liner freight indices, 2009–2009........................................................................................................ 105
........................................................................................................................... 105
........................................ 111
38. Top 20 container terminals and their throughput for 2006, 2007 and 2008........................................ 113
39. The global terminal operators equity share of world container throughput........................................ 116
40. Total length of navigable waters and tons of goods transported by inland waterways....................... 118
41. Rail: International transport of goods for selected countries .............................................................. 119
42. Countries and regions with total rail networks of 20,000 km and above............................................ 120
43. Share of intraregional trade in total African trade............................................................................... 163
44. Performance indicators ....................................................................................................................... 165
45. Indicators of African countries’ connectivity in liner shipping........................................................... 168
....................................................... 170
47. Global Enabling Trade Index, Africa, 2008 ........................................................................................ 172
48. Major African regional economic communities.................................................................................. 173
Figure
1 (a). World GDP growth, 2003–2009, selected countries .......................................................................... 3
1 (b). Indices for world economic growth (GDP), OECD Industrial Production Index and world
seaborne trade (volume), 1994–2009.................................................................................................. 4
2. Indices for world economic growth (GDP) and world merchandise exports
(volume), selected years...................................................................................................................... 7
3. International seaborne trade, selected years........................................................................................ 11
4 (a). World seaborne trade, by country group and region, 2008................................................................. 12
Review of Maritime Transport, 2009viii
4 (b). Developing countries’ seaborne trade, selected years ........................................................................ 12
5. Oil and natural gas: major producers and consumers, 2008 .............................................................. 16
6 (a). Major bulks (steel and iron ore): producers, consumers and traders in 2008 .................................... 20
6 (b). Major bulks (coal and grain): producers, consumers and traders in 2008 .......................................... 21
7. Global container trade, 1990–2020..................................................................................................... 25
8. Shipping sector CO2 emission and CO
2................................................. 28
.......................................................................... 38
10. Geared and gearless fully cellular container ships by age .................................................................. 40
.......................................................................................... 43
..................................................................... 44
economies in transition, and open and international registries located in developing countries ........ 45
among the major 35 vessel-owning countries..................................................................................... 49
15. Deliveries of newbuildings, 1997–2008. ............................................................................................ 63
16. World tonnage on order, 2000–2009................................................................................................... 68
.............................................. 77
........................................... 78
...................... 78
20. Trends in surplus capacity by main vessel types, selected years ........................................................ 81
21. Growth of demand and supply in container shipping, 2000–2009 ..................................................... 82
22. Evolution of prices of new containers................................................................................................. 106
23. Evolution of leasing rates.................................................................................................................... 107
24. Trends in connectivity indicators. ....................................................................................................... 122
25. WTO trade facilitation needs and priorities: self-assessments status ................................................. 133
26. Growth in Africa, oil vs. non-oil economies, 2006–2008................................................................... 160
27. Growth of GDP by African subregions 2006–2008............................................................................ 161
28. Top and bottom performers in Africa ................................................................................................. 161
29. Africa’s share of world trade, 1970–2007........................................................................................... 162
30. Main international shipping lanes, Africa ........................................................................................... 164
31. Burden of customs in Africa, 2007 ..................................................................................................... 171

Contents and Executive Summary ix
32. Annual average cost of importing a container .................................................................................... 176
33. Main road, rail, sea, lake and river corridors in Africa ....................................................................... 176
34. Average number of documents required for import............................................................................ 177
35. Time to imports ................................................................................................................................... 177
Box
...................................................... 27
...................................... 30
3. Contracting States parties to selected conventions on maritime transport,
as at 23 October 2009.......................................................................................................................... 149
Review of Maritime Transport, 2009x
ABBREVIATIONS AND EXPLANATORY NOTES
Abbreviations
AEO Authorized Economic Operator
APEC
ASEAN Association of Southeast Asian Nations
AU African Union
BAF bunker adjustment factor
BCI Baltic Exchange Capesize Index
bcm billion cubic metres
BDI Baltic Exchange Dry Index
bpd barrels per day
BRIC Brazil, Russian Federation, India and China
BWM Convention International Convention for the Control and Management of Ships’ Ballast Water
and Sediments
CAF currency adjustment factor
cbm cubic metres
CBP United States Customs and Border Protection
c.i.f. cost, insurance and freight
CIS Commonwealth of Independent States
CO2
carbon dioxide
COMESA Common Market for Eastern and Southern Africa
COMESA-CD COMESA Customs Document
CSR Special Register of Ships and Shipping Companies of the Canary Islands
DIS Danish International Register of Shipping
dwt deadweight tons
EAC East African Community
ECA Economic Commission for Africa
ECOWAS Economic Community of West African States
EEDI
EEOI
EIA Energy Information Administration
EORI
ERF European Union Road Federation
ESC European Shippers’ Council
EU European Union
FEU 40-foot equivalent unit
FIS French International Ship Register
FNTR Fédération Nationale des Transports Routiers
f.o.b. free on board
FPSO
GATT General Agreement on Tariffs and Trade
GDP gross domestic product
GHG greenhouse gas
GT gross tons
ICC International Chamber of Commerce
ICIR initial cash investment return
ICS International Chamber of Shipping
Contents and Executive Summary xi
ICT information and communication technology
ICTSI International Container Terminal Services Inc.
IDE International Data Exchange
IEA International Energy Agency
IICL Institute of International Container Loss
ILO International Labour Organization
IMB International Maritime Bureau
IMF International Monetary Fund
IMO International Maritime Organization
IMSO International Mobile Satellite Organization
IPCC Intergovernmental Panel on Climate Change
IRU International Road Transport Union
ISO International Organization for Standardization
ISPS Code International Ship and Port Facility Security Code
ITO international terminal operator
LDC least developed country
ldt light displacement ton
LLDC landlocked developing country
LNG
LOA length overall
LPG
LRIT
LSCI Liner Shipping Connectivity Index
mbd million barrels per day
MCCC Modernized Community Customs Code
MDG Millennium Development Goal
MEPC Marine Environment Protection Committee
mmt/y million metric tons per year
MRA mutual recognition agreement
MSC Maritime Safety Committee (IMO)
mtoe million tons oil equivalent
n.a. not available
NAFTA North American Free Trade Agreement
n.e.s.
NGTF Negotiating Group on Trade Facilitation
NIS Norwegian International Ship Register
OECD Organization for Economic Cooperation and Development
OPEC Organization of the Petroleum Exporting Countries
ppm parts per million
SACU Southern Africa Customs Union
SAD South African document
SADC Southern African Development Community
SDRs Special Drawing Rights
SDT special and differential treatment
SEMP
SIDS small island developing State
SITC
SMEs small and medium-sized enterprises
SOLAS Convention International Convention for the Safety of Life at Sea
Review of Maritime Transport, 2009xii
TEU 20-foot equivalent unit
THC terminal handling charges
TNC transnational corporation
TRIE Transit Routier Inter-Etats
UASC United Arab Shipping Company
ULCC ultra-large crude carrier
UNCITRAL United Nations Commission on International Trade Law
UN-DESA United Nations Department of Economic and Social Affairs
UNDP United Nations Development Programme
UNEP United Nations Environment Programme
UNFCCC United Nations Framework Convention on Climate Change
UNODC
VLCC very large crude carrier
VLOC very large ore carrier
VLOO very large ore oiler
WAEMU West African Economic and Monetary Union
WCO World Customs Organization
WEF World Economic Forum
WMU World Maritime University
WS Worldscale
WTO World Trade Organization
Explanatory notes
The Review of Maritime Transport 2009 covers data and events from January 2008 until June 2009. Where
All references to dollars ($) are to United States dollars, unless otherwise stated.
Unless otherwise stated, “ton” means metric ton (1,000 kg) and “mile” means nautical mile.
Because of rounding, details and percentages presented in tables do not necessarily add up to the totals.
Two dots (..) indicate that data are not available or are not separately reported.
In the tables and the text, the terms countries and economies refer to countries, territories or areas.
Since 2007, the presentation of countries in the Review of Maritime Transport is different from that in
Department of Economic and Social Affairs, as well as by UNCTAD in the Handbook of Statistics. For
the purpose of statistical analysis, countries and territories are grouped by economic criteria into three
categories, which are further divided into geographical regions. The main categories are developed
economies, developing economies, and transition economies. See annex I for a detailed breakdown of
the new groupings. Any comparison with data in pre-2007 editions of the Review of Maritime Transport
should therefore be handled with care.
Contents and Executive Summary xiii
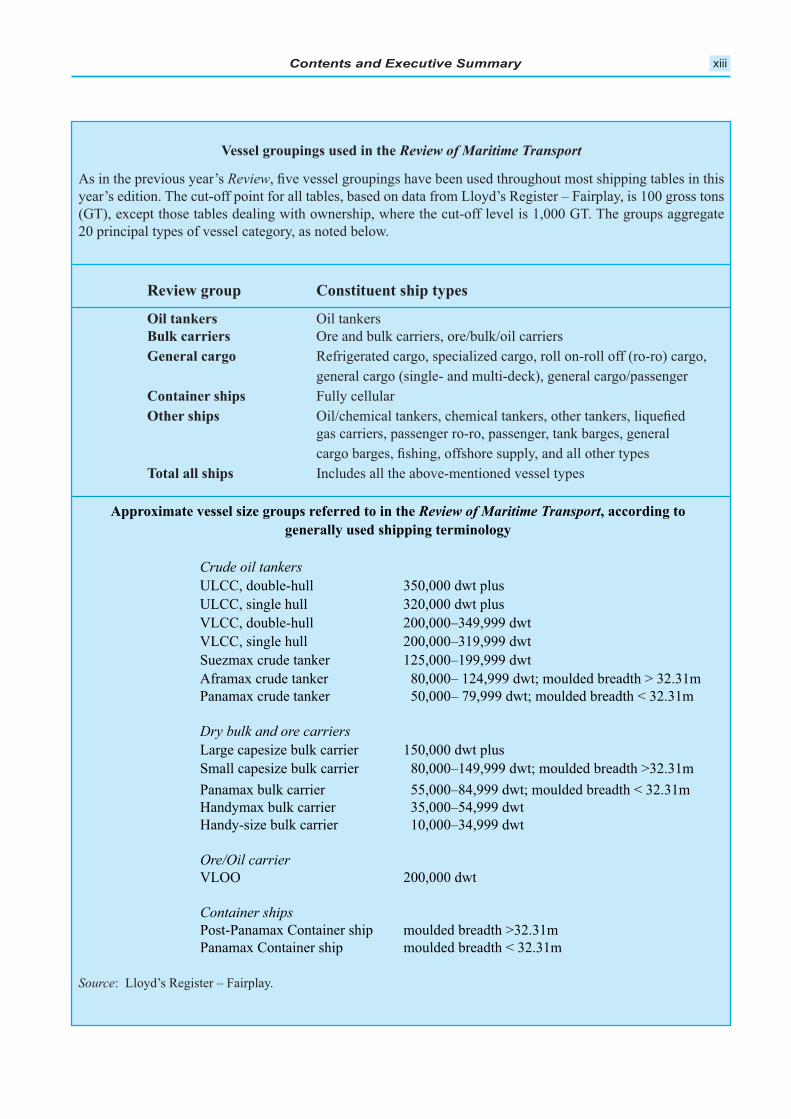
Vessel groupings used in the Review of Maritime Transport
As in the previous year’s Review
year’s edition. The cut-off point for all tables, based on data from Lloyd’s Register – Fairplay, is 100 gross tons
(GT), except those tables dealing with ownership, where the cut-off level is 1,000 GT. The groups aggregate
20 principal types of vessel category, as noted below.
Review group Constituent ship types
Oil tankers Oil tankers
Bulk carriers Ore and bulk carriers, ore/bulk/oil carriers
General cargo Refrigerated cargo, specialized cargo, roll on-roll off (ro-ro) cargo,
general cargo (single- and multi-deck), general cargo/passenger
Container ships Fully cellular
Other ships
gas carriers, passenger ro-ro, passenger, tank barges, general
Total all ships Includes all the above-mentioned vessel types
Approximate vessel size groups referred to in the Review of Maritime Transport, according to
generally used shipping terminology
Crude oil tankers
ULCC, double-hull 350,000 dwt plus
ULCC, single hull 320,000 dwt plus
VLCC, double-hull 200,000–349,999 dwt
VLCC, single hull 200,000–319,999 dwt
Suezmax crude tanker 125,000–199,999 dwt
Aframax crude tanker 80,000– 124,999 dwt; moulded breadth > 32.31m
Panamax crude tanker 50,000– 79,999 dwt; moulded breadth < 32.31m
Dry bulk and ore carriers
Large capesize bulk carrier 150,000 dwt plus
Small capesize bulk carrier 80,000–149,999 dwt; moulded breadth >32.31m
Panamax bulk carrier 55,000–84,999 dwt; moulded breadth < 32.31m
Handymax bulk carrier 35,000–54,999 dwt
Handy-size bulk carrier 10,000–34,999 dwt
Ore/Oil carrier
VLOO 200,000 dwt
Container ships
Post-Panamax Container ship moulded breadth >32.31m
Panamax Container ship moulded breadth < 32.31m
Source: Lloyd’s Register – Fairplay.
Review of Maritime Transport, 2009xiv
EXECUTIVE SUMMARY
crisis and economic downturn, growth in
seaborne trade continued, albeit at a slower
rate.
The year 2008 marked a major turning point in the
history of the world economy and trade. Growth in the
world economy slowed abruptly in the last part of 2008,
in developing economies and countries with economies
in transition has turned out to be less resilient than
expected.
In tandem with the global economic downturn and reduced
trade, growth in international seaborne trade decelerated in
2008, expanding by 3.6 per cent as compared with 4.5 per
cent in 2007. The volume of international seaborne trade in
decline in demand for consumption goods, as well as a fall
in industrial production in major economies and reduced
energy demand, the deceleration in seaborne volumes
affected all shipping sectors.
Existing forecasts suggest that the outlook for seaborne
trade is uncertain and that some challenging times lie
ahead for shipping and international seaborne trade. These
challenges are further compounded by other developments,
including maritime security at sea and the need to address
the climate change challenge.
While demand fell, the supply of new vessels
continued to grow.
1.19 billion deadweight tons, a year-on-year growth of
6.7 per cent compared to January 2008. This growth was
when the industry was still expecting continuing high
growth rates in demand – which did not materialize (see
chapter 1). As the world’s shipping capacity continues to
increase even during the current economic downturn, the
(see chapter 3) and tumbling charter and freight rates (see
chapter 4).
The demolition of existing tonnage is not
enough to compensate for the downturn in
demand and the increase in supply.
Since the beginning of the economic crisis, numerous orders
at the world’s shipyards have been cancelled. Shipbuilders
have been spending more time on renegotiating existing
contracts than on receiving new enquiries or orders.
Although new orders for most vessel types have practically
come to a standstill, vessels continue to be delivered by the
world’s shipyards, especially in the dry bulk segment. Even
without the current economic crisis, the tonnage that entered
the market in recent years would have led to an oversupply
of tonnage and a decline in vessel prices. Prices for scrap
metal in 2009 remain very low when compared to early
2008, and many vessel owners have preferred to hold on
and lay off their ships, hoping for better times to come.
As a consequence of falling demand and
increased supply, freight rates have fallen
from their 2008 highs.
The beginning of 2008 saw a continuation of the buoyant
trend experienced in the preceding year in all sectors.
However, by the start of the third quarter of 2008 things
crisis began to affect demand. Trade volumes in the bulk
cargo and liner sectors sustained dramatic declines, which
continued for the remainder of the year and well into
2009. The tanker market fared slightly better during 2008
compared to other sectors, although by the middle of 2009
all sectors were experiencing similar declines.
By the end of 2008, the effects of the global
economic crisis could be seen in all major
transport modes.
World container port throughput grew by an estimated
4 per cent to reach 506 million TEUs in 2008. Mainland
Chinese ports accounted for approximately 22.6 per cent of
the total world container port throughput. However, 2008
volumes on other modes of transport. In China, the Russian
kilometres showed growth rates of 3.5 per cent, 5 per cent
Contents and Executive Summary xv
and 8.4 per cent respectively for 2008. However, rail freight
early months of 2009 compared to the same period in the
previous year.
2008 saw the United Nations General
Assembly adopt the “Rotterdam Rules”, a
new international convention on contracts
for the international carriage of goods wholly
or partly by sea.
After many years of preparatory work carried out under the
auspices of the United Nations Commission on International
Trade Law (UNCITRAL), the United Nations Convention
on Contracts for the International Carriage of Goods Wholly
or Partly by Sea was adopted by the United Nations General
Assembly in December 2008. The new Convention, which
signature at a special signing conference held in Rotterdam
in September 2009 and will be known as the “Rotterdam
Rules”. Policymakers will now need to carefully consider
the merits of the new Convention and decide whether
it complies with their expectations, both in terms of its
substantive provisions and in terms of its potential to
Since 2004, the World Trade Organization’s
Doha Development Round has been
negotiating on trade facilitation matters.
A major part of the trade facilitation measures proposed so
far focuses on the time needed for the release and clearance
of goods taking into account not only the loss of time,
but also the consequences in terms of possible damages,
opportunities missed and increased costs affecting the
competitiveness of the products. At the end of 2008 and
the beginning of 2009, the overall pace of negotiations
in the World Trade Organization’s Negotiating Group
on Trade Facilitation slowed down, with less time being
devoted to review of the textual proposals, and comments
made by delegations limited to oral interventions. This
situation changed in the second half of 2009, when signs
of a possible compromise on contentious issues of the
Doha Round emerged, and delegates adopted an ambitious
work plan for the period up until the ministerial conference
scheduled for early December 2009. Delegations are now
WTO agreement on trade facilitation.
Key challenges for international cooperation
and regulation include piracy, supply-chain
security and climate change.
The great number of disturbing incidents of piracy and
armed robbery against ships – particularly off the Somali
coast and in the Gulf of Aden – have become an increasing
concern not only for the maritime industry that is heavily
affected by these incidents, but also for international
organizations, including the International Maritime
Organization (IMO) and the United Nations. Joint efforts
and standards are ongoing. Noteworthy environment-
related developments include IMO’s continued commitment
to making progress in a number of areas, including in
relation to reducing emissions of greenhouses gases
from international shipping and in its work towards the
establishment of a relevant global regime.
experienced strong growth in 2008. However,
Africa’s share of world trade remains at 2.7
per cent.
Every year, the Review of Maritime Transport gives
attention to transport developments in a particular region.
The focus in 2009 is on developments in Africa since 2006
when UNCTAD last reported on the region. Despite the
growth in 2008 (5.1 per cent), the top performers being
the resource-rich countries. Africa’s share of world trade
remains at 2.7 per cent. Global port-operating companies
have sought to expand along the main international African
shipping routes, however in some countries, physical,
legal, social and economic constraints have prevented
them from doing so effectively. High numbers of cross-
border documents, poor inland connections, security issues,
excessive transaction costs and delays are common. This has
serious consequences in the case of landlocked countries,
whose dependence on transit countries complicates export
and import processes, with the costs of imported freight
world average. In recent years, however, there has
been a growing recognition of the need to improve
port operations and inland connectivity in the region.
Even when new investments are being considered in
crisis.

1
WORLD ECONOMIC SITUATION A.
AND PROSPECTS
1. World economic growth1
The year 2008 marked a major turning point in the
history of the world economy and trade. Growth in the
world economy measured by gross domestic product
(GDP) slowed abruptly in the last part of 2008, as the
2007 deepened and entered a more severe phase.
Global GDP expanded by just
2.0 per cent, a much slower rate
than the 3.7 per cent recorded in
2007, and below the annual average
rate of 3.5 per cent recorded during
the period 1994–2008. The overall
picture was one of continuing growth in the first
three quarters of 2008 with oil-exporting countries
prices, followed by faltering growth in late 2008 and
then spreading to developing economies and countries
with economies in transition (table 1). World output in
2009 is projected to contract by 2.7 per cent, heralding
demand for maritime transport is derived from economic
activities and trade, the global economic downturn
entails serious implications for the maritime transport
sector and seaborne trade.
Developed economies are leading the global downturn,
with most of their economies already in recession.
growth of 0.7 per cent in 2008.
GDP grew by 1.1 per cent in the
and Italy were the hardest hit, with
their outputs falling by 0.6 per cent
expected to shrink by 4.1 per cent in 2009.
Developing economies and countries with economies
in transition have also felt the brunt of the downturn.
Chapter 1
DEVELOPMENTS IN INTERNATIONAL
SEABORNE TRADE
Global GDP expanded by just
2.0 per cent, a much slower
rate than the 3.7 per cent
recorded in 2007 ...
Review of Maritime Transport, 20092
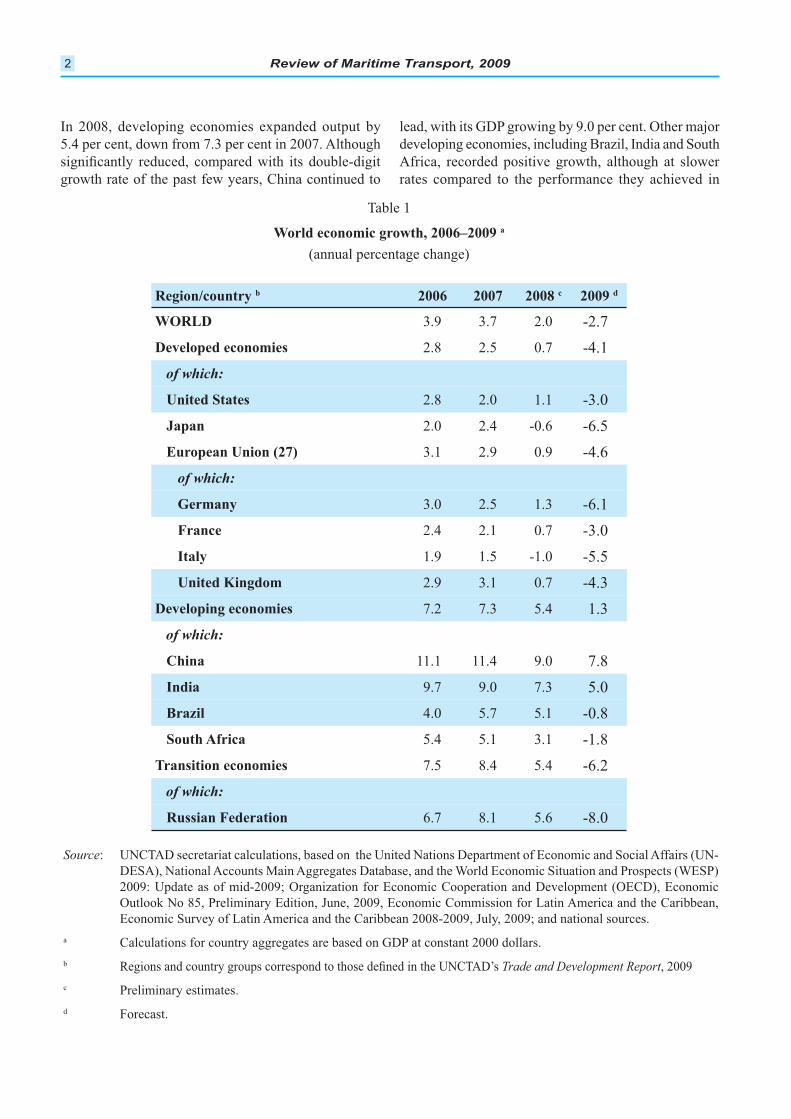
In 2008, developing economies expanded output by
growth rate of the past few years, China continued to
lead, with its GDP growing by 9.0 per cent. Other major
rates compared to the performance they achieved in
Table 1
World economic growth, 2006–2009 a
(annual percentage change)
Region/country b 2006 2007 2008 c 2009 d
WORLD 3.9 3.7 2.0 -2.7
Developed economies 2.8 2.5 0.7 -4.1
United States 2.8 2.0 1.1 -3.0
Japan 2.0 2.4 -0.6 -6.5
European Union (27) 3.1 2.9 0.9 -4.6
Germany 3.0 2.5 1.3 -6.1
France 2.4 2.1 0.7 -3.0
Italy 1.9 1.5 -1.0 -5.5
United Kingdom 2.9 3.1 0.7 -4.3
Developing economies 7.2 7.3 5.4 1.3
China 11.1 11.4 9.0 7.8
India 9.7 9.0 7.3 5.0
Brazil 4.0 5.7 5.1 -0.8
South Africa 5.4 5.1 3.1 -1.8
Transition economies 7.5 8.4 5.4 -6.2
Russian Federation 6.7 8.1 5.6 -8.0
Source
a Calculations for country aggregates are based on GDP at constant 2000 dollars.
b Trade and Development Report, 2009
c Preliminary estimates.
d Forecast.

1 - Developments in International Seaborne Trade 3
2007. In aggregate, developing economies are expected
to grow marginally in 2009 (1.3 per cent), with some
GDP contractions (of -0.8 per cent and -1.8 per cent,
respectively).
Countries with economies in transition are affected too,
with growth slowing to 5.4 per cent in 2008, compared
to a rate of 8.4 per cent in 2007. The 2009 outlook for
these economies is bleak, with GDP expected to fall by
6.2 per cent for the entire group, and by 8.0 per cent for
the Russian Federation.
While the spillover of the downturn from developed to
developing regions might have been slow, the contagion
could not be prevented. China – the main engine of
the global economic and trade expansion over recent
years – could not insulate itself from the effects of the
deteriorating economic situation when its major trading
partners had already entered into recession. Growth in
developing economies and countries with economies
in transition has turned out to be less resilient than
expected suggesting that there is no “decoupling” effect
between the economies of developed and developing
regions.
In an interdependent and globalized economy,
developing economies and countries with economies in
transition cannot be sheltered from the effects of a global
downturn. The rapid spread of the economic downturn
beyond advanced economies has been channelled –
acted as a conduit for the economic downturn. Therefore,
the world is witnessing a broad, deep and synchronized
Figure 1 (a)
World GDP growth, 2003–2009, selected countries
(annual percentage change)
Source:
-10.0
-5.0
0.0
5.0
10.0
15.0
2003 2004 2005 2006 2007 2008 2009
United States EU Japan India China South Africa Brazil Russian Federation
Review of Maritime Transport, 20094
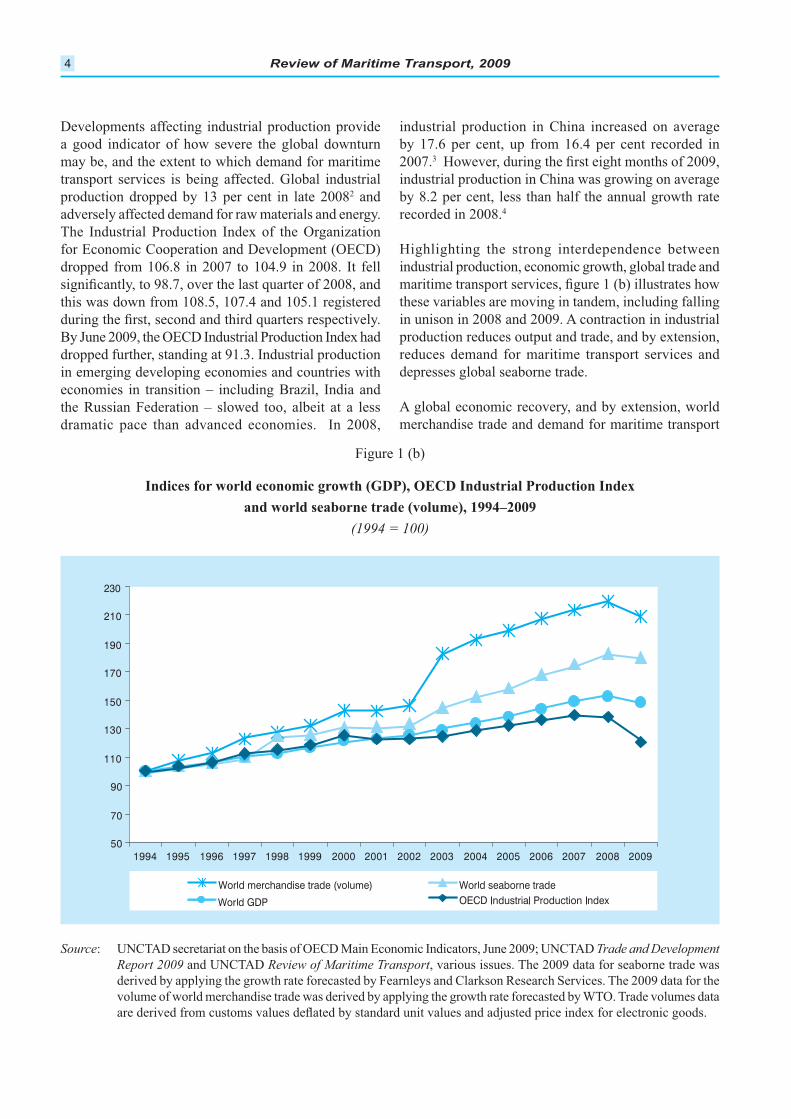
Developments affecting industrial production provide
a good indicator of how severe the global downturn
may be, and the extent to which demand for maritime
transport services is being affected. Global industrial
production dropped by 13 per cent in late 20082 and
adversely affected demand for raw materials and energy.
The Industrial Production Index of the Organization
for Economic Cooperation and Development (OECD)
dropped from 106.8 in 2007 to 104.9 in 2008. It fell
this was down from 108.5, 107.4 and 105.1 registered
dropped further, standing at 91.3. Industrial production
in emerging developing economies and countries with
economies in transition – including Brazil, India and
the Russian Federation – slowed too, albeit at a less
dramatic pace than advanced economies. In 2008,
industrial production in China increased on average
by 17.6 per cent, up from 16.4 per cent recorded in
2007.3
industrial production in China was growing on average
by 8.2 per cent, less than half the annual growth rate
recorded in 2008.4
Highlighting the strong interdependence between
industrial production, economic growth, global trade and
these variables are moving in tandem, including falling
production reduces output and trade, and by extension,
reduces demand for maritime transport services and
depresses global seaborne trade.
merchandise trade and demand for maritime transport
Figure 1 (b)
Indices for world economic growth (GDP), OECD Industrial Production Index
and world seaborne trade (volume), 1994–2009
(1994 = 100)
Source Trade and Development
Report 2009 Review of Maritime Transport, various issues. The 2009 data for seaborne trade was
volume of world merchandise trade was derived by applying the growth rate forecasted by WTO. Trade volumes data

1 - Developments in International Seaborne Trade 5
services, will, to a large extent, depend on actions
taken to reinvigorate economic activity, stimulate
consumption and investment, and promote trade.
Governments, individually, and as a group, including
within the framework of the G-20,5 are taking action and
pledging to help overcome the crisis. Governments at
on an additional $1.1 trillion support programme which
worth $250 billion. In addition, the Governments
of some 40 economies – including Governments in
developing regions, such as those of China and India –
(amounting to approximately $21 trillion) to stabilize
national economies.6
implementation of the various policy and support
measures adopted or planned – that the global economy
will turn around in 2010, albeit at the sluggish rate of
1.9 per cent. It should be noted, however, that despite the
various efforts to pull the world economy out of recession,
economy. Tighter credit conditions constrain investment
and consumer spending, which, in turn, prevent economic
2. Merchandise trade7
Recent developments in international trade
growth in world merchandise trade. In 2008, the volume
of world merchandise exports grew by 2.0 per cent,
four percentage points lower than 2007 (table 2). The
magnitude of this deceleration is
such that, unlike previous years,
growth in export volumes did not
grown at a faster rate than GDP, with
trade expanding two to three times faster. The multiplier
effect is, to a large extent, the result of globalized
production processes and trade in parts and components,
greater economic integration, and the deepening and
widening of global supply chains.8
monthly trade volumes of major developed and
developing economies have been falling in tandem since
2008 is considered particularly severe, with recorded
declines in trade being larger than in past slowdowns.
The most commonly cited reason within the maritime
industry for the speed with which the downturn has
fact, banks stopped issuing letters of credit, and cargoes
could not be lifted and trades executed. Developing
developing economies is estimated to range between
$100 billion and $300 billion annually.9
registered the slowest export growth of any region. The
collapsing demand for imported goods, in particular
consumer goods, resulted in both regions recording sharp
Developing economies and transition economies
continued to drive growth in world merchandise trade,
China – expanded its export volumes by 4.5 per cent,
a dramatic fall from the double-digit rate recorded in
previous years. Growth in export volumes from China
slowed to 8.5 per cent, less than half the growth rate
in particular – also grew at a slower pace than in 2007.
the recession, especially those countries that rely heavily
on the production and export of manufactured goods, the
demand for which has substantially dropped.
expanded their export and import volumes despite the
relatively slower pace. Exporters of
primary commodities, including oil
and metals, maintained relatively
high import volume levels, as they
trade as a result of price surges in
3.0 per cent in 2008, compared to 4.5 per cent in 2007,
cent (4.0 per cent in 2007), while imports grew by
10.0 per cent (14.0 per cent in 2007). Import volumes in
They increased at a double-digit rate (15.5 per cent),
although at a slower pace than in 2007 and at a much
In 2008, the volume of world
merchandise exports grew by
2.0 per cent, four percentage
points lower than 2007.
Review of Maritime Transport, 20096
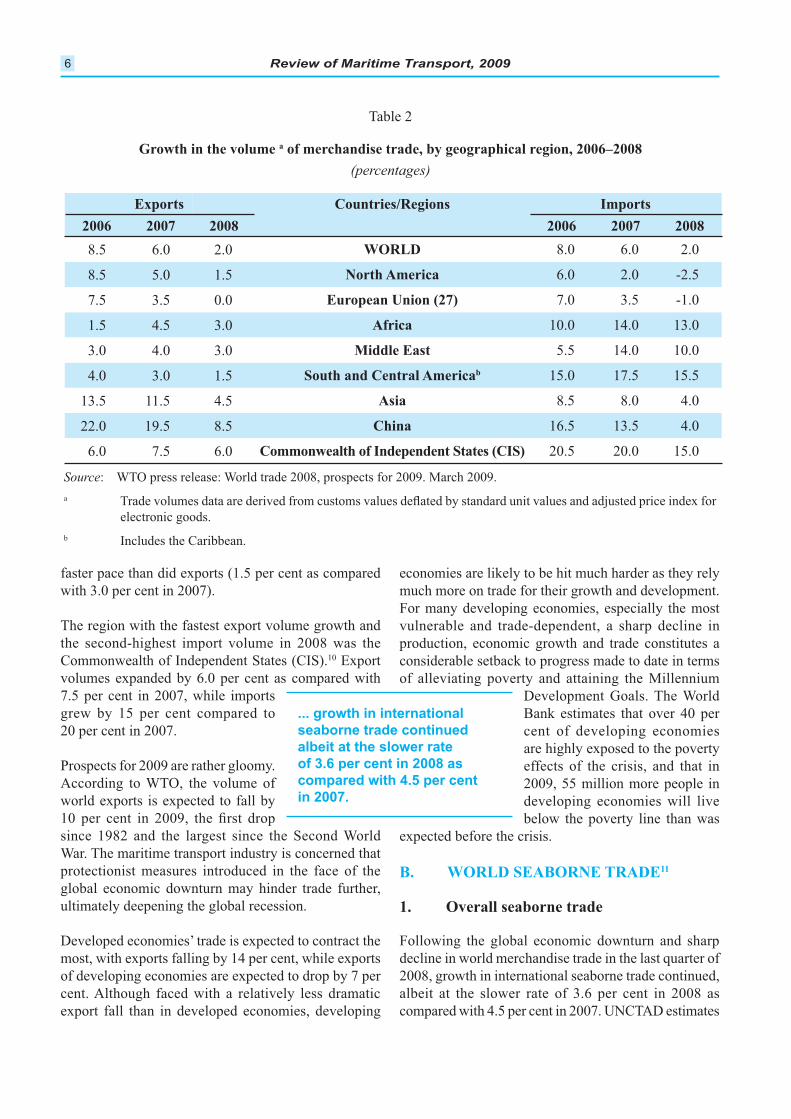
faster pace than did exports (1.5 per cent as compared
with 3.0 per cent in 2007).
The region with the fastest export volume growth and
the second-highest import volume in 2008 was the 10 Export
volumes expanded by 6.0 per cent as compared with
7.5 per cent in 2007, while imports
grew by 15 per cent compared to
20 per cent in 2007.
Prospects for 2009 are rather gloomy.
world exports is expected to fall by
War. The maritime transport industry is concerned that
protectionist measures introduced in the face of the
global economic downturn may hinder trade further,
ultimately deepening the global recession.
most, with exports falling by 14 per cent, while exports
of developing economies are expected to drop by 7 per
export fall than in developed economies, developing
economies are likely to be hit much harder as they rely
much more on trade for their growth and development.
For many developing economies, especially the most
vulnerable and trade-dependent, a sharp decline in
production, economic growth and trade constitutes a
considerable setback to progress made to date in terms
Development Goals. The World
Bank estimates that over 40 per
cent of developing economies
are highly exposed to the poverty
effects of the crisis, and that in
2009, 55 million more people in
developing economies will live
below the poverty line than was
expected before the crisis.
WORLD SEABORNE TRADEB. 11
1. Overall seaborne trade
Following the global economic downturn and sharp
decline in world merchandise trade in the last quarter of
2008, growth in international seaborne trade continued,
albeit at the slower rate of 3.6 per cent in 2008 as
Table 2
Growth in the volume a of merchandise trade, by geographical region, 2006–2008
(percentages)
Exports Countries/Regions Imports
2006 2007 2008 2006 2007 2008
8.5 6.0 2.0 WORLD 8.0 6.0 2.0
8.5 5.0 1.5 North America 6.0 2.0 -2.5
7.5 3.5 0.0 European Union (27) 7.0 3.5 -1.0
1.5 4.5 3.0 Africa 10.0 14.0 13.0
3.0 4.0 3.0 Middle East 5.5 14.0 10.0
4.0 3.0 1.5 South and Central Americab 15.0 17.5 15.5
13.5 11.5 4.5 Asia 8.5 8.0 4.0
22.0 19.5 8.5 China 16.5 13.5 4.0
6.0 7.5 6.0 Commonwealth of Independent States (CIS) 20.5 20.0 15.0
Source
a
electronic goods.
b Includes the Caribbean.
... growth in international
seaborne trade continued
albeit at the slower rate
of 3.6 per cent in 2008 as
compared with 4.5 per cent
in 2007.
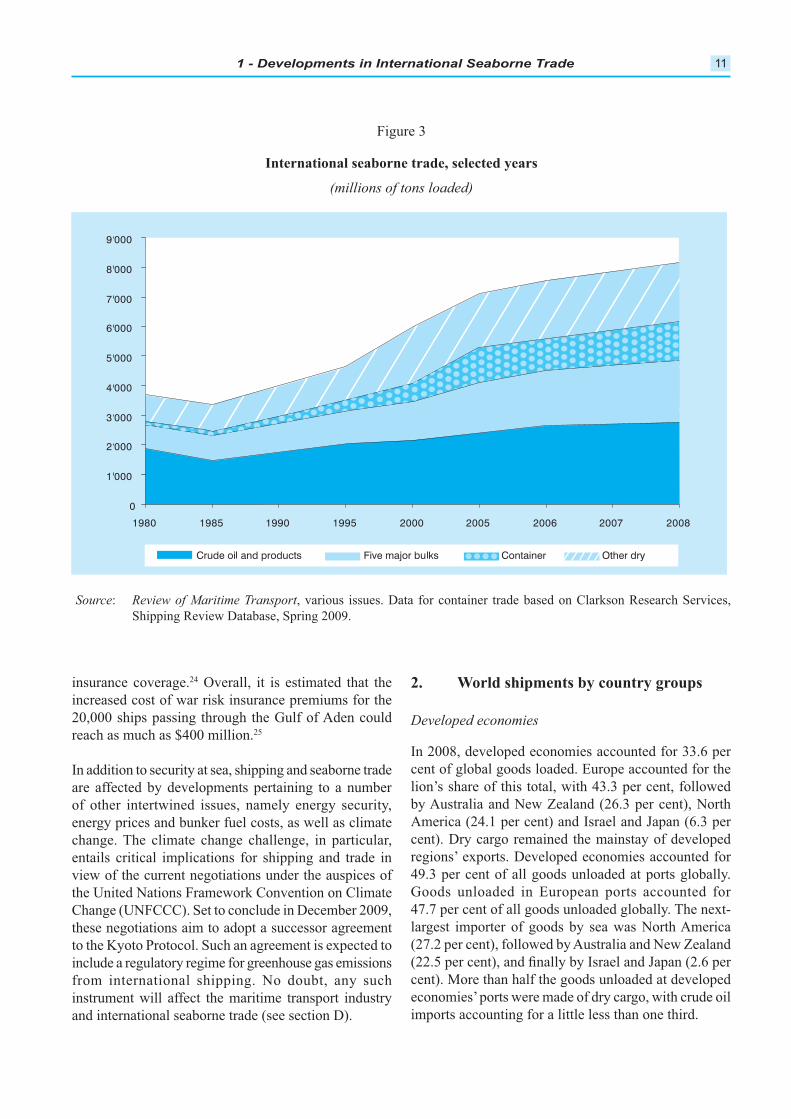
1 - Developments in International Seaborne Trade 7
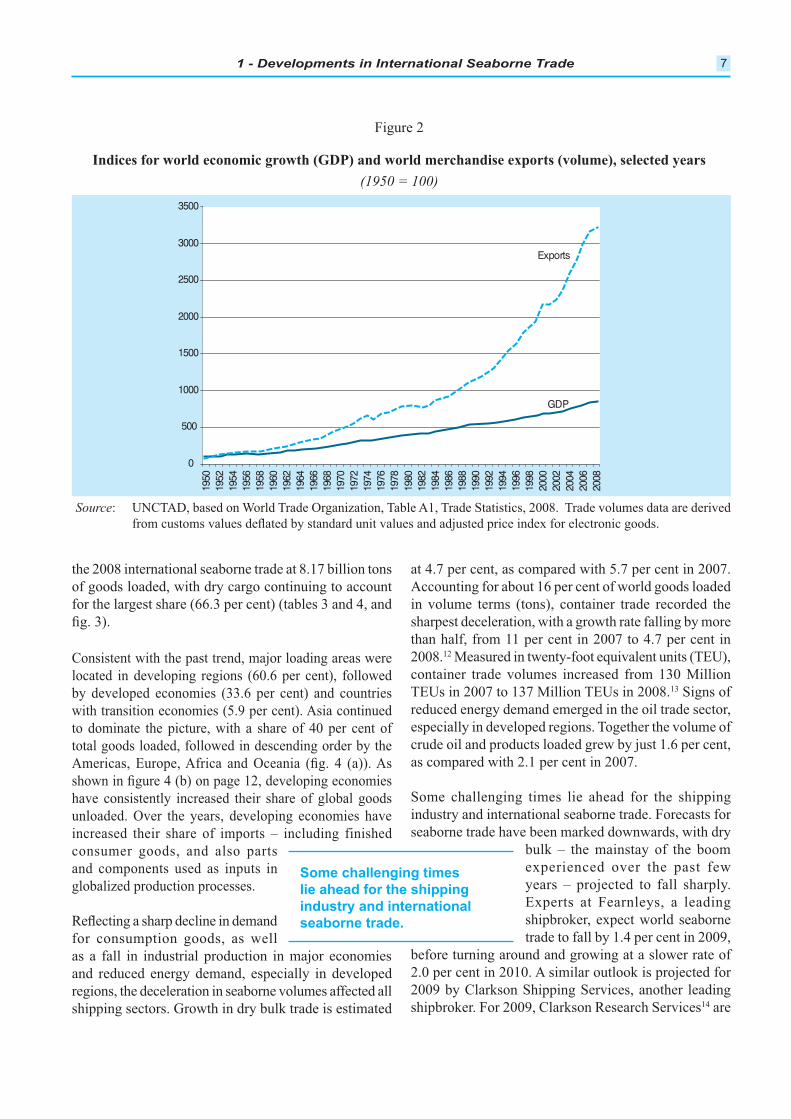
the 2008 international seaborne trade at 8.17 billion tons
of goods loaded, with dry cargo continuing to account
for the largest share (66.3 per cent) (tables 3 and 4, and
Consistent with the past trend, major loading areas were
located in developing regions (60.6 per cent), followed
by developed economies (33.6 per cent) and countries
to dominate the picture, with a share of 40 per cent of
total goods loaded, followed in descending order by the
have consistently increased their share of global goods
unloaded. Over the years, developing economies have
increased their share of imports – including finished
consumer goods, and also parts
and components used as inputs in
globalized production processes.
for consumption goods, as well
as a fall in industrial production in major economies
and reduced energy demand, especially in developed
regions, the deceleration in seaborne volumes affected all
shipping sectors. Growth in dry bulk trade is estimated
at 4.7 per cent, as compared with 5.7 per cent in 2007.
in volume terms (tons), container trade recorded the
sharpest deceleration, with a growth rate falling by more
than half, from 11 per cent in 2007 to 4.7 per cent in
2008.12
13
reduced energy demand emerged in the oil trade sector,
especially in developed regions. Together the volume of
crude oil and products loaded grew by just 1.6 per cent,
as compared with 2.1 per cent in 2007.
industry and international seaborne trade. Forecasts for
seaborne trade have been marked downwards, with dry
bulk – the mainstay of the boom
experienced over the past few
years – projected to fall sharply.
Experts at Fearnleys, a leading
shipbroker, expect world seaborne
trade to fall by 1.4 per cent in 2009,
before turning around and growing at a slower rate of
14 are
Figure 2
Indices for world economic growth (GDP) and world merchandise exports (volume), selected years
(1950 = 100)
Source
Some challenging times
lie ahead for the shipping
industry and international
seaborne trade.
0
500
1000
1500
2000
2500
3000
350019
5019
5219
5419
5619
5819
6019
6219
6419
6619
6819
7019
7219
7419
7619
7819
8019
8219
8419
8619
8819
9019
9219
9419
9619
9820
0020
0220
0420
0620
08
Exports
GDP
Review of Maritime Transport, 20098
expecting dry cargo volumes to fall by 4.4 per cent,
largest decline is expected to affect Phosphate Rock
per cent), Coal (-2.3 per cent) and Grains (- 0.6 per
cent). Iron ore volumes are expected to remain steady
due in particular to continued high import volumes
consumption needs but also the prices negotiated for
balance between use of locally produced and imported
iron ore.15 Oil trade, including crude and oil products,
is expected to remain at practically the same level as
gas trade, it will very much depend on the global
economic situation and energy demand as well as on
the completion of a number of ongoing projects.
particular from the boom in trade driven by the economic
expansion of emerging dynamic developing economies
such as China and India. The buoyant markets that
emerged, and the sustained record-high freight rates
(see chapter 4 for more details) made the world almost
forget the cyclical nature of shipping and its notorious
volatility.16 In common with other economic sectors –
and even more so in view of the fact that demand for
maritime transport services is derived from economic
growth and the need to carry goods between producers
and consumers as well as buyers and sellers – shipping is
vulnerable to economic downturns. The vulnerability of
shipping to the broader economic situation is illustrated
early-1980s recession, and also by the slowdown in the
growth of global seaborne trade in the late 1990s when
precedents also underscore the ability of shipping and
seaborne trade to rebound and recover from economic
downturns and reduced trade.
Other developments affecting seaborne trade
global recession should not play down concerns over
other challenges that affect maritime transport and
seaborne trade. These include, for example, security
at sea, which is being challenged by a surge in piracy
incidents in key strategic transit points such as the Gulf of
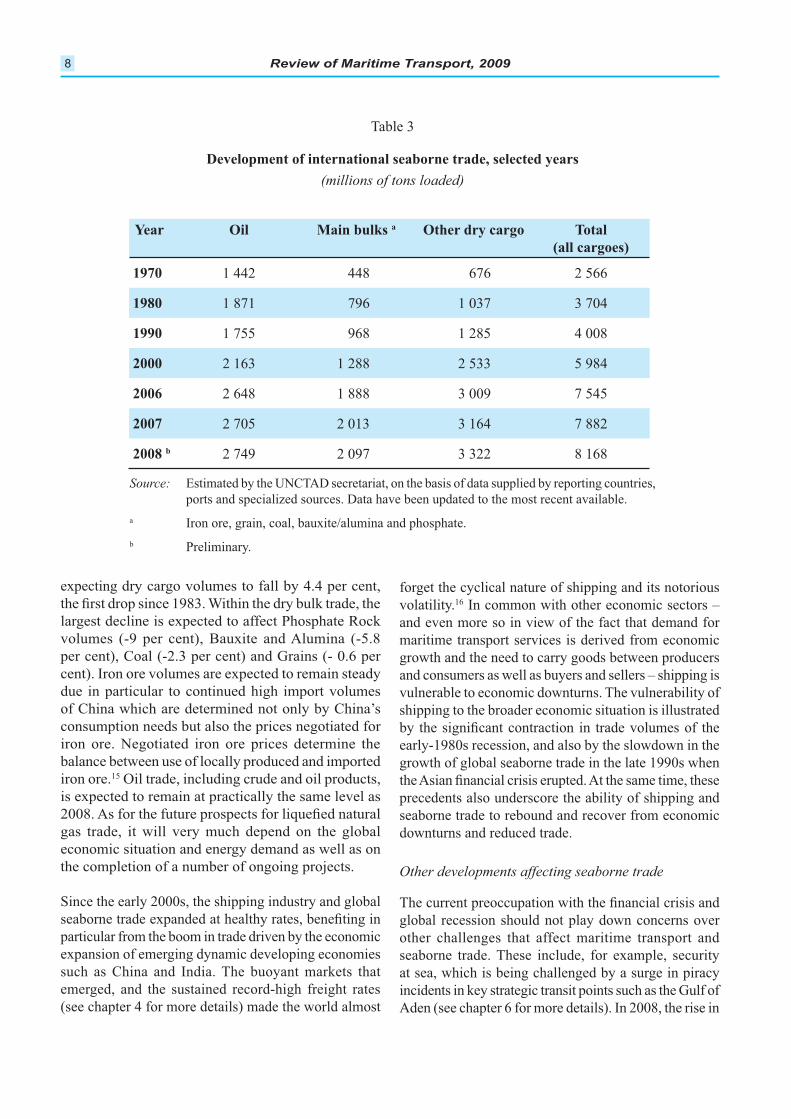
Table 3
Development of international seaborne trade, selected years
(millions of tons loaded)
Year Oil Main bulks a Other dry cargo Total
(all cargoes)
1970 1 442 448 676 2 566
1980 1 871 796 1 037 3 704
1990 1 755 968 1 285 4 008
2000 2 163 1 288 2 533 5 984
2006 2 648 1 888 3 009 7 545
2007 2 705 2 013 3 164 7 882
2008 b 2 749 2 097 3 322 8 168
Source:
ports and specialized sources. Data have been updated to the most recent available.
a Iron ore, grain, coal, bauxite/alumina and phosphate.
b Preliminary.
1 - Developments in International Seaborne Trade 9
maritime security to the forefront of international debate.
In addition to the direct impact on ships, crews and
cargoes, and on the maritime industry and governments,
piracy threatens global seaborne trade (over 80 per cent
of international seaborne trade moving through the 17 and impacts on energy
security and the environment. By hijacking large tankers,
seizing their cargoes, and delaying or preventing their
delivery, and by causing oil spills or other incidents
causing environmental damage, piracy poses additional
risks and costs to all. The implications entail increased
military presence and operations in affected areas, the
costs associated with the hiring of security personnel
and the installation of deterrent equipment.
Carriers can either avoid the piracy-ridden areas by re-
routing their ships via the Cape of Good Hope, or accept
additional risks and costs and continue to sail along the
same lanes.18 Re-routing via the Cape of Good Hope
will likely affect the Egyptian authorities (e.g. foreign
port authorities and terminals (e.g. reduced vessel calls
and transhipments), and also industry and consumers
because of additional costs. Based on 2007 data, the
Canal has been estimated at $25.7 billion, whereas
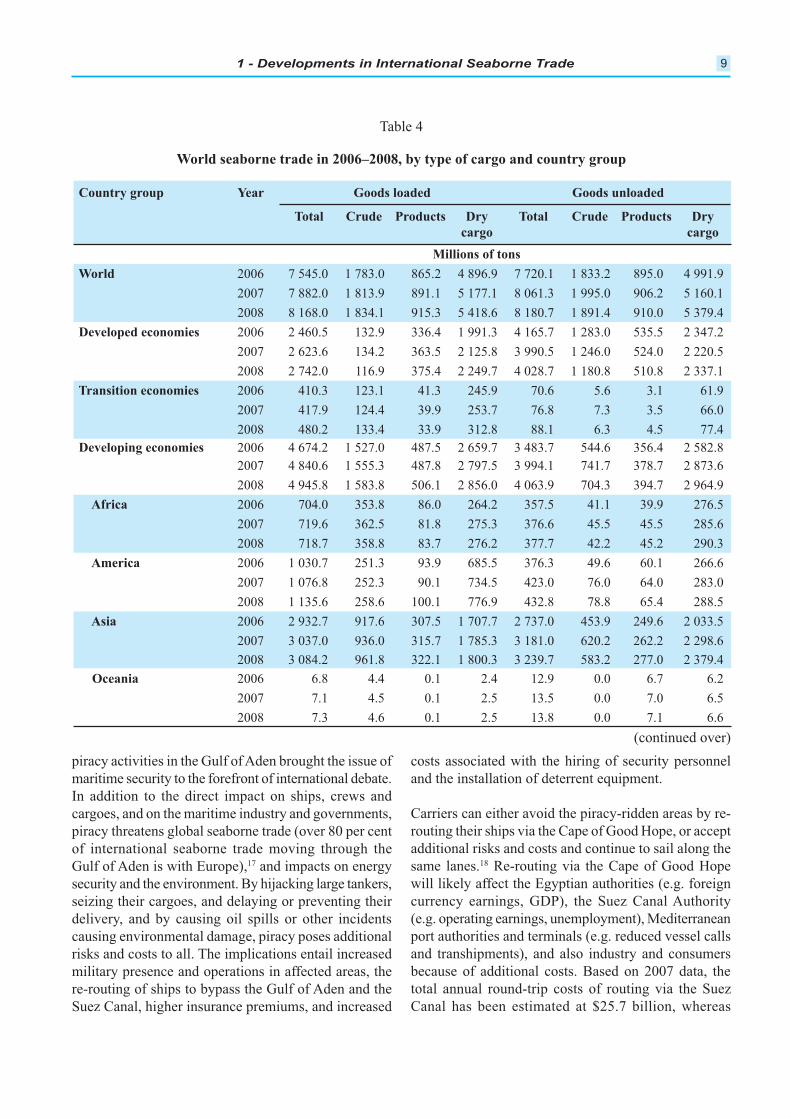
Table 4
World seaborne trade in 2006–2008, by type of cargo and country group
Country group Year Goods loaded Goods unloaded
Total Crude Products Dry
cargo
Total Crude Products Dry
cargo
Millions of tons
World 2006 7 545.0 1 783.0 865.2 4 896.9 7 720.1 1 833.2 895.0 4 991.9
2007 7 882.0 1 813.9 891.1 5 177.1 8 061.3 1 995.0 906.2 5 160.1
2008 8 168.0 1 834.1 915.3 5 418.6 8 180.7 1 891.4 910.0 5 379.4
Developed economies 2006 2 460.5 132.9 336.4 1 991.3 4 165.7 1 283.0 535.5 2 347.2
2007 2 623.6 134.2 363.5 2 125.8 3 990.5 1 246.0 524.0 2 220.5
2008 2 742.0 116.9 375.4 2 249.7 4 028.7 1 180.8 510.8 2 337.1
Transition economies 2006 410.3 123.1 41.3 245.9 70.6 5.6 3.1 61.9
2007 417.9 124.4 39.9 253.7 76.8 7.3 3.5 66.0
2008 480.2 133.4 33.9 312.8 88.1 6.3 4.5 77.4
Developing economies 2006 4 674.2 1 527.0 487.5 2 659.7 3 483.7 544.6 356.4 2 582.8
2007 4 840.6 1 555.3 487.8 2 797.5 3 994.1 741.7 378.7 2 873.6
2008 4 945.8 1 583.8 506.1 2 856.0 4 063.9 704.3 394.7 2 964.9
Africa 2006 704.0 353.8 86.0 264.2 357.5 41.1 39.9 276.5
2007 719.6 362.5 81.8 275.3 376.6 45.5 45.5 285.6
2008 718.7 358.8 83.7 276.2 377.7 42.2 45.2 290.3
America 2006 1 030.7 251.3 93.9 685.5 376.3 49.6 60.1 266.6
2007 1 076.8 252.3 90.1 734.5 423.0 76.0 64.0 283.0
2008 1 135.6 258.6 100.1 776.9 432.8 78.8 65.4 288.5
Asia 2006 2 932.7 917.6 307.5 1 707.7 2 737.0 453.9 249.6 2 033.5
2007 3 037.0 936.0 315.7 1 785.3 3 181.0 620.2 262.2 2 298.6
2008 3 084.2 961.8 322.1 1 800.3 3 239.7 583.2 277.0 2 379.4
Oceania 2006 6.8 4.4 0.1 2.4 12.9 0.0 6.7 6.2
2007 7.1 4.5 0.1 2.5 13.5 0.0 7.0 6.5
2008 7.3 4.6 0.1 2.5 13.8 0.0 7.1 6.6
(continued over)
Review of Maritime Transport, 200910
costs – including inventory costs of cargo – when ships
are routed via the Cape of Good Hope are estimated at
$32.2 billion.19 Taking into account all cost factors, it
was estimated that re-routing 33 per cent of cargo via the
Cape would cost shipowners an additional $7.5 billion
per annum.20 These costs will ultimately be passed on
to shippers and consumers.
other factors, including the global economic downturn,
the fall in oil prices and, by extension, in fuel costs, as well
as the decline in trade volumes, have already resulted in
large containerships being re-routed via the Cape of Good
similar action with a joint service.21 While taking this
longer route leads to greater fuel consumption and adds
another 7 to 10 days as ships continue to reduce speed,
lines were considering it more economical. However, as
bunker fuel prices started to increase in mid-2008,22 the
decision to divert various ships around the Cape of Good
Hope was being revisited and the policy of re-routing to
the Cape of Good Hope was being reversed.23
coverage at $20,000 per ship per voyage (excluding
injury, liability and ransom coverage), as compared
with the $500 required a year ago to purchase additional
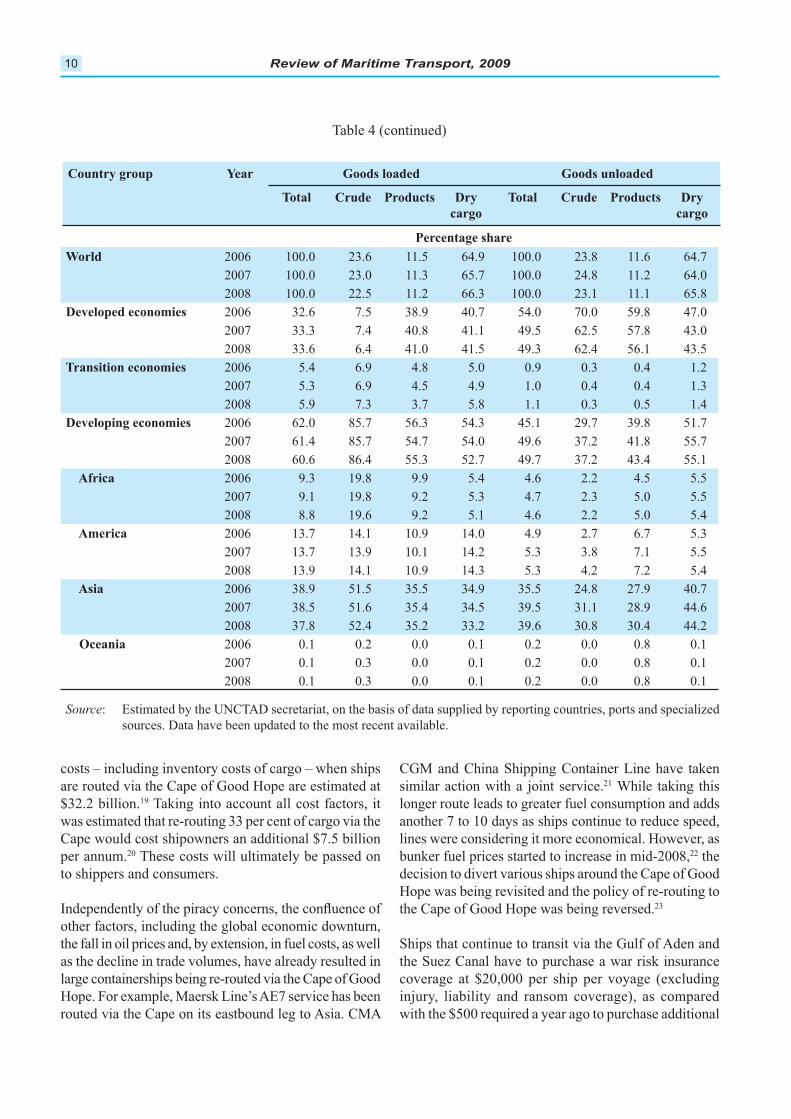
Table 4 (continued)
Source
sources. Data have been updated to the most recent available.
Country group Year Goods loaded Goods unloaded
Total Crude Products Dry
cargo
Total Crude Products Dry
cargo
Percentage share
World 2006 100.0 23.6 11.5 64.9 100.0 23.8 11.6 64.7
2007 100.0 23.0 11.3 65.7 100.0 24.8 11.2 64.0
2008 100.0 22.5 11.2 66.3 100.0 23.1 11.1 65.8
Developed economies 2006 32.6 7.5 38.9 40.7 54.0 70.0 59.8 47.0
2007 33.3 7.4 40.8 41.1 49.5 62.5 57.8 43.0
2008 33.6 6.4 41.0 41.5 49.3 62.4 56.1 43.5
Transition economies 2006 5.4 6.9 4.8 5.0 0.9 0.3 0.4 1.2
2007 5.3 6.9 4.5 4.9 1.0 0.4 0.4 1.3
2008 5.9 7.3 3.7 5.8 1.1 0.3 0.5 1.4
Developing economies 2006 62.0 85.7 56.3 54.3 45.1 29.7 39.8 51.7
2007 61.4 85.7 54.7 54.0 49.6 37.2 41.8 55.7
2008 60.6 86.4 55.3 52.7 49.7 37.2 43.4 55.1
Africa 2006 9.3 19.8 9.9 5.4 4.6 2.2 4.5 5.5
2007 9.1 19.8 9.2 5.3 4.7 2.3 5.0 5.5
2008 8.8 19.6 9.2 5.1 4.6 2.2 5.0 5.4
America 2006 13.7 14.1 10.9 14.0 4.9 2.7 6.7 5.3
2007 13.7 13.9 10.1 14.2 5.3 3.8 7.1 5.5
2008 13.9 14.1 10.9 14.3 5.3 4.2 7.2 5.4
Asia 2006 38.9 51.5 35.5 34.9 35.5 24.8 27.9 40.7
2007 38.5 51.6 35.4 34.5 39.5 31.1 28.9 44.6
2008 37.8 52.4 35.2 33.2 39.6 30.8 30.4 44.2
Oceania 2006 0.1 0.2 0.0 0.1 0.2 0.0 0.8 0.1
2007 0.1 0.3 0.0 0.1 0.2 0.0 0.8 0.1
2008 0.1 0.3 0.0 0.1 0.2 0.0 0.8 0.1
1 - Developments in International Seaborne Trade 11
insurance coverage.24 Overall, it is estimated that the
increased cost of war risk insurance premiums for the
reach as much as $400 million.25
In addition to security at sea, shipping and seaborne trade
are affected by developments pertaining to a number
of other intertwined issues, namely energy security,
energy prices and bunker fuel costs, as well as climate
change. The climate change challenge, in particular,
entails critical implications for shipping and trade in
view of the current negotiations under the auspices of
these negotiations aim to adopt a successor agreement
include a regulatory regime for greenhouse gas emissions
instrument will affect the maritime transport industry
and international seaborne trade (see section D).
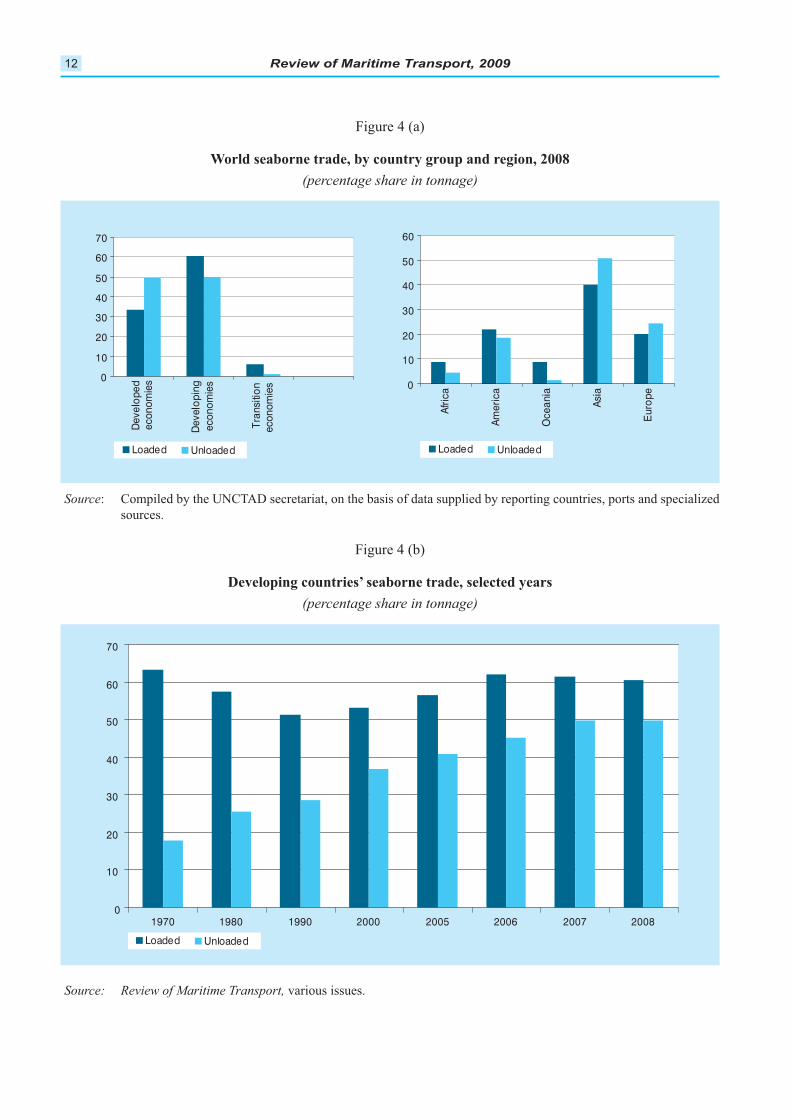
2. World shipments by country groups
Developed economies
In 2008, developed economies accounted for 33.6 per
cent of global goods loaded. Europe accounted for the
cent). Dry cargo remained the mainstay of developed
49.3 per cent of all goods unloaded at ports globally.
Goods unloaded in European ports accounted for
47.7 per cent of all goods unloaded globally. The next-
imports accounting for a little less than one third.
Figure 3
International seaborne trade, selected years
(millions of tons loaded)
Source: Review of Maritime Transport
Container
Review of Maritime Transport, 200912
Figure 4 (a)
World seaborne trade, by country group and region, 2008
(percentage share in tonnage)
Source
sources.
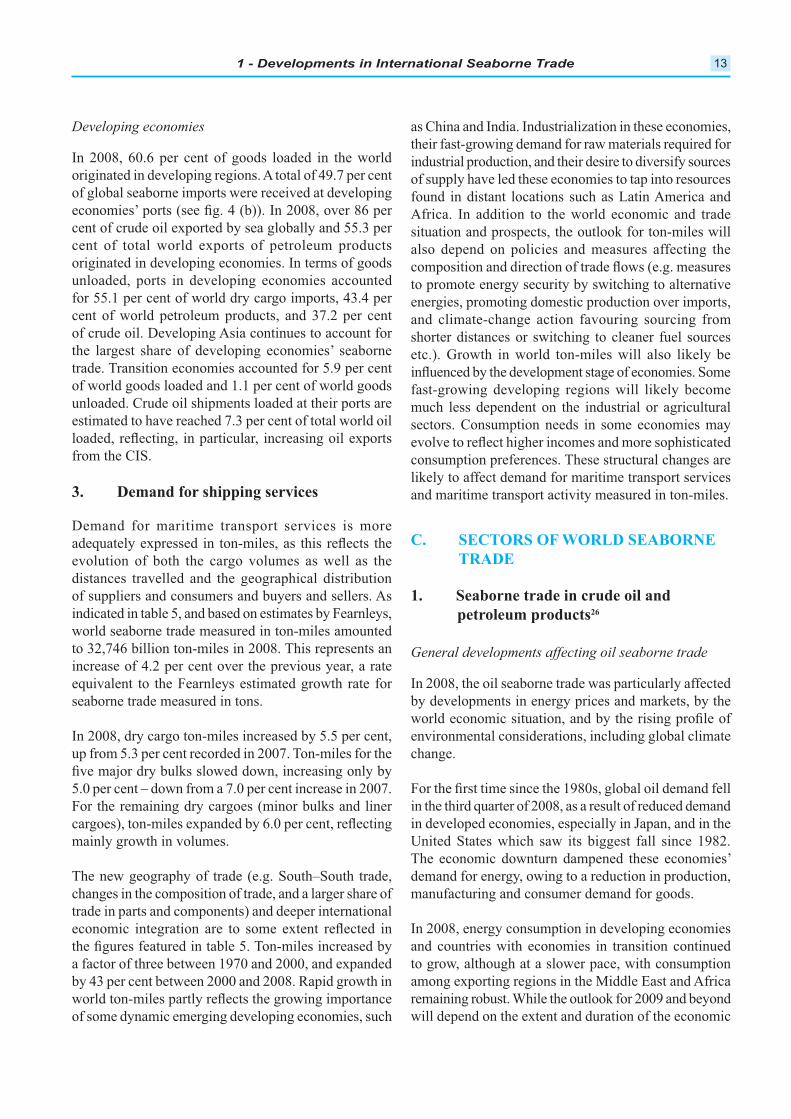
Source: Review of Maritime Transport, various issues.
Figure 4 (b)
Developing countries’ seaborne trade, selected years
(percentage share in tonnage)
1 - Developments in International Seaborne Trade 13
Developing economies
In 2008, 60.6 per cent of goods loaded in the world
of global seaborne imports were received at developing
cent of crude oil exported by sea globally and 55.3 per
cent of total world exports of petroleum products
originated in developing economies. In terms of goods
unloaded, ports in developing economies accounted
for 55.1 per cent of world dry cargo imports, 43.4 per
cent of world petroleum products, and 37.2 per cent
trade. Transition economies accounted for 5.9 per cent
of world goods loaded and 1.1 per cent of world goods
unloaded. Crude oil shipments loaded at their ports are
estimated to have reached 7.3 per cent of total world oil
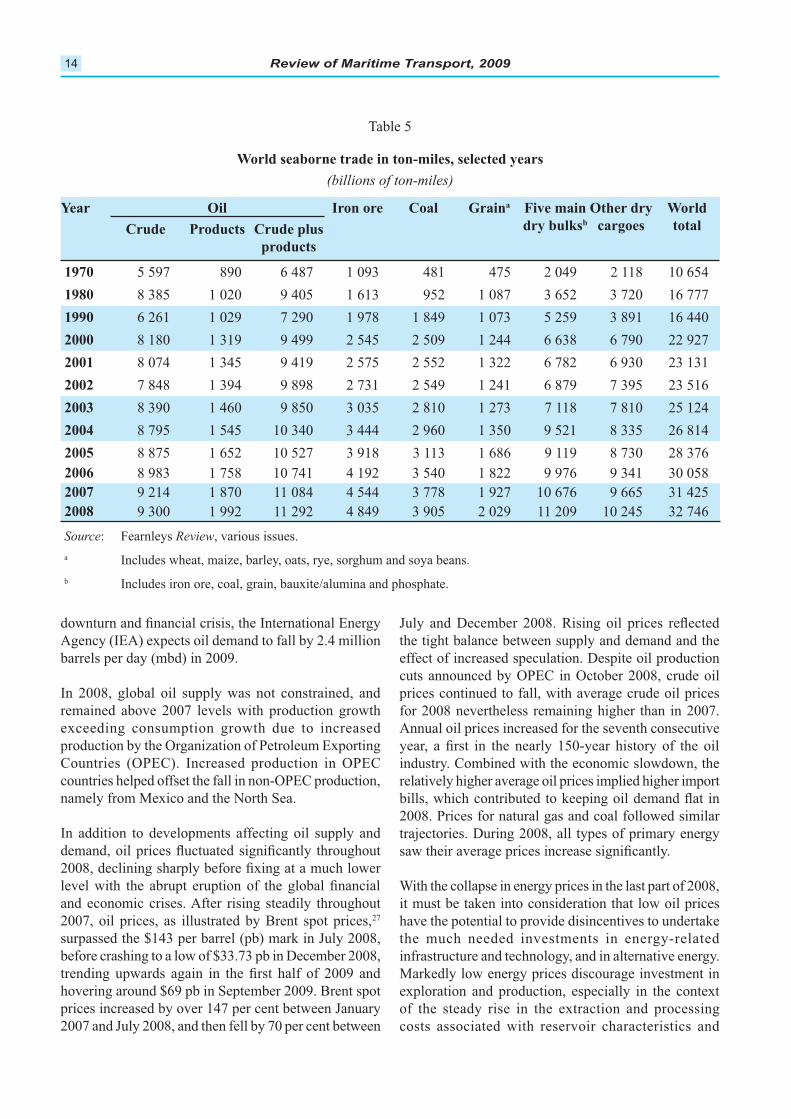
3. Demand for shipping services
Demand for maritime transport services is more
evolution of both the cargo volumes as well as the
distances travelled and the geographical distribution
indicated in table 5, and based on estimates by Fearnleys,
world seaborne trade measured in ton-miles amounted
to 32,746 billion ton-miles in 2008. This represents an
increase of 4.2 per cent over the previous year, a rate
equivalent to the Fearnleys estimated growth rate for
seaborne trade measured in tons.
In 2008, dry cargo ton-miles increased by 5.5 per cent,
up from 5.3 per cent recorded in 2007. Ton-miles for the
5.0 per cent – down from a 7.0 per cent increase in 2007.
For the remaining dry cargoes (minor bulks and liner
mainly growth in volumes.
changes in the composition of trade, and a larger share of
trade in parts and components) and deeper international
a factor of three between 1970 and 2000, and expanded
by 43 per cent between 2000 and 2008. Rapid growth in
of some dynamic emerging developing economies, such
as China and India. Industrialization in these economies,
their fast-growing demand for raw materials required for
industrial production, and their desire to diversify sources
of supply have led these economies to tap into resources
situation and prospects, the outlook for ton-miles will
also depend on policies and measures affecting the
to promote energy security by switching to alternative
energies, promoting domestic production over imports,
and climate-change action favouring sourcing from
shorter distances or switching to cleaner fuel sources
etc.). Growth in world ton-miles will also likely be
fast-growing developing regions will likely become
much less dependent on the industrial or agricultural
sectors. Consumption needs in some economies may
consumption preferences. These structural changes are
likely to affect demand for maritime transport services
and maritime transport activity measured in ton-miles.
SECTORS OF WORLD SEABORNEC.
TRADE
1. Seaborne trade in crude oil and
petroleum products26
General developments affecting oil seaborne trade
In 2008, the oil seaborne trade was particularly affected
by developments in energy prices and markets, by the
environmental considerations, including global climate
change.
in the third quarter of 2008, as a result of reduced demand
demand for energy, owing to a reduction in production,
manufacturing and consumer demand for goods.
In 2008, energy consumption in developing economies
and countries with economies in transition continued
to grow, although at a slower pace, with consumption
remaining robust. While the outlook for 2009 and beyond
will depend on the extent and duration of the economic
Review of Maritime Transport, 200914
barrels per day (mbd) in 2009.
In 2008, global oil supply was not constrained, and
remained above 2007 levels with production growth
exceeding consumption growth due to increased
production by the Organization of Petroleum Exporting
Countries (OPEC). Increased production in OPEC
countries helped offset the fall in non-OPEC production,
In addition to developments affecting oil supply and
2007, oil prices, as illustrated by Brent spot prices,27
before crashing to a low of $33.73 pb in December 2008,
the tight balance between supply and demand and the
effect of increased speculation. Despite oil production
cuts announced by OPEC in October 2008, crude oil
prices continued to fall, with average crude oil prices
for 2008 nevertheless remaining higher than in 2007.
industry. Combined with the economic slowdown, the
relatively higher average oil prices implied higher import
2008. Prices for natural gas and coal followed similar
trajectories. During 2008, all types of primary energy
With the collapse in energy prices in the last part of 2008,
it must be taken into consideration that low oil prices
have the potential to provide disincentives to undertake
the much needed investments in energy-related
infrastructure and technology, and in alternative energy.
exploration and production, especially in the context
of the steady rise in the extraction and processing
costs associated with reservoir characteristics and
Year Oil Iron ore Coal Graina Five main
dry bulksb
Other dry
cargoes
World
totalCrude Products Crude plus
products
1970 5 597 890 6 487 1 093 481 475 2 049 2 118 10 654
1980 8 385 1 020 9 405 1 613 952 1 087 3 652 3 720 16 777
1990 6 261 1 029 7 290 1 978 1 849 1 073 5 259 3 891 16 440
2000 8 180 1 319 9 499 2 545 2 509 1 244 6 638 6 790 22 927
2001 8 074 1 345 9 419 2 575 2 552 1 322 6 782 6 930 23 131
2002 7 848 1 394 9 898 2 731 2 549 1 241 6 879 7 395 23 516
2003 8 390 1 460 9 850 3 035 2 810 1 273 7 118 7 810 25 124
2004 8 795 1 545 10 340 3 444 2 960 1 350 9 521 8 335 26 814
2005 8 875 1 652 10 527 3 918 3 113 1 686 9 119 8 730 28 376
2006 8 983 1 758 10 741 4 192 3 540 1 822 9 976 9 341 30 058
2007 9 214 1 870 11 084 4 544 3 778 1 927 10 676 9 665 31 425
2008 9 300 1 992 11 292 4 849 3 905 2 029 11 209 10 245 32 746
Table 5
World seaborne trade in ton-miles, selected years
(billions of ton-miles)
Source: Fearnleys Review, various issues.
a Includes wheat, maize, barley, oats, rye, sorghum and soya beans.
b Includes iron ore, coal, grain, bauxite/alumina and phosphate.
1 - Developments in International Seaborne Trade 15
Environmental considerations also often add to the end
is considered crucial to address the triple challenge of
meeting energy needs, environmental sustainability, and
economic growth and development. The International
Energy Outlook 2009
energy consumption to increase by 44 per cent between
2006 and 203028 (slower than the growth projected by
World Energy Outlook 2008). Total world
energy use is projected to grow by 17 per cent between
2006 and 2015, and by about 23 per cent between 2015
and 2030, with non-OECD economies accounting for
their importance for transportation. World consumption
of liquids and other petroleum is forecast to grow
from 85 mbd in 2006 and 107 mbd in 2030, with
unconventional liquids making up about 13 per cent of
total liquid production.
in 2010,29 all countries are expected to resume their
appetite for energy. However, the speed, scale and order
in 2030, about $26 trillion of infrastructure-related
pump units) will be needed. Given the current worldwide
will occur in 2009. Investment in oil and gas exploration
is expected to slide by 21 per cent or $100 billion in 2009,
as compared with 2008.30
production costs, new exploration projects are being
depleted, and with world economic growth expected to
pick up in 2010, oil prices have the potential to surge
again and disrupt the supply and demand balance.
The opportunity offered by the various stimulus packages,
one of the initiatives that could provide certain options
out of the current dilemma.31
Deal also has the potential to help reshape the future
landscape of oil supply and demand, as well as its trade
aims to revive the international economy and forge a new
global economic development that is environmentally
sustainable and supportive of the achievement of the
security and environmental sustainability is the
potential for renewable energy to supplement and/or
sectors continued to grow, despite the global economic
downturn. Projects continued to progress and much
economic stimulus legislation included components for
supporting renewable energy. Development assistance
for renewables in developing economies expanded,
support measures, such as subsidy programmes and new
32
energy investment increased by a factor of four since
capacity increased sixfold, while wind power capacity
increased 250 per cent, and total power capacity from
gains in small hydro, geothermal, and biomass power
new capacity investment, with $24 billion invested, or
20 per cent of total global investment, and overtook
Germany, the long-time wind power capacity leader.
capacity, moving up the ranks to become fourth in the
world. Developing economies, particularly India and
China, are increasingly playing a major role in both the
manufacture and installation of renewable energy.33
Oil production and consumption
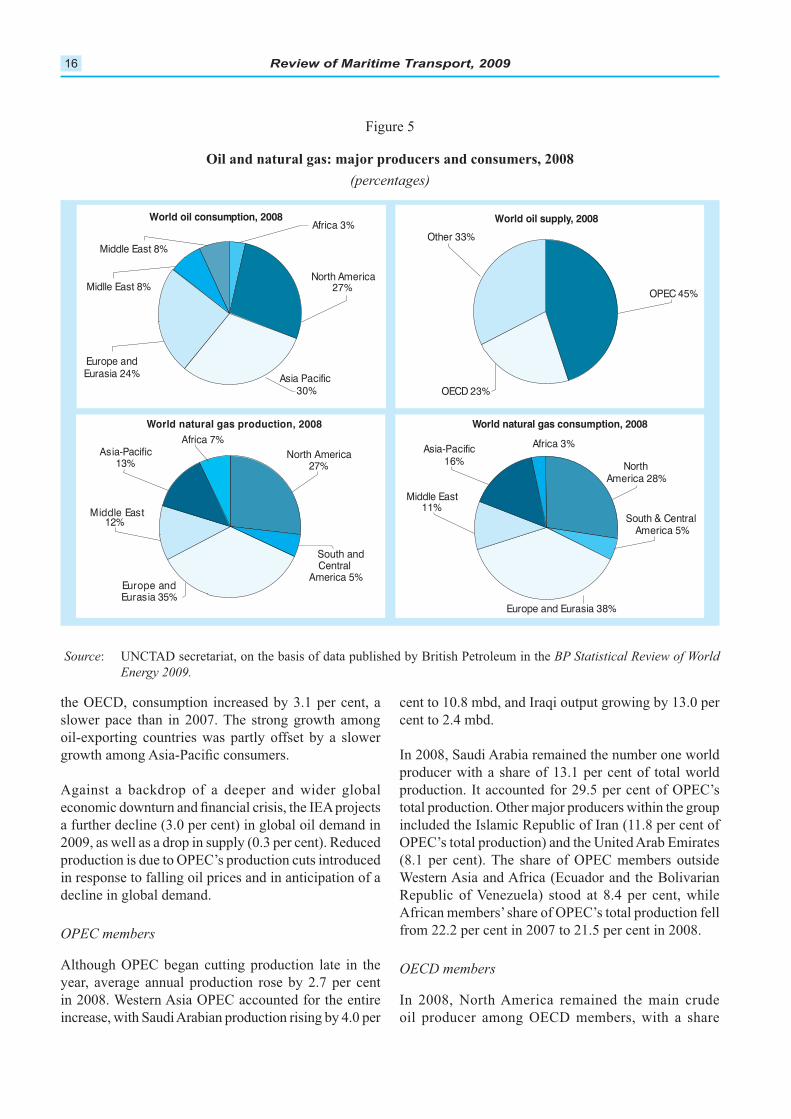
In 2008, global oil production34 increased by 0.4 per
cent (380,000 barrels per day) to reach 81.8 mbd. Oil
production in OECD countries fell by 4.0 per cent, with
a share of 22.5 per cent of global oil production. OPEC
countries increased production by 2.7 per cent, raising
their share in global oil production from 43.8 per cent
by 0.6 per cent to reach 84.4 mbd, the largest fall since
consumption in OECD countries fell by 3.2 per cent to
47.3 mbd, a third consecutive year of decline. Outside
Review of Maritime Transport, 200916
the OECD, consumption increased by 3.1 per cent, a
slower pace than in 2007. The strong growth among
oil-exporting countries was partly offset by a slower
a further decline (3.0 per cent) in global oil demand in
2009, as well as a drop in supply (0.3 per cent). Reduced
in response to falling oil prices and in anticipation of a
decline in global demand.
OPEC members
year, average annual production rose by 2.7 per cent
cent to 10.8 mbd, and Iraqi output growing by 13.0 per
cent to 2.4 mbd.
producer with a share of 13.1 per cent of total world
total production. Other major producers within the group
included the Islamic Republic of Iran (11.8 per cent of
(8.1 per cent). The share of OPEC members outside
Republic of Venezuela) stood at 8.4 per cent, while
from 22.2 per cent in 2007 to 21.5 per cent in 2008.
OECD members
oil producer among OECD members, with a share
Figure 5
Oil and natural gas: major producers and consumers, 2008
(percentages)
Source BP Statistical Review of World
Energy 2009.
World natural gas production, 2008
North America27%
South and Central
America 5%Europe andEurasia 35%
Middle East12%
Asia-Pacific13%
Africa 7%
World oil consumption, 2008
Asia Pacific30%
Africa 3%
North America27%
Europe andEurasia 24%
Midlle East 8%
Middle East 8%
World oil supply, 2008
OPEC 45%
OECD 23%
Other 33%
World natural gas consumption, 2008
NorthAmerica 28%
South & CentralAmerica 5%
Europe and Eurasia 38%
Africa 3%
Middle East11%
Asia-Pacific16%
1 - Developments in International Seaborne Trade 17
a drop in all relevant producers, namely Denmark, Italy,
Other producers
In 2008, the total production of non-OPEC and non-
OECD economies – including the Russian Federation,
China and Brazil – increased marginally by 0.7 per cent
over the previous year. With a total of 26.7 mbd, the
market share of these countries remained steady at 32.6 per
cent. The Russian Federation decreased production by
0.8 per cent, to 9.9 mbd. Other producers have either
In 2008, the total throughput of world refineries
dropped by 0.3 per cent to 75.2 mbd. OCED countries
in throughput was recorded in all
developed regions: throughput from
3.4 per cent, while that of Canada,
by 2.1 per cent, 0.2 per cent, 1.4 per
in 29 years, and the expansion of existing facilities in
the country has failed to keep pace with rising demand.
which holds a capacity of 0.6 mbd and is expected
although several of the projects have been held up due
to the deterioration of the economic situation. Current
tight economic conditions and lack of credit, combined
plans, suggest that the required investments may be
further deferred and may create a lag in supply when
the economy recovers and demand rebounds. In 2005,
to increase by 42 per cent to 118 mbp by 2030, and
that oil companies and Governments worldwide will
need to spend $487 billion between 2005 and 2030 to
keep pace with demand for products such as gasoline,
diesel and jet fuel.35 That being said, commentators also
argue that the large investments required to develop
The energy sector is close to bumping up against
supply constraints, and the gradual depletion of world
crude oil and the imminent “peak oil” (i.e. world oil
production has already started to decline or will soon
expansions unnecessary.
Crude oil shipments
In 2008, the share of tanker trade in the total world
seaborne trade amounted to 33.7 per cent. World
shipments of tanker cargoes reached 2.75 billion tons,
two thirds of which were crude oil. Crude oil seaborne
shipments increased by an estimated 1.1 per cent, to
and container trade sectors, tanker
markets fared relatively better,
up. The phasing out of single-hull
tankers in 2010 and the conversion
during the year of some tankers into
oil storage units helped moderate the incidence of an
oversupply of tonnage. However, the delivery schedule
supply and demand imbalance that will affect tanker
trade, with potential implications for freight rates and
earnings.
crude oil loading areas, with 758.9 million tons. Other
loading areas included,
(131.5 million tons),
tons).
(133.0 million tons). With demand for oil expected to
remain robust in developing regions, namely in China,
Crude oil seaborne shipments
increased by an estimated
1.1 per cent.
Review of Maritime Transport, 200918
capacity resulting from the economic downturn would
be absorbed by this new additional demand.
Shipments of petroleum products
In 2008, world shipments of petroleum products are
estimated to have increased by 2.7 per cent, to reach
915.3 million tons. Developed regions accounted for
41.0 per cent of world petroleum products loaded, and
56.1 per cent of world petroleum products unloaded.
Developing economies accounted for 55.3 per cent
of world products loaded and 43.4 per cent of world
products unloaded. Economies in
transition accounted for the balance.
wider international environment,
including the performance of the
world economy, such demand
remains particularly subject to unforeseen events,
including natural disasters and weather-related
incidents.
high stock levels brought about by lower oil prices (the
capacity provide a good indication of the challenges that
lie ahead for petroleum products trade.
Natural gas production and consumption
In 2008, world production of natural gas increased by
3.8 per cent over the previous year, to reach 3,065.6 billion
cubic metres (bcm). The Russian Federation remained
share of 19.3 per cent. Other producers included Canada
(5.7 per cent), the Islamic Republic of Iran (3.8 per cent),
During the same year, world natural gas consumption
increased by 2.5 per cent, to reach 3,018.7 bcm. The
the main natural gas consumers, with market shares of
22.0 per cent and 13.9 per cent respectively. Other major
consumers included the Islamic Republic of Iran (3.9 per
The natural gas sector also went through two distinct
phases: a tight supply and demand balance with rising
energy prices, followed by a weakening demand and a
plummeting of spot prices. The combination of weak
demand and lower prices could undermine future
investments.
mix of developed and developing
economies, namely France, India,
in developing regions, with Qatar
being the largest (17.5 per cent).
number of liquefaction projects suffering from delays
projects is delayed and the relevant cargo is not available
for carriage. However, the world is now experiencing a
major reversal of the situation: a boom in supply is being
met with falling demand.
million tons per year of new liquefaction capacity are
project coming on stream in 2009. It is estimated that
once all the projects that were delayed in 2008 come
capacity will be online and will boost existing capacity
2008 had also suffered from the economic downturn and
a suppressed demand, especially for electricity usage.
impact on gas prices. For example, it was reported that
In 2008, world shipments
of petroleum products are
estimated to have increased
by 2.7 per cent ...
1 - Developments in International Seaborne Trade 19
75 per cent.36
2. Dry cargo shipments37
General developments
Dry bulk trade, the mainstay of the boom experienced
by the shipping industry over the past few years,
slowed down in 2008 (with a 4.7 per cent growth rate
as compared to 5.7 per cent in 2007) and is forecast to
fall by more than 4.4 per cent in 2009. The total volume
of dry bulk cargoes loaded in 2008 stood at 5.4 billion
tons. These shipments accounted for 66.3 per cent of total
world goods loaded. Trade in the major dry bulks (iron
ore, coal, grains, bauxite/alumina and rock phosphate)
was estimated at 2.1 billion tons. The difference was
made up of minor bulks and liner cargoes, which together
were estimated at 3.3 billion tons. Figures 6 (a) and (b)
present an overview of the major players involved in
the production, consumption and trade of some major
dry bulks.
The collapse that started in the fourth quarter of 2008
has been more readily visible in the dry bulk sector. The
Baltic Dry Index fell sharply, and average earnings for
bulk carriers in October 2008 were 80 per cent lower
driver of the slowdown in 2008 and the projected slump
of 2009 relate to steel production cuts in all-major steel
for the bulk shipping market as it determines the demand
for raw materials such as iron ore and coal and the
need for larger bulkers (e.g. capesize ships). In 2008,
sector in China reached a plateau, and as developers
sector show some resilience in the face of falling demand
bulk carrier market. In 2008, deliveries of bulk carriers
were modest compared to tankers and container ships.
by way of cancellations or conversions into other ship
types, although empirical evidence has shown that there
negotiations with the yards have focused on delaying the
delivery of vessels so as to limit the impact the supply
side will have in 2009–2011 (see chapter 2 for more
details). With projected fall in dry bulk volumes and
growth in bulker tonnage capacity, the short- to medium-
term outlook for the dry bulk sector looks challenging.
World crude steel production and consumption
In 2008, world steel production declined by 1.2 per cent,
nearly all major steel-producing economies, including
China producing more than 500 million tons in one
year – a 2.6 per cent increase over 2007. The Republic
of Korea and India expanded their production too, at
– accounting for 10 per cent of world steel output, the
cent and in Europe by 30 per cent. The company made
temporary production cuts totalling up to 45 per cent
of global production capacity in order to accelerate
inventory reduction, and it has also paused growth
plans for the immediate future.38
collectively decrease active production by 20 per cent
in 2009.39
Production of ferrous scrap, which averages 300 million
tons per year globally, is also affected by the economic
downturn.40
prices were at historic highs, after which demand and
prices for steel products began to decline, followed by
began cancelling orders, which may lead to a scrap steel
oversupply of more than 5 million tons in ports, ships
industry from $200 to $20 per ton.
World steel consumption fell by 0.3 per cent in 2008,
bringing the total to 1.2 billion tons. China continued
8.3 per cent and 3.5 per cent respectively.
Reflecting the global economic context and the
geographical spread of the financial and economic
downturn to developing regions, world steel consumption
is expected to fall by 14.9 per cent in 2009. The economic
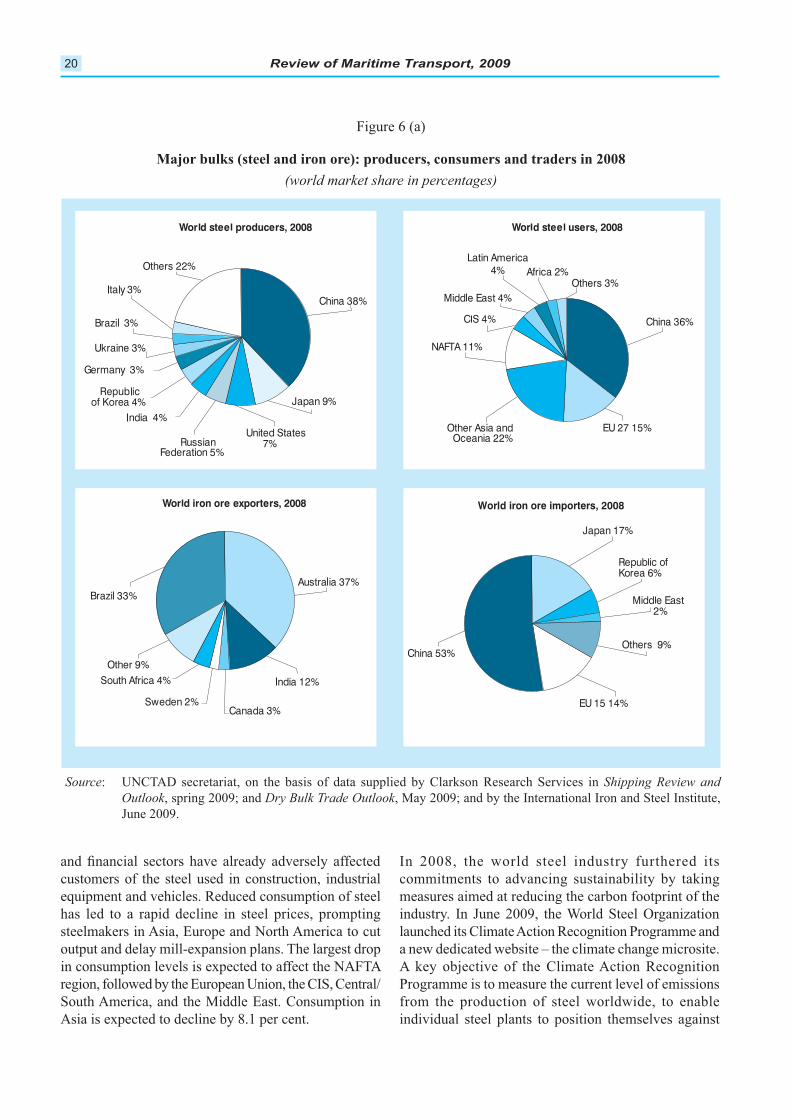
Review of Maritime Transport, 200920
customers of the steel used in construction, industrial
equipment and vehicles. Reduced consumption of steel
has led to a rapid decline in steel prices, prompting
output and delay mill-expansion plans. The largest drop
In 2008, the world steel industry furthered its
commitments to advancing sustainability by taking
measures aimed at reducing the carbon footprint of the
a new dedicated website – the climate change microsite.
Programme is to measure the current level of emissions
from the production of steel worldwide, to enable
individual steel plants to position themselves against
Source Shipping Review and
Outlook Dry Bulk Trade Outlook
Figure 6 (a)
Major bulks (steel and iron ore): producers, consumers and traders in 2008
(world market share in percentages)
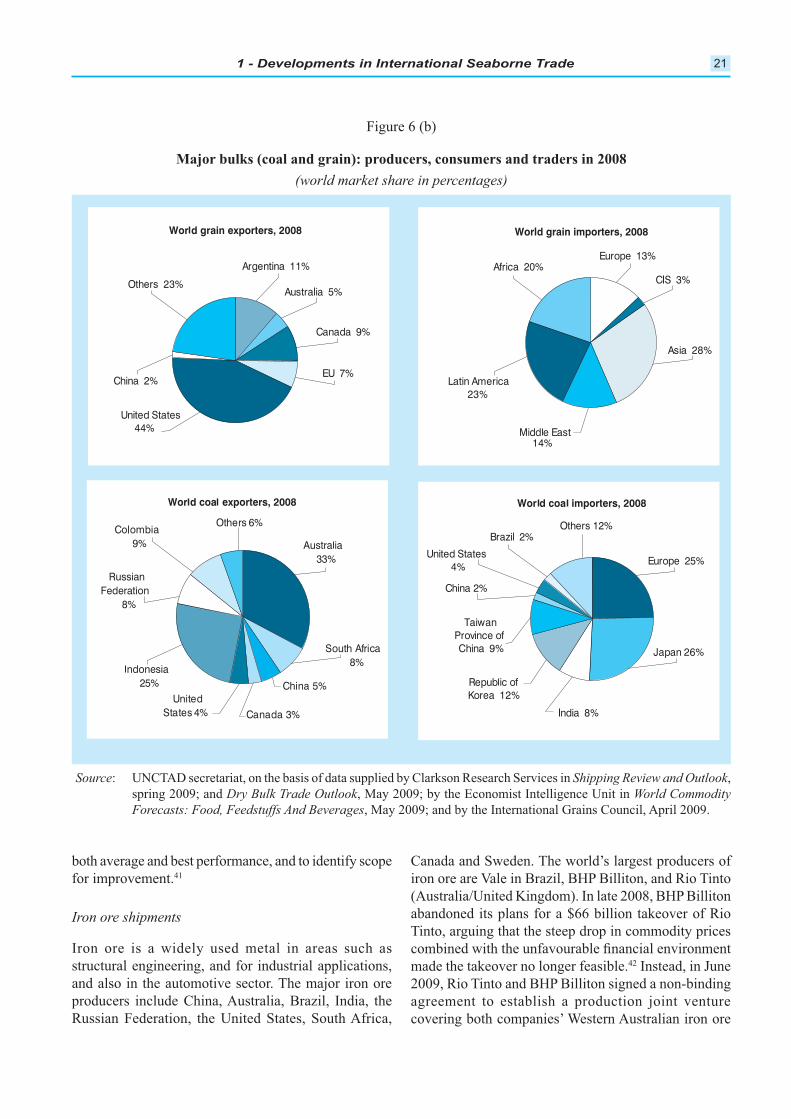
1 - Developments in International Seaborne Trade 21
both average and best performance, and to identify scope
for improvement.41
Iron ore shipments
Iron ore is a widely used metal in areas such as
structural engineering, and for industrial applications,
and also in the automotive sector. The major iron ore
iron ore are Vale in Brazil, BHP Billiton, and Rio Tinto
abandoned its plans for a $66 billion takeover of Rio
Tinto, arguing that the steep drop in commodity prices
made the takeover no longer feasible.42
2009, Rio Tinto and BHP Billiton signed a non-binding
agreement to establish a production joint venture
Figure 6 (b)
Major bulks (coal and grain): producers, consumers and traders in 2008
(world market share in percentages)
Source Shipping Review and Outlook,
Dry Bulk Trade Outlook World Commodity
Forecasts: Food, Feedstuffs And Beverages
Review of Maritime Transport, 200922
assets. The joint venture will encompass all current and
43
844 million tons in 2008, an increase of 6.5 per cent over
2007. While many exporters increased their volumes in
accounted for over two thirds of world iron ore exports.
iron ore exporter, increasing its volumes by 16.0 per
cent to reach 309.5 million tons. Exports from Brazil
amounted to 281.7 million tons, an increase of 4.6 per
cent over 2007. The balance of world iron ore exports
Peru (6.9 million tons).
With 444.1 million tons unloaded in Chinese ports in
2008, China remained the main destination for world
iron ore shipments. Its imports grew at a slightly slower
rate than in 2007 (16.0 per cent). Other major importers
increase), and Western Europe with 127.5 million tons
as the Republic of Korea, recorded increases of 3.3 per
cent, while others, such as Taiwan Province of China,
and Pakistan, recorded a decline in their imports. Iron ore
imports into India and the Philippines remained steady
3.3 per cent and 18.7 per cent respectively.
the collapse experienced in the second half make 2008
a year of two parts: a prosperous part and a poor part.
Before the end of 2008, major iron miners saw iron
iron producers and exporters, including in Brazil, have
already cut or are planning to cut production.44
ore trade volumes to remain steady in 2009 and to grow
rapidly (16 per cent) in 2010, driven mainly by expected
growth in China.45
Coal production and consumption
Coal is a fossil fuel energy source which is much more
coal remaining worldwide. Different types of coal have
coal – is mainly used in power generation. Coking
coal – also known as metallurgical coal – is mainly
used in steel production. Other important users of coal
chemical products can be made from the by-products
chemicals such as creosote oil, naphthalene, phenol and
benzene.
In 2008, world coal production increased by 5.3 per cent,
reaching 3,324.9 million tons oil equivalent (mtoe), with
much of global coal production being used in the country
largest producer, with a share of 42.5 per cent, followed
(4.6 per cent), India (5.8 per cent) and Indonesia (4.2 per
cent).
In 2008, global coal consumption slowed, rising by just
growing fuel in the world for the sixth consecutive year.
cent share) – increased its consumption by 6.8 per cent.
While below the 10-year average, this growth rate was
Consumption growth outside China was negligible
(0.6 per cent) with growth rates below the 10-year
3.3 per cent and 4.0 per cent respectively.
Coal mining raises a number of environmental
challenges, including soil erosion, dust, noise pollution,
water pollution, and impacts on local biodiversity.
However, the most important challenge facing the coal
industry and the international community is how to
reconcile the growing use of coal with climate change
industry is committed to minimizing its greenhouse
gas emissions and action is being taken in a number of
reduce global greenhouse gas emissions by 5.5 per
cent. Carbon capture and storage technology is being
considered as a potential solution that could offer deep
while maintaining the energy infrastructure needed for
growth.46
1 - Developments in International Seaborne Trade 23
World coal shipments
In 2008, coal shipments were estimated to have reached
814.5 million tons, a volume increase of 3.2 per cent over
rate is half the growth rate recorded in 2007. Thermal
coal exports were estimated at 590.1 million tons,
representing 72.4 per cent of world coal shipments,
while coking coal shipments increased by 4.1 per cent
to reach 224.4 million tons.
coal exporter. In 2008, Indonesia increased its thermal
coal exports by 6.1 per cent to reach 200 million tons.
Other major thermal coal exporters in 2008 included
tons), China (35.8 million tons), the Russian Federation
(60.4 million tons) and the Bolivarian Republic of
Venezuela (6.2 million tons).
coal exporter, with a total of 136.9 million tons, a
fall of 0.5 per cent over 2007. Other lesser exporters,
such as Canada, have also recorded a decline in their
main destinations of both types of coal exports (thermal
imports in 2008. In 2008, thermal coal imports into China
fell by 11.0 per cent, while imports into the Republic of
Korea increased by 18.2 per cent.
Coal shipments are forecast to decline by 2.3 per cent in
2009. The coking coal trade is forecast to drop by 6.4 per
cent in 2009. Thermal coal shipments are also likely
to be negatively affected, as industrial production cuts
have the effect of impacting on electricity consumption.
Reduced demand for coal and the expected growth in
ship carrying capacity are likely to negatively affect
Grain market
production of grain (wheat and coarse grain) increased
from 1,588 million tons in 2007 to 1,697 million tons
in 2008. World wheat production increased by 6.5 per
cent, as farmers increased planted areas in response to
In 2008, world grain shipments are estimated to have
grown by 5.6 per cent, reaching 323.3 million tons.
Wheat totalled about 110 million tons, while coarse
grains such as corn, barley, soybeans, sorghum, oats, rye
and millet totalled 213.3 million tons. In 2008, Canada
world grain exports (excluding soybean). Export growth
their export volumes.
(excluding soybean) with 67.5 million tons, followed
by far the largest importer (with a 9.8 per cent share in
2008), reduced its grain imports by 5.3 per cent. Overall,
in Europe.
Trade in grain is expected to decline in both 2009
a decline in coarse grain exports. Improved weather
conditions in some grain importing countries mean that
shortages in those regions will no longer need to be met
by imports.
economic crises, 2008 witnessed the eruption of a global
food crisis which resulted in high and dramatically
increasing prices of food, shortages and declining food
hungry, up 11.0 per cent from 915 million in 2008. To
put things in context: one in six people in the world. In
addition to the direct effect on incomes and employment,
Review of Maritime Transport, 200924
47
The food crisis highlighted the vulnerability of
unfavourably with other regions, and has not seen
and productivity per worker have both remained low,
whereas in other regions they have increased.48 Of
the 36 countries worldwide currently facing a food
It is estimated that doubling the productivity of food
with food prices that were 20–40 per cent lower.49
The World Bank estimates that demand for food will
have risen by 50 per cent in 2030, as a result of rising
growing food demand will require major investment
in the agricultural sectors of developing economies,
the demand for maritime transport services, ship tonnage
capacity, and port handling equipment, and potentially a
change in the geography of trade. Pending the requisite
investments and productivity gains in the agricultural
imports and emerge as a world exporter of grains and
other agricultural-based food products.
Other bulk shipments
other areas (6 per cent). In 2008,
world trade of bauxite and alumina
was estimated to have reached
83.5 million tons. During the same
year, major loading areas of bauxite
(12.2 per cent). The main importing areas are Europe
alone contributed 14.0 per cent. Other loading areas span
largest alumina importer, followed by other developed
The largest sedimentary deposits of phosphate rock are
shipments, the bulk of which was exported to Europe
40 per cent of world exports. High phosphate rock prices
have renewed the interest in exploiting the offshore
The minor dry bulks (manufactures, agribulks, metals
and minerals) were estimated to have remained at
and oilseed) and metals and minerals (e.g. scrap) each
increased by a meager 1.0 per cent, while manufactures
(e.g. steel products) dropped marginally (-1.0 per cent).
Trade in steel products accounted for 60.1 per cent of
this total, and unlike forest products, fell by 1.2 per cent
decline by 5.0 per cent in 2009 and grow again by 4.0
per cent in 2010.50
3. Liner shipments of containerized
cargoes51
The balance of 2.32 billion tons of dry cargoes included
cargo carried in containers along the three major east–
(1.3 billion tons), an increase of
5.4 per cent over the previous year.52
Over the last two decades, global
container trade is estimated to have
grown at an average annual rate
of about 10 per cent. The share of
total dry cargo increased from
5.1 per cent in 1980 to 25.4 per cent in 2008. The value
of world maritime container trade grew from $2 trillion
in 2001 to $4 trillion in 2008 accounting for around
one in every $14 of global economic output.53
earnings, the shipping industry responded by investing
in larger and more sophisticated container ships and
In 2008, the world total of
containerized trade was
estimated at 137 million TEUs
(1.3 billion tons), an increase
of 5.4. per cent over the
previous year.
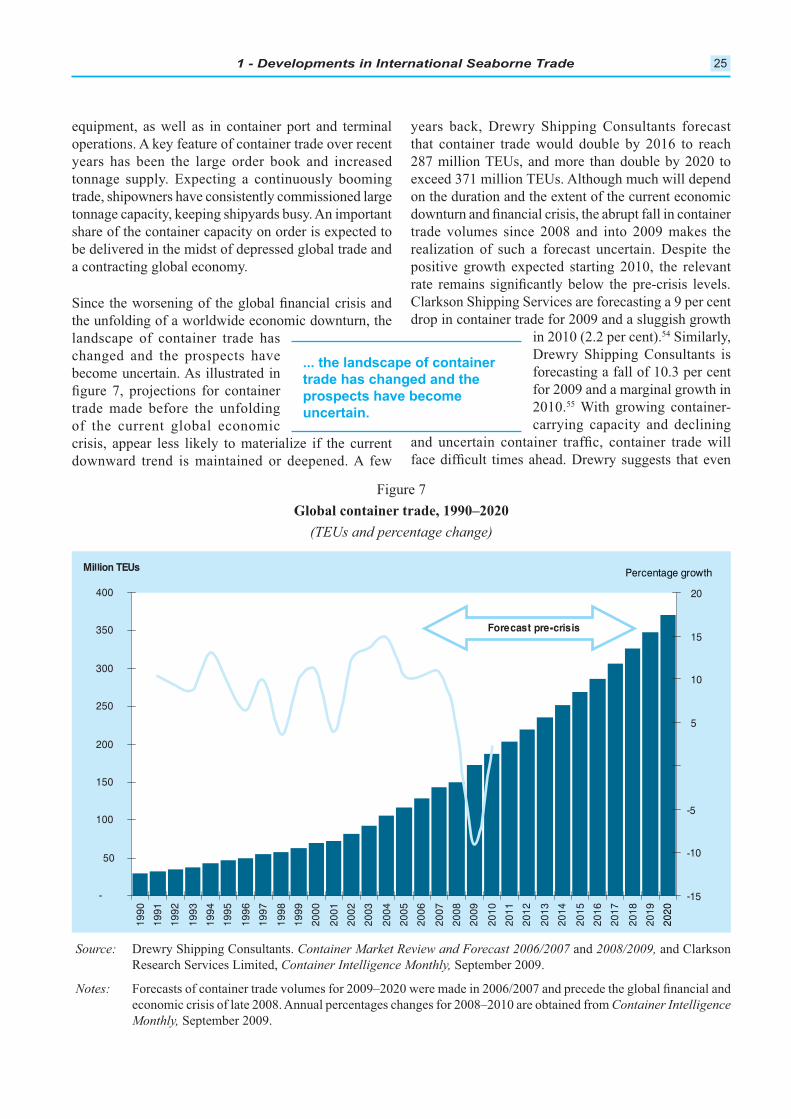
1 - Developments in International Seaborne Trade 25
equipment, as well as in container port and terminal
years has been the large order book and increased
tonnage supply. Expecting a continuously booming
trade, shipowners have consistently commissioned large
share of the container capacity on order is expected to
be delivered in the midst of depressed global trade and
a contracting global economy.
the unfolding of a worldwide economic downturn, the
landscape of container trade has
changed and the prospects have
trade made before the unfolding
of the current global economic
crisis, appear less likely to materialize if the current
that container trade would double by 2016 to reach
on the duration and the extent of the current economic
trade volumes since 2008 and into 2009 makes the
realization of such a forecast uncertain. Despite the
positive growth expected starting 2010, the relevant
drop in container trade for 2009 and a sluggish growth
in 2010 (2.2 per cent).54
forecasting a fall of 10.3 per cent
for 2009 and a marginal growth in
2010.55 With growing container-
carrying capacity and declining
Figure 7
Global container trade, 1990–2020
(TEUs and percentage change)
Source: Container Market Review and Forecast 2006/2007 and 2008/2009, and Clarkson
Container Intelligence Monthly,
Notes:
Container Intelligence
Monthly,
... the landscape of container
trade has changed and the
prospects have become
uncertain.
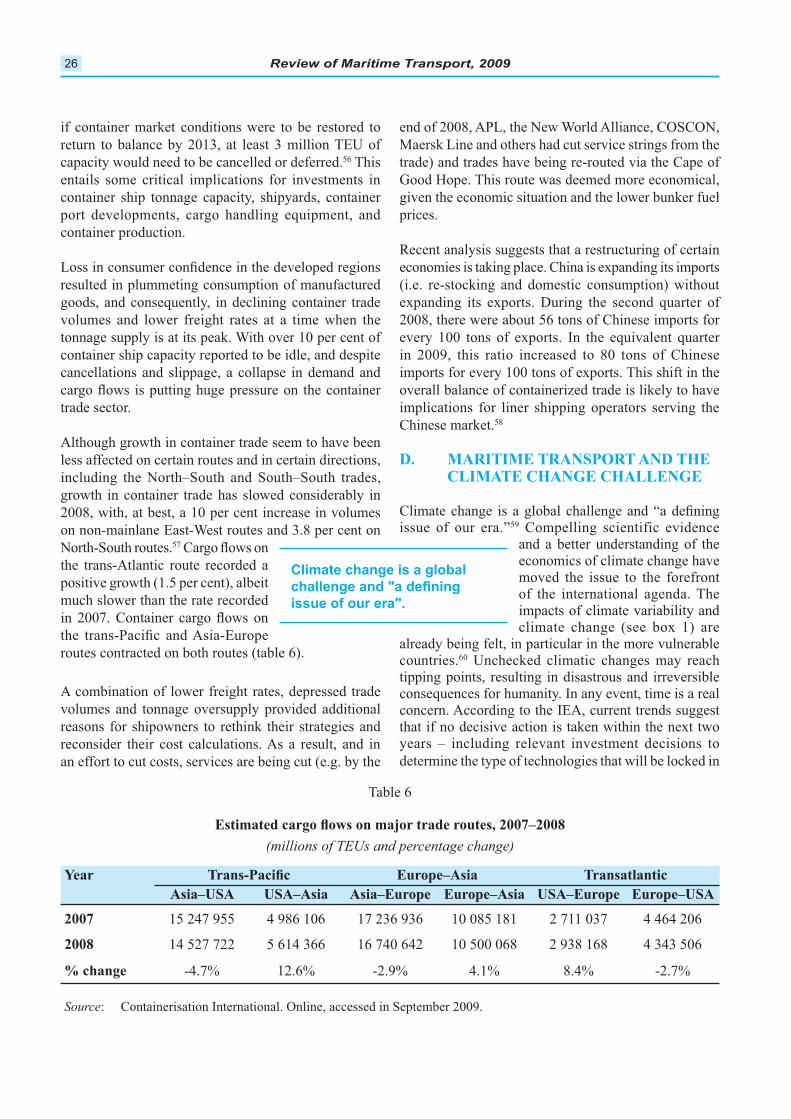
Review of Maritime Transport, 200926
Year Europe–Asia Transatlantic
Asia–USA USA–Asia Asia–Europe Europe–Asia USA–Europe Europe–USA
2007 15 247 955 4 986 106 17 236 936 10 085 181 2 711 037 4 464 206
2008 14 527 722 5 614 366 16 740 642 10 500 068 2 938 168 4 343 506
% change -4.7% 12.6% -2.9% 4.1% 8.4% -2.7%
Table 6
(millions of TEUs and percentage change)
Source
if container market conditions were to be restored to
capacity would need to be cancelled or deferred.56 This
entails some critical implications for investments in
container ship tonnage capacity, shipyards, container
port developments, cargo handling equipment, and
container production.
resulted in plummeting consumption of manufactured
goods, and consequently, in declining container trade
volumes and lower freight rates at a time when the
tonnage supply is at its peak. With over 10 per cent of
container ship capacity reported to be idle, and despite
cancellations and slippage, a collapse in demand and
trade sector.
less affected on certain routes and in certain directions,
growth in container trade has slowed considerably in
2008, with, at best, a 10 per cent increase in volumes
on non-mainlane East-West routes and 3.8 per cent on 57
positive growth (1.5 per cent), albeit
much slower than the rate recorded
routes contracted on both routes (table 6).
volumes and tonnage oversupply provided additional
reasons for shipowners to rethink their strategies and
an effort to cut costs, services are being cut (e.g. by the
trade) and trades have being re-routed via the Cape of
Good Hope. This route was deemed more economical,
given the economic situation and the lower bunker fuel
prices.
Recent analysis suggests that a restructuring of certain
economies is taking place. China is expanding its imports
(i.e. re-stocking and domestic consumption) without
expanding its exports. During the second quarter of
2008, there were about 56 tons of Chinese imports for
every 100 tons of exports. In the equivalent quarter
in 2009, this ratio increased to 80 tons of Chinese
imports for every 100 tons of exports. This shift in the
overall balance of containerized trade is likely to have
implications for liner shipping operators serving the
Chinese market.58
MARITIME TRANSPORT AND THE D.CLIMATE CHANGE CHALLENGE
issue of our era.”59 Compelling scientific evidence and a better understanding of the economics of climate change have moved the issue to the forefront of the international agenda. The impacts of climate variability and climate change (see box 1) are
already being felt, in particular in the more vulnerable countries.60
tipping points, resulting in disastrous and irreversible consequences for humanity. In any event, time is a real
that if no decisive action is taken within the next two years – including relevant investment decisions to
determine the type of technologies that will be locked in
Climate change is a global
issue of our era".
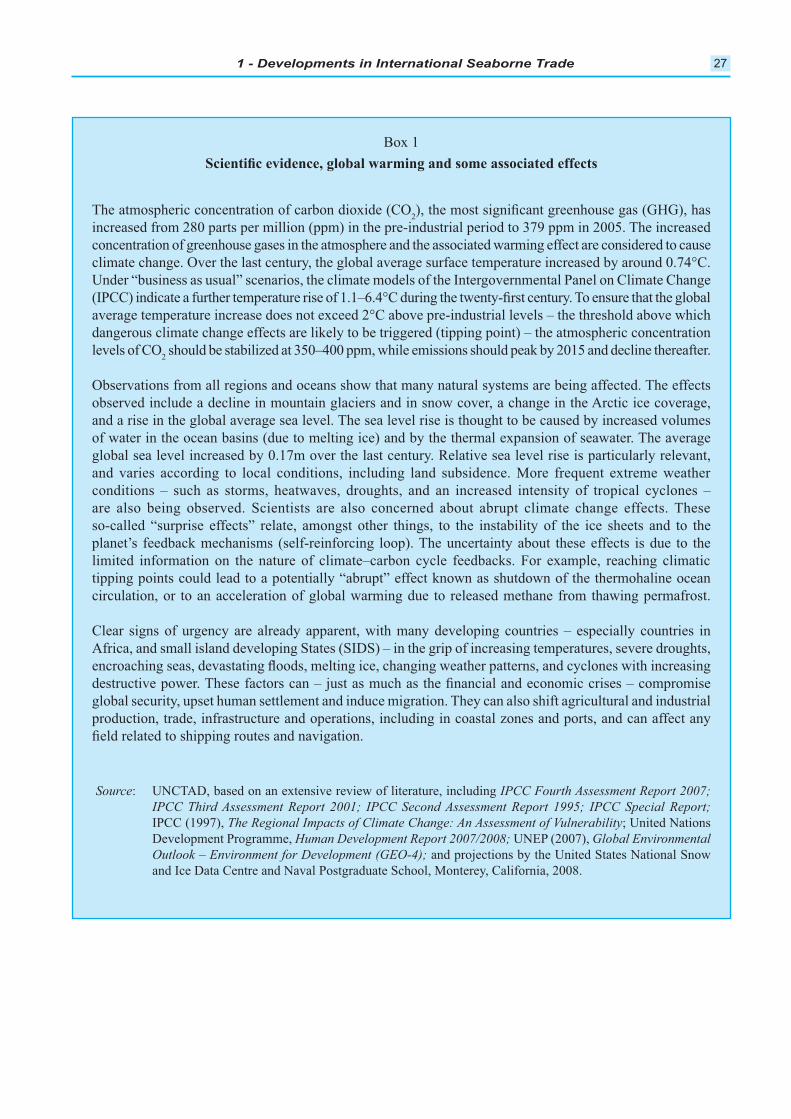
1 - Developments in International Seaborne Trade 27
Box 1
The atmospheric concentration of carbon dioxide (CO2
increased from 280 parts per million (ppm) in the pre-industrial period to 379 ppm in 2005. The increased
concentration of greenhouse gases in the atmosphere and the associated warming effect are considered to cause
climate change. Over the last century, the global average surface temperature increased by around 0.74°C.
average temperature increase does not exceed 2°C above pre-industrial levels – the threshold above which
dangerous climate change effects are likely to be triggered (tipping point) – the atmospheric concentration
levels of CO2 should be stabilized at 350–400 ppm, while emissions should peak by 2015 and decline thereafter.
Observations from all regions and oceans show that many natural systems are being affected. The effects
and a rise in the global average sea level. The sea level rise is thought to be caused by increased volumes
of water in the ocean basins (due to melting ice) and by the thermal expansion of seawater. The average
global sea level increased by 0.17m over the last century. Relative sea level rise is particularly relevant,
conditions – such as storms, heatwaves, droughts, and an increased intensity of tropical cyclones –
so-called “surprise effects” relate, amongst other things, to the instability of the ice sheets and to the
limited information on the nature of climate–carbon cycle feedbacks. For example, reaching climatic
tipping points could lead to a potentially “abrupt” effect known as shutdown of the thermohaline ocean
circulation, or to an acceleration of global warming due to released methane from thawing permafrost.
Clear signs of urgency are already apparent, with many developing countries – especially countries in
global security, upset human settlement and induce migration. They can also shift agricultural and industrial
production, trade, infrastructure and operations, including in coastal zones and ports, and can affect any
Source IPCC Fourth Assessment Report 2007;
IPCC Third Assessment Report 2001; IPCC Second Assessment Report 1995; IPCC Special Report;
IPCC (1997), The Regional Impacts of Climate Change: An Assessment of Vulnerability
Development Programme, Human Development Report 2007/2008; Global Environmental
Outlook – Environment for Development (GEO-4);
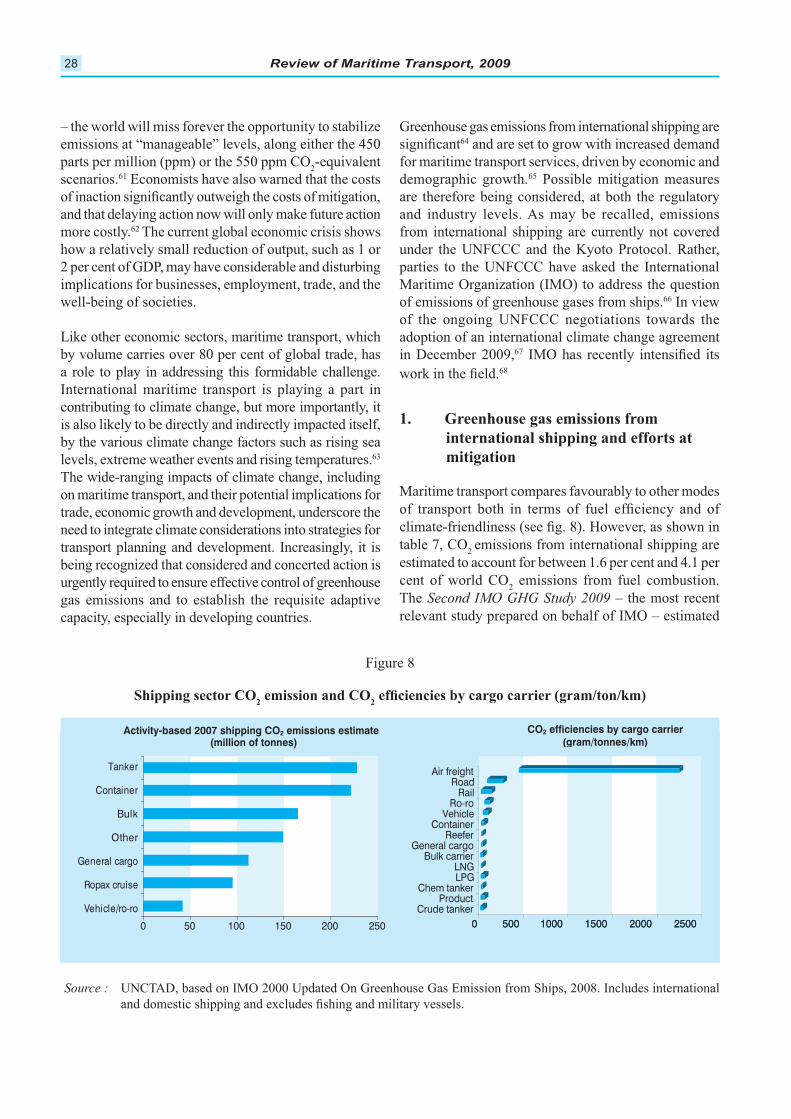
Review of Maritime Transport, 200928
– the world will miss forever the opportunity to stabilize
emissions at “manageable” levels, along either the 450
parts per million (ppm) or the 550 ppm CO2-equivalent
scenarios.61 Economists have also warned that the costs
and that delaying action now will only make future action
more costly.62 The current global economic crisis shows
how a relatively small reduction of output, such as 1 or
2 per cent of GDP, may have considerable and disturbing
implications for businesses, employment, trade, and the
well-being of societies.
by volume carries over 80 per cent of global trade, has
a role to play in addressing this formidable challenge.
International maritime transport is playing a part in
contributing to climate change, but more importantly, it
is also likely to be directly and indirectly impacted itself,
by the various climate change factors such as rising sea
levels, extreme weather events and rising temperatures.63
The wide-ranging impacts of climate change, including
on maritime transport, and their potential implications for
trade, economic growth and development, underscore the
need to integrate climate considerations into strategies for
transport planning and development. Increasingly, it is
being recognized that considered and concerted action is
urgently required to ensure effective control of greenhouse
gas emissions and to establish the requisite adaptive
capacity, especially in developing countries.
Greenhouse gas emissions from international shipping are 64 and are set to grow with increased demand
for maritime transport services, driven by economic and
demographic growth.65 Possible mitigation measures
are therefore being considered, at both the regulatory
from international shipping are currently not covered
of emissions of greenhouse gases from ships.66 In view
adoption of an international climate change agreement
in December 2009,67
68
1. Greenhouse gas emissions from
international shipping and efforts at
mitigation
table 7, CO2emissions from international shipping are
estimated to account for between 1.6 per cent and 4.1 per
cent of world CO2 emissions from fuel combustion.
The Second IMO GHG Study 2009 – the most recent
Figure 8
Shipping sector CO2 emission and CO
2
Activity-based 2007 shipping CO2 emissions estimate (million of tonnes)
CO2 efficiencies by cargo carrier(gram/tonnes/km)
0 50 100 150 200 250
Vehicle/ro-ro
Ropax cruise
General cargo
Other
Bulk
Container
Tanker
00 500500 10001000 15001500 20002000 25002500Crude tanker
ProductChem tanker
LPGLNG
Bulk carrierGeneral cargo
ReeferContainer
VehicleRo-ro
RailRoad
Air freight
Source :
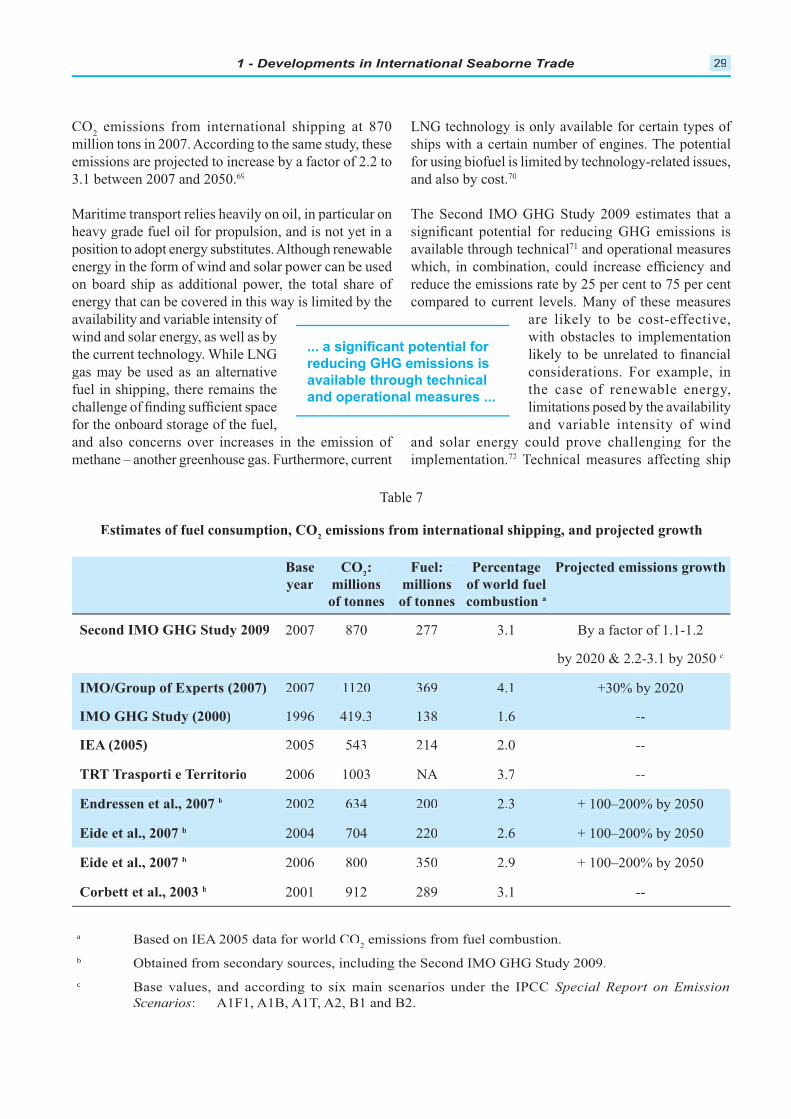
1 - Developments in International Seaborne Trade 292929292929
CO2
emissions from international shipping at 870
emissions are projected to increase by a factor of 2.2 to
3.1 between 2007 and 2050.69
oil, in particular on
heavy grade fuel oil for propulsion, and is not yet in a
energy in the form of wind and solar power can be used
on board ship as additional power, the total share of
energy that can be covered in this way is limited by the
availability and variable intensity of
wind and solar energy, as well as by
gas may be used as an alternative
fuel in shipping, there remains the
for the onboard storage of the fuel,
and also concerns over increases in the emission of
methane – another greenhouse gas. Furthermore, current
ships with a certain number of engines. The potential
for using biofuel is limited by technology-related issues,
and also by cost.70
available through technical71 and operational measures
reduce the emissions rate by 25 per cent to 75 per cent
are likely to be cost-effective,
with obstacles to implementation
considerations. For example, in
the case of renewable energy,
limitations posed by the availability
and variable intensity of wind
and solar energy could prove challenging for the
implementation.72 Technical measures affecting ship
reducing GHG emissions is
available through technical
and operational measures ...
a2
emissions from fuel combustion.
b
c Base values, and according to six main scenarios under the IPCC Special Report on Emission
Scenarios
BaseBase
yearyear
COCO22: :
millionsmillions
of tonnesof tonnes
Fuel: Fuel:
millionsmillions
of tonnesof tonnes
PercentagePercentage
of world fuel of world fuel
combustioncombustion aa
Projected emissions growthProjected emissions growth
Second IMO GHG Study 2009 2007 870 277 3.1 By a factor of 1.1-1.2
by 2020 & 2.2-3.1 by 2050 c
IMO/Group of Experts (2007)IMO/Group of Experts (2007) 20072007 11201120 369369 4.14.1 +30% by 2020+30% by 2020
IMO GHG Study (2000)IMO GHG Study (2000) 19961996 419.3419.3 138138 1.61.6 ----
IEA (2005) 2005 543 214 2.0 --
TRT Trasporti e Territorio 2006 1003 NA 3.7 --
Endressen et al., 2007Endressen et al., 2007 bb 20022002 634634 200200 2.32.3 + 100–200% by 2050+ 100–200% by 2050
Eide et al., 2007 Eide et al., 2007 bb 20042004 704704 220220 2.62.6 + 100–200% by 2050+ 100–200% by 2050
Eide et al., 2007 b 2006 800 350 2.9 + 100–200% by 2050
Corbett et al., 2003 b 2001 912 289 3.1 --
Table 7
Estimates of fuel consumption, CO2 emissions from international shipping, and projected growth
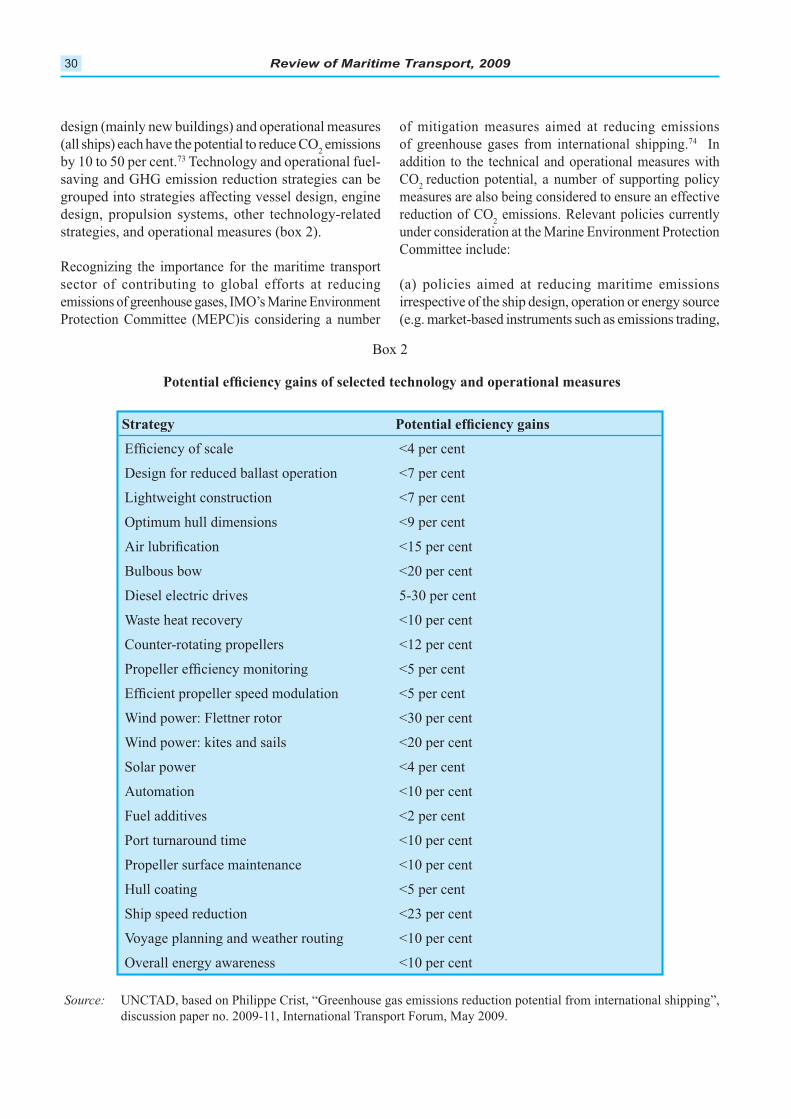
Review of Maritime Transport, 200930
Box 2
Strategy
<4 per cent
Design for reduced ballast operation <7 per cent
<7 per cent
Optimum hull dimensions <9 per cent
<15 per cent
Bulbous bow <20 per cent
Diesel electric drives 5-30 per cent
Waste heat recovery <10 per cent
Counter-rotating propellers <12 per cent
<5 per cent
<5 per cent
Wind power: Flettner rotor <30 per cent
Wind power: kites and sails <20 per cent
<4 per cent
<10 per cent
Fuel additives <2 per cent
Port turnaround time <10 per cent
Propeller surface maintenance <10 per cent
Hull coating <5 per cent
<23 per cent
Voyage planning and weather routing <10 per cent
Overall energy awareness <10 per cent
Source:
design (mainly new buildings) and operational measures
(all ships) each have the potential to reduce CO2 emissions
by 10 to 50 per cent.73 Technology and operational fuel-
saving and GHG emission reduction strategies can be
grouped into strategies affecting vessel design, engine
design, propulsion systems, other technology-related
strategies, and operational measures (box 2).
Recognizing the importance for the maritime transport
sector of contributing to global efforts at reducing
of mitigation measures aimed at reducing emissions
of greenhouse gases from international shipping.74 In
addition to the technical and operational measures with
CO2
reduction potential, a number of supporting policy
measures are also being considered to ensure an effective
reduction of CO2 emissions. Relevant policies currently
Committee include:
(a) policies aimed at reducing maritime emissions
irrespective of the ship design, operation or energy source
(e.g. market-based instruments such as emissions trading,
1 - Developments in International Seaborne Trade 31
an emissions levy or an international compensation
(b) policies aimed at improving the operational fuel
such as the mandatory the EEOI limit, mandatory
such as voluntary agreements to improve EEOI and to
and-control instruments such as the mandatory EEDI
voluntary agreement to improve EEDI and voluntary
(d) policies aimed at reducing fuel life-cycle carbon
emissions, such as policies that favour the use of natural
gas or biofuels (e.g. market-based instruments such
as a differentiated levy, and command-and-control
instruments such as a fuel life-cycle carbon emissions
standard and a biofuel standard).
While market-based instruments are likely to be cost-
effective policy instruments with high environmental
effectiveness,75 there remains the need to improve
understanding of the respective merits of different
options and to assess the potential
implications of the proposed
mitigation measures for global
trade and market distortions,
especially regarding the trade
and development of developing
countries.76 There also remains the
question of how best to reconcile
the principle of common but
differentiated responsibilities
principle of uniform application/obligations under the 77
2. Adaptation requirements and funding
While international maritime transport contributes to
global greenhouse gas emissions, it is important to
note that maritime transport systems are also likely to
be directly and indirectly impacted by various climate
change factors such as rising sea levels, extreme weather
events and rising temperatures. The type, range and
magnitude of impacts will vary according to local
conditions, transportation systems, designs and policies,
and also according to the capacity to adapt and to
minimize the costs.78 Direct impacts may affect maritime
transport infrastructure, operations and maintenance,
result from changes in demand for maritime transport
services.79 These may be induced by climatic changes
affecting trade, investment decisions, demographics,
agricultural production, forests, energy exploration,
and growing interdependence between countries,
climatic impacts on transport systems – in particular
ports and other transport infrastructure in the coastal
zone – entail serious implications for all countries:
developed and developing, coastal and landlocked.
Given the critical role of maritime transport in enabling
ports and shipping services are crucial for global trade,
international production processes and deeply integrated
economies.80
question of mitigation, a better understanding of the
effects of climate change, and any relevant implications
and sustainable international transport services
is important, so that appropriate
adaptation measures may be taken
to ensure that countries will be able
to cope. This is particularly relevant
for costal states, especially the most
vulnerable countries such as small
which are both highly exposed and least
able to adapt, but also for landlocked
ability to access global markets ultimately depends on
vary from country to country, as will the institutions and
legal and political tools available to decision-makers.
... there remains the need to
improve understanding of the
respective merits of different
options and to assess the
potential implications of
the proposed mitigation
measures for global trade and
market distortions ...
Review of Maritime Transport, 200932
and abilities of different countries and regions. In this
respect, available funding is a key consideration, and
as they pertain to maritime transportation networks
must be better understood.81 Identifying adaptation
needs and the requisite funding
is not a straightforward exercise.
to the costs of climate adaptation
for maritime transport, including in
developing countries, and also with
regard to the way funding should be
generated and delivered. The issues
highlighted here were discussed
in more detail at a recent intergovernmental expert
Transport and the Climate Change Challenge”.82 Experts
emphasized the urgent need to reach agreement in the
ongoing negotiations towards a regulatory regime for
greenhouse gas emissions from international shipping.
potential impacts and implications of climate change
for transportation systems, and in particular for ports –
key nodes in the supply chain and vital for global trade.
Increased focus on responding to the challenge was
important for the long-term prospects of the maritime
transport sector, and more generally for global trade.
Planning for the already predicted
impacts should be pursued without
called for increased scientific
research, and well-targeted and
appropriate vulnerability studies –
especially for ports and transport
infrastructure in coastal zones in
developing countries – to help
assess potential climate-change impacts and develop
engineers, industry, international organizations and
policymakers were called upon to increase their
cooperation, in order to ensure that up-to-date relevant
information on climate-change impacts and adaptation
measures was available, widely disseminated, and taken
into account by policymakers, transportation planners
and development strategists.
ENDNOTES
1 For a more comprehensive overview of world economic development, see the Trade and Development Report
2009, available at http://www.unctad.org/Templates/WebFlyer.asp?intItemID=4579&lang=1.
2 World Economic Outlook Update. Global economic slump challenges policies.
3 Dry Bulk Trade Outlook
4 ibid.
5
transition (the Russian Federation). Together, the G-20 economies account for around 90 per cent of global GDP,
6
7 Based, in particular, on information published by the World Trade Organization (WTO) in “World trade 2008,
pdf.
8
gradually from around 2 in the 1960s to above 3 in 2008, as a consequence of production-sharing networks and lean
picks up again.
9
Increased focus on
responding to the challenge
was important for the
long-term prospects of the
maritime transport sector and,
more generally, global trade.
1 - Developments in International Seaborne Trade 33
10 It should be noted that when data are obtained from external sources, including, for example, WTO, reference is
11
therefore, on the effect of the stimulus money allocated to infrastructure investments and on the strength of domestic
demand in China.
12 Container Intelligence Monthly
13 ibid.
14 Dry Bulk Trade Outlook
15
16 Maritime Economics.
regulation for a global industry – conclusions from modal workshop 4 at the 2009 International Transport Forum
17
Piracy.pdf
18 Containerisation International
19
20 ibid.
21 Containerisation International.
22
23 Containerisation International
Business Daily
24 Osler D. The long way around. Lloyd’s List
25 Lloyd’s List
2008.
26 Oil Market
Report BP Statistical Review of World Energy 2009, available at http://www.
Fearnleys Review 2008 Shipping Review and Outlook
DynaLiners Fairplay at http://www.fairplay.
co.uk and from Lloyd’s List at http://www.lloydslist.com/ll/home/index.htm.
27
28 Based on the reference scenario whereby current laws and policies throughout the projection period remain
unchanged.
29
30
31
the international economy and to forge a new global economic development model based on reducing environmental
Review of Maritime Transport, 200934
skills, and reducing the carbon dependency and resource use of all economies, while improving conditions for
32 Renewables Global Status Report,
2009 Update.
33 ibid.
34
Excludes liquid fuels from other sources such as biomass and coal derivatives.
35 World Energy Outlook 2009.
36 LNG World Shipping Journal
37
Dry Bulk Trade Outlook
and Shipping Review and Outlook Fearnleys Review 2008
articles from Fairplay and Lloyd’s List.
38 Safe Sustainable Steel
php?lang=en&page=638).
39 Mineral Commodity Summaries 2009.
40 ibid.
41
worldsteel.org.
42 Dry Bulk Trade Outlook. December 2008.
43
44 Mineral Commodity Summaries 2009.
45 Dry Bulk Trade Outlook
46 For additional information, see: Coal and the environment, at http://www.worldcoal.org/coal-the-environment.
World Coal Institute.
47
crisis”.
48
49
50 Dry Bulk Trade Outlook
51 Shipping Review and Outlook (autumn 2008
and spring 2009) and Container Intelligence Monthly Containerisation
International Magazine
DynaLiners Trades Review, 2009.
52 Shipping Review and Outlook, Spring 2009 and Container Intelligence Monthly,
September 2009.

1 - Developments in International Seaborne Trade 35
53 Containerisation International. Tradelane cargo analysis
54 Container Intelligence Monthly
55 Market Commentary
56 ibid.
57 Container Intelligence Monthly.
58 ibid.
59
60
Human Development Report 2007/2008.
61 World Energy Outlook 2008.
62 The Economics of Climate Change – The Stern Review (http://www.hm-
63
64
2 emissions in 2006 from international shipping (838 million
2emissions (843.4 million tons) and larger than the
2 emissions (556.6 million tons).
65
66
67
int/2860.php.
68
69 Future emissions of CO2from international shipping were estimated in accordance with the scenarios
developed by the IPCC in the Special Report on Emission Scenarios and are based on three categories
and energy.
70
71 For an overview of existing and potential relevant technologies, see, for example: Gunton P. “Controlling
(http://www.unctad.org/ttl/legal).
72
73 ibid.
74
75
Review of Maritime Transport, 200936
76
to indirect impacts such as changed incentives for fragmentation of production. It could also result in
increased demand for ships with lower CO2 emissions. This entails a number of implications for research
and development in terms of the relevant shipbuilding technology, and also for shipyard services – the
77 This issue constitutes a key point of divergence of views about a global regime to regulate GHG emissions
78 Impacts of Climate Change and Variability
on Transportation Systems and Infrastructure: Gulf Coast Study, Phase I
Potential Impacts of Climate Change on U.S. Transportation
79 ibid.
80
seeking to upgrade infrastructure, equipment and operations to satisfy the new international security requirements
by ports hinder the effective integration of these countries into the global transport and trading networks.
81
(2008), Negotiations on Additional Investment and Financial Flows to Address Climate Change in Developing
Countries.
82 For further information about the meeting, as well as all relevant documentation, including a background note by
the secretariat, the report of the meeting, and presentations by experts, see: http://www.unctad.org/ttl/legal.
37
Chapter 2
STRUCTURE, OWNERSHIP AND REGISTRATION
OF THE WORLD FLEET
STRUCTURE OF THE WORLD FLEETA.
Trends in vessel types
During the 12 months up to 1 January 2009, the
deadweight tonnage of oil tankers increased by 2.5 per
bulk carriers has exceeded the tonnage on oil tankers.
Together, the two types of ships represent 71.2 per cent
of the world total tonnage, a slight decrease from the
ships increased by only 3.2 per cent in 2008, resulting in
by 17.3 million deadweight tons (dwt), or 11.9 per cent,
and now represents 13.6 per cent of the total world
recorded high growth rates: in 2008, the tonnage of
1.19 billion dwt, a year-on-year growth rate of 6.7 per
of the decade, the tonnage on general cargo ships has
increased by 7 per cent, dry and liquid bulk tonnage
to expand substantially in 2008: by the beginning of
2009 there were 4,638 ships, with a total capacity of
12.14 million TEUs – an increase of 8.5 per cent in the
capacity per ship growing from 2,516 TEUs in January
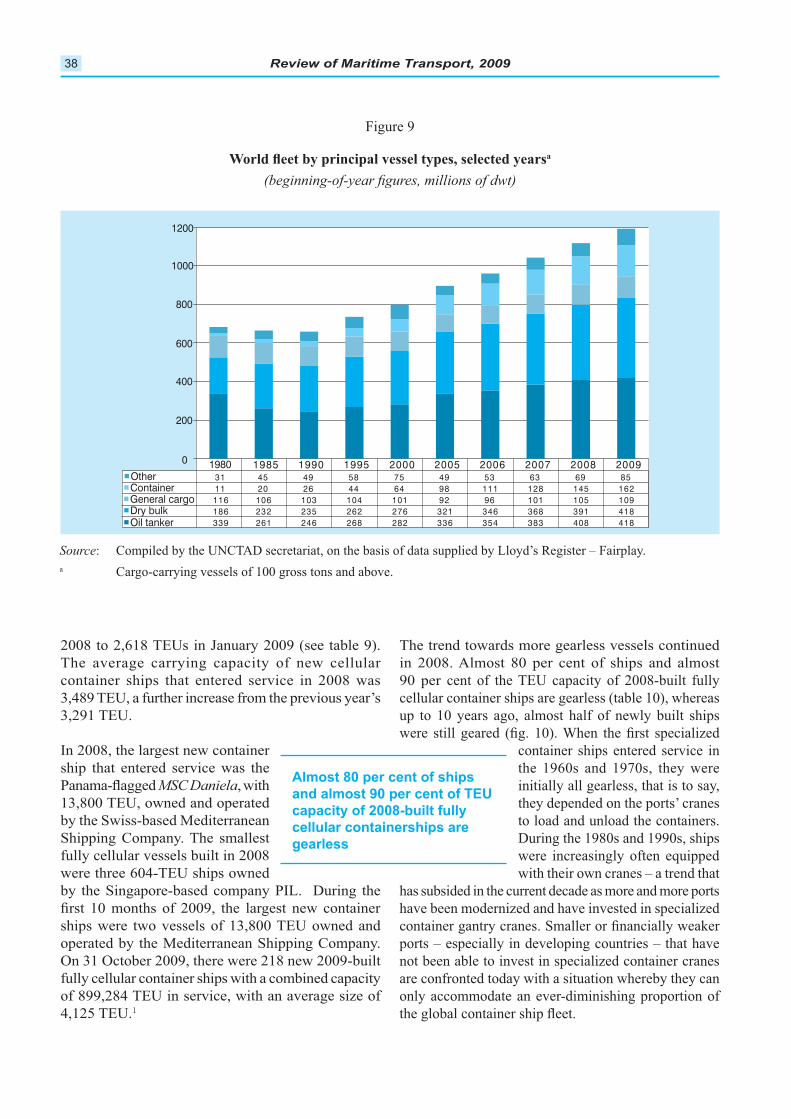
Review of Maritime Transport, 200938
Figure 9
a
: Compiled by the UNCTAD secretariat, on the basis of data supplied by Lloyd’s Register – Fairplay.
a
1200
1000
800
600
400
200
0
Other 31 45 49 58 75 49 53 63 69 85Container 11 20 26 44 64 98 111 128 145 162General cargo 116 106 103 104 101 92 96 101 105 109Dry bulk 186 232 235 262 276 321 346 368 391 418Oil tanker 339 261 246 268 282 336 354 383 408 418
1985 1990 1995 2000 2005 2006 2007 2008 20091980
2008 to 2,618 TEUs in January 2009 (see table 9).
3,291 TEU.
MSC Daniela, with
13,800 TEU, owned and operated
were three 604-TEU ships owned
On 31 October 2009, there were 218 new 2009-built
fully cellular container ships with a combined capacity
4,125 TEU.1
in 2008. Almost 80 per cent of ships and almost
90 per cent of the TEU capacity of 2008-built fully
cellular container ships are gearless (table 10), whereas
up to 10 years ago, almost half of newly built ships
the 1960s and 1970s, they were
initially all gearless, that is to say,
they depended on the ports’ cranes
to load and unload the containers.
During the 1980s and 1990s, ships
were increasingly often equipped
with their own cranes – a trend that
has subsided in the current decade as more and more ports
are confronted today with a situation whereby they can
Almost 80 per cent of ships
and almost 90 per cent of TEU
capacity of 2008-built fully
cellular containerships are
gearless
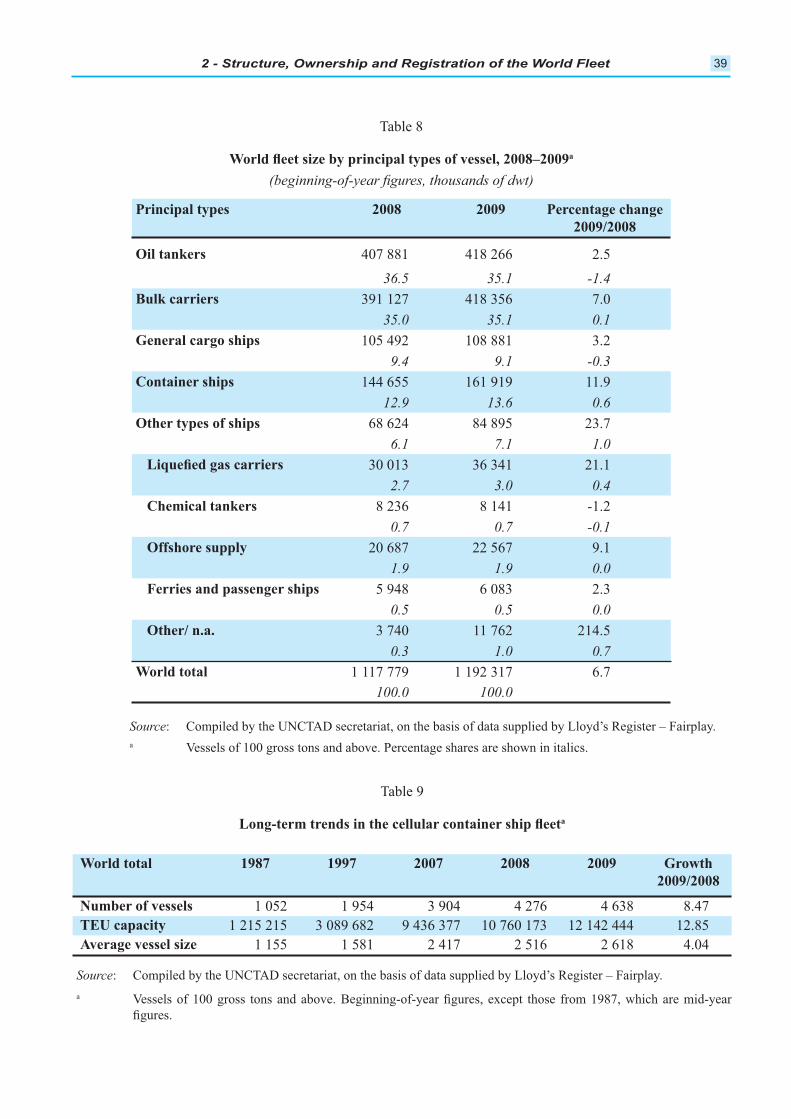
2 - Structure, Ownership and Registration of the World Fleet 39
Table 8
a
: Compiled by the UNCTAD secretariat, on the basis of data supplied by Lloyd’s Register – Fairplay.
a
407 881 418 266 2.5
36.5 35.1 -1.4
391 127 418 356 7.0
35.0 35.1 0.1
105 492 108 881 3.2
9.4 9.1 -0.3
144 655 161 919 11.9
12.9 13.6 0.6
68 624 84 895 23.7
6.1 7.1 1.0
30 013 36 341 21.1
2.7 3.0 0.4
8 236 8 141 -1.2
0.7 0.7 -0.1
20 687 22 567 9.1
1.9 1.9 0.0
5 948 6 083 2.3
0.5 0.5 0.0
3 740 11 762 214.5
0.3 1.0 0.7
World total 1 117 779 1 192 317 6.7
100.0 100.0
World total
1 052 1 954 3 904 4 276 4 638 8.47
1 215 215 3 089 682 9 436 377 10 760 173 12 142 444 12.85
1 155 1 581 2 417 2 516 2 618 4.04
Table 9
a
: Compiled by the UNCTAD secretariat, on the basis of data supplied by Lloyd’s Register – Fairplay.
a
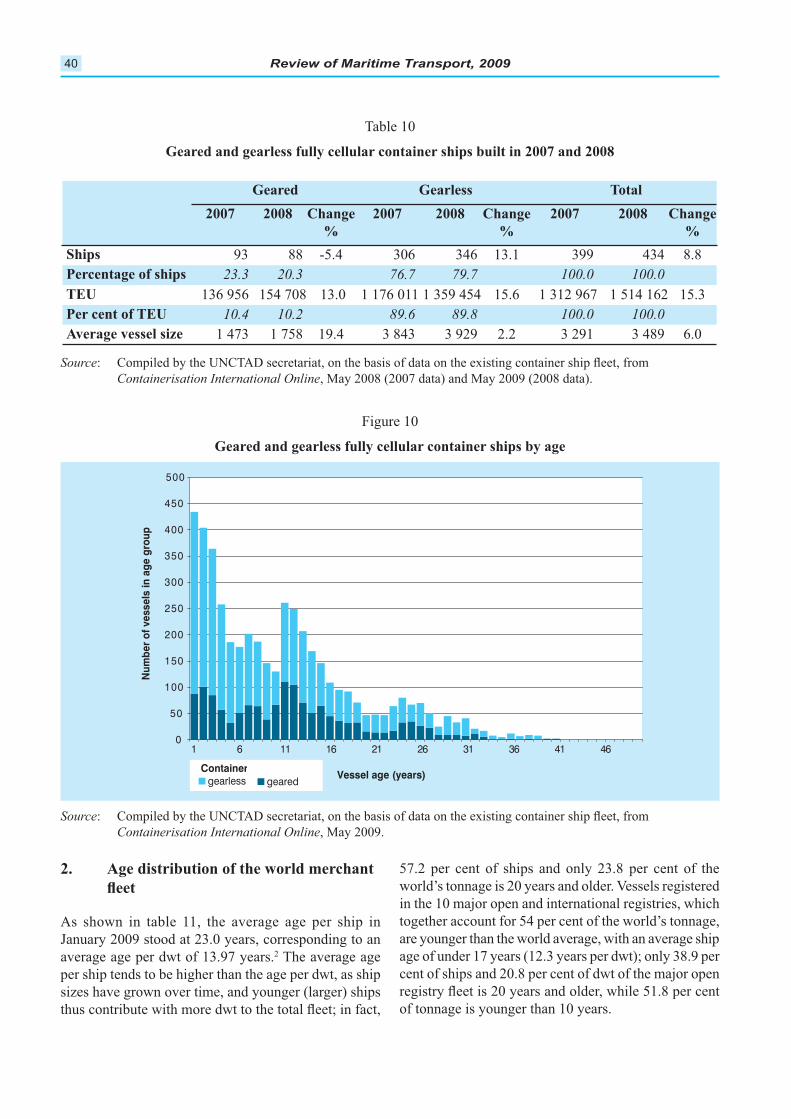
Review of Maritime Transport, 200940
Geared Total
% % %
93 88 -5.4 306 346 13.1 399 434 8.8
23.3 20.3 76.7 79.7 100.0 100.0
TEU 136 956 154 708 13.0 1 176 011 1 359 454 15.6 1 312 967 1 514 162 15.3
10.4 10.2 89.6 89.8 100.0 100.0
1 473 1 758 19.4 3 843 3 929 2.2 3 291 3 489 6.0
:
Containerisation International Online
Table 10
Figure 10
:
Containerisation International Online
Container
0
50
100
150
200
250
300
350
400
450
500
1 6 11 16 21 26 31 36 41 46
Vessel age (years)
Num
ber
of v
esse
ls in
age
gro
up
gearless geared
January 2009 stood at 23.0 years, corresponding to an 2
per ship tends to be higher than the age per dwt, as ship
57.2 per cent of ships and only 23.8 per cent of the
world’s tonnage is 20 years and older. Vessels registered
in the 10 major open and international registries, which
together account for 54 per cent of the world’s tonnage,
cent of ships and 20.8 per cent of dwt of the major open
of tonnage is younger than 10 years.
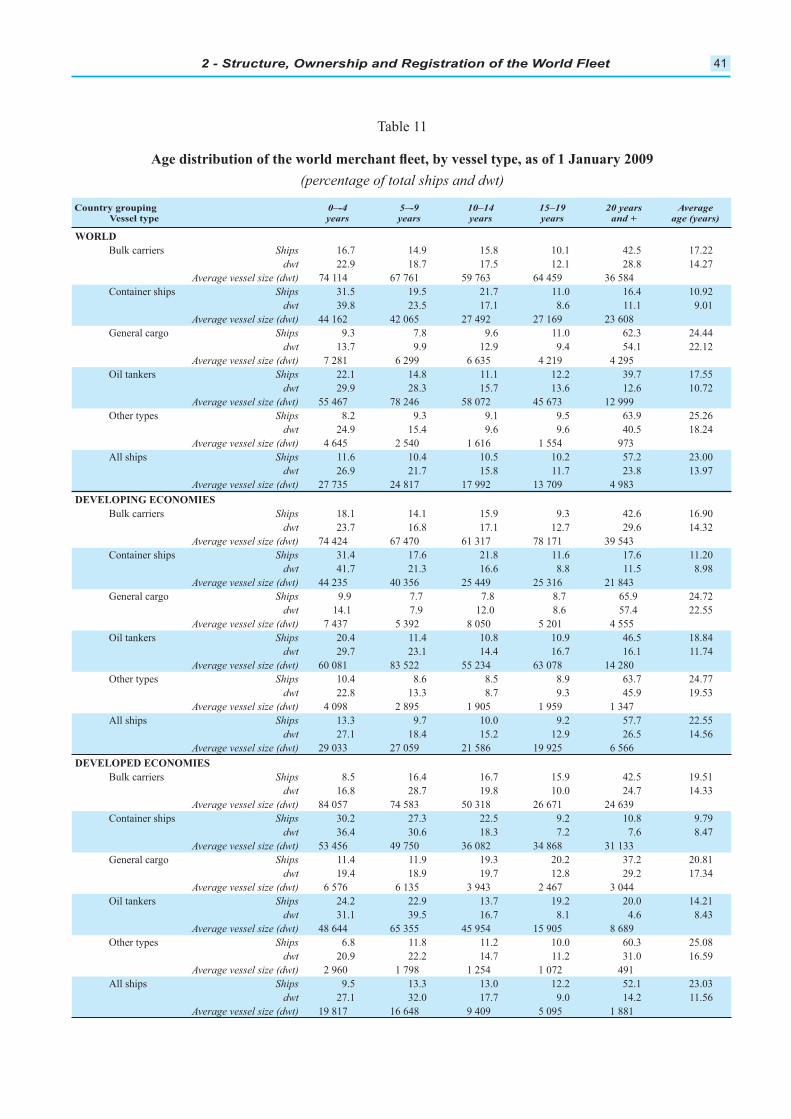
2 - Structure, Ownership and Registration of the World Fleet 41
and +
WORLD
Ships 16.7 14.9 15.8 10.1 42.5 17.22
dwt 22.9 18.7 17.5 12.1 28.8 14.27
74 114 67 761 59 763 64 459 36 584
Container ships Ships 31.5 19.5 21.7 11.0 16.4 10.92
dwt 39.8 23.5 17.1 8.6 11.1 9.01
44 162 42 065 27 492 27 169 23 608
General cargo Ships 9.3 7.8 9.6 11.0 62.3 24.44
dwt 13.7 9.9 12.9 9.4 54.1 22.12
7 281 6 299 6 635 4 219 4 295
Oil tankers Ships 22.1 14.8 11.1 12.2 39.7 17.55
dwt 29.9 28.3 15.7 13.6 12.6 10.72
55 467 78 246 58 072 45 673 12 999
Other types Ships 8.2 9.3 9.1 9.5 63.9 25.26
dwt 24.9 15.4 9.6 9.6 40.5 18.24
4 645 2 540 1 616 1 554 973
All ships Ships 11.6 10.4 10.5 10.2 57.2 23.00
dwt 26.9 21.7 15.8 11.7 23.8 13.97
27 735 24 817 17 992 13 709 4 983
DEVELOPING ECONOMIES
Ships 18.1 14.1 15.9 9.3 42.6 16.90
dwt 23.7 16.8 17.1 12.7 29.6 14.32
74 424 67 470 61 317 78 171 39 543
Container ships Ships 31.4 17.6 21.8 11.6 17.6 11.20
dwt 41.7 21.3 16.6 8.8 11.5 8.98
44 235 40 356 25 449 25 316 21 843
General cargo Ships 9.9 7.7 7.8 8.7 65.9 24.72
dwt 14.1 7.9 12.0 8.6 57.4 22.55
7 437 5 392 8 050 5 201 4 555
Oil tankers Ships 20.4 11.4 10.8 10.9 46.5 18.84
dwt 29.7 23.1 14.4 16.7 16.1 11.74
60 081 83 522 55 234 63 078 14 280
Other types Ships 10.4 8.6 8.5 8.9 63.7 24.77
dwt 22.8 13.3 8.7 9.3 45.9 19.53
4 098 2 895 1 905 1 959 1 347
All ships Ships 13.3 9.7 10.0 9.2 57.7 22.55
dwt 27.1 18.4 15.2 12.9 26.5 14.56
29 033 27 059 21 586 19 925 6 566
DEVELOPED ECONOMIES
Ships 8.5 16.4 16.7 15.9 42.5 19.51
dwt 16.8 28.7 19.8 10.0 24.7 14.33
84 057 74 583 50 318 26 671 24 639
Container ships Ships 30.2 27.3 22.5 9.2 10.8 9.79
dwt 36.4 30.6 18.3 7.2 7.6 8.47
53 456 49 750 36 082 34 868 31 133
General cargo Ships 11.4 11.9 19.3 20.2 37.2 20.81
dwt 19.4 18.9 19.7 12.8 29.2 17.34
6 576 6 135 3 943 2 467 3 044
Oil tankers Ships 24.2 22.9 13.7 19.2 20.0 14.21
dwt 31.1 39.5 16.7 8.1 4.6 8.43
48 644 65 355 45 954 15 905 8 689
Other types Ships 6.8 11.8 11.2 10.0 60.3 25.08
dwt 20.9 22.2 14.7 11.2 31.0 16.59
2 960 1 798 1 254 1 072 491
All ships Ships 9.5 13.3 13.0 12.2 52.1 23.03
dwt 27.1 32.0 17.7 9.0 14.2 11.56
19 817 16 648 9 409 5 095 1 881
Table 11
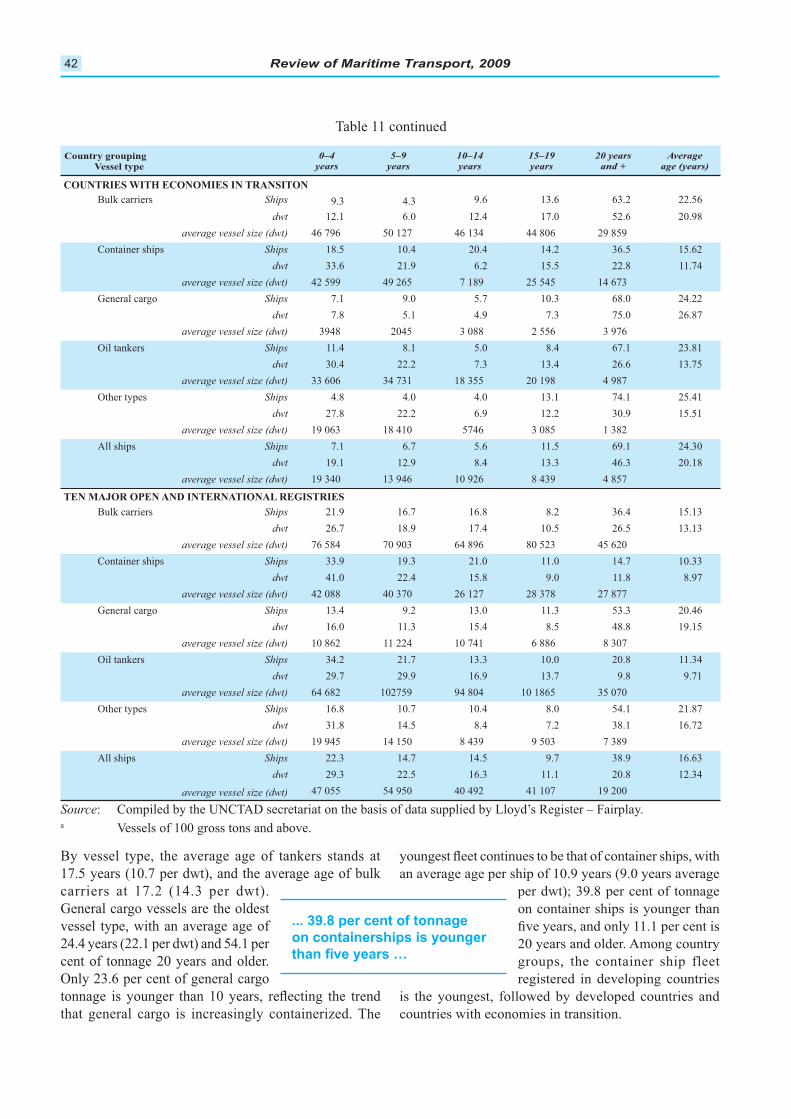
Review of Maritime Transport, 200942
and +
COUNTRIES WITH ECONOMIES IN TRANSITON
Ships 9.3 4.3 9.6 13.6 63.2 22.56
dwt 12.1 6.0 12.4 17.0 52.6 20.98
46 796 50 127 46 134 44 806 29 859
Container ships Ships 18.5 10.4 20.4 14.2 36.5 15.62
dwt 33.6 21.9 6.2 15.5 22.8 11.74
42 599 49 265 7 189 25 545 14 673
General cargo Ships 7.1 9.0 5.7 10.3 68.0 24.22
dwt 7.8 5.1 4.9 7.3 75.0 26.87
3948 2045 3 088 2 556 3 976
Oil tankers Ships 11.4 8.1 5.0 8.4 67.1 23.81
dwt 30.4 22.2 7.3 13.4 26.6 13.75
33 606 34 731 18 355 20 198 4 987
Other types Ships 4.8 4.0 4.0 13.1 74.1 25.41
dwt 27.8 22.2 6.9 12.2 30.9 15.51
19 063 18 410 5746 3 085 1 382
All ships Ships 7.1 6.7 5.6 11.5 69.1 24.30
dwt 19.1 12.9 8.4 13.3 46.3 20.18
19 340 13 946 10 926 8 439 4 857
Ships 21.9 16.7 16.8 8.2 36.4 15.13
dwt 26.7 18.9 17.4 10.5 26.5 13.13
76 584 70 903 64 896 80 523 45 620
Container ships Ships 33.9 19.3 21.0 11.0 14.7 10.33
dwt 41.0 22.4 15.8 9.0 11.8 8.97
42 088 40 370 26 127 28 378 27 877
General cargo Ships 13.4 9.2 13.0 11.3 53.3 20.46
dwt 16.0 11.3 15.4 8.5 48.8 19.15
10 862 11 224 10 741 6 886 8 307
Oil tankers Ships 34.2 21.7 13.3 10.0 20.8 11.34
dwt 29.7 29.9 16.9 13.7 9.8 9.71
64 682 102759 94 804 10 1865 35 070
Other types Ships 16.8 10.7 10.4 8.0 54.1 21.87
dwt 31.8 14.5 8.4 7.2 38.1 16.72
19 945 14 150 8 439 9 503 7 389
All ships Ships 22.3 14.7 14.5 9.7 38.9 16.63
dwt 29.3 22.5 16.3 11.1 20.8 12.34
47 055 54 950 40 492 41 107 19 200
Table 11 continued
: Compiled by the UNCTAD secretariat on the basis of data supplied by Lloyd’s Register – Fairplay.a
carriers at 17.2 (14.3 per dwt).
24.4 years (22.1 per dwt) and 54.1 per
cent of tonnage 20 years and older.
Only 23.6 per cent of general cargo
he
on container ships is younger than
20 years and older. Among country
groups, the container ship fleet
countries with economies in transition.
... 39.8 per cent of tonnage
on containerships is younger
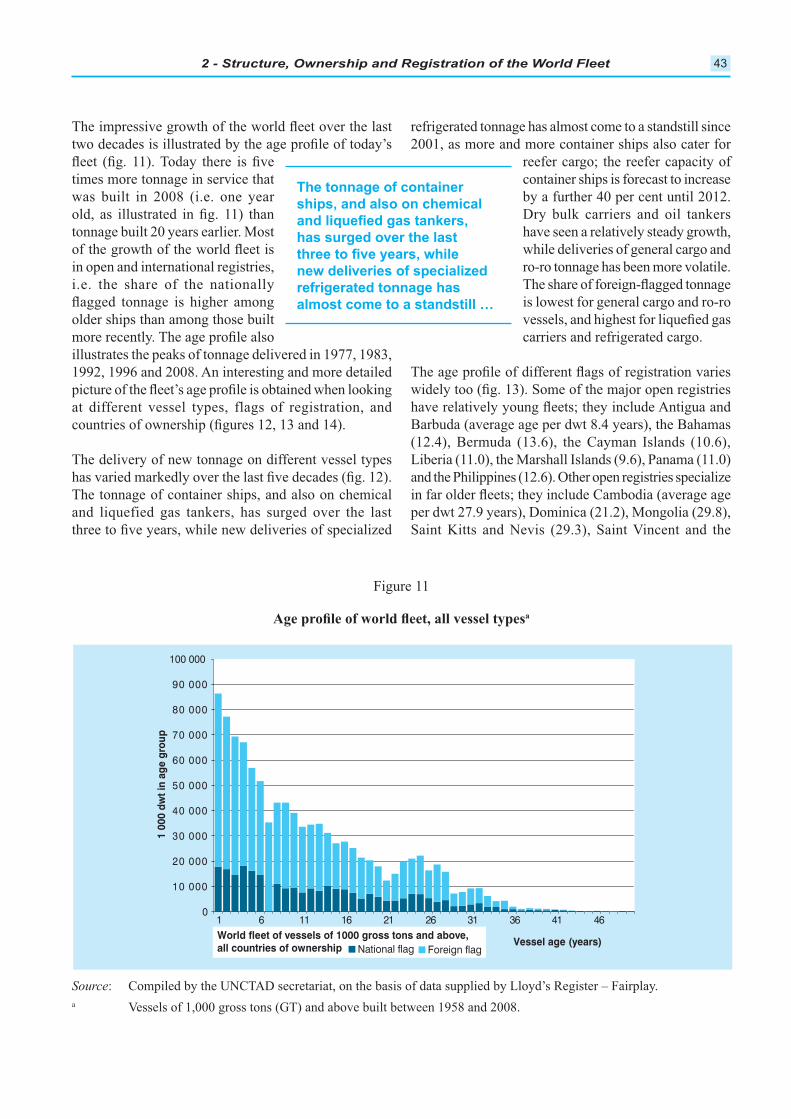
2 - Structure, Ownership and Registration of the World Fleet 43
Figure 11
a
: Compiled by the UNCTAD secretariat, on the basis of data supplied by Lloyd’s Register – Fairplay.
a
National flag Foreign flagWorld fleet of vessels of 1000 gross tons and above,all countries of ownership
0
10 000
20 000
30 000
40 000
50 000
60 000
70 000
80 000
90 000
100 000
1 6 11 16 21 26 31 36 41 46
Vessel age (years)
1 00
0 dw
t in
age
grou
p
was built in 2008 (i.e. one year
in open and international registries,
i.e. the share of the nationally
older ships than among those built
1992, 1996 and 2008. An interesting and more detailed
The tonnage of container ships, and also on chemical
refrigerated tonnage has almost come to a standstill since
2001, as more and more container ships also cater for
container ships is forecast to increase
by a further 40 per cent until 2012.
Dry bulk carriers and oil tankers
is lowest for general cargo and ro-ro
carriers and refrigerated cargo.
The tonnage of container
ships, and also on chemical
refrigerated tonnage has
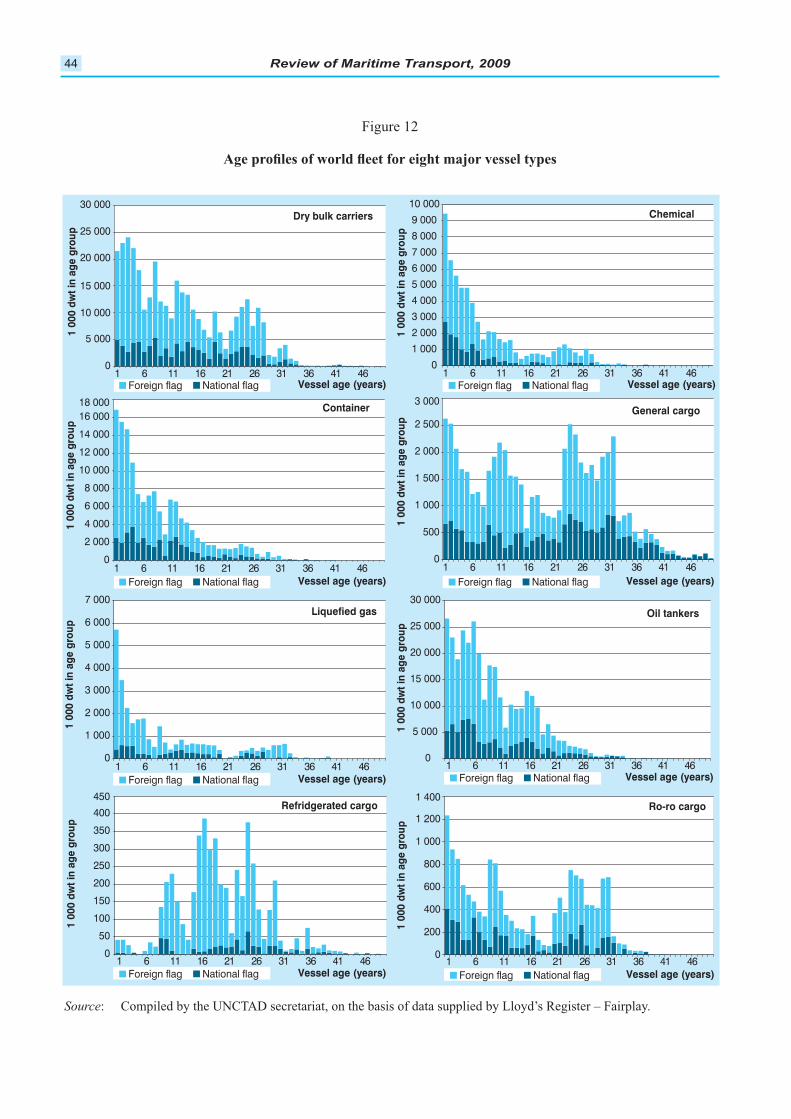
Review of Maritime Transport, 200944
Figure 12
: Compiled by the UNCTAD secretariat, on the basis of data supplied by Lloyd’s Register – Fairplay.
National flagForeign flag
Dry bulk carriers
Container
Chemical
General cargo
0
5 000
10 000
15 000
20 000
25 000
30 000
1 6 11 16 21 26 31 36 41 46Vessel age (years) National flagForeign flag Vessel age (years)
1 00
0 dw
t in
age
grou
p
0
1 000
2 000
3 000
4 000
5 000
6 000
7 000
8 000
9 000
10 000
1 6 11 16 21 26 31 36 41 46
1 00
0 dw
t in
age
grou
p1
000
dwt i
n ag
e gr
oup
0
2 000
4 000
6 000
8 000
10 000
12 000
14 000
16 000 18 000
1 6 11 16 21 26 31 36 41 46
1 00
0 dw
t in
age
grou
p1
000
dwt i
n ag
e gr
oup
1 00
0 dw
t in
age
grou
p1
000
dwt i
n ag
e gr
oup
0
500
1 000
1 500
2 000
2 500
3 000
1 6 11 16 21 26 31 36 41 46
0
5 000
10 000
15 000
20 000
25 000
30 000
1 6 11 16 21 26 31 36 41 46
0
50
100
150
200
250
300
350
400
450
1 6 11 16 21 26 31 36 41 460
200
400
600
800
1 000
1 200
1 400
1 6 11 16 21 26 31 36 41 46
Refridgerated cargo
Oil tankers
Ro-ro cargo
1 00
0 dw
t in
age
grou
p
0
1 000
2 000
3 000
4 000
5 000
6 000
7 000
1 6 11 16 21 26 31 36 41 46
Liquefied gas
National flagForeign flag Vessel age (years)
National flagForeign flag Vessel age (years) National flagForeign flag Vessel age (years)
National flagForeign flag Vessel age (years)National flagForeign flag Vessel age (years)
National flagForeign flag Vessel age (years)
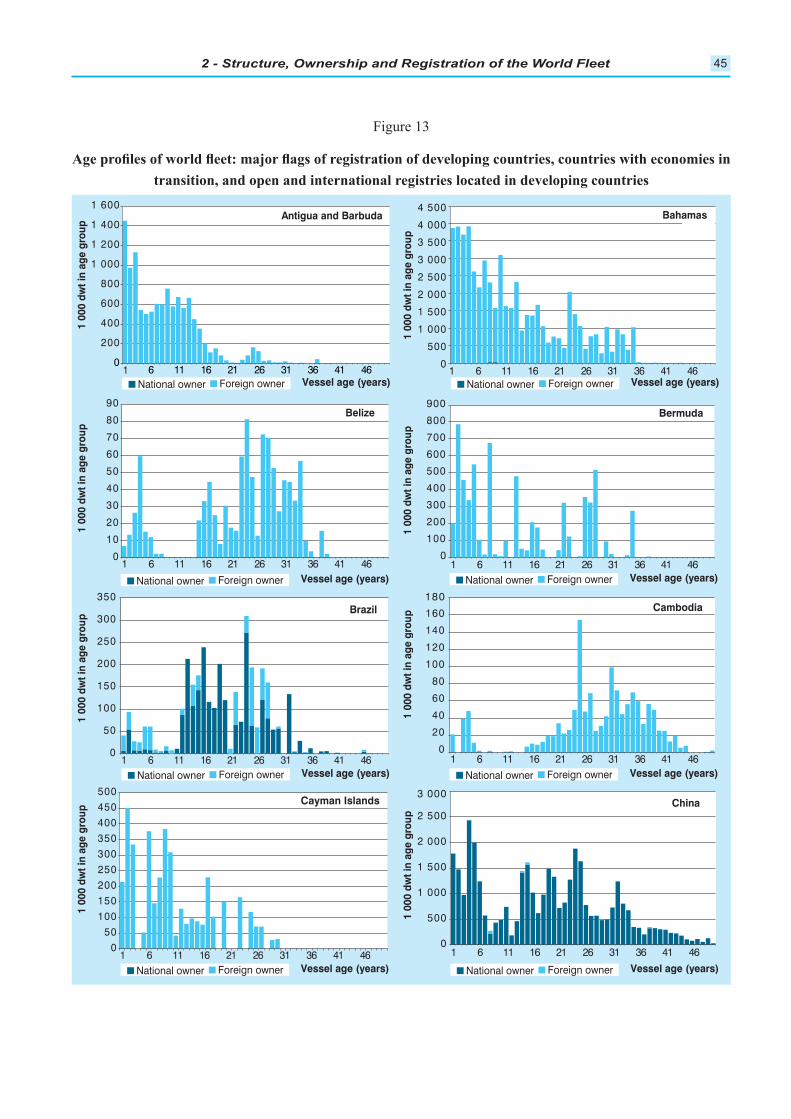
2 - Structure, Ownership and Registration of the World Fleet 45
Figure 13
National owner Foreign owner
Antigua and Barbuda
Belize
Bahamas
Bermuda
Vessel age (years)
1 00
0 dw
t in
age
grou
p1
000
dwt i
n ag
e gr
oup
1 00
0 dw
t in
age
grou
p1
000
dwt i
n ag
e gr
oup
1 00
0 dw
t in
age
grou
p1
000
dwt i
n ag
e gr
oup
1 00
0 dw
t in
age
grou
p1
000
dwt i
n ag
e gr
oup
0
200
400
600
800
1 000
1 200
1 400
1 600
6 11 16 21 26 31 36 41 461 0
500
1 000
1 500
2 000
2 500
3 000
3 500
4 000
4 500
1 6 11 16 21 26 31 36 41 46
0
10
20
30
40
50
60
70
80
90
1 6 11 16 21 26 31 36 41 46
National owner Foreign owner Vessel age (years)
Brazil
0
100
200
300
400
500
600
700
800
900
1 6 11 16 21 26 31 36 41 46
0
50
100
150
200
250
300
350
1 6 11 16 21 26 31 36 41 46
Cayman Islands China
Cambodia
0
20
40
60
80
100
120
140
160
180
1 6 11 16 21 26 31 36 41 46
050
100150200250300350400450500
1 6 11 16 21 26 31 36 41 460
500
1 000
1 500
2 000
2 500
3 000
1 6 11 16 21 26 31 36 41 46
National owner Foreign owner Vessel age (years) National owner Foreign owner Vessel age (years)
National owner Foreign owner Vessel age (years)
National owner Foreign owner Vessel age (years) National owner Foreign owner Vessel age (years)
National owner Foreign owner Vessel age (years)
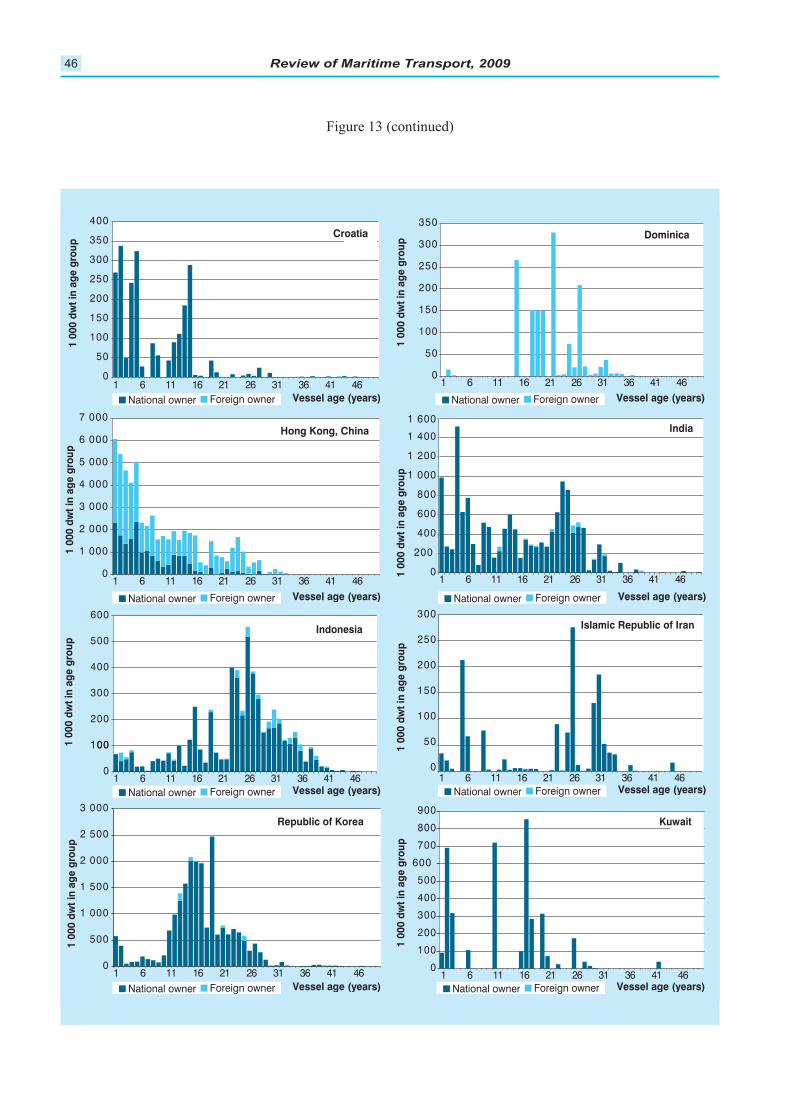
Review of Maritime Transport, 200946
Figure 13 (continued)
Croatia
Hong Kong, China
Indonesia
Republic of Korea Kuwait
Islamic Republic of Iran
India
Dominica
1 00
0 dw
t in
age
grou
p1
000
dwt i
n ag
e gr
oup
1 00
0 dw
t in
age
grou
p1
000
dwt i
n ag
e gr
oup
1 00
0 dw
t in
age
grou
p1
000
dwt i
n ag
e gr
oup
1 00
0 dw
t in
age
grou
p1
000
dwt i
n ag
e gr
oup
0
50
100
150
200
250
300
350
400
1 6 11 16 21 26 31 36 41 460
50
100
150
200
250
300
350
1 6 11 16 21 26 31 36 41 46
0
1 000
2 000
3 000
4 000
5 000
6 000
7 000
1 6 11 16 21 26 31 36 41 460
200
400
600
800
1 000
1 200
1 400
1 600
1 6 11 16 21 26 31 36 41 46
0
100100
200
300
400
500
600
1 6 11 16 21 26 31 36 41 460
50
100
150
200
250
300
1 6 11 16 21 26 31 36 41 46
0
500
1 000
1 500
2 000
2 500
3 000
1 6 11 16 21 26 31 36 41 46 0
100
200
300
400
500
600
700
800
900
1 6 11 16 21 26 31 36 41 46
National owner Foreign owner Vessel age (years)
National owner Foreign owner Vessel age (years)
National owner Foreign owner Vessel age (years)
National owner Foreign owner Vessel age (years) National owner Foreign owner Vessel age (years)
National owner Foreign owner Vessel age (years)
National owner Foreign owner Vessel age (years)
National owner Foreign owner Vessel age (years)
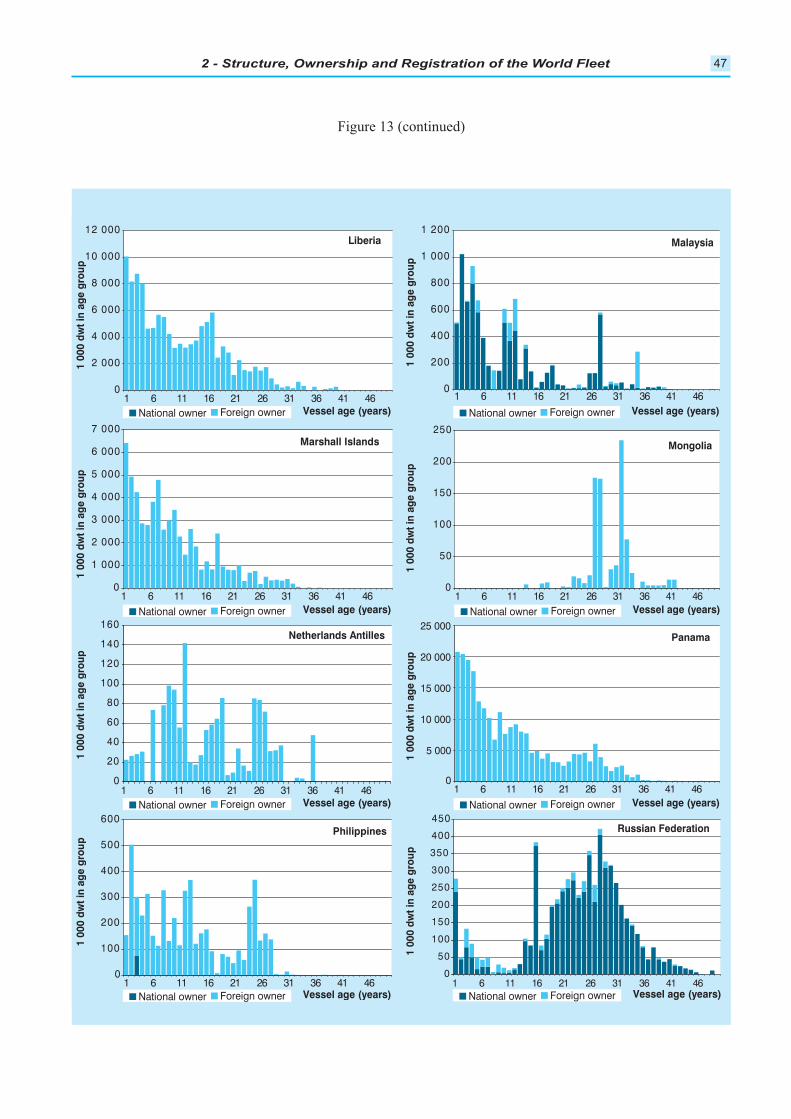
2 - Structure, Ownership and Registration of the World Fleet 47
Figure 13 (continued)
1 00
0 dw
t in
age
grou
p1
000
dwt i
n ag
e gr
oup
1 00
0 dw
t in
age
grou
p1
000
dwt i
n ag
e gr
oup
1 00
0 dw
t in
age
grou
p1
000
dwt i
n ag
e gr
oup
1 00
0 dw
t in
age
grou
p1
000
dwt i
n ag
e gr
oup
0
2 000
4 000
6 000
8 000
10 000
12 000
1 6 11 16 21 26 31 36 41 46
Liberia
Marshall Islands
Netherlands Antilles
Philippines
Panama
Russian Federation
Mongolia
Malaysia
0
200
400
600
800
1 000
1 200
1 6 11 16 21 26 31 36 41 46
0
1 000
2 000
3 000
4 000
5 000
6 000
7 000
1 6 11 16 21 26 31 36 41 46
1 6 11 16 21 26 31 36 41 46
0
50
100
150
200
250
1 6 11 16 21 26 31 36 41 46
0
20
40
60
80
100
120
140
160
0
5 000
10 000
15 000
20 000
25 000
1 6 11 16 21 26 31 36 41 46
0
100
200
300
400
500
600
1 6 11 16 21 26 31 36 41 460
50
100
150
200
250
300
350
400
450
1 6 11 16 21 26 31 36 41 46
National owner Foreign owner Vessel age (years)
National owner Foreign owner Vessel age (years)
National owner Foreign owner Vessel age (years)
National owner Foreign owner Vessel age (years) National owner Foreign owner Vessel age (years)
National owner Foreign owner Vessel age (years)
National owner Foreign owner Vessel age (years)
National owner Foreign owner Vessel age (years)
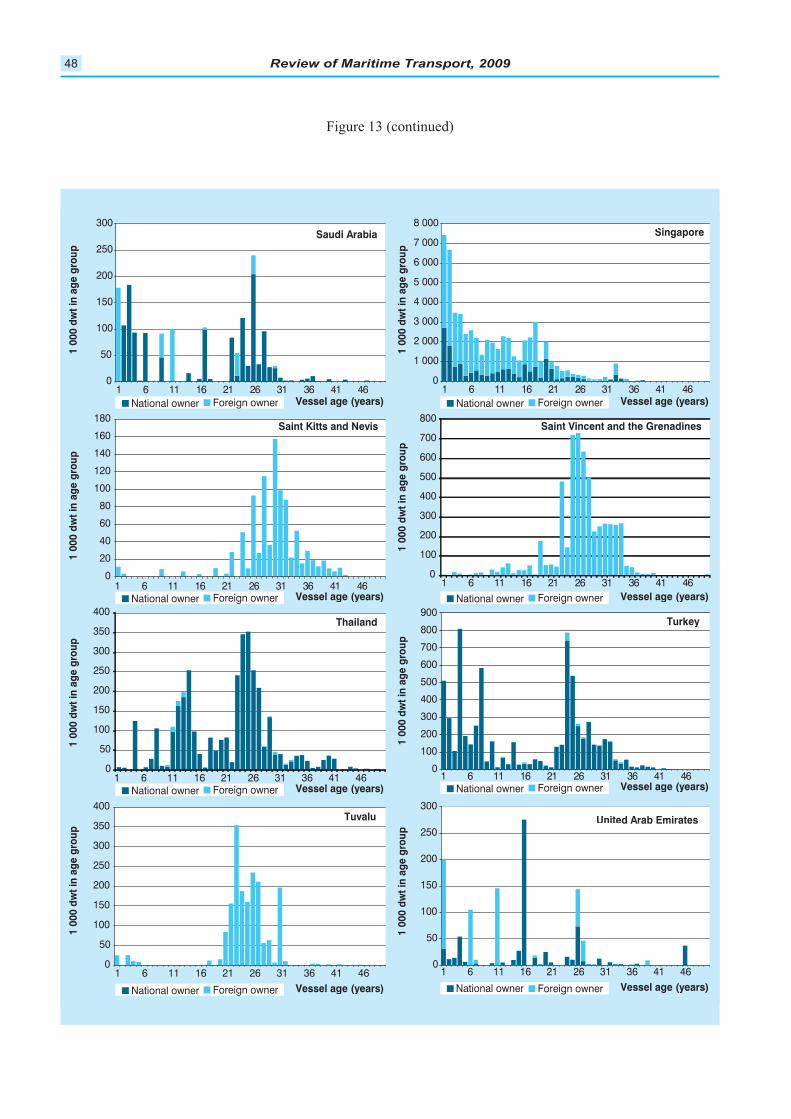
Review of Maritime Transport, 200948
Figure 13 (continued)
1 00
0 dw
t in
age
grou
p1
000
dwt i
n ag
e gr
oup
1 00
0 dw
t in
age
grou
p1
000
dwt i
n ag
e gr
oup
1 00
0 dw
t in
age
grou
p1
000
dwt i
n ag
e gr
oup
1 00
0 dw
t in
age
grou
p1
000
dwt i
n ag
e gr
oup
Thailand
0
50
100
150
200
250
300
350
400
1 6 11 16 21 26 31 36 41 46
Turkey
0
100
200
300
400
500
600
700
800
900
1 6 11 16 21 26 31 36 41 46
Tuvalu
0
50
100
150
200
250
300
350
400
1 6 11 16 21 26 31 36 41 46
National owner Foreign owner Vessel age (years)
National owner Foreign owner Vessel age (years)
National owner Foreign owner Vessel age (years)
National owner Foreign owner Vessel age (years)
National owner Foreign owner Vessel age (years)
National owner Foreign owner Vessel age (years)
National owner Foreign owner Vessel age (years)
National owner Foreign owner Vessel age (years)
Saudi Arabia
0
50
100
150
200
250
300
1 6 11 16 21 26 31 36 41 46
Singapore
0
1 000
2 000
3 000
4 000
5 000
6 000
7 000
8 000
1 6 11 16 21 26 31 36 41 46
Saint Kitts and Nevis
0
20
40
60
80
100
120
140
160
180
1 6 11 16 21 26 31 36 41 46
Saint Vincent and the Grenadines
0
100
200
300
400
500
600
700
800
1 6 11 16 21 26 31 36 41 46
United Arab Emirates
0
50
100
150
200
250
300
1 6 11 16 21 26 31 36 41 46
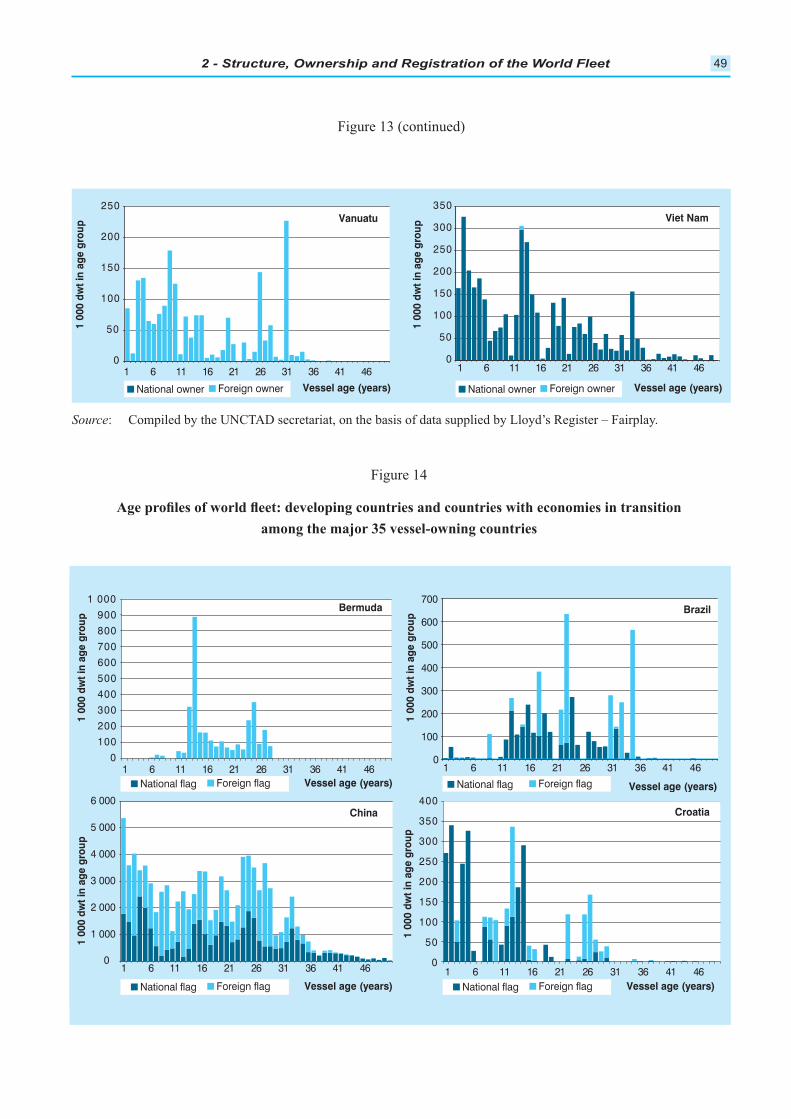
2 - Structure, Ownership and Registration of the World Fleet 49
Figure 13 (continued)
: Compiled by the UNCTAD secretariat, on the basis of data supplied by Lloyd’s Register – Fairplay.
Figure 14
Vessel age (years)
1 00
0 dw
t in
age
grou
p1
000
dwt i
n ag
e gr
oup
1 00
0 dw
t in
age
grou
p1
000
dwt i
n ag
e gr
oup
National flag Foreign flag
Vessel age (years)National flag Foreign flag Vessel age (years)National flag Foreign flag
Bermuda
China
Vessel age (years)National flag Foreign flag
Brazil
Croatia
0100200300400500600700800900
1 000
1 6 11 16 21 26 31 36 41 460
100
200
300
400
500
600
700
1 6 11 16 21 26 31 36 41 46
0
1 000
2 000
3 000
4 000
5 000
6 000
1 6 11 16 21 26 31 36 41 46 0
50
100
150
200
250
300
350
400
1 6 11 16 21 26 31 36 41 46
Vessel age (years)
1 00
0 dw
t in
age
grou
p
1 00
0 dw
t in
age
grou
p
National owner Foreign owner Vessel age (years)National owner Foreign owner
Vanuatu
0
50
100
150
200
250
1 6 11 16 21 26 31 36 41 46
Viet Nam
0
50
100
150
200
250
300
350
1 6 11 16 21 26 31 36 41 46
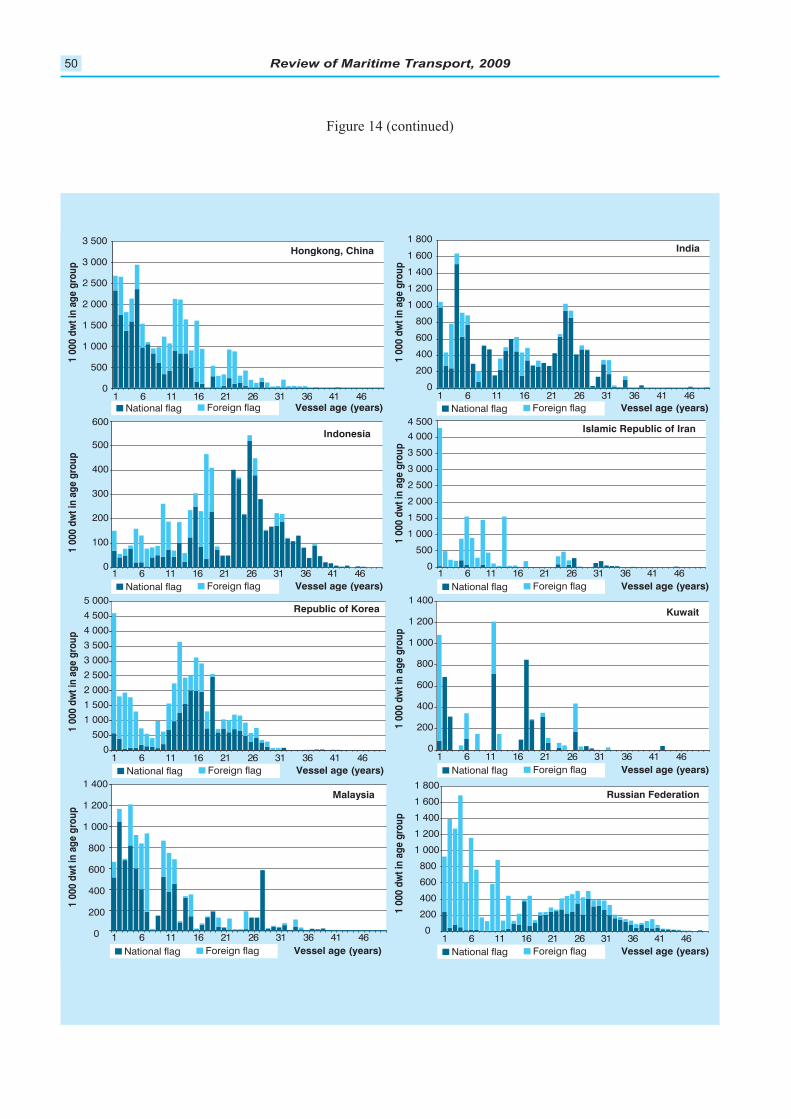
Review of Maritime Transport, 200950
Figure 14 (continued)
1 00
0 dw
t in
age
grou
p1
000
dwt i
n ag
e gr
oup
1 00
0 dw
t in
age
grou
p1
000
dwt i
n ag
e gr
oup
1 00
0 dw
t in
age
grou
p1
000
dwt i
n ag
e gr
oup
1 00
0 dw
t in
age
grou
p1
000
dwt i
n ag
e gr
oup
Vessel age (years)National flag Foreign flag
Hongkong, China India
Indonesia
Republic of Korea
Malaysia
Islamic Republic of Iran
Kuwait
Russian Federation
0
500
1 000
1 500
2 000
2 500
3 000
3 500
1 6 11 16 21 26 31 36 41 460
200
400
600
800
1 000
1 200
1 400
1 600
1 800
1 6 11 16 21 26 31 36 41 46
0
100
200
300
400
500
600
1 6 11 16 21 26 31 36 41 460
500
1 000
1 500
2 000
2 500
3 000
3 500
4 000 4 500
1 6 11 16 21 26 31 36 41 46
0
500
1 000
1 500
2 000
2 500
3 000
3 500
4 000
4 500
5 000
1 6 11 16 21 26 31 36 41 460
200
400
600
800
1 000
1 200
1 400
1 6 11 16 21 26 31 36 41 46
0
200
400
600
800
1 000
1 200
1 400
1 6 11 16 21 26 31 36 41 460
200
400
600
800
1 000
1 200
1 400
1 600
1 800
1 6 11 16 21 26 31 36 41 46
Vessel age (years)National flag Foreign flag
Vessel age (years)National flag Foreign flag Vessel age (years)National flag Foreign flag
Vessel age (years)National flag Foreign flag Vessel age (years)National flag Foreign flag
Vessel age (years)National flag Foreign flagVessel age (years)National flag Foreign flag
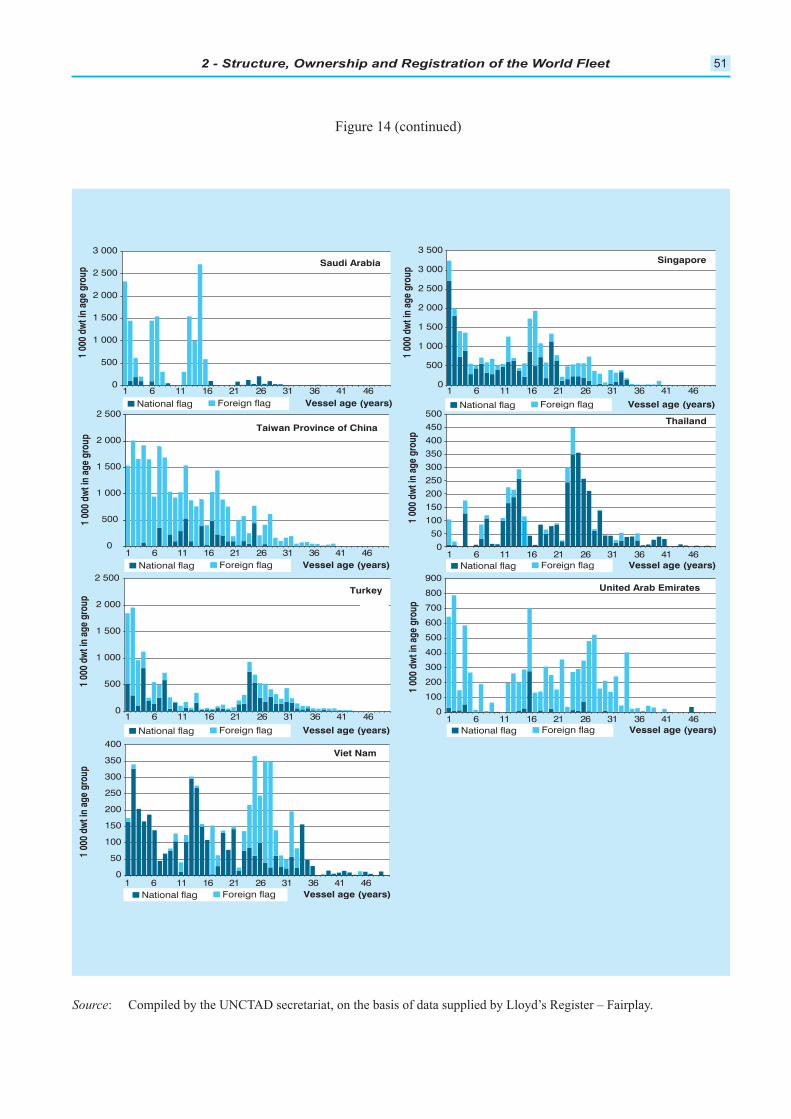
2 - Structure, Ownership and Registration of the World Fleet 51
Figure 14 (continued)
1 00
0 dw
t in
age
grou
p1
000
dwt i
n ag
e gr
oup
1 00
0 dw
t in
age
grou
p1
000
dwt i
n ag
e gr
oup
1 00
0 dw
t in
age
grou
p1
000
dwt i
n ag
e gr
oup
1 00
0 dw
t in
age
grou
p
Saudi Arabia
0
500
1 000
1 500
2 000
2 500
3 000
1 6 11 16 21 26 31 36 41 46
Taiwan Province of China
Turkey United Arab Emirates
Viet Nam
Thailand
Singapore
0
500
1 000
1 500
2 000
2 500
3 000
3 500
1 6 11 16 21 26 31 36 41 46
0 50
100 150 200 250 300 350 400 450 500
1 6 11 16 21 26 31 36 41 46
0
500
1 000
1 500
2 000
2 500
1 6 11 16 21 26 31 36 41 46 0
100
200
300
400
500
600
700
800
900
1 6 11 16 21 26 31 36 41 46
0
50
100
150
200
250
300
350
400
1 6 11 16 21 26 31 36 41 46
0
500
1 000
1 500
2 000
2 500
1 6 11 16 21 26 31 36 41 46
Vessel age (years)National flag Foreign flag Vessel age (years)National flag Foreign flag
Vessel age (years)National flag Foreign flag Vessel age (years)National flag Foreign flag
Vessel age (years)National flag Foreign flag Vessel age (years)National flag Foreign flag
Vessel age (years)National flag Foreign flag
: Compiled by the UNCTAD secretariat, on the basis of data supplied by Lloyd’s Register – Fairplay.
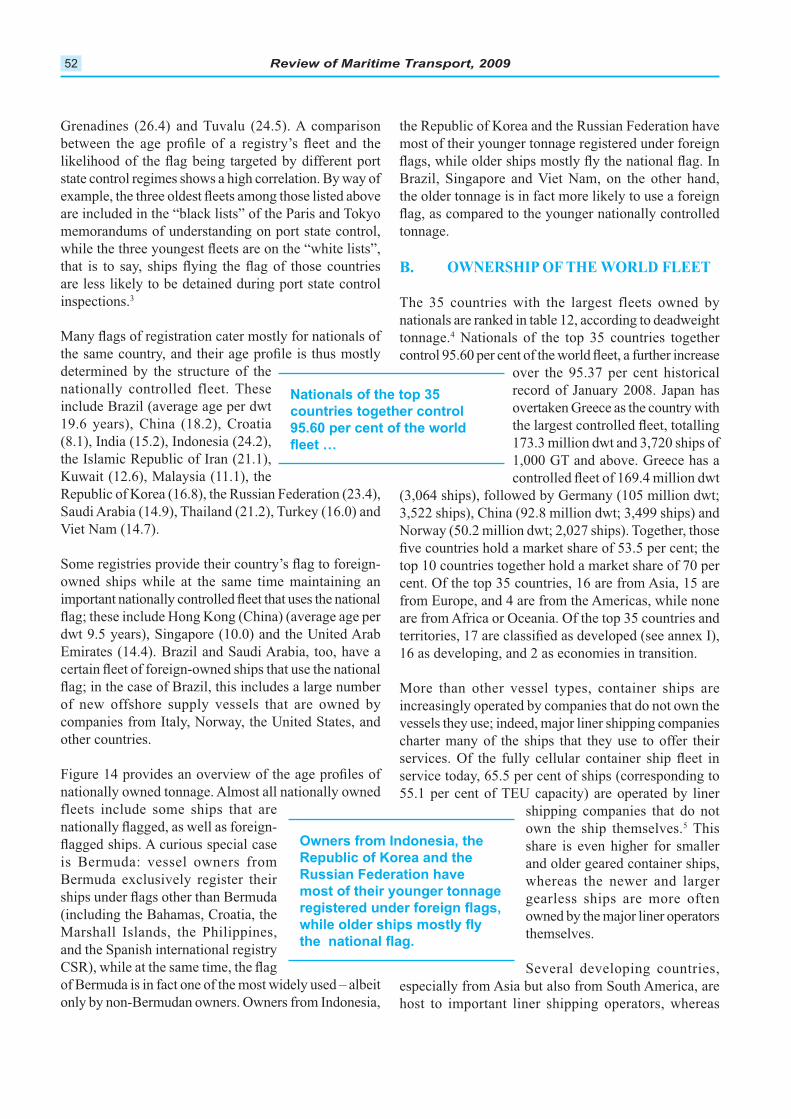
Review of Maritime Transport, 200952
are included in the “black lists” of the Paris and Tokyo
memorandums of understanding on port state control,
are less likely to be detained during port state control
inspections.3
determined by the structure of the
nationally controlled fleet. These
19.6 years), China (18.2), Croatia
Viet Nam (14.7).
owned ships while at the same time maintaining an
other countries.
nationally owned tonnage. Almost all nationally owned
fleets include some ships that are
most of their younger tonnage registered under foreign
the older tonnage is in fact more likely to use a foreign
tonnage.
OWNERSHIP OF THE WORLD FLEETB.
The 35 countries with the largest fleets owned by
nationals are ranked in table 12, according to deadweight
tonnage.4 Nationals of the top 35 countries together
record of January 2008. Japan has
173.3 million dwt and 3,720 ships of
top 10 countries together hold a market share of 70 per
cent. Of the top 35 countries, 16 are from Asia, 15 are
from Europe, and 4 are from the Americas, while none
are from Africa or Oceania. Of the top 35 countries and
increasingly operated by companies that do not own the
charter many of the ships that they use to offer their
55.1 per cent of TEU capacity) are operated by liner
shipping companies that do not 5 This
and older geared container ships,
whereas the newer and larger
gearless ships are more often
owned by the major liner operators
host to important liner shipping operators, whereas
Republic of Korea and the
most of their younger tonnage
Nationals of the top 35
countries together control
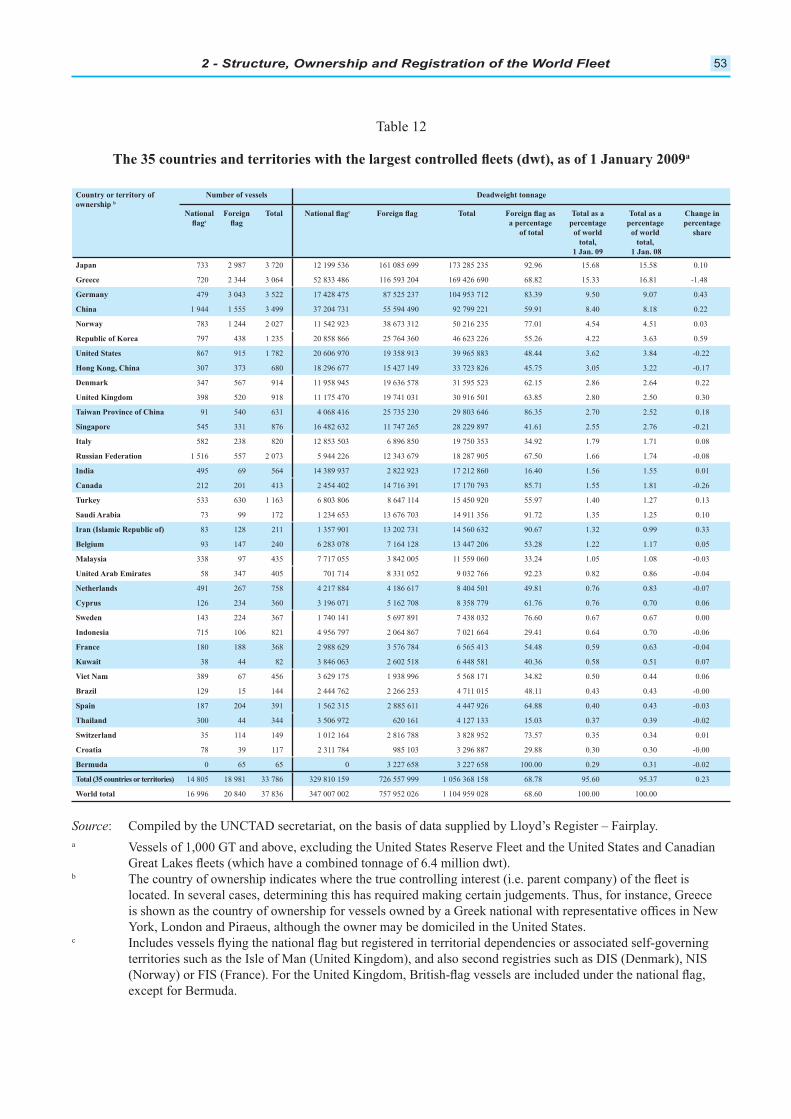
2 - Structure, Ownership and Registration of the World Fleet 53
Total Total
total, total,
733 2 987 3 720 12 199 536 161 085 699 173 285 235 92.96 15.68 15.58 0.10
720 2 344 3 064 52 833 486 116 593 204 169 426 690 68.82 15.33 16.81 -1.48
479 3 043 3 522 17 428 475 87 525 237 104 953 712 83.39 9.50 9.07 0.43
1 944 1 555 3 499 37 204 731 55 594 490 92 799 221 59.91 8.40 8.18 0.22
783 1 244 2 027 11 542 923 38 673 312 50 216 235 77.01 4.54 4.51 0.03
797 438 1 235 20 858 866 25 764 360 46 623 226 55.26 4.22 3.63 0.59
867 915 1 782 20 606 970 19 358 913 39 965 883 48.44 3.62 3.84 -0.22
307 373 680 18 296 677 15 427 149 33 723 826 45.75 3.05 3.22 -0.17
347 567 914 11 958 945 19 636 578 31 595 523 62.15 2.86 2.64 0.22
398 520 918 11 175 470 19 741 031 30 916 501 63.85 2.80 2.50 0.30
91 540 631 4 068 416 25 735 230 29 803 646 86.35 2.70 2.52 0.18
545 331 876 16 482 632 11 747 265 28 229 897 41.61 2.55 2.76 -0.21
Italy 582 238 820 12 853 503 6 896 850 19 750 353 34.92 1.79 1.71 0.08
1 516 557 2 073 5 944 226 12 343 679 18 287 905 67.50 1.66 1.74 -0.08
495 69 564 14 389 937 2 822 923 17 212 860 16.40 1.56 1.55 0.01
212 201 413 2 454 402 14 716 391 17 170 793 85.71 1.55 1.81 -0.26
533 630 1 163 6 803 806 8 647 114 15 450 920 55.97 1.40 1.27 0.13
73 99 172 1 234 653 13 676 703 14 911 356 91.72 1.35 1.25 0.10
83 128 211 1 357 901 13 202 731 14 560 632 90.67 1.32 0.99 0.33
93 147 240 6 283 078 7 164 128 13 447 206 53.28 1.22 1.17 0.05
338 97 435 7 717 055 3 842 005 11 559 060 33.24 1.05 1.08 -0.03
58 347 405 701 714 8 331 052 9 032 766 92.23 0.82 0.86 -0.04
491 267 758 4 217 884 4 186 617 8 404 501 49.81 0.76 0.83 -0.07
126 234 360 3 196 071 5 162 708 8 358 779 61.76 0.76 0.70 0.06
143 224 367 1 740 141 5 697 891 7 438 032 76.60 0.67 0.67 0.00
715 106 821 4 956 797 2 064 867 7 021 664 29.41 0.64 0.70 -0.06
180 188 368 2 988 629 3 576 784 6 565 413 54.48 0.59 0.63 -0.04
38 44 82 3 846 063 2 602 518 6 448 581 40.36 0.58 0.51 0.07
389 67 456 3 629 175 1 938 996 5 568 171 34.82 0.50 0.44 0.06
129 15 144 2 444 762 2 266 253 4 711 015 48.11 0.43 0.43 -0.00
187 204 391 1 562 315 2 885 611 4 447 926 64.88 0.40 0.43 -0.03
300 44 344 3 506 972 620 161 4 127 133 15.03 0.37 0.39 -0.02
35 114 149 1 012 164 2 816 788 3 828 952 73.57 0.35 0.34 0.01
78 39 117 2 311 784 985 103 3 296 887 29.88 0.30 0.30 -0.00
Bermuda 0 65 65 0 3 227 658 3 227 658 100.00 0.29 0.31 -0.02
14 805 18 981 33 786 329 810 159 726 557 999 1 056 368 158 68.78 95.60 95.37 0.23
World total 16 996 20 840 37 836 347 007 002 757 952 026 1 104 959 028 68.60 100.00 100.00
Table 12
a
: Compiled by the UNCTAD secretariat, on the basis of data supplied by Lloyd’s Register – Fairplay.
a
b
c
Review of Maritime Transport, 200954
their share among the shipowning companies is
the remainder are owned by German non-operating
This distinction between ownership and operation of
how and the costs of management skills may be more
REGISTRATION OF SHIPSC.
of 0.45 per cent compared to their
92.42 per cent share in January
2008 (table 13).6 The top 5 registries
together account for 49.95 per cent
of the world’s dwt, and the top 10
registries account for 70.49 per
with between 61 and 68 million dwt (between 5 and
and the Russian Federation (3,444). Except for Panama,
shipping.
2008, notably Viet Nam (+19.8 per cent), Germany
appears among the top 35 (it was still ranked 32 in
January 2008). The growth in Viet Nam, Germany
to nationally controlled tonnage, while the growth in
the 10 major open and international registries increased
their combined market share between 2008 and 2009 by
a further 0.77 percentage points to reach 55.11 per cent.
The 10 major open and international registries had their
highest shares among dry bulk carriers (60.6 per cent)
and oil tankers (55.6 per cent).
Excluding the 10 major open and international registries,
countries, with a particularly high share (27.1 per cent)
economies in transition accounted
for 1.1 per cent of the total world
the world’s tonnage is registered
and Oceania, including the open
countries, holding a particularly high share in the general
cent).
The following section will examine in more detail the
the 10 major open and international registries and the
35 major countries of ownership.
The top 5 registries together
account for 49.95 per cent
top 10 registries account for
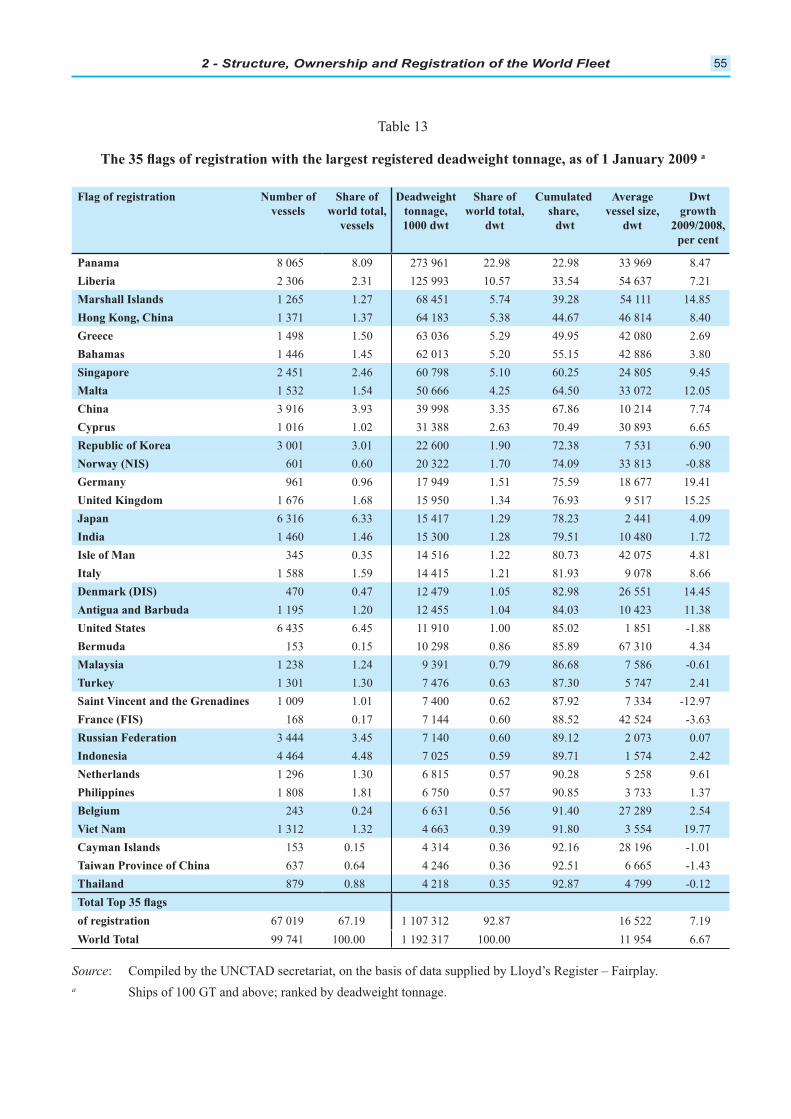
2 - Structure, Ownership and Registration of the World Fleet 55
Table 13
a
Cumulated
8 065 8.09 273 961 22.98 22.98 33 969 8.47
2 306 2.31 125 993 10.57 33.54 54 637 7.21
1 265 1.27 68 451 5.74 39.28 54 111 14.85
1 371 1.37 64 183 5.38 44.67 46 814 8.40
1 498 1.50 63 036 5.29 49.95 42 080 2.69
1 446 1.45 62 013 5.20 55.15 42 886 3.80
2 451 2.46 60 798 5.10 60.25 24 805 9.45
Malta 1 532 1.54 50 666 4.25 64.50 33 072 12.05
3 916 3.93 39 998 3.35 67.86 10 214 7.74
1 016 1.02 31 388 2.63 70.49 30 893 6.65
3 001 3.01 22 600 1.90 72.38 7 531 6.90
601 0.60 20 322 1.70 74.09 33 813 -0.88
961 0.96 17 949 1.51 75.59 18 677 19.41
1 676 1.68 15 950 1.34 76.93 9 517 15.25
6 316 6.33 15 417 1.29 78.23 2 441 4.09
1 460 1.46 15 300 1.28 79.51 10 480 1.72
345 0.35 14 516 1.22 80.73 42 075 4.81
Italy 1 588 1.59 14 415 1.21 81.93 9 078 8.66
470 0.47 12 479 1.05 82.98 26 551 14.45
1 195 1.20 12 455 1.04 84.03 10 423 11.38
6 435 6.45 11 910 1.00 85.02 1 851 -1.88
Bermuda 153 0.15 10 298 0.86 85.89 67 310 4.34
1 238 1.24 9 391 0.79 86.68 7 586 -0.61
1 301 1.30 7 476 0.63 87.30 5 747 2.41
1 009 1.01 7 400 0.62 87.92 7 334 -12.97
168 0.17 7 144 0.60 88.52 42 524 -3.63
3 444 3.45 7 140 0.60 89.12 2 073 0.07
4 464 4.48 7 025 0.59 89.71 1 574 2.42
1 296 1.30 6 815 0.57 90.28 5 258 9.61
1 808 1.81 6 750 0.57 90.85 3 733 1.37
243 0.24 6 631 0.56 91.40 27 289 2.54
1 312 1.32 4 663 0.39 91.80 3 554 19.77
153 0.15 4 314 0.36 92.16 28 196 -1.01
637 0.64 4 246 0.36 92.51 6 665 -1.43
879 0.88 4 218 0.35 92.87 4 799 -0.12
67 019 67.19 1 107 312 92.87 16 522 7.19
World Total 99 741 100.00 1 192 317 100.00 11 954 6.67
: Compiled by the UNCTAD secretariat, on the basis of data supplied by Lloyd’s Register – Fairplay.
a
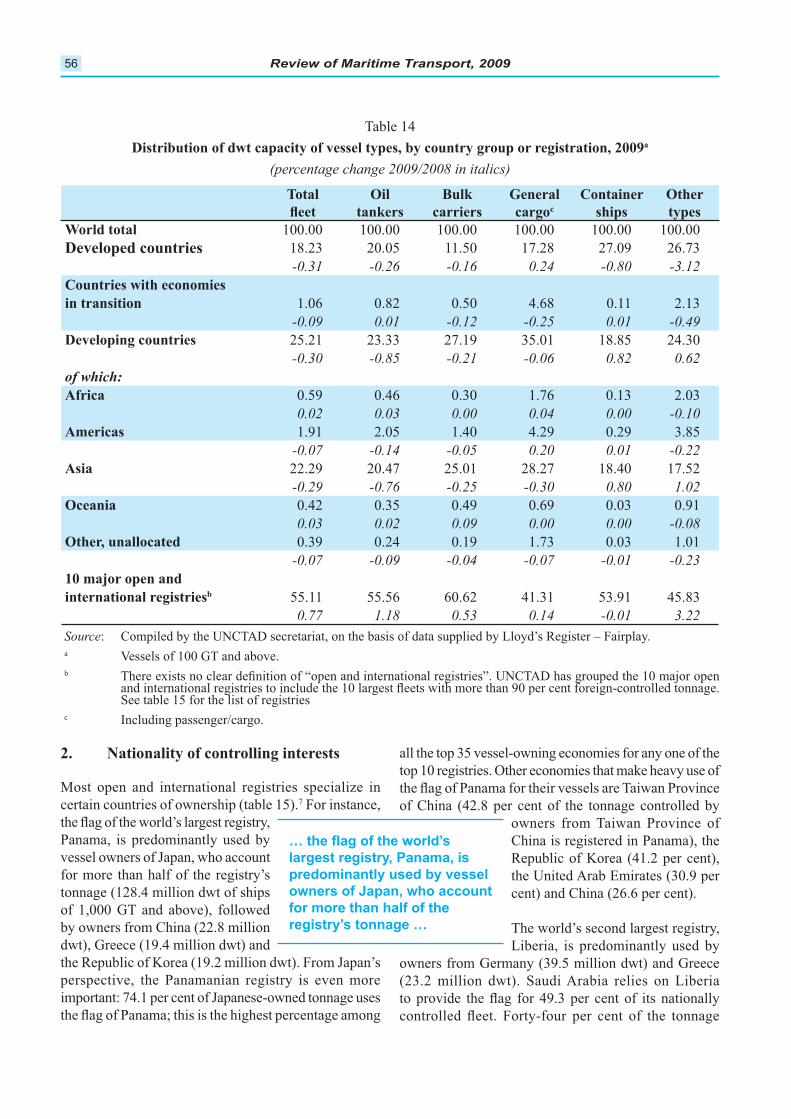
Review of Maritime Transport, 200956
certain countries of ownership (table 15).7 For instance,
Panama, is predominantly used by
for more than half of the registry’s
tonnage (128.4 million dwt of ships
by owners from China (22.8 million
dwt), Greece (19.4 million dwt) and
important: 74.1 per cent of Japanese-owned tonnage uses
of China (42.8 per cent of the tonnage controlled by
China is registered in Panama), the
the United Arab Emirates (30.9 per
cent) and China (26.6 per cent).
The world’s second largest registry,
Liberia, is predominantly used by
owners from Germany (39.5 million dwt) and Greece
Total Other
World total 100.00 100.00 100.00 100.00 100.00 100.00
18.23 20.05 11.50 17.28 27.09 26.73
-0.31 -0.26 -0.16 0.24 -0.80 -3.12
1.06 0.82 0.50 4.68 0.11 2.13
-0.09 0.01 -0.12 -0.25 0.01 -0.49
25.21 23.33 27.19 35.01 18.85 24.30
-0.30 -0.85 -0.21 -0.06 0.82 0.62
of which:
0.59 0.46 0.30 1.76 0.13 2.03
0.02 0.03 0.00 0.04 0.00 -0.10
1.91 2.05 1.40 4.29 0.29 3.85
-0.07 -0.14 -0.05 0.20 0.01 -0.22
22.29 20.47 25.01 28.27 18.40 17.52
-0.29 -0.76 -0.25 -0.30 0.80 1.02
0.42 0.35 0.49 0.69 0.03 0.91
0.03 0.02 0.09 0.00 0.00 -0.08
0.39 0.24 0.19 1.73 0.03 1.01
-0.07 -0.09 -0.04 -0.07 -0.01 -0.23
55.11 55.56 60.62 41.31 53.91 45.83
0.77 1.18 0.53 0.14 -0.01 3.22
Table 14a
largest registry, Panama, is
for more than half of the
: Compiled by the UNCTAD secretariat, on the basis of data supplied by Lloyd’s Register – Fairplay.a
b
c
2 - Structure, Ownership and Registration of the World Fleet 57
tonnage of the top 35 shipowning countries, albeit only
to 6.1 per cent of the number of ships, which is due to the
owned by interests from Greece (16.1 million dwt),
(10.4 million dwt). This registry is of particular
nationally controlled tonnage.
Greece (13.1 million dwt) and
Germany (4.2 million dwt), and
also on owners from Cyprus itself
(3.2 million dwt). Only 38.2 per
cent of the Cypriot-owned fleet
Greece (4.6 million dwt) and Norway (2.1 million dwt).
as 19.1 per cent of the tonnage owned by the United
predominantly for tonnage owned by Greece (12.6 million
dwt), Canada (8.5 million dwt) and Norway (6.7 million
dwt). Of Canadian-controlled tonnage, 49.4 per cent
27.1 per cent of the fleet owned
Dutch-controlled tonnage, and
owned tonnage (10.5 million dwt),
which accounts for an 89.9 per cent share among
the top 35 shipowning countries. This is the highest
dependency among the top 10 registries. From the
the registry of tonnage from China (2.2 million dwt) and
dwt owned by Chinese interests, and 1.7 million dwt
owned by interests from Greece. This registry caters
depends on it for a particularly high percentage of its
nationally owned tonnage.
8 Another
built in the country of ownership, this
increases the likelihood of remaining
from high-income countries are more
owners from countries with a lower
GDP per capita or with low human
low literacy rate or life expectancy. These indicators are
countries with lower wages.
SHIPBUILDING, DEMOLITION ANDD.
2008. Although new orders for
be constructed in line with orders
placed prior to the economic crisis,
especially in the dry bulk segment. continued to be constructed

Review of Maritime Transport, 200958
% % %
2 292 128 423 53.3 115 6 996 6.0 23 2 234 3.7
503 19 429 8.1 387 23 155 19.9 282 16 051 26.7
95 7 501 3.1 857 39 527 34.0 233 10 449 17.4
558 22 818 9.5 12 364 0.3 10 789 1.3
134 4 540 1.9 49 2 164 1.9 86 6 185 10.3
324 19 209 8.0 5 124 0.1 13 1 059 1.8
172 3 065 1.3 105 3 698 3.2 170 11 788 19.6
127 4 864 2.0 60 3 672 3.2 7 283 0.5
40 1 063 0.4 9 275 0.2 9 521 0.9
56 1 305 0.5 30 1 345 1.2 16 798 1.3
332 12 753 5.3 92 7 186 6.2 1 276 0.5
92 2 668 1.1 36 4 420 3.8 20 952 1.6
Italy 31 788 0.3 48 2 953 2.5 3 127 0.2
24 238 0.1 95 8 049 6.9 9 163 0.3
25 859 0.4 1 150 0.1 2 310 0.5
11 975 0.4 5 215 0.2 0 -
96 782 0.3 12 228 0.2 57 2 344 3.9
8 191 0.1 28 7 353 6.3 4 1 242 2.1
8 68 0.0 0 - 0 -
3 192 0.1 1 14 0.0 1 442 0.7
17 296 0.1 0 - 8 47 0.1
118 2 788 1.2 27 1 556 1.3 16 511 0.9
29 242 0.1 6 74 0.1 10 164 0.3
14 781 0.3 38 764 0.7 42 1 113 1.9
7 72 0.0 10 421 0.4 6 57 0.1
26 498 0.2 2 234 0.2 0 -
7 188 0.1 4 159 0.1 0 -
9 565 0.2 0 - 0 -
35 1 126 0.5 4 204 0.2 0 -
8 1 367 0.6 3 456 0.4 1 280 0.5
51 336 0.1 0 - 1 94 0.2
11 63 0.0 0 - 0 -
32 828 0.3 11 318 0.3 11 374 0.6
3 35 0.0 2 31 0.0 8 213 0.4
Bermuda 0 - 0 - 11 1 255 2.1
5 298 240 917 100.0 2 054 116 104 100.0 1 060 60 122 100.0
15.7 22.8 6.1 11.0 3.1 5.7
Table 15
a
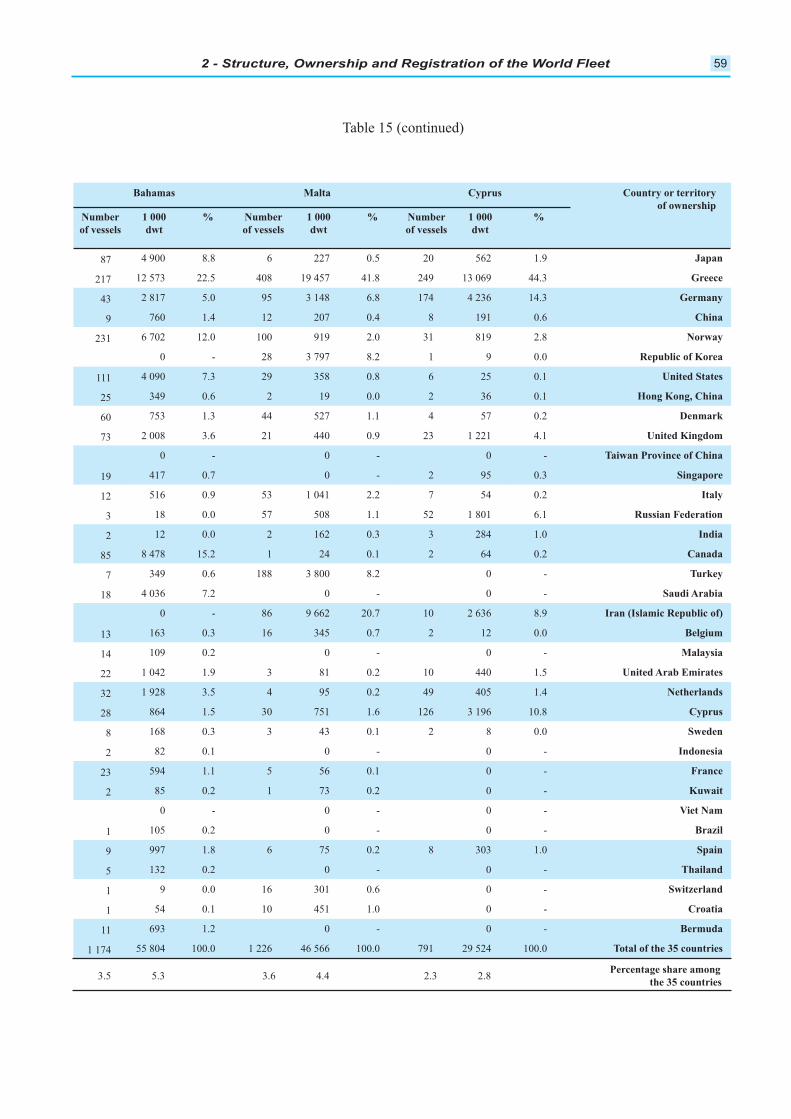
2 - Structure, Ownership and Registration of the World Fleet 59
Malta
% % %
87 4 900 8.8 6 227 0.5 20 562 1.9
217 12 573 22.5 408 19 457 41.8 249 13 069 44.3
43 2 817 5.0 95 3 148 6.8 174 4 236 14.3
9 760 1.4 12 207 0.4 8 191 0.6
231 6 702 12.0 100 919 2.0 31 819 2.8
0 - 28 3 797 8.2 1 9 0.0
111 4 090 7.3 29 358 0.8 6 25 0.1
25 349 0.6 2 19 0.0 2 36 0.1
60 753 1.3 44 527 1.1 4 57 0.2
73 2 008 3.6 21 440 0.9 23 1 221 4.1
0 - 0 - 0 -
19 417 0.7 0 - 2 95 0.3
12 516 0.9 53 1 041 2.2 7 54 0.2 Italy
3 18 0.0 57 508 1.1 52 1 801 6.1
2 12 0.0 2 162 0.3 3 284 1.0
85 8 478 15.2 1 24 0.1 2 64 0.2
7 349 0.6 188 3 800 8.2 0 -
18 4 036 7.2 0 - 0 -
0 - 86 9 662 20.7 10 2 636 8.9
13 163 0.3 16 345 0.7 2 12 0.0
14 109 0.2 0 - 0 -
22 1 042 1.9 3 81 0.2 10 440 1.5
32 1 928 3.5 4 95 0.2 49 405 1.4
28 864 1.5 30 751 1.6 126 3 196 10.8
8 168 0.3 3 43 0.1 2 8 0.0
2 82 0.1 0 - 0 -
23 594 1.1 5 56 0.1 0 -
2 85 0.2 1 73 0.2 0 -
0 - 0 - 0 -
1 105 0.2 0 - 0 -
9 997 1.8 6 75 0.2 8 303 1.0
5 132 0.2 0 - 0 -
1 9 0.0 16 301 0.6 0 -
1 54 0.1 10 451 1.0 0 -
11 693 1.2 0 - 0 - Bermuda
1 174 55 804 100.0 1 226 46 566 100.0 791 29 524 100.0
3.5 5.3 3.6 4.4 2.3 2.8
Table 15 (continued)
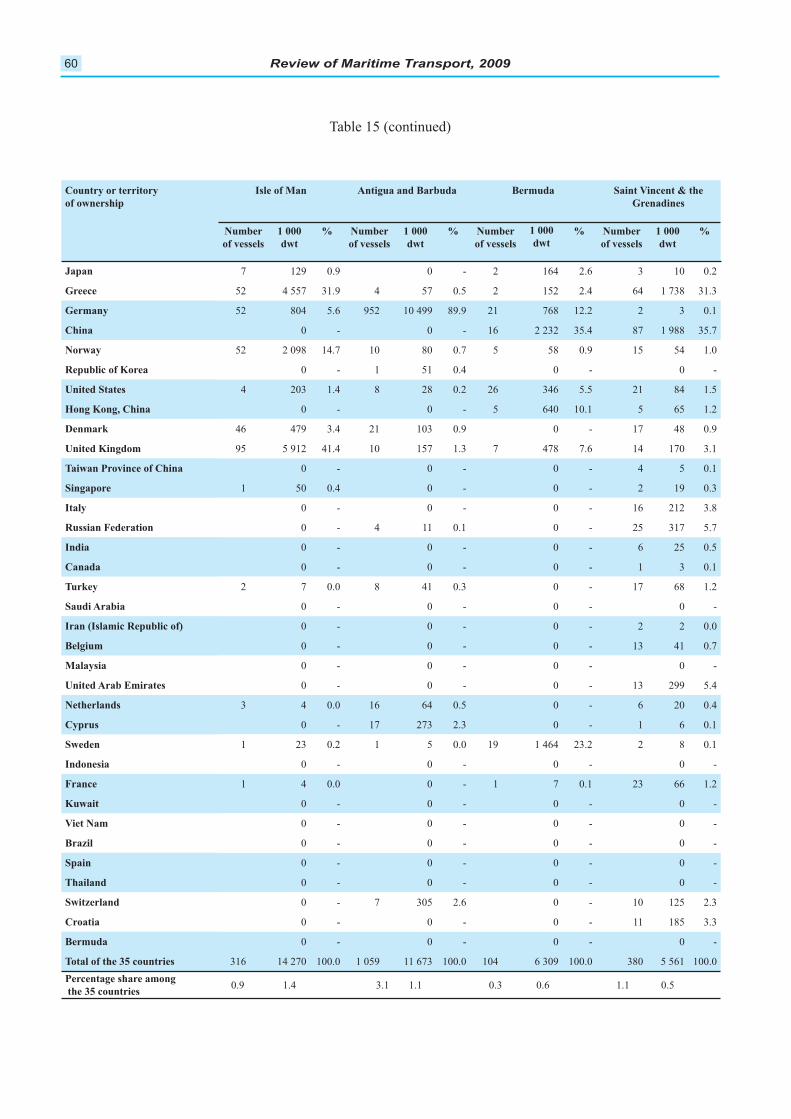
Review of Maritime Transport, 200960
Bermuda
% % % %
7 129 0.9 0 - 2 164 2.6 3 10 0.2
52 4 557 31.9 4 57 0.5 2 152 2.4 64 1 738 31.3
52 804 5.6 952 10 499 89.9 21 768 12.2 2 3 0.1
0 - 0 - 16 2 232 35.4 87 1 988 35.7
52 2 098 14.7 10 80 0.7 5 58 0.9 15 54 1.0
0 - 1 51 0.4 0 - 0 -
4 203 1.4 8 28 0.2 26 346 5.5 21 84 1.5
0 - 0 - 5 640 10.1 5 65 1.2
46 479 3.4 21 103 0.9 0 - 17 48 0.9
95 5 912 41.4 10 157 1.3 7 478 7.6 14 170 3.1
0 - 0 - 0 - 4 5 0.1
1 50 0.4 0 - 0 - 2 19 0.3
Italy 0 - 0 - 0 - 16 212 3.8
0 - 4 11 0.1 0 - 25 317 5.7
0 - 0 - 0 - 6 25 0.5
0 - 0 - 0 - 1 3 0.1
2 7 0.0 8 41 0.3 0 - 17 68 1.2
0 - 0 - 0 - 0 -
0 - 0 - 0 - 2 2 0.0
0 - 0 - 0 - 13 41 0.7
0 - 0 - 0 - 0 -
0 - 0 - 0 - 13 299 5.4
3 4 0.0 16 64 0.5 0 - 6 20 0.4
0 - 17 273 2.3 0 - 1 6 0.1
1 23 0.2 1 5 0.0 19 1 464 23.2 2 8 0.1
0 - 0 - 0 - 0 -
1 4 0.0 0 - 1 7 0.1 23 66 1.2
0 - 0 - 0 - 0 -
0 - 0 - 0 - 0 -
0 - 0 - 0 - 0 -
0 - 0 - 0 - 0 -
0 - 0 - 0 - 0 -
0 - 7 305 2.6 0 - 10 125 2.3
0 - 0 - 0 - 11 185 3.3
Bermuda 0 - 0 - 0 - 0 -
316 14 270 100.0 1 059 11 673 100.0 104 6 309 100.0 380 5 561 100.0
0.9 1.4 3.1 1.1 0.3 0.6 1.1 0.5
Table 15 (continued)
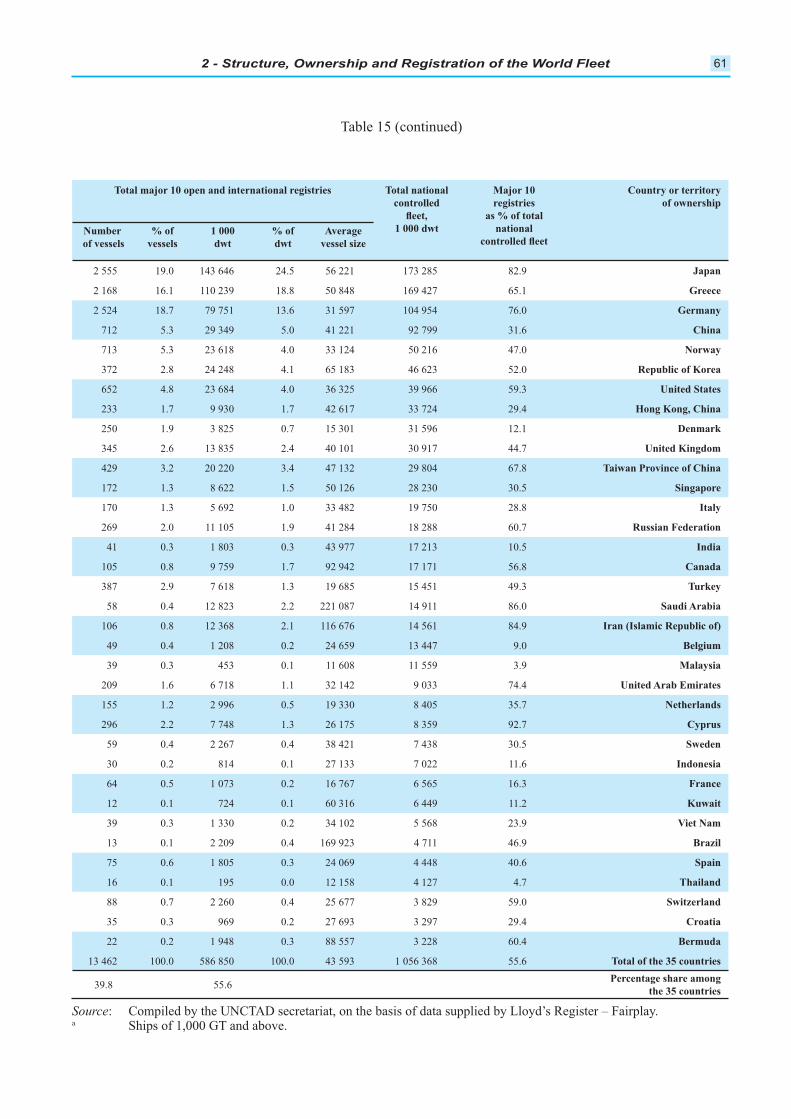
2 - Structure, Ownership and Registration of the World Fleet 61
2 555 19.0 143 646 24.5 56 221 173 285 82.9
2 168 16.1 110 239 18.8 50 848 169 427 65.1
2 524 18.7 79 751 13.6 31 597 104 954 76.0
712 5.3 29 349 5.0 41 221 92 799 31.6
713 5.3 23 618 4.0 33 124 50 216 47.0
372 2.8 24 248 4.1 65 183 46 623 52.0
652 4.8 23 684 4.0 36 325 39 966 59.3
233 1.7 9 930 1.7 42 617 33 724 29.4
250 1.9 3 825 0.7 15 301 31 596 12.1
345 2.6 13 835 2.4 40 101 30 917 44.7
429 3.2 20 220 3.4 47 132 29 804 67.8
172 1.3 8 622 1.5 50 126 28 230 30.5
170 1.3 5 692 1.0 33 482 19 750 28.8 Italy
269 2.0 11 105 1.9 41 284 18 288 60.7
41 0.3 1 803 0.3 43 977 17 213 10.5
105 0.8 9 759 1.7 92 942 17 171 56.8
387 2.9 7 618 1.3 19 685 15 451 49.3
58 0.4 12 823 2.2 221 087 14 911 86.0
106 0.8 12 368 2.1 116 676 14 561 84.9
49 0.4 1 208 0.2 24 659 13 447 9.0
39 0.3 453 0.1 11 608 11 559 3.9
209 1.6 6 718 1.1 32 142 9 033 74.4
155 1.2 2 996 0.5 19 330 8 405 35.7
296 2.2 7 748 1.3 26 175 8 359 92.7
59 0.4 2 267 0.4 38 421 7 438 30.5
30 0.2 814 0.1 27 133 7 022 11.6
64 0.5 1 073 0.2 16 767 6 565 16.3
12 0.1 724 0.1 60 316 6 449 11.2
39 0.3 1 330 0.2 34 102 5 568 23.9
13 0.1 2 209 0.4 169 923 4 711 46.9
75 0.6 1 805 0.3 24 069 4 448 40.6
16 0.1 195 0.0 12 158 4 127 4.7
88 0.7 2 260 0.4 25 677 3 829 59.0
35 0.3 969 0.2 27 693 3 297 29.4
22 0.2 1 948 0.3 88 557 3 228 60.4 Bermuda
13 462 100.0 586 850 100.0 43 593 1 056 368 55.6
39.8 55.6
Table 15 (continued)
: Compiled by the UNCTAD secretariat, on the basis of data supplied by Lloyd’s Register – Fairplay.a
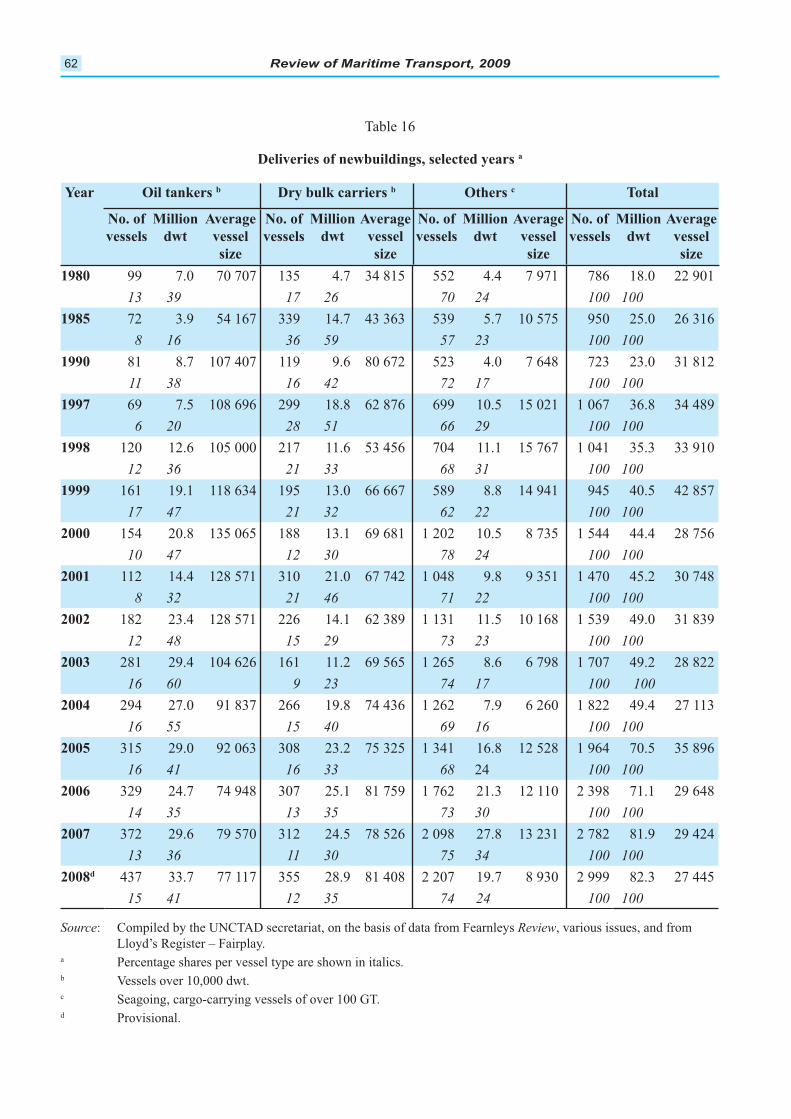
Review of Maritime Transport, 200962
99 7.0 70 707 135 4.7 34 815 552 4.4 7 971 786 18.0 22 901
13 39 17 26 70 24 100 100
72 3.9 54 167 339 14.7 43 363 539 5.7 10 575 950 25.0 26 316
8 16 36 59 57 23 100 100
81 8.7 107 407 119 9.6 80 672 523 4.0 7 648 723 23.0 31 812
11 38 16 42 72 17 100 100
69 7.5 108 696 299 18.8 62 876 699 10.5 15 021 1 067 36.8 34 489
6 20 28 51 66 29 100 100
120 12.6 105 000 217 11.6 53 456 704 11.1 15 767 1 041 35.3 33 910
12 36 21 33 68 31 100 100
161 19.1 118 634 195 13.0 66 667 589 8.8 14 941 945 40.5 42 857
17 47 21 32 62 22 100 100
154 20.8 135 065 188 13.1 69 681 1 202 10.5 8 735 1 544 44.4 28 756
10 47 12 30 78 24 100 100
112 14.4 128 571 310 21.0 67 742 1 048 9.8 9 351 1 470 45.2 30 748
8 32 21 46 71 22 100 100
182 23.4 128 571 226 14.1 62 389 1 131 11.5 10 168 1 539 49.0 31 839
12 48 15 29 73 23 100 100
281 29.4 104 626 161 11.2 69 565 1 265 8.6 6 798 1 707 49.2 28 822
16 60 9 23 74 17 100 100
294 27.0 91 837 266 19.8 74 436 1 262 7.9 6 260 1 822 49.4 27 113
16 55 15 40 69 16 100 100
315 29.0 92 063 308 23.2 75 325 1 341 16.8 12 528 1 964 70.5 35 896
16 41 16 33 68 24 100 100
329 24.7 74 948 307 25.1 81 759 1 762 21.3 12 110 2 398 71.1 29 648
14 35 13 35 73 30 100 100
372 29.6 79 570 312 24.5 78 526 2 098 27.8 13 231 2 782 81.9 29 424
13 36 11 30 75 34 100 100d 437 33.7 77 117 355 28.9 81 408 2 207 19.7 8 930 2 999 82.3 27 445
15 41 12 35 74 24 100 100
Year Total
Table 16
a
S : Compiled by the UNCTAD secretariat, on the basis of data from Fearnleys Review
Lloyd’s Register – Fairplay.a
b
c
d
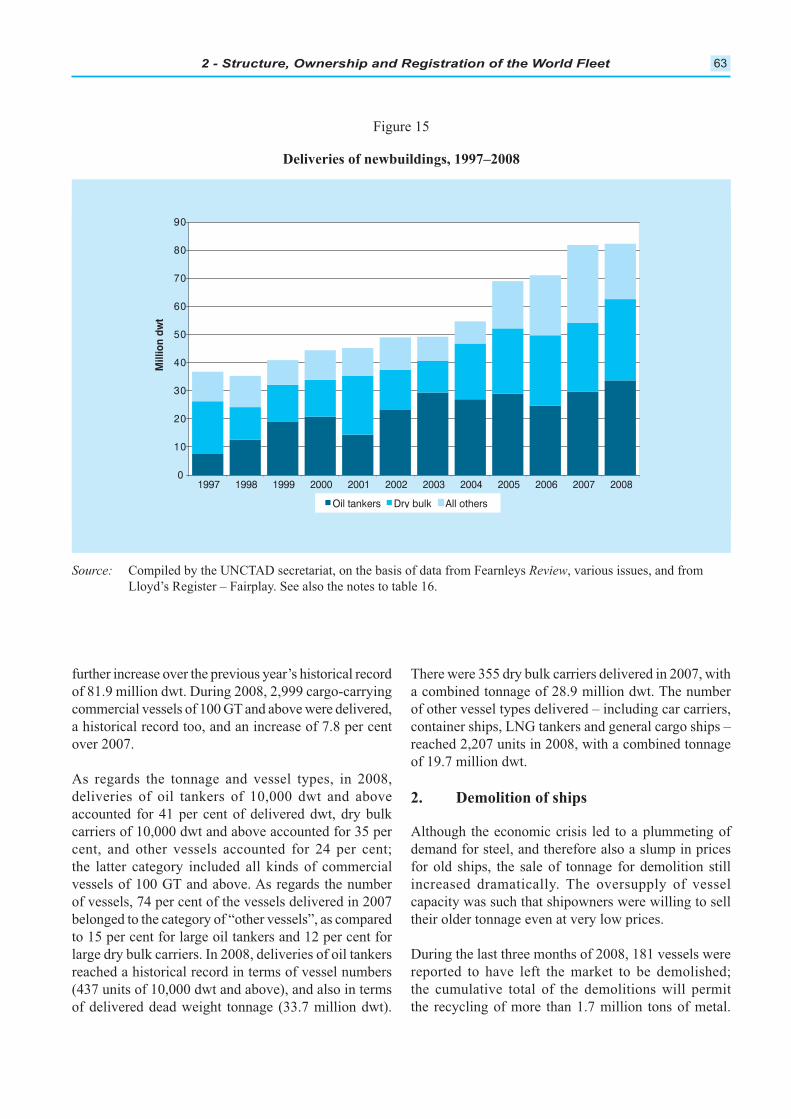
2 - Structure, Ownership and Registration of the World Fleet 63
Figure 15
Compiled by the UNCTAD secretariat, on the basis of data from Fearnleys Review
0
10
20
30
40
50
60
70
80
90
1997 1998 1999 2000 2001 2002 2003 2004 2005 2006 2007 2008
Mill
ion
dwt
Oil tankers Dry bulk All others
of 81.9 million dwt. During 2008, 2,999 cargo-carrying
a historical record too, and an increase of 7.8 per cent
the latter category included all kinds of commercial
to 15 per cent for large oil tankers and 12 per cent for
a combined tonnage of 28.9 million dwt. The number
container ships, LNG tankers and general cargo ships –
reached 2,207 units in 2008, with a combined tonnage
of 19.7 million dwt.
Although the economic crisis led to a plummeting of
demand for steel, and therefore also a slump in prices
for old ships, the sale of tonnage for demolition still
capacity was such that shipowners were willing to sell
the recycling of more than 1.7 million tons of metal.
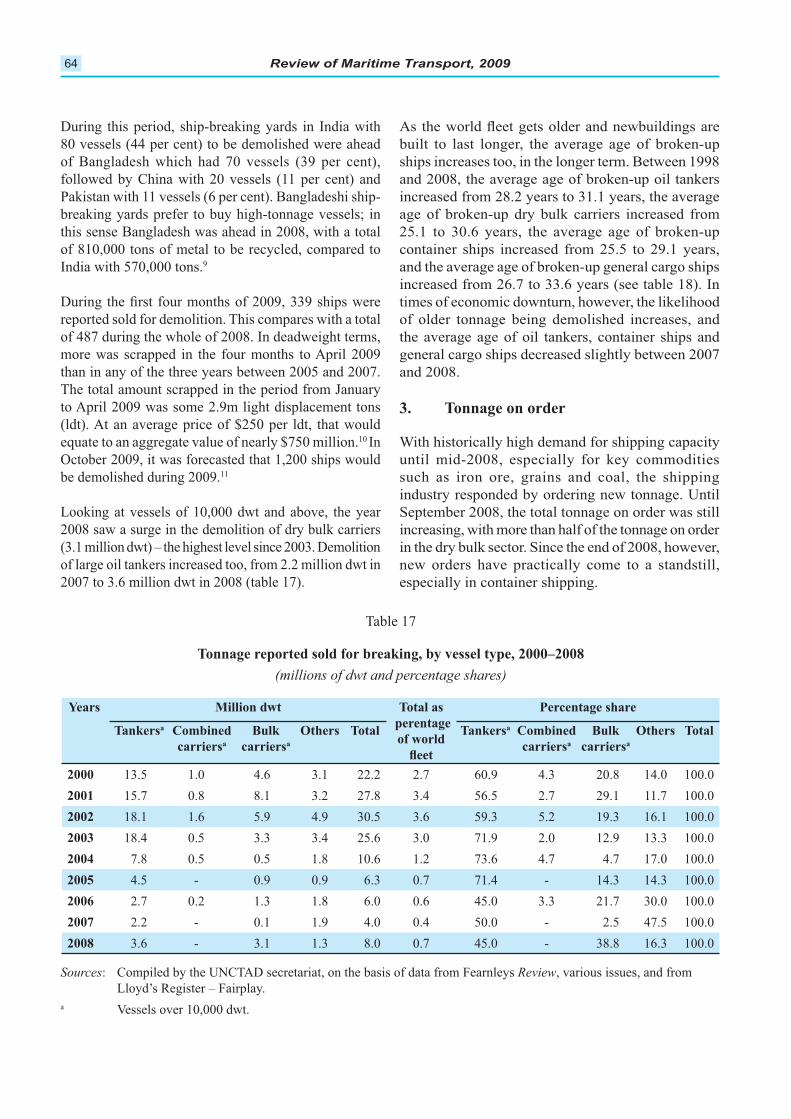
Review of Maritime Transport, 200964
of 810,000 tons of metal to be recycled, compared to 9
reported sold for demolition. This compares with a total
more was scrapped in the four months to April 2009
than in any of the three years between 2005 and 2007.
The total amount scrapped in the period from January
to April 2009 was some 2.9m light displacement tons
10
October 2009, it was forecasted that 1,200 ships would
be demolished during 2009.11
2008 saw a surge in the demolition of dry bulk carriers
of large oil tankers increased too, from 2.2 million dwt in
2007 to 3.6 million dwt in 2008 (table 17).
age of broken-up dry bulk carriers increased from
container ships increased from 25.5 to 29.1 years,
of older tonnage being demolished increases, and
general cargo ships decreased slightly between 2007
and 2008.
until mid-2008, especially for key commodities
such as iron ore, grains and coal, the shipping
industry responded by ordering new tonnage. Until
increasing, with more than half of the tonnage on order
especially in container shipping.
a
a a
Total a
a a
Total
13.5 1.0 4.6 3.1 22.2 2.7 60.9 4.3 20.8 14.0 100.0
15.7 0.8 8.1 3.2 27.8 3.4 56.5 2.7 29.1 11.7 100.0
18.1 1.6 5.9 4.9 30.5 3.6 59.3 5.2 19.3 16.1 100.0
18.4 0.5 3.3 3.4 25.6 3.0 71.9 2.0 12.9 13.3 100.0
7.8 0.5 0.5 1.8 10.6 1.2 73.6 4.7 4.7 17.0 100.0
4.5 - 0.9 0.9 6.3 0.7 71.4 - 14.3 14.3 100.0
2.7 0.2 1.3 1.8 6.0 0.6 45.0 3.3 21.7 30.0 100.0
2.2 - 0.1 1.9 4.0 0.4 50.0 - 2.5 47.5 100.0
3.6 - 3.1 1.3 8.0 0.7 45.0 - 38.8 16.3 100.0
S : Compiled by the UNCTAD secretariat, on the basis of data from Fearnleys Review
Lloyd’s Register – Fairplay.
a
Table 17
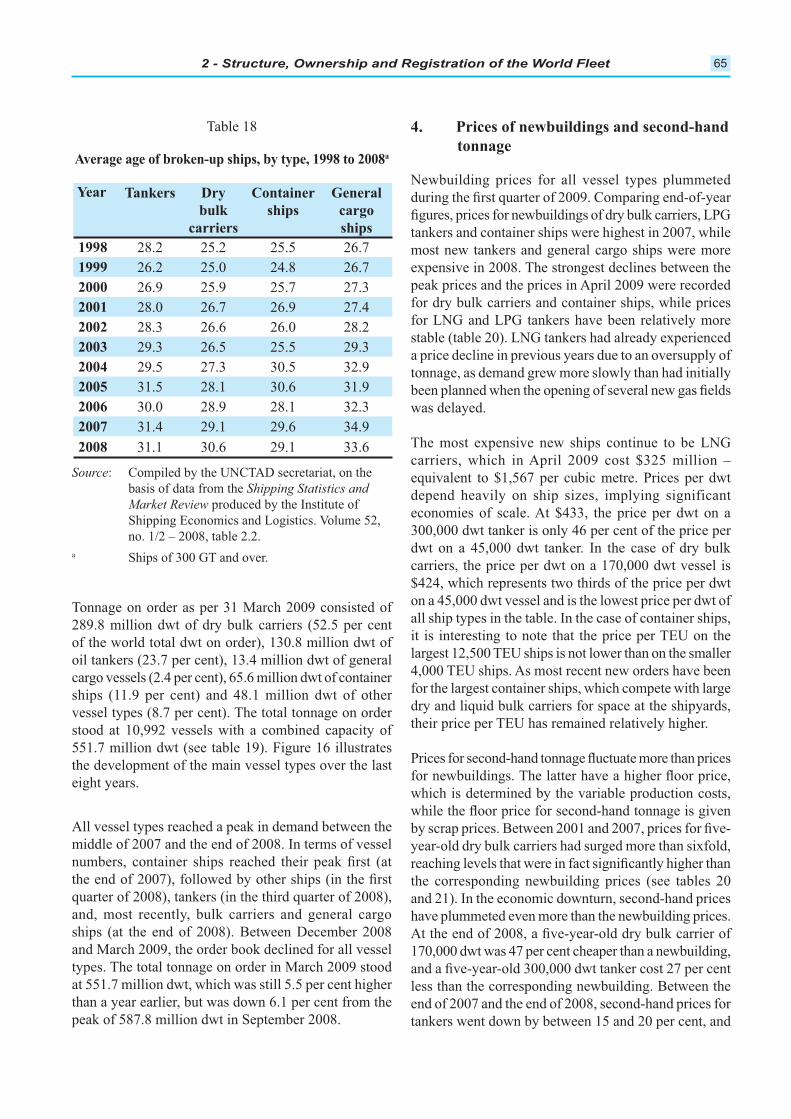
2 - Structure, Ownership and Registration of the World Fleet 65
Year Dry
28.2 25.2 25.5 26.7
26.2 25.0 24.8 26.7
26.9 25.9 25.7 27.3
28.0 26.7 26.9 27.4
28.3 26.6 26.0 28.2
29.3 26.5 25.5 29.3
29.5 27.3 30.5 32.9
31.5 28.1 30.6 31.9
30.0 28.9 28.1 32.3
31.4 29.1 29.6 34.9
31.1 30.6 29.1 33.6
Table 18
a
: Compiled by the UNCTAD secretariat, on the
basis of data from the Shipping Statistics and
Market Review
a
289.8 million dwt of dry bulk carriers (52.5 per cent
of the world total dwt on order), 130.8 million dwt of
oil tankers (23.7 per cent), 13.4 million dwt of general
ships (11.9 per cent) and 48.1 million dwt of other
551.7 million dwt (see table 19). Figure 16 illustrates
eight years.
quarter of 2008), tankers (in the third quarter of 2008),
and, most recently, bulk carriers and general cargo
at 551.7 million dwt, which was still 5.5 per cent higher
than a year earlier, but was down 6.1 per cent from the
tankers and container ships were highest in 2007, while
most new tankers and general cargo ships were more
peak prices and the prices in April 2009 were recorded
for dry bulk carriers and container ships, while prices
stable (table 20). LNG tankers had already experienced
tonnage, as demand grew more slowly than had initially
was delayed.
300,000 dwt tanker is only 46 per cent of the price per
it is interesting to note that the price per TEU on the
largest 12,500 TEU ships is not lower than on the smaller
for the largest container ships, which compete with large
dry and liquid bulk carriers for space at the shipyards,
year-old dry bulk carriers had surged more than sixfold,
the corresponding newbuilding prices (see tables 20
170,000 dwt was 47 per cent cheaper than a newbuilding,
end of 2007 and the end of 2008, second-hand prices for
tankers went down by between 15 and 20 per cent, and
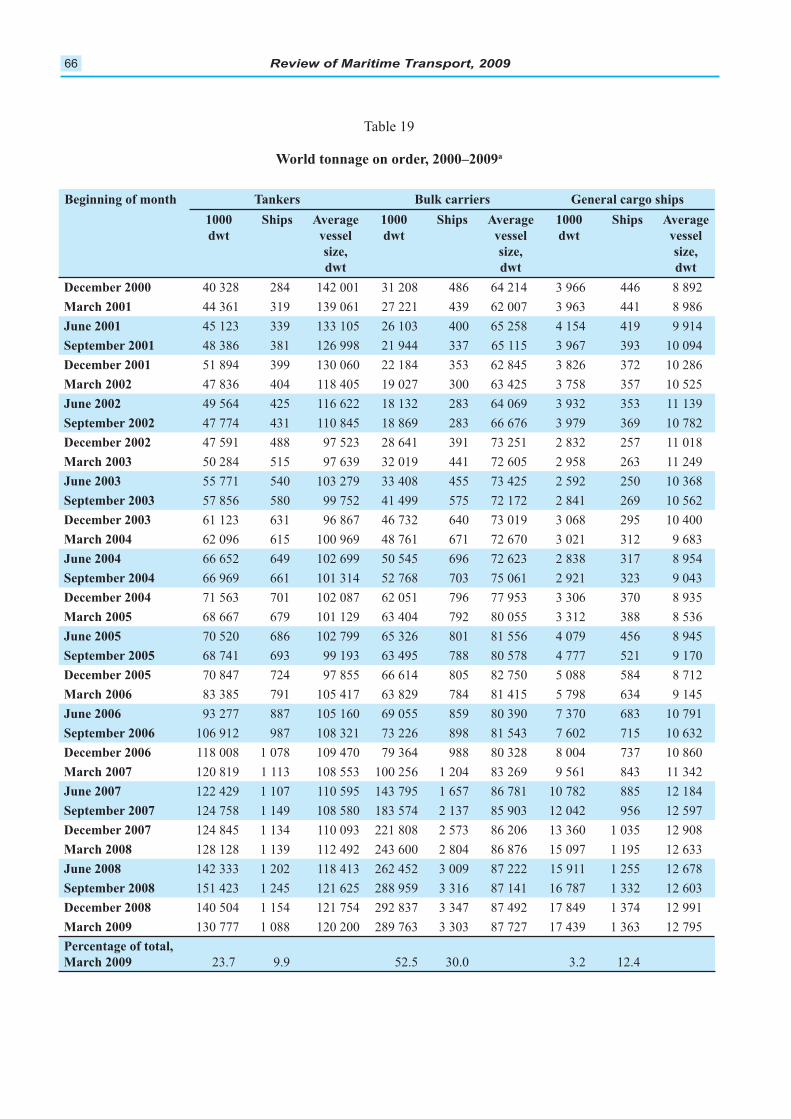
Review of Maritime Transport, 200966
40 328 284 142 001 31 208 486 64 214 3 966 446 8 892
44 361 319 139 061 27 221 439 62 007 3 963 441 8 986
45 123 339 133 105 26 103 400 65 258 4 154 419 9 914
48 386 381 126 998 21 944 337 65 115 3 967 393 10 094
51 894 399 130 060 22 184 353 62 845 3 826 372 10 286
47 836 404 118 405 19 027 300 63 425 3 758 357 10 525
49 564 425 116 622 18 132 283 64 069 3 932 353 11 139
47 774 431 110 845 18 869 283 66 676 3 979 369 10 782
47 591 488 97 523 28 641 391 73 251 2 832 257 11 018
50 284 515 97 639 32 019 441 72 605 2 958 263 11 249
55 771 540 103 279 33 408 455 73 425 2 592 250 10 368
57 856 580 99 752 41 499 575 72 172 2 841 269 10 562
61 123 631 96 867 46 732 640 73 019 3 068 295 10 400
62 096 615 100 969 48 761 671 72 670 3 021 312 9 683
66 652 649 102 699 50 545 696 72 623 2 838 317 8 954
66 969 661 101 314 52 768 703 75 061 2 921 323 9 043
71 563 701 102 087 62 051 796 77 953 3 306 370 8 935
68 667 679 101 129 63 404 792 80 055 3 312 388 8 536
70 520 686 102 799 65 326 801 81 556 4 079 456 8 945
68 741 693 99 193 63 495 788 80 578 4 777 521 9 170
70 847 724 97 855 66 614 805 82 750 5 088 584 8 712
83 385 791 105 417 63 829 784 81 415 5 798 634 9 145
93 277 887 105 160 69 055 859 80 390 7 370 683 10 791
106 912 987 108 321 73 226 898 81 543 7 602 715 10 632
118 008 1 078 109 470 79 364 988 80 328 8 004 737 10 860
120 819 1 113 108 553 100 256 1 204 83 269 9 561 843 11 342
122 429 1 107 110 595 143 795 1 657 86 781 10 782 885 12 184
124 758 1 149 108 580 183 574 2 137 85 903 12 042 956 12 597
124 845 1 134 110 093 221 808 2 573 86 206 13 360 1 035 12 908
128 128 1 139 112 492 243 600 2 804 86 876 15 097 1 195 12 633
142 333 1 202 118 413 262 452 3 009 87 222 15 911 1 255 12 678
151 423 1 245 121 625 288 959 3 316 87 141 16 787 1 332 12 603
140 504 1 154 121 754 292 837 3 347 87 492 17 849 1 374 12 991
130 777 1 088 120 200 289 763 3 303 87 727 17 439 1 363 12 795
23.7 9.9 52.5 30.0 3.2 12.4
Table 19
a
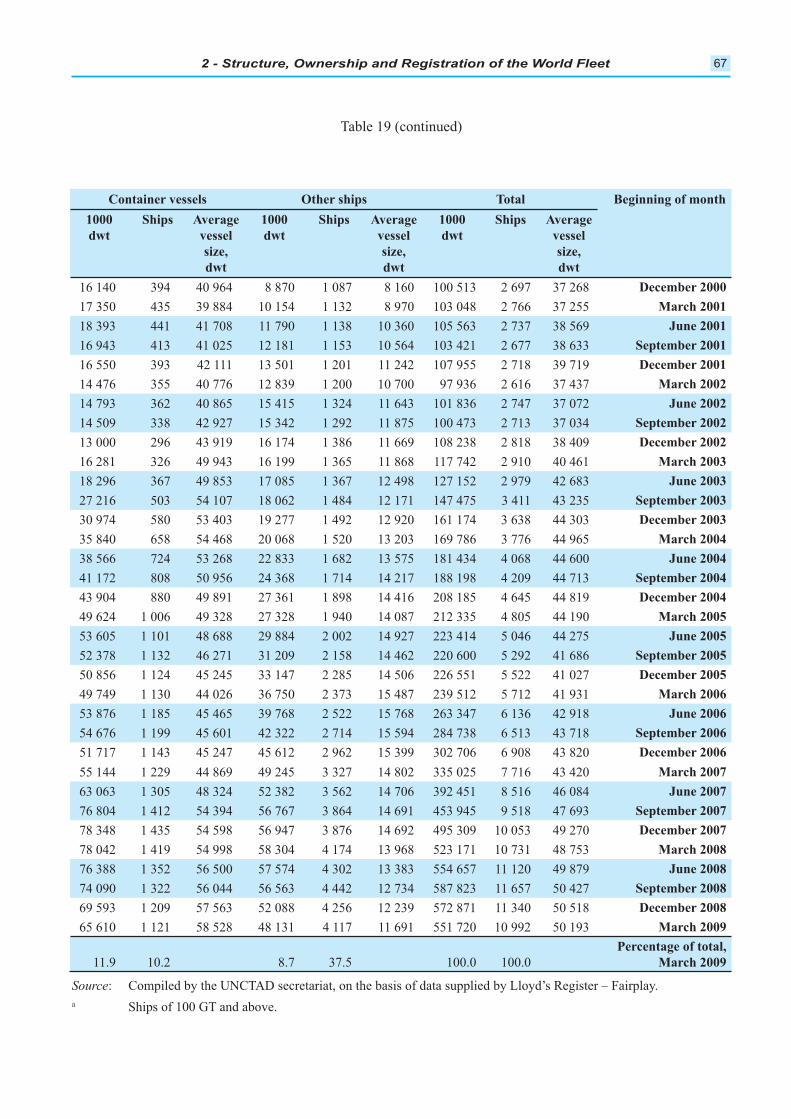
2 - Structure, Ownership and Registration of the World Fleet 67
Total
16 140 394 40 964 8 870 1 087 8 160 100 513 2 697 37 268
17 350 435 39 884 10 154 1 132 8 970 103 048 2 766 37 255
18 393 441 41 708 11 790 1 138 10 360 105 563 2 737 38 569
16 943 413 41 025 12 181 1 153 10 564 103 421 2 677 38 633
16 550 393 42 111 13 501 1 201 11 242 107 955 2 718 39 719
14 476 355 40 776 12 839 1 200 10 700 97 936 2 616 37 437
14 793 362 40 865 15 415 1 324 11 643 101 836 2 747 37 072
14 509 338 42 927 15 342 1 292 11 875 100 473 2 713 37 034
13 000 296 43 919 16 174 1 386 11 669 108 238 2 818 38 409
16 281 326 49 943 16 199 1 365 11 868 117 742 2 910 40 461
18 296 367 49 853 17 085 1 367 12 498 127 152 2 979 42 683
27 216 503 54 107 18 062 1 484 12 171 147 475 3 411 43 235
30 974 580 53 403 19 277 1 492 12 920 161 174 3 638 44 303
35 840 658 54 468 20 068 1 520 13 203 169 786 3 776 44 965
38 566 724 53 268 22 833 1 682 13 575 181 434 4 068 44 600
41 172 808 50 956 24 368 1 714 14 217 188 198 4 209 44 713
43 904 880 49 891 27 361 1 898 14 416 208 185 4 645 44 819
49 624 1 006 49 328 27 328 1 940 14 087 212 335 4 805 44 190
53 605 1 101 48 688 29 884 2 002 14 927 223 414 5 046 44 275
52 378 1 132 46 271 31 209 2 158 14 462 220 600 5 292 41 686
50 856 1 124 45 245 33 147 2 285 14 506 226 551 5 522 41 027
49 749 1 130 44 026 36 750 2 373 15 487 239 512 5 712 41 931
53 876 1 185 45 465 39 768 2 522 15 768 263 347 6 136 42 918
54 676 1 199 45 601 42 322 2 714 15 594 284 738 6 513 43 718
51 717 1 143 45 247 45 612 2 962 15 399 302 706 6 908 43 820
55 144 1 229 44 869 49 245 3 327 14 802 335 025 7 716 43 420
63 063 1 305 48 324 52 382 3 562 14 706 392 451 8 516 46 084
76 804 1 412 54 394 56 767 3 864 14 691 453 945 9 518 47 693
78 348 1 435 54 598 56 947 3 876 14 692 495 309 10 053 49 270
78 042 1 419 54 998 58 304 4 174 13 968 523 171 10 731 48 753
76 388 1 352 56 500 57 574 4 302 13 383 554 657 11 120 49 879
74 090 1 322 56 044 56 563 4 442 12 734 587 823 11 657 50 427
69 593 1 209 57 563 52 088 4 256 12 239 572 871 11 340 50 518
65 610 1 121 58 528 48 131 4 117 11 691 551 720 10 992 50 193
11.9 10.2 8.7 37.5 100.0 100.0
Table 19 (continued)
: Compiled by the UNCTAD secretariat, on the basis of data supplied by Lloyd’s Register – Fairplay.
a
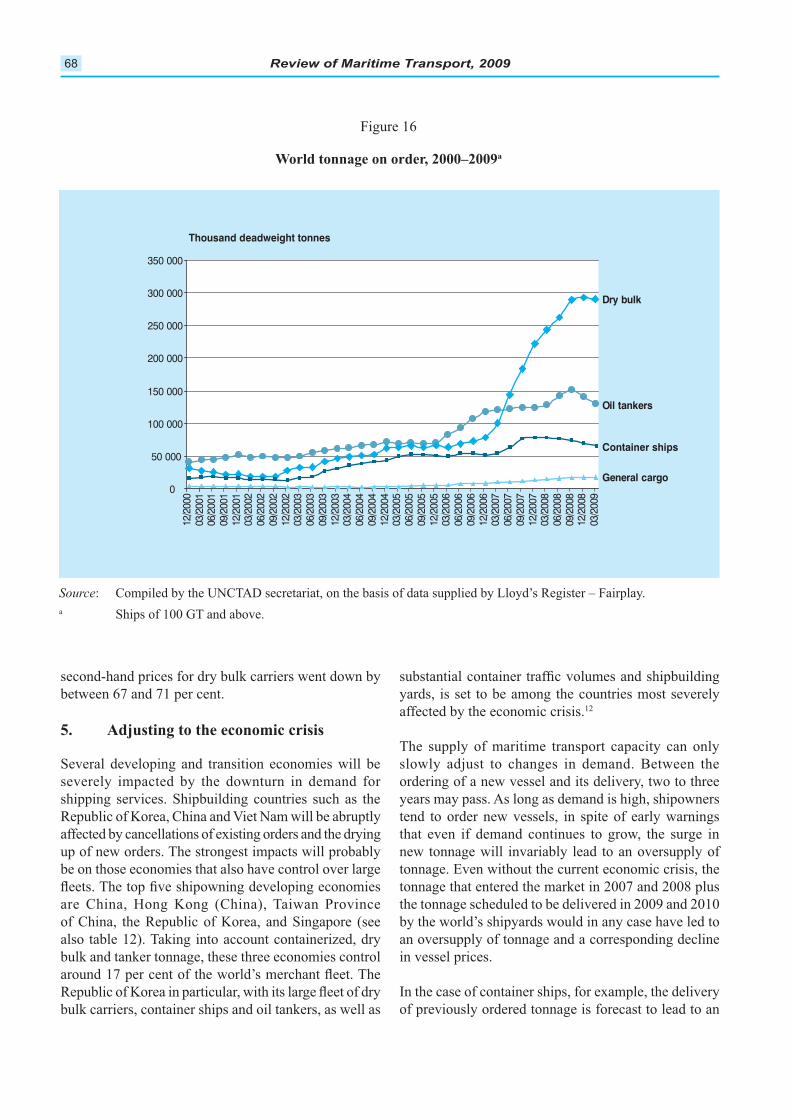
Review of Maritime Transport, 200968
Figure 16
a
: Compiled by the UNCTAD secretariat, on the basis of data supplied by Lloyd’s Register – Fairplay.
a
Oil tankers
Dry bulk
General cargo
Container ships
0
50 000
100 000
150 000
200 000
250 000
300 000
350 000
12/2
000
03/2
001
06/2
001
09/2
001
12/2
001
03/2
002
06/2
002
09/2
002
12/2
002
03/2
003
06/2
003
09/2
003
12/2
003
03/2
004
06/2
004
09/2
004
12/2
004
03/2
005
06/2
005
09/2
005
12/2
005
03/2
006
06/2
006
09/2
006
12/2
006
03/2
007
06/2
007
09/2
007
12/2
007
03/2
008
06/2
008
09/2
008
12/2
008
03/2
009
Thousand deadweight tonnes
second-hand prices for dry bulk carriers went down by
between 67 and 71 per cent.
affected by cancellations of existing orders and the drying
up of new orders. The strongest impacts will probably
bulk and tanker tonnage, these three economies control
bulk carriers, container ships and oil tankers, as well as
affected by the economic crisis.12
The supply of maritime transport capacity can only
years may pass. As long as demand is high, shipowners
tonnage that entered the market in 2007 and 2008 plus
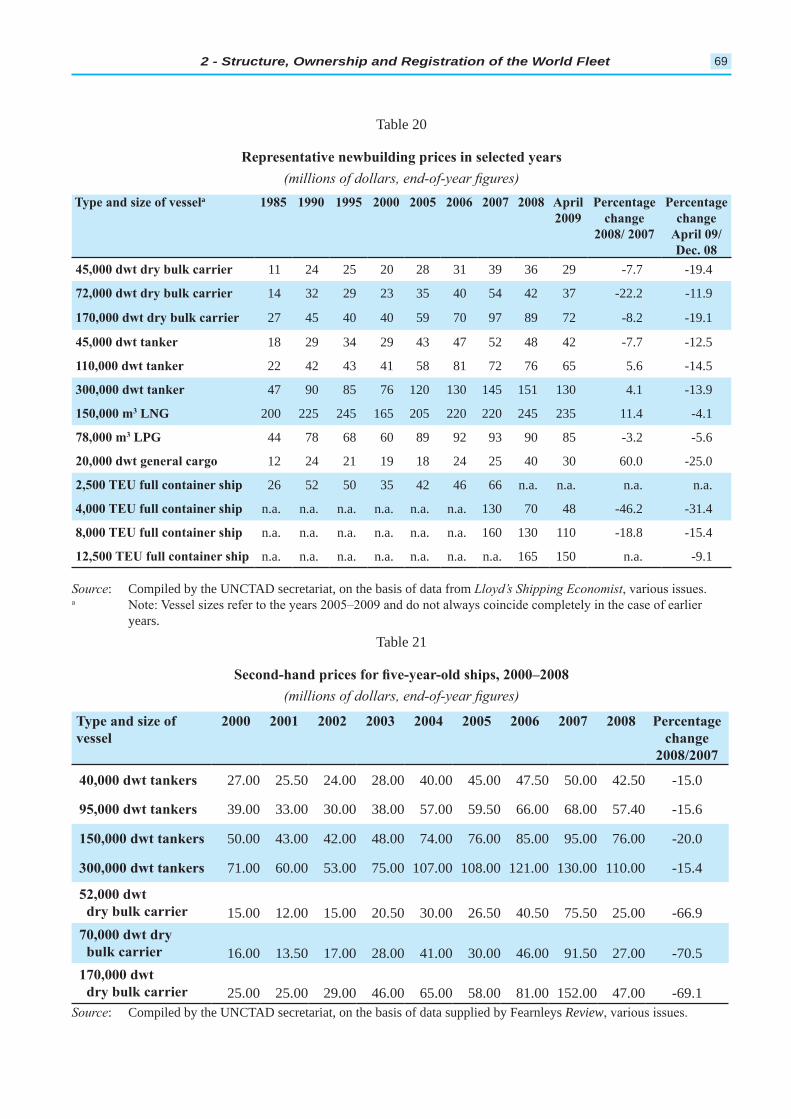
2 - Structure, Ownership and Registration of the World Fleet 69
Typeandsizeofvessela 1985 1990 1995 2000 2005 2006 2007 2008 April2009
Percentagechange
2008/2007
PercentagechangeApril09/Dec.08
45,000dwtdrybulkcarrier 11 24 25 20 28 31 39 36 29 -7.7 -19.4
72,000dwtdrybulkcarrier 14 32 29 23 35 40 54 42 37 -22.2 -11.9
170,000dwtdrybulkcarrier 27 45 40 40 59 70 97 89 72 -8.2 -19.1
45,000dwttanker 18 29 34 29 43 47 52 48 42 -7.7 -12.5
110,000dwttanker 22 42 43 41 58 81 72 76 65 5.6 -14.5
300,000dwttanker 47 90 85 76 120 130 145 151 130 4.1 -13.9
150,000m3 LNg 200 225 245 165 205 220 220 245 235 11.4 -4.1
78,000m3 LPg 44 78 68 60 89 92 93 90 85 -3.2 -5.6
20,000dwtgeneralcargo 12 24 21 19 18 24 25 40 30 60.0 -25.0
2,500TEUfullcontainership 26 52 50 35 42 46 66 n.a. n.a. n.a. n.a.
4,000TEUfullcontainership n.a. n.a. n.a. n.a. n.a. n.a. 130 70 48 -46.2 -31.4
8,000TEUfullcontainership n.a. n.a. n.a. n.a. n.a. n.a. 160 130 110 -18.8 -15.4
12,500TEUfullcontainership n.a. n.a. n.a. n.a. n.a. n.a. n.a. 165 150 n.a. -9.1
Table 20
Representativenewbuildingpricesinselectedyears(millions of dollars, end-of-year figures)
Source: Compiled by the UNCTAD secretariat, on the basis of data from Lloyd’s Shipping Economist, various issues.a Note: Vessel sizes refer to the years 2005–2009 and do not always coincide completely in the case of earlier
years.
Typeandsizeofvessel
2000 2001 2002 2003 2004 2005 2006 2007 2008 Percentagechange
2008/2007
40,000dwttankers 27.00 25.50 24.00 28.00 40.00 45.00 47.50 50.00 42.50 -15.0
95,000dwttankers 39.00 33.00 30.00 38.00 57.00 59.50 66.00 68.00 57.40 -15.6
150,000dwttankers 50.00 43.00 42.00 48.00 74.00 76.00 85.00 95.00 76.00 -20.0
300,000dwttankers 71.00 60.00 53.00 75.00 107.00 108.00 121.00 130.00 110.00 -15.4
52,000dwtdrybulkcarrier 15.00 12.00 15.00 20.50 30.00 26.50 40.50 75.50 25.00 -66.970,000dwtdrybulkcarrier 16.00 13.50 17.00 28.00 41.00 30.00 46.00 91.50 27.00 -70.5170,000dwtdrybulkcarrier 25.00 25.00 29.00 46.00 65.00 58.00 81.00 152.00 47.00 -69.1
Source: Compiled by the UNCTAD secretariat, on the basis of data supplied by Fearnleys Review, various issues.
Table 21
Second-handpricesforfive-year-oldships,2000–2008(millions of dollars, end-of-year figures)
Review of Maritime Transport, 200970
discussion on adjustment to the economic crisis), this
per year until the end of 2013.13
forecast to decline during the next years up to 2012,
as delayed liquefaction projects come on stream.14 The
15 Charter and freight rates
to a decline in demand. Firstly, it may
may, to some extent, terminate orders
may slow steam, thus reducing the
may temporarily withdraw existing
Withholding of new orders
1,000 GT were recorded – a further reduction from the
which was 96 per cent below the peak of new orders
in July 2007. The global order book itself contained
10,341 ships larger than 1,000 GT as of 7 April 2009
16 Looking at
new orders for general cargo ships were at their lowest
tanker was reported.17
half of 2009 yielded hardly any newbuilding contracts
2008.18
the economic crisis: “The ship-recycling industry is now
experiencing its largest growth period in history, after the
globally this year, and more than 1,000 ships destined
for the breakers’ yards, there are
now fears that existing yards cannot
handle the workload.”19
the demolition of existing tonnage
will not be enough to compensate
for the downturn in demand and for
the world’s shipyards. Prices for
their ships, hoping for better times to come. Demolition
20
(…), with the renegotiation of existing contracts
now taking up more time for shipbuilders than new
enquiries.”21
market focuses “primarily on the restructuring of the
existing order book, as possible cancellations and
renegotiations of existing deals become an increasing
issue, and yards are yet to fully address their pricing
ideas. (…) One change that is becoming apparent
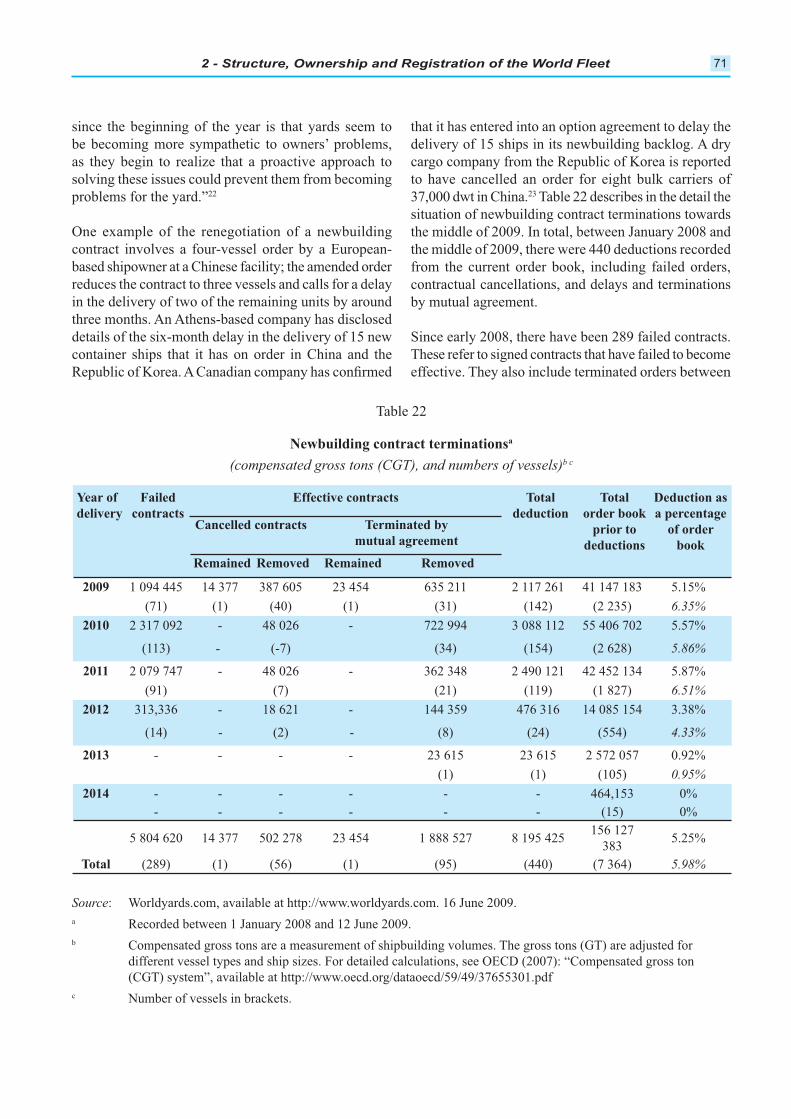
2 - Structure, Ownership and Registration of the World Fleet 71
since the beginning of the year is that yards seem to
be becoming more sympathetic to owners’ problems,
problems for the yard.”22
One example of the renegotiation of a newbuilding
three months. An Athens-based company has disclosed
container ships that it has on order in China and the
that it has entered into an option agreement to delay the
37,000 dwt in China.23 Table 22 describes in the detail the
situation of newbuilding contract terminations towards
the middle of 2009, there were 440 deductions recorded
from the current order book, including failed orders,
contractual cancellations, and delays and terminations
by mutual agreement.
between
Total Total
1 094 445 14 377 387 605 23 454 635 211 2 117 261 41 147 183 5.15%
(71) (1) (40) (1) (31) (142) (2 235) 6.35%
2 317 092 - 48 026 - 722 994 3 088 112 55 406 702 5.57%
(113) - (-7) (34) (154) (2 628) 5.86%
2 079 747 - 48 026 - 362 348 2 490 121 42 452 134 5.87%
(91) (7) (21) (119) (1 827) 6.51%
313,336 - 18 621 - 144 359 476 316 14 085 154 3.38%
(14) - (2) - (8) (24) (554) 4.33%
- - - - 23 615 23 615 2 572 057 0.92%
(1) (1) (105) 0.95%
- - - - - - 464,153 0%
- - - - - - (15) 0%
5 804 620 14 377 502 278 23 454 1 888 527 8 195 425156 127
3835.25%
Total (289) (1) (56) (1) (95) (440) (7 364) 5.98%
Table 22
a
b c
a Recorded between 1 January 2008 and 12 June 2009.
b
c
Review of Maritime Transport, 200972
shipbuilders and shipowning companies which are
controlled by the same ultimate interests. During
the same period, there were 56 cancelled orders,
shipyard decided to continue with construction in
spite of the cancellation from the shipowner. Ninety-
These resulted from an agreement between buyer
distant future. The buyers would normally agree to
pay the shipbuilders some compensation. Among
the contracts terminated by mutual agreement, there
was one case where the shipyard decided to continue
with construction in spite of the cancellation by the
buyer.
for the termination of orders without penalty, shipyards’
lawyers work hard to make sure that companies that
the long term, there is a common interest between both
by mutual agreement, including 59 orders for tankers
(corresponding to 3.0 million dwt), 72 orders for dry
bulk carriers (9.5 million dwt), 94 orders for container
existing order book.24
impacts. Firstly, it helps to reduce emissions of
greenhouse gases, and secondly, it absorbs some of the
that “owners could cope with up to 10–15 per cent 25
shipboard machinery and other components, which
are designed for higher speeds and suffer from higher
e.g. car carriers or tankers, but this, too, is only a
were reported as idle by the end of April 2009. The
employ their ships if no charterers are found.26 Laid-
up dry bulk tonnage increased by 73 per cent between 27
The following chapter will examine the supply and
ENDNOTES
1 Containerisation
2
the
3
about the white lists and black lists of port state control regimes, such as the Paris and Tokyo memorandums of
4
2 - Structure, Ownership and Registration of the World Fleet 73
5 Containerisation
International Online
always as clear-cut as it appears when two different company names are reported.
6
7
owner.
8 Shipping
,
9
10 : Lloyd’s List.
11 Lloyd’s List. 30 October 2009.
12
13 Fairplay Shipping Weekly
14 Lloyd’s List. 30 April 2009.
15 . April 2009.
16 Fairplay Shipping Weekly. 23 April 2009.
17 Fairplay Shipping Weekly. 2 July 2009.
18 Fairplay Shipping Weekly. 30 April 2009.
19 Lloyd’s List
20
21 Fairplay Shipping Weekly
22 Container Intelligence Monthly
23 Fairplay Shipping Weekly
24
25 Lloyd’s List
26 Data from Alphaliner, as reported by Containerisation International Online
27 . April 2009.

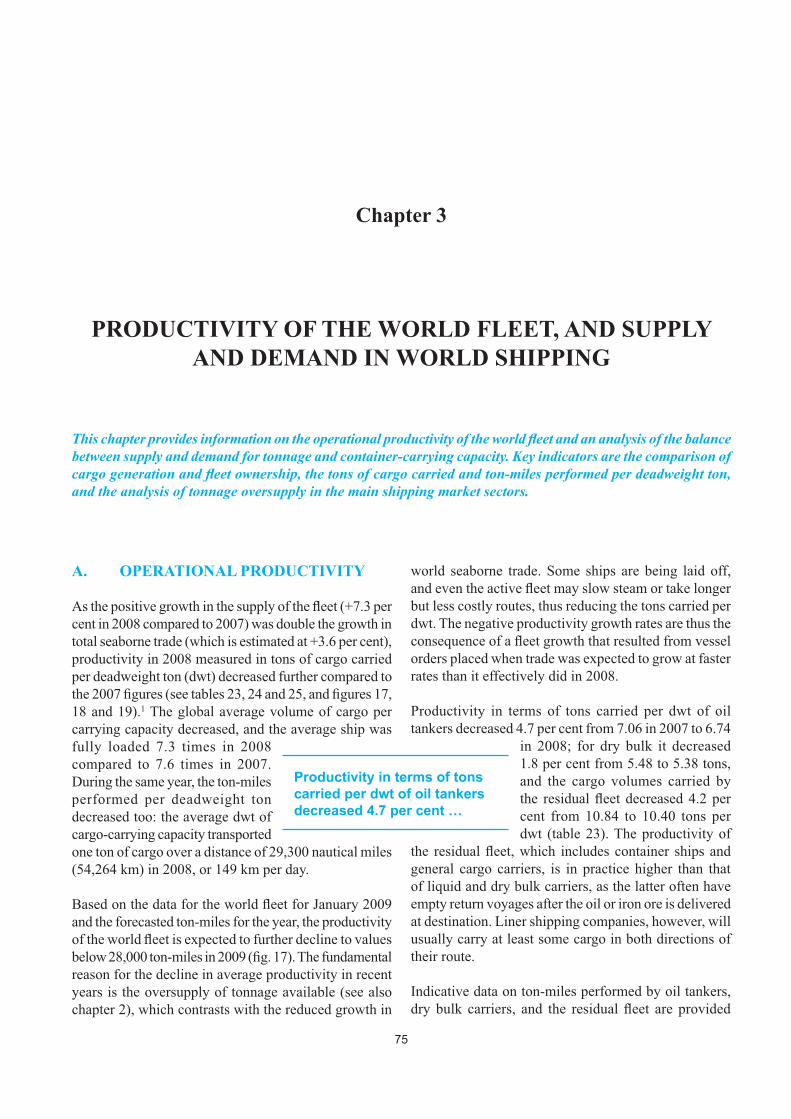
75
PRODUCTIVITY OF THE WORLD FLEET, AND SUPPLY
AND DEMAND IN WORLD SHIPPING
Chapter 3
OPERATIONAL PRODUCTIVITYA.
productivity in 2008 measured in tons of cargo carried
performed per deadweight ton
decreased too: the average dwt of
reason for the decline in average productivity in recent
Productivity in terms of tons carried per dwt of oil
empty return voyages after the oil or iron ore is delivered
Productivity in terms of tons
carried per dwt of oil tankers
decreased 4.7 per cent …
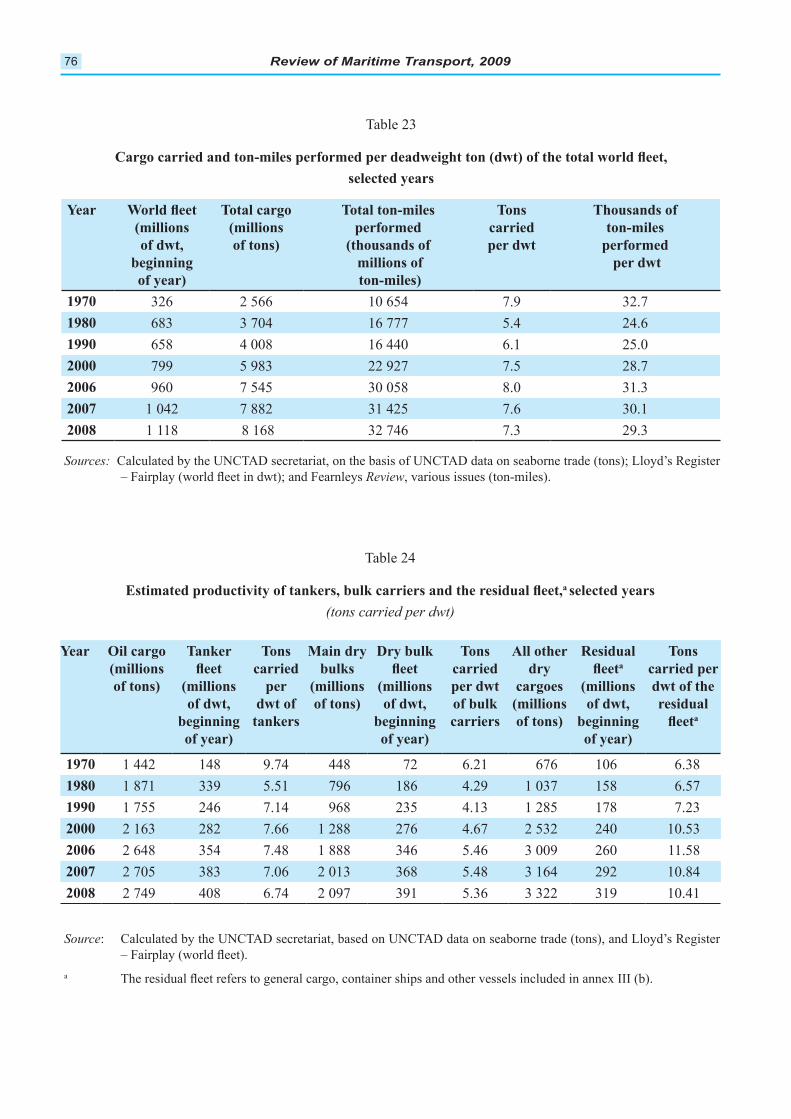
Review of Maritime Transport, 200976
Year World fleet (millions of dwt,
beginning of year)
Total cargo (millions of tons)
Total ton-miles performed
(thousands of millions of ton-miles)
Tons carried per dwt
Thousands of ton-miles
performed per dwt
1970 326 2 566 10 654 7.9 32.71980 683 3 704 16 777 5.4 24.61990 658 4 008 16 440 6.1 25.02000 799 5 983 22 927 7.5 28.72006 960 7 545 30 058 8.0 31.32007 1 042 7 882 31 425 7.6 30.12008 1 118 8 168 32 746 7.3 29.3
Sources: Calculated by the UNCTAD secretariat, on the basis of UNCTAD data on seaborne trade (tons); Lloyd’s Register – Fairplay (world fleet in dwt); and Fearnleys Review, various issues (ton-miles).
Table 23
Cargo carried and ton-miles performed per deadweight ton (dwt) of the total world fleet, selected years
Year Oil cargo (millions of tons)
Tanker fleet
(millions of dwt,
beginning of year)
Tons carried
per dwt of
tankers
Main dry bulks
(millions of tons)
Dry bulk fleet
(millions of dwt,
beginning of year)
Tons carried per dwt of bulk carriers
All other dry
cargoes (millions of tons)
Residual fleeta
(millions of dwt,
beginning of year)
Tons carried per dwt of the residual
fleeta
1970 1 442 148 9.74 448 72 6.21 676 106 6.381980 1 871 339 5.51 796 186 4.29 1 037 158 6.571990 1 755 246 7.14 968 235 4.13 1 285 178 7.232000 2 163 282 7.66 1 288 276 4.67 2 532 240 10.532006 2 648 354 7.48 1 888 346 5.46 3 009 260 11.582007 2 705 383 7.06 2 013 368 5.48 3 164 292 10.842008 2 749 408 6.74 2 097 391 5.36 3 322 319 10.41
Table 24
Estimated productivity of tankers, bulk carriers and the residual fleet,a selected years(tons carried per dwt)
Source: Calculated by the UNCTAD secretariat, based on UNCTAD data on seaborne trade (tons), and Lloyd’s Register – Fairplay (world fleet).
a The residual fleet refers to general cargo, container ships and other vessels included in annex III (b).
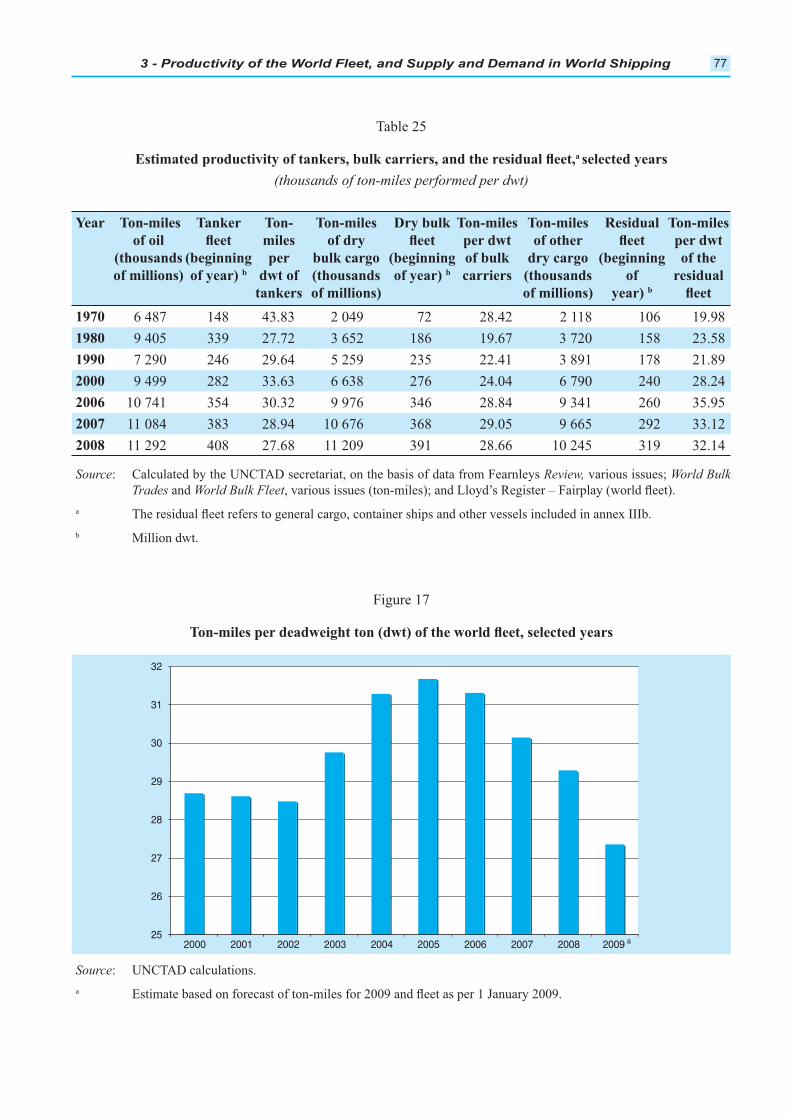
3 - Productivity of the World Fleet, and Supply and Demand in World Shipping 77
Year Ton-miles
of oil
(thousands
of millions)
Tanker
(beginning
of year) b
Ton-
miles
per
dwt of
tankers
Ton-miles
of dry
bulk cargo
(thousands
of millions)
Dry bulk
(beginning
of year) b
Ton-miles
per dwt
of bulk
carriers
Ton-miles
of other
dry cargo
(thousands
of millions)
Residual
(beginning
of
year) b
Ton-miles
per dwt
of the
residual
1970
1980
1990
2000 282
2006
2007
2008
a selected years
(thousands of ton-miles performed per dwt)
Source Review, various issues; World Bulk
Trades and World Bulk Fleet
a
M
Source
a
25
26
27
28
29
30
31
32
2000 2001 2002 2003 2004 2005 2006 2007 2008 2009 a
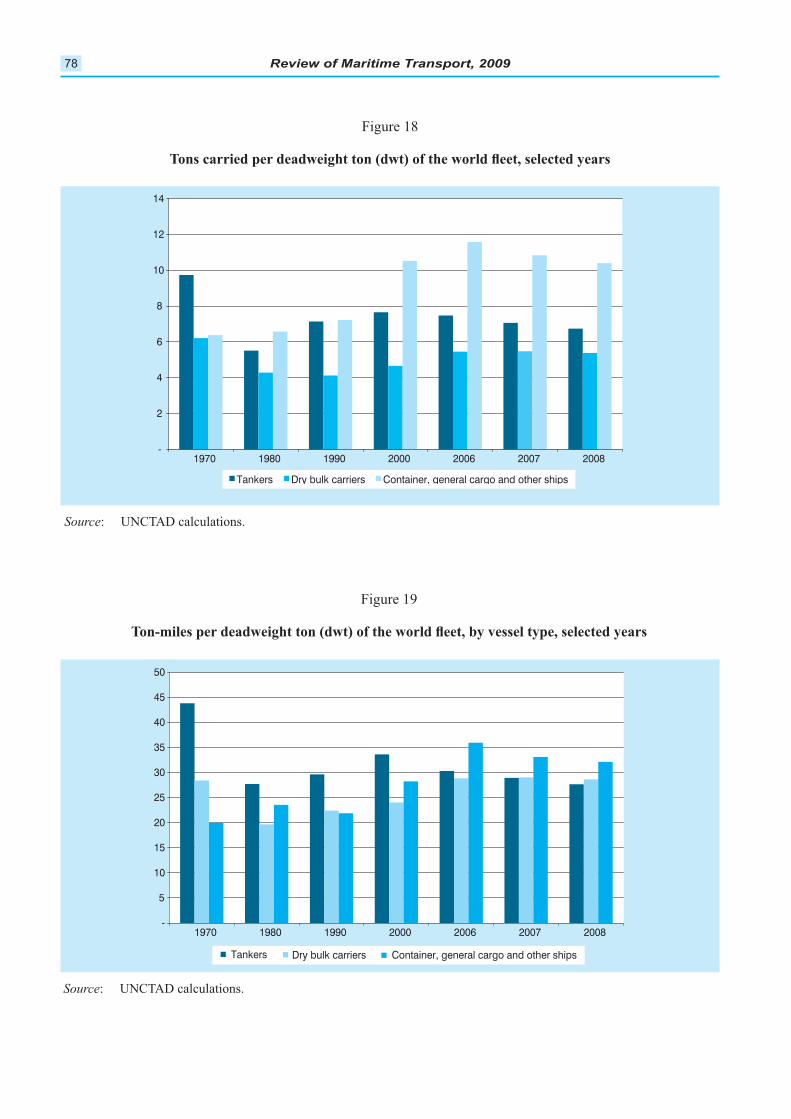
Review of Maritime Transport, 200978
Source
-
2
4
6
8
10
12
14
1970 1980 1990 2000 2006 2007 2008
Tankers Dry bulk carriers Container, general cargo and other ships
Source
-
5
10
15
20
25
30
35
40
45
50
1970 1980 1990 2000 2006 2007 2008
Tankers Dry bulk carriers Container, general cargo and other ships
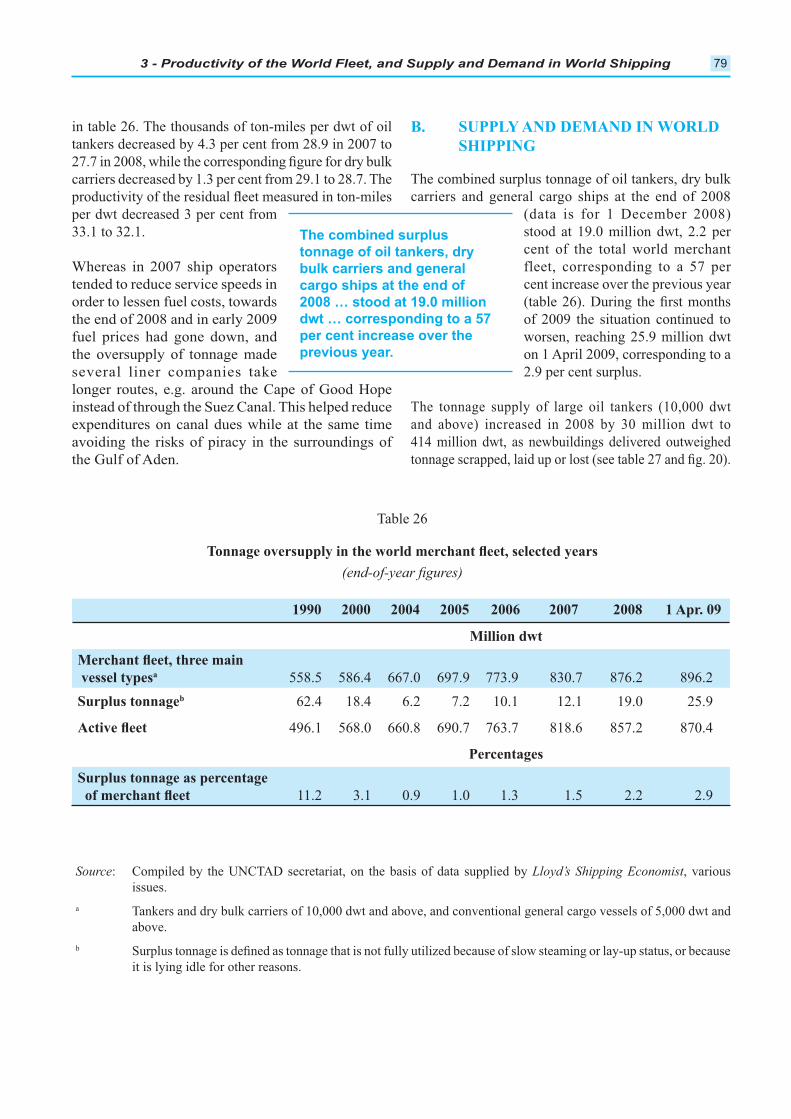
3 - Productivity of the World Fleet, and Supply and Demand in World Shipping 79
tended to reduce service speeds in
the oversupply of tonnage made
SUPPLY AND DEMAND IN WORLD B.
SHIPPING
carriers and general cargo ships at the end of 2008
cent of the total world merchant
cent increase over the previous year
The combined surplus
tonnage of oil tankers, dry
bulk carriers and general
cargo ships at the end of
2008 … stood at 19.0 million
dwt … corresponding to a 57
per cent increase over the
previous year.
1990 2000 2004 2005 2006 2007 2008 1 Apr. 09
Million dwt
vessel typesa
Surplus tonnageb
Percentages
Surplus tonnage as percentage
Source
a
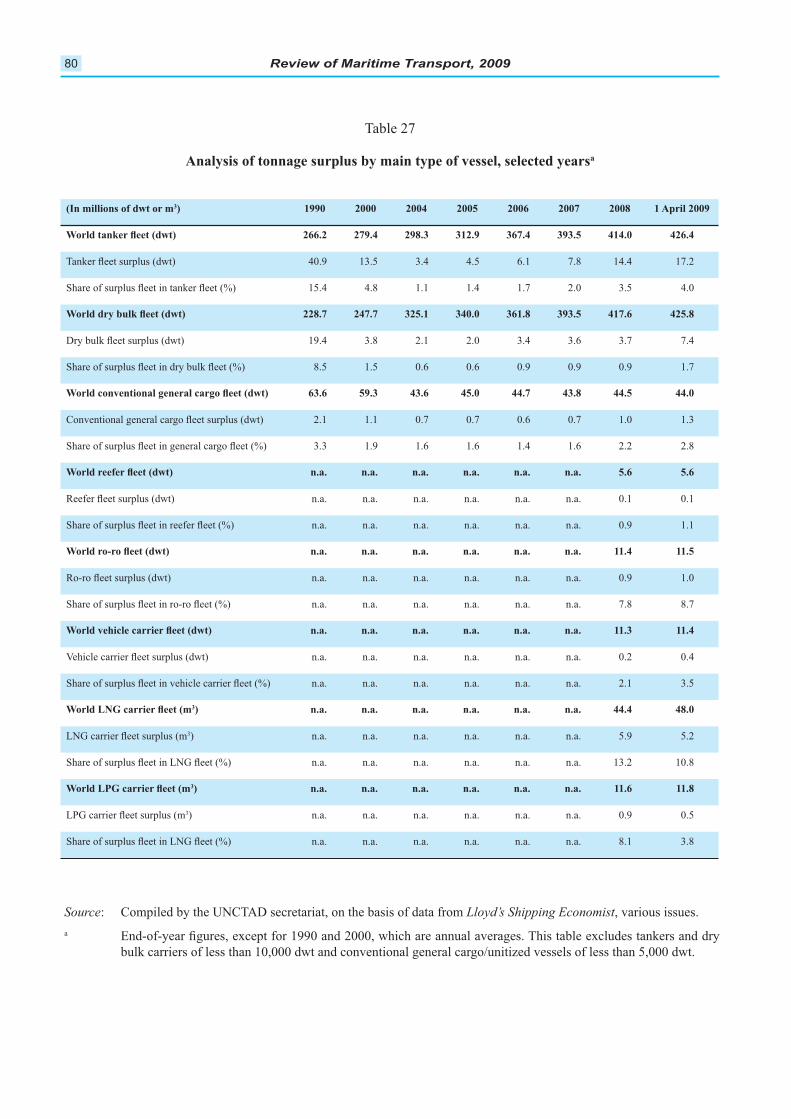
Review of Maritime Transport, 200980
(In millions of dwt or m3) 1990 2000 2004 2005 2006 2007 2008 1 April 2009
266.2 279.4 298.3 312.9 367.4 393.5 414.0 426.4
228.7 247.7 325.1 340.0 361.8 393.5 417.6 425.8
63.6 59.3 43.6 45.0 44.7 43.8 44.5 44.0
n.a. n.a. n.a. n.a. n.a. n.a. 5.6 5.6
n.a. n.a. n.a. n.a. n.a. n.a. 11.4 11.5
n.a. n.a. n.a. n.a. n.a. n.a. 11.3 11.4
3) n.a. n.a. n.a. n.a. n.a. n.a. 44.4 48.0
3) n.a. n.a. n.a. n.a. n.a. n.a. 11.6 11.8
Analysis of tonnage surplus by main type of vessel, selected yearsa
Source
a
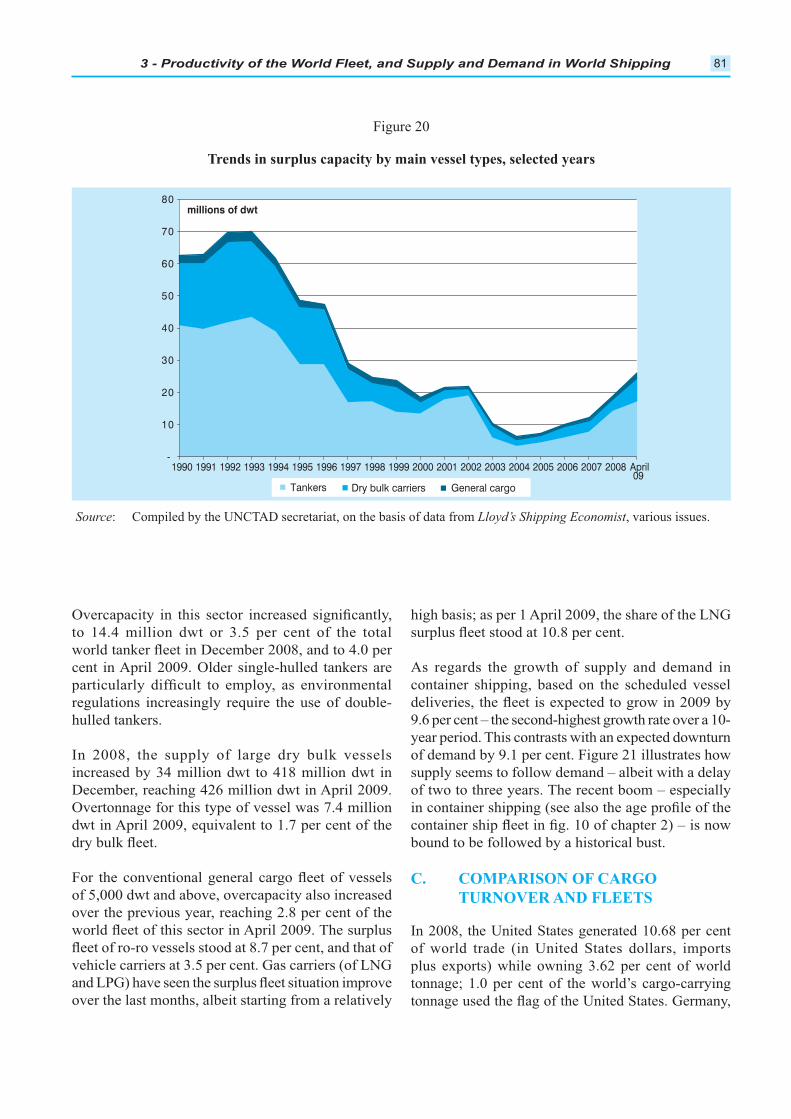
3 - Productivity of the World Fleet, and Supply and Demand in World Shipping 81
Figure 20
Trends in surplus capacity by main vessel types, selected years
Source
Tankers Dry bulk carriers General cargo
-
10
20
30
40
50
60
70
80
19901990 19911991 19921992 19931993 19941994 19951995 19961996 19971997 19981998 19991999 20002000 20012001 20022002 20032003 20042004 20052005 20062006 20072007 20082008 AprilApril0909
millions of dwt
As regards the growth of supply and demand in
COMPARISON OF CARGO C.
TURNOVER AND FLEETS
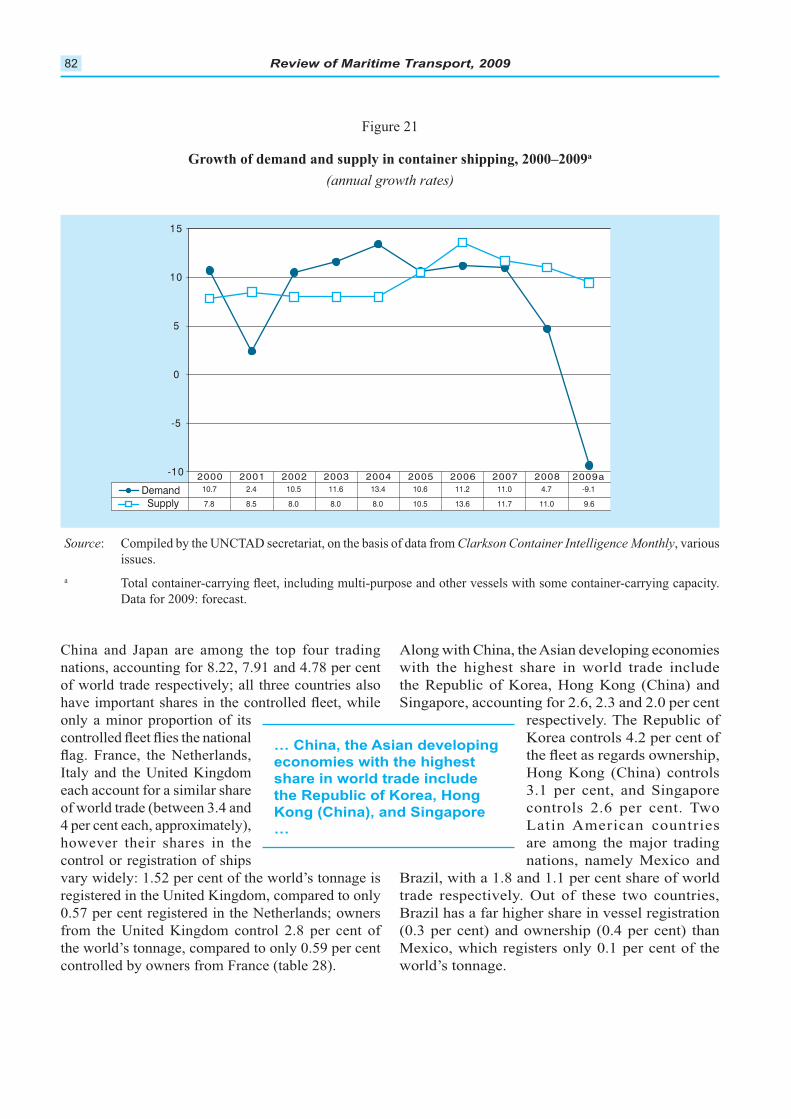
Review of Maritime Transport, 200982
Growth of demand and supply in container shipping, 2000–2009a
Source
a
-10
-5
0
5
10
15
10.7 2.4 10.5 11.6 13.4 10.6 11.2 11.0 4.7 -9.1
2000 2001 2002 2003 2004 2005 2006 2007 2008 2009a
DemandSupply 7.8 8.5 8.0 8.0 8.0 10.5 13.6 11.7 11.0 9.6
re among the top four trading
of world trade respectively; all three countries also
only a minor proportion of its
each account for a similar share
however their shares in the
control or registration of ships
with the highest share in world trade include
are among the major trading
… China, the Asian developing
economies with the highest
share in world trade include
the Republic of Korea, Hong
Kong (China), and Singapore
…
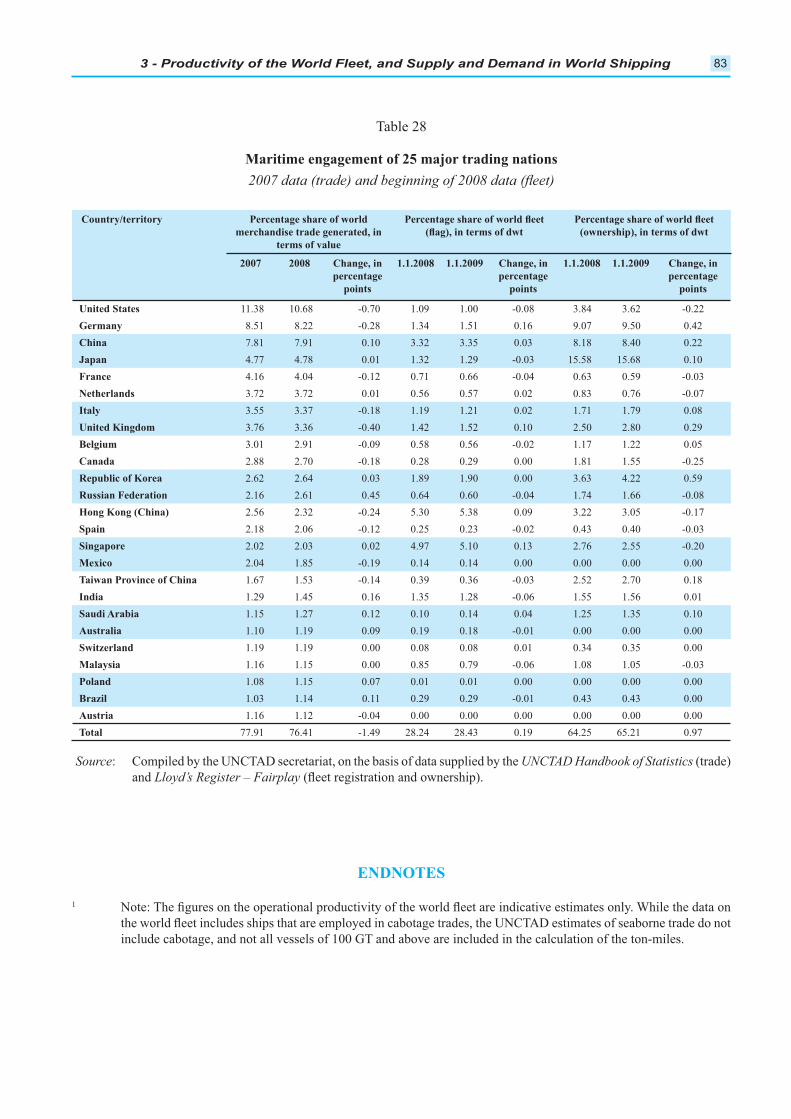
3 - Productivity of the World Fleet, and Supply and Demand in World Shipping 83
Country/territory Percentage share of world
merchandise trade generated, in
terms of value
(ownership), in terms of dwt
2007 2008 Change, in
percentage
points
1.1.2008 1.1.2009 Change, in
percentage
points
1.1.2008 1.1.2009 Change, in
percentage
points
United States
Germany
China
Japan
France
Netherlands
Italy
United Kingdom
Belgium
Canada
Republic of Korea
Russian Federation
Hong Kong (China)
Spain
Singapore
Mexico
Taiwan Province of China
India
Saudi Arabia
Australia
Switzerland
Malaysia
Poland
Brazil
Austria
Total
Maritime engagement of 25 major trading nations
Source UNCTAD Handbook of Statistics
and
ENDNOTES

85
Chapter 4
TRADE AND FREIGHT MARKETS
This chapter looks at the demand side of international seaborne trade by describing conditions and trends in
trade and freight markets, covering the major tanker, bulk cargo and liner sectors. This chapter expands upon
the general overview of international maritime trade as described in chapter 1. The start of 2008 continued the
buoyant trend experienced in the preceding year in all sectors. However, by the middle of the year, things took
liner sectors sustained dramatic declines, which continued for the remainder of the year and well into 2009. The
tanker market fared slightly better during 2008 compared to other sectors, although by the middle of 2009 all
sectors were experiencing similar declines. Initially, the record oil price reached in July 2008 had been pushing
the global economic crisis took effect.
CRUDE OIL AND PETROLEUMA.
PRODUCTS SHIPPING MARKET1
Introduction
Crude oil and petroleum products are major transport
commodities, representing approximately one third of
the total world seaborne trade. In addition, crude oil
is still the main source of fuel that
Shipping remains, on a per ton basis,
long distances. Understanding tanker
freight rates, and thus the underlying
oil production and consumption trends are discussed
in more detail in chapter 1. During 2008, there were
1. Tanker freight rates
freight rates peaked in the middle
of the year, before embarking on
a sector-wide downward trend.
between December 2008 and December 2007 shows
that all rates were substantially down. A sharp
January 2008, as a result of surplus tonnage following
the New Year holiday period, reduced weather delays
Freight rates for all types of
quarter of 2009 were down
on the same period for the
previous year.
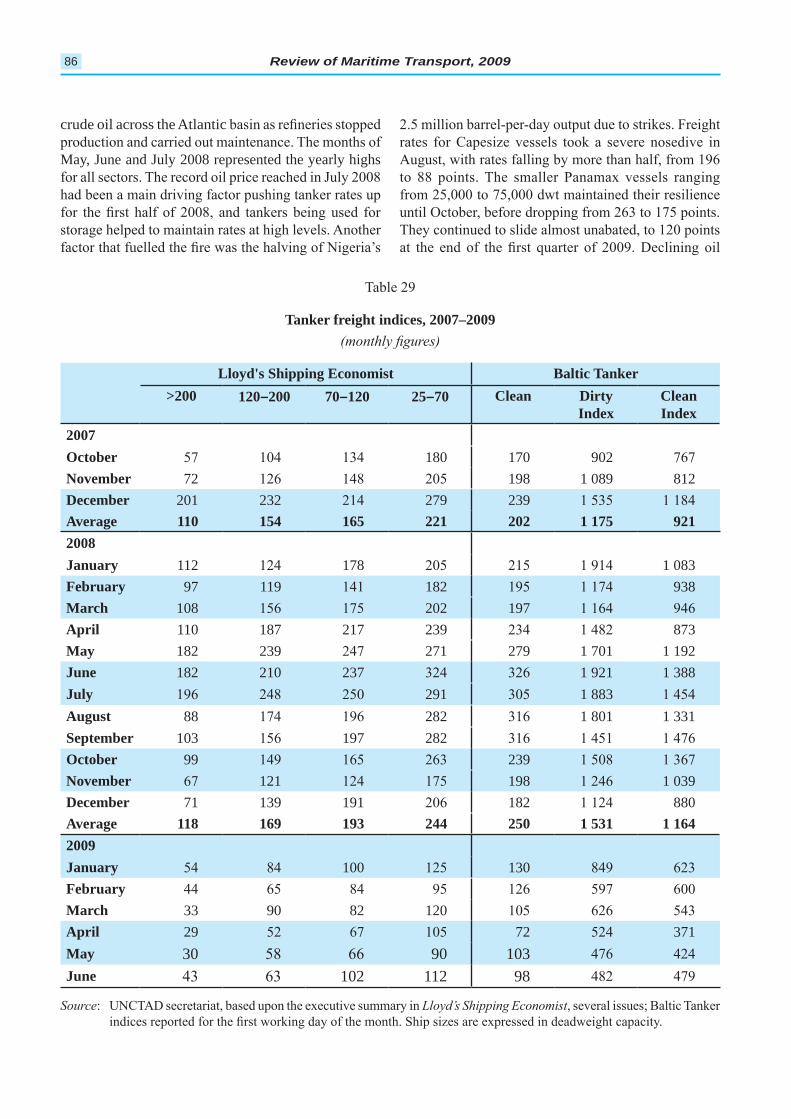
Review of Maritime Transport, 200986
crude oil across the Atlantic basin as refineries stopped production and carried out maintenance. The months of May, June and July 2008 represented the yearly highs for all sectors. The record oil price reached in July 2008 had been a main driving factor pushing tanker rates up for the first half of 2008, and tankers being used for storage helped to maintain rates at high levels. Another factor that fuelled the fire was the halving of Nigeria’s
2.5 million barrel-per-day output due to strikes. Freight rates for Capesize vessels took a severe nosedive in August, with rates falling by more than half, from 196 to 88 points. The smaller Panamax vessels ranging from 25,000 to 75,000 dwt maintained their resilience until October, before dropping from 263 to 175 points. They continued to slide almost unabated, to 120 points at the end of the first quarter of 2009. Declining oil
Table 29
Tanker freight indices, 2007–2009(monthly figures)
lloyd's shipping economist Baltic Tanker>200 120–200 70–120 25–70 Clean dirty
indexClean index
2007october 57 104 134 180 170 902 767november 72 126 148 205 198 1 089 812december 201 232 214 279 239 1 535 1 184average 110 154 165 221 202 1 175 9212008January 112 124 178 205 215 1 914 1 083february 97 119 141 182 195 1 174 938march 108 156 175 202 197 1 164 946april 110 187 217 239 234 1 482 873may 182 239 247 271 279 1 701 1 192June 182 210 237 324 326 1 921 1 388July 196 248 250 291 305 1 883 1 454august 88 174 196 282 316 1 801 1 331september 103 156 197 282 316 1 451 1 476october 99 149 165 263 239 1 508 1 367november 67 121 124 175 198 1 246 1 039december 71 139 191 206 182 1 124 880average 118 169 193 244 250 1 531 1 1642009January 54 84 100 125 130 849 623february 44 65 84 95 126 597 600march 33 90 82 120 105 626 543april 29 52 67 105 72 524 371may 30 58 66 90 103 476 424June 43 63 102 112 98 482 479
Source: UNCTAD secretariat, based upon the executive summary in Lloyd’s Shipping Economist, several issues; Baltic Tanker indices reported for the first working day of the month. Ship sizes are expressed in deadweight capacity.
4 - Trade and Freight Markets 87
demand brought about by the deepening economic
also affected rates for cargo from the Arabian Gulf to
in the following two months. It then embarked on an
upward trend, which culminated in June at 1,921 before
embarking on a year of almost continuous falls, hitting
2008 to 371 in April 2009.
Caribbean and Singapore, while the main unloading
China route, relying on large ships, has not been included
in the table.
When comparing freight indices for December 2007
with December 2008, it can be seen that rates on
all routes declined, with the sole exception of those
One of the largest month-on-month increases in
freight rates during 2008 occurred on routes within the
Mediterranean, when rates nearly
doubled from WS113 in February to
attributable to a light maintenance
proposed tax increases, particularly
in the United Kingdom. During the
month for shipowners on the Caribbean–Caribbean/
doubled, and on routes within the Mediterranean and
thirds.
Asia. Freight rates on these routes declined by around
two thirds from December 2007 to December 2008. In
general, rates departed from their established pattern –
year – to a pattern where rates climbed towards the
middle of the year, before falling back and ending the
that follows the seasons of the markets in the northern
occurred because high oil prices fuelled higher demand
this bubble collapsed when the market saw that oil
well for the tanker market, when, in January, freight
the northern-hemisphere summer of 2008 with those
freight rates on some routes declined by as much as
May 2008 to WS82 in April 2009.
to a cut in oil production by
elsewhere.
… freight rates for VLCCs on
the Persian Gulf toJapan and
on the Persian Gulf
to the Republic of Korea
routes decreased by over 60
per cent …
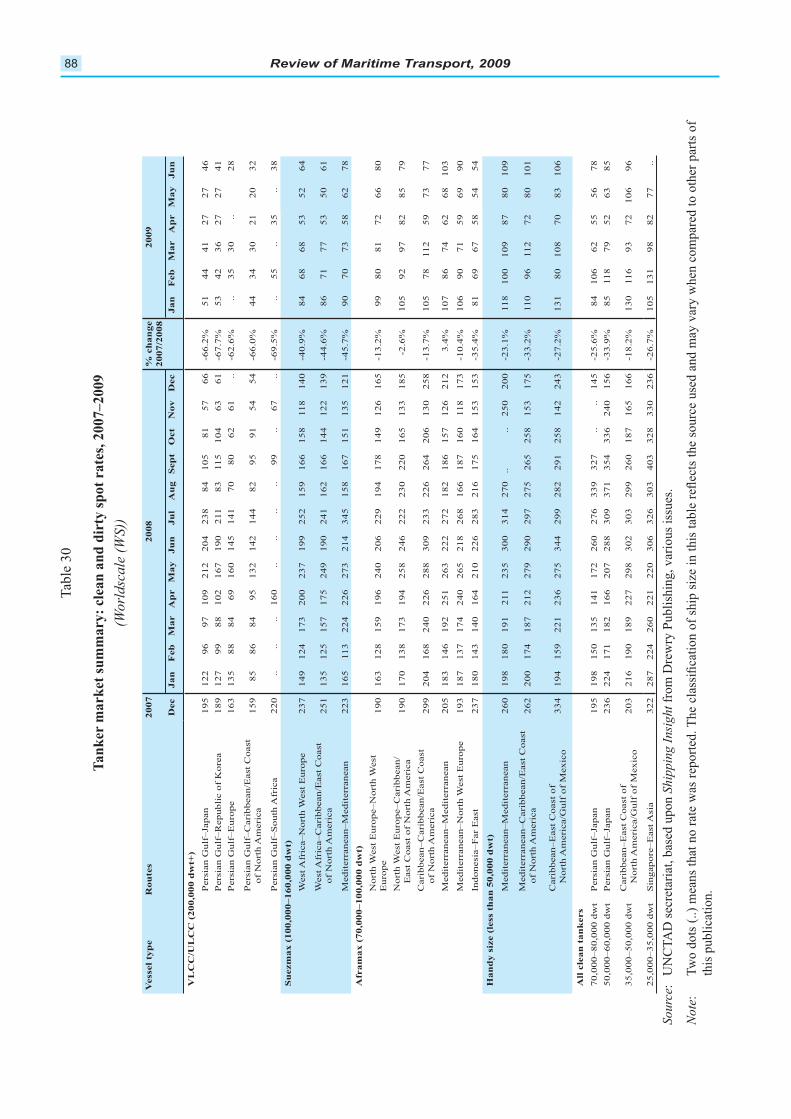
Review of Maritime Transport, 200988
Vessel
typ
eR
ou
tes
20
07
20
08
% c
ha
ng
e
20
07
/20
08
20
09
Dec
Ja
nF
eb
Ma
rA
pr
Ma
yJ
un
Ju
lA
ug
Sep
tO
ct
No
vD
ec
Ja
nF
eb
Ma
rA
pr
Ma
yJ
un
VL
CC
/UL
CC
(2
00
,00
0 d
wt+
)
12
29
71
09
21
22
38
81
27
27
18
91
27
99
88
10
21
90
211
8
32
72
7
88
70
80
....
30
..2
8
o
f N
ort
h A
meri
ca
13
28
29
13
02
12
03
2
22
0..
....
....
....
99
....
....
..3
8
Su
ezm
ax
(1
00
,00
0–
16
0,0
00
dw
t)
23
71
73
20
02
37
19
911
8
o
f N
ort
h A
meri
ca
19
01
22
13
97
17
7
Med
iterr
an
ean
–M
ed
iterr
an
ean
22
311
32
73
12
19
07
07
37
8
Afr
am
ax
(7
0,0
00
–1
00
,00
0 d
wt)
19
01
28
22
91
78
99
80
81
72
80
19
01
70
13
81
73
22
22
30
22
01
33
92
97
82
79
o
f N
ort
h A
meri
ca
29
92
88
30
92
33
13
07
811
27
37
7
Med
iterr
an
ean
–M
ed
iterr
an
ean
18
31
92
22
22
72
18
22
12
10
71
03
19
31
87
13
72
18
18
711
81
73
90
71
90
23
71
80
21
02
83
81
Ha
nd
y s
ize (
less t
ha
n 5
0,0
00
dw
t)
Med
iterr
an
ean
–M
ed
iterr
an
ean
19
81
80
19
12
11
30
02
70
....
20
011
81
00
10
98
78
01
09
o
f N
ort
h A
meri
ca
20
01
87
21
22
79
29
02
97
11
011
27
28
01
01
N
ort
h A
meri
ca/G
ulf
of
Mex
ico
22
12
99
28
22
91
13
18
01
08
70
83
All
cle
an
ta
nk
ers
70
,00
0–
80
,00
0 d
wt
19
81
72
33
93
27
....
78
17
11
82
20
72
88
30
93
71
11
87
9
N
ort
h A
meri
ca/G
ulf
of
Mex
ico
20
31
90
18
92
27
29
83
02
30
32
99
18
71
30
93
72
32
22
87
22
12
20
30
33
28
33
01
31
98
82
77
..
Ta
nk
er m
ark
et s
um
ma
ry:
clea
n a
nd
dir
ty s
po
t ra
tes,
20
07
–2
00
9
this
publi
cati
on.
4 - Trade and Freight Markets 89
transportation of oil where pipelines are non-existent.
and 70 per cent when comparing December 2007 with
and summer months saw some strong growth, rates
plummeted starting from August 2008 and continued to
shipowners were seen in May 2008, when rates climbed
of factors, ranging from a decrease in the supply of
speeds, to strikes by port workers and the increased use
2009 declined to around $87 million, compared to
declined sharply too, as the price
of steel plummeted from more than
$700 a ton in 2008 to around $200
highest prices paid by breakers was
1987-built
breakers reportedly paid $770 per light displacement
As the name suggests, Suezmax ships are the largest
tankers able to transit the Suez Canal. Capable of
important role in trading from West Africa to North-
a turnaround was seen in March 2008, which lasted
for the most part until the end of the year, shipowners
could not withstand the global economic downturn,
and the start of 2009 marked a bleak era. Freight rates
on West African routes slumped to a 10-year low of
from the highs of mid-2008, as a dearth of cargoes
following month. A corresponding decline was noted
deployed for trading within and between the following
Coast of North America, the Mediterranean, Indonesia
at the start of 2008 and then peaked in the middle of the
market for other types of tankers in
was on the Aframax Mediterranean–
cent growth rate. Freight rates for
Coast of North America route, which peaked in June
2008 at WS309, pushing the daily time charter earnings
of the six routes shown in table 29 experienced a yearly
of $19,300 per day. Despite a rally in freight rates at the
end of 2008, rates continued their downward path well
into 2009, pushing rates on the Caribbean–Caribbean/
The Aframax market generally
fared better than the market
for other types of tankers in
2008.
Review of Maritime Transport, 200990
2007.
calling at destinations with limited draft and with length
the freight rates for these types of ships deployed for
trades across the Mediterranean, for trades originating
in the Mediterranean with destinations in the Caribbean
Coast of North America.
Freight rates on all three routes shown in table 29 declined
by between 23 and 33 per cent, with the Mediterranean–
the most.
on routes between the Mediterranean and the Caribbean
North America route.
Freight rates on all four routes shown in table 29 declined
route. Rates continued to fall in 2009, by as much as two
primarily in pure chemical cargoes such as styrene,
IMO 3, or double-hull product tankers, trading only in
most hazardous cargoes such as chlorosulphonic acid
in deep sea trades.2
tankers continued its downward slide. For example,
both recorded less than 1 million dwt, while February
a continuation of this trend, so that by March the rate
stood at $71,000 per day.
LIQUEFIED NATURAL GASB.
Introduction
When
cubic metres.3
4 - Trade and Freight Markets 91
would render the project uneconomic, or the crossing of
many territories would pose too many potential risks of
rise less rapidly as a function of distance than pipeline
itself. Should there be a problem in supply, such as one
economic downturn, and from weak demand – especially
Republic of Korea, the United States, Spain, France
declined in recent years, dropping in 2008 alone by
included Algeria, Indonesia, Malaysia and Nigeria.
weak global gas market – from Algeria, Nigeria, Qatar,
1. Developments in LNG trade6
Whereas gas was once burnt off as a waste product in
allowed a decrease in transport costs by between 20
7
increased by a mere 1.9 per cent to 87.8 million
8
at Melkøya in northern Norway resumed operation in
2008 after a few start-up problems, while in the Russian
Also in the Russian Federation is the giant Shtokman
the north-west of the country, which is still in the initial
Indonesia, bound for Gwangyang, Republic of Korea,
produce up to 3.8 million tons per annum each.
2. LNG freight rates
prices that affect other sectors. Daily charter rates in
tankers on short-term hauls declined by 17 per cent in
located mainly in the Republic of Korea, and to a lesser

Review of Maritime Transport, 200992
freight rates in the medium term, as production capacity
at new facilities lags behind.
DRY BULK SHIPPING MARKETC. 9
Introduction
alumina and phosphate, processed as inputs for products
which in turn form the backbone of merchandise trade.
dry bulk cargoes loaded in 2008
the major dry bulks, which are
considered in the following sections,
was estimated at 2.1 billion tons in
2008. With a carrying capacity of
In general, as a way of securing essential supplies,
bulk carriers, which supply it with raw materials for the
example, Indonesia – a major oil exporter – has a large
specialize in bulk shipping that carries the raw material
they need in order to produce manufactured goods, or to
cent, followed by the Republic of Korea, Hong Kong
Singapore.
1. Developments in dry bulk trade
Iron ore is an important commodity as it forms the basic
ingredient for the production of steel, which in itself
industrial production. Around
98 per cent of iron ore goes into
iron and steel production, with
the remainder used in applications
such as coal washeries and cement
manufacturing. Iron itself is the
tonnage of global metal production. Iron is also alloyed
with a number of elements such as carbon, manganese
and nickel to produce stronger and harder steels which
ships, trains and railroad tracks.10
exports of iron ore. China accounts for almost half of the
world’s imports, and Japan remains the second-largest
trips from Australia to China. Considering that these
being earned.
The dry bulk market – which
had been riding high since
2003 – collapsed in 2008,
despite a promising start.
4 - Trade and Freight Markets 93
sectors, China’s imports of iron ore increased in 2008
2008. In April 2009, China reached a new import high
2009 showed an increase in iron ore imports by China
to around 20 million tons.11 According to data released
some mills to reduce their demand for iron ore imports
iron ore during 2008. If domestic production stays the
same, then imported iron ore after August 2009 will either
fall – leading to lower freight rates – or it will contribute
to the stockpile and help maintain rates. In 2009, China
affect world markets is not yet clear, as it will depend on
sold around 20 per cent on the spot market. During 2008,
out for a freight premium because of their geographical
price cut with Japan’s Nippon Steel, the world’s second-
largest steelmaker.12 13
and the Republic of Korea.
announced a series of financial measures aimed at
the country’s 8 per cent export duty on iron ore, and a
Indian iron ore imports by China, pushing the country’s
total exports to 13.9 million tons for the month of
as the increasing cost of rail freight from Karnataka and
eastern India took effect. Draft restrictions at Indian ports
also been a contributing factor in limiting exports, as
In addition to being an important ingredient in steel
In other parts of the world, coal exports from Ukraine were
affected by a number of incidents, including a methane
explosion at the Karl Marx mine in the Donetsk region.
a 13 per cent import duty on all coal, in order to protect
time for India, which is facing increased costs for its coal
on coal exports, bringing the duty up to 20 per cent. In
South Africa, exports of coking coal decreased during
March and April 2008 as domestic steel production rose.
Review of Maritime Transport, 200994
Grains form the key ingredients that go into the
manufacture of food stock for humans and animal
United States, followed by Argentina, Canada, the
down from 98.2 million tons in 2007. Grain exports
from Canada also declined, from 22.2 million tons in
its exports from 9.2 million tons in 2007 to 13.1 million
tons in 2008, while Argentina’s exports of grain remained
regarding the creation of a state grain company to control
grain exports.
bauxite to produce 2 tons of alumina, which, in turn,
17
aluminium, including all forms of secondary metal,
mine production of bauxite increased by an estimated
and India accounted for most of the slight increase
in the worldwide production of
bauxite in 2008. Meanwhile, world
alumina production increased by an
dominates the global aluminium
industry, accounting for one third
of both world production and world
consumption of primary aluminium. After China,
the most important producing countries are the
Russian Federation, Canada, the United States,
aluminium. Globally, there are some 200 smelters
that produce primary aluminium, half of which are
10 of these, with a total capacity of 2.8 million tons
per year. A new 300,000-ton-per-year smelter factory
began operations in Oman.
UC Rusal,18 restarted output at the Alscon plant in
Nigeria, which has a capacity of 197,000 tons annually.
and where UC Rusal owns the Friguia bauxite and
alumina complex, which has the capacity to produce
built in Nigeria because a smelter consumes an
enormous amount of energy, which Nigeria has in the
remain the two costliest inputs in the production of
supply of power is a more important factor than either
nearby raw materials or markets, when deciding on a
plentiful hydroelectricity and nearby consumption
markets.
tons. In terms of regions, 33 per cent are located in
South America and the Caribbean, 27 per cent in Africa,
17 per cent in Asia, 13 per cent in
Oceania and 10 per cent elsewhere.
countries, which together account
production, in decreasing order
of tonnage mined, are: Australia,
cash price for high-grade aluminium fell from a record
high of $3,070 per ton in July 2008 to $1,329 per ton in
tons to 3.2 million tons.
World mine production of
bauxite increased by an
estimated 1.5 per cent to
reach 205 million tons in 2008.
4 - Trade and Freight Markets 95
most commonly in the agricultural industry, which
accounts for more than 90 per cent of world phosphate
only significant global resources of phosphorus,
which is an essential element for plant nutrition
applications for rock phosphates include anti-corrosion
agents, cosmetics, fungicides, ceramics, water
occur principally as sedimentary marine phosphorites.
are found in northern Africa,
Canada, the Russian Federation
large complexes for phosphate rock are located in
Morocco remains the world’s major exporter, and the
United States the world’s major importer. Morocco’s
exports accounted for nearly half of world shipments,
totalling 32 million tons, the bulk of which was
by lesser exporters in other African countries and
In 2008, world mine production of phosphates increased
been put at around 18,000 million
tons. China and Morocco hold
by South Africa with 8 per cent
tight supplies.
on the price of other forms of fertilizer, such as
nitrogen, potash and sulphur.
in 2007. As reported in chapter 2,
the tonnage of dry bulk ships on
order in 2009 outstripped that of
tonnage order book represents
,
be seen in the rising freight costs,
which meant that by mid-2008 it
cost nearly $108 per ton to ship iron
Australian iron ore producers who are closer to the Asian
2008, the collapse in dry bulk freight rates saw rates for
In 2008 world mine production
of phosphates increased by
an estimated 6.5 per cent to
reach 167 million tons.
… the tonnage of dry bulk
ships on order in 2009
outstripped that of any other
vessel type.
Review of Maritime Transport, 200996
2. Dry bulk freight rates
A turning point in the fortunes of dry bulk shipowners
was reached in 2008 after four years of strong growth.
helped tighten supply and lift freight rates at the start of
the year. In northern China, high stockpiles of iron ore
port during June 2008, as a result of
again caused delays at the port.
19
by December 2008, rates had dropped tenfold to
experienced freight rate declines of around 30 per cent
high for some time, just kept falling in December 2008,
companies took worked against them. Not only were
costs on the physical side, but they also had to meet
had a knock-on effect, and bad debts added further to the
misery of those companies still standing. When Armada
more than $100 million by Fortescue Metals, Ashapura
20
cost $128 million at the start of 2008, then rose to
Index, which peaked in May 2008
and rapidly fell to record lows in
daily hire rate rose slightly to $21,300. Historically, these
1990s – a decade when the highest daily rate could not
to reach 3,822 points, from an all-time low of 830 points
Supramax earnings were around $10,000 per day –
per day mark, although the sustainability of these rates
ships in an effort to restore rates.21
In 2008, the tramp market for dry cargo, both time
A turning point in the fortunes
of dry bulk shipowners was
reached in 2008 after four
years of strong growth.
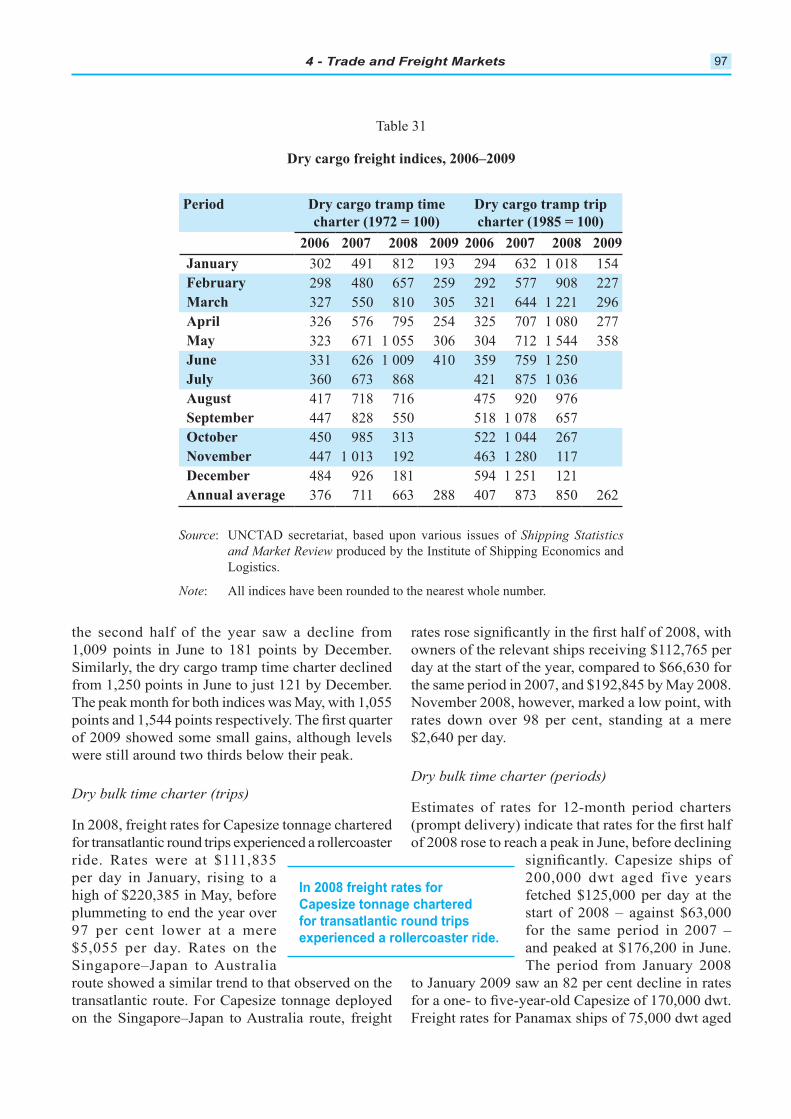
4 - Trade and Freight Markets 97
period dry cargo tramp time charter (1972 = 100)
dry cargo tramp trip charter (1985 = 100)
2006 2007 2008 2009 2006 2007 2008 2009January 302 491 812 193 294 632 1 018 154february 298 480 657 259 292 577 908 227march 327 550 810 305 321 644 1 221 296april 326 576 795 254 325 707 1 080 277may 323 671 1 055 306 304 712 1 544 358June 331 626 1 009 410 359 759 1 250July 360 673 868 421 875 1 036august 417 718 716 475 920 976september 447 828 550 518 1 078 657october 450 985 313 522 1 044 267november 447 1 013 192 463 1 280 117december 484 926 181 594 1 251 121annual average 376 711 663 288 407 873 850 262
Source: UNCTAD secretariat, based upon various issues of Shipping Statistics and Market Review produced by the Institute of Shipping Economics and Logistics.
Note: All indices have been rounded to the nearest whole number.
Table 31
dry cargo freight indices, 2006–2009
the second half of the year saw a decline from 1,009 points in June to 181 points by December. Similarly, the dry cargo tramp time charter declined from 1,250 points in June to just 121 by December. The peak month for both indices was May, with 1,055 points and 1,544 points respectively. The first quarter of 2009 showed some small gains, although levels were still around two thirds below their peak.
Dry bulk time charter (trips)
In 2008, freight rates for Capesize tonnage chartered for transatlantic round trips experienced a rollercoaster ride. Rates were at $111,835 per day in January, rising to a high of $220,385 in May, before plummeting to end the year over 97 per cent lower at a mere $5,055 per day. Rates on the Singapore–Japan to Australia route showed a similar trend to that observed on the transatlantic route. For Capesize tonnage deployed on the Singapore–Japan to Australia route, freight
rates rose significantly in the first half of 2008, with owners of the relevant ships receiving $112,765 per day at the start of the year, compared to $66,630 for the same period in 2007, and $192,845 by May 2008. November 2008, however, marked a low point, with rates down over 98 per cent, standing at a mere $2,640 per day.
Dry bulk time charter (periods)
Estimates of rates for 12-month period charters (prompt delivery) indicate that rates for the first half of 2008 rose to reach a peak in June, before declining
significantly. Capesize ships of 200,000 dwt aged five years fetched $125,000 per day at the start of 2008 – against $63,000 for the same period in 2007 – and peaked at $176,200 in June. The period from January 2008
to January 2009 saw an 82 per cent decline in rates for a one- to five-year-old Capesize of 170,000 dwt. Freight rates for Panamax ships of 75,000 dwt aged
In 2008 freight rates for Capesize tonnage chartered for transatlantic round trips experienced a rollercoaster ride.
Review of Maritime Transport, 200998
from $31,000 in January 2007, but ended the year
down, at $10,000 per day. Freight rates for Handymax
ships of 28,000 dwt aged 10 years saw a decline from
by December 2008.
2008. A similar picture emerges for all other routes, as
the effects of the global economic downturn curtailed
the demand for raw materials.
THE LINER SHIPPING MARKETD. 22
Introduction
cent of world goods loaded in
most items can be transported
in containers, including cargoes
components of products, containers
In 2008, the total world containerized trade was
23 Full container trade is
of containerized trade, as part of the world’s total dry
factors that includes dedicated purpose-built container
ports, and also the increasing amount of raw materials
being carried in containers, for example base metals
such as copper cathodes and copper concentrates.
1. Developments in the liner trade
2008 was the repeal of the block exemption that liner
with regard to price and capacity setting. As of
surcharges, resulting in different rates and amounts
rates applied by shipping companies are putting an extra
Union approach.
compared to the boom of 2007. In an effort to shore up
the spot price from 1 April 2009.
As an additional measure to absorb
capacity, some operators re-routed
to transit the longer Cape of Good
around 30 per cent, the route eliminates transit fees for
the Suez Canal. In some cases, this re-routing brought
after allowing for extra fuel and crew costs. With rising
compared to the same period in 2008. During April 2009,
can expect to pay twice that amount for a single transit.
Interestingly, in May 2009, MSC, which had re-routed
negotiated a discount with the Suez Canal Authority.
… container volumes on the
Asia–Europe trade fell by
around 15 per cent in 2008.
4 - Trade and Freight Markets 99
the piracy hot spot off Somalia and the need to purchase
additional insurance. It has been reported that insurance
costs for piracy attacks rose more than tenfold in 2008.
will double.
reductions in early 2009 relating to trade on the route
in 2008 followed a trend similar to the tanker and dry
As reported in chapter 2, the total seaborne container-
of newbuildings were ordered in 2008, whereas up to
in 2008: around 728,000 dwt from January to October.
–
which is owned and operated by the Swiss-
10 global container ship operators increased by 11 per
share of the top 20 liner operators
fleet of the top 20 liner companies had grown by
On 1 January 2009, the 20 leading operators accounted
deployed, down by around 1 per cent on 2008. Within
none were from countries with economies in transition.
of the top 20 liner shippers, which entered at position 18
– namely the United Arab Shipping Company,
United Arab Shipping Company caused a stir in 2008
20 as a result of a retrenchment programme to reduce
the number of ships it operates. Despite this, Wan Hai
increased its container-carrying capacity in 2008, and
long-term strategic partnership.
between January 2008 and April 2009, whereas MSC’s
only major change in ownership
with the top 20 liner companies
Hamburg consortium in late 2008.
companies in 2008 was significantly lower than in
On 1 January 2009, the
20 leading operators
accounted for about 69 per
cent of the total container
capacity deployed, down by
around 1 per cent on 2008.
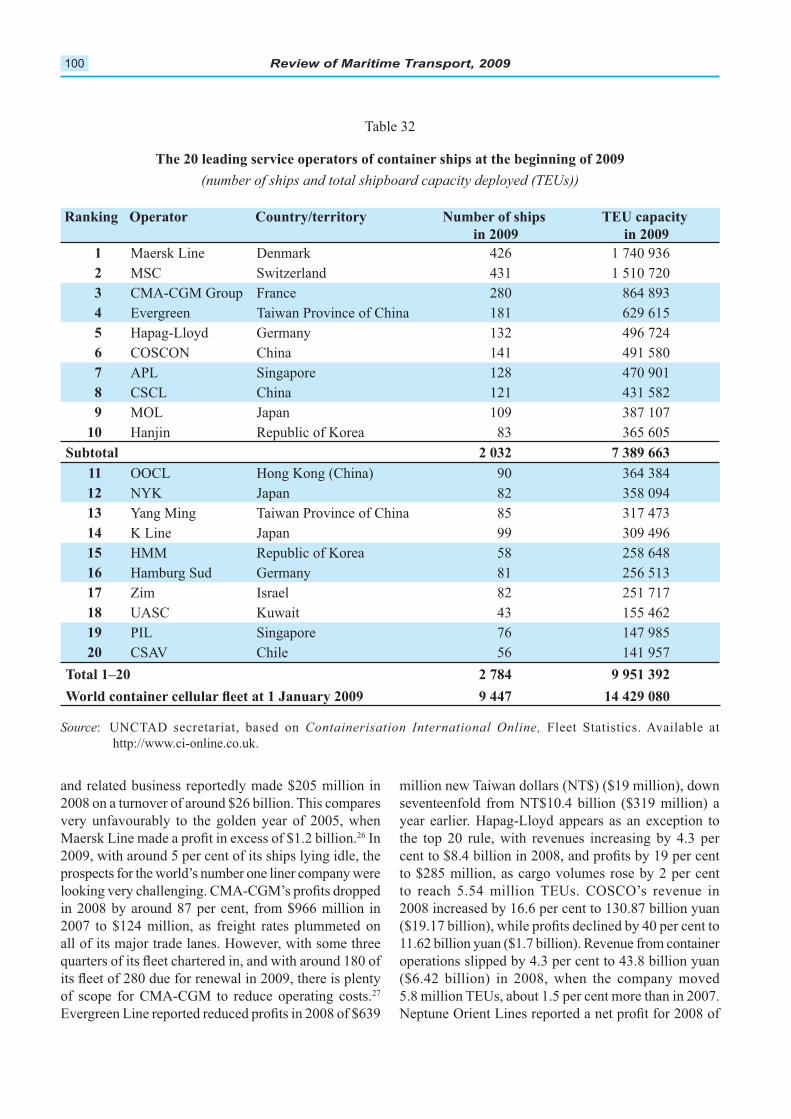
Review of Maritime Transport, 2009100
Ranking Operator Country/territory Number of ships
in 2009
TEU capacity
in 2009
1 Denmark
2 MSC Switzerland
3 CMA-CGM Group France 280
4 181
5 Germany 132
6 COSCON China
7 Singapore 128
8 China 121
9 Japan 109 387 107
10 Hanjin Republic of Korea 83
Subtotal 2 032 7 389 663
11 90
12 NYK Japan 82
13 Yang Ming
14 Japan 99
15 HMM Republic of Korea
16 Hamburg Sud Germany 81
17 Zim Israel 82
18 UASC Kuwait
19 Singapore
20 Chile
Total 1–20 2 784 9 951 392
9 447 14 429 080
The 20 leading service operators of container ships at the beginning of 2009
http://www.ci-online.co.uk.
In
prospects for the world’s number one liner company were
of scope for CMA-CGM to reduce operating costs.27

4 - Trade and Freight Markets 101
while operating income plunged by 32 per cent to
by the global economic downturn combined with dire
are exacerbated by the rising cost of fuel.
2. Container freight rates
German shipowners dominate the global liner shipping
1998, the Hamburg Shipbrokers’
a market analysis of container ship
time charter rates of a minimum
and monthly charter rates for container ships for 2008,
remarkable considering the decline experienced across
the declines at the end of the year continued well into
the three major routes during 2008. A comparison of
United States routes during the same period. Freight rates
currency adjustment factors, bunker adjustment factors
freight rates along selected routes.
As mentioned earlier, as of 18 October 2008, liner
association set up in the wake of
Conference, reported a decrease
Asia route of 22 per cent on the westbound route
from Asia and of 17 per cent on the eastbound
down by 30 per cent.
rates on cargoes loaded or discharged by liners at
ports of the German coastal range for the period
By April 2009, freight rates for
most vessels were below their
year 2000 levels.
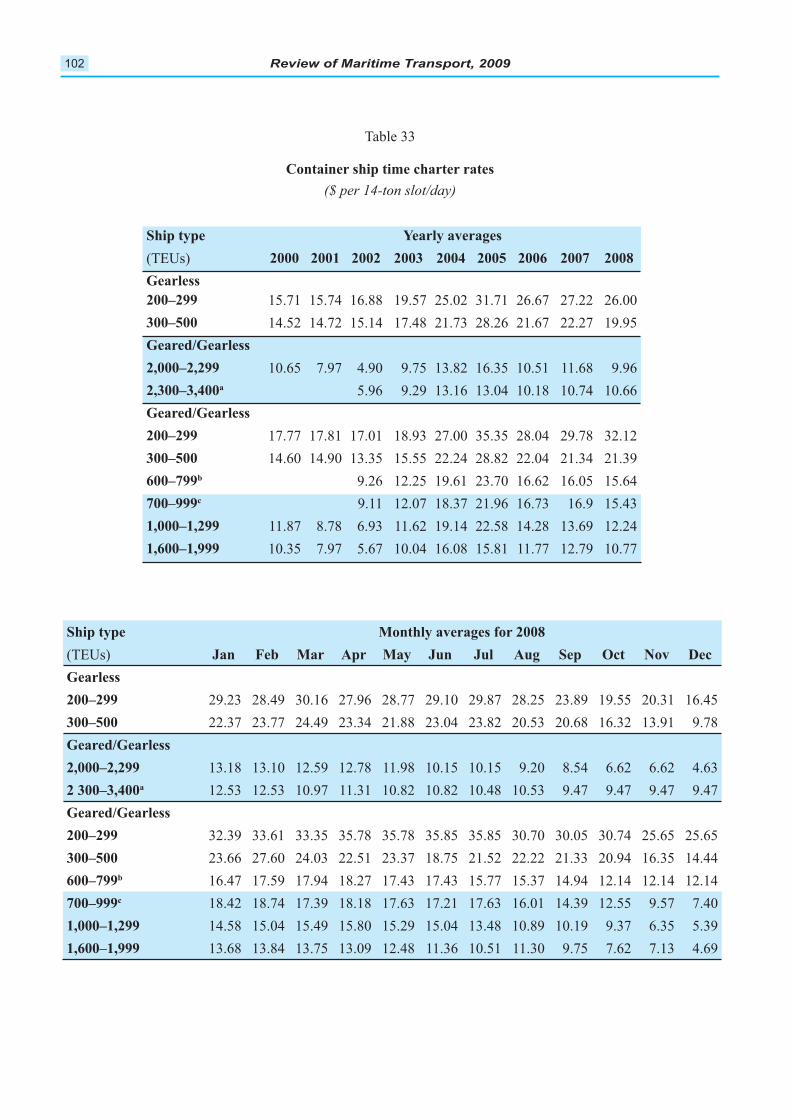
Review of Maritime Transport, 2009102
Container ship time charter rates
Ship type Yearly averages
2000 2001 2002 2003 2004 2005 2006 2007 2008
Gearless
200–299 31.71 27.22
300–500 21.73 22.27
Geared/Gearless
2,000–2,299 7.97 13.82
2,300–3,400a 9.29 10.18
Geared/Gearless
200–299 17.77 17.81 17.01 18.93 27.00 29.78 32.12
300–500 28.82 21.39
600–799b 23.70
700–999c 9.11 12.07 18.37
1,000–1,299 11.87 8.78
1,600–1,999 7.97 11.77 12.79 10.77
Ship type Monthly averages for 2008
Jan Feb Mar Apr May Jun Jul Aug Sep Oct Nov Dec
Gearless
200–299 29.23 28.77 29.10 29.87 23.89 20.31
300–500 22.37 23.77 21.88 23.82 13.91 9.78
Geared/Gearless
2,000–2,299 13.18 13.10 12.78 11.98 9.20
2 300–3,400a 10.97 11.31 10.82 10.82
Geared/Gearless
200–299 32.39 30.70
300–500 23.37 22.22 21.33
600–799b 18.27
700–999c 17.39 18.18 17.21
1,000–1,299 10.89 10.19 9.37
1,600–1,999 13.09 11.30 7.13
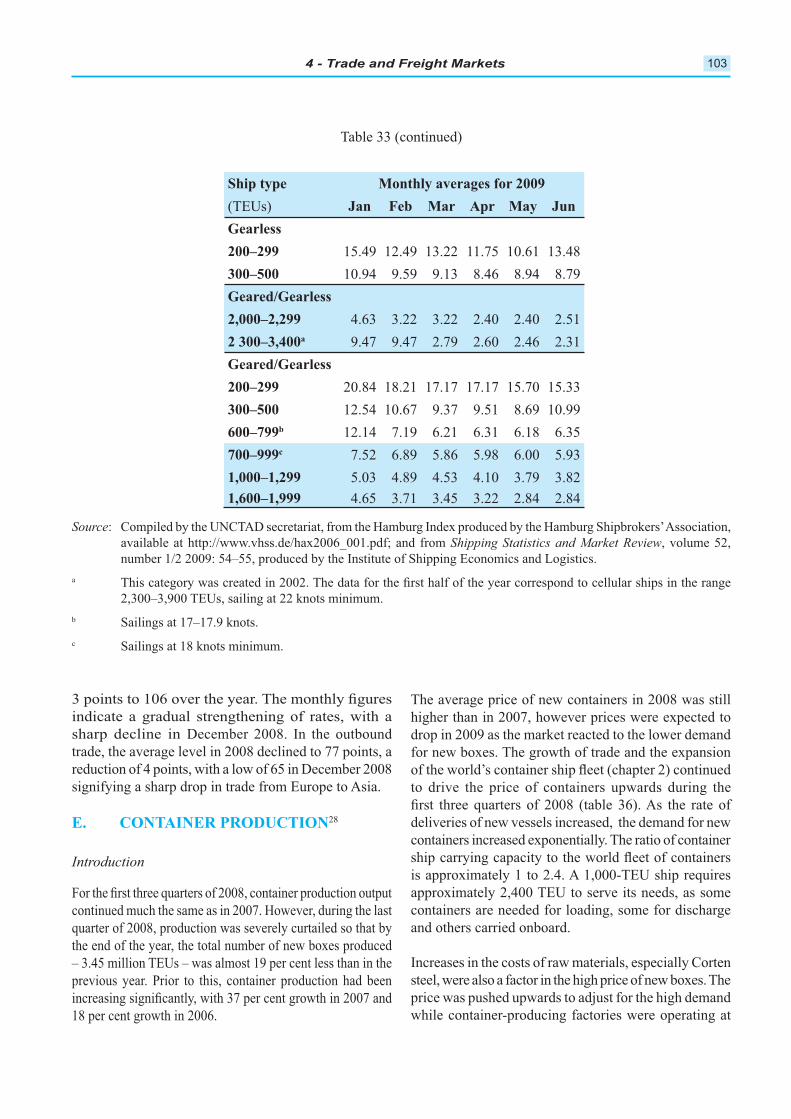
4 - Trade and Freight Markets 103
Ship type Monthly averages for 2009
Jan Feb Mar Apr May Jun
Gearless
200–299 13.22
300–500 9.13 8.79
Geared/Gearless
2,000–2,299 3.22 3.22
2 300–3,400a 2.79 2.31
Geared/Gearless
200–299 18.21 17.17 17.17
300–500 9.37 10.99
600–799b 7.19
700–999c
1,000–1,299 3.79 3.82
1,600–1,999 3.71 3.22
a
b Sailings at 17–17.9 knots.
c Sailings at 18 knots minimum.
indicate a gradual strengthening of rates, with a
sharp decline in December 2008. In the outbound
CONTAINER PRODUCTIONE. 28
Introduction
the end of the year, the total number of new boxes produced
drop in 2009 as the market reacted to the lower demand
containers are needed for loading, some for discharge
and others carried onboard.
Increases in the costs of raw materials, especially Corten
price was pushed upwards to adjust for the high demand
while container-producing factories were operating at
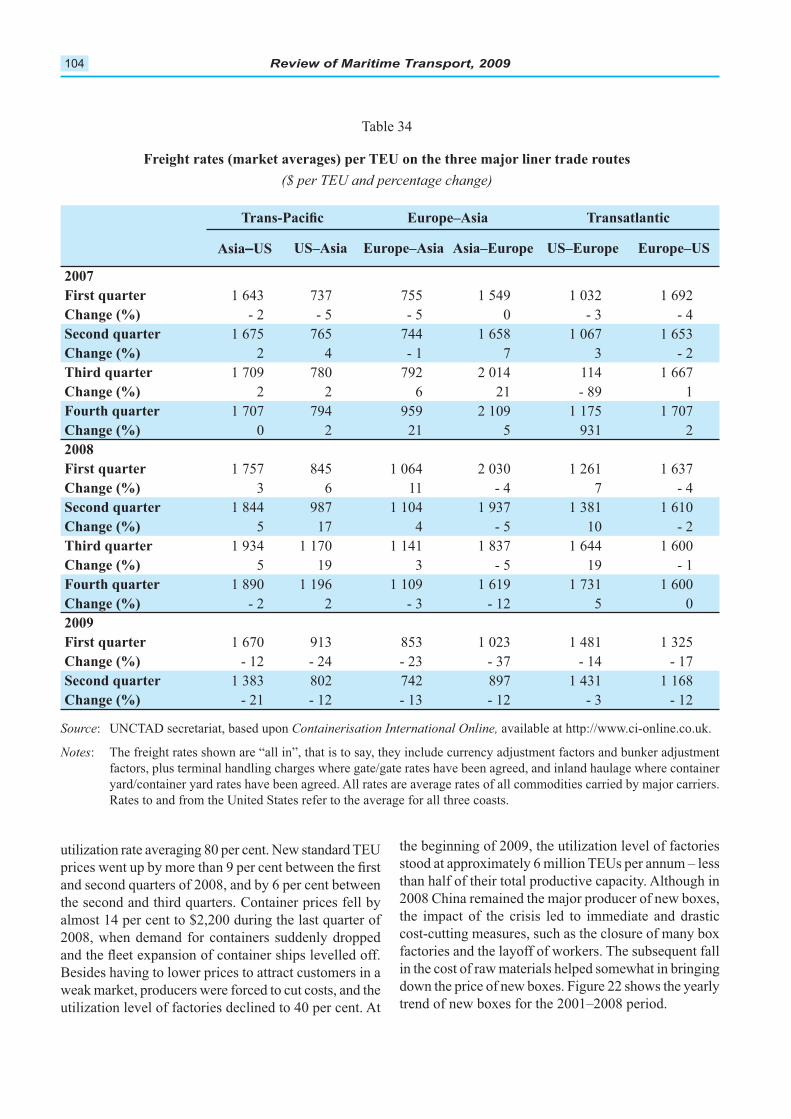
Review of Maritime Transport, 2009104
Europe–Asia Transatlantic
Asia–US US–Asia Europe–Asia Asia–Europe US–Europe Europe–US
2007 1878 1709 1009
First quarter 737 1 032
Change (%) - 2 0 - 3
Second quarter
Change (%) 2 - 1 7 3 - 2
Third quarter 1 709 780 792
Change (%) 2 2 21 - 89 1
Fourth quarter 1 707 2 109 1 707
Change (%) 0 2 21 931 2
2008
First quarter 2 030
Change (%) 3 11 7
Second quarter 987 1 937 1 381
Change (%) 17 10 - 2
Third quarter 1 170 1 837
Change (%) 19 3 19 - 1
Fourth quarter 1 890 1 109 1 731
Change (%) - 2 2 - 3 - 12 0
2009
First quarter 913 1 023
Change (%) - 12 - 23 - 37 - 17
Second quarter 1 383 802 897
Change (%) - 21 - 12 - 13 - 12 - 3 - 12
Freight rates (market averages) per TEU on the three major liner trade routes
2008, when demand for containers suddenly dropped
weak market, producers were forced to cut costs, and the
2008 China remained the major producer of new boxes,
the impact of the crisis led to immediate and drastic
cost-cutting measures, such as the closure of many box
in the cost of raw materials helped somewhat in bringing
down the price of new boxes. Figure 22 shows the yearly
trend of new boxes for the 2001–2008 period.
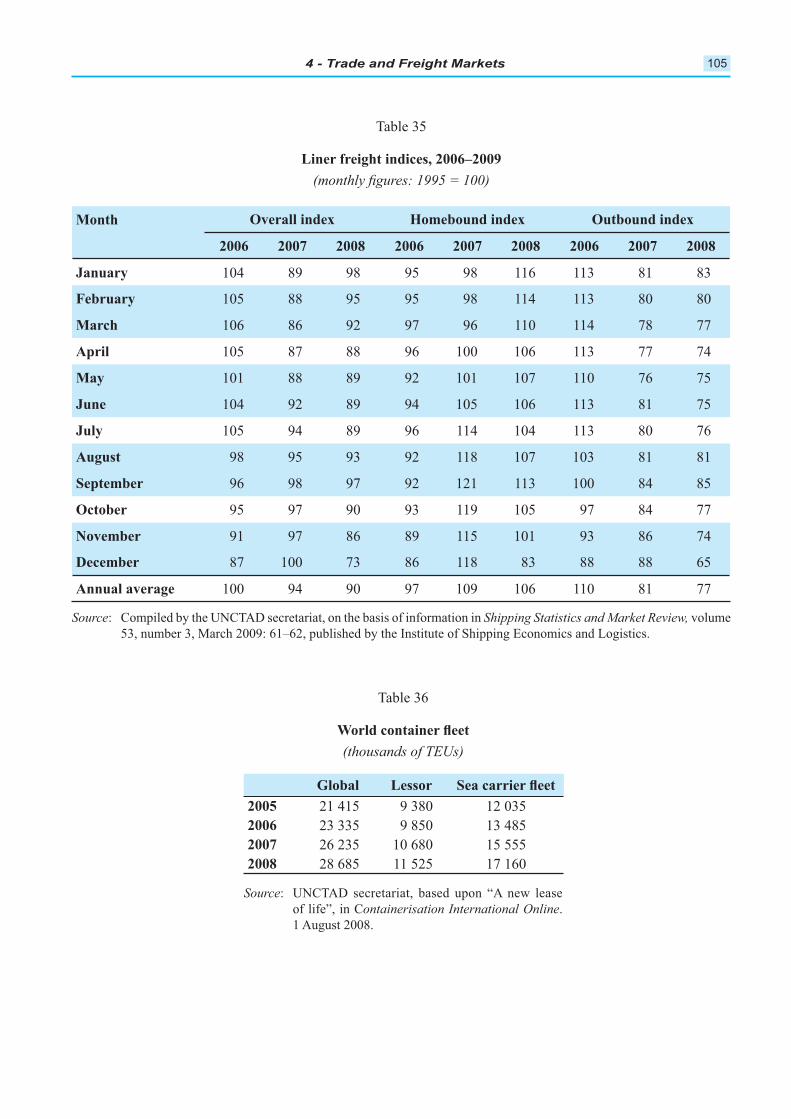
4 - Trade and Freight Markets 105
Month Overall index Homebound index Outbound index
2006 2007 2008 2006 2007 2008 2006 2007 2008
January 89 98 98 113 81 83
February 88 98 113 80 80
March 92 97 110 78 77
April 87 88 100 113 77
May 101 88 89 92 101 107 110
June 92 89 113 81
July 89 113 80
August 98 93 92 118 107 103 81 81
September 98 97 92 121 113 100
October 97 90 93 119 97 77
November 91 97 89 101 93
December 87 100 73 118 83 88 88
Annual average 100 90 97 109 110 81 77
Liner freight indices, 2006–2009
Global Lessor
2005 9 380
2006
2007
2008
.
1 August 2008.
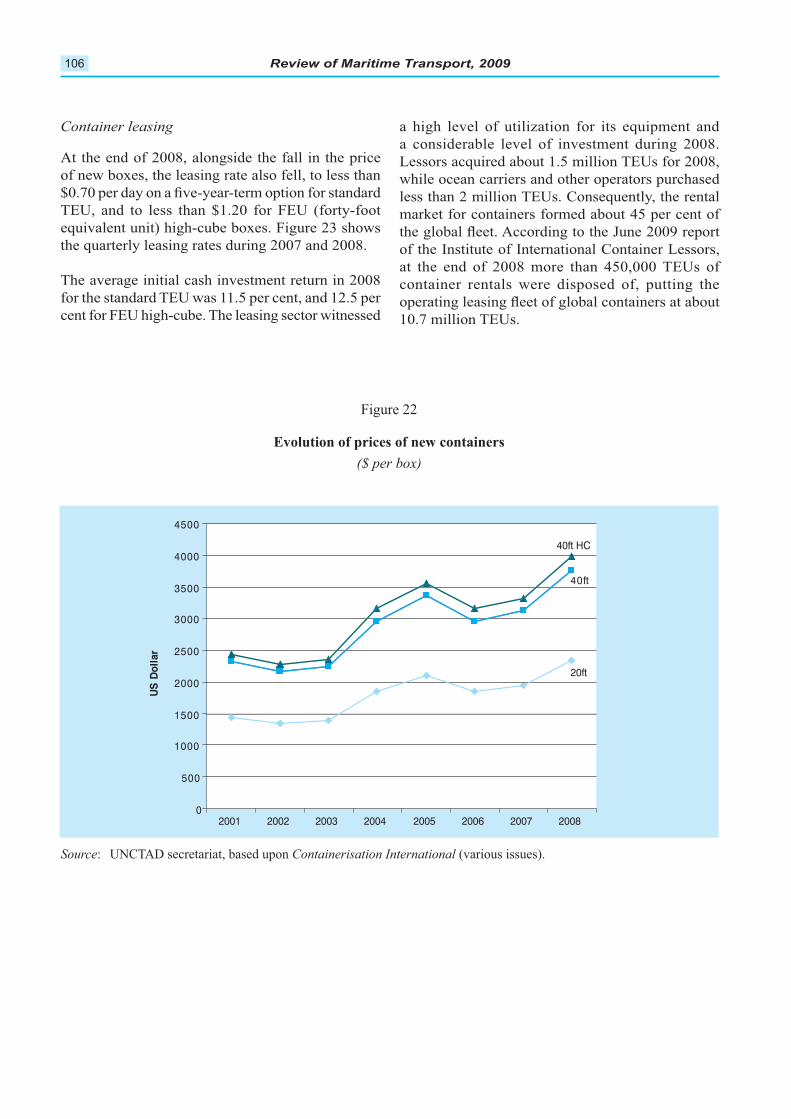
Review of Maritime Transport, 2009106
At the end of 2008, alongside the fall in the price
of new boxes, the leasing rate also fell, to less than while ocean carriers and other operators purchased
container rentals were disposed of, putting the
Figure 22
Evolution of prices of new containers
0
500
1000
1500
2000
2500
3000
3500
4000
4500
2001 2002 2003 2004 2005 2006 2007 2008
US
Dol
lar
20ft
40ft
40ft HC
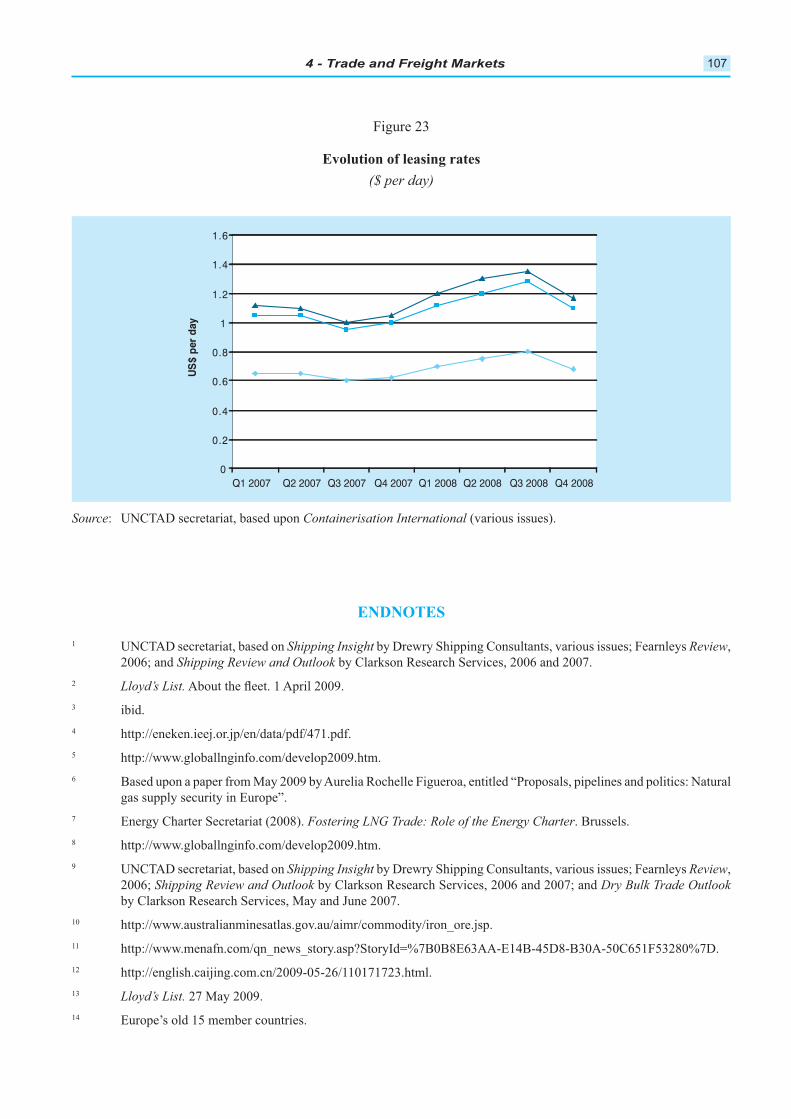
4 - Trade and Freight Markets 107
Figure 23
Evolution of leasing rates
0
0.2
0.4
0.6
0.8
1
1.2
1.4
1.6
Q1 2007 Q2 2007 Q3 2007 Q4 2007 Q1 2008 Q2 2008 Q3 2008 Q4 2008
US
$ pe
r da
y
ENDNOTES
1 ,
2
3 ibid.
7
8
9 ,
10
11
12
13 27 May 2009.
Review of Maritime Transport, 2009108
. August 2008: 7.
17
18
19 – had reportedly been
China.
20
21
22
,
23 . May 2009.
27
28 , 2008 and
2009 issues.
109
Chapter 5
PORT AND MULTIMODAL TRANSPORT DEVELOPMENTS
This chapter covers container port throughput improvements in port performance, institutional change, port
development and inland transportation. World container port throughput grew by an estimated 4 per cent to
reach 506.9 million TEUs in 2008. Chinese mainland ports accounted for approximately 22.3 per cent of the total
ton-kilometres showed growth rates of 3.5 per cent, 5 per cent and 8.4 per cent respectively for 2008. However,
CONTAINER PORT TRAFFICA.
World container port throughput (measured in 20-foot
equivalent units (TEUs)) increased by 12.1 per cent
in 2007. The preliminary figures
for world container port throughput
in 2008 show that this growth
continued, albeit at a lower rate of
approximately 4 per cent. In most
cases, the port throughput statistics
reliable picture.
During 2008, the world’s fleet of container ships
increased by 17.3 million dwt or 11.9 per cent (see
chapter 2), while freight rates on most routes dived
sharply towards the end of the year (see chapter 4). The
situation now facing some ports is a glut of container
ships laying idle outside the port waiting for cargo. The
of 2008 had an effect upon port volumes and therefore
on revenue. The high price/earning ratios that some ports
and terminal operators were experiencing in the years
preceding 2008 have since decreased. For instance, DP
World, one of the largest international terminal operators,
saw its share price drop to $0.18 in
March 2009 from its initial public
offering price of $1.30 in December
2007. This effectively meant the
valuation of the company had
declined from just over $21 billion
to less than $3 billion. Other port/terminal owners/
operators suffered a similar fate as stock markets
declined globally. However, one other important factor
in the valuation of ports was that port throughput – and
thus revenue – had been growing faster than international
trade. With international trade now set to level off or
decline, so too will the revenue of those companies
dependent on it. Port revenue consists not only of
charges made from cargo handling, but also of charges
for services such as towage, mooring, waste removal
etc., which will all decrease with the reduced number of
vessel calls. There is also likely to be a knock-on effect
World container port
throughput … increased by
12.1 per cent in 2007.
Review of Maritime Transport, 2009110
on port project investments, as ports either cut back on
spending or banks insist on stricter loan conditions.
an annual national throughput of over 100,000 TEUs
(table 37), 2007 registered 487.1 million TEU moves
In 2007, the container throughput growth rate for
developing economies was 14 per cent, with a throughput
of 311 million TEUs; this accounted for approximately
listed, 29 countries experienced double-digit growth
in port throughput compared to the preceding year.
The 10 countries registering the highest growth were
the Libyan Arab Jamahiriya (81.7 per cent), Namibia
cent), the Dominican Republic (25.5 per cent) and
China (23.2 per cent). China, the Dominican Republic,
China continues to top the list as the country with the
highest container throughput.
Chinese ports (excluding Hong Kong,
cent in 2007 over the previous year to
reach 103 million TEUs. Preliminary
port throughput continued to grow,
to around 113 million TEUs. Since
with ports in the Bohai Bay area faring better than those
in the south of the country. The main factors for this
are: (a) the large number of factories that are located
in north-east China, where labour and land costs are
cheaper than in the south; (b) the development of
intermodal links with internal provinces; and (c) the
fast expansion of intraregional trade in the region.
Despite this, Dalian recorded its biggest fall in container
throughput – a 10 per cent drop – in February 2009. In
southern China, in particular around Shenzhen, exports
and are thus more affected by the global economic crisis.
Shenzhen, China’s second largest container port, saw box
2009.1 During the same period, Shanghai port handled
1.5 million TEUs in February compared with 1.9 million
TEUs in January, representing year-on-year declines of
19 per cent and 17 per cent. In neighbouring Ningbo,
two months, down 14 per cent from the same period
in 2008. The decline in monthly container volumes
widened from 5 per cent in January 2009 to 23 per cent
in February 2009.
Table 38 shows the world’s 20 leading container ports
for 2008. The list includes 13 ports from developing
economies – all in Asia – with the remainder from
developed countries located in Europe (4) and the
UnitedStates (3). Of the 13ports in developing economies,
7 are located in China (including Hong Kong, China).
The other ports are located in the Republic of Korea,
Malaysia (2), Singapore, Taiwan Province of China,
and the United Arab Emirates. Container throughput in
these ports reached 247.4 million TEUs in 2008, a rise
of 4.9 per cent over the previous year. The ports listed
remained the same for the second consecutive year, with
a slight shifting of fortunes and jostling for position for
those further down the league. The top 5 ports all retained
their respective positions in 2008.
Singapore retained its lead as the world’s busiest port
in terms of the total number of TEU moves, growing at
just over 7 per cent compared to the
previous year. Shanghai matched
this growth rate and maintained its
position in second place. This was
a much lower growth rate than the
20 per cent experienced over the
last few years. The gap between
Singapore and Shanghai widened
slightly in 2008 to 1.9 million
TEUs, from 1.7 million in the previous year, despite
extra capacity with the completion of the third-phase
Hong Kong (China) remained in third place, despite a
weak growth rate of just 1 per cent over the previous
year. The neighbouring port of Shenzhen achieved a
1.5 per cent growth rate in 2008, compared to 14 per
cent in 2007, to remain in fourth place. Busan remained
cent in 2008. Dubai continued its steady upward climb,
rising one place after growing by 11 per cent. Ningbo
and Guangzhou both moved up an impressive four places
after increasing their throughput by around 20 per cent.
Rotterdam fell by three places to ninth place, as a result
of static throughput. Qingdao held on to its tenth place,
with a 9 per cent growth rate. Hamburg dropped by two
places to end in eleventh place. Kaohsiung continued its
Singapore retained its lead
as the world’s busiest port in
terms of the total number of
TEU moves, growing at just
over 7 per cent compared to
the previous year.
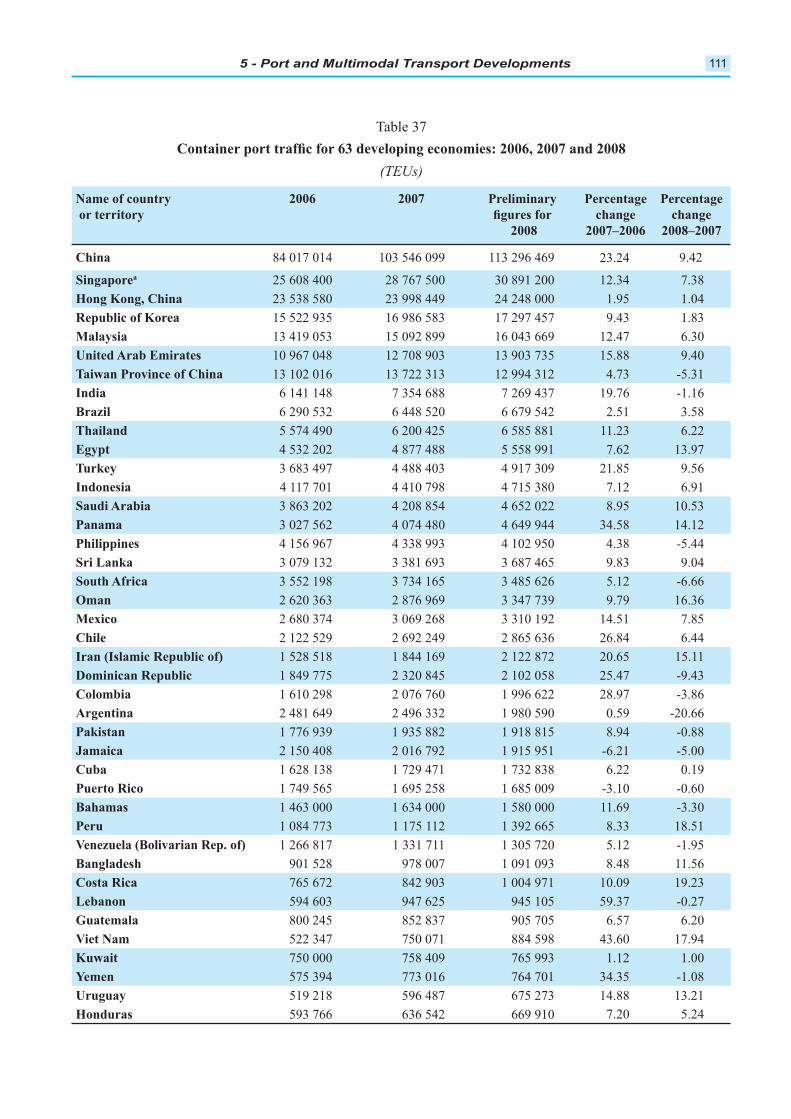
5 - Port and Multimodal Transport Developments 111
Table 37
(TEUs)
China 84 017 014 23.24 9.42
a 30 891 200 12.34 7.38
23 538 580 23 998 449 24 248 000 1.95 1.04
15 522 935 17 297 457 9.43 1.83
13 419 053 15 092 899 12.47
12 708 903 13 903 735 15.88 9.40
13 722 313 12 994 312 4.73 -5.31
2.51 3.58
5 574 490 11.23
4 532 202 4 877 488 5 558 991 13.97
4 488 403 4 917 309 21.85
4 117 701 4 410 798 4 715 380 7.12
4 208 854 8.95 10.53
4 074 480 34.58 14.12
4 338 993 4 102 950 4.38 -5.44
3 079 132 9.83 9.04
3 552 198 5.12
3 347 739 9.79
3 310 192 14.51 7.85
2 122 529
1 528 518 2 122 872 15.11
1 849 775 2 320 845 2 102 058 25.47 -9.43
28.97
1 980 590 0.59
1 935 882 1 918 815 8.94 -0.88
2 150 408 1 915 951 -5.00
1 729 471 1 732 838 0.19
-3.10
1 580 000 -3.30
1 084 773 1 175 112 8.33 18.51
1 331 711 1 305 720 5.12 -1.95
901 528 978 007 1 091 093 8.48
842 903 1 004 971 10.09 19.23
945 105 59.37 -0.27
800 245 852 837 905 705
522 347 750 071 884 598 17.94
750 000 758 409 1.12 1.00
575 394 34.35 -1.08
519 218 14.88 13.21
7.20 5.24
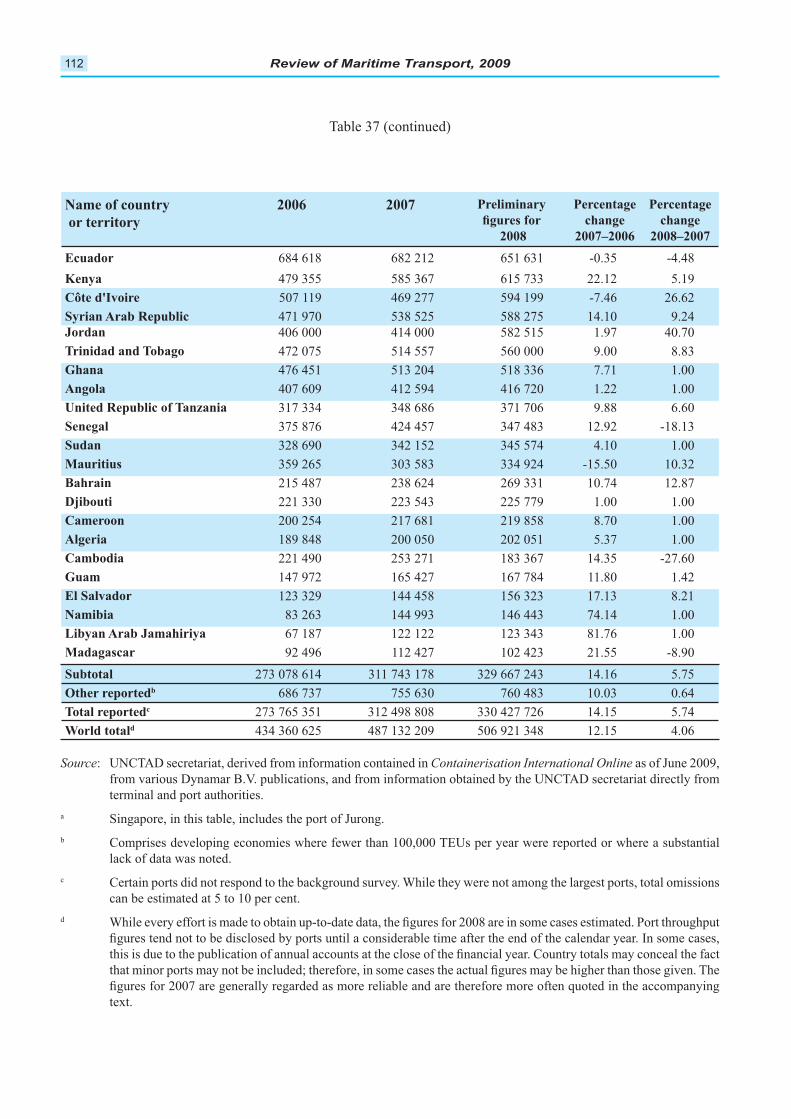
Review of Maritime Transport, 2009112
Source: UNCTAD secretariat, derived from information contained in Containerisation International Online as of June 2009,
from various Dynamar B.V. publications, and from information obtained by the UNCTAD secretariat directly from
terminal and port authorities.
a Singapore, in this table, includes the port of Jurong.
b Comprises developing economies where fewer than 100,000 TEUs per year were reported or where a substantial
lack of data was noted.
c Certain ports did not respond to the background survey. While they were not among the largest ports, total omissions
can be estimated at 5 to 10 per cent.
d
text.
Table 37 (continued)
-0.35 -4.48
479 355 22.12 5.19
507 119 594 199
471 970 538 525 588 275 14.10 9.24
414 000 582 515 1.97 40.70
472 075 514 557 9.00 8.83
Ghana 513 204 7.71 1.00
412 594 1.22 1.00
317 334 9.88
424 457 347 483 12.92 -18.13
342 152 345 574 4.10 1.00
303 583 334 924 -15.50 10.32
Bahrain 215 487 10.74 12.87
221 330 223 543 225 779 1.00 1.00
200 254 219 858 8.70 1.00
189 848 200 050 202 051 5.37 1.00
221 490 253 271 14.35
147 972 11.80 1.42
123 329 144 458 17.13 8.21
144 993 74.14 1.00
122 122 123 343 1.00
112 427 102 423 21.55 -8.90
311 743 178 5.75
10.03
312 498 808 14.15 5.74
487 132 209 12.15
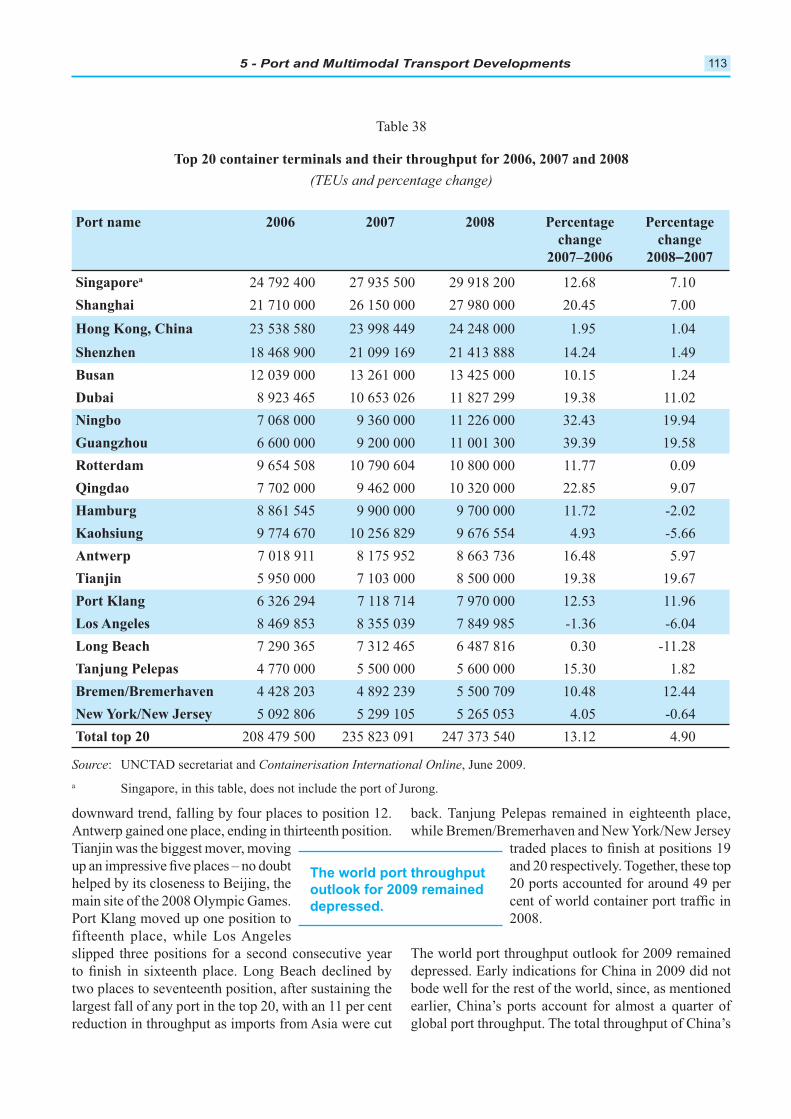
5 - Port and Multimodal Transport Developments 113
–
a 24 792 400 27 935 500 29 918 200 7.10
21 710 000 27 980 000 20.45 7.00
23 538 580 23 998 449 24 248 000 1.95 1.04
Shenzhen 21 413 888 14.24 1.49
12 039 000 13 425 000 10.15 1.24
11 827 299 19.38 11.02
32.43 19.94
9 200 000 11 001 300 39.39 19.58
10 800 000 11.77 0.09
7 702 000 10 320 000 22.85 9.07
9 900 000 9 700 000 11.72 -2.02
4.93
Antwerp 7 018 911 8 175 952 5.97
Tianjin 5 950 000 7 103 000 8 500 000 19.38
7 118 714 7 970 000 12.53
8 355 039 7 849 985
0.30 -11.28
4 770 000 5 500 000 15.30 1.82
4 428 203 4 892 239 5 500 709 10.48 12.44
5 299 105 4.05
208 479 500 235 823 091 247 373 540 13.12 4.90
Table 38
(TEUs and percentage change)
Source: UNCTAD secretariat and Containerisation International Online, June 2009.
a Singapore, in this table, does not include the port of Jurong.
downward trend, falling by four places to position 12.
Antwerp gained one place, ending in thirteenth position.
Tianjin was the biggest mover, moving
helped by its closeness to Beijing, the
main site of the 2008 Olympic Games.
Port Klang moved up one position to
fifteenth place, while Los Angeles
slipped three positions for a second consecutive year
two places to seventeenth position, after sustaining the
largest fall of any port in the top 20, with an 11 per cent
reduction in throughput as imports from Asia were cut
back. Tanjung Pelepas remained in eighteenth place,
and 20 respectively. Together, these top
20 ports accounted for around 49 per
2008.
The world port throughput outlook for 2009 remained
depressed. Early indications for China in 2009 did not
bode well for the rest of the world, since, as mentioned
earlier, China’s ports account for almost a quarter of
global port throughput. The total throughput of China’s
The world port throughput
outlook for 2009 remained
depressed.
Review of Maritime Transport, 2009114
by 11 per cent to 21.8 million TEUs compared to
the previous year. Guangzhou registered the greatest
decline in throughput, losing 24.3 per cent; Shanghai
and Shenzhen declined by 15.1 per cent and 21.2 per
cent respectively.
IMPROVEMENTS IN PORT B.
PERFORMANCE
The most notable improvements to port performance in
2008 occurred in the number of ports achieving greater
crane productivity. In recent years, larger vessels have
created more pressure on ports to load and discharge
cargo, and some of the technology that is used to cater
for this need has now spread to a greater number of
connectivity to world markets, improve trade and lower
their transport costs by improving port facilities. In
some cases this may involve infrastructure investments,
such as providing better access to the port by dredging,
extending and supporting existing quays, or providing
breakwaters. In terms of superstructure, better cargo
handling equipment and storage facilities may be needed.
To make the most use of the port infrastructure and
superstructure, these need to be woven together by an
effective operational system. By operating an integrated
system in the United Arab Emirates, the Khor Fakkan
Container Terminal (KCT), for instance, achieved
220 container moves per hour when servicing the United
Arab Shipping Company (UASC) vessel Mayssan in
April 2009. Although this did not beat the terminal’s
previous record of 237 moves per hour (for the CMA-
CGM vessel La Traviata in 2007), it was a prelude of
things to come. Several weeks later, KCT surpassed
its 2007 terminal record by achieving 279 moves per
hour (for the CMA-CGM vessel Pelleas). While this
is not a world record, it is nevertheless impressive, and
does highlight the fact that incremental improvements
can be made to increase port efficiency through
technological advances. The Apapa Container Terminal
in Nigeria, operated by APM Terminals, broke its own
productivity record when it performed 2,249 moves
in 47.3 hours while unloading the Maersk Pembroke,
productivity was due to new training programmes, yard
improvements, and the deployment of new equipment.
Even though some ports have achieved individual crane
productivity of greater than 70 moves per hour, most
cranes operating at less than half that rate are considered
discharge a single ship as in the KCT example above,
surpassed the 400 mark several years ago. While the
arrival over recent years of tandem-lift, triple-lift
and even quad-lifts cranes has helped improve port
performance on an incremental scale, these new cranes
have not revolutionized the industry. These multiple-
lifting cranes are not a panacea, and as such, they are
not in use everywhere. To get the most out of multiple-
lifting cranes, cargo needs to be loaded onboard in the
right position, to be headed for the same destination,
and to weigh a similar amount. Cargo handling within
ports remains a critical point in the transport chain where
of goods internationally.
RECENT PORT DEVELOPMENTSC.
This section gives a brief overview of some of the port
developments that are happening around the world. It is
intended to be informative rather than exhaustive, and
pertains to developing economies and countries with
economies in transition. In general, port developments
continue unabated, despite the global economic crisis.
Some port projects have been put on hold pending further
analysis of the current economic climate, while other
projects have gone ahead.
In China, the port of Dalian had announced plans to cut
¥800 million
subsequent to this, it announced investments of ¥1.5 billion
for 2010 and ¥799 million for 2011, signalling that the
as bad as originally perceived. The Ningbo-Zhoushan
port expansion plans, which include the building of nine
container terminals, have reportedly been put on hold
by Singapore’s PSA International and Hong Kong’s
Modern Terminals, as a consequence of the global trade
distortions. PSA had also expressed an interest in building
seven additional terminals, bringing the total investment
as high as $1.9 billion. Both parties have now put their
projects on hold until the global economic downturn
eases. Ningbo-Zhoushan port, located near Shanghai,
plans to increase its container throughput to 30 million
TEUs by 2020, up from 10.93 million TEUs in 2008. Total
cargo volume is set to rise to 890 million metric tons, up
from 520 million metric tons. Elsewhere in China, plans
were announced to build three multi-functional ports on
the border with the Russian Federation, at Tuntszyan,
Jiamusi and Big Ussuri. In China, a 51 per cent stake
in the country, was sold to Hong Kong–listed port and
5 - Port and Multimodal Transport Developments 115
In India, the Port of Jawaharlal Nehru completed the
bidding process for its 330-metre berth extension
project. Expected to be ready in 2010, the additional
taking total capacity at the state-owned terminal to
1.2 million TEUs. In addition, the port also extended
the deadline for bids to operate its fourth container
terminal project, which could cost $1.3 billion. The 30-
is expected to have a 1,000-metre-long terminal with a
backup area and an annual capacity of 4 million TEUs.
At present, private operators DP World run the Nhava
Sheva Container Terminal, and APM Terminals run the
gateway terminal within the port, while the trust operates
its own terminal.
In Colombo, the South Container Terminal port
volumes. Domestic volumes at the Colombo port fell
by 24 per cent, while transshipment volumes fell by
19 per cent in February 2009 over the same period in
the previous year.
In the Republic of Korea, Hanjin Shipping celebrated
the opening of its new terminal at Busan New Port in
February 2009. It also has operations at the Gamcheon
and Gamman terminals elsewhere in Busan, plus
terminals at the ports of Kyangyang and Pyongtaek
in the Republic of Korea. Internationally, Hanjin has
operations in Long Beach, Oakland, Seattle, Rotterdam,
Antwerp, Osaka, Tokyo and Kaohsiung. New projects
scheduled to come online include those in Algeciras
(Spain), Tan Can-Cai Mep (Viet Nam) and Jacksonville
(United States), for completion in 2010, 2011 and 2012
respectively.
In Brunei, the Government has signed an agreement with
International Container Terminal Services Inc. to operate
the Muara Container Terminal for a period of four years,
with two one-year options to extend.
In the Middle East, Saudi Arabia has allocated 12 billion
riyals ($3.2 billion) in its budget for infrastructure
projects including road and ports. A 450-km high-speed
railway designed to link the Red Sea port city of Jeddah
In addition, a 2,400-km rail link between Jordan and
Riyadh is due to be completed in 2010. The line will
link Saudi Arabia’s Al-Jalamid phosphate mine and
its Al-Zabirah bauxite mine in the north with planned
aluminium and fertilizer complexes at Ras al-Zour on
the Gulf coast. Also in Jordan, the Aqaba Development
Corporation has signed a 30-year build-operate transfer
agreement worth in excess of $100 million with the
Jordan Phosphate Mines Company and the Arab Potash
Company to rehabilitate, develop and operate the current
industrial terminal, and to establish and operate a new
at Onitsha, Idah, Dekina, Lokoja and Baro, in Niger
State, to ease the pressure of congestion at existing
terminals in Lagos. In addition, the River Niger is to be
dredged some 570 kilometres from Baro in Niger State
to Bayelsa State. APM Terminals are involved in port
projects in Apapa (Nigeria) and Luanda (Angola), and
also in Pointe-Noire (Congo).2
In Latin America, plans are progressing for further
concessioning in the ports of San Antonio and Valparaíso.
At present DP World, which operates the northern port
of Callao, is reported to be interested in the upcoming
concessioning, along with Hutchison Port Holdings
and local operator Puerto de Lirquén. At the Colombian
port of Buenaventura, despite a fall in throughput of
the $17.7 million planned investment programme will
number of bulk carriers visiting. In Brazil, the National
Department of Transport Infrastructure revealed plans
into the country’s newest container terminal. Several
international terminal operators are reportedly interested
in developing the new project, which has received
wide local support. In Mexico, the Punta Colonet
port development was reportedly put on hold as the
companies interested in or able to carry out the required
investments under the terms stipulated by the Federal
Government. The building of a mineral bulk cargo
facility at Guaymas port also suffered a similar fate after
it failed to attract interest from investors. The building
situation faced by the car industry. The multi-purpose
because the two bidders failed to meet the tender’s
economic requisites.
Table 39 shows the equity market share of the leading
global terminal operators. The equity share proportions
the terminal throughput by the stake that the global
terminal operator has in a particular project. Thus, a
port operating as a 50/50 joint venture between a global
terminal operator and a local partner would allocate
each operator half the port throughput. It is, however,
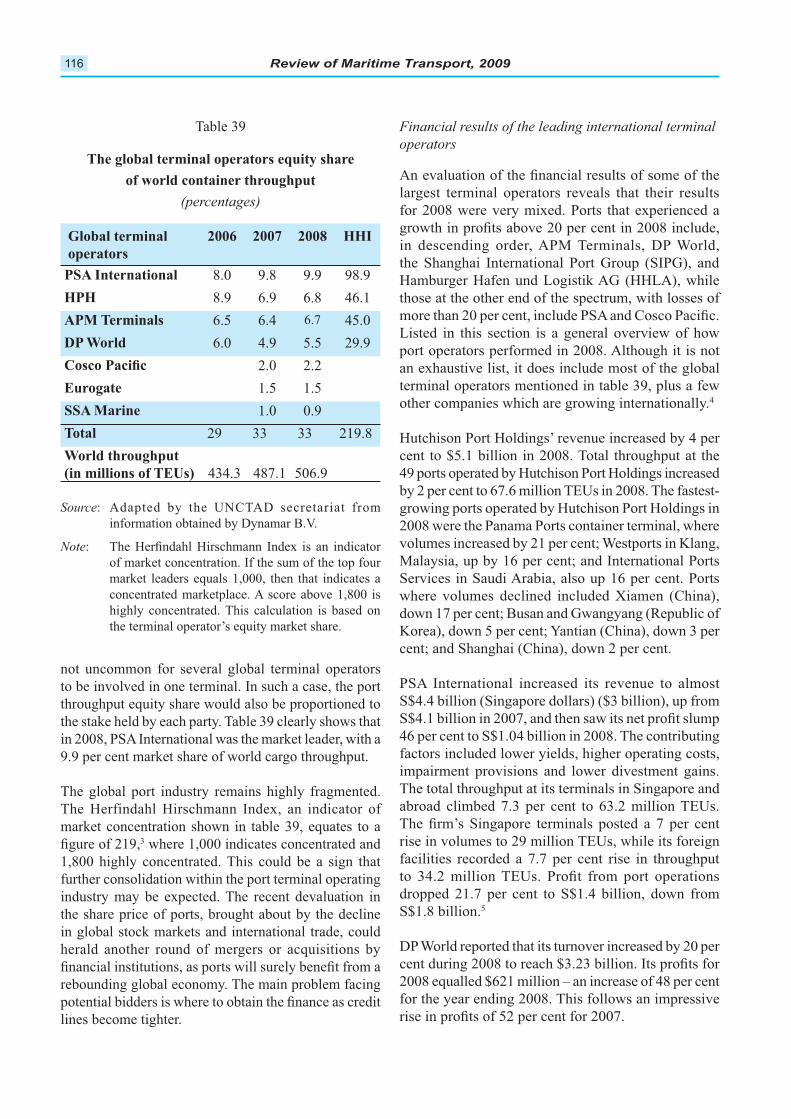
Review of Maritime Transport, 2009116
HHI
8.0 9.8 9.9 98.9
HPH 8.9
45.0
4.9 5.5 29.9
2.0 2.2
1.5 1.5
SSA Marine 1.0 0.9
29 33 33 219.8
434.3 487.1
Table 39
(percentages)
Source: Adapted by the UNCTAD secretariat from
information obtained by Dynamar B.V.
Note
of market concentration. If the sum of the top four
market leaders equals 1,000, then that indicates a
concentrated marketplace. A score above 1,800 is
highly concentrated. This calculation is based on
the terminal operator’s equity market share.
not uncommon for several global terminal operators
to be involved in one terminal. In such a case, the port
throughput equity share would also be proportioned to
the stake held by each party. Table 39 clearly shows that
in 2008, PSA International was the market leader, with a
9.9 per cent market share of world cargo throughput.
The global port industry remains highly fragmented.
The Herfindahl Hirschmann Index, an indicator of
market concentration shown in table 39, equates to a 3 where 1,000 indicates concentrated and
1,800 highly concentrated. This could be a sign that
further consolidation within the port terminal operating
industry may be expected. The recent devaluation in
the share price of ports, brought about by the decline
in global stock markets and international trade, could
herald another round of mergers or acquisitions by
rebounding global economy. The main problem facing
lines become tighter.
Financial results of the leading international terminal
operators
largest terminal operators reveals that their results
for 2008 were very mixed. Ports that experienced a
in descending order, APM Terminals, DP World,
the Shanghai International Port Group (SIPG), and
Hamburger Hafen und Logistik AG (HHLA), while
those at the other end of the spectrum, with losses of
Listed in this section is a general overview of how
port operators performed in 2008. Although it is not
an exhaustive list, it does include most of the global
terminal operators mentioned in table 39, plus a few
other companies which are growing internationally.4
Hutchison Port Holdings’ revenue increased by 4 per
cent to $5.1 billion in 2008. Total throughput at the
49 ports operated by Hutchison Port Holdings increased
growing ports operated by Hutchison Port Holdings in
2008 were the Panama Ports container terminal, where
volumes increased by 21 per cent; Westports in Klang,
where volumes declined included Xiamen (China),
down 17 per cent; Busan and Gwangyang (Republic of
cent; and Shanghai (China), down 2 per cent.
PSA International increased its revenue to almost
S$4.4 billion (Singapore dollars) ($3 billion), up from
factors included lower yields, higher operating costs,
impairment provisions and lower divestment gains.
The total throughput at its terminals in Singapore and
rise in volumes to 29 million TEUs, while its foreign
facilities recorded a 7.7 per cent rise in throughput
dropped 21.7 per cent to S$1.4 billion, down from
S$1.8 billion.5
DP World reported that its turnover increased by 20 per
for the year ending 2008. This follows an impressive
5 - Port and Multimodal Transport Developments 117
Cosco Pacific increased its turnover in 2008 to
a result of the global economic crisis affecting demand
China and 3 internationally.
TEUs. The share of third-party carriers rose to 38 per
cent, from 34 per cent in 2007, with sister company
Maersk Line providing the remainder.
Eurogate increased its revenue by 8.4 per cent in 2008
was the company’s best operating result in its 10-year
history.
HHLA achieved a 23.4 per cent
increase in operating profits to
€355million ($472 million) in 2008.
Sales were up by 12.4 per cent to
€1.3 billion. HHLA’s full-year 2008
container turnover was still slightly
up, by 1.2 per cent to 7.3 million TEUs, including
HHLA’s container terminal in the Ukrainian Black Sea
port of Odessa. However, in the fourth quarter of 2008,
by 27 per cent in 2008 to ¥
by 11 per cent to ¥18.1 billion. In 2007, the company
¥
¥
2008 show a decline of 17.5 per cent compared to the
previous year. Shanghai International Port Group handled
TEUs, up 7 per cent, of which the Waigaoqiao container
deep water port processed 8.2 million TEUs.
China Merchants Holdings International increased its
(Hong Kong dollars) for 2008. China Merchants Holdings
International’s portfolio of ports are mainly located in
China, with the exception of a small stake in a terminal
in Zeebrugge and in a forthcoming project in Viet Nam.
The group handled an aggregate container throughput
of 50.48 million TEUs – an increase of approximately
7.1 per cent over 2007. Throughput of 43.58 million
TEUs was handled in the mainland, an increase of
group in the western Shenzhen port recorded a total
container throughput of 11.58 million TEUs – an increase
of 5 per cent, which was higher than the overall growth
rate of Shenzhen Port. Its market share in Shenzhen also
grew to 54 per cent.
International Container Terminal Services Inc. reported a
pesos, from 3.29 billion in the previous year. A change
in accounting practices was cited as the main cause of
the decline.
INLAND TRANSPORT DEVELOPMENTSD.
By the end of 2008, the effects of the global economic
crisis could be seen in all major transport modes: sea,
road and rail. The most notable
movements in volumes occurred
with severe declines for railway
regions. The following sections
briefly state some of the main
developments that have occurred in the inland waterway,
railway and road sectors.
Inland waterway transport
Whereas inland waterway transport perhaps used
goods from inland to coastal areas, today it is looked
upon more as an alternative means of transport to
help relieve congestion on other transport networks.
Inland waterway transport is an increasingly popular
mode of transportation for goods in many parts of
the world, as is evident from the increasing number
of projects attracting investment. However, inland
waterways only account for a small portion of goods
transported internationally, especially in regions
with very well-developed alternative modes of
transport. For example, in Europe, inland waterway
transport, whereas railways account for 17.9 per
However, in comparison to other regions, European
waterways transport a higher percentage of goods,
suggesting that perhaps it is not alternative modes of
transport that are a key factor, but rather intermodal
By the end of 2008, the effects
of the global economic crisis
could be seen in all major
transport modes ...
Review of Maritime Transport, 2009118
Date of
info.
1 China 110 000 2008 1.3 bn
2 Russian Federation 102 000 2007 152 ma
3 European Union 52 332 500 mb
4 Brazil 50 000 2008 n/a
5 United States
of America 41 009 2008 800 m
Indonesia 21 579 2008 n/a
7 Colombia 18 000 2008 3.8 m
Table 40
Source: Compiled by UNCTAD from various sources.
Note: Data refer to 2008, except where indicated.
a 2007 data.
b
connectivity. Currently, only 2 per cent of the Russian
Federation’s freight transport is carried on waterways,
and in Brazil, inland waterways account for less than
1 per cent of the total freight volume. China, with
the world’s largest network of inland waterways,
transported around 1.3 billion tons of cargo in 2007.
The Russian Federation, with the second-largest
network of inland waterways, transported around
152 million tons in 2007, representing a year-on-
year increase of 9.5 per cent. The third-largest inland
waterway network is in Europe, where 20 of the
European Union’s 27 member States have direct
access. In Europe, around 500 million tons of cargo
were transported using its 37,000 kilometres of inland
waterways in 2007. Table 40 illustrates the total
goods shipped via some of the world’s largest inland
waterway networks.
Recognizing the potential of inland waterways, some
countries have increased their infrastructure investment
in such areas. For instance, the Government of Viet Nam
has proposed a future inland waterway that would
connect Ho Chi Minh City with neighbouring areas,
with an estimated cost of $88.1 million to develop
the waterway system. The plan includes connecting
Ho Chi Minh City with 88 inland waterway routes
totalling 574 km in length, of which 138 km will be
new routes.
Railway transport
In some countries, railways are a major transport
mode for goods destined for international markets. For
around 40 per cent of transport share by volume. For
other countries such as Brazil, railroads account for
this represents an increase of almost 80 per cent since
soon to reach 28 per cent, and a further 2 per cent
has been estimated if the Government invests what is
necessary to expand the railroad network. With a 30 per
cent share, the Brazilian railroad system would be closer
to the international parameter of 40 per cent, which is
considered by many to be the ideal share of railroads in
the transport matrix of countries with similar industrial
and regional features.
The International Union of Railways has reported that
the ton-kilometres of European railways declined by
5 per cent in 2008, when compared to 2007. The end
of 2008 was particularly dramatic for some countries,
when in the last quarter rail freight volumes declined on
average by 14 per cent over the previous quarter (see
table 41). This trend continued into 2009, with a 34 per
cent decline in January 2009 compared to the same
period in 2008. In Western Europe, similar data indicate
cent in January 2009. In the United States, rail volumes
were reported to have fallen by 25 per cent in May 2009,
compared to May 2008.
In Asia, however, railway growth (in ton-kilometres)
year before. China’s growth in 2008, for instance, was
about half the growth rate registered in 2007 (3.5 per
growth rate declined slightly, from 9.4 per cent in 2007
to 8.4 per cent in 2008. In contrast, rail freight in the
Russian Federation experienced yet another good year,
growing by 5 per cent in 2008 from a 7.2 per cent growth
rate registered in 2007.
Reports for the first few months of 2009 indicate
that railroad carload volumes in the United
States were down 19.2 per cent from 2008, down
miles. Similarly, Canadian railroads reported a 22.9 per
cent decrease in carloads and a 14.3 per cent decline in
volume of trailers or containers since 2008.
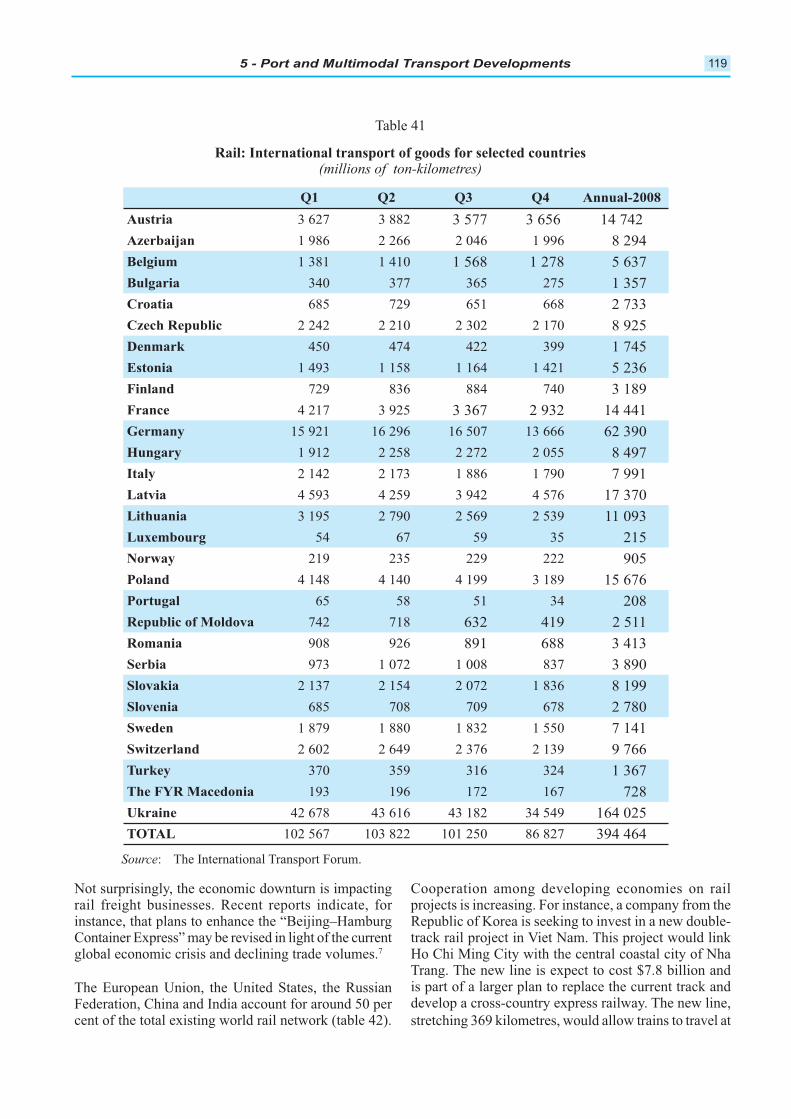
5 - Port and Multimodal Transport Developments 119
Not surprisingly, the economic downturn is impacting rail freight businesses. Recent reports indicate, for instance, that plans to enhance the “Beijing–Hamburg Container Express” may be revised in light of the current global economic crisis and declining trade volumes.7
The European Union, the United States, the Russian Federation, China and India account for around 50 percent of the total existing world rail network (table 42).
Cooperation among developing economies on rail projects is increasing. For instance, a company from the Republic of Korea is seeking to invest in a new double-track rail project in Viet Nam. This project would link Ho Chi Ming City with the central coastal city of Nha Trang. The new line is expect to cost $7.8 billion and is part of a larger plan to replace the current track and develop a cross-country express railway. The new line,
to travel at
Q1 Q4
3 882 3 577 14 742
8 294
1 381 1 410 1 278
340 377 275 1 357
Croatia 729 2 733
2 242 2 210 2 302 2 170 8 925
450 474 422 399 1 745
1 493 1 158 1 421
729 884 740 3 189
4 217 3 925 2 932 14 441
15 921
1 912 2 258 2 272 2 055 8 497
2 142 2 173 1 790 7 991
4 593 4 259 3 942 17 370
3 195 2 790 2 539 11 093
54 59 35 215
219 235 229 222 905
4 148 4 140 4 199 3 189
58 51 34 208
742 718 419 2 511
908 891 3 413
973 1 072 1 008 837 3 890
2 137 2 154 2 072 8 199
708 709 2 780
1 879 1 880 1 832 1 550 7 141
2 139
370 359 324
193 172 728
43 182 34 549
TOTAL 103 822 101 250
Table 41
(millions of ton-kilometres)
Source: The International Transport Forum.
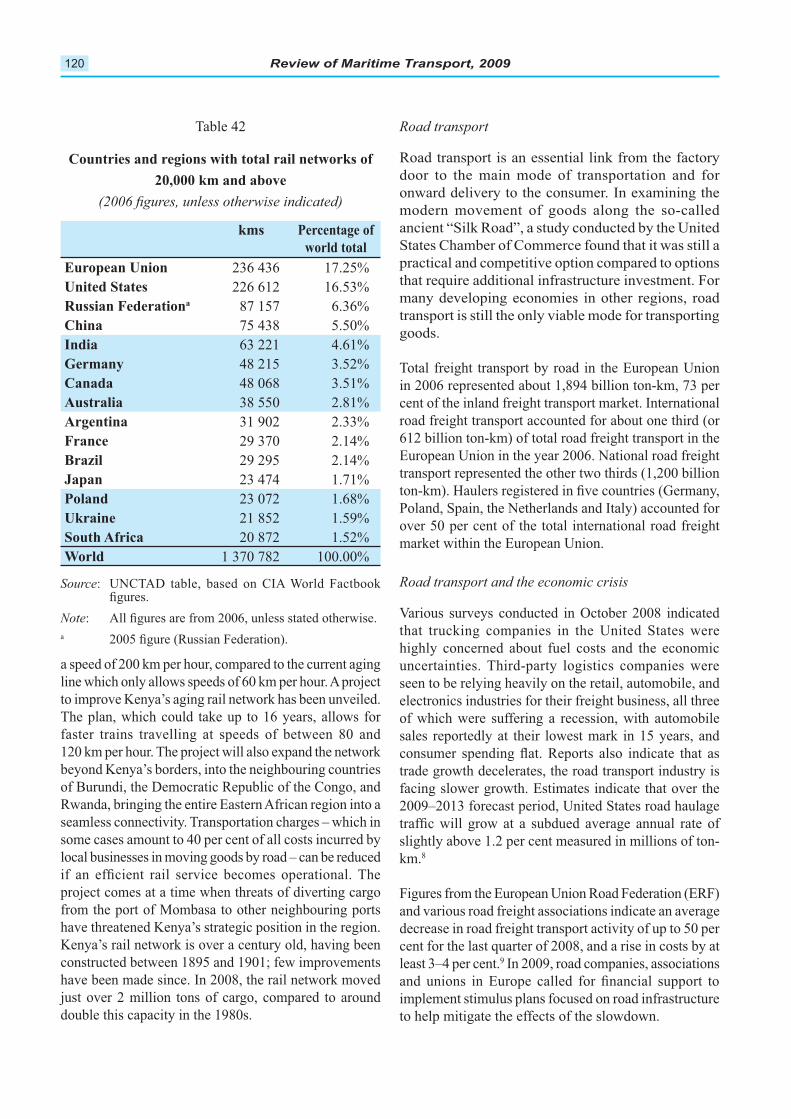
Review of Maritime Transport, 2009120
17.25%
a 87 157
China 75 438 5.50%
48 215 3.52%
3.51%
38 550 2.81%
31 902 2.33%
29 370 2.14%
29 295 2.14%
Japan 23 474 1.71%
23 072
21 852 1.59%
20 872 1.52%
1 370 782 100.00%
Table 42
Source: UNCTAD table, based on CIA World Factbook
Note
a
a speed of 200 km per hour, compared to the current aging
to improve Kenya’s aging rail network has been unveiled.
faster trains travelling at speeds of between 80 and
120 km per hour. The project will also expand the network
beyond Kenya’s borders, into the neighbouring countries
of Burundi, the Democratic Republic of the Congo, and
Rwanda, bringing the entire Eastern African region into a
seamless connectivity. Transportation charges – which in
some cases amount to 40 per cent of all costs incurred by
local businesses in moving goods by road – can be reduced
project comes at a time when threats of diverting cargo
from the port of Mombasa to other neighbouring ports
have threatened Kenya’s strategic position in the region.
Kenya’s rail network is over a century old, having been
constructed between 1895 and 1901; few improvements
have been made since. In 2008, the rail network moved
just over 2 million tons of cargo, compared to around
double this capacity in the 1980s.
Road transport
Road transport is an essential link from the factory
door to the main mode of transportation and for
onward delivery to the consumer. In examining the
modern movement of goods along the so-called
ancient “Silk Road”, a study conducted by the United
States Chamber of Commerce found that it was still a
practical and competitive option compared to options
that require additional infrastructure investment. For
many developing economies in other regions, road
transport is still the only viable mode for transporting
goods.
Total freight transport by road in the European Union
cent of the inland freight transport market. International
road freight transport accounted for about one third (or
transport represented the other two thirds (1,200 billion
Poland, Spain, the Netherlands and Italy) accounted for
over 50 per cent of the total international road freight
market within the European Union.
Road transport and the economic crisis
Various surveys conducted in October 2008 indicated
that trucking companies in the United States were
highly concerned about fuel costs and the economic
uncertainties. Third-party logistics companies were
seen to be relying heavily on the retail, automobile, and
electronics industries for their freight business, all three
of which were suffering a recession, with automobile
sales reportedly at their lowest mark in 15 years, and
trade growth decelerates, the road transport industry is
facing slower growth. Estimates indicate that over the
2009–2013 forecast period, United States road haulage
slightly above 1.2 per cent measured in millions of ton-
km.8
Figures from the European Union Road Federation (ERF)
and various road freight associations indicate an average
decrease in road freight transport activity of up to 50 per
cent for the last quarter of 2008, and a rise in costs by at
least 3–4 per cent.9 In 2009, road companies, associations
implement stimulus plans focused on road infrastructure
to help mitigate the effects of the slowdown.
5 - Port and Multimodal Transport Developments 121
Road haulage companies
are not immune to the global
Road haulage companies are not immune to the
International Road Transport Union
(IRU), the number of bankruptcies
of road haulage companies has
increased substantially since the
end of 2007. The French road
transport organization Fédération
Nationale des Transports Routiers (FNTR) reports that
out of 210 insolvency cases recorded in the road goods
transport sector in France in January 2009, 82 per
cent took place in small or very small enterprises.
Also, according to FNTR, cases of insolvency had
increased threefold in French businesses of more than
50 employees between 2007 and the end of 2008.
The sector, in which around 50 per cent of workers
are self-employed, is likely to be impacted severely
by the crisis. As of January 2009, an estimated
10,000 jobs have been lost in France as a result of the
and 4,000 in Belgium have been
lost through cases of bankruptcy
in the road transport sector. It
is also estimated that a total of
140,000 jobs in EU road freight
transport are currently at risk or
have already been lost since the
end of 2007.10 The number of jobs
lost is only one indicator of the effects of the crisis
on employment (employment conditions in existing
jobs are affected by the crisis too).
Prospects for the rest of 2009 are not favourable.
In January 2009, the IRU published its yearly road
transport indices, according to which growth in the
transport sector in Western Europe is set to stagnate at
this view: over the year 2008, registrations of new
trucks (> 3.5 t.) fell by 4.0 per cent in the EU-27 and
EFTA (without Cyprus and Malta), mainly because
of the 21.1 per cent decrease in the EU-12.
UNCTAD LINER SHIPPINGE.
Countries’ access to world markets depends largely
on their transport connectivity, especially as regards
regular shipping services for the import and export
of manufactured goods. UNCTAD’s Liner Shipping
Connectivity Index (LSCI) aims at capturing a
country’s level of integration into global liner
shipping networks.11 In 2009, China continued to be
the country with the highest LSCI,
followed by Hong Kong (China),
Singapore, the Netherlands and
the Republic of Korea (annex
IV).
Between 2008 and early 2009, the
container-carrying capacity of the largest container
vessels increased further. With 13,800 TEUs, the
new MSC Daniela is larger than the 12,508-TEU
vessels of Maersk, which were the largest ships
in mid-2008. As regards the other components of
the LSCI, however, the global economic crisis has
already had a measurable impact: the average number
of ships, the TEU capacity deployed and the number
time since 2004, when UNCTAD started monitoring
reduction in the number of carriers,
as the mergers and acquisitions
among shipping companies have an
impact on the level of competition
on numerous trade routes. The data
on the routing and deployment
of container ships provide some
further insights into the impacts
of the global economic crisis on different regions.
to grow in line with new deliveries, ships are
increasingly being withdrawn from service and others
have been redeployed on different routes. Between
July 2008 and July 2009, the number of ships, their
total TEU carrying capacity, the number of services
and the number of companies have all decreased.
Only the maximum vessel size has continued to
increase: in spite of the economic crisis, new and
larger vessels are being delivered by the world’s
shipyards. Many of these larger ships then replace
the average number of vessels per country. For the
the average container-carrying capacity TEU assigned
per country has discontinued its rise. Following the
continued trend of mergers and acquisitions, the
average number of companies offering services per
country has decreased by 17 per cent since 2004
Between July 2008 and July
2009, the number of ships, …
the number of services and
the number of companies
have all decreased.
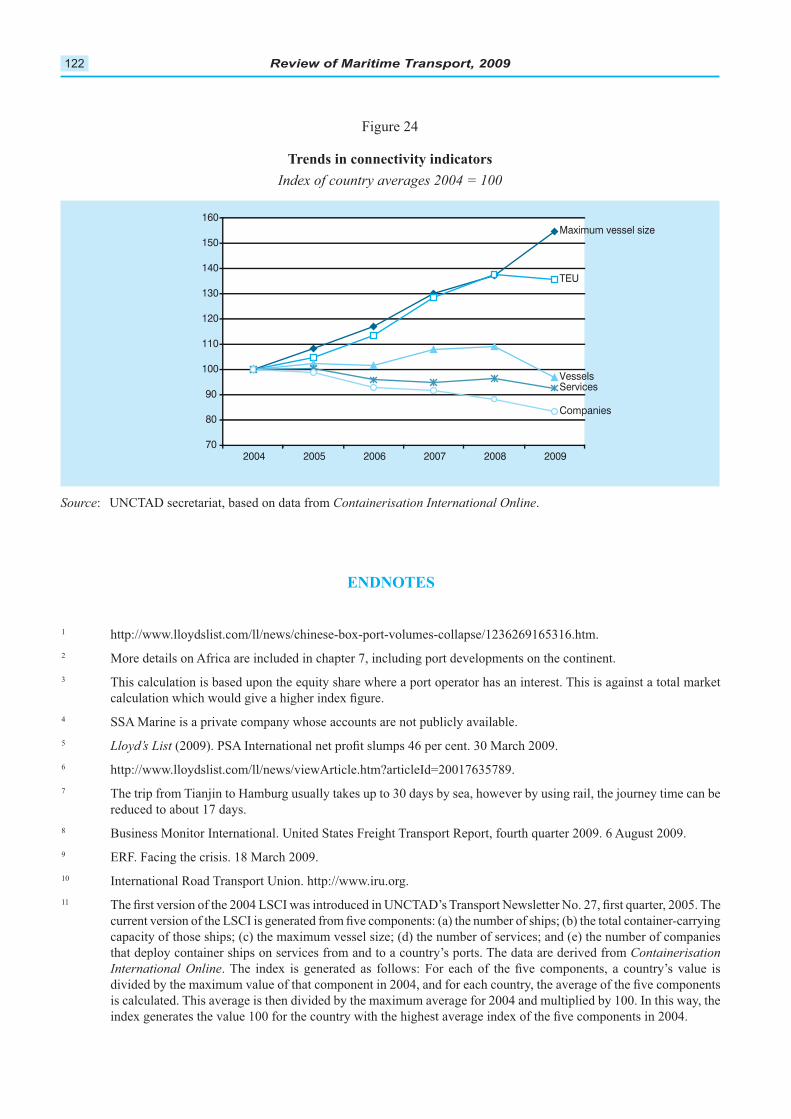
Review of Maritime Transport, 2009122
ENDNOTES
1
2 More details on Africa are included in chapter 7, including port developments on the continent.
3 This calculation is based upon the equity share where a port operator has an interest. This is against a total market
4 SSA Marine is a private company whose accounts are not publicly available.
5 Lloyd’s List
7 The trip from Tianjin to Hamburg usually takes up to 30 days by sea, however by using rail, the journey time can be
reduced to about 17 days.
8
9 ERF. Facing the crisis. 18 March 2009.
10 International Road Transport Union. http://www.iru.org.
11
capacity of those ships; (c) the maximum vessel size; (d) the number of services; and (e) the number of companies
that deploy container ships on services from and to a country’s ports. The data are derived from Containerisation
International Online
is calculated. This average is then divided by the maximum average for 2004 and multiplied by 100. In this way, the
Figure 24
Index of country averages 2004 = 100
Source: UNCTAD secretariat, based on data from Containerisation International Online.
Maximum vessel size
TEU
VesselsServices
Companies
70
80
90
100
110
120
130
140
150
160
2004 2005 2006 2007 2008 2009
123
Chapter 6
LEGAL ISSUES AND REGULATORY DEVELOPMENTS
of transport and trade facilitation, together with information on the status of the main maritime conventions.
A. IMPORTANT DEVELOPMENTS IN
TRANSPORT LAW
Adoption of a new United Nations Convention
on Contracts for the International Carriage of
Goods Wholly or Partly by Sea:
the Rotterdam Rules
In 2008, after years of deliberation, work on the text of
a draft Convention on Contracts for the International
Carriage of Goods Wholly or Partly
draft text, as approved by the United
Nations Commission on International
Trade Law (UNCITRAL) was adopted
by the United Nations General
Assembly on 11 December 2008.
This new United Nations convention,
to be known as the “Rotterdam
Rules”1 (hereinafter referred to as
“the Convention” or “the Rotterdam
Rules”) was open for signing at a
special conference held in Rotterdam in September 2009.
Thereafter, states will consider whether to become parties
the Convention to enter into force.2 In this context it is
conditional upon denunciation of any other international
is to say, for Contracting States to any other international
Rules becomes effective only if and when denunciation
of the Hague Rules,3 the Hague-Visby Rules4 or the
Hamburg Rules,5 as the case may be, has become
effective.6 Thus, adherence to
on balance, national interests
are better served by the new
Convention, rather than by any
of the established international
mar i t ime cargo- l iabi l i ty
regimes.7
Background
By way of background, it
should be noted that the regulation of liability arising
in connection with the international carriage of goods
This new United Nations
convention, to be known as the
"Rotterdam Rules"was open for
signing at a special conference
held in Rotterdam in September
2009. Thereafter, States will
consider whether to become
parties to the new Convention;
Convention to enter into force.
Review of Maritime Transport, 2009124
by sea has, over the past decades, become increasingly
diverse. Many states are Contracting States to the Hague
Rules or the Hague-Visby Rules. The 1978 United
Nations Convention on the Carriage of Goods by Sea
(the Hamburg Rules), which entered into force in 1992,
was designed to provide a modern successor to the
Hague-Visby Rules, but failed to attract widespread
acceptance; although the Hamburg Rules are now in
force in 34 states, none of the major shipping nations
liability regimes, namely the Hague Rules, the Hague-
Visby Rules and the Hamburg Rules, have come to
coexist internationally. At the same time, the exponential
have increased the need for appropriate modern
regulation. In relation to multimodal transportation,
no uniform international liability regime is in force,
and the international legal framework is particularly
complex, as liability continues to be governed by existing
unimodal conventions, and by increasingly diverse
national, regional and subregional laws and contractual
agreements.8
It is against this background that the new Rotterdam Rules
were prepared, with the aim of establishing a modern
set of internationally uniform
rules that provide commercial
parties with much-needed legal
certainty. States will now have to
carefully consider the merits of
the new Convention and decide
whether the Rotterdam Rules
comply with their expectations,
both in terms of its substantive
provisions and in terms of its
potential to provide international uniformity of laws in
The substantive work was carried out by an UNCITRAL
working group, established by the UNCITRAL
Commission.9 Together with a number of other
interested intergovernmental and non-governmental
organizations, the UNCTAD secretariat has been
participating in the relevant UNCITRAL working group
meetings as an observer and has provided substantive
analytical comments for consideration by the working
group throughout the drafting process.10 While proper
consideration of the Convention’s individual provisions
or a comprehensive summary of its content is not
possible here,11 an analytical overview of some of its
central features is provided, with a view to assisting
policymakers in their assessment of the potential merits
many aspects of the new Convention appear potentially
problematic, in particular from the perspective of small-
and medium-scale shippers in developing countries.12
Substantive scope of coverage
The Rotterdam Rules consist of 96 articles which are
contained in 18 chapters. Many of the provisions are
lengthy and highly complex, which, unfortunately,
makes national differences in their interpretation and
application likely and may give rise to significant
litigation.13 To a large extent, the Convention covers
matters that are dealt with in the existing maritime
liability regimes, namely the Hague-Visby Rules and
terms of structure, wording and substance. In addition,
several chapters are devoted to matters currently not
subject to international uniform law such as delivery of
the goods14 and the transfer of the right of control and
of rights of suit.15 The new Convention also provides
for electronic communication and the issue of electronic
substitutes for traditional paper documents, largely
by recognizing contractual agreements in this respect
and by according electronic records a similar status
to paper-based documents.16
Two separate chapters provide
complex rules on jurisdiction
and arbitration.17 These chapters
are, however, optional, and will
only be binding on Contracting
States that have declared their
intention to be bound – a state
of affairs which may give rise
to parallel legal proceedings in
judgments.
Scope of application18
The Rotterdam Rules apply to contracts of carriage19 in
which the places of receipt and delivery are in different
States, provided the contract involves an international
sea leg and the contractual place of receipt, loading,
discharge or delivery is located in a Contracting State
(article 5). The Rules do not apply to charter parties
or to “other contracts for the use of a ship or for any
space thereon” and to contracts of carriage in non-liner
transportation, except where “there is no charter party
or other contract for the use of a ship or of any space
thereon and a transport document or an electronic
States will now have to carefully consider
the merits of the new Convention and
decide whether the Rotterdam Rules
comply with their expectations, both
in terms of its substantive provisions
and in terms of its potential to provide
6 - Legal Issues and Regulatory Developments 125
transport record is issued” (article 6). However, in these
cases, the Rotterdam Rules would apply as between the
carrier and consignee, controlling party or holder that is
not an original party to a contract excluded under article
6 (article 7).
Multimodal transport20
Importantly, and in contrast to the existing international
maritime regimes, the Rotterdam Rules have a broad
scope of application and also cover contracts for
multimodal transportation that involve an international
sea leg, irrespective of which mode of transport is
dominant.21 While at present there is no international
convention in force to govern
multimodal transportation, the
extension of the Convention’s scope
of coverage to multimodal transport
involving a maritime leg was
subject to considerable controversy
throughout the negotiations, as was
the text of the relevant provisions
in the Rotterdam Rules.22 This was
due, in particular, to: (a) concerns
unimodal conventions in the field
of road, rail, air and inland waterway carriage, which
in many instances also apply to loss arising during a
particular stage of a multimodal transport; (b) the desire
by some states to ensure the continued application of
existing national law on multimodal transportation;
(c) concerns about further fragmentation of the law
applicable to international multimodal transportation;
and (d) the fact that the substantive content of the
liability regime is based exclusively on considerations
and principles applicable to sea carriage, rather than
multimodal transportation.23
international conventions applicable to road, rail, air
and inland waterway carriage24 has, to some extent, been
addressed in a separate provision (article 82), which gives
precedence to these conventions to
the extent that they apply beyond
pure unimodal transportation by
road, rail, air and inland waterway,
respectively.25 However, otherwise,
substantive rules pertaining to other
modes of transport come into play
only in relation to losses “arising
solely before or after sea carriage”, and only in the
form of “mandatory provisions on the carrier’s liability,
limitation of liability and time for suit” contained in
any “international convention that would have applied
mandatorily” to the stage of carriage where the loss
occurs, had a separate unimodal transport contract been
made (article 26). Such mandatory provisions would,
in a cargo claim, need to be applied in context with the
remainder of the provisions of the Rotterdam Rules – a
may be expected to result in internationally diverging
judgments. In all other cases, that is to say where no
international unimodal convention would have been
modal stage of a multimodal transport, the provisions
of the Rotterdam Rules, i.e. of a
substantively maritime liability
regime, would apply to determine
the parties’ rights and the extent of
any liability. Existing national laws
on multimodal transportation will
play no role in relation to contracts
falling within the scope of the new
Convention.
Liability of the carrier26
The carrier (as well as any maritime performing party,
such as a terminal operator)27 is under a number of
obligations, breach of which gives rise to liability for
damage to, loss of or delay in delivery28 of the goods.
The liability of the carrier under the Rotterdam Rules 29 with
limitation amounts higher than in the Hague-Visby
Rules or Hamburg Rules30 and subject to a two-year time
bar (article 62), which may be extended by declaration
limitation of liability in case of recklessness or intention
(article 61).
The carrier’s main obligations include the duty to
carry the cargo and deliver the goods to the consignee
(article 11), a duty of care during the carrier’s
period of responsibility, i.e. from
receipt to delivery of the goods
(articles 13 (1) and 12), and a duty
to exercise due diligence to make
and maintain the vessel seaworthy
(article 14);31 this includes (a) the
physical seaworthiness of the vessel;
as well as (b) manning, supply and
In contrast to the Hague-Visby Rules, the seaworthiness
Importantly, and in contrast to the
existing international maritime
regimes, the Rotterdam Rules
have a broad scope of application
and also cover contracts for
multimodal transportation that
involve an international sea-leg,
irrespective of which mode of
transport is dominant.
Existing national laws on
multimodal transportation
will play no role in relation to
contracts falling within the
scope of the new Convention
Review of Maritime Transport, 2009126
obligation is a continuous one, applying throughout the
carriage, and there is no general reversal of the burden
of proof regarding the exercise of
due diligence (cf. article IV, r.1 of
the Hague-Visby Rules). Instead,
the central provision dealing with
liability of the carrier for loss, damage
or delay in the context of a cargo
claim, article 17, which sets out a list
of exceptions to liability, including
some that differ from the list in article r. 2 of the Hague-
Visby Rules,32 also contains detailed and complex rules
on burden of proof.
Worth noting in this respect are a number of points which
are of particular relevance in the context of contracts
conducted on the carrier’s standard terms, i.e. contracts
of adhesion. First, the carrier’s period of responsibility
(i.e. restricted), to cover only the period from initial
12 (3)). Secondly, the carrier’s responsibility for
certain functions, such as loading, handling, stowing
and unloading may be contractually transferred to the
shipper, documentary shipper33 or consignee (article 13
(2)). Thirdly, the carrier’s liability for special cargo and
for live animals may be contractually limited or excluded
(article 81). Therefore, a carrier may only be liable from
loading to discharge and for only some of a carrier’s
functions set out in the Convention.
Moreover, the rules on burden of proof34 within the
from those in the established maritime liability
conventions, favouring the carrier, in particular in cases
where unseaworthiness of the vessel has contributed to
a loss.35 The Rotterdam Rules envisage proportional
allocation of liability in these cases, whereas under the
Hague-Visby Rules a carrier would be liable in full,
unless it could prove the proportion of loss not due to
an important shift in commercial risk allocation to the
detriment of shippers.
Liability of the shipper36
The shipper’s obligations and
liability are more extensive than in
the Hague-Visby Rules and are set out in some detail in
a separate chapter (chapter 7). They include fault-based
liability relating to the preparation and delivery for
carriage of the goods (article 27) and in respect of wide-
(article 29), which may become particularly relevant in
the context of new maritime security 37 They also include
strict liability (see article 30 (2))
for loss arising from the shipment
of dangerous cargo (article 32) and
the failure to provide timely and
accurate contract particulars (article
31 (2)).
Importantly, the relevant rules on burden of proof38
are more onerous than under existing maritime
liability regimes, which could have important practical
implications for the outcome of claims by the carrier
against the shipper, in particular in cases where
unseaworthiness of the vessel may have contributed to a
loss arising from the carriage of dangerous cargo. Thus,
whereas under the Hague-Visby Rules, in cases where
cause, a shipper would in most instances be free from
liability. Under the Rotterdam Rules, a shipper could
become liable in full for any of the potentially extensive
losses sustained by the carrier (e.g. loss of a vessel, third-
party liability). In this context, it is worth highlighting
that the potentially very extensive liability of the shipper
is not subject to any monetary limitation.39
may also become liable for breach of any of the shipper’s
obligations.40 Moreover, a so-called “documentary
shipper”, i.e. a party who is not the contracting shipper
but who “accepts to be named as “shipper” in the
transport document”(article 1(9)), such as an FOB seller,
is also liable for any breach of a shipper’s obligations,
in addition to the shipper himself (article 33).
Delivery of the goods
It should also be noted that there is a separate chapter
dealing with delivery of the goods (chapter 10), providing
for a new obligation on the part of the consignee
to accept delivery of the goods
from the carrier (article 43) and
including detailed rules on delivery
of the goods under different types
of transport documents/electronic
records. Importantly, the chapter also
includes complex new rules to effectively shift the risk of
delayed bills of lading from carrier to consignee: in cases
under a negotiable transport document (i.e. a bill of
The shipper’s obligations and
liability are more extensive than
in the Hague-Visby Rules and
are set out in some detail in a
separate chapter (chapter 7).
There is a separate chapter
dealing with delivery of the
goods (chapter 10).
6 - Legal Issues and Regulatory Developments 127
lading), typically a CIF41 buyer in a chain of contracts,
of the goods from the carrier, for
whatever reason, or (b) is not
yet in possession of the bill of
lading, the carrier may, in certain
circumstances, deliver the goods
without the need for surrender
of the bill of lading (article 47),
or invoke wide-ranging rights to
dispose of the goods (article 48).
having paid his seller, under a
CIF contract, against tender of a
negotiable transport document,
may be left empty-handed and unable to sue the carrier
for misdelivery. The provisions, apparently intended
to provide a solution to the practical problem of
negotiable bills of lading being delayed in a chain of
international transactions involving different buyers
and banks, may seriously undermine the document of
title function of the negotiable bill of lading, which is
key to its use in international trade.42
Mandatory nature of liability
Article 79 sets out the general rule on mandatory
application of the liability regime. Accordingly,
unless otherwise provided in the
Convention, a contractual term is
void (a) if it excludes or limits the
obligations or liability of the carrier
or maritime performing party; and
(b) if it excludes, limits or increases
the obligations or liability of shipper,
consignee, controlling party, holder
or documentary shipper (e.g. FOB
seller). Thus, in contrast to the
Hague-Visby Rules, it is not only the
carrier who is subject to mandatory
minimum liability standards under
the Convention, but also the shipper
(and potentially anyone liable for
breach of the shipper’s obligations,
such as the consignee and documentary shipper). While
may be increased contractually, the shipper’s liability
may not. However, it should again be noted that the
shipper’s mandatory liability under the Rotterdam
Rules is, in any event, not subject to any monetary
limitation.
Volume contracts43
Although in general minimum
standards of liability apply to contracts
covered by the Rotterdam, this is
subject to an important exception.
So-called “volume contracts”, which
for the first time are regulated in
an international convention, are
subject to special rules providing
for extensive freedom of contract.
This represents an important novel
feature, distinguishing the new
Rotterdam Rules from existing
it is of particular interest. By way of
background, it seems appropriate to
with one another, and therefore, normally freedom of
contract reigns.
All international liability regimes for the carriage of
goods by sea currently in force (i.e. the Hague, Hague-
Visby and Hamburg Rules) establish minimum levels of
carrier liability, which apply mandatorily, that is to say
the relevant substantive rules on liability of the carrier
of the shipper or consignee.44 Contractual increase of
the carrier’s liability is, however,
permitted.45 The mandatory scope of
application of the relevant regimes
extends to contracts of carriage
which are not individually negotiated
between the parties, but are conducted
on the carrier’s standard terms, as
typically contained in or evidenced
by a bill of lading or other transport
document issued by the carrier.46
The main purpose of this approach,
c o m m o n t o a l l e s t a b l i s h e d
international liability regimes, is to
reduce the potential for abuse in the
context of contracts of adhesion,
bargaining power contract with one another. In liner
carriage, where few large liner companies dominate the
global market47 and goods are typically shipped under
bills of lading or other standard form documents – issued
and signed by the carrier and usually drafted in terms
favourable to the carrier, with no scope for negotiation
So-called “volume contracts”,
regulated in an international
convention, are subject to
special rules providing for
extensive freedom of contract.
This represents an important
novel feature, distinguishing
the new Rotterdam Rules from
and, therefore is of particular
interest.
By establishing minimum
levels of carrier liability, which
apply mandatorily and may
existing liability regimes
seek to ensure the protection
of cargo interests with little
bargaining power, i.e. small
shippers and third-party
consignees, against unfair
contract terms unilaterally
introduced by the carrier
in his standard terms of
contract.
Review of Maritime Transport, 2009128
bargaining power of the parties is particularly obvious.
By establishing minimum levels of carrier liability,
which apply mandatorily and may not be contractually
protection of cargo interests with little bargaining power,
i.e. small shippers and third-party consignees, against
unfair contract terms unilaterally introduced by the
carrier in his standard terms of contract. Thus, a central
feature of the established international legal framework
is a restriction of freedom of contract with the legislative
intent of ensuring the protection of small shippers and
consignees against unfair standard contract terms.
Against this background, the regulation on volume
contracts in the Rotterdam Rules, providing contracting
parties with extensive freedom of contract, proved to be
highly controversial throughout the drafting process.48
of carriage that provides for the
of goods in a series of shipments
during an agreed period of time.
include a minimum, a maximum
or a certain range” (article 1(2)).
Parties to a volume contract may
derogate from the provisions of the
Convention (article 80), subject to certain conditions49
and subject to some relevant statutory limits on the right
to derogate.50
These include – on the carrier side – the loss of the right
or intention (article 61); and the obligation, under articles
14(a) and (b) to make and keep the ship seaworthy
mentioned in this context is the third aspect of the
carrier’s seaworthiness obligation, i.e. the obligation
to make and keep the vessel cargoworthy (see article
14(c)); therefore, contractual derogation in this respect
shipper’s obligations and liabilities are concerned, no
derogations are permitted regarding (a) the duty to
provide documentation, instructions and information
under article 29; and (b) the obligations and (strict)
liability arising in the context of dangerous goods, under
article 32.
It is important to note that a shipper’s liability arising
from breach of articles 29 and 32 – which may be
extensive, such as in the case of loss of or delay of a
vessel, and is not subject to monetary limitation – may
This means that a shipper would always be exposed to
potentially extensive (and unlimited) liability under the
Rotterdam Rules for losses arising from the carriage of
dangerous cargo or breach of the obligation to provide
certain documentation, information and instruction.51
Volume contracts are exempt from the mandatory
scope of application of the liability regime, based
on the proposition that these types of contract are
bargaining power.52 However, the definition of
“volume contract” is extremely wide and no minimum
type of contract in the liner trade might be devised as
a volume contract, subject to almost complete freedom
of contract. Given that liner carriage is dominated
by a small number of global liner-carriage operators,
concerns arise about the position
of small shippers, who might
face contractual terms unilaterally
set by the carrier. Against this
whether the statutory safeguards
included in the Rotterdam Rules
are effective to protect small parties
against the use of volume contracts
as contractual devices to circumvent the mandatory
liability regime.
As between carrier and shipper, derogations from the
Convention set out in a volume contract53 are binding,
even if the contract has not been individually negotiated.54
Although the shipper must be given the opportunity to
contract on terms of the Convention, without derogation,55
pressure to agree to a volume contract, such as a much
higher freight rate that would apply unless consent was
given. Similarly, while third parties are only bound by
volume contracts if they expressly consent to be bound,56 it
is not clear whether this will ensure the effective protection
that their only commercially viable choice is to give their
consent. Thus, depending on the approach taken by courts
in the application of the relevant provisions, it remains to
ensure that notional agreement of a volume contract may
not be used as a contractual device to circumvent otherwise
applicable mandatory liability rules to the detriment of a
small shipper or consignee.
Parties to a volume contract may derogate from the provisions of the Convention (Art. 80), subject to certain conditions and subject to some relevant statutory limits on the right to derogate.
6 - Legal Issues and Regulatory Developments 129
The provisions on volume contracts may, if and when
the Convention enters into force, have important
repercussions, both for commercial
contracting practice and, more generally,
for the prospects of international legal
If, in future practice, the use of volume
the provisions of the Convention becomes
with a predictable internationally uniform
liability regime may, in the longer run, fail
to materialize.
Concluding remarks
As is true in respect of any new international convention,
much will depend on what courts in different jurisdictions
make of the complex provisions of the new Convention
and how they interpret and apply them in practice.
However, as the above analysis shows, there are a
number of areas of potential concern, in particular from
the perspective of small and medium-sized shippers and
consignees in developing countries.
Overall, it appears that the Rotterdam Rules are in
substance more favourable to carriers than any of the
the rules on burden of proof, for instance, seem to be
more advantageous to carriers than those in the Hague-
Visby or Hamburg Rules, with potentially important
carrier and cargo interests. Moreover, the obligations and
liability of the shipper, which are much more extensive
and detailed than under existing maritime liability
regimes, are mandatory, and the shipper’s liability is – in
contrast to the liability of the carrier – not subject to any
monetary limitation. As a matter of policy, this important
shift in commercial risk allocation to the detriment of
shippers may be of concern to those representing the
interests of transport users.57
The provisions in chapter 10 which, under certain
circumstances, permit the carrier to deliver the goods
without surrender of a negotiable transport document are
new and potentially problematic, as they may undermine
the document of title function of the negotiable bill of
lading, which is key to its use in international trade.
The regulation of volume contracts in the Rotterdam
Rules, also new and untested, may lead to a state of affairs
in which freedom of contract becomes the norm and in
which strength of bargaining power matters more than
it has since the advent of the Hague Rules in 1924. This
would be of particular concern
from the perspective of small
shippers and consignees, who as
a result of commercial pressure
contractual terms effectively set
unilaterally by one of a small
number of large global liner-
carrying companies. Larger
shippers too should be aware
that their potentially extensive
liability under the Rotterdam
Rules for loss arising (at least in part) from the carriage
of dangerous goods would be non-negotiable, even in the
context of a volume contract. More generally, extensive
use of volume contracts in future commercial contracting
practice could mean effectively less rather than more
uniformity of liability rules at the international level.
In relation to regulation of liability arising from
multimodal transport involving an international sea
leg, the new Convention adopts an approach which is
application. Substantive liability rules vary, depending
on whether a loss may be attributed to a particular non-
sea leg of the multimodal transport and on whether
existing international conventions governing carriage of
goods by land or air would have applied had a separate
contract been made for that particular leg of the transport.
In summary, the position appears to be as follows:
(a) in cases where a loss was not clearly attributable
to a particular modal stage of transport, as will
often be the case in containerized transport, the
substantively maritime liability regime set out in
the Rotterdam Rules would determine the rights
and liabilities of the contracting parties, even if
the transport was carried out mainly by land;
(b) the position would be the same in cases where
a loss arose during land transport, but none of
the existing unimodal international conventions
would have been applicable, had a separate
contract been made for the relevant land leg of
transportation;
(c) in cases where a loss could be attributed to a
mode of transport other than sea carriage and one
of the existing unimodal transport conventions
would have applied (had a separate contract
The provisions on volume
contracts may, if and when the
Convention enters into force,
have important repercussions,
both for commercial contracting
practice and, more generally, for
the prospects of international
carriage of goods.
Review of Maritime Transport, 2009130
been made), the mandatory provisions on carrier
liability, limitation of liability and time for suit
contained in the relevant unimodal convention
would apply, together with the remainder of the
Rotterdam Rules. The mixture of substantive
rules from different international conventions
which courts in different jurisdictions would, in
these cases, need to apply in context is highly
complex and clearly likely to lead to nationally
differing results.
More generally, the complexity and considerable
scope for interpretation inherent in the Convention
a clear understanding of the new rules, with courts
in different jurisdictions adopting
potentially differing approaches to
interpretation and application of
the provisions.58 The likelihood of
conflicting legal proceedings, and
ultimately, conflicting judgments
at the international level is further
compounded by the fact that, as
already noted,59 chapters in the
Convention setting out rules on
jurisdiction and arbitration are
optional for Contracting States, and
as a result, contractual jurisdiction
and arbitration clauses may be valid
under the same conditions in only
some but not all Contracting States.
a desirable degree of legal certainty may be achieved.
This prospect appears to be particularly unfortunate in
respect of a new international Convention which aims
to establish internationally uniform rules in a variety of
jurisdictions; it may also be of concern to commercial
parties whose rights and liabilities may in future be
regulated by the Rotterdam Rules.
B. NEGOTIATIONS ON TRADE
FACILITATION AT WTO
1. Facilitating trade and transport:
How can WTO disciplines help?
Negotiations on trade facilitation have been ongoing
since 2004 as part of the World Trade Organization
(WTO) Doha Development Round of trade negotiations.
With these negotiations, members aim at expediting
the release, clearance and movement of goods. Other
objectives of the negotiations are to enhance technical
assistance and support for capacity-building, and to
draft provisions for effective cooperation between
customs or any other appropriate authorities on trade
facilitation. Trade-supporting service providers and
importers and exporters alike stand to gain from
and harmonization of procedures and formalities in
the cross-border movement of goods and enhanced
transparency.
The WTO system is based on legal disciplines which
ensure trade openness and liberalization. Since 1947,
the General Agreement on Tariffs and Trade (GATT)
(originally drafted in 1947 and incorporated without any
changes in the WTO agreement in 1994) in its articles
X, VIII, and V contains disciplines
pertaining to the administration
and publication of trade regulations
(article X), the fees and formalities
connected with importation and
exportation (article VIII), and
the freedom of transit (article V).
Against the background of the wide-
ranging tariff reductions achieved
in the Uruguay Round, efforts to
address non-tariff barriers to trade
have become more pressing in
recent years. The increased use
of information technologies and
electronic information transmission,
together with globalized production
networks with reduced inventories, have led countries
the relevant GATT disciplines so as to include trade
facilitation disciplines as another cornerstone of the
multilateral trading system.
2. 2009: Trade facilitation negotiations
pick up momentum
The negotiations on trade facilitation are an integral
part of the Doha trade negotiations. This means that
negotiations on trade facilitation are dependent on
progress made in the other areas of the Doha Round.
The failure to reach an agreement on the main areas of
the Doha Round in July 2008 also affected the meetings
of the WTO Negotiating Group on Trade Facilitation
(NGTF). In particular at the end of 2008 and the
beginning of 2009 the overall pace of negotiations in
the NGTF slowed down, with less time being devoted
to the review of the textual proposals, and comments
made by delegations limited to oral interventions. This
…the complexity and
considerable scope for
interpretation inherent in
the Convention means
that extensive litigation
a clear understanding of
the new rules, with courts
in different jurisdictions
adopting potentially differing
approaches to interpretation
and application of the
provisions.
6 - Legal Issues and Regulatory Developments 131
situation changed in the second half of 2009, when
signs of a possible comprise on contentious issues of
the Doha Round emerged, and the delegates adopted
an ambitious work plan for the period up until the
ministerial conference scheduled for early December
draft text for a new WTO agreement on trade facilitation
by that date.
By the end of 2006, delegations had put forward more
than 70 trade facilitation measures for consideration
in the negotiations. These measures were grouped into
14 categories, ranging from the publication of trade-
related regulations to the clearance and movement
of goods and the cross-border exchange of customs
information. During 2007 and 2008, these provisions
were further consolidated, where possible, so that in
early 2009 the core set of proposed measures was
narrowed down to 42 measures in 12 categories.
Furthermore, the proposed measures have now been
drafted using legal language, so that the proposals
proposed text of these legal provisions. For this purpose
the NGTF meets in informal drafting sessions, during
which the text of each of the proposed provisions
is examined, and comments or alternative drafting
suggestions by delegations are incorporated.
3. Measures proposed: Improvements to
transparency, delays and international
transit
When time matters
A major part of the trade facilitation measures proposed
focuses on the time needed for the release and clearance
of goods, taking into account not only the loss of time,
missed trading opportunities and increased costs,
affecting the competitiveness of the products.
To address this issue, members propose, for example, that
average release and clearance times at border posts should
be recorded and published; this would allow traders to make
informed decisions and weigh possible delays. Further
proposals include:
(a) The review and simplification of existing
procedures, formalities, fees, and the payment
of those fees;
(b) The introduction of risk management, and in
combination with it, the introduction of post-
clearance audit procedures to reduce incidences
of physical inspection;
(c) The possibility for advance processing and the
release of goods with final determination of
customs value and duty payment still pending,
in order to enable faster release at arrival;
(d) The setting up of a single window, and the
acceptance by authorities of commercially
available documents and copies to reduce both
the number of documents and of submission
points;
procedures to economic operators with a good
track record of compliance, so-called Authorized
Economic Operators or traders, or to those with
special needs, such as, for example, express
shipment carriers;
(f) Elimination of pre-shipment inspections and the
mandatory use of customs brokers.
When transparency matters
Another very important area of the proposals focuses
on strengthening transparency. Transparency provisions
are at the heart of WTO, as they are crucial for
system. In addition to the current non-selective manner
of the transparency provisions contained in GATT,
proposals submitted in the NGTF attempt to determine
a list of selective documents which countries should
publish. This list should also include new information
members are also concerned with access to published
information. Current proposals prescribe the means
of publication; they newly include the internet, and
information to be provided in a more user-friendly and
accessible way.
Similar to provisions in the WTO agreement on rules
of origin, members seek to introduce legally binding
advance rulings applying to customs areas such as the
Advance rulings enhance predictability and certainty
for traders.
Review of Maritime Transport, 2009132
When governance matters
Finally, members also proposed strengthening
good governance in trade. In this respect, countries
should hold regular consultations with private sector
stakeholders, coordinate the responsibilities and
operations of the various public agencies present at
the borders, and strengthen the appeal systems.
When transit is essential
Landlocked countries have attached high priority to the
review of GATT article V, which deals with freedom
of transit. In the negotiation process, proposals in this
area are, therefore, often submitted jointly by several
landlocked countries. Transit countries regularly
when it comes to the issue of restrictions on the
freedom of transit, whether these are legitimate or
are perceived as illegitimate. The limited amount
of legal interpretation of the principle of freedom
of transit weighs heavily over these discussions.
Transit fees and charges are under discussion, as is the
administration of transit-related guarantee systems.
Furthermore, members have been debating the
extent to which the current and the newly proposed
disciplines extend to goods moved via fixed
infrastructure, such as electricity grids and pipelines.
More than 6 per cent of trade by volume is actually
moved in pipelines across borders. Some delegations
have proposed including dedicated disciplines related
4. Flexibility versus uniformity –
the implementation debate
While negotiating the legal text of the measures,
members do not leave out considerations and
discussions related to the implementation of the
disciplines.
In general, WTO negotiations aim at establishing
a set of rules that are applied and can be enforced
at the same time, implementation capacity in all
countries. But implementation capacity is what
distinguishes members most, and WTO agreements
already in existence have suffered considerably
from a lack of implementation. The challenge for
delegations in these negotiations is, therefore, to draft
a set of rules that can be applied uniformly by all
countries in their application of the commitments. To
achieve this objective, delegations work along two
main assumptions: First, the level of ambition of the
negotiations should take into account the development
context and needs of developing countries; and
second, the special and differential treatment
(SDT) provisions for developing countries should
link the application of the commitments to the
technical assistance and capacity-building provided
by the donor community. While SDT provisions
in earlier WTO agreements simply allowed full
exemptions of application, or transitional periods, in
the negotiations on trade facilitation, delegations have
been seeking to ensure that implementation capacity
is built up.
Level of ambition: countries’ trade facilitation needs
and priorities
Countries’ levels of ambition in the negotiations
and their targeted outcomes vary depending on each
development or trading), which determines its trade
facilitation priorities and needs. The assessment of
countries’ needs and priorities has therefore been
inscribed as a distinct objective in the negotiation
mandate. Only a few countries, however, conducted
such priority assessments at an early stage of the
negotiations – the most active being landlocked
developing countries (LLDCs). Later on in the
negotiations, other countries followed suit, but with a
core set of measures already on the table, they limited
the assessments to implementation, and in particular,
to technical assistance needs and priorities.
For the purposes of assessing their trade facilitation
technical assistance needs and priorities, countries
mostly use the WTO Trade Facilitation Self-
Assessment Guide, which is based on a gap analysis
methodology and was developed by the World Bank in
collaboration with other Annex D organizations. The
technical assistance support programme was set up
by donors at the WTO secretariat to provide support
for national trade facilitation self-assessments and
was implemented over a two-year period. By
September 2009, 96 developing countries had
assistance was provided to date to 69 countries
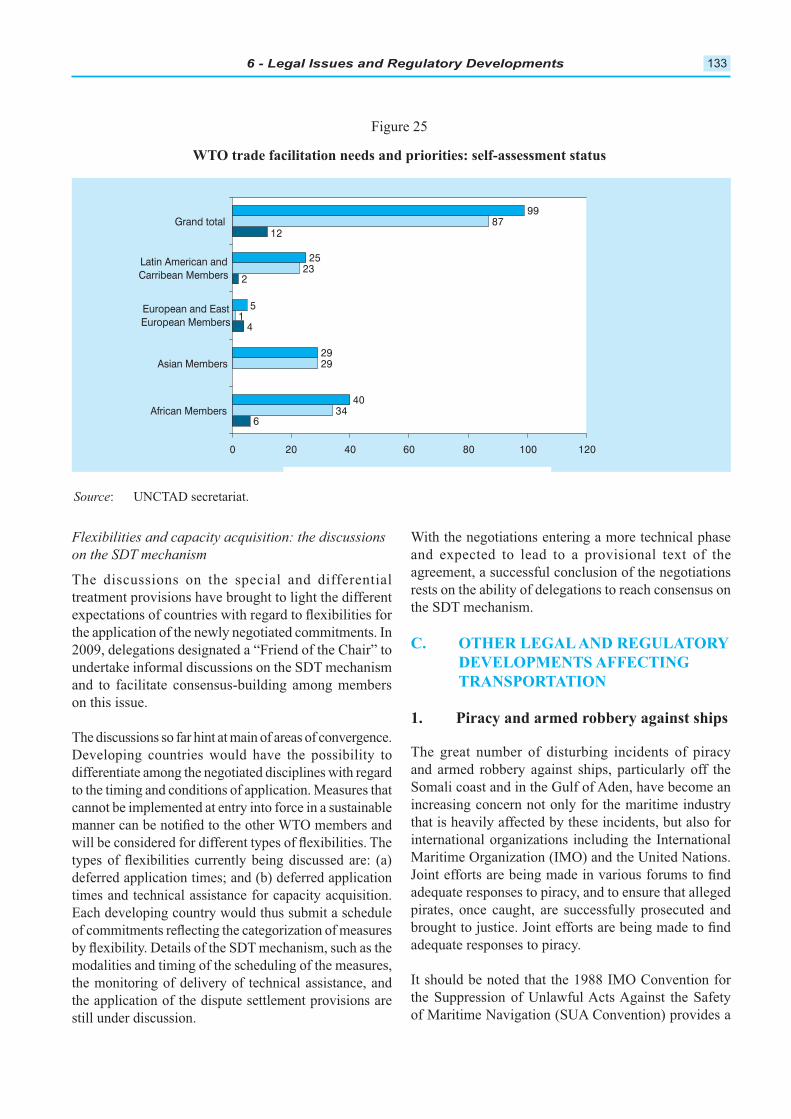
6 - Legal Issues and Regulatory Developments 133
Figure 25
WTO trade facilitation needs and priorities: self-assessment status
Source: UNCTAD secretariat.
Flexibilities and capacity acquisition: the discussions
on the SDT mechanism
The discussions on the special and differential
treatment provisions have brought to light the different
the application of the newly negotiated commitments. In
2009, delegations designated a “Friend of the Chair” to
undertake informal discussions on the SDT mechanism
and to facilitate consensus-building among members
on this issue.
The discussions so far hint at main of areas of convergence.
Developing countries would have the possibility to
differentiate among the negotiated disciplines with regard
to the timing and conditions of application. Measures that
cannot be implemented at entry into force in a sustainable
deferred application times; and (b) deferred application
Each developing country would thus submit a schedule
modalities and timing of the scheduling of the measures,
the monitoring of delivery of technical assistance, and
the application of the dispute settlement provisions are
still under discussion.
With the negotiations entering a more technical phase
and expected to lead to a provisional text of the
agreement, a successful conclusion of the negotiations
rests on the ability of delegations to reach consensus on
the SDT mechanism.
C. OTHER LEGAL AND REGULATORY
DEVELOPMENTS AFFECTING
TRANSPORTATION
1. Piracy and armed robbery against ships
The great number of disturbing incidents of piracy
and armed robbery against ships, particularly off the
Somali coast and in the Gulf of Aden, have become an
increasing concern not only for the maritime industry
that is heavily affected by these incidents, but also for
international organizations including the International
Maritime Organization (IMO) and the United Nations.
pirates, once caught, are successfully prosecuted and
It should be noted that the 1988 IMO Convention for
the Suppression of Unlawful Acts Against the Safety
of Maritime Navigation (SUA Convention) provides a
6
4
2
12
34
29
1
23
87
40
29
5
25
99
0 20 40 60 80 100 120
African Members
Asian Members
European and EastEuropean Members
Latin American andCarribean Members
Grand total
Review of Maritime Transport, 2009134
basis for its States parties to prosecute pirates. Although
of piracy and armed robbery against ships, its article
3 (1)(a) stipulates that any person commits an offence
if that person unlawfully and intentionally “seizes or
exercises control over a ship by force or threat thereof or
any other form of intimidation”. Under the Convention,
appropriate measures need to be taken by states to make
this and other offences punishable by penalties, to
establish jurisdiction over those, and to accept delivery
of persons responsible for or suspected of committing
such offences.60
In addition, the 2005 amendments to the SUA Convention
introduced provisions covering cooperation and
procedures to be followed if a State
party desires to board on the high
party has reasonable grounds to
suspect that the ship or a person on
board the ship has been or is about
to be involved in the commission
of an offence under the 1998 SUA
61
Recent statistics on piracy
Instances of piracy are monitored both by IMO, which
armed robbery against ships,62 and by
the ICC International Maritime Bureau
(IMB) – a specialized division of the
International Chamber of Commerce
(ICC) – which acts as a focal point in
crime and malpractice.63 It should
piracy and armed robbery against ships are used by the
IMO and the IMB, which explains some differences in
the number of recorded instances.64 According to the
annual 2008 ICC–IMB “Piracy and armed robbery against
ships” report, incidents of piracy and armed attacks
against shipping increased at an unprecedented rate. A
total of 293 incidents were recorded by the IMB for 2008,
Attacks off Somalia and in the Gulf of Aden, however,
rocketed by 200 per cent last year, according to the report.
Worldwide, in 2008, a total of 49 vessels were hijacked,
889 crew were taken hostage, and a further 46 vessels
represented the highest rise in reported hostage-taking and
hijackings ever recorded by the IMB’s Piracy Reporting
Centre. Thirty-two crew members were injured, 11 were
killed, and 21 were missing or presumed dead. The total
number of incidents in which guns were used was 139,
compared to 72 in 2007.65
The sharp increase in both the number and severity of
attacks in waters off the coast of Somalia was noted
with concern by IMO’s Maritime Safety Committee
was also noted that most of the attacks worldwide had
occurred or had been attempted in territorial waters
while the ships were at anchor or berthed. In many
of the reports received, the crews had been violently
attacked by groups of 5 to 10 people
carrying knives or guns.66 During
the eighty-fourth session of the
MSC, a correspondence group had
been established, in order to review
and update the IMO guidance for
preventing and suppressing piracy
and armed robbery against ships.67
the correspondence group,68 and after deliberating on a
number of key issues, the MSC at its eighty-sixth session,
held from 27 May to 5 June 2009,69 agreed on revised
guidance, and in this context approved circulars entitled
“Recommendations to Governments for preventing and
suppressing piracy and armed robbery against ships”70
and “Guidance to shipowners and ship operators,
shipmasters and crews on preventing
and suppressing acts of piracy and
armed robbery against ships.”71
The guidance to shipmasters and
crew includes a new annex aimed at
those who may be kidnapped or held
hostage for ransom, based on the
current United Nations Department
of Safety and Security guidelines entitled “Surviving as
to be applicable in the maritime context.
and armed robbery against ships in waters off the coast of
Somalia”72 should include “Best management practices
to deter piracy in the Gulf of Aden and off the coast
of Somalia”; these had been developed by industry
organizations including the International Association
of Independent Tanker Owners (INTERTANKO), the
International Chamber of Shipping (ICS), the Baltic
and International Maritime Council (BIMCO), the
Worldwide, in 2008, a total number
of 49 vessels were hijacked,
889 crew were taken hostage, and
a further 46 vessels reported as
The sharp increase in both
the number and severity of
attacks in waters off the coast
of Somalia was noted with
concern by the IMO’s Maritime
Safety Committee (MSC) at its
85th session in November 2008.
6 - Legal Issues and Regulatory Developments 135
International Association of Dry Cargo Shipowners
(INTERCARGO) and IMB, and were issued by the ICS
in February 2009. In addition, the MSC, at its eighty-
sixth session, approved a draft resolution containing
amendments to the “Code of practice for the investigation
of crimes of piracy and armed robbery against ships”,73
for consideration by the IMO Assembly later in 2009.
Multilateral cooperation to combat piracy
The increase in acts of piracy in recent years has led to
enhanced cooperation at the international and regional
level. For instance, IMO, which has maintained a
leading role in the coordination
of international efforts to tackle
piracy, has taken action to increase
awareness of the problem, and
in cooperation with the shipping
industry advises on measures that
ships can take in the event of an
attack. Moreover, as part of its technical cooperation
programme, IMO is assisting countries in various regions
to build capacity, so that they can effectively contribute
to overall efforts to combat piracy, including through
relevant national legislation.
In response to the unprecedented escalation in the
number of acts and attempted acts of piracy and armed
robbery off the coast of Somalia and the hijacking of
ships and seafarers for ransom in the past few years,
the IMO Assembly adopted resolution A.1002(25)74
in November 2007. The resolution, inter alia, sets
out a number of measures that
Governments and the shipping
industry should adopt with a view to
minimizing the risks of falling victim
to such incidents. The resolution
Government of Somalia to take
specific actions; called upon the
countries in the region to conclude, in cooperation
with IMO, a regional agreement to prevent, deter and
suppress piracy and armed robbery against ships, and
Secretary-General of IMO to consult with Governments
and organizations interested in providing technical
assistance to Somalia and nearby coastal states, and to
enhance the capacity of these states to give effect to the
resolution, as appropriate.
In January 2009, a high-level meeting of 17 states from
the Western Indian Ocean, Gulf of Aden and Red Sea
areas, which was convened by IMO in Djibouti, adopted a
“Code of conduct concerning the repression of piracy and
armed robbery against ships in the Western Indian Ocean
and the Gulf of Aden”. Signatories to the code of conduct
undertake wide-ranging commitments to cooperate in
seizing, investigating and prosecuting pirates in the
region, and to review their relevant national laws. The
the patrol ships or aircraft of another signatory. By the
the code of conduct, namely Djibouti, Ethiopia, Kenya,
Madagascar, the Maldives, the Seychelles, Somalia, the
United Republic of Tanzania, and Yemen.75
The United Nations has also been
actively engaged in the process of
to the challenge of piracy, mainly
through the Security Council, but
also through other forums.76 The
attention of the Security Council by IMO in 2005.
Federal Government of Somalia, and later as a result
of the escalation of the number of incidents which led
to a further deterioration of the situation, the Security
Council adopted, under Chapter VII of the Charter
of the United Nations, resolutions 1814 (2008), 1816
(2008), 1838 (2008), 1844 (2008), 1846 (2008) and 1851
(2008). These resolutions were intended to address the
issue of piracy, including the delivery of humanitarian
aid to Somalia and the protection and escorting of
ships employed by the World Food
Programme. They also envisaged a
number of measures to be put in place
by states, with a view to bringing the
situation under control.77 With the
consent of the Transitional Federal
Government of Somalia, military
personnel from patrolling forces will
be allowed to enter the territorial waters of Somalia for
the purpose of suppressing acts of piracy and armed
robbery at sea, and to use all necessary means to repress
such acts. This will be done “in a manner consistent with
such action permitted on the high seas with respect to
piracy under relevant international law.”78
Pursuant to Security Council resolution 1851, the
Contact Group on Piracy off the Coast of Somalia was
established on 14 January 2009, at a meeting held at
is “to facilitate discussion and coordination of actions
The increase in acts of piracy
in recent years has led to
enhanced cooperation at the
international and regional level.
The United Nations has also
been actively engaged in
the process of formulating
challenge of piracy.
Review of Maritime Transport, 2009136
among states and organizations to suppress piracy off
the coast of Somalia”, and it will report periodically
to the Security Council on the progress of its work.
The contact group established four working groups
to address different piracy-related issues. Working
Group 1 will deal with activities related to military and
operational coordination and information-sharing, and
to the establishment of the regional coordination centre.
It will be convened by the United Kingdom, with the
support of IMO. Working Group 2 will be convened
by Denmark to address judicial aspects of piracy, with
and Crime (UNODC). The United States will convene
Working Group 3 to strengthen shipping self-awareness
and other capabilities, with the support of IMO. Egypt
will convene Working Group 4 to improve diplomatic
efforts on all aspects of piracy.79
Also in response to Security Council resolution 1851
(2008), which had noted with concern the lack of
capacity, domestic legislation and clarity about how
to deal with pirates following their capture, the IMO
session held from 30 March to 3
April 2009, informed states that
the IMO secretariat intended to
review existing national legislation
to prevent and punish the crimes
of piracy and armed robbery at sea
as part of IMO’s anti-piracy strategy. In this context,
member States were urged to submit information and
the texts of their national legislation on piracy.80
Other international efforts to coordinate counter-piracy
operations include the establishment of the Maritime
Security Centre (Horn of Africa), set up by the European
Union (EU) as part of the European Security and Defence
Policy Initiative, which aims to provide a service to
mariners in the region in support of the resolutions of the
United Nations Security Council, and the EU–NAVFOR
Somalia (Operation Atalanta) naval mission, set up in
November 2008 by the Council of the European Union
to improve maritime security off the Somali coast by
preventing and deterring pirate attacks and helping
safeguard merchant shipping in the region.81 Another
multinational task force, namely Combined Task Force
151, comprised of naval forces of the United States, the
United Kingdom, Denmark and Turkey, was established
to counter piracy operations in and around the Gulf
of Aden, the Arabian Sea, the Indian Ocean and the
Red Sea. In addition, Chinese and Japanese warships
have joined the anti-piracy patrols in the Gulf of Aden
recently. South Africa was also contemplating escorting
merchant ships between South Africa and Somalia.82
Other individual states, and regional and international
organizations such as NATO, have also contributed with
their naval forces to efforts at preventing and deterring
piracy attacks off the coast of Somalia.83
Recognizing the broader context, the Secretary-General
of the United Nations has called for a multifaceted
approach to combating piracy “to ensure that the political
process and the peacekeeping efforts of the African
Union and the strengthening of institutions work in
tandem.”84
2. Overview of recent developments relating
to maritime and supply-chain security
(a) World Customs Organization – SAFE Framework
of Standards
The World Customs Organization (WCO), the only
intergovernmental organization with worldwide
membership exclusively focused on
customs matters, is particularly noted
for its work on the development of
of customs procedures, trade supply-
chain security, facilitation of
international trade, and global customs capacity building
programmes, many of which focus on developing
countries. In 2005, the Council of the WCO adopted
the Framework of Standards to Secure and Facilitate
Global Trade (the SAFE Framework), which has fast
gained widespread international acceptance as the main
global supply-chain security framework. As of May
2009, 156 countries had expressed their intention to
implement the SAFE Framework.85 The core features of
the SAFE Framework have been presented in previous
editions of the Review of Maritime Transport. One of
the integral aspects of the customs-to-business network
arrangements envisaged by the SAFE Framework is
the concept of the Authorized Economic Operator
movement of goods … that has been approved by or on
behalf of national customs administrations as complying
standards. AEOs include, inter alia, manufacturers,
importers, exporters, brokers, carriers, consolidators,
intermediaries, ports, airports, terminal operators,
integrated operators, warehouses and distributors.”86
Detailed AEO guidelines were integrated into a revised
The Secretary-General of the
United Nations has called for
a multifaceted approach to
combating piracy.

6 - Legal Issues and Regulatory Developments 137
version of the SAFE Framework, in June 2007. The
and/or to customs administrations, were presented in the
Review of Maritime Transport 2008, but are restated here
for ease of reference. A number of elements that need
customs, or to both.87 These elements include:
(a) Demonstrated compliance with customs
(b) A satisfactory system for management of
commercial records;
(c) Financial viability;
(d) Consultation, cooperation and communication;
(e) Education, training and awareness;
(f) Information exchange, access and
(g) Cargo security;
(h) Conveyance security;
(i) Premises security;
(j) Personnel security;
(k) Trading partner security;
(l) Crisis management and incident recovery; and
(m) Measurement, analyses and improvement.
It is worth noting that both the national implementation
of the AEO system and mutual
recognition agreements are, in
many cases, still at an initial
stage of their development, and
remain a challenge, particularly
from the perspective of developing
economies. For instance, countries
of which are developing countries
Economic Cooperation (APEC),88 a
forum for discussing matters that concern the regional
economy, cooperation, trade and investments. APEC has
been organizing the so-called “STAR” (Secure Trade in
the APEC Region) conferences since 2003, to discuss
issues of security for transport and travel. An action plan
has been adopted by APEC member States in the context
of STAR, recommending that companies, in accordance
with their own needs, comply with security measures,
laid down by the WCO, IMO, the International
Organization for Standardization (ISO) and so on.
Several individual APEC countries, mostly developed
ones, have already established their own business partner
programmes (AEOs and similar), in conformity with
the SAFE Framework.89 However, unlike the European
is yet under way within the framework of APEC or any
other regional organization so far.
According to information provided by the WCO, as
of 30 September 2009, in addition to the 27 member
States of the European Union,90 11 additional countries
had operational AEO programmes,91 and in another 6
states, such programmes were soon to be launched.92
So far, 7 mutual recognition agreements (MRAs) of
AEO programmes have been concluded globally;93
with another 12 being negotiated, and 11 studies or
consultations being under way. For two more countries,
AEO programmes were to become operational, and the
conclusion of relevant MRAs with the European Union
was scheduled for winter 2010.94
To assist countries, the WCO is developing a compendium
of existing AEO programmes and implementation
guidelines for AEO standards.95
In view of the global character of the SAFE Framework of
customs administrations will be able to implement it
in its entirety. There is a risk that developing countries
lacking the infrastructure and the
administrative capacity might not
in respect of security measures, and
that their access to global markets
could be negatively affected as
a result. In this context, and as
reported in previous editions of
the Review of Maritime Transport,
the WCO has launched a number
of capacity-building programmes,
notably the Columbus Programme: Aid for SAFE trade.96
This programme is continuing to help the modernization
Both the national implementation
of the AEO system and mutual
recognition agreements are, in
many cases, still at an initial stage
of their development, and remain
a challenge, particularly from
the perspective of developing
economies.
Review of Maritime Transport, 2009138
of member customs administrations and to assist in the
implementation of the SAFE Framework of Standards,
and to prepare countries for the possible outcome of
the WTO negotiations on trade facilitation. Within
the Columbus Programme, a three-year Technical
Cooperation Agreement on Capacity-Building (2009–
2011), was signed by the Customs Administration of
Mongolia, the Dutch Tax and Customs Administration,
and the WCO, on 4 December 2008. The agreed
cooperation covers a number of seminars on a range
of topics. As part of the ongoing implementation of
its capacity-building strategy, the WCO also organizes
regional training workshops for the private sector,
which among other things, aim at strengthening the
links among customs officials from neighbouring
countries and ensuring more effective follow-up. To
date, 16 memorandums of understanding establishing
regional training centres have been concluded by the
WCO and the customs administrations of member
countries, mainly developing countries.97 Moreover, a
number of seminars on AEOs were recently organized in
various regions, including East Africa, Southern Africa
and Central America.98
A new WCO report entitled “Customs in the twenty-
first century: Enhancing growth and development
through trade facilitation and border
security”99 was issued in June 2008,
emphasizing the importance of mutual
recognition of both customs controls
and AEO programmes. As part of a
new strategic direction for customs,
“Networked Customs”, including
the creation of an international
“e-Customs” network, are considered
century
model of managing end-to-end international supply
chains. This relies on the secure, real-time exchange of
information between business and customs, and between
customs administrations in a supply chain. According to
export, transit and import, and the implementation
number as part of a cross-border data reference
model;
(b) Interconnected systems and aligned customs
databases to enable the electronic exchange of
data between customs administrations as early as
possible in the international movement of goods;
(c) Mutual recognition and coordination protocols
between exporting, transit and importing
administrations to eliminate unnecessary
duplication of controls in international supply
chains;
(d) Standards to enable the development of a system
of mutual recognition for AEOs; and
(e) A set of rules governing the exchange of
information between customs administrations,
including rules on data protection.100
of procedures and practices are indispensable for
achieving mutual recognition, and for avoiding
relation to AEOs.
Attention should also be drawn to the sixtieth session
of the WCO Policy Commission, which was held
in Buenos Aires in December 2008. In the context
of discussions on the global financial crisis, the
Policy Commission emphasized the need to focus on
trade facilitation in the current climate, taking care
not to introduce new barriers to trade or generate
additional delays. It also considered
it important that the work on
AEOs and mutual recognition
arrangements continue, and that as
far as possible, these arrangements
be implemented with broadly
similar standards worldwide.
Another important factor was the
current climate, and also to recognize the importance
of budget security, in particular for developing
countries.101
(b) European Union
As reported in the Review of Maritime Transport
2008, at EU level, regulation (EC) No. 1875/2006102
was adopted in December 2006 to introduce a number
of measures to increase the security of shipments
into and out of the EU, and to implement regulation
(EC) No. 648/2005, which had first introduced
the AEO concept into the Community Customs
Code. Regulation (EC) No. 1875/2006 includes
detailed rules regarding implementation of the AEO
programme, and envisages that reliable economic
“Networked Customs”,
including the creation of an
international “e-Customs”
network, are considered
critical for the 21st century
model of managing end-to-end
international supply chains.
6 - Legal Issues and Regulatory Developments 139
for recognition of AEO status may be issued with AEO 103 It should be noted
in the course of his business, is involved in activities
covered by customs legislation”.104 This would cover, for
instance, a manufacturer producing goods for export, but
not a supplier of raw materials already in free circulation,
or a transport operator that moves
only free-circulation goods within
the customs territory of the European
Community.105
Companies seeking AEO status must
comply with certain criteria, including
an automated trade and transport
data management system, proven
safety/security standards (including physical security,
access control, screening of personnel etc.) There are
(a) Customs Simplifications (AEO-C) – AEOs
under the customs rules;
(b) Security and Safety (AEO-S)
from facilitation of customs controls relating to
security and safety at the entry or exit of the goods
to the customs territory of the Community;
(c) Customs
jointly (AEO-F)
from both.
A database of economic operators who hold a valid
agreement to the publication of their details, has recently
become available on the European
Commission website.106 Also available
on the website is a list of competent
customs authorities for the issuing
of AEO certificates. According to
EU statistics, as of 14 October 2009,
a total of 3,433 applications had
been submitted, and a total of 1,643
certificates had been issued; the
number of applications processed
between 15 October 2008 and 15
October 2009 was 1,972. The reported
AEO-C 19 per cent; and AEO-S 3 per cent.107
Additionally, as laid down in regulation (EC)
312/2009,108
operators in the European Union, any economic
operator established in the European Union, as from
member States.109 Economic operators established
outside the EU will have to be
assigned an EORI number if they
lodge a customs declaration, an entry
or an exit summary declaration, or
a summary declaration. Many
member States will use their current
new operators should register,
and the application should be sent
to the relevant authorities of the
member States in which the economic operator is
established.110
The EU is in the process of negotiating agreements on
mutual recognition of the business partner programmes
(AEO and similar) with some neighbouring states
and with its major trading partners,111 including
in particular the United States. To this end, in
2007, the European Union and the United States
started negotiations towards mutual recognition of
the United States’ C-TPAT and the European Union’s
AEO supply-chain programmes. The agreement
would cover about 40 per cent of global trade,
and may set a precedent that could help to provide
both improved supply-chain security and global
trade facilitation.112 While there are significant
differences between the two customs–business
partnership schemes, in March 2008, United
States Customs and Border Protection (CBP) and
the European Commission adopted the “Joint
roadmap towards mutual
r e c o g n i t i o n o f t r a d e
partnership programmes.”113
The roadmap focuses on
six areas in which to achieve
mutual recognition: political,
administrative, legal, policy,
technical/operational, and
evaluation. It was envisaged
that the following tasks
would be accomplished by
the United States and the
European Union, in an effort to achieve mutual
recognition by 2009:
A database of economic operators
of any type, and who have given
their agreement to the publication
of their details, has recently
become available on the European
Commission
website.
The EU is in the process of
negotiating agreements on
mutual recognition of the
business partner programmes
(AEO and similar) with some
neighbouring states and with
its major trading partners.
Review of Maritime Transport, 2009140
(a) Establishing guidelines regarding the exchange
of information, including validation/audit results
and legalities associated with the disclosure of
membership details;
(b) Performing joint verifications to determine
remaining gaps between AEO/C-TPAT;
(c) Exploring and testing an export component for
C-TPAT;
(d) Exchanging best practices through joint visits
and conferences;
(e) Continuing dialogue on legal and policy
d e v e l o p m e n t s u n d e r t h e r e s p e c t i v e
administrations;
(f) Endorsing and signing a mutual recognition
arrangement; and
(g) Evaluating mutual recognition benefits for
AEO/C-TPAT members.114
In order to gather feedback from the business
community and incorporate it within the roadmap as
appropriate, an abridged external partner version of
the roadmap was made available in January 2009,115
providing a short description, and a summary of status
and accomplishments for each of
the tasks in three areas, namely
operational/technical, legal, and
evaluation.
The International Chamber of
Commerce (ICC), one of the key
international representatives of
the world business community,
has issued a discussion paper
that raises a number of concerns
regarding mutual recognition of the
United States and European Union
programmes, and provides a number
of recommendations.116 Among other things, the ICC
discussion paper expresses concern about the absence of a
meaningful dialogue between the designers of the Mutual
Recognition programme and the business community,
the European Union’s AEO programme and the United
and tracked, thus making any assumptions regarding
ICC discussion paper expresses great concerns about
the potential impact of these programmes on small and
medium-sized enterprises (SMEs), and emphasizes the
need to assure the suitability of these programmes for
all supply-chain entities, highlighting that “the costs of
implementation and compliance may be such that many
SMEs will be unable to participate, which could impact
their competitiveness”. Certainly, this applies particularly
to SMEs from developing countries. Another concern
expressed is that both the AEO programme and C-TPAT
A lower risk score, resulting in fewer controls and
inspections, as provided under both programmes, was
high level of security that companies had demonstrated
during the application/validation procedure. More
generally, the ICC emphasizes that harmonization,
practices are indispensable for achieving mutual
recognition, stating that “failure to achieve reasonable
uniformity would also create counterproductive, costly
approaches.”
issues, which may impede the attainment of Mutual
Recognition between the European Union and the United
States, and which should be addressed and adjusted
over a reasonable period of time. In
this context, structural asymmetries
between the European Union’s AEO
programme and C-TPAT are noted,
as is the need for interoperability
in terms of software and electronic
messaging between the United
States and the European Union and
among EU members coupled with
single window facilitation so that
electronic data elements only need
to be submitted once. Emphasis is
also placed on the need to adhere to
WCO guidelines in order to “ensure
information, and that information provided be used
solely for the purposes for which it was provided”.117
Another measure stipulated in regulation (EC) No.
The International Chamber
of Commerce (ICC), one
of the key international
representatives of the world
business community,…
raises a number of concerns
regarding mutual recognition
of the United States and
European Union programmes,
and provides a number of
recommendations.
6 - Legal Issues and Regulatory Developments 141
out of the customs territory of the European Union.
Also known as the “advance cargo declaration scheme”,
the system, which in parts corresponds to the United
States “24-hour rule”118 adopted in October 2002 with
the aim of enabling United States customs authorities
to evaluate the terrorist risk of cargo containers loaded
send manifest information to national authorities 24
become mandatory on 1 July 2009, but in April 2009, the
European Commission’s regulation (EC) No. 273/2009
was adopted, introducing a temporary derogation for 18
to provide advance electronic information for security
and safety purposes. The preamble to the regulation
states that: “Due to the complexity of the processes
for introducing of electronic entry and exit summary
declarations, unanticipated delays have occurred in
the implementation process so that not all economic
operators will be in a position to use information
technology and computer networks for these purposes
by 1 July 2009. Though information technology and
computer networks facilitate international trade, they
systems which may cause problems for economic
operators in the short term. It is therefore appropriate
to take such situations into account by providing that
during a transitional period economic
operators will be able, but will not be
obliged, to lodge electronic entry and
exit summary declarations in order
to allow them to adjust their systems 119
Unders tandab ly, due to the
complexity of these processes, the
level of computer technology and
exporters in developing countries face challenges in 120
It should be noted that additional advance cargo
United States in late 2008, when an interim Importer
Security Filing rule121 was issued, known as the “10 + 2”
United States Customs and Border Protection, at least
24 hours before cargo is loaded onto a vessel bound for
the United States, of the following information: (a) the
name and address of the manufacturer or supplier; (b)
the name and address of the seller; (c) the name and
address of the buyer; (d) the “ship to” name and address;
and address; (g) the importer of record number; (h) the
consignee number(s); (i) the country of origin; and (j)
the commodity’s Harmonized Tariff Schedule of the
United States number. Moreover, within 48 hours of the
vessel’s departure for the United States, carriers need to
provide: (a) the vessel stowage plan; and (b) container
status messages. This interim rule was envisaged to
come into effect on 26 January 2009, but its compliance
date was postponed for 12 months, taking into account
systems.122
It appears that China has also informally relaxed the
on 1 January 2009. According to press reports, an
‘informal’ grace period of three to six months without
penalties was offered, which was also designed to
allow the testing of the systems for reliable eventual
compliance.123
(c) International Maritime Organization
terrorism, and in maintaining the security of maritime
transport and the global supply chain in general.
The Maritime Safety Committee
from 26 November to 5 December
2008. Following the outcome of
the fifth special meeting of the
Counter-Terrorism Committee
held in Nairobi from 29 to 31
October 2007,124 and in the context
of measures to further enhance port facility security
measures, several needs assessments missions on
maritime security were carried out under the IMO
Integrated Technical Cooperation Programme. In
addition, several on-site visits were conducted by
the Counter-Terrorism Committee of the United
Nations Security Council, pursuant to Security
Council resolution 1373 (2001). It was noted that
the provisions of the International Convention for the
Safety of Life at Sea (SOLAS Convention) chapter
XI-2 and of the International Ship and Port Facility
Security Code (the ISPS Code) were either absent
national laws which, in some cases, had been enacted
Additional advance cargo
also established in the United
States, in late 2008, when
an interim Importer Security
Filing Rule was issued.
Review of Maritime Transport, 2009142
at the beginning of the 1900s. Thus, with a view to
assisting SOLAS Contracting Governments to improve
the situation, the development of model legislation
would be very useful. Under SOLAS article III(c),
SOLAS Contracting Governments have an obligation to
communicate to and deposit with the Secretary-General
of IMO, inter alia, the text of laws, decrees, orders and
regulations which have been promulgated on various
matters within the scope of SOLAS. Therefore, they
were urged to do so, in order to enable the development
of model legislation.125
The MSC, having received and approved, in general,
the report of the Ad Hoc Working Group on Maritime
Security126 (MSC 85/WP.6), also approved MSC.1/
Circ.1283 entitled “Guidelines on security aspects of
the operation of vessels which do not fall within the
scope of SOLAS chapter XI-2 and the ISPS Code”. The
guidelines are recommendatory only, and they are not
intended to form the basis for a mandatory instrument.
They should, therefore, in no way be
interpreted as the basis for regulation
of non-SOLAS vessels and related
facilities.
also considered matters relating to
the implementation of the so-called
LRIT system. As was reported in the
Review of Maritime Transport 2008,
SOLAS regulation V/19-1 on a Long-
(LRIT) system, which had been adopted in 2006, entered
into force on 1 January 2008. The regulation applies
to ships of over 500 gross tons constructed on or after
31 December 2008, with a phased-in implementation
schedule for ships constructed before 31 December 2008.
The LRIT system was intended to be operational from 31
December 2008,127 but delays in the establishment of a
number of national data centres were reported by the ad
hoc LRIT working group. Therefore, the establishment
of the entire LRIT system would continue after 31
December 2008, and it was possible that it could take
several months during 2009 before it could be completed.
not on others. Overall, there was a 25 per cent failure rate.
Secondly, there was concern that the EU Contracting
Governments would not be ready until the middle of
2009.128 However, a letter from the United States, making
clear that for the time being there would be only carriage
level of operational capability had been achieved, was
noted with appreciation.129
While it was clear that the system would not be fully
operational and that there was a need for a pragmatic
approach, the MSC emphasized the importance of
for ships constructed before 31 December 2008, was
agreed that the date of compliance of ships with the
subject to extension, and that regulation V/19-1 did not
include any provisions on the basis of which extensions
may be granted.
Having considered the various issues relating to LRIT,
group on LRIT-related matters,
adopted its terms of reference, and
provided detailed instructions for
work to be conducted, including
the future development of a draft
resolution on the appointment of
the International Mobile Satellite
Organization (IMSO)130 as LRIT
coordinator within the framework of
regulation V/19-1.14.131 At its eighty-
sixth session held from 27 May to
5 June 2009, after considering the
report of the LRIT working group, the MSC adopted
the documents entitled “Guidance on the survey and
to transmit LRIT information”;132 “Guidance to search
receiving LRIT information”;133 and the “Circular on
information communicated to the IMO in relation to the
establishment of LRIT data centres and their position in
relation to developmental testing in the production of
the LRIT system.”134
(d) International Organization for Standardization
The ISO/PAS 28000 series of international standards
systems to ensure security in the supply chain.
These standards are intended for application by
organizations involved in manufacturing, service,
storage or transportation, by all modes of transport
and at any stage of the production or supply process.
During 2008, work continued on
the development of the ISO/PAS
28000 series standards, whose
aim is to facilitate and improve
with the threats of piracy and
terrorism, and to enable secure
management of supply chains.
6 - Legal Issues and Regulatory Developments 143
During 2008, work continued on the development of
the ISO/PAS 28000 series of standards, whose aim is to
terrorism, and to enable secure management of supply
chains.
The Review of Maritime Transport 2008 provided a short
and supply-chain standards, namely ISO 28000, ISO
28001, ISO 28003, ISO 28004 and ISO 20858, and on
one standard under development – ISO 28005.
Work has continued on ISO 28005, which in order
to expedite development, has been divided into two
parts, namely ISO 28005-1: Electronic Port Clearance
(EPC) – Single Window Concept; and ISO 28005-2:
Electronic Port Clearance (EPC) – Technology and Data
Dictionary.
In addition, work is in progress on amendment of ISO
28004, with the aim of:
and medium-sized ports that are implementing
ISO 28000, so that they develop processes that
general guidance contained in the existing ISO
28004 standard;
small and medium-sized businesses (other than
marine ports) that are implementing ISO 28000,
so that they develop processes that comply
guidance contained in the existing ISO 28004
standard;
organizations seeking to incorporate security
Authorized Economic Operators) into their
implementation of ISO 28000. The security
best practices contained in ISO 28001 were
carefully developed in liaison with WCO, and
were designed to be incorporated into existing
management systems.
Another standard under development is ISO/AWI 28002:
Chain – Resilience in Security in the Supply Chain. This
standard is aimed at ensuring that the suppliers and the
extended supply chain have planned steps to prevent
and mitigate the threats and hazards to which they are
exposed.
ISO, through technical assistance and training activities
derived from the ISO Action Plan for Developing
Countries, helps those countries to participate in
international standardization activities. It responds to a
members in developing countries and their stakeholders,
by organizing seminars, workshops, training courses,
e-learning, sponsorships etc.135
(e) United Nations
It should also be noted that pursuant to General Assembly
resolutions 61/222 and 62/215, the ninth meeting of the
United Nations Open-ended Informal Consultative
Process on Oceans and the Law of the Sea, held in New
York in June 2008, focused its discussions on the area
of maritime security and safety.
The meeting participants agreed that maritime security
and safety were essential to the role of oceans and seas
in promoting the economic, social and environmental
pillars of sustainable development, as provided in
chapter 17 of agenda 21, adopted by the United Nations
Conference on Environment and Development, through,
inter alia, international trade, economic development,
poverty alleviation and environmental protection. They
further agreed that the global nature of the threats and
challenges to the security and safety of oceans could only
be tackled effectively through international cooperation
and coordination.
A number of agreed consensual elements from the
meeting were suggested to the United Nations General
Assembly for consideration under the agenda item
“Oceans and the law of the sea”. With reference to
maritime security, it was proposed that the General
Assembly:
(a) “recall that all actions taken to combat threats
to maritime security must be in accordance with
international law, including the Convention
and other relevant international legal instruments
while respecting maritime jurisdiction, and
reaffirm that the sovereignty and territorial
integrity and political independence of states, as
well as the principles of non-use or threat of use
of navigation, should be respected”; and
Review of Maritime Transport, 2009144
(b) “recognize the crucial role of international
cooperation at the global, regional, subregional
and bilateral level in combating threats to maritime
security in accordance with international law,
including through enhanced sharing of information
among states relevant to the detection, prevention
and suppression of such
threats, and the prosecution
of offenders with due regard
to national legislation, and the
need for sustained capacity-
building to support such
objectives.”136
3. Legal instruments and other developments
relating to the environment
IMO continues to implement its ambitious action
plan to address emissions of greenhouse gases from
international shipping, and to establish a regime
regulating the issue at the global level, in order to slow
down climate change. IMO’s Marine
Environment Protection Committee
adopted the revised MARPOL137
annex VI regulations and the NOx
Technical Code 2008, aimed at
reducing air pollution from ships. It
agreed to establish a working group
on greenhouse gas (GHG) emissions
from ships, which was instructed
to work on a whole package of
technical and operational measures.
for the Safe and Environmentally Sound Recycling of
Ships, which was adopted at a diplomatic conference
on 11 May 2009, and it pursued its work related to the
Ballast Water Management Convention. In addition, a
draft protocol to the 1996 International Convention on
Liability and Compensation for Damage in Connection
with the Carriage of Hazardous and Noxious Substances
by Sea was adopted by the IMO Legal Committee
its 102nd session approved the holding of a diplomatic
conference in April 2010, at which the draft protocol
will be considered for adoption.
In recognition of the focus that climate change is
receiving at IMO, the organization has adopted “Climate
change – a challenge for IMO too” as the theme for the
2009 World Maritime Day, which was celebrated on 24
September 2009.
(a) Ship recycling
The International Convention for the Safe and
Environmentally Sound Recycling of Ships was adopted,
under the auspices of IMO, at a diplomatic conference
held in Hong Kong, China, from 11 to 15 May 2009,
which was attended by delegates
from 63 countries.138
As explained in previous editions of
the Review of Maritime Transport, the
development of a convention on ship
recycling had been in progress for
several years at IMO, in cooperation
with the International Labour Organization (ILO) and the
relevant bodies of the Basel Convention. The convention
on ship recycling is designed to provide globally
applicable ship recycling regulations for international
shipping and for recycling activities. It aims to ensure
that ships, when being recycled after reaching the end
of their operational lives, do not pose any unnecessary
risk to human health and safety or to
the environment.
The new Convention provides
r egu la t ions fo r the des ign ,
cons t ruc t ion , opera t ion and
preparation of ships so as to facilitate
safe and environmentally sound
recycling without compromising
of ships; for the operation of ship
recycling facilities in a safe and
environmentally sound manner; and for the establishment
of an appropriate enforcement mechanism for ship
recycling, incorporating certification and reporting
an inventory of hazardous materials, which will be
will provide a list of hazardous materials, the installation
or use of which is prohibited or restricted in shipyards,
ship repair yards, and ships of parties to the Convention.
verify the inventory of hazardous materials, additional
to provide a “ship recycling plan” to specify the manner
in which each ship will be recycled, depending on its
take effective measures to ensure that ship recycling
IMO continues to implement its ambitious action plan to address emissions of greenhouse gases from international shipping, and to establish a regime regulating the issue at the global level, in order to slow down climate change.
The International Convention for
the Safe and Environmentally
Sound Recycling of Ships was
adopted, under the auspices of
IMO.
6 - Legal Issues and Regulatory Developments 145
facilities under their jurisdiction comply with the
Convention. A series of guidelines are being developed
to assist in the Convention’s implementation.139
The Convention shall be open for signature from 1
September 2009 until 31 August 2010. Thereafter, it
shall remain open for accession by any state. It will enter
into force 24 months after the date
on which 15 states – representing 40
per cent of world merchant shipping
by gross tonnage – have either
signed it without reservation as to
approval or accession with the IMO Secretary-General.
Furthermore, the combined maximum annual ship
recycling volume of those states must, during the
preceding 10 years, constitute not less than 3 per cent of
their combined merchant shipping tonnage.140
(b) Air pollution from ships
While maritime transport represents the most
fuel-efficient way to carry cargo, international
shipping is also heavily dependent on fossil fuels.
The combustion of these fossil
such as nitrogen oxides (NOx) and
sulphuric oxides (SOx) which have
been linked to a variety of adverse
public health outcomes,141 and also
carbon dioxide (CO2) which causes
global warming. However, it should
be noted that bunker fuel emissions
from international shipping are not covered by the
international regulatory framework as set out in the
Kyoto Protocol.142
MARPOL 1973/1978, the main international convention
dealing with pollution from ships and covering different
types of pollution (by oil, chemicals, pollutants in
packaged form, sewage and garbage) did not cover air
pollution until 1997, when the new annex VI entitled
“Regulations for the prevention of air pollution from
ships” was adopted at a special conference. MARPOL’s
annex VI came into force in May 2005, and as at 2
October 2009 it had been ratified by 56 countries,
representing approximately 83.46 per cent of the gross 143 Annex VI deals
with SOx and NO
x emissions and particulate matter, but
it does not cover CO2 emissions, which are subject to
separate discussions within IMO.
A revised MARPOL annex VI and the NOx Technical
Code 2008 were adopted unanimously by the MEPC at its
176(58) and MEPC 177(58)).144 Both legal instruments
will come into force on 1 July 2010, rather than on 1 March
2010 as had previously been indicated. This is to allow
the revision. The MEPC also agreed
needed in the revised annex VI, as this
had been described in the test method
in ISO 8754: 2003. As regards NOx
of marine diesel engine in regulation 2(14) of MARPOL’s
annex VI and in paragraph 1.3.10 of the NOx Technical
Code should not include engines that under normal service
conditions operate on gas fuel only.145
In addition, the fifty-eighth session of the MEPC
1 of an updated 2000 IMO study on GHG emissions
from ships,146 covering a CO2 emission inventory from
international shipping and future emission scenarios. In a
second phase, the study covers GHG emissions other than
CO2 and relevant substances emitted
from ships engaged in international
transport, in accordance with the
methodology adopted by the United
Nations Framework Convention
on Climate Change, as well as
consideration of future reduction
potentials by technical, operational
and market-based measures. The 147 covering both phases of the study, and
an executive summary148 were made available for
July 2009. The main conclusions of the report are set
out in the executive summary, as follows:
(a) Shipping is estimated to have emitted 1,046
million tons of CO2 in 2007, which corresponds
to 3.3 per cent of the global emissions during
2007. International shipping is estimated to have
emitted 870 million tons of CO2 in 2007, or about
2.7 per cent of the global emissions.
(b) Exhaust gases are the primary source of emissions
from ships. Carbon dioxide is the most important
and of global warming potential, other GHG
emissions from ships are less important.
The Convention shall be open
for signature from 1 September
2009 until 31 August 2010.
In a second phase, the study
covers GHG emissions
other than CO2 and relevant
substances emitted from
ships engaged in international
transport.
Review of Maritime Transport, 2009146
(c) Mid-range emissions scenarios show that, by
2050, in the absence of policies, ship emissions
may grow by 150 to 250 per cent (compared to
the emissions in 2007) as a result of the growth
in shipping.
(d) Significant potential has been identified for
the reduction of greenhouse gases through
technical and operational measures. Together,
if implemented, these measures could increase
75 per cent below current levels. Many of these
measures appear to be cost-effective, although
non-financial barriers may discourage their
implementation, as discussed in chapter 5.
(e) A number of policies to reduce GHG emissions
from ships are conceivable. This report analyses
options that are relevant to the current IMO
market-based instruments
are cost-effective policy
instruments with a high
environmental effectiveness.
These instruments capture
the largest amount of emissions under the scope,
allow both technical and operational measures
in the shipping sector to be used, and can offset
emissions in other sectors. A mandatory limit
ships is a cost-effective solution that can provide
new ships. However, its environmental effect is
limited because it only applies to new ships, and
because it only incentivizes design improvements
and not improvements in operations.
(f) Shipping has been shown, in general, to be
an energy-efficient means of transportation
compared to other modes. However, not all forms
of transport.
(g) The emissions of CO2 from shipping lead to
positive “radiative forcing” (a metric of climate
change) and to long-lasting global warming.
In the shorter term, the global mean radiative
forcing from shipping is negative and implies
cooling; however, regional temperature responses
and other manifestations of climate change may
nevertheless occur. In the longer term, emissions
from shipping will result in a warming response,
as the long-lasting effect of CO2 will overwhelm
any shorter-term cooling effects.
(h) If the climate is to be stabilized at no more than a
2°C warming over pre-industrial levels by 2100
and emissions from shipping continue as projected
in the scenarios that are given in this report, then
they would constitute between 12 and 18 per cent
of the global total CO2 emissions in 2050 that
2100) with a 50 per cent probability of success.
session agreed to re-establish the Working Group
on GHG Emissions from Ships, to work on a whole
package of technical and operational measures , aimed
at reducing GHG emissions from international shipping.
These reductions would be achieved, for new ships
through improved design and propulsion technologies,
and for all ships, both new and
existing, mainly through improved
operational practices. The package
of measures, focusing on energy
ninth session of the MEPC in July
2009 and was intended to be used for trial purposes only,
until the sixtieth session of MEPC in March 2010, with a
into account the relevant outcomes of the United Nations
Climate Change Conference to be held in Copenhagen
in December 2009.149 The measures include:
(a) Interim Guidelines on the method of calculation
(c) Guidance for the development of a ship energy
(d) Guidelines for voluntary use of the Energy 150
However, MEPC recognized that in view of growth
expectations of the world trade technical and operational
reduce GHG emissions from international shipping.
Therefore, it was considered necessary to also have in
place marked-based reduction mechanisms that could
serve two main purposes: the offsetting of growing
ship emissions in other sectors, and the provision of
A number of policies to reduce
GHG emissions from ships are
conceivable.
6 - Legal Issues and Regulatory Developments 147
incentives for the maritime industry to invest in more
It was also considered that proposed market-based
mechanisms, such as a global contribution scheme (levy)
and a global emission trading scheme
for ships, could generate considerable
funds, which could be used for
different climate-related purposes,
such as mitigation and adaptation
activities in developing countries.
Several delegations recalled that
the principle of “common but
differentiated responsibility” needed
to be carefully considered and
included in any regulatory scheme,
in order to make it comprehensive
and globally applicable. Some
delegations expressed the concern that market-based
measures would disadvantage developing countries,
by increasing transportation costs, and cautioned that
an extensive bureaucracy would be needed to assure
compliance and prevent potential fraud. 151
After in-depth discussion, the MEPC approved a
Work Plan for further consideration of market-based
measures.152In addition, MEPC agreed that any regulatory
scheme on GHG emissions applied to international
shipping should be developed and enacted by IMO as
the most competent relevant international body.153
It is also worth noting that as part of the work of the
ninth session containing excerpts of the first draft
negotiating text to be considered by parties at the
UNFCCC “climate talks” in June 2009, in the lead-up
to the United Nations Climate Change Conference in
December 2009, as they refer to international maritime
transport.154 The document contains submissions by
IMO parties on long-term cooperative action under the
Convention, including proposals and views on possible
sectors.155
session held from 30 March to 3 April 2009, approved
a draft protocol to the 1996 International Convention on
Liability and Compensation for Damage in Connection
with the Carriage of Hazardous and Noxious Substances
by Sea (HNS Convention). The draft protocol is
designed to address practical problems that have
prevented many states from ratifying the original
Convention. The Convention seeks to establish a two-
tier system for compensation to be paid in the event of
pollution incidents involving hazardous and noxious
substances, such as chemicals. While
such a system of compensation
has been successfully in operation
for many years in respect of oil
pollution from tankers, the HNS
Convention has not yet entered into
force. One of the main obstacles so
appears to have been difficulties
they receive of a diverse range of
hazardous and noxious substances
governed by the Convention.
The IMO Council, at its 102nd session held from 29 June
to 3 July 2009, approved the holding of a diplomatic
conference in April 2010, for the purpose of considering
and adopting the draft protocol.156
The MEPC at its fifty-eighth session recalled that
from 31 May 2005, the International Convention for
the Control and Management of Ships’ Ballast Water
and Sediments (BWM Convention), which deals with
open for accession. It noted that three more states had
acceded to the Convention since the last session, and
urged the other member States to become a Party to
this Convention at the earliest possible opportunity. The
BWM Convention will enter into force 12 months after
world merchant tonnage.157
conclusion that only a limited number of ballast water
treatment technologies would be available to meet the
there were concerns regarding the capability of all ships
subject to regulation B-3.3 to meet the D-2 standard
in 2009 due to procedural and logistical problems.
Following an initiative by the IMO Secretary-General
to address these concerns, the IMO Assembly, at its
the Application of the BWM Convention, which calls on
states that have not yet done so to ratify the Convention
as soon as possible. In the meantime, the resolution
The IMO Legal Committee,
during its 95th session held
from 30 March-to 3 April 2009,
approved a draft protocol to the
1996 International Convention
on Liability and Compensation
for Damage in Connection with
the Carriage of Hazardous and
Noxious Substances by Sea
(HNS Convention).
Review of Maritime Transport, 2009148
recommends that ships subject to regulation B-3.3
with regulation D-2 until their second annual survey, but
no later than 31 December 2011. The IMO Assembly in
of type-approved technology for such ships to meet the
another six ballast-water management systems. At its
water treatment technologies available had increased
to install the ballast water management systems without
extensive design consideration, such as physical and
water treatment technologies were available and were
of ballast water management systems would be available
to ships constructed in 2010.
MEPC, noting that postponing the dates stipulated
the implementation process, would send the wrong
message to the world and would not stimulate the
installation of new ballast water technologies on
board ships, concluded that no changes to Assembly
resolution A.1005(25) were needed with respect
to ships constructed in 2010. Recognizing that a
proactive approach would best serve the interests of
the industry at this stage, MEPC agreed to instruct
the Secretariat to prepare a draft MEPC resolution
of ballast water management systems during new
ship construction in accordance with the application
dates contained in the Ballast Water Management
Convention, to be presented to the sixtieth session of
MEPC for consideration and adoption.158
D. STATUS OF CONVENTIONS
There are a number of international conventions affecting
the commercial and technical activities of maritime
transport, prepared or adopted under the auspices of
UNCTAD. Box 3 provides information on the status of
each of these conventions, as at 23 October 2009.159
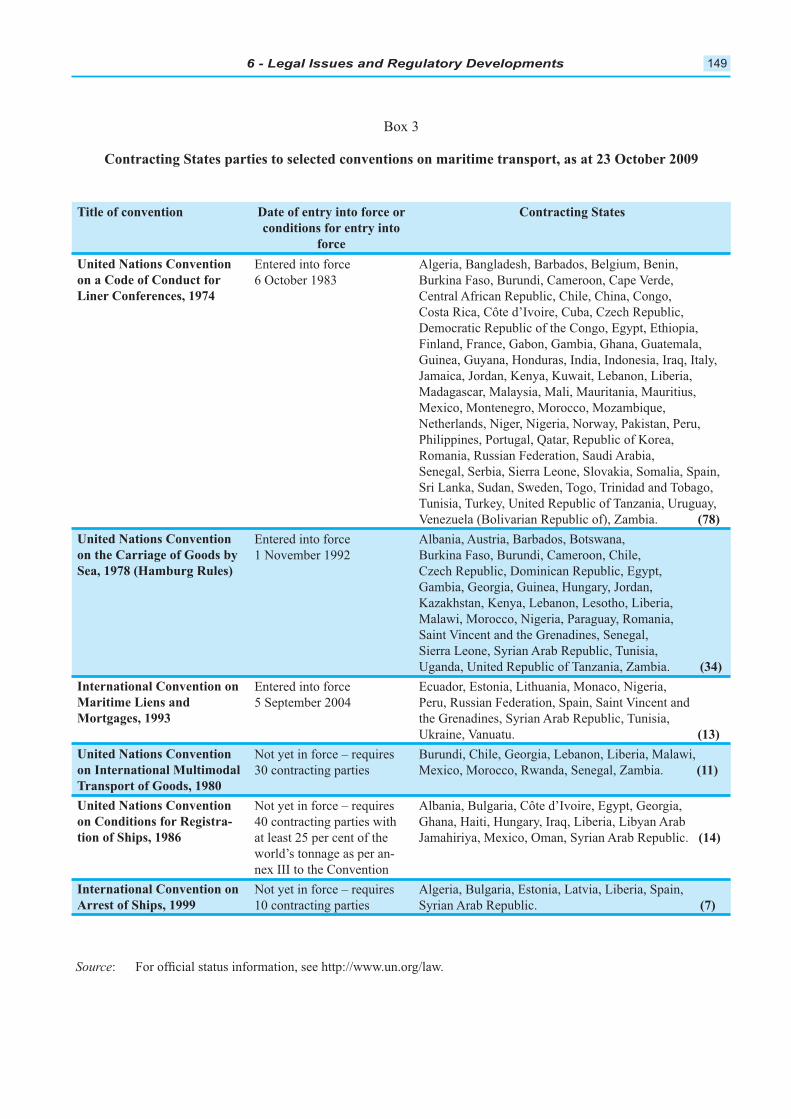
6 - Legal Issues and Regulatory Developments 149
Title of convention Date of entry into force or
conditions for entry into
force
Contracting States
United Nations Convention
on a Code of Conduct for
Liner Conferences, 1974
Entered into force
6 October 1983
Algeria, Bangladesh, Barbados, Belgium, Benin,
Burkina Faso, Burundi, Cameroon, Cape Verde,
Central African Republic, Chile, China, Congo,
Costa Rica, Côte d’Ivoire, Cuba, Czech Republic,
Democratic Republic of the Congo, Egypt, Ethiopia,
Finland, France, Gabon, Gambia, Ghana, Guatemala,
Jamaica, Jordan, Kenya, Kuwait, Lebanon, Liberia,
Madagascar, Malaysia, Mali, Mauritania, Mauritius,
Netherlands, Niger, Nigeria, Norway, Pakistan, Peru,
Philippines, Portugal, Qatar, Republic of Korea,
Romania, Russian Federation, Saudi Arabia,
Senegal, Serbia, Sierra Leone, Slovakia, Somalia, Spain,
Sri Lanka, Sudan, Sweden, Togo, Trinidad and Tobago,
Tunisia, Turkey, United Republic of Tanzania, Uruguay,
Venezuela (Bolivarian Republic of), Zambia. (78)
United Nations Convention
on the Carriage of Goods by
Sea, 1978 (Hamburg Rules)
Entered into force
1 November 1992
Albania, Austria, Barbados, Botswana,
Burkina Faso, Burundi, Cameroon, Chile,
Czech Republic, Dominican Republic, Egypt,
Gambia, Georgia, Guinea, Hungary, Jordan,
Kazakhstan, Kenya, Lebanon, Lesotho, Liberia,
Malawi, Morocco, Nigeria, Paraguay, Romania,
Saint Vincent and the Grenadines, Senegal,
Sierra Leone, Syrian Arab Republic, Tunisia,
Uganda, United Republic of Tanzania, Zambia. (34)
International Convention on
Maritime Liens and
Mortgages, 1993
Entered into force
5 September 2004
Ecuador, Estonia, Lithuania, Monaco, Nigeria,
Peru, Russian Federation, Spain, Saint Vincent and
the Grenadines, Syrian Arab Republic, Tunisia,
Ukraine, Vanuatu. (13)
United Nations Convention
on International Multimodal
Transport of Goods, 1980
30 contracting parties
Burundi, Chile, Georgia, Lebanon, Liberia, Malawi,
Mexico, Morocco, Rwanda, Senegal, Zambia. (11)
United Nations Convention
on Conditions for Registra-
tion of Ships, 1986
40 contracting parties with
at least 25 per cent of the
world’s tonnage as per an-
nex III to the Convention
Albania, Bulgaria, Côte d’Ivoire, Egypt, Georgia,
Jamahiriya, Mexico, Oman, Syrian Arab Republic. (14)
International Convention on
Arrest of Ships, 1999 10 contracting parties
Algeria, Bulgaria, Estonia, Latvia, Liberia, Spain,
Syrian Arab Republic. (7)
Box 3
Contracting States parties to selected conventions on maritime transport, as at 23 October 2009
Source
Review of Maritime Transport, 2009150
ENDNOTES
1 The United Nations General Assembly adopted the United Nations Convention on Contracts for the International
Carriage of Goods Wholly or Partly by Sea on 11 December 2008. The General Assembly authorized the opening for
signature of the Convention at a signing ceremony to be held on 23 September 2009 in Rotterdam, the Netherlands,
and recommended that the rules embodied in the Convention be known as the “Rotterdam Rules”. The text of the
Convention, as adopted, is set out in the annex to the General Assembly Resolution A/RES/62/122. It is also contained
All other working documents of Working Group III (Transport) are also available on the UNCITRAL website. Unless
otherwise provided, references hereinafter to “articles” relate to provisions in the new Rotterdam Rules.
2
3
4
as amended by the Visby and SDR protocols of 1968 and 1979.
5 United Nations Convention on Contracts for the Carriage of Goods by Sea, 1978.
6 See article 89(3).
7
of goods by sea from or to any of the Contracting States may be governed by the Rotterdam Rules or by national law,
depending on whether a contract falls within the scope of application of the Rotterdam Rules and on the substantive
expected that courts in Contracting States to the Hague-Visby Rules would apply neither the Rotterdam Rules nor the
Hague-Visby Rules to outward shipments from a Contracting State to the Rotterdam Rules.
8
are based on the 1980 Convention. See: UNCTAD, “Implementation of multimodal transport rules”, UNCTAD/SDTE/
TLB/2 and Add.1. See also: UNCTAD, “Multimodal transport: the feasibility of an international legal instrument”,
UNCTAD/SDTE/TLB/2003/1 (available at http://www.unctad.org/ttl/legal).
9 The UNCITRAL Commission, at its thirty-fourth session, created a working group to consider possible uniform
organizations, such as UNCTAD. See also the São Paulo Consensus at paras. 93 and 107 for an express mandate of
the UNCTAD secretariat to assist developing countries in the ongoing negotiations.
10 Relevant documentation highlighting potential areas of concern, in particular from the perspective of developing
countries, is available on the UNCTAD website at http://www.unctad.org/ttl/legal. For an article-by-article commentary
on the original draft legal instrument published in 2002, see UNCTAD/SDTE/TLB/4. Much of the analysis remains
of contract under the UNCITRAL draft instrument on the carriage of goods [wholly or partly] [by sea], UNCTAD/
SDTE/TLB/2004/2. The documentation is also available on the UNCITRAL website as working documents A/CN.9/
WG.III/WP.21/Add.1, A/CN.9/WG.III/WP.41 and A/CN.9/WG.III/WP.46.
11 A bibliography of academic writing on the Rotterdam Rules is available on the UNCITRAL website (http://www.
uncitral.org). For an analytical overview of the Convention, see, for instance: Diamond A (2008), The Next Sea
Carriage Convention? Lloyd’s Maritime and Commercial Law Quarterly (LMCLQ) 135; and Thomas D R (2008), An
appraisal of the liability regime established under the new UN Convention, 14, Journal of International Maritime Law
philosophy, and potential impact of the Rotterdam Rules, 14, JIML 461. For earlier analysis of different aspects of the
and papers of an international symposium held in 2004 in Hamburg, published in Transportrecht (2004) 274–308.
12
Shippers’ Council (ESC), which represents the interests of 12 national transport user organizations/shippers’ councils
from 12 countries (see the ESC position paper of 24 March 2009 and press release of 29 June 2009, available at http://
6 - Legal Issues and Regulatory Developments 151
www.europeanshippers.com), and by CLECAT (the European Association for Forwarding, Transport, Logistic and
Customs Services), which represents European freight forwarders, logistics service providers and customs agents
(see the CLECAT position paper of 29 May 2009, available at http://www.clecat.org). According to information in the
by the head of the European Commission’s Directorate-General for Transport and Energy at an ESC seminar on 22
the European multimodal expectations”.
13 Note, for instance, the conclusions of Thomas D R (2008), An appraisal of the liability regime established under the
new UN Convention, 14, JIML 496, at 511: “The Rules are a formidably comprehensive and complex code, as the
to be attributed to the legal principles and framework that is propounded but to their suffocating wordiness, careless
use of language and persistent refusal to abide by the basic rules of elegant and effective drafting. When the time
comes to put the drafting to the test […] it is suspected that the Rules may be found to be wanting and productive of
more disputes than might be considered healthy for the shipping industry.” See also: Tetley W (2008), Some general
criticisms of the Rotterdam Rules, 14, JIML 625, at 626.14 On this aspect, see Diamond A (2008), The next sea carriage Convention? LMCLQ 135; van der Ziel G (2008),
Delivery of the goods, rights of the controlling party and transfer of rights, 14, JIML 597; Asariotis R (2008), What
future for the bill of lading as a document of title? 14, JIML 75. See also: Asariotis R (2004), Main obligations and
liabilities of the shipper, Transportrecht 284.
15 On this aspect, see Williams R (2008), Transport documentation under the new Convention, 14, JIML 566. For
some analysis of earlier drafts of the text, see also: Clarke M (2002), Transport documents: their transferability as
documents of title; electronic documents. LMCLQ 356; and Schelin J (2004), Documents, Transportrecht 294.
16 On this aspect, see Goldby M (2008), Electronic alternatives to transport documents and the new Convention: a
framework for future development? 14, JIML 586. For some comments regarding earlier drafts of the text, see
also: van der Ziel G (2003), The legal underpinning of e-commerce in maritime transport by the UNCITRAL Draft
Instrument on the Carriage of Goods by Sea, 9, JIML 461.
17 See articles 74 and 78. In general, the rules on jurisdiction and arbitration that are set out in chapters 14 and 15 only
apply if a Contracting State declares that it will be bound by them. In the absence of such a declaration, national
rules would apply to determine whether contractual choice of a forum is admissible. Both chapters envisage a list of
places, at the claimant’s choice, for the institution of legal/arbitral proceedings against the carrier. Contractual choice
of forum is only permitted in the context of volume contracts, and under certain conditions, but the position of third
parties is specially regulated. Whether third parties are bound by a contractual choice of forum depends on the “law
of the court seized” (in the case of jurisdiction clauses) or the “applicable law” (in the case of arbitration clauses)
and on whether the selected forum is situated in one of the listed places. There is considerable uncertainty associated
with the practical application of these provisions in different jurisdictions, which may or may not have opted into the
jurisdiction and arbitration chapters. For detailed analysis, see Baatz YM (2008), Jurisdiction and arbitration under
the Rotterdam Rules, 14, JIML 608. On this issue, at an earlier stage of the negotiation process, see also: Berlingieri
F (2004), Freedom of contract under the Rules, Forum and Arbitration Clauses, Transportrecht 303.
18 For some discussion of earlier drafts of the text, see, for instance: Sturley MF (2005), Solving the scope-of-application
puzzle: contracts, trades and documents in the UNCITRAL transport law project, 11, JIML 22; and Rosaeg E (2002),
The applicability of conventions for the carriage of goods and for multimodal transport, LMCLQ 316.
19
undertakes to carry goods from one place to another. The contract shall provide for carriage of goods by sea and may
provide for carriage by other modes of transport in addition to sea carriage.”
20 For an analysis of relevant provisions, see Hancock C (2008), Multimodal transport and the new UN Convention
on the carriage of goods, 14, JIML 484. In relation to earlier versions of the draft conventions, see Hoeks M (2008),
Multimodal carriage with a pinch of sea salt: door-to-door under the UNCITRAL draft instrument, European
Transport Law 257; Faghfouri M (2006), International regulation of liability for multimodal transport – in search
of uniformity, World Maritime University (WMU) Journal of Maritime Affairs 61; Haak KF and Hoeks M (2004),
B (2004), Scope of application and rules on multimodal transport contracts, Transportrecht 297; and Alcantara JM
(2002), The new regime and multimodal transport, LMCLQ 399.
Review of Maritime Transport, 2009152
21
a carrier, against the payment of freight, undertakes to carry goods from one place to another. The contract shall
provide for carriage by sea and may provide for carriage by other modes of transport in addition to sea carriage”.
sentence of the provision appear possible. For some discussion of different approaches to interpretation, see Diamond
A (2008), The next sea carriage Convention? LMCLQ 135 at 140.
22 The substantive scope of application and the provisions regulating the application of the Convention to multimodal
with some States proposing to make the multimodal application of the new international regime optional, or proposing
to provide for continued applicability of existing national law. Others expressed concern about the suitability of the
substantive liability regime in the context of international multimodal transportation. See A/63/17 at paras. 23, 93–98
and 270–278.23 Ibid.
24 In particular the Convention on the Contract for the International Carriage of Goods by Road (1956), as amended
by the 1978 Protocol (the “CMR”), the Uniform Rules concerning the Contract for International Carriage of Goods
by Rail (appendix B to the Convention concerning International Carriage by Rail, as amended by the Protocol of
Carriage by Air 1999 (the “Montreal Convention”), and the Budapest Convention on the Contract for the Carriage
of Goods by Inland Waterways, 2000 (the “CMNI”).
25 Only the application of existing international conventions (and any relevant future amendments thereto on carrier
liability) has been preserved; see article 82. For relevant discussions at the 2008 UNCITRAL Commission session,
see A/63/17 at paras. 249–254.
26
carrier liability, see, for instance: Nikaki T (2008), The fundamental duties of the carrier under the Rotterdam Rules,
14, JIML 512; Honka H (2004), Main obligations and liabilities of the carrier, Transportrecht 278; and Berlingieri F
(2002), Basis of liability and exclusions from liability, LMCLQ 336.
27
arrival of the goods at the port of loading and their departure from the port of discharge. An inland carrier is a maritime
performing party only if it performs or undertakes to perform its services exclusively within a port area.”
28 Liability for delay in delivery only arises in cases where a time for delivery has been agreed in the contract. Delay is
for in the contract of carriage within the time agreed.”
29 See article 59, according to which “the carrier’s liability for breaches of its obligations under this Convention is limited
to 875 [SDR] per package or other shipping unit or 3 [SDR] per kg of the gross weight of the goods that are subject
to the claim or dispute, whichever amount is higher,” except where a higher value of the goods has been declared or
a higher limit of liability has been agreed. Note that for potential liability from delay in delivery, a separate limit of
2.5 times the agreed freight applies (article 60). This is similar to the corresponding limit in the Hamburg Rules.
30 The relevant limitation amounts under the Hague-Visby Rules and Hamburg Rules are 666.7 SDR/pkg or 2 SDR/
kg, and 825 SDR/pkg or 2.5 SDR/kg, respectively.
31 Note that while there is an express seaworthiness obligation, there is no corresponding obligation in respect of vehicles
other than ships that may be used in the performance of the contract.
32 Note in particular articles 17(3) (f), (h), (i), (n) and (o). The so-called “nautical fault” exemption has been omitted
(cf. article IV r. 2(b) HVR) has been retained, but it no longer protects the carrier in cases of proven negligence (cf.
article 17(4)). Exempting events/circumstances without express parallel in the Hague-Visby Rules include “loading,
handling, stowage or unloading of the goods” performed pursuant to a “free in and out stowage” (FIOS)-type agreement
which is now expressly permitted under article 13(2), as well as “reasonable measures to avoid or attempt to avoid
damage to the environment.” Moreover, the list of events or circumstances includes “acts of the carrier in pursuance
of the powers conferred by articles 15 and 16”. Article 15 deals with potentially dangerous cargo and gives the carrier
broad rights, “notwithstanding” its obligations regarding delivery of the goods and care of cargo (articles 11 and 13),
11, 13 and 14, i.e. irrespective of the carrier’s seaworthiness obligation.
6 - Legal Issues and Regulatory Developments 153
33
be named as “shipper” in the transport document or electronic transport record.”
34 For detailed analysis, see Asariotis R (2008), Burden of proof and allocation of liability for loss due to a combination
of causes under the Rotterdam Rules, 14, JIML 537. For earlier analysis, see also: UNCTAD (2004), Carrier liability
and freedom of contract under the UNCITRAL draft instrument on the carriage of goods [wholly or partly] [by
sea], UNCTAD/SDTE/TLB/2004/2; and Asariotis R (2002), Allocation of liability and burden of proof in the draft
instrument on transport law, LMCLQ 382.
35 Ibid. See also: Sturley M (2009) Modernizing and Reforming US Maritime Law: The Impact of the Rotterdam Rules
in the United States, 44, Texas International Law Journal 427 at 447-448 and Hooper C (a former president of the
United States Maritime Law Association and member of the United States delegation to the UNCITRAL Working
Group), The Rotterdam Rules – simpler than they appear, The Arbitrator 40 (2009) 5, available at http://www.smany.
org/sma/pdf/Vol40_No3_Apr2009.pdf.
36
the liability of the shipper, see Baughen S (2008), Obligations of the shipper to the carrier, 14, JIML 555 at 564. For
analysis of the relevant provisions, as contained in an earlier text of the draft convention, see Asariotis R (2004),
Main obligations and liabilities of the shipper, Transportrecht 284. See also: Zunarelli S (2002), The liability of the
shipper, LMCLQ 350.
37 Information duties and any potential liability for failure to comply may, in future, become more relevant as a result
of international and national regulation to enhance maritime and supply-chain security. Potential losses could arise,
documentation or information. For some information, see an UNCTAD report published in 2004 entitled “Container
security: major initiatives and related international developments” (UNCTAD/SDTE/TLB/2004/1), which is available
at http://www.unctad.org/ttl/legal.
38 See notes 34 and 35, above.
39 However, note that a two-year time bar applies to all claims under the Convention, article 62.
40 See article 58(2), which states that a “holder” who “exercises any rights under the contract of carriage” also “assumes
any liabilities imposed on it under the contract of carriage”. However, it has been argued, with reference to the wording
of articles 58(2) and 79(2)(b) that the statutory obligations set out in chapter 7 may be personal to the shipper, and
cannot be contractually transferred to a third-party consignee. See Baughen S (2008), Obligations of the shipper to
the carrier, 14, JIML 555 at 564; and the discussion by Williams R (2008), Transport documentation under the new
Convention, 14, JIML 566 at 583.
41 CIF stands for Cost, insurance and freight. See INCOTERMS 2000, published by the International Chamber of
Commerce.
42 For an overview of the role and function of different types of transport documents, see UNCTAD: The use of transport
documents in international trade, UNCTAD/SDTE/TLB/2003/3, paras. 9–42, available at http://www.unctad.org/
ttl/legal. For a critical assessment of the approach adopted in the Rotterdam Rules, see the references in note 14,
above.
43 For analysis of the regulation of volume contract under the Convention, see Asariotis R, UNCITRAL draft convention
on contracts for the carriage of goods wholly or partly by sea: Mandatory rules and freedom of contract, in: Antapassis,
Athanassiou and Rosaeg eds. (2009), Competition and regulation in shipping and shipping-related industries, Martinus
Nijhoff 349. On this issue, at an earlier stage of the negotiation process, see also: Berlingieri F (2004), Freedom of
contract under the Rules; Forum and Arbitration Clauses, Transportrecht 303.
44 See article III, r.8 of the Hague Rules and the Hague-Visby Rules and article 23 of the Hamburg Rules.
45 Article V of the Hague-Visby Rules and article 23(2) of the Hamburg Rules.
46 The mandatory application of the Hague Rules and the Hague-Visby Rules extends to “bills of lading or similar
documents of title” (see article I(b) of the Hague-Visby Rules). Non-negotiable seawaybills are not expressly covered.
However, as they are also standard form documents, issued by a carrier and operating as a receipt and as evidence
of a contract of carriage, the national legislation of some States extends the protection of the Hague Rules and the
Hague-Visby Rules to non-negotiable seawaybills. The Hamburg Rules apply to all contracts for the carriage of
goods by sea, other than charter parties (articles 1(6), 2(1) and (3) of the Hamburg Rules) and thus include contracts
covered by negotiable as well as non-negotiable transport documents. See the UNCTAD report entitled “The use of
transport documents in international trade”, UNCTAD/SDTE/TLB/2003/3.
Review of Maritime Transport, 2009154
47 See chapter 4, table 32.
48 For an overview of the genesis of the set of provisions dealing with volume contracts and the relevant debate within
proposals submitted by delegations in the course of the UNCITRAL Working Group deliberations concerning volume
contracts are contained in documents A/CN.9/WG.III/WP.34 and 42 (United States), and in document A/CN.9/WG.III/
WP.88 (Australia and France). Relevant submissions by Governments to the UNCITRAL Commission at which the
It should be noted that a number of delegations, including Australia, New Zealand and China, had expressed particular
as adopted by the Commission.
49 Article 80(2).
50 Article 80(4).
51 It should again be noted that information duties and any potential liability for failure to comply may, in future, become
more relevant as a result of international and national regulation to enhance maritime and supply-chain security – see
note 37, above.
52
at para. 36.
53 While derogations must be set out in the volume contract, incorporation of (standard) terms by reference is permitted;
see article 80(2) and (3).
54 Article 80(2)(b).
55 Article 80(2)(c).
56 Article 80(5).
57
representatives such as the European Community’s Shopowners Associations (ECSA), the International Chamber of
Shipping (ICS) and the World Shipping Council (WSC), whereas strong opposition has been expressed by the European
Shippers’ Council (ESC) and freight forwarders’ organization CLECAT as well as the International Association
of Freight Forwarders Associations (FIATA). Position papers by these and some other industry representatives are
available on the UNCITRAL website at http://www.uncitral.org.
58 See also note 13, above.
59 See note 17, above, and the accompanying text.
60 The 1988 SUA Convention came into force on 1 March 1992. As at 2 October 2009, it had 154 parties, representing
93.45 per cent of world tonnage. Its text can be found at http://www.admiraltylawguide.com. For its latest updated
status, check the IMO website at http://www.imo.org.
61 For a description of amendments to the 1988 SUA and its 1988 Protocol adopted in 2005 under the auspices of IMO,
see the Review of Maritime Transport 2006. As at 2 October 2009, the 2005 amendment to the SUA Convention
had not yet entered into force. Only nine Contracting States had become parties, representing 6.01 per cent of world
tonnage.
62 Reports are issued under the MSC.4/Circ series. Their texts can be found at http://docs.imo.org.
63 http://www.icc-ccs.org
64 IMO, in its “Code of practice for the investigation of crimes of piracy and armed robbery against ships” distinguishes
101 of the 1982 United Nations Convention on the Law of the Sea. The code of practice was adopted in November
2001 during the twenty-second session of the IMO Assembly, by resolution A/922(22). For the text of the code, see
MSC 74/24/Add.1 – Report of the MSC at its seventy-fourth session, annexes 1–22, annex 18, article 2.2; or MSC/
armed robbery” as: “an act of boarding or attempting to board any ship with the apparent intent to commit theft or
any other crime and with the apparent intent or capability to use force in the furtherance of that act.” This updated
org).
65 ICC–IMB Piracy and Armed Robbery Against Ships Report – Annual Report 2008.
6 - Legal Issues and Regulatory Developments 155
66 See the . MSC 85/26, page 100.
67 MSC.1/Circ.622/Rev.1; MSC.1/Circ.623/Rev.3; and resolution A.922(22).
68 MSC 86/18/1.
69 For more information on the discussions held, see the Report of the Maritime Safety Committee on its eighty-sixth
session,
70 MSC.1/Circ.1333 (previously MSC.1/Circ.622/Rev.1).
71 MSC.1/Circ.1334 (previously MSC.1/Circ.623/Rev.3).
72 MSC.1/Circ.1302
73 Resolution A.922(22).
74 Resolution A.1002(25) on “Piracy and armed robbery against ships in waters off the coast of Somalia” (http://docs.
imo.org).
75 See the ICC–IMB Piracy and Armed Robbery Against Ships Report – First Quarter 2009.
76 and the
United Nations Commission on Crime Prevention and Criminal Justice (http://www.unodc.org). See also: “Piracy
must be defeated in courts, ports and banks, not just at sea”, editorial by Antonio Maria Costa, UNODC Executive
Director, Lloyd’s List, 5 February 2009.
77 The texts of the resolutions can be found at the United Nations Security Council website, http://www.un.org/docs/
sc.
78 See S/RES/1846/2008, adopted on 2 December 2008, para. 19.
79 For the text of the establishing statement, see http://www.marad.dot.gov. Participating in the meeting were representatives
from Australia, China, Denmark, Djibouti, Egypt, France, Germany, Greece, India, Italy, Japan, Kenya, the Netherlands,
Oman, the Republic of Korea, the Russian Federation, Saudi Arabia, Somalia (Transitional Federal Government),
Spain, Turkey, the United Arab Emirates, the United Kingdom, the United States and Yemen, as well as the African
Union, the European Union, the North Atlantic Treaty Organization, the United Nations Secretariat and the International
Maritime Organization. Additionally, Belgium, Djibouti, Norway, Portugal, Sweden and the Arab League, joined
the Contact Group. See also the UNODC press release from 20 January 2009 entitled “Ship riders”: tackling Somali
pirates at sea.
80 IMO circular letter no. 2933, 23 December 2008. According to IMO document LEG 96/7/Corr.1, as at 23 September 2009
replies had been received from Argentina, Australia, Azerbaijan, the Bahamas, Belgium, Brazil, Chile, Colombia,
Denmark, Ecuador, Estonia, Germany, Greece, Guatemala, Iran (Islamic Republic of), Italy, Jamaica, Japan, Mexico,
Morocco, New Zealand, Peru, the Philippines, the Republic of Korea, the Russian Federation, Spain, Sri Lanka,
Thailand, The United States and Uruguay. Hong Kong (China) also submitted its legislation. It was noted that some
replies to the circular letter provided a summary of the national law rather than the text of current legislation.
81 For further information, see http://www.mschoa.org.
82 See the ICC–IMB Piracy and Armed Robbery Against Ships Report – First Quarter 2009, page 31. See also: New
‘hunters’ stalk pirates, Fairplay, 15 January 2009.
83 Security Council resolution 1846 of 2 December 2008 welcomes initiatives by Canada, Denmark, France, India, the
Netherlands, the Russian Federation, Spain, the United Kingdom and the United States of America, pursuant to earlier
Security Council resolutions.
84 ICC–IMB Piracy and Armed Robbery Against Ships Report – First Quarter 2009, page 31.
85 See http://www.wcoomd.org.
86 SAFE Framework of standards to secure and facilitate global trade, rev. June 2007: 6, footnote 1.
87 See SAFE Framework, rev. June 2007, subsection 5.2: 37.
88 APEC’s member states are Australia, Brunei Darussalam, Canada, Chile, China, Hong Kong (China), Indonesia,
Japan, Malaysia, Mexico, New Zealand, Papua New Guinea, Peru, the Philippines, the Republic of Korea, the Russian
Federation, Singapore, Thailand, the United States and Viet Nam.
89 For instance Australia, Canada, China, Japan, New Zealand, Singapore and the United States.
90 Among the member states of the European Union, Germany, the Netherlands, Sweden and the United Kingdom are
Review of Maritime Transport, 2009156
91 Argentina, Canada, China, Japan, Jordan, New Zealand, Norway, the Republic of Korea, Singapore and the United
States. In addition, an AEO programme will start in Morocco.
92 Australia, Botswana, Chile, Mexico, Serbia, and the former Yugoslav Republic of Macedonia.
93
Agreement, announced in June 2007 (see the press release entitled U.S., New Zealand establish joint trade security
arrangement, 29 June 2007 (http://www.cbp.gov). In June 2008, the United States signed an arrangement with Canada
on mutual recognition of the Customs-Trade Partnership Against Terrorism (C-TPAT) and the Partners in Protection
programme (PIP). The PIP is comparable to the C-TPAT and the EU’s AEO programme; see the Canada Border Services
States–Japan, EU-Switzerland and EU-Norway.
94 Andorra and San Marino.
95 See the speech by the Secretary-General of the WCO at the International Transport Forum 2009, IRU workshop,
Leipzig, 27 May 2009, available at http://www.wcoomd.org.
96 WCO Columbus Programme brochure – Enhancing the global dialogue on capacity-building. See also the Capacity-
building development compendium, a Columbus Programme phase 2 implementation tool, which is available at http://
www.wcoomd.org.
97 These countries are Azerbaijan, Brazil, Burkina Faso, China, the Dominican Republic, Egypt, Hong Kong (China),
Hungary, India, Japan, Kenya, Lebanon, Malaysia, the Russian Federation, South Africa and Zimbabwe. See: http://
www.wcoomd.org.
98 For more information, see: WCO News, No. 58, February 2009, http://www.wcoomd.org.
99 The text of the report can be found at the WCO website at http://www.wcoomd.org.
100
trade facilitation and border security”, available at http://www.wcoomd.org.
101 Ibid.
102 Regulation No. 1875/2006 is contained in the L 360, 19 December 2006: 64.
103 A number of guidance documents and tools have been prepared by the European Commission, including detailed AEO
guidelines published in June 2007, a common framework for risk assessment of economic operators called COMPACT
which was published in June 2006, an AEO self-assessment tool, and an AEO e-learning tool. The AEO guidelines
(TAXUD/2006/1450) and the AEO compact model (TAXUD/2006/1452) are available at http://ec.europa.eu.
104 See article 1.12 of regulation (EEC) no. 2454/93, as amended by article 1 of regulation (EC) no. 1875/2006.
105 See AEO Guidelines (TAXUD/2006/1450): 8.
106
107 Information provided by the EU Secretariat, DG Taxation and Customs Union.
108 OJ.L 98/3 of 17 April 2009 (http://eur-lex.europa.eu).
109 For further information, see http://ec.europa.eu.
110 See the Guidelines on EORI, TAXUD/2008/1633 rev. 1.9, issued on 14 May 2009. For information concerning the
authorities in member states responsible for assigning EORI numbers, see information on the European Commission’s
website (http://ec.europa.eu). In addition, an e-learning tool on EORI will soon be available on the same website.
111 In particular, Andorra, China, Japan, and San Marino. Negotiations with Canada are also to begin. For more information
see the European Commission website (http://ec.europa.eu). See also the Review of Maritime Transport 2008.
112 See the ICC discussion paper “ICC recommendations on mutual recognition of US–EU trade partner programmes for
border security”, fourth revision, 23 January 2009, available at http://www.iccwbo.org.
113 Press release, 27 March 2008. For further information, see the United States Customs and Border Protection website
at http://www.cbp.gov.
114 European Commission, Taxation and Customs Union press release. “United States Customs and Border Protection
and European Commission adopt the joint roadmap towards mutual recognition trade partnership programmes”,
27 March 2008.
6 - Legal Issues and Regulatory Developments 157
115 Abridged external partner version of the United States–European Union Joint Customs Cooperation Committee
roadmap towards mutual recognition of trade partnership programmes. The text is available on the Customs and
Border Protection website at http://www.cbp.gov.
116 ICC discussion paper “ICC recommendations on mutual recognition of US–EU trade partner programmes for border
security”, fourth revision, 23 January 2009, available at http://www.iccwbo.org.
117 WCO AEO Guidelines, Section F(a).
118 For further information on the United States 24-hour rule, see http://www.cbp.gov. See also the UNCTAD report
entitled “Container security: Major initiatives and related international developments” (UNCTAD/SDTE/TLB/2004/1)
at http://www.unctad.org/ttl/legal.
119 Commission regulation (EC) no. 273/2009 of 2 April 2009, laying down provisions for the implementation of Council
Regulation (EEC) no. 2913/92 establishing the Community Customs Code, derogating from certain provisions of
Commission Regulation (EEC) no. 2454/93. L 91/14, http://eur-lex.europa.
eu.
120 In this context, see, for instance, the UNCTAD report entitled “Maritime security: ISPS implementation, costs and
showed that the costs of compliance with the ISPS Code were proportionately higher for smaller ports.
121 For the text, see http://edocket.access.gpo.gov/2008/pdf/E8-27048.pdf, where earlier comments by stakeholders are
also addressed.
122
is available at http://www.cbp.gov.
123 See: “China ‘amnesty’ on 24-hour electronic manifest rule”, Lloyd’s List, 7 January 2009.
124 For further information, see the Review of Maritime Transport 2008.
125 See the , MSC 85/26, 18 December 2008, available
at http://docs.imo.org.
126 The Ad Hoc Working Group on Maritime Security was re-established at the eighty-third session of the MSC. See
the Review of Maritime Transport 2008.
127 For further information on the LRIT and relevant decisions at earlier sessions of the MSC, see the Review of Maritime
Transport 2008.
128 According to a press release from the European Maritime Safety Agency (http://www.emsa.europa.eu), the EU LRIT
Data Centre entered into production on 1 June 2009, following successful developmental testing. The participating
countries/territories are: Aruba, Austria, Belgium, Bulgaria, Cyprus, the Czech Republic, Denmark, Estonia, Germany,
Greece, Greenland, Finland, France, Hungary, Iceland, Ireland, Italy, Latvia, Lithuania, Luxembourg, Malta, the
Netherlands, the Netherlands Antilles, Norway, Poland, Portugal, Romania, Slovakia, Slovenia, Spain, Sweden and
the United Kingdom.
129
docs.imo.org.
130 The IMSO, which was created to launch and run services related to IMO’s global maritime distress and safety system,
acceptance or endorsement of the action by the Committee, the integration, on an interim basis, of the data centres
that have undergone and satisfactorily completed developmental testing into the production LRIT system”. See the
131
85/26: 58–59.
132 MSC.1/Circ.1307.
133 MSC.1/Circ.1308.
134 MSC.1/Circ.1309. For more information on the discussions held, see the Report of the Maritime Safety Committee
on its eighty-sixth session, MSC 86/26: 33–49.
135 For more information, see the ISO website at http://www.iso.org/iso/developing_countries.
Review of Maritime Transport, 2009158
136 For further information see the “Report on the work of the United Nations Open-ended Informal Consultative Process
on Oceans and the Law of the Sea at its ninth meeting”, A/63/174, 28 July 2008 (http://ods.un.org).
137
relating thereto (MARPOL).
138 The conference also adopted six resolutions, including resolutions on future work pertaining to the Convention, on
139 See resolution 4 adopted by the Conference.
140 Article 17 of the Convention.
141 Increased risk of premature death from pulmonary diseases and worsened respiratory diseases.
142
See also the website of the United Nations Framework Convention on Climate Change at http://unfccc.int/methods_
and_science/emissions_from_intl_transport/items/1057.php.
143 For updated status, see http://www.imo.org.
144 For the text of the resolutions, see MEPC 58/23/Add.1. For the content of the amendments endorsed earlier on SOx
and NOx emissions and particulate matter, see the Review of Maritime Transport 2008.
145
docs.imo.org).
146 In this context, see documents MEPC 58/4/2 and MEPC 58/4/4.
147 MEPC 59/INF.10.
148 MEPC 59/4/7.
149 See the Report of the
150 Ibid. Annexes 17-20.
151 Ibid., page 44-50.
152 Ibid., Annex 16.
153 MEPC 59/24 at para. 4.107.
154 MEPC 59/4/40. This complements the information on the ongoing process within the UNFCCC contained in documents
MEPC 59/4 and MEPC 59/INF.29.
155 Further information on draft negotiating texts and other relevant submissions by Parties can be found in annexes 1,
2 and 3 of document MEPC 59/4/40.
156 See IMO Council document C.102/D, 9 July 2009, Summary of decisions. For the text of the draft protocol, see the
157 According to information provided on the IMO website, as at 2 October 2009, 18 states had become members of the
BWM Convention, representing 15.36 per cent of world tonnage.
158 See the Report of the
159 Up-to-date and authoritative information on the status of international conventions is available from the relevant
depository. For United Nations conventions, see the United Nations website at http://www.un.org/law. This site
also provides links to a number of websites of other organizations, such as IMO (http://www.imo.org), ILO (http://
www.ilo.org) and the United Nations Commission on International Trade Law (http://www.uncitral.org), containing
information on conventions adopted under the auspices of each of them. Since the last reporting period, four States,
United Nations Convention on a Code of Conduct for Liner Conferences, 1974.
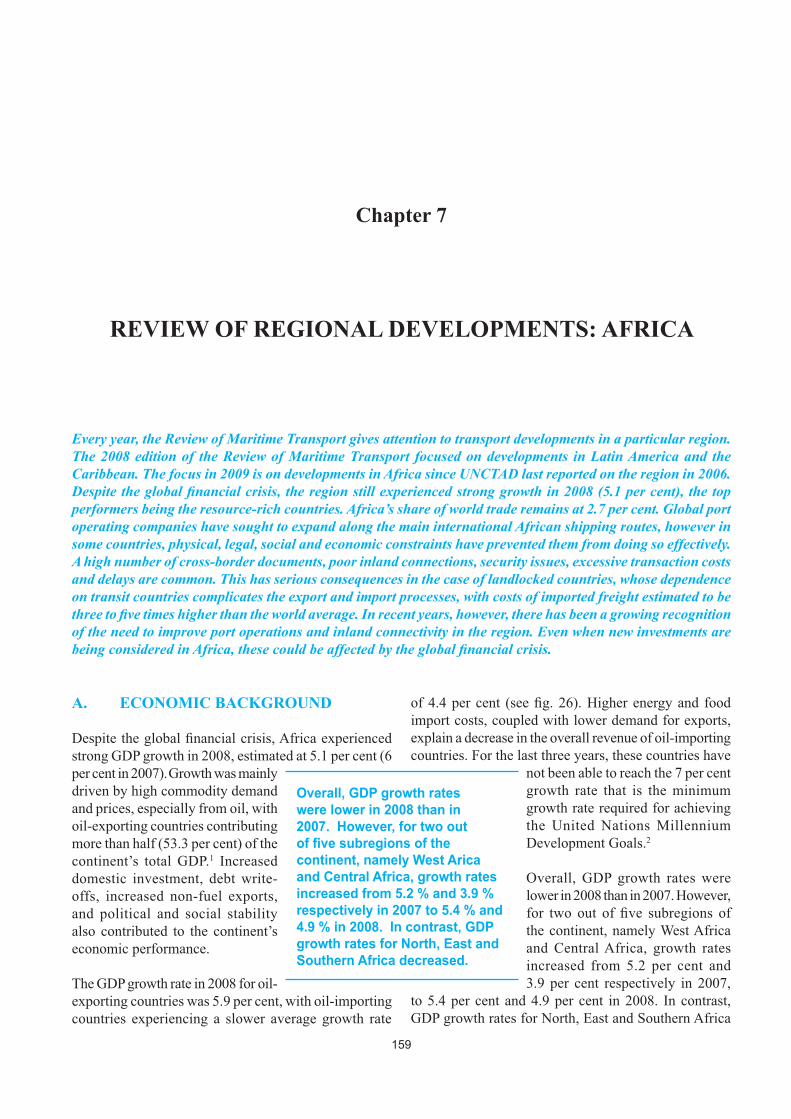
159
Chapter 7
REVIEW OF REGIONAL DEVELOPMENTS: AFRICA
Every year, the Review of Maritime Transport gives attention to transport developments in a particular region.
The 2008 edition of the Review of Maritime Transport focused on developments in Latin America and the
Caribbean. The focus in 2009 is on developments in Africa since UNCTAD last reported on the region in 2006.
performers being the resource-rich countries. Africa’s share of world trade remains at 2.7 per cent. Global port
some countries, physical, legal, social and economic constraints have prevented them from doing so effectively.
and delays are common. This has serious consequences in the case of landlocked countries, whose dependence
of the need to improve port operations and inland connectivity in the region. Even when new investments are
ECONOMIC BACKGROUNDA.
Overall, GDP growth rates
were lower in 2008 than in
2007. However, for two out
continent, namely West Arica
and Central Africa, growth rates
increased from 5.2 % and 3.9 %
respectively in 2007 to 5.4 % and
4.9 % in 2008. In contrast, GDP
growth rates for North, East and
Southern Africa decreased.
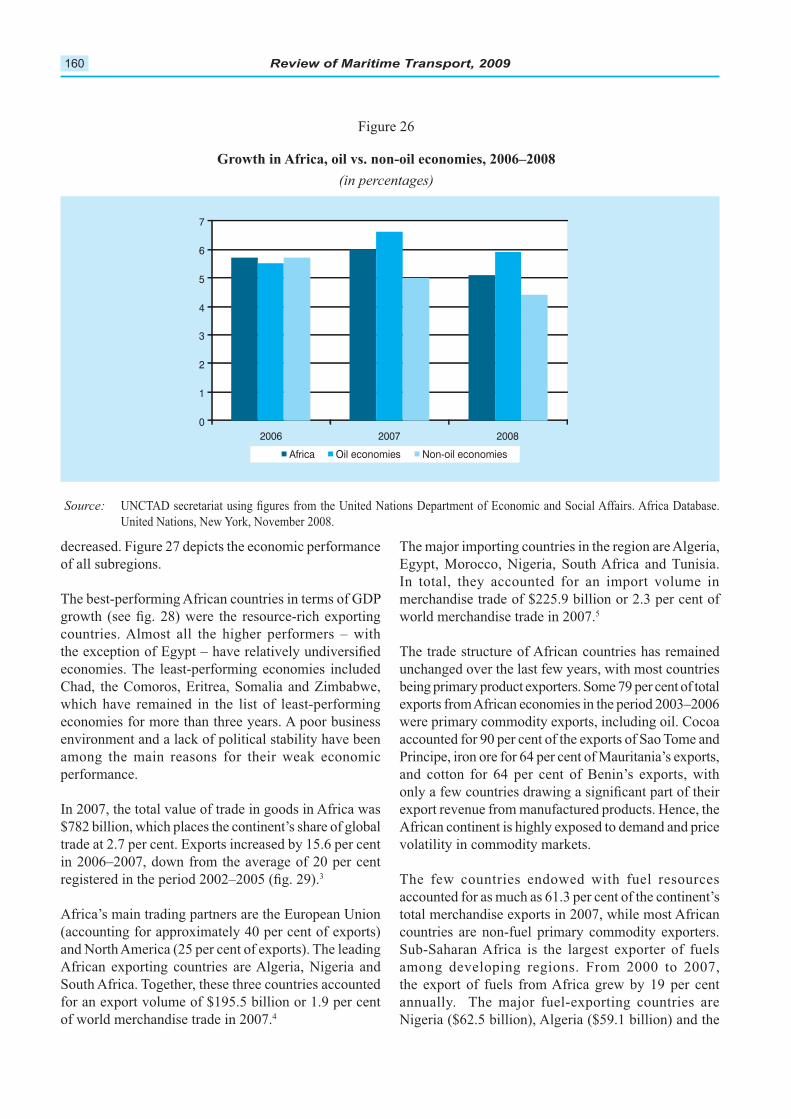
Review of Maritime Transport, 2009160
Growth in Africa, oil vs. non-oil economies, 2006–2008
(in percentages)
Source:
0
1
2
3
4
5
6
7
2006 2007 2008
Africa Oil economies Non-oil economies
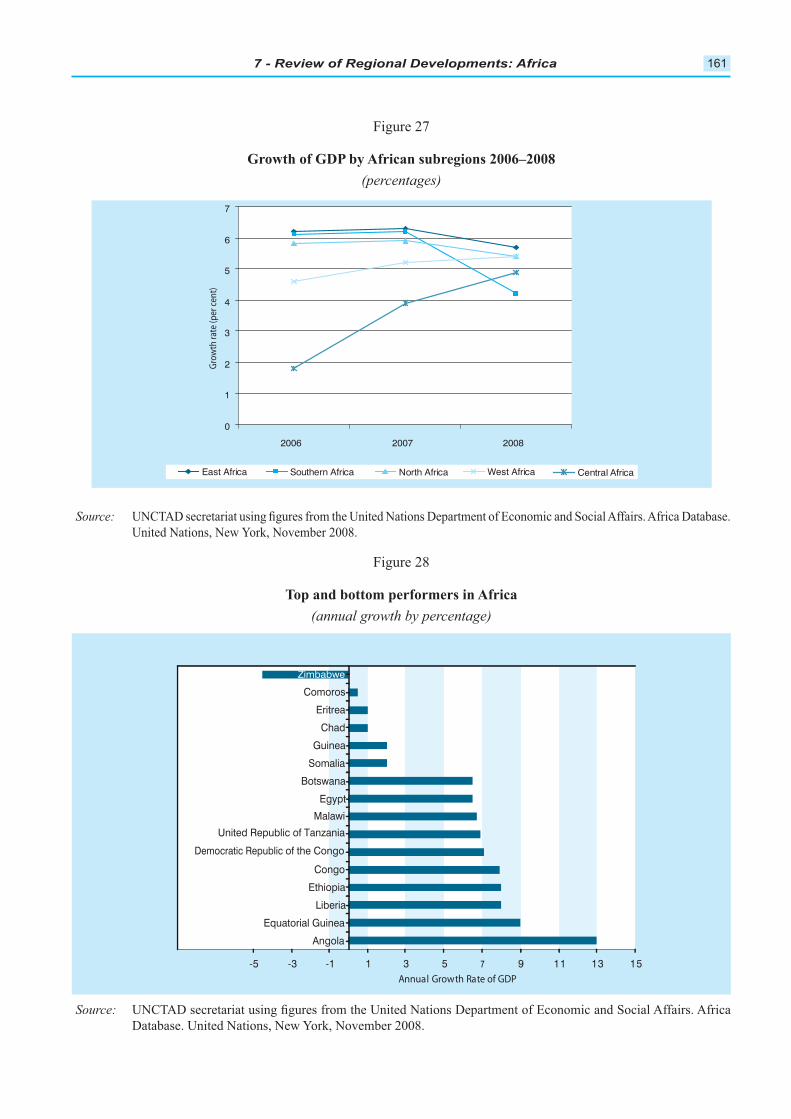
7 - Review of Regional Developments: Africa 161
Growth of GDP by African subregions 2006–2008
(percentages)
Source:
Top and bottom performers in Africa
(annual growth by percentage)
Source:
-5 -3 -1 1 3 5 7 9 11 13 15
Zimbabwe
Comoros
Eritrea
Chad
Guinea
Somalia
Botswana
Egypt
Malawi
United Republic of Tanzania
Democratic Republic of the Congo
Congo
Ethiopia
Liberia
Equatorial Guinea
Angola
Annual Growth Rate of GDP
0
1
2
3
4
5
6
7
2006 2007 2008
Grow
th ra
te (p
er ce
nt)
East Africa Southern Africa North Africa West Africa Central Africa
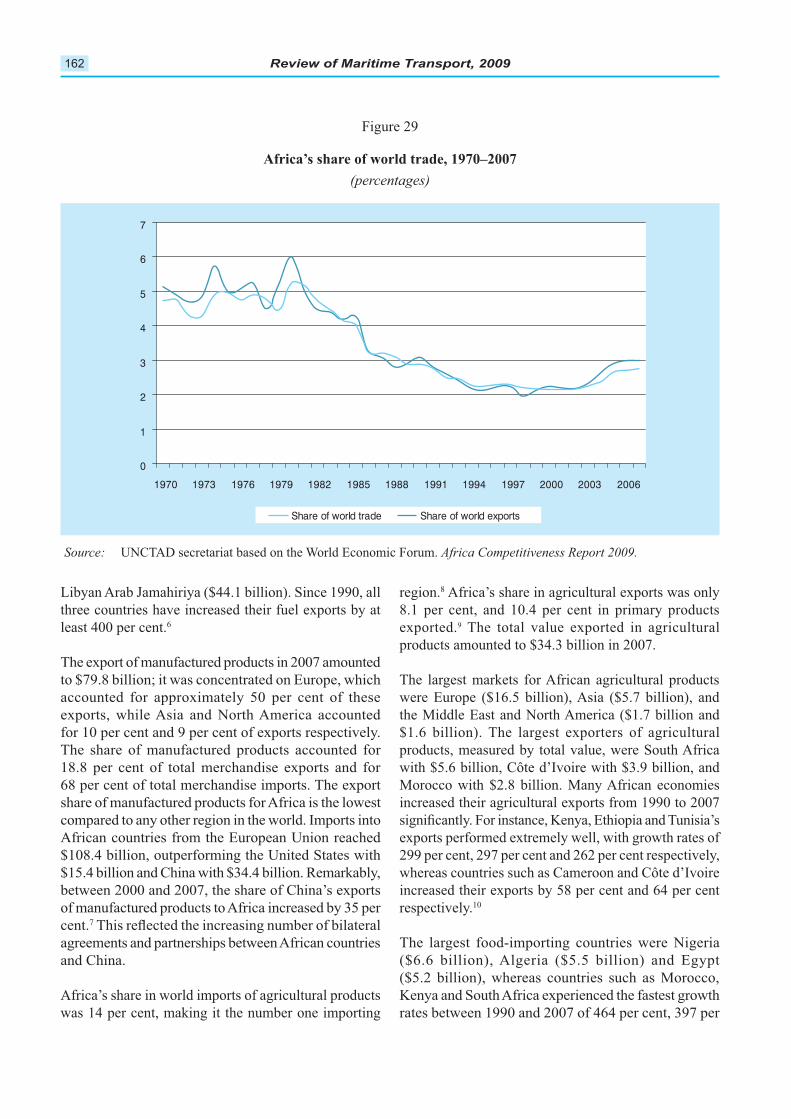
Review of Maritime Transport, 2009162
Africa’s share of world trade, 1970–2007
(percentages)
Source: Africa Competitiveness Report 2009.
0
1
2
3
4
5
6
7
1970 1973 1976 1979 1982 1985 1988 1991 1994 1997 2000 2003 2006
Share of world trade Share of world exports
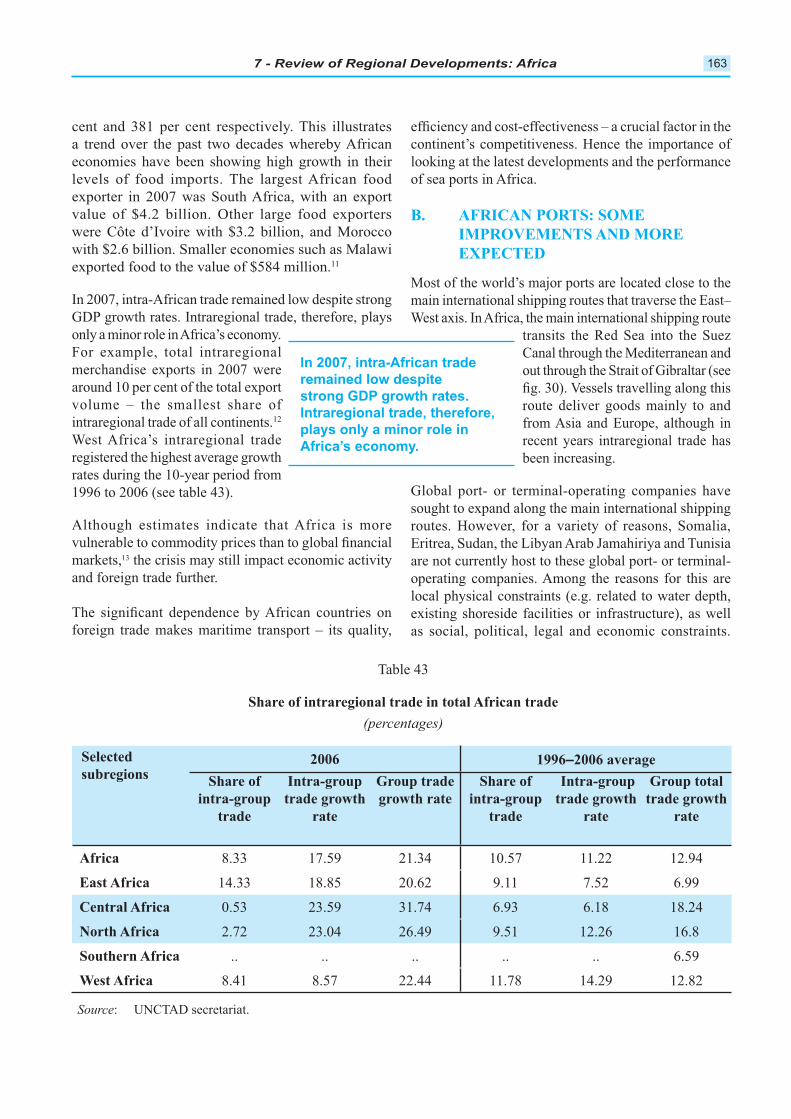
7 - Review of Regional Developments: Africa 163
AFRICAN PORTS: SOME B.
IMPROVEMENTS AND MORE
EXPECTED
In 2007, intra-African trade
remained low despite
strong GDP growth rates.
Intraregional trade, therefore,
plays only a minor role in
Africa’s economy.
Selected
subregions2006 1996–2006 average
Share of
intra-group
trade
Intra-group
trade growth
rate
Group trade
growth rate
Share of
intra-group
trade
Intra-group
trade growth
rate
Group total
trade growth
rate
Africa
East Africa
Central Africa
North Africa
Southern Africa
West Africa
Share of intraregional trade in total African trade
(percentages)
Source

Review of Maritime Transport, 2009164
Main international shipping lanes, Africa
Source:
Global port orterminal operator
International shipping lanesMajorMinor
Algeria
Morocco
MauritaniaMali Niger
Libya Egypt
ChadSudan
Nigeria Ethiopia
SaudiArabia
Yemen
Iraq Iran
Somalia
DR Congo
Angola Zambia
Tanzania
Mozambique
MadagascarZimbabwe
BotswanaNamibia
SouthAfrica
Kenya
In recent years, there has
of the need to improve port
operations in some countries
in Africa.
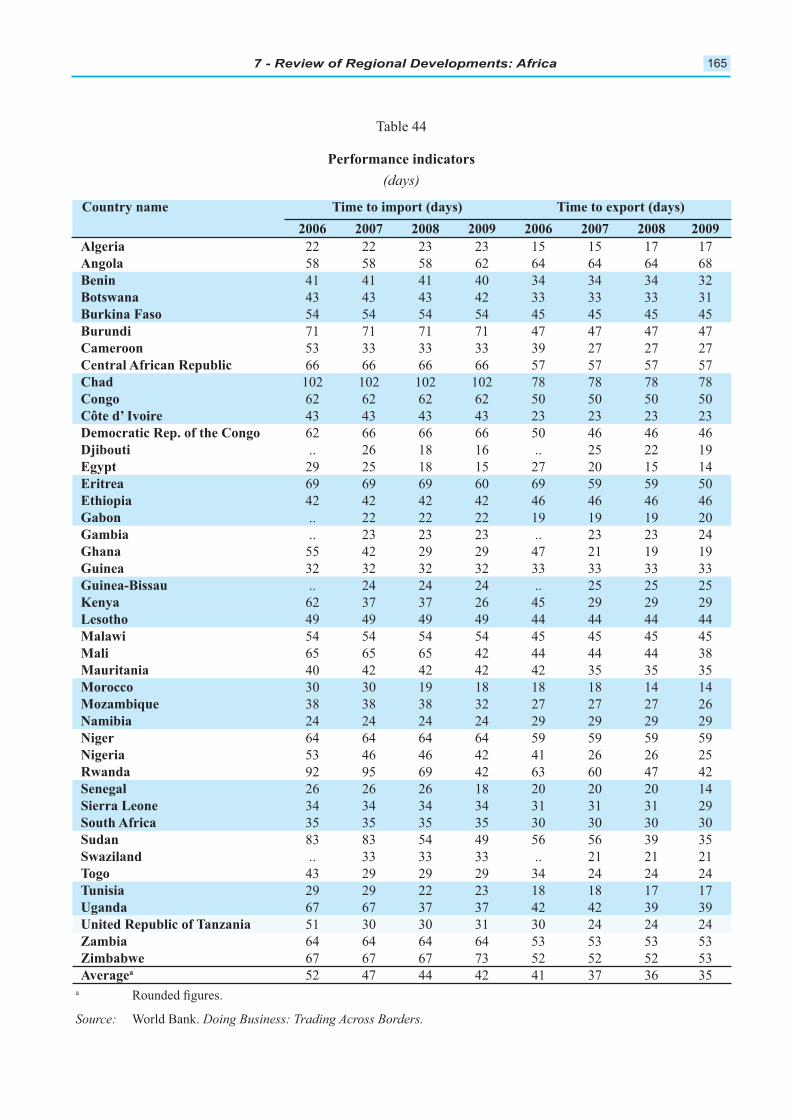
7 - Review of Regional Developments: Africa 165
Country name Time to import (days) Time to export (days)
2006 2007 2008 2009 2006 2007 2008 2009
Algeria
Angola
Benin
Botswana
Burkina Faso
Burundi
Cameroon
Central African Republic
Chad
Congo
Côte d’ Ivoire
Democratic Rep. of the Congo
Djibouti
Egypt
Eritrea
Ethiopia
Gabon
Gambia
Ghana
Guinea
Guinea-Bissau
Kenya
Lesotho
Malawi
Mali
Mauritania
Morocco
Mozambique
Namibia
Niger
Nigeria
Rwanda
Senegal
Sierra Leone
South Africa
Sudan
Swaziland
Togo
Tunisia
Uganda
United Republic of Tanzania
Zambia
Zimbabwe
Averagea
a
Source: Doing Business: Trading Across Borders.
Performance indicators
(days)
Review of Maritime Transport, 2009166
AFRICAN SHIPPING NETWORKS C.
AND LINER SHIPPING
CONNECTIVITY IN AFRICA:
A DIFFICULT PATH
Important challenges exist
for developing countries,
liner operators …
Operations are also hampered
poor inland connections, and
economic
7 - Review of Regional Developments: Africa 167
e
With regard to the components
ships per country, the TEU
capacity deployed, and the
average maximum ship size
have all increased since 2004.
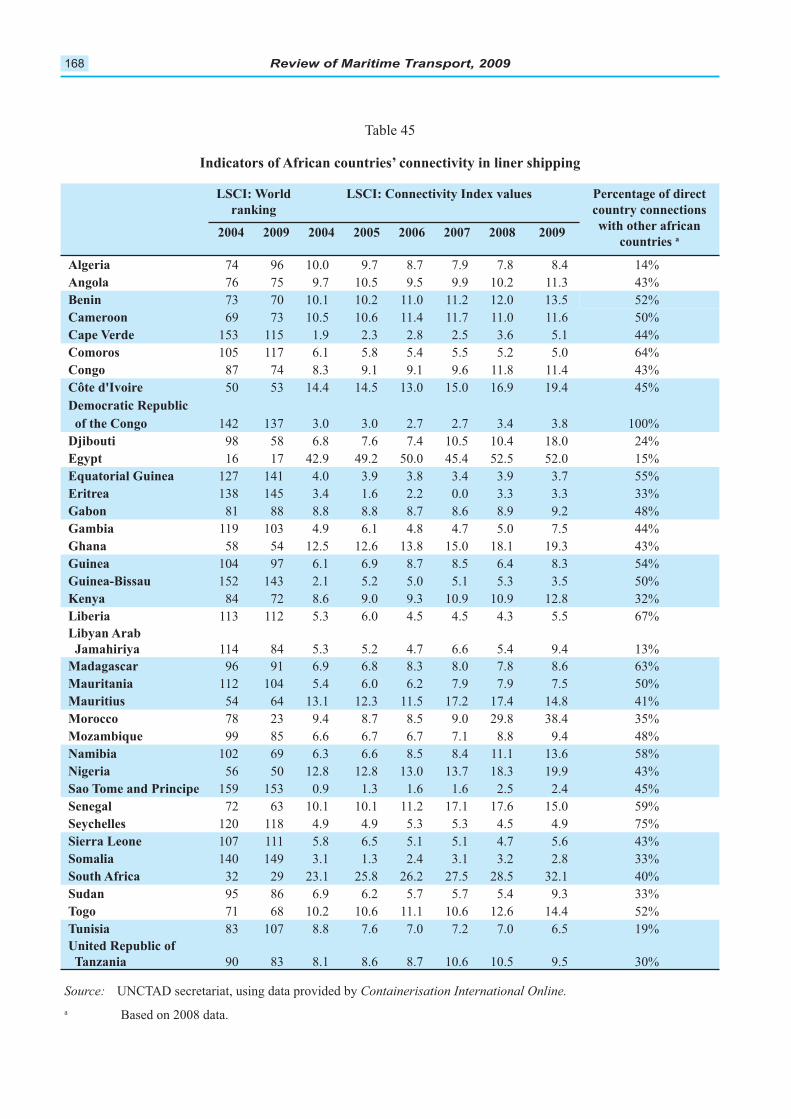
Review of Maritime Transport, 2009168
LSCI: World
ranking
LSCI: Connectivity Index values Percentage of direct
country connections
with other african
countries a2004 2009 2004 2005 2006 2007 2008 2009
Algeria
Angola
Benin
Cameroon
Cape Verde
Comoros
Congo
Côte d'Ivoire
Democratic Republic
of the Congo
Djibouti
Egypt
Equatorial Guinea
Eritrea
Gabon
Gambia
Ghana
Guinea
Guinea-Bissau
Kenya
Liberia
Libyan Arab
Jamahiriya
Madagascar
Mauritania
Mauritius
Morocco
Mozambique
Namibia
Nigeria
Sao Tome and Principe
Senegal
Seychelles
Sierra Leone
Somalia
South Africa
Sudan
Togo
Tunisia
United Republic of
Tanzania
Indicators of African countries’ connectivity in liner shipping
Source: Containerisation International Online.
a
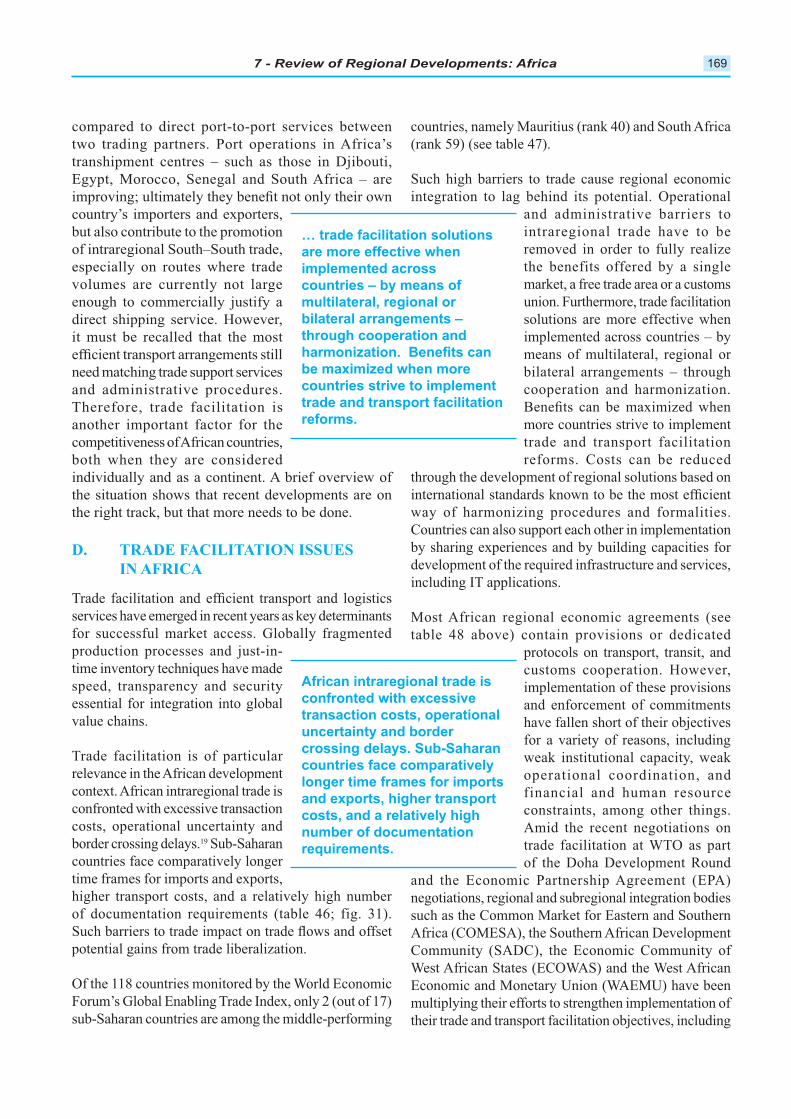
7 - Review of Regional Developments: Africa 169
TRADE FACILITATION ISSUESD.
IN AFRICA
African intraregional trade is
confronted with excessive
transaction costs, operational
countries face comparatively
longer time frames for imports
and exports, higher transport
costs, and a relatively high
requirements.
… trade facilitation solutions
are more effective when
implemented across
multilateral, regional or
through cooperation and
countries strive to implement
trade and transport facilitation
reforms.
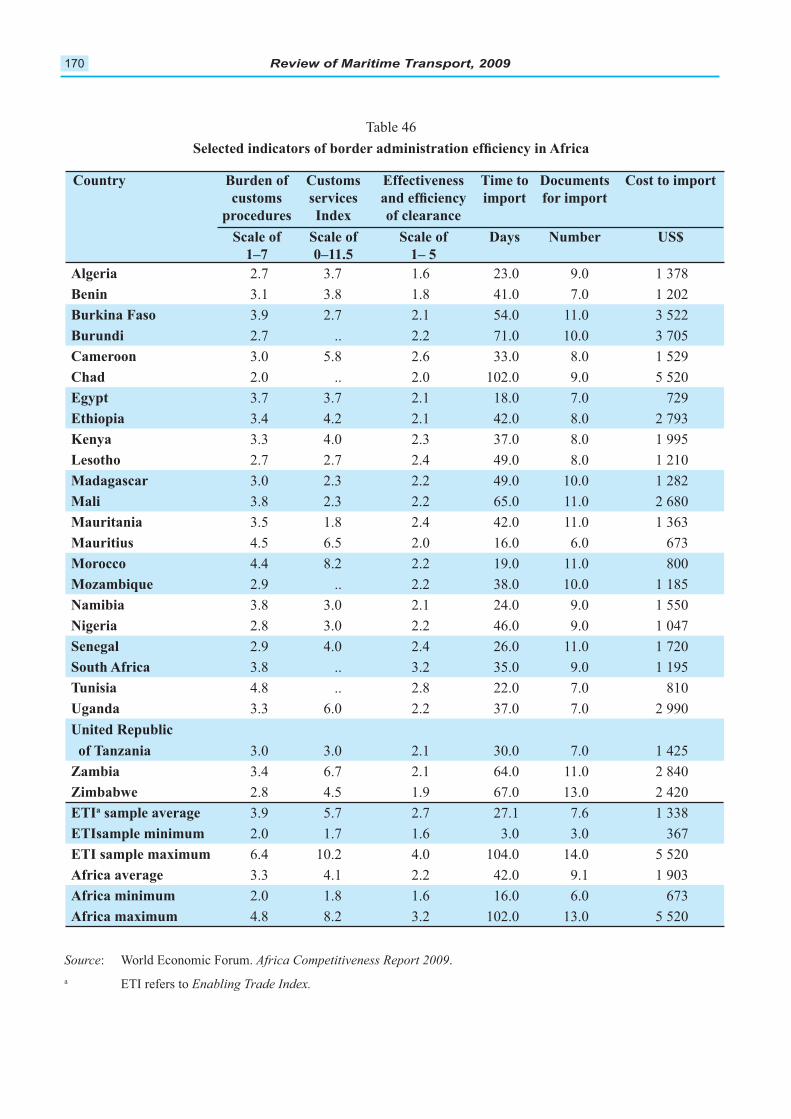
Review of Maritime Transport, 2009170
Country Burden of
customs
procedures
Customs
services
Index
Effectiveness
of clearance
Time to
import
Documents
for import
Cost to import
Scale of
1–7
Scale of
0–11.5
Scale of
1– 5
Days Number US$
Algeria
Benin
Burkina Faso
Burundi
Cameroon
Chad
Egypt
Ethiopia
Kenya
Lesotho
Madagascar
Mali
Mauritania
Mauritius
Morocco
Mozambique
Namibia
Nigeria
Senegal
South Africa
Tunisia
Uganda
United Republic
of Tanzania
Zambia
Zimbabwe
ETIa sample average
ETIsample minimum
ETI sample maximum
Africa average
Africa minimum
Africa maximum
Source Africa Competitiveness Report 2009
a Enabling Trade Index.
7 - Review of Regional Developments: Africa 171
Burden of customs procedures in Africa, 2007
2
0 1 2 3 4 5 6
TunisiaMaurit iusMorocco
Burkina FasoNamibia
MaliSout h Af r ica
EgyptMaurit ania
Et hiopiaZambiaUganda
KenyaSyr iaBenin
CameroonUnited Republic of Tanzania
MadagascarMozambique
SenegalNiger ia
ZimbabweBurundiLesot hoAlger ia
Chad
Country4.8
4.54.4
3.93.83.83.8
3.73.5
3.43.4
3.33.3
3.13.1
333
2.92.9
2.82.8
2.72.72.7
Score (1-7)
Source Africa Competitiveness Report 2009
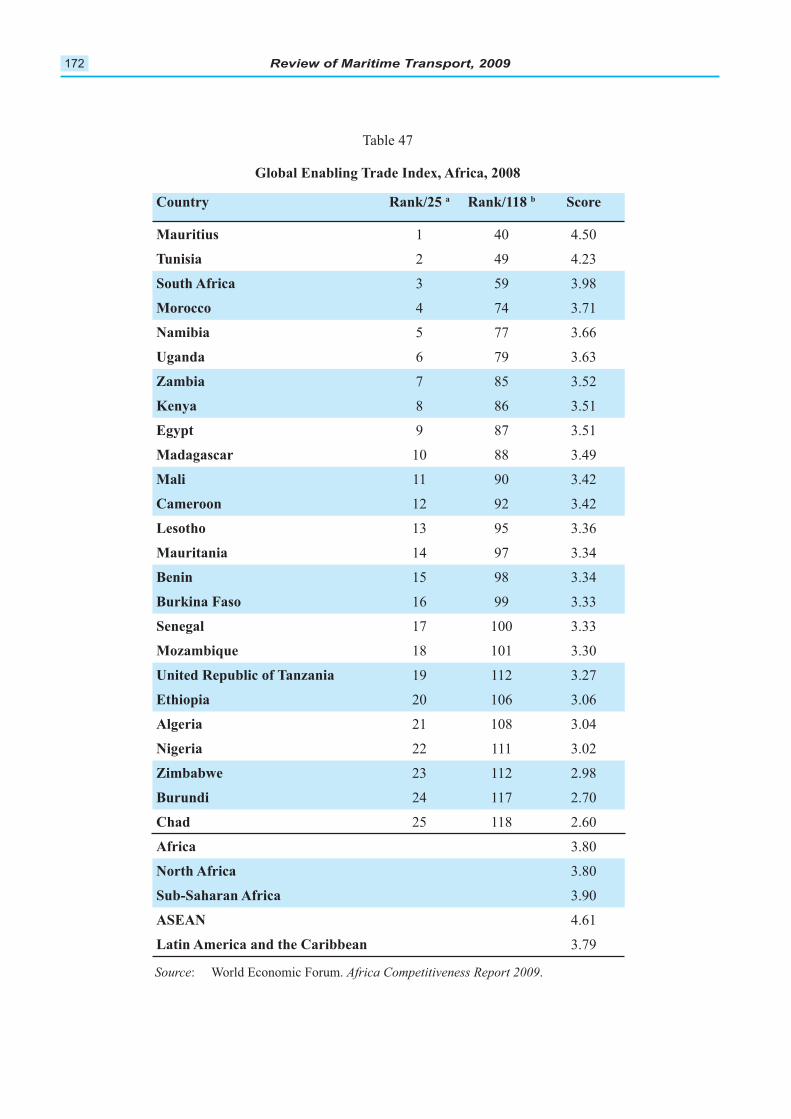
Review of Maritime Transport, 2009172
Country Rank/25 a Rank/118 b Score
Mauritius
Tunisia
South Africa
Morocco
Namibia
Uganda
Zambia
Kenya
Egypt
Madagascar
Mali
Cameroon
Lesotho
Mauritania
Benin
Burkina Faso
Senegal
Mozambique
United Republic of Tanzania
Ethiopia
Algeria
Nigeria
Zimbabwe
Burundi
Chad
Africa
North Africa
Sub-Saharan Africa
ASEAN
Latin America and the Caribbean
Global Enabling Trade Index, Africa, 2008
Source Africa Competitiveness Report 2009
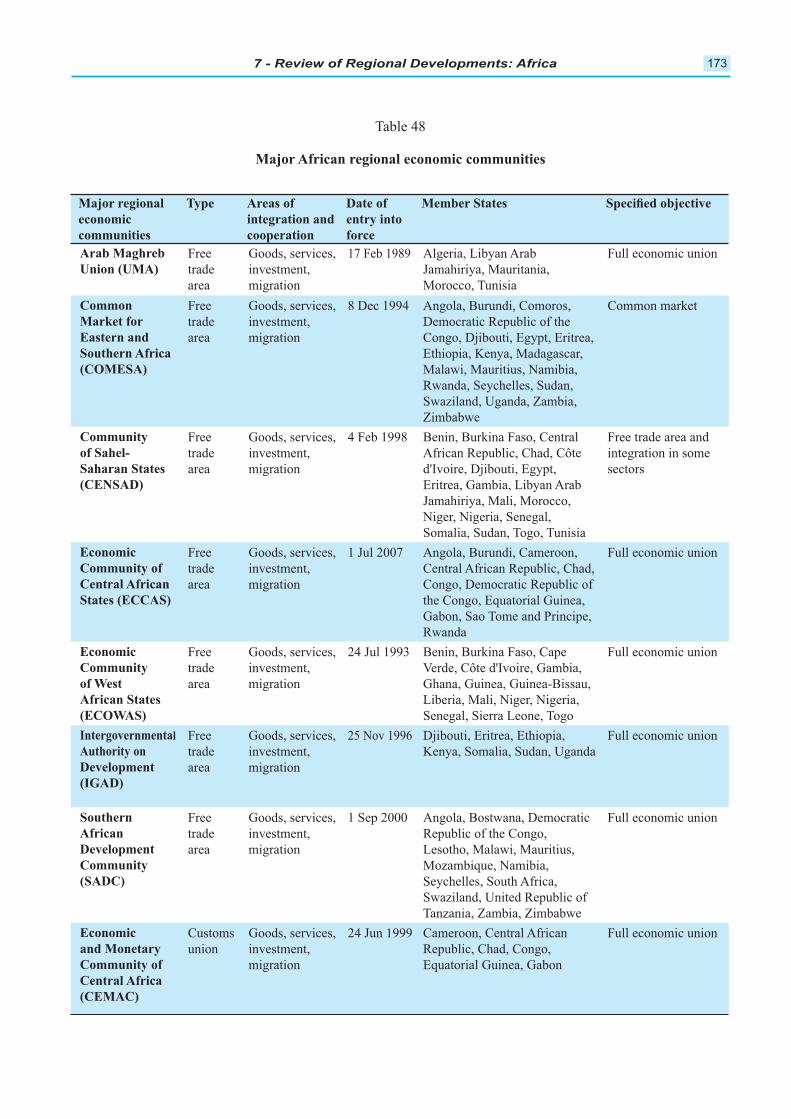
7 - Review of Regional Developments: Africa 173
Major regional
economic
communities
Type Areas of
integration and
cooperation
Date of
entry into
force
Member States
Arab Maghreb
Union (UMA)
Common
Market for
Eastern and
Southern Africa
(COMESA)
Community
of Sahel-
Saharan States
(CENSAD)
Economic
Community of
Central African
States (ECCAS)
Economic
Community
of West
African States
(ECOWAS)
Intergovernmental
Authority on
Development
(IGAD)
Southern
African
Development
Community
(SADC)
Economic
and Monetary
Community of
Central Africa
(CEMAC)
Major African regional economic communities
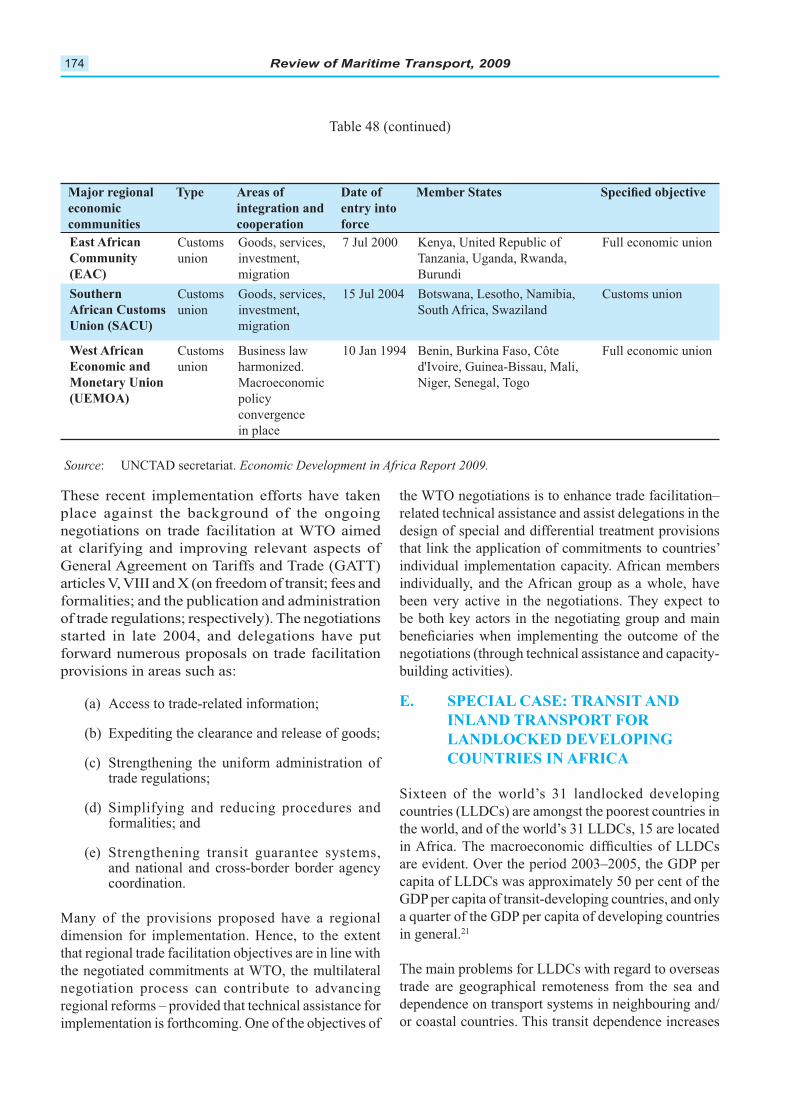
Review of Maritime Transport, 2009174
Major regional
economic
communities
Type Areas of
integration and
cooperation
Date of
entry into
force
Member States
East African
Community
(EAC)
Southern
African Customs
Union (SACU)
West African
Economic and
Monetary Union
(UEMOA)
Source Economic Development in Africa Report 2009.
SPECIAL CASE: TRANSIT ANDE.
INLAND TRANSPORT FOR
LANDLOCKED DEVELOPING
COUNTRIES IN AFRICA
7 - Review of Regional Developments: Africa 175
cost in freight transport
in transportation time.
Countries such as Burundi,
the Central African
spend an average of 15
per cent of their export
earnings on transport, and
for some this cost is as
high as 50 per cent.
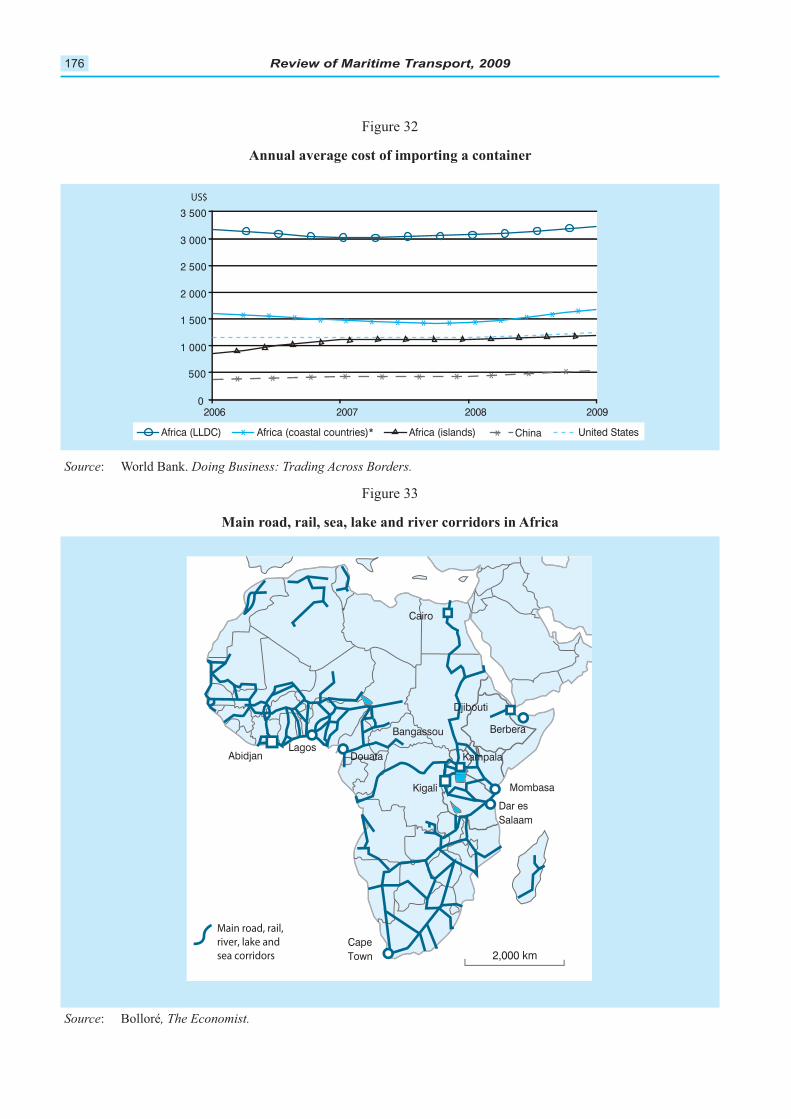
Review of Maritime Transport, 2009176
Main road, rail, sea, lake and river corridors in Africa
Main road, rail,river, lake andsea corridors 2,000 km
AbidjanLagos
Mombasa
Dar esSalaam
CapeTown
Kigali
Cairo
Berbera
Djibouti
Bangassou
KampalaDouata
Annual average cost of importing a container
Source Doing Business: Trading Across Borders.
0
500
1 000
1 500
2 000
2 500
3 000
3 500
2006 2007 2008 2009
Africa (LLDC) Africa (coastal countries)* Africa (islands) China United States
*
* * * * * * * * * *
**
* * * * * * * * * * * * *
US$
Source , The Economist.
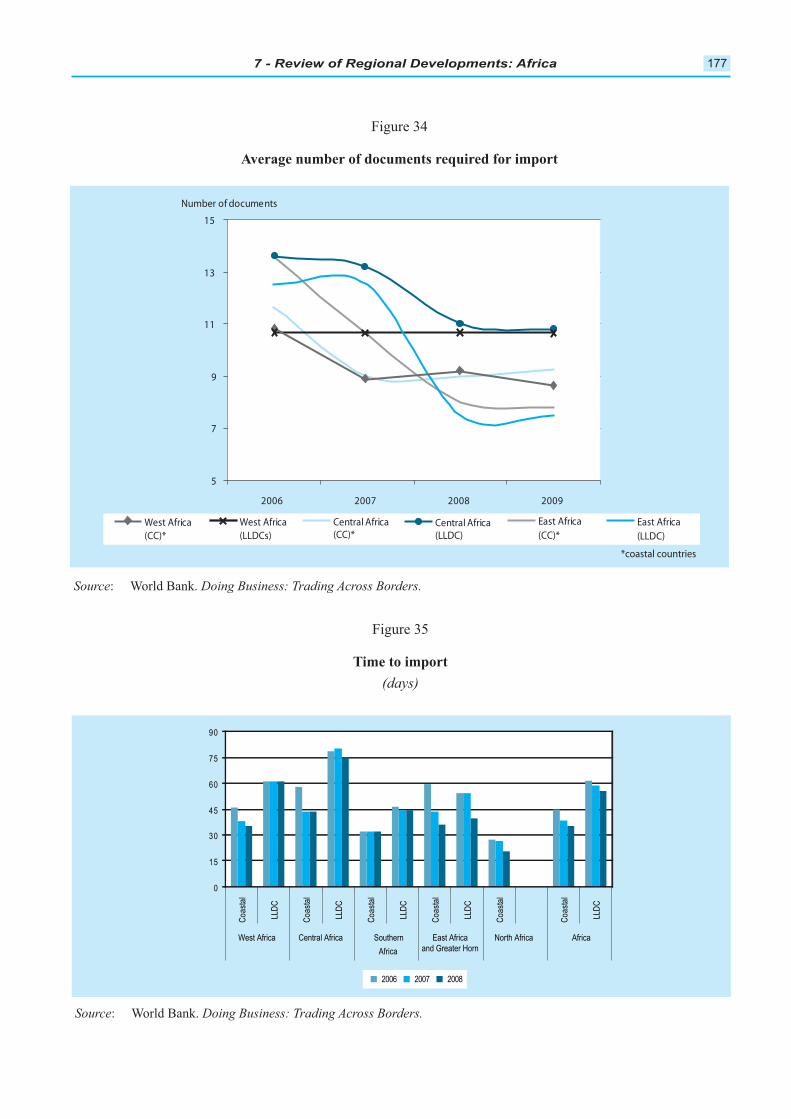
7 - Review of Regional Developments: Africa 177
Average number of documents required for import
Source Doing Business: Trading Across Borders.
5
7
9
11
13
15
2006 2007 2008 2009
Number of documents
West Africa(CC)*
West Africa(LLDCs)
Central Africa(CC)*
Central Africa(LLDC)
East Africa(CC)*
East Africa(LLDC)
*coastal countries
Time to import
(days)
Source Doing Business: Trading Across Borders.
0
15
30
45
60
75
90
Coas
tal
LLDC
Coas
tal
LLDC
Coas
tal
LLDC
Coas
tal
LLDC
Coas
tal
Coas
tal
LLDC
West Africa Central Africa SouthernAfrica
East Africaand Greater Horn
North Africa Africa
2006 2007 2008
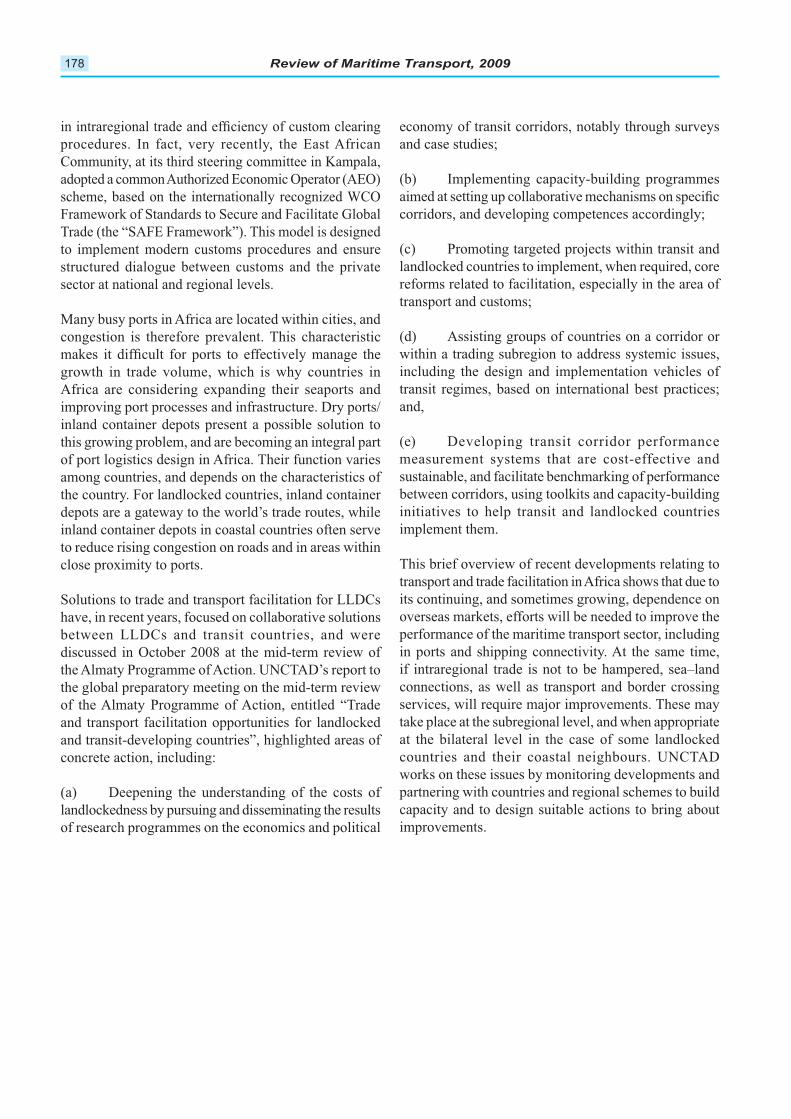
Review of Maritime Transport, 2009178
7 - Review of Regional Developments: Africa 179
ENDNOTES
Regional Economic Outlook: Sub-Saharan Africa.
The Statesman
Containerisation International Online
Economic Development in Africa Report 2009
Economic Development in
Africa Report 2009
Containerisation International Online
The Independent
Containerisation International Online

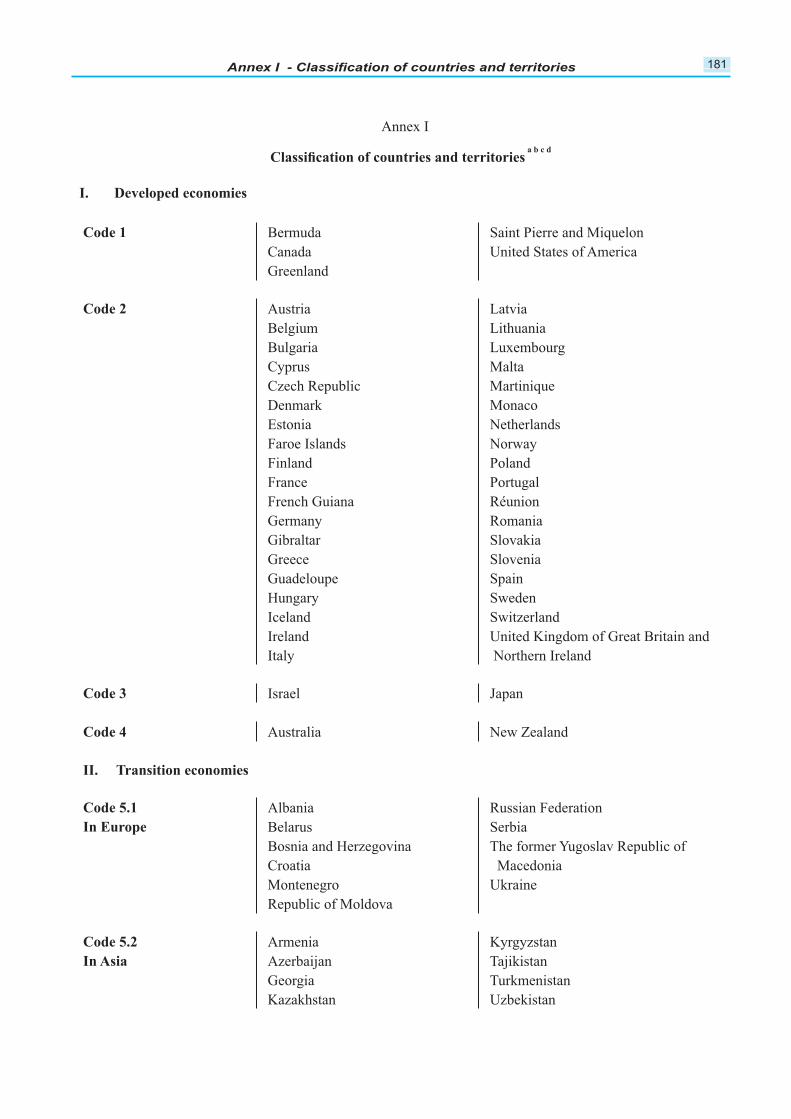
181
Annex I
Bermuda Saint Pierre and Miquelon
Canada United States of America
Greenland
Austria Latvia
Belgium Lithuania
Bulgaria Luxembourg
Cyprus Malta
Czech Republic Martinique
Denmark Monaco
Estonia Netherlands
Faroe Islands Norway
Finland Poland
France Portugal
French Guiana Réunion
Germany Romania
Gibraltar Slovakia
Greece Slovenia
Guadeloupe Spain
Hungary Sweden
Iceland Switzerland
Ireland United Kingdom of Great Britain and
Italy Northern Ireland
Israel Japan
Australia New Zealand
Albania Russian Federation
Belarus Serbia
Bosnia and Herzegovina The former Yugoslav Republic of
Croatia Macedonia
Montenegro Ukraine
Republic of Moldova
Armenia Kyrgyzstan
Azerbaijan Tajikistan
Georgia Turkmenistan
Kazakhstan Uzbekistan
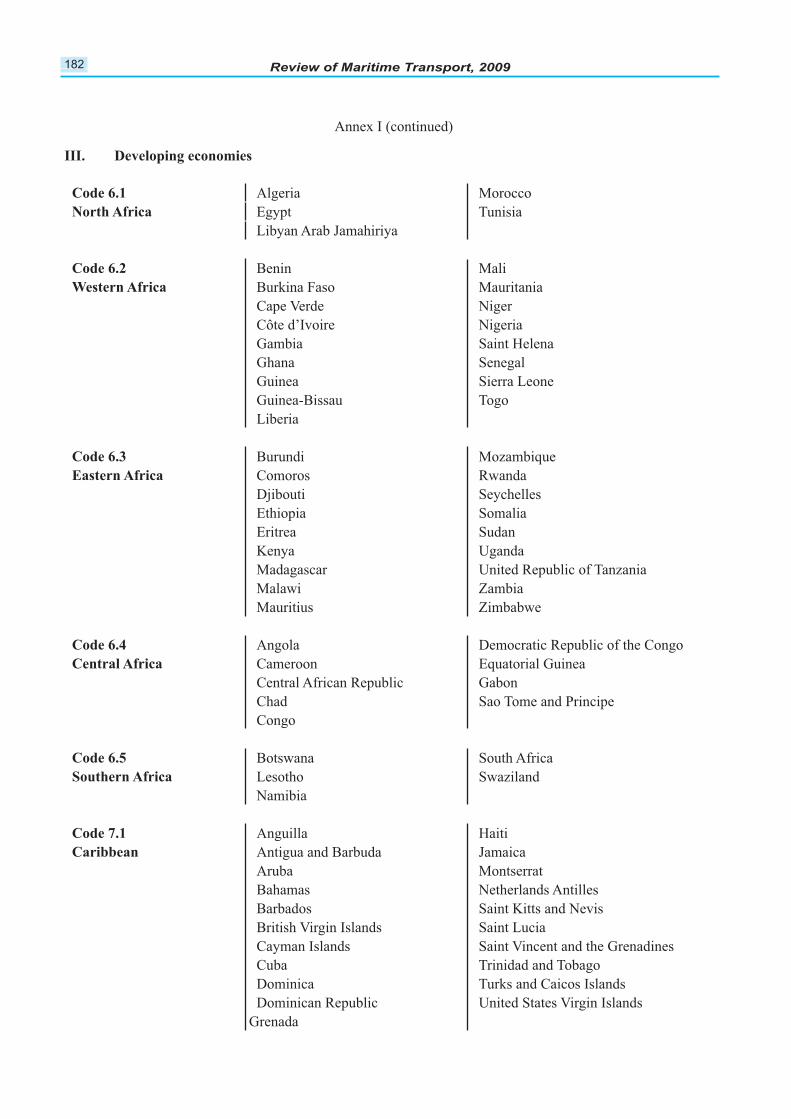
182
Annex I (continued)
Algeria Morocco
Egypt Tunisia
Libyan Arab Jamahiriya
Benin Mali
Burkina Faso Mauritania
Cape Verde Niger
Côte d’Ivoire Nigeria
Gambia Saint Helena
Ghana Senegal
Guinea Sierra Leone
Guinea-Bissau Togo
Liberia
Burundi Mozambique
Comoros Rwanda
Djibouti Seychelles
Ethiopia Somalia
Eritrea Sudan
Kenya Uganda
Madagascar United Republic of Tanzania
Malawi Zambia
Mauritius Zimbabwe
Angola Democratic Republic of the Congo
Cameroon Equatorial Guinea
Central African Republic Gabon
Chad Sao Tome and Principe
Congo
Botswana South Africa
Lesotho Swaziland
Namibia
Anguilla Haiti
Antigua and Barbuda Jamaica
Aruba Montserrat
Bahamas Netherlands Antilles
Barbados Saint Kitts and Nevis
British Virgin Islands Saint Lucia
Cayman Islands Saint Vincent and the Grenadines
Cuba Trinidad and Tobago
Dominica Turks and Caicos Islands
Dominican Republic United States Virgin Islands
Grenada
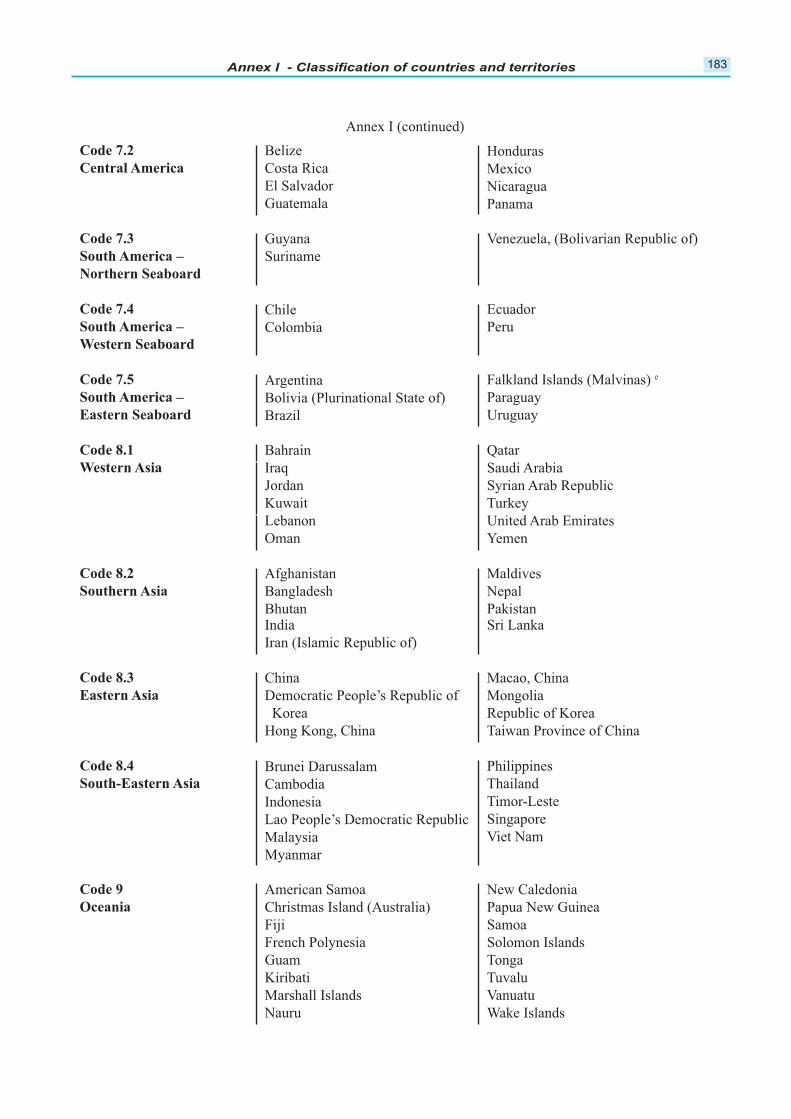
183
Annex I (continued)
Belize Honduras
Costa Rica Mexico
El Salvador Nicaragua
Guatemala Panama
Guyana Venezuela, (Bolivarian Republic of)
Suriname
Chile Ecuador
Colombia Peru
Argentina Falkland Islands (Malvinas) e
Bolivia (Plurinational State of) Paraguay
Brazil Uruguay
Bahrain Qatar
Iraq Saudi Arabia
Jordan Syrian Arab Republic
Kuwait Turkey
Lebanon United Arab Emirates
Oman Yemen
Afghanistan Maldives
Bangladesh Nepal
Bhutan PakistanIndia Sri Lanka
Iran (Islamic Republic of)
China Macao, China
Democratic People’s Republic of Mongolia
Korea Republic of Korea
Hong Kong, China Taiwan Province of China
Brunei Darussalam Philippines
Cambodia Thailand
Indonesia Timor-Leste
Lao People’s Democratic Republic Singapore
Malaysia Viet Nam
Myanmar
American Samoa New Caledonia
Christmas Island (Australia) Papua New Guinea
Fiji Samoa
French Polynesia Solomon Islands
Guam Tonga
Kiribati Tuvalu
Marshall Islands Vanuatu
Nauru Wake Islands
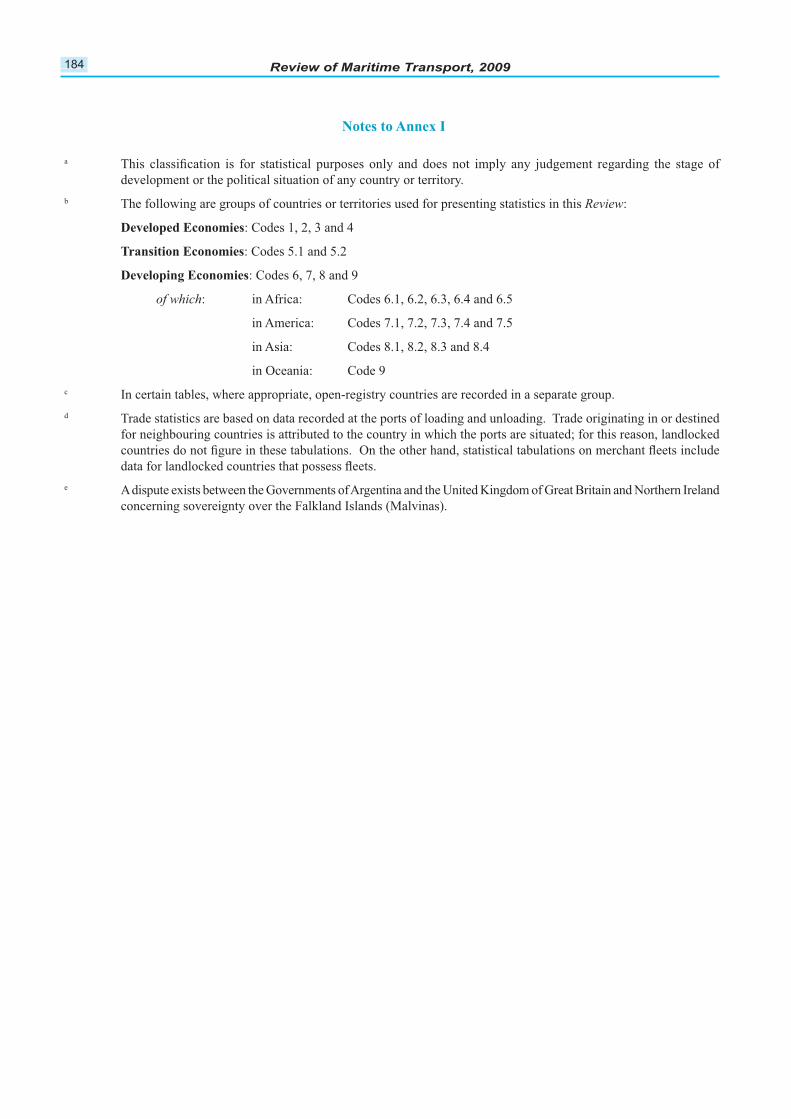
184
a
development or the political situation of any country or territory.
b The following are groups of countries or territories used for presenting statistics in this Review:
: Codes 1, 2, 3 and 4
: Codes 5.1 and 5.2
: Codes 6, 7, 8 and 9
of which: in Africa: Codes 6.1, 6.2, 6.3, 6.4 and 6.5
in America: Codes 7.1, 7.2, 7.3, 7.4 and 7.5
in Asia: Codes 8.1, 8.2, 8.3 and 8.4
in Oceania: Code 9
c In certain tables, where appropriate, open-registry countries are recorded in a separate group.
d Trade statistics are based on data recorded at the ports of loading and unloading. Trade originating in or destined
for neighbouring countries is attributed to the country in which the ports are situated; for this reason, landlocked
e A dispute exists between the Governments of Argentina and the United Kingdom of Great Britain and Northern Ireland
concerning sovereignty over the Falkland Islands (Malvinas).
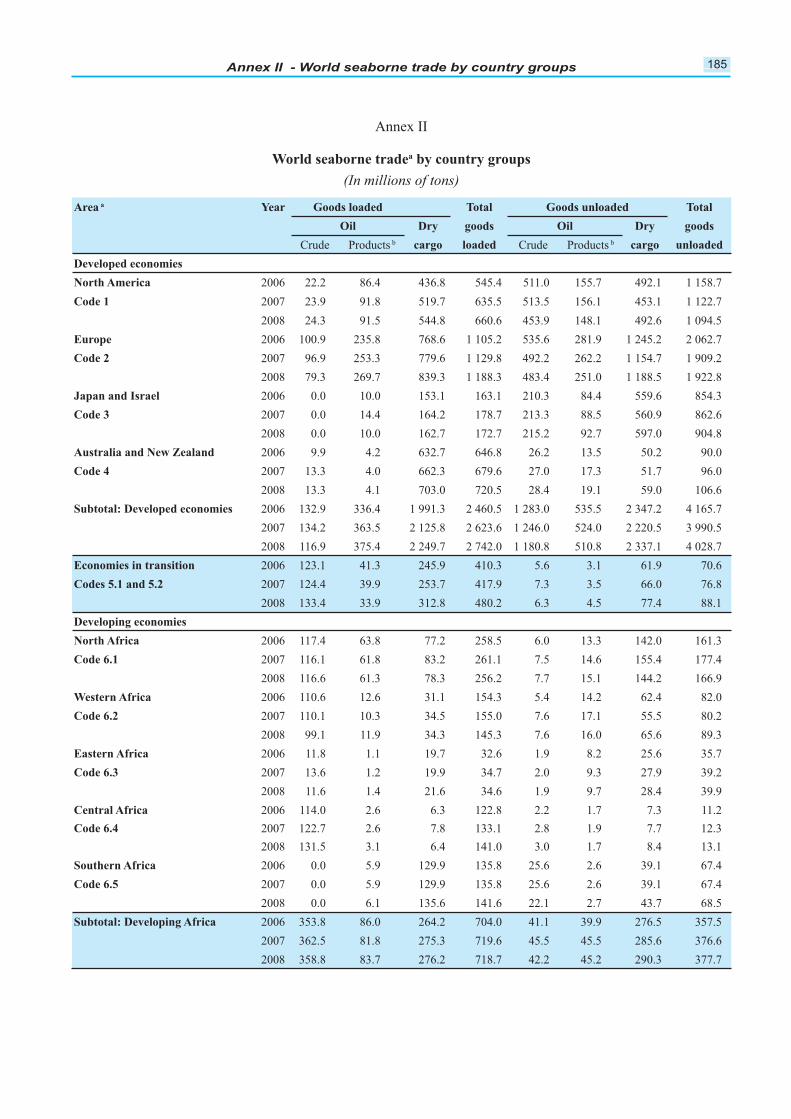
185Annex II - World seaborne trade by country groups
Annex II
World seaborne tradea by country groups
(In millions of tons)
Area a Year Goods loaded Total Goods unloaded Total
Oil Dry goods Oil Dry goods
Crude Products b cargo loaded Crude Products b cargo unloaded
Developed economies
North America 2006 22.2 86.4 436.8 545.4 511.0 155.7 492.1 1 158.7
Code 1 2007 23.9 91.8 519.7 635.5 513.5 156.1 453.1 1 122.7
2008 24.3 91.5 544.8 660.6 453.9 148.1 492.6 1 094.5
Europe 2006 100.9 235.8 768.6 1 105.2 535.6 281.9 1 245.2 2 062.7
Code 2 2007 96.9 253.3 779.6 1 129.8 492.2 262.2 1 154.7 1 909.2
2008 79.3 269.7 839.3 1 188.3 483.4 251.0 1 188.5 1 922.8
Japan and Israel 2006 0.0 10.0 153.1 163.1 210.3 84.4 559.6 854.3
Code 3 2007 0.0 14.4 164.2 178.7 213.3 88.5 560.9 862.6
2008 0.0 10.0 162.7 172.7 215.2 92.7 597.0 904.8
Australia and New Zealand 2006 9.9 4.2 632.7 646.8 26.2 13.5 50.2 90.0
Code 4 2007 13.3 4.0 662.3 679.6 27.0 17.3 51.7 96.0
2008 13.3 4.1 703.0 720.5 28.4 19.1 59.0 106.6
Subtotal: Developed economies 2006 132.9 336.4 1 991.3 2 460.5 1 283.0 535.5 2 347.2 4 165.7
2007 134.2 363.5 2 125.8 2 623.6 1 246.0 524.0 2 220.5 3 990.5
2008 116.9 375.4 2 249.7 2 742.0 1 180.8 510.8 2 337.1 4 028.7
Economies in transition 2006 123.1 41.3 245.9 410.3 5.6 3.1 61.9 70.6
Codes 5.1 and 5.2 2007 124.4 39.9 253.7 417.9 7.3 3.5 66.0 76.8
2008 133.4 33.9 312.8 480.2 6.3 4.5 77.4 88.1
Developing economies
North Africa 2006 117.4 63.8 77.2 258.5 6.0 13.3 142.0 161.3
Code 6.1 2007 116.1 61.8 83.2 261.1 7.5 14.6 155.4 177.4
2008 116.6 61.3 78.3 256.2 7.7 15.1 144.2 166.9
Western Africa 2006 110.6 12.6 31.1 154.3 5.4 14.2 62.4 82.0
Code 6.2 2007 110.1 10.3 34.5 155.0 7.6 17.1 55.5 80.2
2008 99.1 11.9 34.3 145.3 7.6 16.0 65.6 89.3
Eastern Africa 2006 11.8 1.1 19.7 32.6 1.9 8.2 25.6 35.7
Code 6.3 2007 13.6 1.2 19.9 34.7 2.0 9.3 27.9 39.2
2008 11.6 1.4 21.6 34.6 1.9 9.7 28.4 39.9
Central Africa 2006 114.0 2.6 6.3 122.8 2.2 1.7 7.3 11.2
Code 6.4 2007 122.7 2.6 7.8 133.1 2.8 1.9 7.7 12.3
2008 131.5 3.1 6.4 141.0 3.0 1.7 8.4 13.1
Southern Africa 2006 0.0 5.9 129.9 135.8 25.6 2.6 39.1 67.4
Code 6.5 2007 0.0 5.9 129.9 135.8 25.6 2.6 39.1 67.4
2008 0.0 6.1 135.6 141.6 22.1 2.7 43.7 68.5
Subtotal: Developing Africa 2006 353.8 86.0 264.2 704.0 41.1 39.9 276.5 357.5
2007 362.5 81.8 275.3 719.6 45.5 45.5 285.6 376.6
2008 358.8 83.7 276.2 718.7 42.2 45.2 290.3 377.7
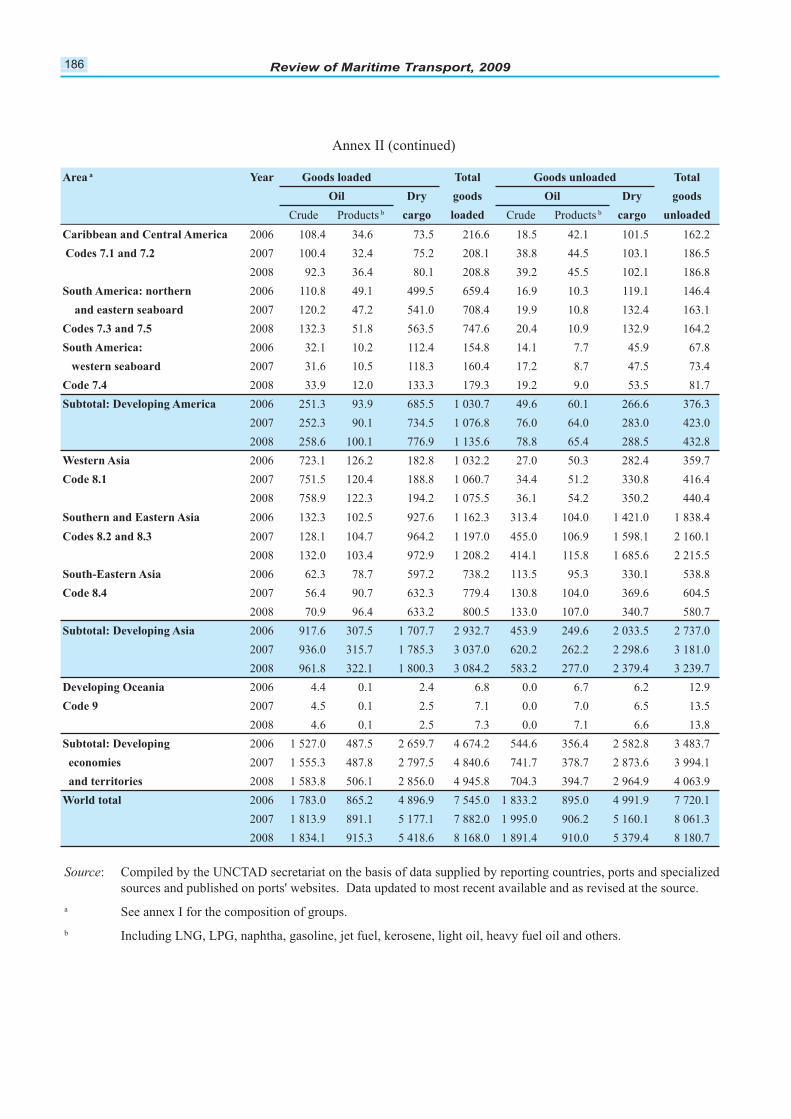
186 Review of Maritime Transport, 2009
Annex II (continued)
Area a Year Goods loaded Total Goods unloaded Total
Oil Dry goods Oil Dry goods
Crude Products b cargo loaded Crude Products b cargo unloaded
Caribbean and Central America 2006 108.4 34.6 73.5 216.6 18.5 42.1 101.5 162.2
Codes 7.1 and 7.2 2007 100.4 32.4 75.2 208.1 38.8 44.5 103.1 186.5
2008 92.3 36.4 80.1 208.8 39.2 45.5 102.1 186.8
South America: northern 2006 110.8 49.1 499.5 659.4 16.9 10.3 119.1 146.4
and eastern seaboard 2007 120.2 47.2 541.0 708.4 19.9 10.8 132.4 163.1
Codes 7.3 and 7.5 2008 132.3 51.8 563.5 747.6 20.4 10.9 132.9 164.2
South America: 2006 32.1 10.2 112.4 154.8 14.1 7.7 45.9 67.8
western seaboard 2007 31.6 10.5 118.3 160.4 17.2 8.7 47.5 73.4
Code 7.4 2008 33.9 12.0 133.3 179.3 19.2 9.0 53.5 81.7
Subtotal: Developing America 2006 251.3 93.9 685.5 1 030.7 49.6 60.1 266.6 376.3
2007 252.3 90.1 734.5 1 076.8 76.0 64.0 283.0 423.0
2008 258.6 100.1 776.9 1 135.6 78.8 65.4 288.5 432.8
Western Asia 2006 723.1 126.2 182.8 1 032.2 27.0 50.3 282.4 359.7
Code 8.1 2007 751.5 120.4 188.8 1 060.7 34.4 51.2 330.8 416.4
2008 758.9 122.3 194.2 1 075.5 36.1 54.2 350.2 440.4
Southern and Eastern Asia 2006 132.3 102.5 927.6 1 162.3 313.4 104.0 1 421.0 1 838.4
Codes 8.2 and 8.3 2007 128.1 104.7 964.2 1 197.0 455.0 106.9 1 598.1 2 160.1
2008 132.0 103.4 972.9 1 208.2 414.1 115.8 1 685.6 2 215.5
South-Eastern Asia 2006 62.3 78.7 597.2 738.2 113.5 95.3 330.1 538.8
Code 8.4 2007 56.4 90.7 632.3 779.4 130.8 104.0 369.6 604.5
2008 70.9 96.4 633.2 800.5 133.0 107.0 340.7 580.7
Subtotal: Developing Asia 2006 917.6 307.5 1 707.7 2 932.7 453.9 249.6 2 033.5 2 737.0
2007 936.0 315.7 1 785.3 3 037.0 620.2 262.2 2 298.6 3 181.0
2008 961.8 322.1 1 800.3 3 084.2 583.2 277.0 2 379.4 3 239.7
Developing Oceania 2006 4.4 0.1 2.4 6.8 0.0 6.7 6.2 12.9
Code 9 2007 4.5 0.1 2.5 7.1 0.0 7.0 6.5 13.5
2008 4.6 0.1 2.5 7.3 0.0 7.1 6.6 13.8
Subtotal: Developing 2006 1 527.0 487.5 2 659.7 4 674.2 544.6 356.4 2 582.8 3 483.7
economies 2007 1 555.3 487.8 2 797.5 4 840.6 741.7 378.7 2 873.6 3 994.1
and territories 2008 1 583.8 506.1 2 856.0 4 945.8 704.3 394.7 2 964.9 4 063.9
World total 2006 1 783.0 865.2 4 896.9 7 545.0 1 833.2 895.0 4 991.9 7 720.1
2007 1 813.9 891.1 5 177.1 7 882.0 1 995.0 906.2 5 160.1 8 061.3
2008 1 834.1 915.3 5 418.6 8 168.0 1 891.4 910.0 5 379.4 8 180.7
Source: Compiled by the UNCTAD secretariat on the basis of data supplied by reporting countries, ports and specialized
sources and published on ports' websites. Data updated to most recent available and as revised at the source.
a See annex I for the composition of groups.
b Including LNG, LPG, naphtha, gasoline, jet fuel, kerosene, light oil, heavy fuel oil and others.
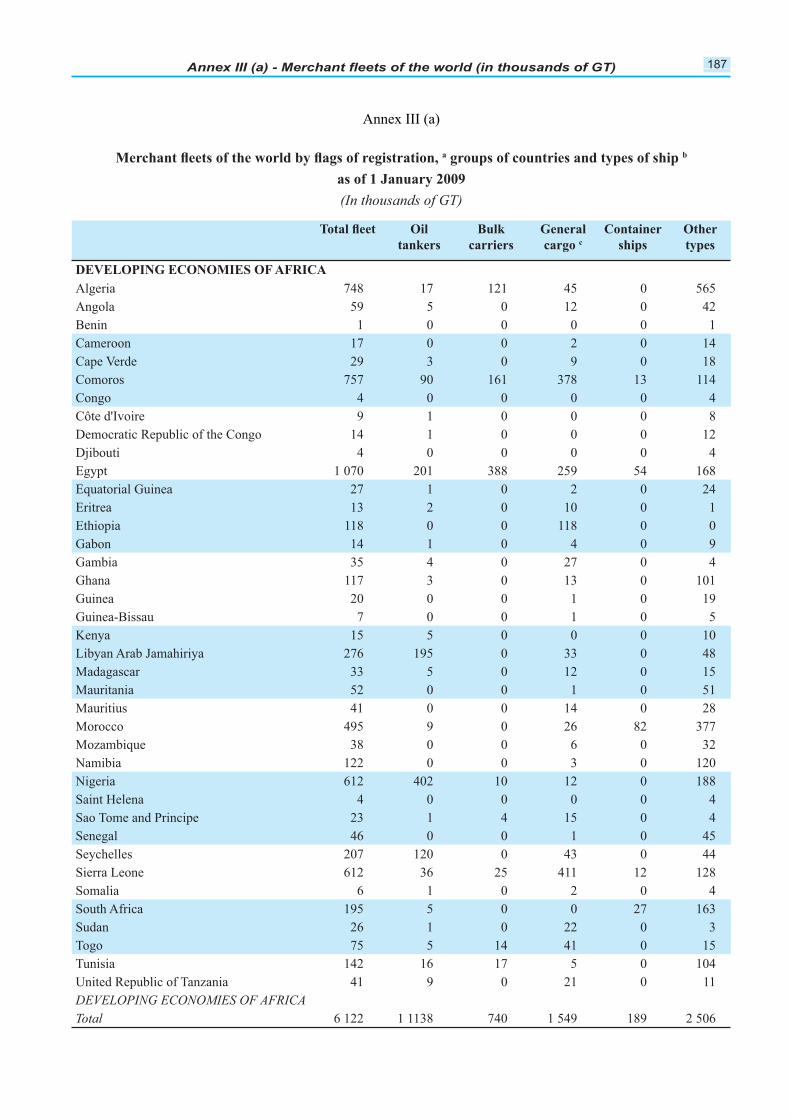
187
Annex III (a)
a
(In thousands of GT)
c
Other
DEVELOPING ECONOMIES OF AFRICA
Algeria 748 17 121 45 0 565
Angola 59 5 0 12 0 42
Benin 1 0 0 0 0 1
Cameroon 17 0 0 2 0 14
Cape Verde 29 3 0 9 0 18
Comoros 757 90 161 378 13 114
Congo 4 0 0 0 0 4
Côte d'Ivoire 9 1 0 0 0 8
Democratic Republic of the Congo 14 1 0 0 0 12
Djibouti 4 0 0 0 0 4
Egypt 1 070 201 388 259 54 168
Equatorial Guinea 27 1 0 2 0 24
Eritrea 13 2 0 10 0 1
Ethiopia 118 0 0 118 0 0
Gabon 14 1 0 4 0 9
Gambia 35 4 0 27 0 4
Ghana 117 3 0 13 0 101
Guinea 20 0 0 1 0 19
Guinea-Bissau 7 0 0 1 0 5
Kenya 15 5 0 0 0 10
Libyan Arab Jamahiriya 276 195 0 33 0 48
Madagascar 33 5 0 12 0 15
Mauritania 52 0 0 1 0 51
Mauritius 41 0 0 14 0 28
Morocco 495 9 0 26 82 377
Mozambique 38 0 0 6 0 32
Namibia 122 0 0 3 0 120
Nigeria 612 402 10 12 0 188
Saint Helena 4 0 0 0 0 4
Sao Tome and Principe 23 1 4 15 0 4
Senegal 46 0 0 1 0 45
Seychelles 207 120 0 43 0 44
Sierra Leone 612 36 25 411 12 128
Somalia 6 1 0 2 0 4
South Africa 195 5 0 0 27 163
Sudan 26 1 0 22 0 3
Togo 75 5 14 41 0 15
Tunisia 142 16 17 5 0 104
United Republic of Tanzania 41 9 0 21 0 11
DEVELOPING ECONOMIES OF AFRICA
Total 6 122 1 1138 740 1 549 189 2 506
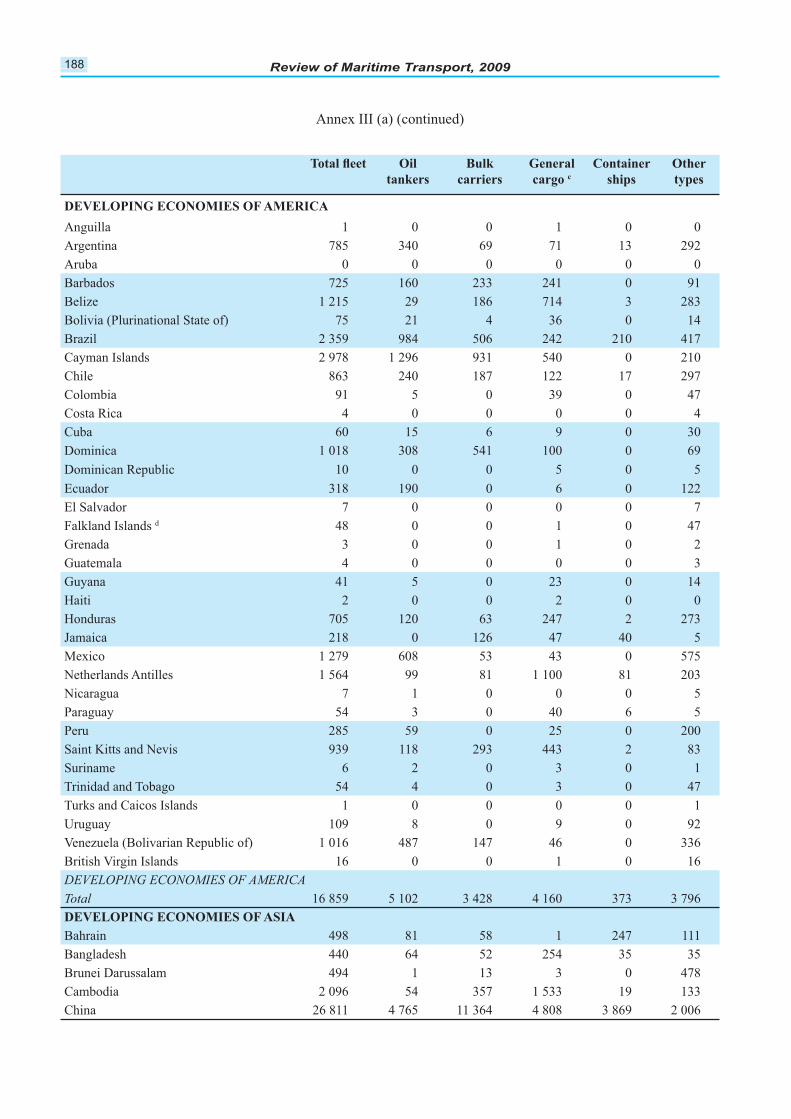
188
Annex III (a) (continued)
c
Other
DEVELOPING ECONOMIES OF AMERICA
Anguilla 1 0 0 1 0 0
Argentina 785 340 69 71 13 292
Aruba 0 0 0 0 0 0
Barbados 725 160 233 241 0 91
Belize 1 215 29 186 714 3 283
Bolivia (Plurinational State of) 75 21 4 36 0 14
Brazil 2 359 984 506 242 210 417
Cayman Islands 2 978 1 296 931 540 0 210
Chile 863 240 187 122 17 297
Colombia 91 5 0 39 0 47
Costa Rica 4 0 0 0 0 4
Cuba 60 15 6 9 0 30
Dominica 1 018 308 541 100 0 69
Dominican Republic 10 0 0 5 0 5
Ecuador 318 190 0 6 0 122
El Salvador 7 0 0 0 0 7
Falkland Islands d 48 0 0 1 0 47
Grenada 3 0 0 1 0 2
Guatemala 4 0 0 0 0 3
Guyana 41 5 0 23 0 14
Haiti 2 0 0 2 0 0
Honduras 705 120 63 247 2 273
Jamaica 218 0 126 47 40 5
Mexico 1 279 608 53 43 0 575
Netherlands Antilles 1 564 99 81 1 100 81 203
Nicaragua 7 1 0 0 0 5
Paraguay 54 3 0 40 6 5
Peru 285 59 0 25 0 200
Saint Kitts and Nevis 939 118 293 443 2 83
Suriname 6 2 0 3 0 1
Trinidad and Tobago 54 4 0 3 0 47
Turks and Caicos Islands 1 0 0 0 0 1
Uruguay 109 8 0 9 0 92
Venezuela (Bolivarian Republic of) 1 016 487 147 46 0 336
British Virgin Islands 16 0 0 1 0 16
DEVELOPING ECONOMIES OF AMERICA
Total 16 859 5 102 3 428 4 160 373 3 796
DEVELOPING ECONOMIES OF ASIA
Bahrain 498 81 58 1 247 111
Bangladesh 440 64 52 254 35 35
Brunei Darussalam 494 1 13 3 0 478
Cambodia 2 096 54 357 1 533 19 133
China 26 811 4 765 11 364 4 808 3 869 2 006
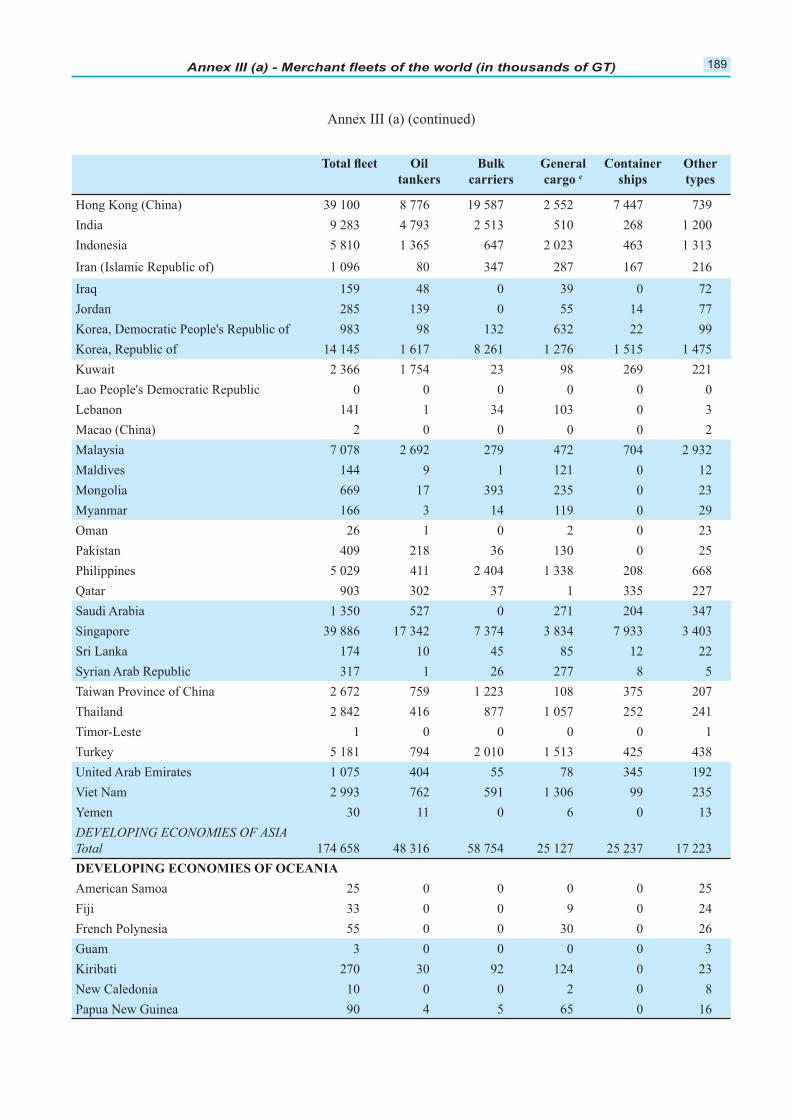
189
Annex III (a) (continued)
c
Other
Hong Kong (China) 39 100 8 776 19 587 2 552 7 447 739
India 9 283 4 793 2 513 510 268 1 200
Indonesia 5 810 1 365 647 2 023 463 1 313
Iran (Islamic Republic of) 1 096 80 347 287 167 216
Iraq 159 48 0 39 0 72
Jordan 285 139 0 55 14 77
Korea, Democratic People's Republic of 983 98 132 632 22 99
Korea, Republic of 14 145 1 617 8 261 1 276 1 515 1 475
Kuwait 2 366 1 754 23 98 269 221
Lao People's Democratic Republic 0 0 0 0 0 0
Lebanon 141 1 34 103 0 3
Macao (China) 2 0 0 0 0 2
Malaysia 7 078 2 692 279 472 704 2 932
Maldives 144 9 1 121 0 12
Mongolia 669 17 393 235 0 23
Myanmar 166 3 14 119 0 29
Oman 26 1 0 2 0 23
Pakistan 409 218 36 130 0 25
Philippines 5 029 411 2 404 1 338 208 668
Qatar 903 302 37 1 335 227
Saudi Arabia 1 350 527 0 271 204 347
Singapore 39 886 17 342 7 374 3 834 7 933 3 403
Sri Lanka 174 10 45 85 12 22
Syrian Arab Republic 317 1 26 277 8 5
Taiwan Province of China 2 672 759 1 223 108 375 207
Thailand 2 842 416 877 1 057 252 241
Timor-Leste 1 0 0 0 0 1
Turkey 5 181 794 2 010 1 513 425 438
United Arab Emirates 1 075 404 55 78 345 192
Viet Nam 2 993 762 591 1 306 99 235
Yemen 30 11 0 6 0 13
DEVELOPING ECONOMIES OF ASIA
Total 174 658 48 316 58 754 25 127 25 237 17 223
DEVELOPING ECONOMIES OF OCEANIA
American Samoa 25 0 0 0 0 25
Fiji 33 0 0 9 0 24
French Polynesia 55 0 0 30 0 26
Guam 3 0 0 0 0 3
Kiribati 270 30 92 124 0 23
New Caledonia 10 0 0 2 0 8
Papua New Guinea 90 4 5 65 0 16
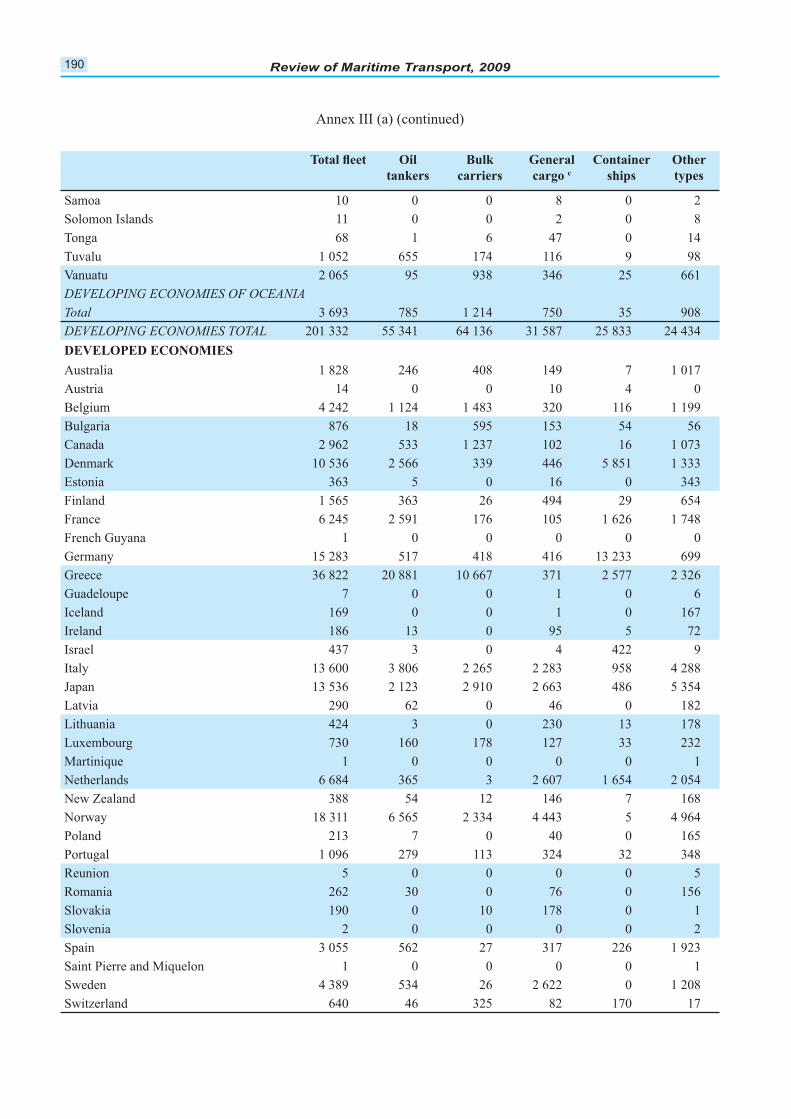
190
c
Other
Samoa 10 0 0 8 0 2
Solomon Islands 11 0 0 2 0 8
Tonga 68 1 6 47 0 14
Tuvalu 1 052 655 174 116 9 98
Vanuatu 2 065 95 938 346 25 661
DEVELOPING ECONOMIES OF OCEANIA
Total 3 693 785 1 214 750 35 908
DEVELOPING ECONOMIES TOTAL 201 332 55 341 64 136 31 587 25 833 24 434
DEVELOPED ECONOMIES
Australia 1 828 246 408 149 7 1 017
Austria 14 0 0 10 4 0
Belgium 4 242 1 124 1 483 320 116 1 199
Bulgaria 876 18 595 153 54 56
Canada 2 962 533 1 237 102 16 1 073
Denmark 10 536 2 566 339 446 5 851 1 333
Estonia 363 5 0 16 0 343
Finland 1 565 363 26 494 29 654
France 6 245 2 591 176 105 1 626 1 748
French Guyana 1 0 0 0 0 0
Germany 15 283 517 418 416 13 233 699
Greece 36 822 20 881 10 667 371 2 577 2 326
Guadeloupe 7 0 0 1 0 6
Iceland 169 0 0 1 0 167
Ireland 186 13 0 95 5 72
Israel 437 3 0 4 422 9
Italy 13 600 3 806 2 265 2 283 958 4 288
Japan 13 536 2 123 2 910 2 663 486 5 354
Latvia 290 62 0 46 0 182
Lithuania 424 3 0 230 13 178
Luxembourg 730 160 178 127 33 232
Martinique 1 0 0 0 0 1
Netherlands 6 684 365 3 2 607 1 654 2 054
New Zealand 388 54 12 146 7 168
Norway 18 311 6 565 2 334 4 443 5 4 964
Poland 213 7 0 40 0 165
Portugal 1 096 279 113 324 32 348
Reunion 5 0 0 0 0 5
Romania 262 30 0 76 0 156
Slovakia 190 0 10 178 0 1
Slovenia 2 0 0 0 0 2
Spain 3 055 562 27 317 226 1 923
Saint Pierre and Miquelon 1 0 0 0 0 1
Sweden 4 389 534 26 2 622 0 1 208
Switzerland 640 46 325 82 170 17
Annex III (a) (continued)
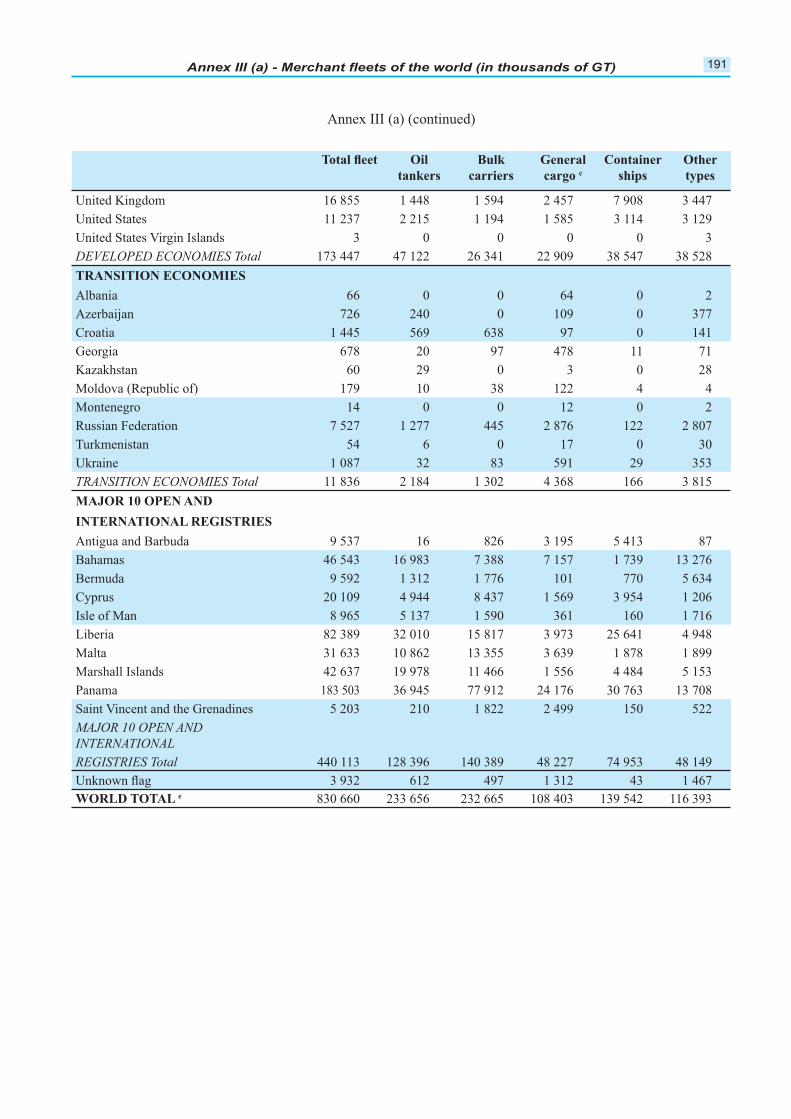
191
c
Other
United Kingdom 16 855 1 448 1 594 2 457 7 908 3 447
United States 11 237 2 215 1 194 1 585 3 114 3 129
United States Virgin Islands 3 0 0 0 0 3
DEVELOPED ECONOMIES Total 173 447 47 122 26 341 22 909 38 547 38 528
TRANSITION ECONOMIES
Albania 66 0 0 64 0 2
Azerbaijan 726 240 0 109 0 377
Croatia 1 445 569 638 97 0 141
Georgia 678 20 97 478 11 71
Kazakhstan 60 29 0 3 0 28
Moldova (Republic of) 179 10 38 122 4 4
Montenegro 14 0 0 12 0 2
Russian Federation 7 527 1 277 445 2 876 122 2 807
Turkmenistan 54 6 0 17 0 30
Ukraine 1 087 32 83 591 29 353
TRANSITION ECONOMIES Total 11 836 2 184 1 302 4 368 166 3 815
INTERNATIONAL REGISTRIES
Antigua and Barbuda 9 537 16 826 3 195 5 413 87
Bahamas 46 543 16 983 7 388 7 157 1 739 13 276
Bermuda 9 592 1 312 1 776 101 770 5 634
Cyprus 20 109 4 944 8 437 1 569 3 954 1 206
Isle of Man 8 965 5 137 1 590 361 160 1 716
Liberia 82 389 32 010 15 817 3 973 25 641 4 948
Malta 31 633 10 862 13 355 3 639 1 878 1 899
Marshall Islands 42 637 19 978 11 466 1 556 4 484 5 153
Panama 183 503 36 945 77 912 24 176 30 763 13 708
Saint Vincent and the Grenadines 5 203 210 1 822 2 499 150 522
MAJOR 10 OPEN AND
INTERNATIONAL
REGISTRIES Total 440 113 128 396 140 389 48 227 74 953 48 149
3 932 612 497 1 312 43 1 467
WORLD TOTAL e 830 660 233 656 232 665 108 403 139 542 116 393
Annex III (a) (continued)

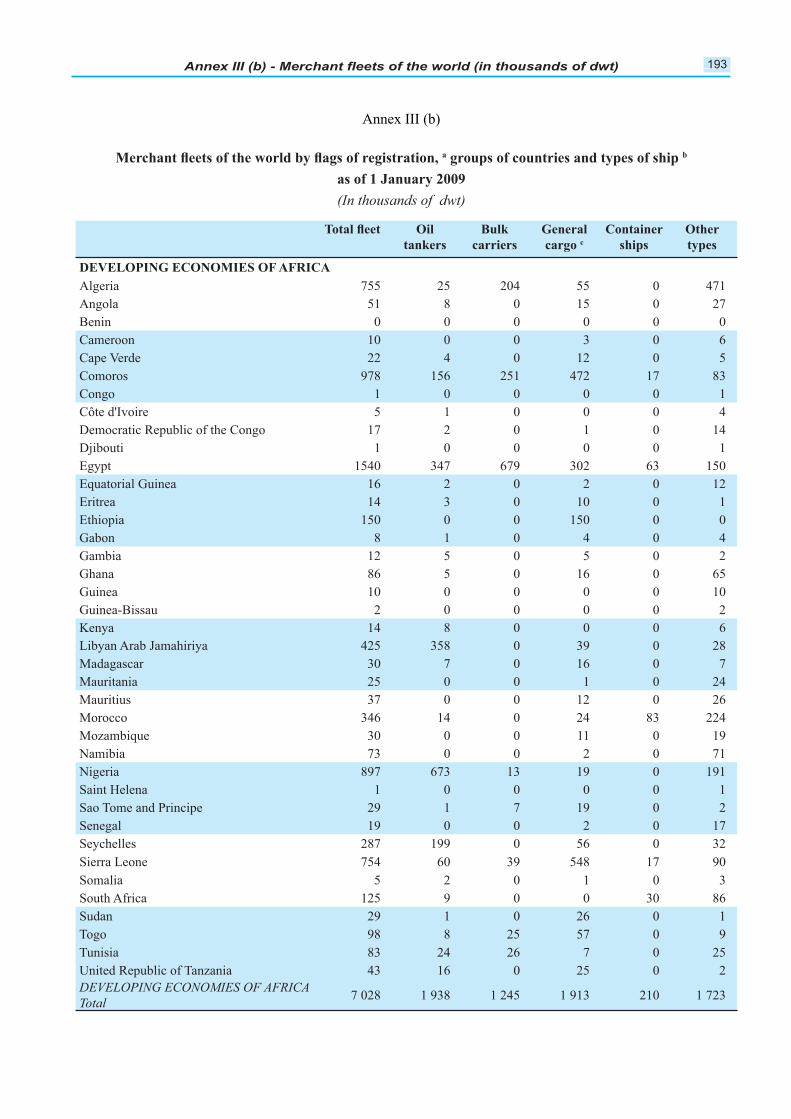
193
Annex III (b)
a
(In thousands of dwt)
c
Other
DEVELOPING ECONOMIES OF AFRICA
Algeria 755 25 204 55 0 471
Angola 51 8 0 15 0 27
Benin 0 0 0 0 0 0
Cameroon 10 0 0 3 0 6
Cape Verde 22 4 0 12 0 5
Comoros 978 156 251 472 17 83
Congo 1 0 0 0 0 1
Côte d'Ivoire 5 1 0 0 0 4
Democratic Republic of the Congo 17 2 0 1 0 14
Djibouti 1 0 0 0 0 1
Egypt 1540 347 679 302 63 150
Equatorial Guinea 16 2 0 2 0 12
Eritrea 14 3 0 10 0 1
Ethiopia 150 0 0 150 0 0
Gabon 8 1 0 4 0 4
Gambia 12 5 0 5 0 2
Ghana 86 5 0 16 0 65
Guinea 10 0 0 0 0 10
Guinea-Bissau 2 0 0 0 0 2
Kenya 14 8 0 0 0 6
Libyan Arab Jamahiriya 425 358 0 39 0 28
Madagascar 30 7 0 16 0 7
Mauritania 25 0 0 1 0 24
Mauritius 37 0 0 12 0 26
Morocco 346 14 0 24 83 224
Mozambique 30 0 0 11 0 19
Namibia 73 0 0 2 0 71
Nigeria 897 673 13 19 0 191
Saint Helena 1 0 0 0 0 1
Sao Tome and Principe 29 1 7 19 0 2
Senegal 19 0 0 2 0 17
Seychelles 287 199 0 56 0 32
Sierra Leone 754 60 39 548 17 90
Somalia 5 2 0 1 0 3
South Africa 125 9 0 0 30 86
Sudan 29 1 0 26 0 1
Togo 98 8 25 57 0 9
Tunisia 83 24 26 7 0 25
United Republic of Tanzania 43 16 0 25 0 2
DEVELOPING ECONOMIES OF AFRICA
Total 7 028 1 938 1 245 1 913 210 1 723
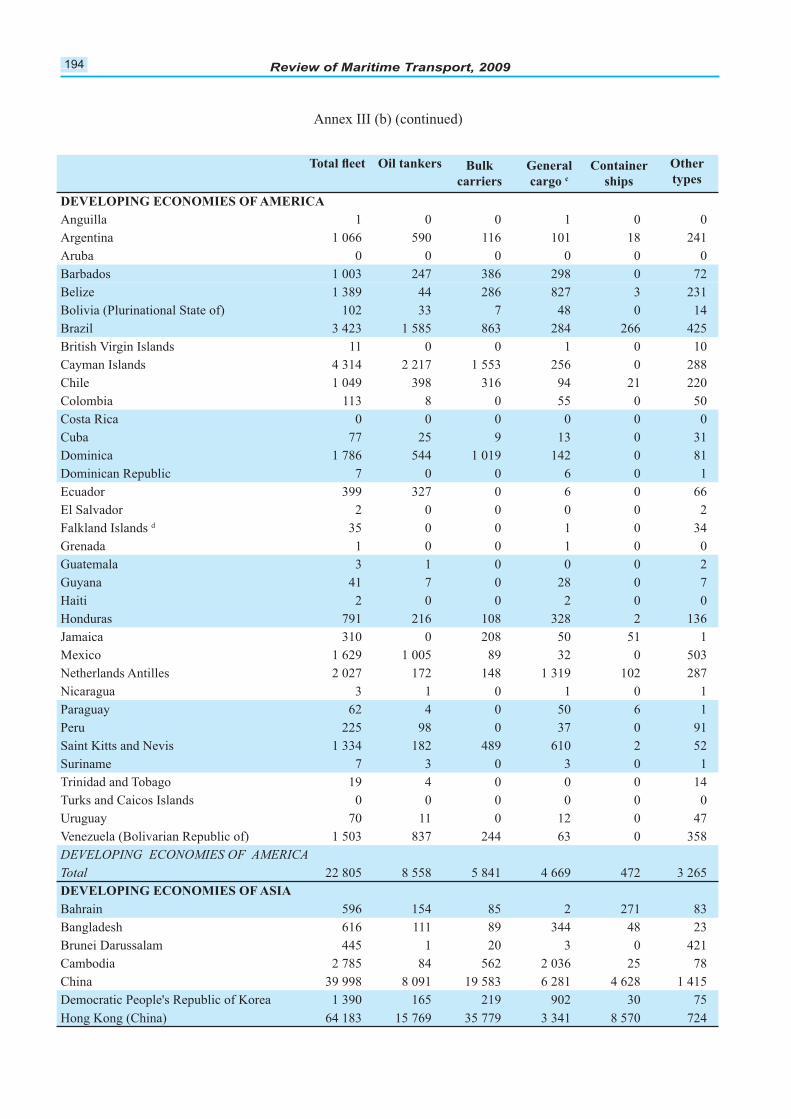
194
Annex III (b) (continued)
c
Other
DEVELOPING ECONOMIES OF AMERICA
Anguilla 1 0 0 1 0 0
Argentina 1 066 590 116 101 18 241
Aruba 0 0 0 0 0 0
Barbados 1 003 247 386 298 0 72
Belize 1 389 44 286 827 3 231
Bolivia (Plurinational State of) 102 33 7 48 0 14
Brazil 3 423 1 585 863 284 266 425
British Virgin Islands 11 0 0 1 0 10
Cayman Islands 4 314 2 217 1 553 256 0 288
Chile 1 049 398 316 94 21 220
Colombia 113 8 0 55 0 50
Costa Rica 0 0 0 0 0 0
Cuba 77 25 9 13 0 31
Dominica 1 786 544 1 019 142 0 81
Dominican Republic 7 0 0 6 0 1
Ecuador 399 327 0 6 0 66
El Salvador 2 0 0 0 0 2
Falkland Islands d 35 0 0 1 0 34
Grenada 1 0 0 1 0 0
Guatemala 3 1 0 0 0 2
Guyana 41 7 0 28 0 7
Haiti 2 0 0 2 0 0
Honduras 791 216 108 328 2 136
Jamaica 310 0 208 50 51 1
Mexico 1 629 1 005 89 32 0 503
Netherlands Antilles 2 027 172 148 1 319 102 287
Nicaragua 3 1 0 1 0 1
Paraguay 62 4 0 50 6 1
Peru 225 98 0 37 0 91
Saint Kitts and Nevis 1 334 182 489 610 2 52
Suriname 7 3 0 3 0 1
Trinidad and Tobago 19 4 0 0 0 14
Turks and Caicos Islands 0 0 0 0 0 0
Uruguay 70 11 0 12 0 47
Venezuela (Bolivarian Republic of) 1 503 837 244 63 0 358
DEVELOPING ECONOMIES OF AMERICA
Total 22 805 8 558 5 841 4 669 472 3 265
DEVELOPING ECONOMIES OF ASIA
Bahrain 596 154 85 2 271 83
Bangladesh 616 111 89 344 48 23
Brunei Darussalam 445 1 20 3 0 421
Cambodia 2 785 84 562 2 036 25 78
China 39 998 8 091 19 583 6 281 4 628 1 415
Democratic People's Republic of Korea 1 390 165 219 902 30 75
Hong Kong (China) 64 183 15 769 35 779 3 341 8 570 724
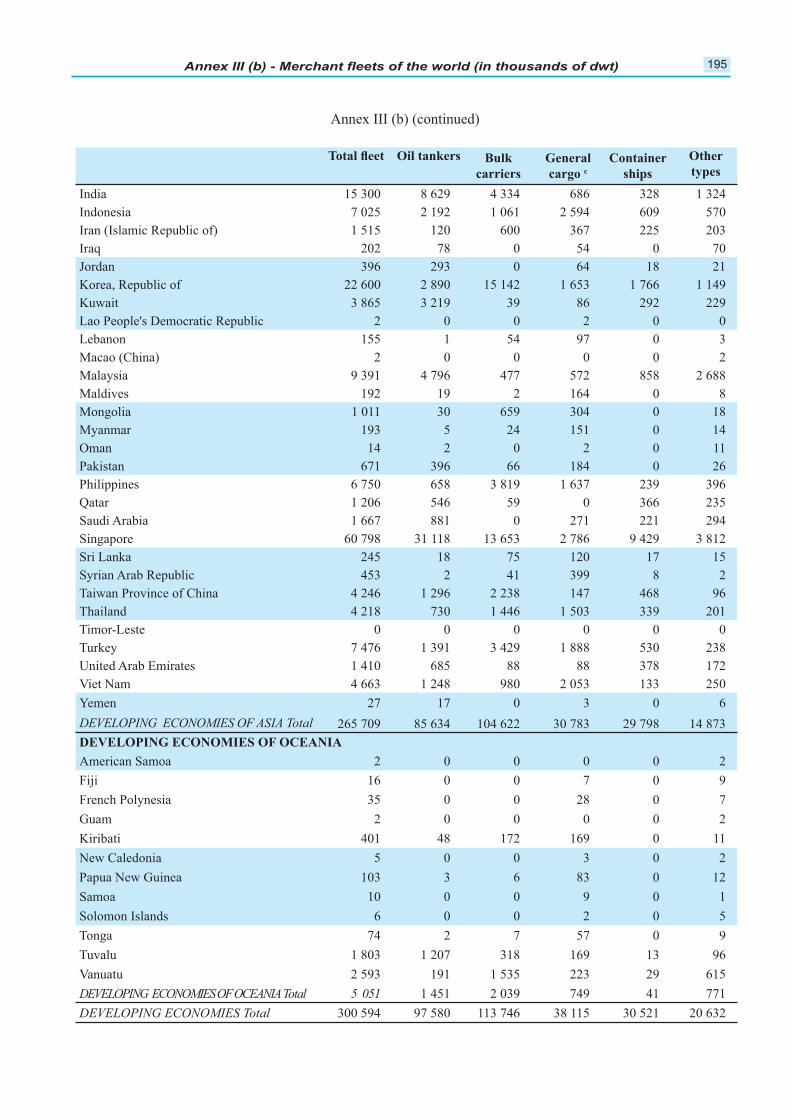
195
Annex III (b) (continued)
c
Other
India 15 300 8 629 4 334 686 328 1 324
Indonesia 7 025 2 192 1 061 2 594 609 570
Iran (Islamic Republic of) 1 515 120 600 367 225 203
Iraq 202 78 0 54 0 70
Jordan 396 293 0 64 18 21
Korea, Republic of 22 600 2 890 15 142 1 653 1 766 1 149
Kuwait 3 865 3 219 39 86 292 229
Lao People's Democratic Republic 2 0 0 2 0 0
Lebanon 155 1 54 97 0 3
Macao (China) 2 0 0 0 0 2
Malaysia 9 391 4 796 477 572 858 2 688
Maldives 192 19 2 164 0 8
Mongolia 1 011 30 659 304 0 18
Myanmar 193 5 24 151 0 14
Oman 14 2 0 2 0 11
Pakistan 671 396 66 184 0 26
Philippines 6 750 658 3 819 1 637 239 396
Qatar 1 206 546 59 0 366 235
Saudi Arabia 1 667 881 0 271 221 294
Singapore 60 798 31 118 13 653 2 786 9 429 3 812
Sri Lanka 245 18 75 120 17 15
Syrian Arab Republic 453 2 41 399 8 2
Taiwan Province of China 4 246 1 296 2 238 147 468 96
Thailand 4 218 730 1 446 1 503 339 201
Timor-Leste 0 0 0 0 0 0
Turkey 7 476 1 391 3 429 1 888 530 238
United Arab Emirates 1 410 685 88 88 378 172
Viet Nam 4 663 1 248 980 2 053 133 250
Yemen 27 17 0 3 0 6
DEVELOPING ECONOMIES OF ASIA Total 265 709 85 634 104 622 30 783 29 798 14 873
DEVELOPING ECONOMIES OF OCEANIA
American Samoa 2 0 0 0 0 2
Fiji 16 0 0 7 0 9
French Polynesia 35 0 0 28 0 7
Guam 2 0 0 0 0 2
Kiribati 401 48 172 169 0 11
New Caledonia 5 0 0 3 0 2
Papua New Guinea 103 3 6 83 0 12
Samoa 10 0 0 9 0 1
Solomon Islands 6 0 0 2 0 5
Tonga 74 2 7 57 0 9
Tuvalu 1 803 1 207 318 169 13 96
Vanuatu 2 593 191 1 535 223 29 615
DEVELOPING ECONOMIES OF OCEANIA Total 5 051 1 451 2 039 749 41 771
DEVELOPING ECONOMIES Total 300 594 97 580 113 746 38 115 30 521 20 632
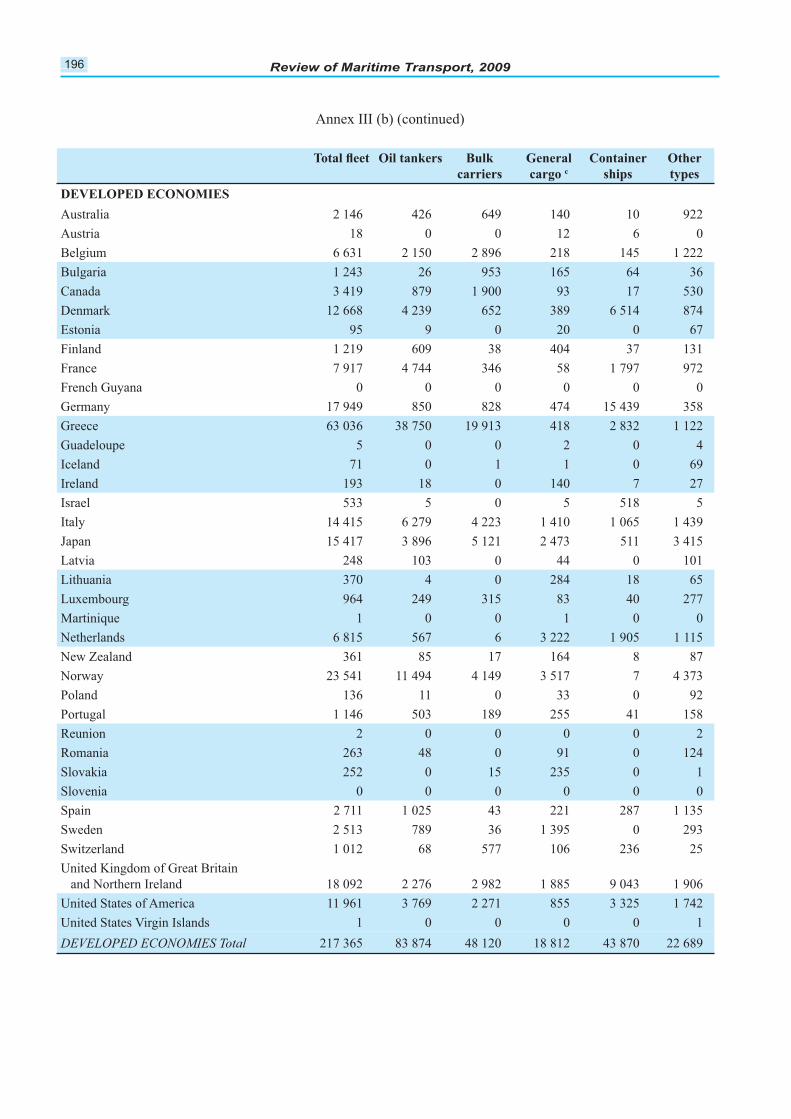
196
Annex III (b) (continued)
c
Other
DEVELOPED ECONOMIES
Australia 2 146 426 649 140 10 922
Austria 18 0 0 12 6 0
Belgium 6 631 2 150 2 896 218 145 1 222
Bulgaria 1 243 26 953 165 64 36
Canada 3 419 879 1 900 93 17 530
Denmark 12 668 4 239 652 389 6 514 874
Estonia 95 9 0 20 0 67
Finland 1 219 609 38 404 37 131
France 7 917 4 744 346 58 1 797 972
French Guyana 0 0 0 0 0 0
Germany 17 949 850 828 474 15 439 358
Greece 63 036 38 750 19 913 418 2 832 1 122
Guadeloupe 5 0 0 2 0 4
Iceland 71 0 1 1 0 69
Ireland 193 18 0 140 7 27
Israel 533 5 0 5 518 5
Italy 14 415 6 279 4 223 1 410 1 065 1 439
Japan 15 417 3 896 5 121 2 473 511 3 415
Latvia 248 103 0 44 0 101
Lithuania 370 4 0 284 18 65
Luxembourg 964 249 315 83 40 277
Martinique 1 0 0 1 0 0
Netherlands 6 815 567 6 3 222 1 905 1 115
New Zealand 361 85 17 164 8 87
Norway 23 541 11 494 4 149 3 517 7 4 373
Poland 136 11 0 33 0 92
Portugal 1 146 503 189 255 41 158
Reunion 2 0 0 0 0 2
Romania 263 48 0 91 0 124
Slovakia 252 0 15 235 0 1
Slovenia 0 0 0 0 0 0
Spain 2 711 1 025 43 221 287 1 135
Sweden 2 513 789 36 1 395 0 293
Switzerland 1 012 68 577 106 236 25
United Kingdom of Great Britain
and Northern Ireland 18 092 2 276 2 982 1 885 9 043 1 906
United States of America 11 961 3 769 2 271 855 3 325 1 742
United States Virgin Islands 1 0 0 0 0 1
DEVELOPED ECONOMIES Total 217 365 83 874 48 120 18 812 43 870 22 689
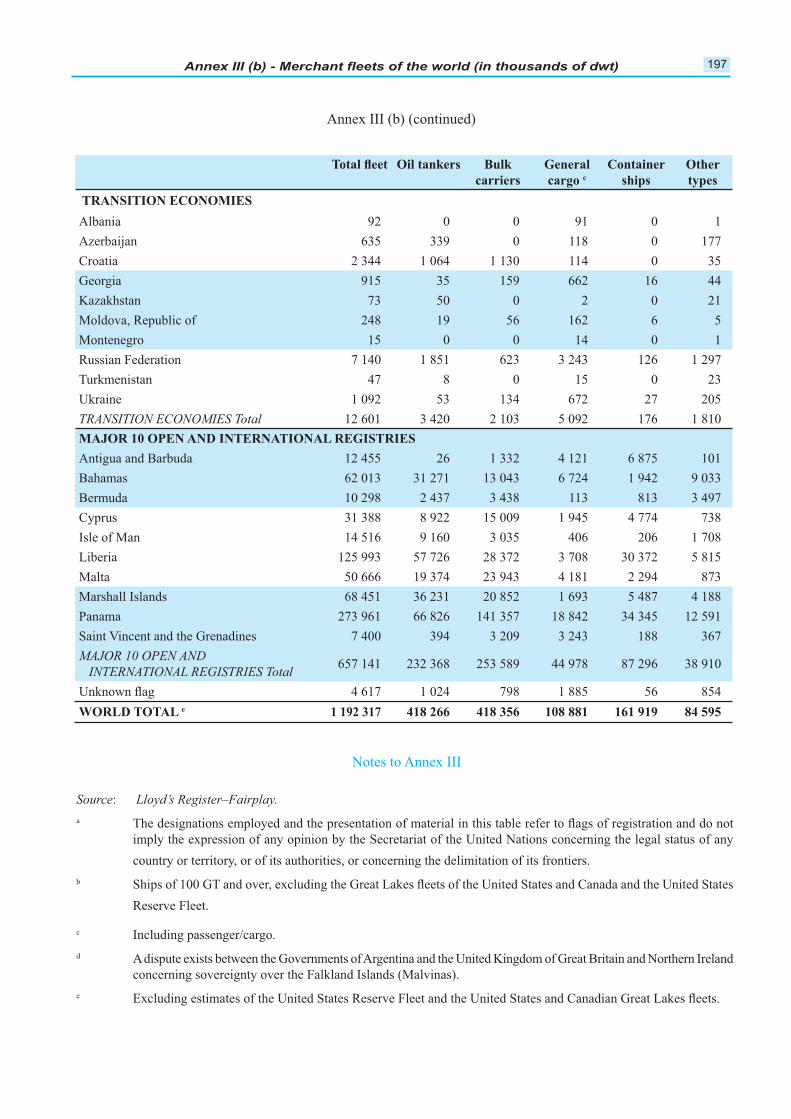
197
Annex III (b) (continued)
c
Other
TRANSITION ECONOMIES
Albania 92 0 0 91 0 1
Azerbaijan 635 339 0 118 0 177
Croatia 2 344 1 064 1 130 114 0 35
Georgia 915 35 159 662 16 44
Kazakhstan 73 50 0 2 0 21
Moldova, Republic of 248 19 56 162 6 5
Montenegro 15 0 0 14 0 1
Russian Federation 7 140 1 851 623 3 243 126 1 297
Turkmenistan 47 8 0 15 0 23
Ukraine 1 092 53 134 672 27 205
TRANSITION ECONOMIES Total 12 601 3 420 2 103 5 092 176 1 810
Antigua and Barbuda 12 455 26 1 332 4 121 6 875 101
Bahamas 62 013 31 271 13 043 6 724 1 942 9 033
Bermuda 10 298 2 437 3 438 113 813 3 497
Cyprus 31 388 8 922 15 009 1 945 4 774 738
Isle of Man 14 516 9 160 3 035 406 206 1 708
Liberia 125 993 57 726 28 372 3 708 30 372 5 815
Malta 50 666 19 374 23 943 4 181 2 294 873
Marshall Islands 68 451 36 231 20 852 1 693 5 487 4 188
Panama 273 961 66 826 141 357 18 842 34 345 12 591
Saint Vincent and the Grenadines 7 400 394 3 209 3 243 188 367
MAJOR 10 OPEN AND
INTERNATIONAL REGISTRIES Total 657 141 232 368 253 589 44 978 87 296 38 910
4 617 1 024 798 1 885 56 854
WORLD TOTAL e
Notes to Annex III
Source: Lloyd’s Register–Fairplay.
a
imply the expression of any opinion by the Secretariat of the United Nations concerning the legal status of any
country or territory, or of its authorities, or concerning the delimitation of its frontiers.
b
Reserve Fleet.
c Including passenger/cargo.
d A dispute exists between the Governments of Argentina and the United Kingdom of Great Britain and Northern Ireland
concerning sovereignty over the Falkland Islands (Malvinas).
e

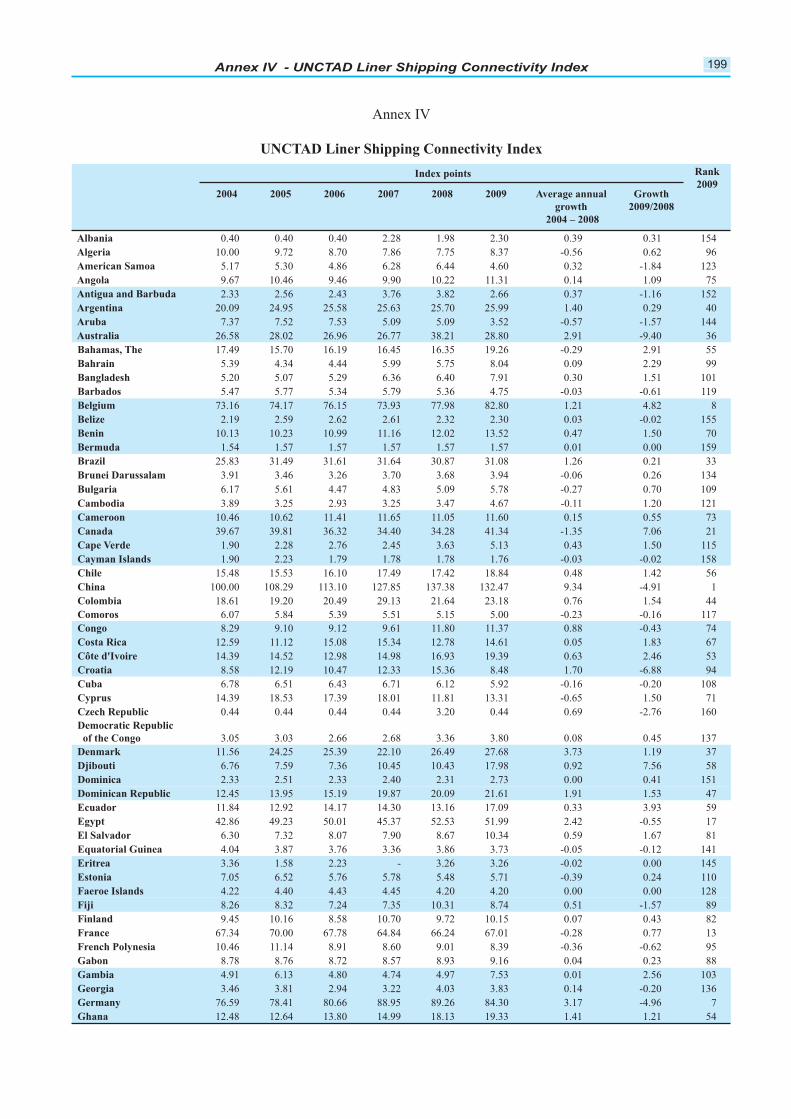
199Annex IV - UNCTAD Liner Shipping Connectivity Index
Annex IV
UNCTAD Liner Shipping Connectivity Index
Index points Rank
20092004 2005 2006 2007 2008 2009 Average annual
growth
2004 – 2008
Growth
2009/2008
Albania 0.40 0.40 0.40 2.28 1.98 2.30 0.39 0.31 154
Algeria 10.00 9.72 8.70 7.86 7.75 8.37 -0.56 0.62 96
American Samoa 5.17 5.30 4.86 6.28 6.44 4.60 0.32 -1.84 123
Angola 9.67 10.46 9.46 9.90 10.22 11.31 0.14 1.09 75
Antigua and Barbuda 2.33 2.56 2.43 3.76 3.82 2.66 0.37 -1.16 152
Argentina 20.09 24.95 25.58 25.63 25.70 25.99 1.40 0.29 40
Aruba 7.37 7.52 7.53 5.09 5.09 3.52 -0.57 -1.57 144
Australia 26.58 28.02 26.96 26.77 38.21 28.80 2.91 -9.40 36
Bahamas, The 17.49 15.70 16.19 16.45 16.35 19.26 -0.29 2.91 55
Bahrain 5.39 4.34 4.44 5.99 5.75 8.04 0.09 2.29 99
Bangladesh 5.20 5.07 5.29 6.36 6.40 7.91 0.30 1.51 101
Barbados 5.47 5.77 5.34 5.79 5.36 4.75 -0.03 -0.61 119
Belgium 73.16 74.17 76.15 73.93 77.98 82.80 1.21 4.82 8
Belize 2.19 2.59 2.62 2.61 2.32 2.30 0.03 -0.02 155
Benin 10.13 10.23 10.99 11.16 12.02 13.52 0.47 1.50 70
Bermuda 1.54 1.57 1.57 1.57 1.57 1.57 0.01 0.00 159
Brazil 25.83 31.49 31.61 31.64 30.87 31.08 1.26 0.21 33
Brunei Darussalam 3.91 3.46 3.26 3.70 3.68 3.94 -0.06 0.26 134
Bulgaria 6.17 5.61 4.47 4.83 5.09 5.78 -0.27 0.70 109
Cambodia 3.89 3.25 2.93 3.25 3.47 4.67 -0.11 1.20 121
Cameroon 10.46 10.62 11.41 11.65 11.05 11.60 0.15 0.55 73
Canada 39.67 39.81 36.32 34.40 34.28 41.34 -1.35 7.06 21
Cape Verde 1.90 2.28 2.76 2.45 3.63 5.13 0.43 1.50 115
Cayman Islands 1.90 2.23 1.79 1.78 1.78 1.76 -0.03 -0.02 158
Chile 15.48 15.53 16.10 17.49 17.42 18.84 0.48 1.42 56
China 100.00 108.29 113.10 127.85 137.38 132.47 9.34 -4.91 1
Colombia 18.61 19.20 20.49 29.13 21.64 23.18 0.76 1.54 44
Comoros 6.07 5.84 5.39 5.51 5.15 5.00 -0.23 -0.16 117
Congo 8.29 9.10 9.12 9.61 11.80 11.37 0.88 -0.43 74
Costa Rica 12.59 11.12 15.08 15.34 12.78 14.61 0.05 1.83 67
Côte d'Ivoire 14.39 14.52 12.98 14.98 16.93 19.39 0.63 2.46 53
Croatia 8.58 12.19 10.47 12.33 15.36 8.48 1.70 -6.88 94
Cuba 6.78 6.51 6.43 6.71 6.12 5.92 -0.16 -0.20 108
Cyprus 14.39 18.53 17.39 18.01 11.81 13.31 -0.65 1.50 71
Czech Republic 0.44 0.44 0.44 0.44 3.20 0.44 0.69 -2.76 160
Democratic Republic
of the Congo 3.05 3.03 2.66 2.68 3.36 3.80 0.08 0.45 137
Denmark 11.56 24.25 25.39 22.10 26.49 27.68 3.73 1.19 37
Djibouti 6.76 7.59 7.36 10.45 10.43 17.98 0.92 7.56 58
Dominica 2.33 2.51 2.33 2.40 2.31 2.73 0.00 0.41 151
Dominican Republic 12.45 13.95 15.19 19.87 20.09 21.61 1.91 1.53 47
Ecuador 11.84 12.92 14.17 14.30 13.16 17.09 0.33 3.93 59
Egypt 42.86 49.23 50.01 45.37 52.53 51.99 2.42 -0.55 17
El Salvador 6.30 7.32 8.07 7.90 8.67 10.34 0.59 1.67 81
Equatorial Guinea 4.04 3.87 3.76 3.36 3.86 3.73 -0.05 -0.12 141
Eritrea 3.36 1.58 2.23 - 3.26 3.26 -0.02 0.00 145
Estonia 7.05 6.52 5.76 5.78 5.48 5.71 -0.39 0.24 110
Faeroe Islands 4.22 4.40 4.43 4.45 4.20 4.20 0.00 0.00 128
Fiji 8.26 8.32 7.24 7.35 10.31 8.74 0.51 -1.57 89
Finland 9.45 10.16 8.58 10.70 9.72 10.15 0.07 0.43 82
France 67.34 70.00 67.78 64.84 66.24 67.01 -0.28 0.77 13
French Polynesia 10.46 11.14 8.91 8.60 9.01 8.39 -0.36 -0.62 95
Gabon 8.78 8.76 8.72 8.57 8.93 9.16 0.04 0.23 88
Gambia 4.91 6.13 4.80 4.74 4.97 7.53 0.01 2.56 103
Georgia 3.46 3.81 2.94 3.22 4.03 3.83 0.14 -0.20 136
Germany 76.59 78.41 80.66 88.95 89.26 84.30 3.17 -4.96 7
Ghana 12.48 12.64 13.80 14.99 18.13 19.33 1.41 1.21 54
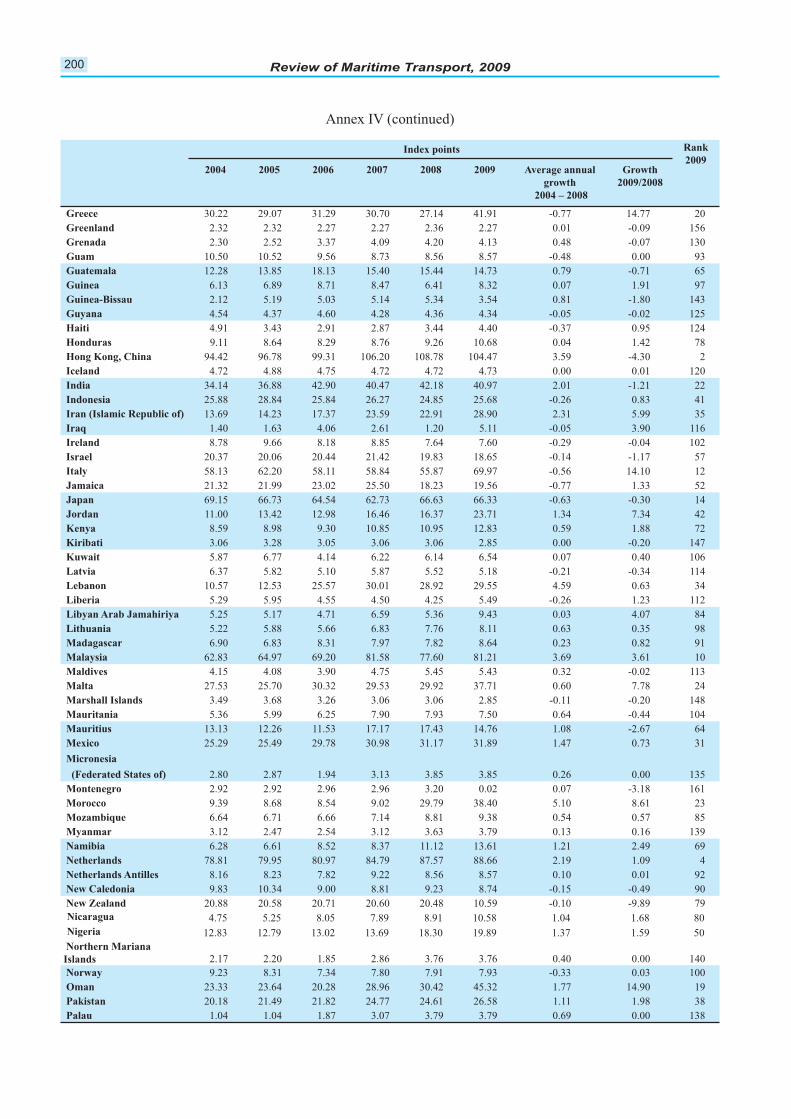
200 Review of Maritime Transport, 2009
Annex IV (continued)
Index points Rank
20092004 2005 2006 2007 2008 2009 Average annual
growth
2004 – 2008
Growth
2009/2008
Greece 30.22 29.07 31.29 30.70 27.14 41.91 -0.77 14.77 20
Greenland 2.32 2.32 2.27 2.27 2.36 2.27 0.01 -0.09 156
Grenada 2.30 2.52 3.37 4.09 4.20 4.13 0.48 -0.07 130
Guam 10.50 10.52 9.56 8.73 8.56 8.57 -0.48 0.00 93
Guatemala 12.28 13.85 18.13 15.40 15.44 14.73 0.79 -0.71 65
Guinea 6.13 6.89 8.71 8.47 6.41 8.32 0.07 1.91 97
Guinea-Bissau 2.12 5.19 5.03 5.14 5.34 3.54 0.81 -1.80 143
Guyana 4.54 4.37 4.60 4.28 4.36 4.34 -0.05 -0.02 125
Haiti 4.91 3.43 2.91 2.87 3.44 4.40 -0.37 0.95 124
Honduras 9.11 8.64 8.29 8.76 9.26 10.68 0.04 1.42 78
Hong Kong, China 94.42 96.78 99.31 106.20 108.78 104.47 3.59 -4.30 2
Iceland 4.72 4.88 4.75 4.72 4.72 4.73 0.00 0.01 120
India 34.14 36.88 42.90 40.47 42.18 40.97 2.01 -1.21 22
Indonesia 25.88 28.84 25.84 26.27 24.85 25.68 -0.26 0.83 41
Iran (Islamic Republic of) 13.69 14.23 17.37 23.59 22.91 28.90 2.31 5.99 35
Iraq 1.40 1.63 4.06 2.61 1.20 5.11 -0.05 3.90 116
Ireland 8.78 9.66 8.18 8.85 7.64 7.60 -0.29 -0.04 102
Israel 20.37 20.06 20.44 21.42 19.83 18.65 -0.14 -1.17 57
Italy 58.13 62.20 58.11 58.84 55.87 69.97 -0.56 14.10 12
Jamaica 21.32 21.99 23.02 25.50 18.23 19.56 -0.77 1.33 52
Japan 69.15 66.73 64.54 62.73 66.63 66.33 -0.63 -0.30 14
Jordan 11.00 13.42 12.98 16.46 16.37 23.71 1.34 7.34 42
Kenya 8.59 8.98 9.30 10.85 10.95 12.83 0.59 1.88 72
Kiribati 3.06 3.28 3.05 3.06 3.06 2.85 0.00 -0.20 147
Kuwait 5.87 6.77 4.14 6.22 6.14 6.54 0.07 0.40 106
Latvia 6.37 5.82 5.10 5.87 5.52 5.18 -0.21 -0.34 114
Lebanon 10.57 12.53 25.57 30.01 28.92 29.55 4.59 0.63 34
Liberia 5.29 5.95 4.55 4.50 4.25 5.49 -0.26 1.23 112
Libyan Arab Jamahiriya 5.25 5.17 4.71 6.59 5.36 9.43 0.03 4.07 84
Lithuania 5.22 5.88 5.66 6.83 7.76 8.11 0.63 0.35 98
Madagascar 6.90 6.83 8.31 7.97 7.82 8.64 0.23 0.82 91
Malaysia 62.83 64.97 69.20 81.58 77.60 81.21 3.69 3.61 10
Maldives 4.15 4.08 3.90 4.75 5.45 5.43 0.32 -0.02 113
Malta 27.53 25.70 30.32 29.53 29.92 37.71 0.60 7.78 24
Marshall Islands 3.49 3.68 3.26 3.06 3.06 2.85 -0.11 -0.20 148
Mauritania 5.36 5.99 6.25 7.90 7.93 7.50 0.64 -0.44 104
Mauritius 13.13 12.26 11.53 17.17 17.43 14.76 1.08 -2.67 64
Mexico 25.29 25.49 29.78 30.98 31.17 31.89 1.47 0.73 31
Micronesia
(Federated States of) 2.80 2.87 1.94 3.13 3.85 3.85 0.26 0.00 135
Montenegro 2.92 2.92 2.96 2.96 3.20 0.02 0.07 -3.18 161
Morocco 9.39 8.68 8.54 9.02 29.79 38.40 5.10 8.61 23
Mozambique 6.64 6.71 6.66 7.14 8.81 9.38 0.54 0.57 85
Myanmar 3.12 2.47 2.54 3.12 3.63 3.79 0.13 0.16 139
Namibia 6.28 6.61 8.52 8.37 11.12 13.61 1.21 2.49 69
Netherlands 78.81 79.95 80.97 84.79 87.57 88.66 2.19 1.09 4
Netherlands Antilles 8.16 8.23 7.82 9.22 8.56 8.57 0.10 0.01 92
New Caledonia 9.83 10.34 9.00 8.81 9.23 8.74 -0.15 -0.49 90
New Zealand 20.88 20.58 20.71 20.60 20.48 10.59 -0.10 -9.89 79
Nicaragua 4.75 5.25 8.05 7.89 8.91 10.58 1.04 1.68 80
Nigeria 12.83 12.79 13.02 13.69 18.30 19.89 1.37 1.59 50
Northern Mariana
Islands 2.17 2.20 1.85 2.86 3.76 3.76 0.40 0.00 140
Norway 9.23 8.31 7.34 7.80 7.91 7.93 -0.33 0.03 100
Oman 23.33 23.64 20.28 28.96 30.42 45.32 1.77 14.90 19
Pakistan 20.18 21.49 21.82 24.77 24.61 26.58 1.11 1.98 38
Palau 1.04 1.04 1.87 3.07 3.79 3.79 0.69 0.00 138
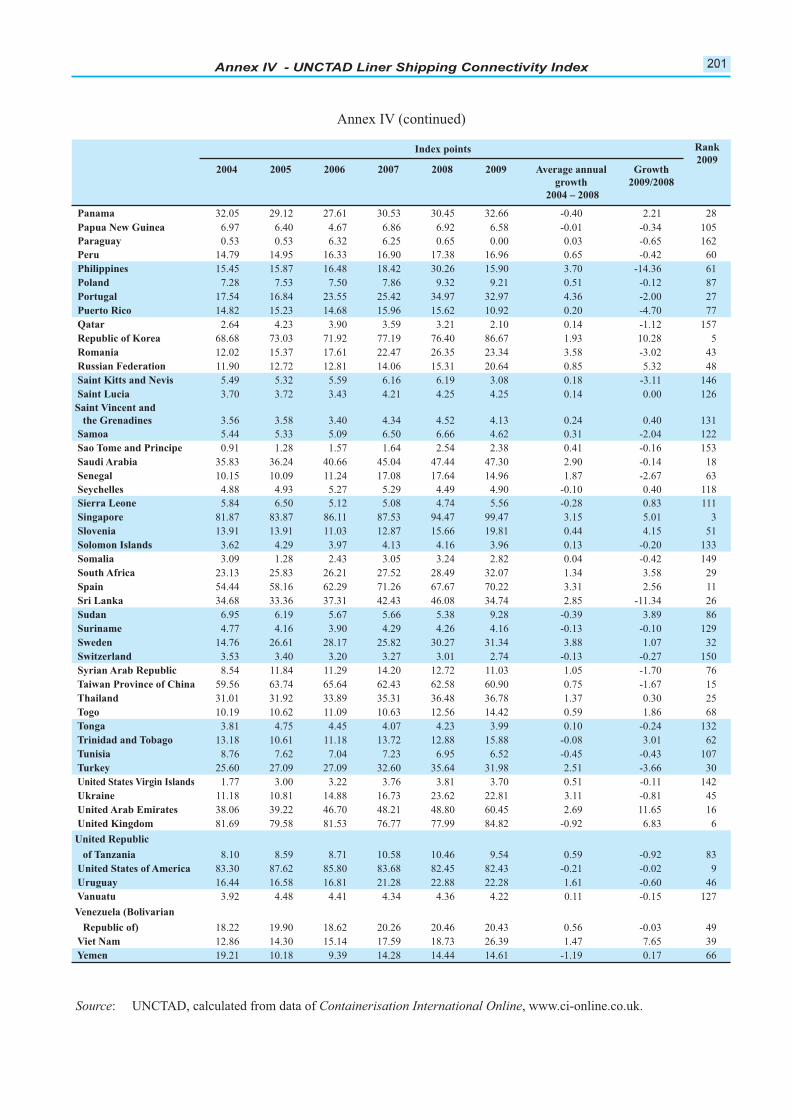
201Annex IV - UNCTAD Liner Shipping Connectivity Index 201
Annex IV (continued)
Index points Rank
20092004 2005 2006 2007 2008 2009 Average annual
growth
2004 – 2008
Growth
2009/2008
Panama 32.05 29.12 27.61 30.53 30.45 32.66 -0.40 2.21 28
Papua New Guinea 6.97 6.40 4.67 6.86 6.92 6.58 -0.01 -0.34 105
Paraguay 0.53 0.53 6.32 6.25 0.65 0.00 0.03 -0.65 162
Peru 14.79 14.95 16.33 16.90 17.38 16.96 0.65 -0.42 60
Philippines 15.45 15.87 16.48 18.42 30.26 15.90 3.70 -14.36 61
Poland 7.28 7.53 7.50 7.86 9.32 9.21 0.51 -0.12 87
Portugal 17.54 16.84 23.55 25.42 34.97 32.97 4.36 -2.00 27
Puerto Rico 14.82 15.23 14.68 15.96 15.62 10.92 0.20 -4.70 77
Qatar 2.64 4.23 3.90 3.59 3.21 2.10 0.14 -1.12 157
Republic of Korea 68.68 73.03 71.92 77.19 76.40 86.67 1.93 10.28 5
Romania 12.02 15.37 17.61 22.47 26.35 23.34 3.58 -3.02 43
Russian Federation 11.90 12.72 12.81 14.06 15.31 20.64 0.85 5.32 48
Saint Kitts and Nevis 5.49 5.32 5.59 6.16 6.19 3.08 0.18 -3.11 146
Saint Lucia 3.70 3.72 3.43 4.21 4.25 4.25 0.14 0.00 126
Saint Vincent and
the Grenadines 3.56 3.58 3.40 4.34 4.52 4.13 0.24 0.40 131
Samoa 5.44 5.33 5.09 6.50 6.66 4.62 0.31 -2.04 122
Sao Tome and Principe 0.91 1.28 1.57 1.64 2.54 2.38 0.41 -0.16 153
Saudi Arabia 35.83 36.24 40.66 45.04 47.44 47.30 2.90 -0.14 18
Senegal 10.15 10.09 11.24 17.08 17.64 14.96 1.87 -2.67 63
Seychelles 4.88 4.93 5.27 5.29 4.49 4.90 -0.10 0.40 118
Sierra Leone 5.84 6.50 5.12 5.08 4.74 5.56 -0.28 0.83 111
Singapore 81.87 83.87 86.11 87.53 94.47 99.47 3.15 5.01 3
Slovenia 13.91 13.91 11.03 12.87 15.66 19.81 0.44 4.15 51
Solomon Islands 3.62 4.29 3.97 4.13 4.16 3.96 0.13 -0.20 133
Somalia 3.09 1.28 2.43 3.05 3.24 2.82 0.04 -0.42 149
South Africa 23.13 25.83 26.21 27.52 28.49 32.07 1.34 3.58 29
Spain 54.44 58.16 62.29 71.26 67.67 70.22 3.31 2.56 11
Sri Lanka 34.68 33.36 37.31 42.43 46.08 34.74 2.85 -11.34 26
Sudan 6.95 6.19 5.67 5.66 5.38 9.28 -0.39 3.89 86
Suriname 4.77 4.16 3.90 4.29 4.26 4.16 -0.13 -0.10 129
Sweden 14.76 26.61 28.17 25.82 30.27 31.34 3.88 1.07 32
Switzerland 3.53 3.40 3.20 3.27 3.01 2.74 -0.13 -0.27 150
Syrian Arab Republic 8.54 11.84 11.29 14.20 12.72 11.03 1.05 -1.70 76
Taiwan Province of China 59.56 63.74 65.64 62.43 62.58 60.90 0.75 -1.67 15
Thailand 31.01 31.92 33.89 35.31 36.48 36.78 1.37 0.30 25
Togo 10.19 10.62 11.09 10.63 12.56 14.42 0.59 1.86 68
Tonga 3.81 4.75 4.45 4.07 4.23 3.99 0.10 -0.24 132
Trinidad and Tobago 13.18 10.61 11.18 13.72 12.88 15.88 -0.08 3.01 62
Tunisia 8.76 7.62 7.04 7.23 6.95 6.52 -0.45 -0.43 107
Turkey 25.60 27.09 27.09 32.60 35.64 31.98 2.51 -3.66 30
United States Virgin Islands 1.77 3.00 3.22 3.76 3.81 3.70 0.51 -0.11 142
Ukraine 11.18 10.81 14.88 16.73 23.62 22.81 3.11 -0.81 45
United Arab Emirates 38.06 39.22 46.70 48.21 48.80 60.45 2.69 11.65 16
United Kingdom 81.69 79.58 81.53 76.77 77.99 84.82 -0.92 6.83 6
United Republic
of Tanzania 8.10 8.59 8.71 10.58 10.46 9.54 0.59 -0.92 83
United States of America 83.30 87.62 85.80 83.68 82.45 82.43 -0.21 -0.02 9
Uruguay 16.44 16.58 16.81 21.28 22.88 22.28 1.61 -0.60 46
Vanuatu 3.92 4.48 4.41 4.34 4.36 4.22 0.11 -0.15 127
Venezuela (Bolivarian
Republic of) 18.22 19.90 18.62 20.26 20.46 20.43 0.56 -0.03 49
Viet Nam 12.86 14.30 15.14 17.59 18.73 26.39 1.47 7.65 39
Yemen 19.21 10.18 9.39 14.28 14.44 14.61 -1.19 0.17 66
Source: UNCTAD, calculated from data of Containerisation International Online, www.ci-online.co.uk.


Q U E S T I O N N A I R E
Review of Maritime Transport, 2009
In order to improve the quality and relevance of the Review of Maritime Transport, the UNCTAD secretariat would
greatly appreciate your views on this publication. Please complete the following questionnaire and return it to:
Readership Survey
Division on Technology and Logistics UNCTAD
Palais des Nations, Room E.7041
CH-1211 Geneva 10, Switzerland
Fax: (+41) (0)22 917 0050
E-mail: [email protected]
Thank you very much for your kind cooperation.
1. What is your assessment of this publication? Excellent Good Adequate Poor
Presentation and readability
Comprehensiveness of coverage
Quality of analysis
Overall quality
2. What do you consider the strong points of this publication?
__________________________________________________________________________________
__________________________________________________________________________________
3. What do you consider the weak points of this publication?
__________________________________________________________________________________
__________________________________________________________________________________
4. For what main purposes do you use this publication?
Analysis and research Education and training
Policy formulation and management Other (specify) ____________________________
__________________________________________________________________________________
5. Which of the following best describes your area of work?
Government Public enterprise
Non-governmental organization Academic or research
International organization Media
Private enterprise institution Other (specify) ____________________________
6. Name and address of respondent (optional):
__________________________________________________________________________________
__________________________________________________________________________________
__________________________________________________________________________________
7. Do you have any further comments?
__________________________________________________________________________________
__________________________________________________________________________________
__________________________________________________________________________________
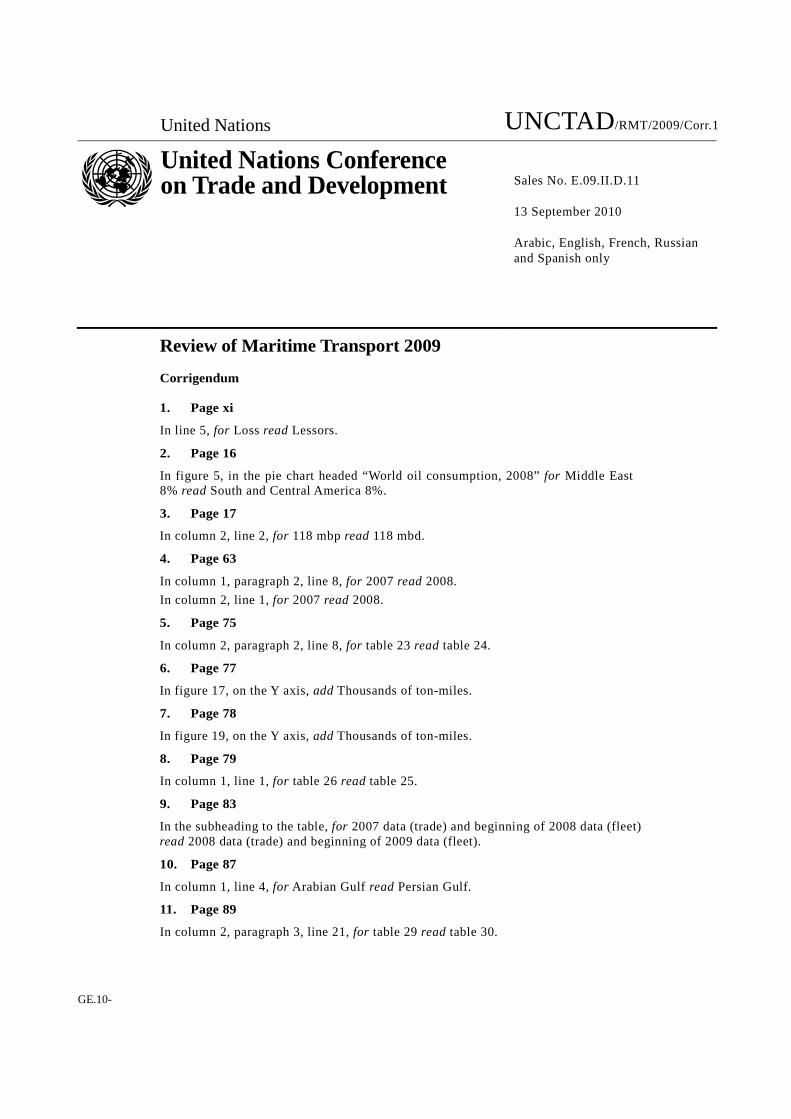
United Nations UNCTAD/RMT/2009/Corr.1
United Nations Conference on Trade and Development
Sales No. E.09.II.D.11 13 September 2010 Arabic, English, French, Russian and Spanish only
GE.10-
Review of Maritime Transport 2009
Corrigendum
1. Page xi
In line 5, for Loss read Lessors.
2. Page 16
In figure 5, in the pie chart headed “World oil consumption, 2008” for Middle East 8% read South and Central America 8%.
3. Page 17
In column 2, line 2, for 118 mbp read 118 mbd.
4. Page 63
In column 1, paragraph 2, line 8, for 2007 read 2008.
In column 2, line 1, for 2007 read 2008.
5. Page 75
In column 2, paragraph 2, line 8, for table 23 read table 24.
6. Page 77
In figure 17, on the Y axis, add Thousands of ton-miles.
7. Page 78
In figure 19, on the Y axis, add Thousands of ton-miles.
8. Page 79
In column 1, line 1, for table 26 read table 25.
9. Page 83
In the subheading to the table, for 2007 data (trade) and beginning of 2008 data (fleet) read 2008 data (trade) and beginning of 2009 data (fleet).
10. Page 87
In column 1, line 4, for Arabian Gulf read Persian Gulf.
11. Page 89
In column 2, paragraph 3, line 21, for table 29 read table 30.
2
UNCTAD/RMT/2009/Corr.1
12. Page 90
In column 1, paragraph 3, line 1, for table 29 read table 30.
In column 1, paragraph 4, line 1, for table 29 read table 30.
13. Page 100
In column 2, line 7, for COSCO’s read COSCON’s.
14. Page 101
In column 1, paragraph 4, line 2, for table 32 read table 33.
15. Page 105
In the title of table 35, for 2009 read 2008.
16. Page 107
In endnote 14, for Europe’s old 15 read The European Union’s old 15.
17. Page 118
In table 40, in the headnote, for km read tons.
18. Page 120
In column 2, paragraph 3, line 14, delete millions of.
19. Page 126
In column 1, line 11, for article r. 2 read article IV r. 2.
In column 2, paragraph 4, line 2, for chapter 10 read chapter 9.
In the lower box, for chapter 10 read chapter 9.
20. Page 129
In column 1, paragraph 4, line 1, for chapter 10 read chapter 9.
21. Page 150
In endnote 1, line 5, for A/RES/62/122 read A/RES/63/122.
In endnote 8, line 1, after Transport insert of Goods.
22. Page 154
In endnote 57, line 2, for Shopowners read Shipowners.
In endnote 57, line 4, for Association read Federation.
23. Page 155
In endnote 78, for para. 19 read para. 10.
In endnote 79, line 6, delete Djibouti.
24. Page 172
In table 47, as a footnote to the table, add a Regional comparison. b Global comparison.