REVIEW OF MARITIME TRANSPORT 2011 - UNCTAD | Home · 146 Review of MaRitiMe tRanspoRt 2011...
29
UNITED NATIONS CONFERENCE ON TRADE AND DEVELOPMENT REVIEW OF MARITIME TRANSPORT 2011 Report by the UNCTAD secretariat Chapter 6 UNITED NATIONS New York and Geneva, 2011
Transcript of REVIEW OF MARITIME TRANSPORT 2011 - UNCTAD | Home · 146 Review of MaRitiMe tRanspoRt 2011...

UNITED NATIONS CONFERENCE ON TRADE AND DEVELOPMENT
REVIEW OF MARITIMETRANSPORT
2011
Report by the UNCTAD secretariat
Chapter 6
UNITED NATIONS
New York and Geneva, 2011

Developing countries are expanding their participation in a range of different maritime businesses. They already hold strong positions in ship scrapping, registration, and the supply of seafarers, and they have growing market shares in more capital-intensive or technologically advanced maritime sectors such as ship construction and owning. China and the Republic of Korea alone built 72.4 per cent of the world’s ship capacity (in dwt) in 2010, and nine out of the twenty largest shipowning nations are developing countries.
Ship �nancing, insurance services and vessel classi�cation are among the few maritime sectors that have, until today, been dominated by the more advanced economies. Here too, however, developing countries have recently been demonstrating their potential to become major market players. India, for instance, has joined the International Association of Classi�cation Societies, and through this gains easier access to the global ship classi�cation market. China now hosts two of the world’s largest banks dealing with ship �nancing.
This chapter analyses these and other maritime businesses. It discusses the current and potential participation of developing countries based on a wide range of sector data, and provides examples illustrating the growth paths of selected developing countries in different maritime businesses. Furthermore, the chapter explores the linkages between maritime sectors, as some develop more autonomously than others. It also assesses how policy measures and a country’s stage of development may in�uence its involvement in a maritime sector.
CHAPTER 6
DEVELOPING COUNTRIES’ PARTICIPATION IN
MARITIME BUSINESSES
6

Review of MaRitiMe tRanspoRt 2011144
A. MARITIMEBUSINESSESINDEVELOPINGCOUNTRIES
1. Introduction
Forty years ago, when UNCTAD first produced the Review of Maritime Transport, the maritime industry as a whole was mostly located in developed countries, whereas today, developing countries have gained large market shares in many maritime businesses.1 One example of this trend is shipbuilding – an industry that used to be dominated by members of the Organization for Economic Cooperation and Development (OECD). Today, the world’s largest shipbuilding countries are China and the Republic of Korea, and the vessels built in these two countries are purchased by shipping companies worldwide. In 2001, the value of vessels exported from developed countries was higher than that exported from developing countries; however, in 2009, the total value of vessels exported from developing countries stood at $91 billion, compared to vessel exports worth $53 billon from developed countries (figure 6.1).
Traditionally, developed countries covered the entire maritime value chain or a large part of it, whereas
today most maritime champions in both developing and developed countries specialize in a limited number of sectors (see also annex VII for a table with each country’s market share in key maritime businesses). For example, Panama and Liberia are the largest open ship registries. Containers are mostly built in China. Dubai Ports is among the largest container terminal operators, with concessions on all continents. Bangladesh specializes in ship recycling. Many ships operate with crews from India, Indonesia and the Philippines.
The remainder of this chapter analyses the structure, intensity, and future prospects of selected maritime sectors in developing countries.
Section A introduces the maritime sectors that fall within the scope of this chapter, and refers to the different maritime businesses along a ship’s lifecycle.
In Section B, a number of key maritime sectors are described individually, and country case studies illustrate examples of the growth paths of maritime businesses in developing countries.
Section C presents a cross-sector comparison which looks at the market concentration levels and market shares of developing countries. It also discusses linkages between different maritime sectors.
Source: International Trade Centre. Trade Map. http://www.trademap.org/tradestat/Country_ SelProduct_TS.aspx (accessed in September 2011).
Figure 6.1. Export value of ships, boats and other floating structures (in billions of dollars)
10
20
30
40
50
60
70
80
90
100
Developing countries 17.2 17.6 20.8 27.2 33.4 45.4 53.1 84.2 90.6
Developed countries 27.8 29.4 34.1 37.2 37.6 45.2 54.3 60.3 53.2
2001 2002 2003 2004 2005 2006 2007 2008 2009

CHapteR 6: DeveLopinG CoUntRies’ paRtiCipation in MaRitiMe BUsinesses 145
2. Maritimeshipping
Maritime shipping comprises a large variety of different businesses, a selection of which will be analysed in this chapter. Following Porter’s value chain concept, the sectors are structured in chronological order.2 Porter chooses a single business unit as the appropriate level to construct his value chain. Products pass through this sequence of functions and gain value at each activity.
For the purposes of this chapter, a selection of key maritime businesses is presented along a ship’s lifecycle, starting from the building of the ship and continuing until its scrapping (figure 6.2).3 The sectors are divided into (a) the core ship lifecycle industries and (b) the supporting industries, with an emphasis on container shipping. Conceptually, the object of the analysis is a cluster of maritime businesses, rather than a single business unit. The core businesses in the ship lifecycle industries include:
(a) Ship building: A manufacturing industry that conceptualizes and assembles different vessel types.
(b) Ship owning: The company purchases the ship through its own or external financial resources, and becomes the legal proprietor of the ship.
(c) Ship operation: A ship operator is usually responsible for management of the crew, route planning, servicing and maintenance. It also takes the entrepreneurial risks related to
capacity utilization and operational efficiency. Particularly in the case of containerized liner shipping, operation and ownership of ships often lie in different companies.
(d) Ship scrapping: Includes the breaking up of a ship at the end of its lifecycle and is often referred to as “ship recycling”. The ship scrapping company mostly benefits from the reuse of the scrapped steel and some other components, although hazardous elements have to be recycled or disposed of.
During this lifecycle, the ship will require numerous support services, six of which are discussed in further detail in this chapter:
(a) Ship financing: The process whereby a lender, such as a bank, provides the financial resources to a shipowning company to purchase and maintain a vessel.
(b) Ship classification: Classification societies verify and certify compliance with technical rules and safety and other national and international standards for ship construction and operation. They work on behalf of the shipbuilder, the flag state, or other interested parties.
(c) Ship registration: This includes the process of national registration of a ship by a country under whose flag the vessel sails.
(d) Ship insurance (P&I): This section focuses on protection and indemnity (P&I) clubs. A P&I club is a non-profit association that typically consists of
Figure 6.2. Maritime sectors along a ship’s lifecycle
Source: UNCTAD secretariat.
Industry overview of maritime shipping
8. Ship insurance (protection and indemnity)
10. Port operation (container terminal operators)
9. Seafarer supply
6. Ship classification
Core ship lifecycleindustries
Supportingindustries
5. Ship financing
7. Ship registration
1. Ship building 4. Ship scrapping
2. Ship owning
3. Ship operation (container ships)
Figure 6.2

Review of MaRitiMe tRanspoRt 2011146
shipowners, ship operators and ship charterers. It provides its members with mutual ship insurance services that also cover third-party liabilities, such as cargo or environmental damage.
(e) Seafarers: A ship’s crew consists of officers (e.g. masters and engineers) and ratings (such as able seamen, oilers and cooks).
(f) Terminal operators: Terminal operators carry out the logistical processing of containers between ships and other modes of transports. Particularly in the case of container shipping, loading and unloading operations are mostly undertaken by private stevedoring companies which are often also responsible for the terminal operations, superstructure and IT systems.
Section B below examines these ten maritime sectors in more detail, and evaluates the participation of developing countries. In addition, it briefly introduces some other maritime and related businesses, such as container construction, leasing, ship repair, bunkering, brokering, and ship management.
B. ANALySISOfSELECTEDMARITIMEBUSINESSES
This section analyses the current participation of developing countries within ten selected maritime businesses. A case study from a developing country, for each sector, aims to illustrate possible growth paths and corresponding influencing factors.
1.Shipbuilding
Most large cargo-carrying vessels are now built in developing countries in Asia, while shipyards in Australia, Europe, and North and South America specialize in smaller vessels (e.g. tugboats and offshore supply ships) or other specialized non-cargo-carrying vessels (e.g. ferries and cruise ships).
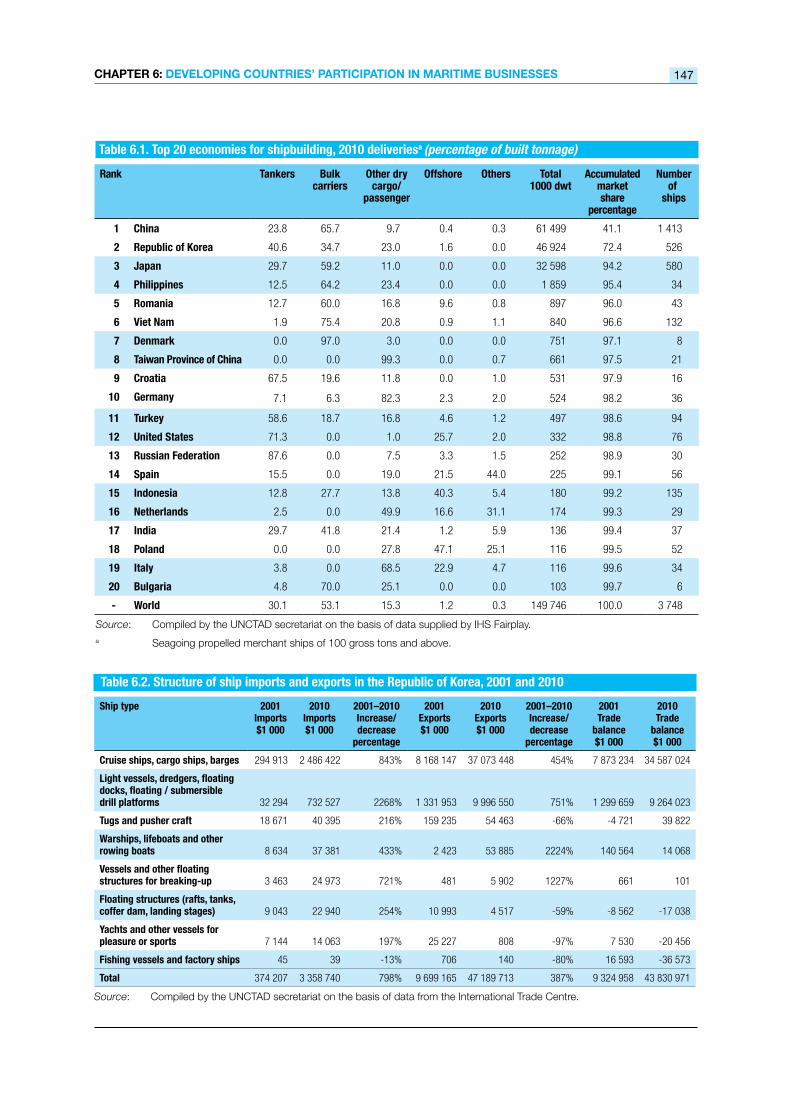
Ship building has become a highly concentrated business (table 6.1). China and the Republic of Korea together built more than 72 per cent of dwt in 2010, with China specializing in dry bulk carriers and the Republic of Korea specializing more in container ships. Japan was the third-largest player, with 22 per cent. These three major producers combined reached a market share of 94 per cent of world tonnage. The Philippines, in fourth position with a market share of 1.2 per cent, focuses on bulk carriers. Production by South-East Asian shipbuilders concentrates on small types of
ships or on specific elements of ships. Singapore, for instance, is a world leader in oil rig building.
China has emerged as the world’s largest shipbuilder, and expanded its dry bulk shipbuilding capacity by a factor of six between 2008 and 2010.4 The country is also the world’s largest importer of ship engines, with a value of $2.4 billion in 2009.5 In addition to dry bulk carriers, China builds a large number of smaller ships, including tugboats and product tankers.
Country case study: The Republic of Korea expanding its product portfolio in shipbuilding
The diversification of the Republic of Korea’s shipbuilding business and its competitiveness are a result of support policies for manufacturing industries at the “infant industry” stage. Such policies during the third and fourth five-year plans (1971–1981) allowed for accelerated development of the sector. To this day, the strategic importance of the sector is reflected in the structure of the country’s Government, which includes a maritime affairs ministry with various supporting bodies.6
Table 6.2. shows the distribution of imports and exports to/from the Republic of Korea in different shipbuilding sectors. Dry cargo ships (including container ships) and passenger ships account for the largest share. The second most important sector includes the construction of light vessels, dredgers, floating docks and drill platforms. The fastest-growing export sector comprises warships and lifeboats, however these vessels remain at a comparatively low level, with a total value of $0.5 billion in 2010.
Shipbuilding companies from the Republic of Korea are often also active in other manufacturing industries – this is the case of Daewoo, Hyundai and Samsung. The Republic of Korea is the world’s sixth-largest producer of steel, which is a crucial input for ship construction.7 The country’s Hanjin and Hyundai Merchant Marine (HMM) carriers, which are among the world’s top 20 liner shipping companies, have most of their ships built in shipyards in the Republic of Korea, which specialize in container ships, offshore vessels, oil tankers, and LNG tankers.
The country’s shipbuilding sector is currently confronted by rising labour costs, which it is partly able to offset by achieving constant increases in productivity. The Republic of Korea’s average labour costs for the manufacture of transportation equipment tripled between 1998 ($7.90 per hour) and 2007 ($23.30 per hour), whereas unit labour costs had an average annual growth rate of only 1.67 per cent from 2000 until 2009.8
CHapteR 6: DeveLopinG CoUntRies’ paRtiCipation in MaRitiMe BUsinesses 147
Rank Tankers Bulk carriers
Other dry cargo/
passenger
Offshore Others Total 1000 dwt
Accumulated market share
percentage
Number of
ships
1 China 23.8 65.7 9.7 0.4 0.3 61 499 41.1 1 413
2 Republic of Korea 40.6 34.7 23.0 1.6 0.0 46 924 72.4 526
3 Japan 29.7 59.2 11.0 0.0 0.0 32 598 94.2 580
4 Philippines 12.5 64.2 23.4 0.0 0.0 1 859 95.4 34
5 Romania 12.7 60.0 16.8 9.6 0.8 897 96.0 43
6 Viet Nam 1.9 75.4 20.8 0.9 1.1 840 96.6 132
7 Denmark 0.0 97.0 3.0 0.0 0.0 751 97.1 8
8 Taiwan Province of China 0.0 0.0 99.3 0.0 0.7 661 97.5 21
9 Croatia 67.5 19.6 11.8 0.0 1.0 531 97.9 16
10 Germany 7.1 6.3 82.3 2.3 2.0 524 98.2 36
11 Turkey 58.6 18.7 16.8 4.6 1.2 497 98.6 94
12 United States 71.3 0.0 1.0 25.7 2.0 332 98.8 76
13 Russian Federation 87.6 0.0 7.5 3.3 1.5 252 98.9 30
14 Spain 15.5 0.0 19.0 21.5 44.0 225 99.1 56
15 Indonesia 12.8 27.7 13.8 40.3 5.4 180 99.2 135
16 Netherlands 2.5 0.0 49.9 16.6 31.1 174 99.3 29
17 India 29.7 41.8 21.4 1.2 5.9 136 99.4 37
18 Poland 0.0 0.0 27.8 47.1 25.1 116 99.5 52
19 Italy 3.8 0.0 68.5 22.9 4.7 116 99.6 34
20 Bulgaria 4.8 70.0 25.1 0.0 0.0 103 99.7 6
- World 30.1 53.1 15.3 1.2 0.3 149 746 100.0 3 748
Table 6.1. Top 20 economies for shipbuilding, 2010 deliveriesa (percentage of built tonnage)
Source: Compiled by the UNCTAD secretariat on the basis of data supplied by IHS Fairplay.a Seagoing propelled merchant ships of 100 gross tons and above.
Ship type 2001 Imports $1 000
2010 Imports $1 000
2001–2010 Increase/ decrease
percentage
2001 Exports $1 000
2010 Exports $1 000
2001–2010 Increase/ decrease
percentage
2001 Trade
balance $1 000
2010 Trade
balance $1 000
Cruise ships, cargo ships, barges 294 913 2 486 422 843% 8 168 147 37 073 448 454% 7 873 234 34 587 024
Light vessels, dredgers, floating docks, floating / submersible drill platforms 32 294 732 527 2268% 1 331 953 9 996 550 751% 1 299 659 9 264 023
Tugs and pusher craft 18 671 40 395 216% 159 235 54 463 -66% -4 721 39 822
Warships, lifeboats and other rowing boats 8 634 37 381 433% 2 423 53 885 2224% 140 564 14 068
Vessels and other floating structures for breaking-up 3 463 24 973 721% 481 5 902 1227% 661 101
Floating structures (rafts, tanks, coffer dam, landing stages) 9 043 22 940 254% 10 993 4 517 -59% -8 562 -17 038
Yachts and other vessels for pleasure or sports 7 144 14 063 197% 25 227 808 -97% 7 530 -20 456
Fishing vessels and factory ships 45 39 -13% 706 140 -80% 16 593 -36 573
Total 374 207 3 358 740 798% 9 699 165 47 189 713 387% 9 324 958 43 830 971
Table 6.2. Structure of ship imports and exports in the Republic of Korea, 2001 and 2010
Source: Compiled by the UNCTAD secretariat on the basis of data from the International Trade Centre.

Review of MaRitiMe tRanspoRt 2011148
2. Shipowning
The three largest shipowners are developed countries, namely Greece, Japan and Germany. Together, they account for 41 per cent of the world’s deadweight tonnage. China ranks fourth, with an owned capacity of 108 million dwt. While the four largest shipowning countries together control about half of the world fleet, ownership of the other half is spread among a large number of countries, including many developing countries (see also chapter 2, and in particular, table 2.5).
The order book in table 6.3 shows that China can be expected to climb the ownership ranking in the future; the country’s order book ranks second in the world. As a group, developing countries have a larger order book than developed countries, suggesting a growing market for developing countries in the future.
Country case study: Largest order book in Brazilian historyThe case of Brazil shows how shipowning can be linked to a country’s international trade in goods.
Building on the boom in its commodity exports, Brazil is expected, in the coming years, to achieve the highest fleet growth out of the top 35 shipowning countries. Underlying this projection is the country’s order book, which is the world’s largest order book in relation to its current fleet (table 6.3). It is also the largest order book in Brazilian history.
As at January 2011, Brazilian shipowners had a fleet which comprised 152 vessels and had a capacity of 10.9 million dwt. At a global level, Brazil’s market share is below 1 per cent, ranking twenty-third in the world. In terms of deadweight tonnage, 38 per cent of the Brazilian fleet is made up of bulk carriers and 41 per cent is made up of tankers (table 6.4). These ship types mainly serve the demand created by the country’s exports such as oil and iron ore and by the offshore industry. The largest oil-producing company in Brazil is the state-owned Petrobras, which operates 172 vessels, 52 of which are owned by the company.9
Table 6.4 analyses Brazil’s fleet in terms of ship registration. More than 70 per cent of the country’s
Table 6.3. Top 20 ship orderbooks by country of ownership, 1 January 2011
Source: Clarkson Research Services. World Fleet Monitor. As at 1 January 2011. Seagoing cargo-carrying vessels only.
Rank Number of ships
Value (billions
of dollars)
Gross tonnage (millions
of GT)
GT, world
percentage
GT, accumulated
world percentage
GT, ownership
rank
GT orderbook as a
% share of the owned fleet
1 Greece 715 42.3 39.2 13.6 13.6 1 28.2
2 China 801 36.0 36.7 12.7 26.4 4 45.0
3 Japan 535 31.2 26.7 9.3 35.6 2 19.5
4 Germany 714 33.8 24.9 8.6 44.3 3 29.4
5 Republic of Korea 310 17.3 17.2 6.0 50.3 7 42.8
6 Taiwan Province of China 179 13.6 11.7 4.1 54.3 10 50.7
7 Norway 322 20.7 8.7 3.0 57.3 5 17.5
8 Turkey 251 10.2 8.1 2.8 60.2 16 52.8
9 Italy 168 9.4 6.9 2.4 62.6 8 21.3
10 Brazil 106 12.1 6.9 2.4 65.0 27 108.1
11 Denmark 201 10.0 6.7 2.3 67.3 9 22.0
12 China, Hong Kong SAR 150 6.6 6.6 2.3 69.6 11 20.0
13 Singapore 281 7.5 6.5 2.3 71.8 12 28.8
14 United States 181 20.2 6.3 2.2 74.0 6 14.4
15 Israel 81 6.9 6.2 2.2 76.2 13 39.2
16 India 138 5.4 5.1 1.8 77.9 17 41.0
17 France 132 4.8 2.6 0.9 78.8 23 28.6
18 United Arab Emirates 102 4.0 2.5 0.9 79.7 25 31.0
19 Canada 58 3.2 2.3 0.8 80.5 14 14.6
20 Netherlands 204 3.9 1.9 0.7 81.2 20 19.9
- World 7456 376.8 287.9 100.0 100.0 - -

CHapteR 6: DeveLopinG CoUntRies’ paRtiCipation in MaRitiMe BUsinesses 149
Table 6.4. Brazilian-owned fleet, 1 January 2011
Source: Compiled by the UNCTAD secretariat on the basis of data provided by IHS Fairplay.
Total Percentage of total
Brazil Panama Liberia Bahamas Marshall Islands
Others
Total number of ships 152 70.4 5.3 16.5 1.3 0.0 6.6
Total dwt 10 866 503 19.9 11.7 56.9 3.3 3.1 8.1
Bulk carriers, dwt 4 690 527 8.8 2.9 81.2 0.0 0.0 7.1
Cargo/passenger ships, dwt 270 289 100.0 0.0 0.0 0.0 0.0 0.0
Offshore, dwt 1 428 141 7.4 59.8 0.0 18.1 4.3 14.8
Tankers, dwt 4 466 352 30.6 6.3 53.2 2.4 6.3 7.6
Miscellaneous, dwt 11 194 59.7 0.0 0.0 0.0 0.0 40.3
vessels sail under the Brazilian flag. However, based on tonnage, Liberia is the most used flag for the Brazilian-owned fleet, with a share of 57 per cent. Next are the Brazilian flag (20 per cent) and the Panamanian flag (12 per cent). Large vessels such as bulk carriers and tankers are involved in international transport and are mostly listed at Liberia’s registry, while offshore platforms and general cargo and passenger vessels often need to be registered in Brazil. Cabotage, for instance, can only be carried out by Brazilian-flagged vessels.
3. Shipoperation
In container shipping especially, the companies that provide liner shipping services tend to own only a part of their fleet. The liner shipping companies charter in additional ships, which are then operated and deployed under their own name.
A total of 405 containership operators are reported to provide international liner shipping services. The three countries with the highest containership operating capacity (in terms of total TEU vessel capacity) are Denmark, Switzerland and France, which jointly have a market share of almost 30 per cent.10 It is also noteworthy that the largest shipowning country, Greece, is not host to any major containership operators.11
Among the top 20 operating countries are 10 developing economies, which have a combined share of 37 per cent. After the selling in the 1990s of major United States liner shipping companies, it is Chilean companies which today operate the largest containership fleet in the Western Hemisphere (tables 2.6 and 6.5).
Country case study: Chilean containership operatorsChile is home to three international containership operators, which in January 2011 had a combined capacity of 449,913 TEU. Compañía Sudamericana de Vapores (CSAV) dominates the sector in Chile, with an 85 per cent share among the Chilean carriers and a ranking of tenth in the world (table 2.6). The other Chilean carriers are Compañía Chilena de Navegación Interoceánica, and Nisa Navegación (table 6.6).
As illustrated in figure 6.3, CSAV’s growth has outpaced the world market for containerized cargo in recent decades. From 1981 to 2009, global transport of containerized cargo increased approximately 3.3 times faster than the world’s GDP, while the cargo carried by CSAV grew almost 11 times faster during the same period. In 2009, during the economic crisis, the company lost market share. This was the year with the highest net loss in the company’s history (-$633 million). CSAV was able to generate a positive net income in 2010 ($171 million), but in early 2011 it was again reporting losses. The Lucksic family is now a major shareholder and they are trying to accomplish a sustainable turnaround.
Founded in 1872, CSAV is one of the oldest shipping companies in the world. Initially, the company’s business consisted of national coastal shipping services; these were then extended along the whole west coast of South America as far as the Panama Canal. Today, CSAV, through its subsidiary Sudamericana Agencias Aéreas y Marítimas (SAAM), also has interests in terminal operations, stevedoring, tugboats, agency and other logistics-related services in 11 countries in North, Central and South America. On the shipping side, the CSAV group includes liner companies in Brazil and Uruguay, as well as interests in dry bulk and reefer shipping.

Review of MaRitiMe tRanspoRt 2011150
Table 6.5. The 20 largest containership-operating economies, January 2011
Source: Compiled by the UNCTAD secretariat on the basis of data from Containerisation International Online (accessed in March 2011).
Country Total fleet
Vessel capacity
TEU
Vessel capacity, percentage of world capacity
Accumulated market share,
percentage of worldcapacity
Number of ships,
2010
Denmark 1 891 051 11.6% 11.6% 485
Switzerland 1 771 621 10.9% 22.5% 439
France 1 190 894 7.3% 29.9% 383
China 1 141 708 7.0% 36.9% 398
Singapore 1 117 000 6.9% 43.8% 492
Taiwan Province of China 1 113 598 6.9% 50.6% 337
Japan 1 085 802 6.7% 57.3% 296
Germany 1 025 650 6.3% 63.6% 412
Republic of Korea 906 259 5.6% 69.2% 336
China, Hong Kong SAR 661 531 4.1% 73.2% 190
Chile 449 913 2.8% 76.0% 149
United States 318 297 2.0% 78.0% 337
Israel 281 532 1.7% 79.7% 73
Kuwait 178 599 1.1% 80.8% 47
Belgium 137 090 0.8% 81.6% 163
Netherlands 132 483 0.8% 82.5% 191
Iran, Islamic Republic of 90 288 0.6% 83.0% 42
Malaysia 85 967 0.5% 83.5% 74
Italy 80 080 0.5% 84.0% 95
United Arab Emirates 69 896 0.4% 84.5% 47
World 16 253 988 100% 100.0% 9 688
Table 6.6. Chilean ship operators
Source: Compiled by the UNCTAD secretariat on the basis of data from Containerisation International Online (accessed in March 2011).
Company Total fleet Order book in 2010
2010 Ranking position
2009 Ranking position
2010 TEU
Share of TEU,
as a % of Chilean
TEU
2010 Number of ships
TEU Ships
Compañia Sud Americana de Vapores SA 10 10 382 786 85.1 119 6 316 1
Compañía Chilena de Navegación Interoceánica S.A. 28 29 65 530 14.6 27 0 0
Nisa Navegacíon S.A. 230 311 1 597 0.4 3 0 0
Total Chile 449 913 149 6 316 1

CHapteR 6: DeveLopinG CoUntRies’ paRtiCipation in MaRitiMe BUsinesses 151
Figure 6.3. CSAV index on transported TEU, 1997–2010 (1997=1)
Source: Compiled by the UNCTAD secretariat on the basis of data from various CSAV web pages, (accessed in March 2011).
0
1
2
3
4
5
6
7
8
1997 1998 1999 2000 2001 2002 2003 2004 2005 2006 2007 2008 2009 2010
CSAV
World
With regard to its liner shipping operations, CSAV controls 80 per cent of its sales through its own 105 agencies worldwide. A specific characteristic of the company is the comparatively low share of owned ships in terms of TEU capacity; more than 90 per cent of its capacity is chartered-in tonnage. By comparison, the other top 10 liner shipping companies own almost half of their operated fleet.12
The expansion of CSAV has also been driven by geographical factors. With 6,435 km of coastline, extending 4,270 km from North to South, Chile had to develop long-distance national maritime transportation networks in order to reach remote regions at affordable freight rates. Chile has a high demand for maritime transport, sending 95 per cent of its exports (mostly agricultural products and copper) by sea. Owing to its geographical location, Chilean ship operators have been able to optimize the capacity utilization of vessels by loading and discharging cargo at stopovers along the coast of South America located on regional and international trade routes. Moreover, the country’s containerized international trade is relatively balanced, with slightly more exports than imports, whereas other countries on the west coast of South America have a trade deficit in containerized transport.13 Chile adopted policies that aimed to liberalize international transport
services earlier than most other Latin American countries did, and this has given impetus for national ship operators to modernize and internationalize their businesses.
4. Shipscrapping
The competitiveness of a country’s scrapping industry is mostly influenced by labour costs and the regulatory environment. All major ship scrapping countries are developing countries. Ship scrapping has reached a similar level of market concentration as ship building. The four largest ship scrapping countries covered 98.1 per cent of the activity in terms of recycled dwt in 2010 (table 6.7). India ranked first with 9.3 million dwt, followed by Bangladesh with 6.8 million dwt, and then China with 5.8 million dwt and Pakistan with 5.1 million dwt. Each of these countries is home to more then 100 companies that are involved in the ship scrapping business, through which competition is sustained within the sector.14
The types of ship scrapped vary from one country to another: India focuses on tankers (representing a 46 per cent share of its dwt) and on dry cargo and passenger ships (33 per cent share of its dwt); China

Review of MaRitiMe tRanspoRt 2011152
Table 6.7. Top 10 ship-scrapping nations, 2010
Source: Compiled by the UNCTAD secretariat on the basis of data from IHS Fairplay
Country Scrapped amount,
dwt
Accumulated market share,
as a percentage
Number of ships
scrapped
Rank Scrapped ships, percentage of total volume
Bulk carriers
Dry cargo / passenger
Offshore Tankers Others
India 9 287 775 32.4 451 1 9.7 32.8 5.3 46.2 5.9
Bangladesh 6 839 207 56.3 110 2 15.1 5.5 5.7 71.1 2.5
China 5 769 227 76.5 189 3 46.6 36.3 2.5 12.2 2.4
Pakistan 5 100 606 94.3 111 4 8.1 2.9 6.2 80.6 2.2
Turkey 1 082 446 98.1 226 5 24.3 48.7 0.2 14.1 12.8
United States 217 980 98.8 15 6 0.0 19.9 0.0 80.1 0.0
Romania 16 064 98.9 4 7 0.0 100.0 0.0 0.0 0.0
Denmark 15 802 98.9 25 8 0.0 53.4 22.7 0.0 23.9
Japan 13 684 99.0 1 9 0.0 100.0 0.0 0.0 0.0
Belgium 8 807 99.0 12 10 0.0 100.0 0.0 0.0 0.0
World 28 637 092 100.0 1 324 18.6 22.7 4.7 50.0 4.1
specializes in bulk carriers (47 per cent share of its dwt); Pakistan scraps tankers (81 per cent share of its dwt). These differences are also reflected in the average vessel sizes scrapped in the different countries – the size of the average vessel scrapped in Bangladesh is approximately 62,000 dwt, while the average size in China is 31,000 dwt.
Strong steel prices and the recovery of maritime business increased costs for ship procurement but at the same time tripled the margins in the ship scrapping business from 8 per cent in 2009 to 30 per cent in 2010.15 Indian shipbuyers left Asian scrapyards behind, with rates that were lower by about $50 per ldt. Thus, tonnage opening up in Asia was bought by Indian shipbreakers and delivered to their yards.16
Country case study: Bangladesh reopening ship scrapping yards
Bangladesh’s ship scrapping industry provides direct and indirect employment, and is also important to cover the country’s demand for steel. It contributes approximately 50 per cent to the country’s steel-using industries and 20–25 per cent to national steel consumption. In total, approximately 1.5 million tons are supplied by the national ship scrapping industry.17
Bangladesh’s ship scrapping industry came to a halt in 2010 due to an explosion in 2009 that led to the death of four workers. The High Court forced more than 100 shipyards to stop their activities for most of 2010. Only about 20 scrapping yards that acquired certificates guaranteeing better environmental standards were
allowed to continue their operations. The result was temporary job loss for an estimated 100,000 workers who were directly or indirectly employed in the industry. Since a large proportion of the labour force working in ship scrapping is unskilled or even illiterate, these job losses especially affected the poorest households in the country.18
The court ruled that the scrapyards could reopen on 7 March 2011. The reopening of the yards can be expected to have a positive influence on the competitiveness of other heavy industries in the country, since the price of imported steel is higher than the price of steel purchased from national scrapyards. The precise way in which the reopening process and regulatory changes will proceed is still being defined.19
5. Shipfinancing
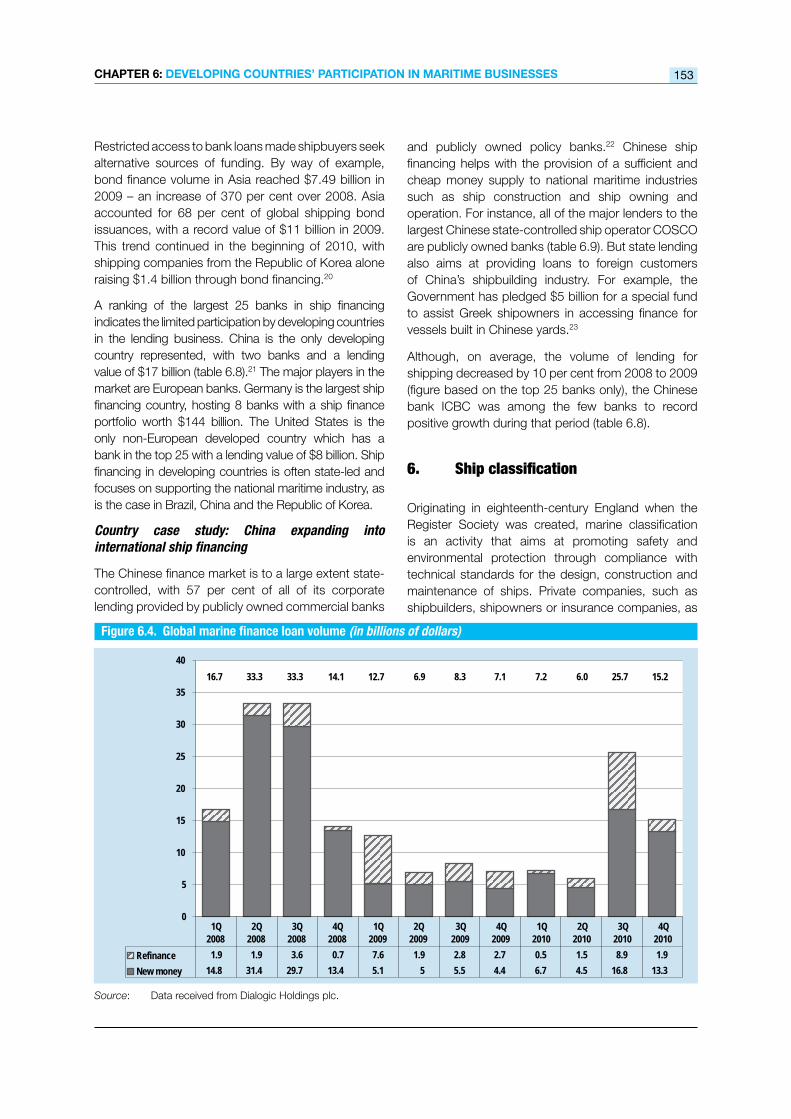
The economic crisis had a severe effect on ship financing. Many banks had to write off a large amount of bad assets from their balance sheets, and were very reluctant to enter into any new ship financing deals. In addition, the demand for maritime freight transport collapsed, as did freight rates and vessel values, which put pressure on shipowners’ and ship operators’ profit margins (see chapters 2 and 3). This led to a downturn in business in the fourth quarter of 2008, with new ship finance deals amounting to only $14.1 billion, compared with $33.2 billion one quarter earlier in the same year. The market began to recover in the third quarter of 2010 with a deal value of $25.7 billion (see figure 6.4).
CHapteR 6: DeveLopinG CoUntRies’ paRtiCipation in MaRitiMe BUsinesses 153
Restricted access to bank loans made shipbuyers seek alternative sources of funding. By way of example, bond finance volume in Asia reached $7.49 billion in 2009 – an increase of 370 per cent over 2008. Asia accounted for 68 per cent of global shipping bond issuances, with a record value of $11 billion in 2009. This trend continued in the beginning of 2010, with shipping companies from the Republic of Korea alone raising $1.4 billion through bond financing.20
A ranking of the largest 25 banks in ship financing indicates the limited participation by developing countries in the lending business. China is the only developing country represented, with two banks and a lending value of $17 billion (table 6.8).21 The major players in the market are European banks. Germany is the largest ship financing country, hosting 8 banks with a ship finance portfolio worth $144 billion. The United States is the only non-European developed country which has a bank in the top 25 with a lending value of $8 billion. Ship financing in developing countries is often state-led and focuses on supporting the national maritime industry, as is the case in Brazil, China and the Republic of Korea.
Country case study: China expanding into international ship financing
The Chinese finance market is to a large extent state-controlled, with 57 per cent of all of its corporate lending provided by publicly owned commercial banks
and publicly owned policy banks.22 Chinese ship financing helps with the provision of a sufficient and cheap money supply to national maritime industries such as ship construction and ship owning and operation. For instance, all of the major lenders to the largest Chinese state-controlled ship operator COSCO are publicly owned banks (table 6.9). But state lending also aims at providing loans to foreign customers of China’s shipbuilding industry. For example, the Government has pledged $5 billion for a special fund to assist Greek shipowners in accessing finance for vessels built in Chinese yards.23
Although, on average, the volume of lending for shipping decreased by 10 per cent from 2008 to 2009 (figure based on the top 25 banks only), the Chinese bank ICBC was among the few banks to record positive growth during that period (table 6.8).
6. Shipclassification
Originating in eighteenth-century England when the Register Society was created, marine classification is an activity that aims at promoting safety and environmental protection through compliance with technical standards for the design, construction and maintenance of ships. Private companies, such as shipbuilders, shipowners or insurance companies, as
Figure 6.4. Global marine finance loan volume (in billions of dollars)
Source: Data received from Dialogic Holdings plc.
0
5
10
15
20
25
30
35
40
Refinance 1.9 1.9 3.6 0.7 7.6 1.9 2.8 2.7 0.5 1.5 8.9 1.9New money 14.8 31.4 29.7 13.4 5.1 5 5.5 4.4 6.7 4.5 16.8 13.3
1Q 2008
2Q 2008
3Q 2008
4Q 2008
1Q 2009
2Q 2009
3Q 2009
4Q 2009
1Q 2010
2Q 2010
3Q 2010
4Q 2010
16.7 33.3 33.3 14.1 12.7 6.9 8.3 7.1 7.2 6.0 25.7 15.2

Review of MaRitiMe tRanspoRt 2011154
Table 6.8. World’s largest ship-financing banks, total lending portfolio, 2009
Source: Data from Marine Money. Available at http://www.marinemoney.com (accessed in April 2011).
Bank Country 2009 (billions
of dollars)
2008–2009 increase / decrease
percentage
HSH Nordbank Germany 49.3 -8.7
Deutsche Schiffsbank Germany 33.3 -11.5
DnB NOR Norway 28.0 -8.0
Royal Bank of Scotland United Kingdom 23.0 -7.0
KfW IPEX-Bank Germany 20.3 -0.4
Nordea Sweden 18.4 -1.1
BNP Paribas France 18.0 6.0
Lloyds Banking Group United Kingdom 16.9 4.7
CA-CIB France 13.9 -4.8
DVB Germany 13.1 -1.5
Bank of China China 12.2 0.0
UniCredit (ex-HVB) Italy 11.4 0.2
Danish Ship Finance Denmark 11.3 0.0
Bremer Landesbank Germany 9.8 -0.2
Deutsche Bank Germany 9.5 -1.8
Citi United States 8.0 -1.5
Danske/Focus Bank Norway 8.0 -0.2
SEB Germany 6.1 -0.4
Natixis France 4.8 -0.2
ICBC China 4.7 2.5
Fortis Belgium 4.2 -0.9
Helaba Germany 3.0 -0.5
Alpha Bank Greece 2.8 0.1
Marfin Bank Cyprus 1.9 0.0
Bank of Ireland Ireland 1.4 -0.4
Total (25 banks) - 333.3 -10.0
well as government authorities, rely on “classification societies” for these purposes. In particular, the flag state authority will require that a marine classification society has a ship “classed” before it can be admitted for registration in the country’s national fleet.
The market for ship classification is effectively dominated by a group of service providers that are members of the International Association of Classification Societies (IACS). IACS currently has 12 members and accounts for the classification of more than 90 per cent of world tonnage. The entire classification market is estimated to be worth $5 billion each year.24 Three classification societies from developing countries are members of IACS
(China, India and the Republic of Korea) and together account for less than 15 per cent of IACS tonnage (table 6.10). The largest ship classification society is Nippon Kaiji Kyokai (Japan) with a classed tonnage in 2010 of 177 million GT. The largest provider from a developing country is Korean Register of Shipping, which has a classed tonnage of 42 million GT. Klasifikasi Indonesia ranks first among the non-members of IACS, and accounts for approximately 0.6 per cent of the global market.
Being a member of IACS brings several benefits, notably that flag states prefer to work with IACS members. IACS has also consultative status with the International Maritime Organization (IMO) and contributes to the interpretation and formulation of maritime regulations adopted by IMO member states. IACS participates in the development of classification standards for the maritime industry.
In previous years, criticism was levelled at IASC for its restrictive policies regarding entry to the organization and for a lack of transparency in the setting of classification standards. This came to an end with a European Commission antitrust investigation that wound up in 2009. The investigation led to several commitments from IACS members. Transparency on membership criteria had to be increased. In addition, IACS committed itself to integrate non-IACS members into the technical working groups and to publish all technical background documents on classification standards. Furthermore, the organization created an independent body that can settle disputes with regard to the granting or withdrawal of IACS membership.25 The Indian Register of Shipping (IRS) was the first applicant to receive IACS membership after conclusion of the European Commission’s antitrust investigation.
Country case study: India joining the International Association of Classification Societies
The Indian Register of Shipping is a relatively small classification society, which in 2009 classified 961 ships totalling 7.6 million dwt. Its world market share is approximately 0.8 per cent.
IRS applied for membership of IACS in 1991, and was initially given associate member status. This was converted into full membership in 2010. Previously, most Indian shipowners went through a dual classification process, with approval from an IACS member and from IRS.26 With full IACS membership, IRS can now provide all necessary services and can grow its classification business in foreign markets more easily.

CHapteR 6: DeveLopinG CoUntRies’ paRtiCipation in MaRitiMe BUsinesses 155
Table 6.9. Lenders to COSCO (in billions of yuan)
Bank Committed credit
Shareholder Amount drawn Balance
China Merchant Bank 6.6 public 2.8 3.8
Agricultural Bank of China 8.7 public 3.5 5.2
Bank of China 11.0 public 6.1 4.9
Bank of Communications 6.5 public 0.8 5.7
China Everbright Bank 0.5 public 0.0 0.5
China CITIC Bank 3.3 public 0.6 2.7
Bank of Construction 3.0 public 0.6 2.4
Shenzhen Development Bank 1.2 public 1.2 0.0
Industrial and Commercial Bank of China 1.4 public 0.7 0.7
Other lenders 8.8 - 4.6 4.2
Total 51.0 21.1 29.9
Source: Data from Marine Money. Available at http://www.marinemoney.com (accessed in April 2011).
Table 6.10. Top 20 classification societies, 2010
Society IACS member
Average ship age in years
Number of
ships
Millions of GT
GT share, percentage
Accumulated GT share,
percentage
2006 millions
of GT
Increase in GT
2006–2010 percentage
Nippon Kiji Kyokai Yes 10.8 7 000 177.3 18.4 18.4 144.5 22.7
Lloyd’s register Yes 15.3 6 433 155.4 16.1 34.5 132.4 17.4
American Bureau Yes 15 7 351 152.5 15.8 50.4 110.1 38.5
Det Norske Veritas Yes 12.9 4 831 141.3 14.7 65.0 113.5 24.5
Germanischer Lloyd Yes 12.7 5 763 93.9 9.7 74.8 62.8 49.5
Bureau Veritas Yes 13.1 6 385 73.0 7.6 82.4 53.1 37.5
Korean Register Yes 14.5 2 023 42.1 4.4 86.7 29.7 41.8
China Class Yes 13.1 2 220 42.0 4.4 91.1 26.9 56.1
Registro Italiano Yes 19.4 2 020 28.0 2.9 94.0 20.2 38.6
Russian Register Yes 25.3 3 214 13.5 1.4 95.4 14.3 -5.6
Indian Register Yes 16.1 961 7.6 0.8 96.2 7.9 -3.8
Klasifikasi Indonesia No 20.4 2 984 5.2 0.5 96.7 4.3 20.9
Vietnam Register No 14.4 893 3.9 0.4 97.1 2.8 39.3
Polski Rejestr No 30.3 366 2.7 0.3 97.4 3.3 -18.2
Hellenic Register No 30 418 2.3 0.2 97.7 2.7 -14.8
Türk Loydu No 27.1 613 1.5 0.2 97.8 1.5 0.0
Croatia Yes 32.4 208 0.9 0.1 97.9 1.1 -18.2
Bulgarian Register No 32.8 148 0.7 0.1 98.0 1.1 -36.4
China, Corporation No 25 37 0.3 0.0 98.0 0.7 -57.1
Russian River No 33.9 111 0.3 0.0 98.0 0.3 0.0
Total - 15.3 53 979 944.4 98.0 98.0 733.2 28.8
World Fleet - 21.1 83 670 963.3 100.0 100.0 726.2 32.6
Source: Clarkson Research Services. World Fleet Monitor. As at 1 January 2011.

Review of MaRitiMe tRanspoRt 2011156
The case of India’s classification society suggests that having access to a national market of considerable size facilitates the process of admission to IACS. This allowed IRS to build up expertise and sufficient organizational size and experience in order to meet the exacting IACS membership criteria.27
7. Shipregistration
The four largest vessel registries are in developing economies: Panama, Liberia, the Marshall Islands, and Hong Kong (China). Together, these four territories provide their flag to 47.5 per cent of the world fleet (in dwt, see table 2.7 in chapter 2). These are “open registries”, which also provide registration services to non-national shipowners and ship operators. Over time, there has been a significant rise in the share of foreign-flagged tonnage, which indicates the competitiveness and increasing relevance of this type of registry in the business (see also figure 2.4). Thus, the major ship registries in developing economies have grown at the pace of the global fleet or faster than it. Liberia, the Marshall Islands and Hong Kong (China) have seen annual growth of approximately 10 per cent between 2006 and 2011.
A recent cost comparison of major open registries, undertaken by Combined Maritime Limited, concluded that no flag offers the lowest fees for all vessel types, sizes and ages.28 Accordingly, different registries specialize in different market segments (see also figure 2.5).
Many of the countries that have established open registries are also important providers of other services (including offshore banking), or have attracted company headquarters by offering low corporate tax rates. These include several small island developing States, which may find in ship registration a source of income that their geographical location and small population could not otherwise provide.
Running an open registry implies relatively high fixed costs to maintain a network of offices. In addition, strategic partnerships with classification societies have to be built up. This has prevented major newcomers in this business in recent years. Registration fees need to be kept competitive in a market where shipowners can change their vessel’s flag relatively easily. It is also important to run a registry on high safety standards in order to avoid port state control inspections or higher insurance premiums for shipowners.
Entering the business of vessel registration in practice requires close cooperation with partner firms in
developed countries. The registry of Panama, for example, has received technical assistance from the Government of Japan; and the registries of Liberia and the Marshall Islands are both effectively managed by companies based in the United States. Also, the certification of ships is usually outsourced to foreign classification societies.
Country case study: Panama, the world’s first open registry
Panama is the largest provider of ship registration services, with a market share of 21.9 per cent of the world’s dwt. Panama’s ship registration services experienced an annual growth rate of 7.4 per cent between 2006 and 2011. The structure of the ship types registered in Panama, which is dominated by dry bulk carriers and oil tankers, has not undergone significant changes in the past fifteen years (figure 6.5).
Panama was the first modern open registry. It was set up in 1917, and mostly targeted owners from the United States. At that time, the geographical location near the United States–administered Panama Canal, with a large amount of ship traffic and therefore contact with potential customers, may have been a comparative advantage. Benefiting from a first mover advantage, the country established consular networks and built up cooperation with classification societies, shipowners and nautical schools. This allowed Panama to provide round-the-clock services at competitive prices.
Panama has recently moved up to the white list of the Paris Memorandum of Understanding on Port State Control (Paris MOU) regime.29 Inclusion on the white, grey or black list of the Paris MOU reflects the results of random ship inspections. Inclusion on the white list implies that Panama-flagged ships are less likely to be found with deficiencies. For shipowners who have registered their ships in Panama, it means that their vessels are less likely to be physically inspected when calling at European ports.
8. Shipinsurance(protectionandindemnity)
The global maritime liability insurance market is highly concentrated in developed countries, and mostly in the hands of the 13 members of the International Group of P&I Clubs (IGP&I) which accounts for approximately 90 per cent of the world’s seagoing tonnage.30 Private companies that offer fixed-premium insurance

CHapteR 6: DeveLopinG CoUntRies’ paRtiCipation in MaRitiMe BUsinesses 157
Figure 6.5. Panama-registered fleet, 1995–2011 (in thousands of dwt)
Source: Compiled by the UNCTAD secretariat on the basis of data supplied by IHS Fairplay.
0
100 000
200 000
300 000
400 000
Year and status on Paris MOU targeting list
Ship
type
Other types of ships 5 167 5 617 6 404 7 011 9 027 10 664 10 962 11 732 7 852 6 842 6 920 6 477 8 005 8 508 12 591 12 781 12 093
Container ships 6 262 7 622 8 825 11 633 13 295 14 118 14 676 16 955 18 223 20 647 21 779 23 282 26 726 30 007 34 345 33 879 35 795
General cargo ships 13 962 13 519 13 785 13 794 14 369 14 834 14 552 14 281 13 863 13 452 13 935 15 094 15 807 17 274 18 842 18 089 18 360
Bulk carriers 38 244 46 349 57 842 68 096 71 842 76 149 81 721 89 516 89 921 92 740 97 404 108 315 120 256 130 433 141 357 154 645 172 640
Oil tankers 34 295 36 408 38 309 38 669 41 988 43 182 50 444 52 567 56 541 53 180 55 248 57 953 61 200 66 342 66 826 69 363 67 141
1995 1996 1997 1998 1999 2000 2001 2002 2003 2004 2005 2006 2007 2008 2009 2010 2011
black grey grey black blackblackblackn.a.n.a.n.a.n.a. black blackblack black grey white
policies struggle to compete with the P&I clubs. Only a few relatively small players manage to grasp some market share, such as British Marine, whose size is comparable to the tonnage of the American Club of Shipowners (based on entered GT) – the smallest P&I club in the International Group.
Each P&I club is an independent, not-for-profit, mutual insurance association that provides risk coverage for its shipowner and charterer members against third-party liabilities including personal injury to crew, passengers and others on board, cargo loss and damage, oil pollution, wreck removal and dock damage.
P&I clubs often accept members from beyond their head-office country. For instance, almost half of the tonnage in the UK P&I Club is from Asian members, and two thirds of the members of the Japan P&I Club are, in terms of dwt, are from the Americas (table 6.11).
As not-for-profit organizations, the P&I clubs invest savings on behalf of their members. Clubs also provide a wide range of services to their members on claims, legal issues and loss prevention, and often play a leading role in the management of casualties. Mutual insurance associations depend on a large membership to spread the risk.
The main entry barrier to new shipping insurance companies lies in the large reserves that need to be
built up to avoid having to look for reinsurance on the open market at relatively high costs. In addition, building up reserves requires financial commitment from the new members. Comparing the $14 million reserves of the Korea P&I Club with the $1.9 billion of Gard illustrates the finance gap between large and small P&I clubs. The P&I clubs that are members of the IGP&I can also share claims exceeding $8 million, arrange reinsurance programmes, and negotiate contract terms at a competitive price level.31 The established P&I clubs can rely on a worldwide network of offices that are familiar with the local regulatory framework and are in a position to deliver legal advice. With their historical data and accumulated experience, established P&I clubs have the required capacities to assess the fleets of new and existing members and to maintain a balanced risk structure among members.
The location of the headquarters of today’s major clubs is mostly driven by historical reasons and from cluster benefits that stem from being close to banks, insurance companies, law firms and other marine service providers. Only a few developing – or even developed – countries are in a position to offer a comparable competitive setting. However, the following country case studies, which look at China and the Republic of Korea, show that new

Review of MaRitiMe tRanspoRt 2011158
Source: Willis Group. Protection and Indemnity: Market Review 2010/2011. Available at http://www.willis.com/Documents/Pu-blications/Industries/Marine/AnimatedPDF/dec2010/index.html (accessed in September 2011).
Table 6.11. Membership of the International Group of P&I Clubs
2008 Entered tonnage, 1 000 GT
2010 Entered
tonnage, 1 000 GT
Share of entered
tonnage, percentage
2009/10 Calls and
premiums, $ million
GT by nationality of management as percentages P&I club Europe Asia Africa
(Middle East)
Americas Others/ not
defined
American Club 13 300 15 283 1.4 115.7 58.2 22.8 1.6 13.6 3.8
Britannia 129 000 138 000 12.6 289.6 41.7 48.9 2.6 6.4 0.4
Gard (Norway) 170 100 184 900 16.9 447.6 68.0 22.0 0.0 10.0 0.0
Japan P&I Club 96 080 102 030 9.3 231.0 0.0 24.4 3.1 67.8 4.7
London Steam-Ship 40 156 40 615 3.7 121.0 64.0 29.0 2.0 3.0 2.0
North of England Club 90 000 114 400 10.4 285.1 44.0 26.0 14.0 10.0 6.0
Shipowners (Luxembourg) 15 614 16 933 1.5 174.2 31.0 36.0 9.0 24.0 0.0
Skuld (Norway) 91 142 n.a. 0.0 255.4 63.0 28.0 2.0 7.0 0.0
Standard (Bermuda) 73 020 110 000 10.0 250.3 50.0 20.0 0.0 22.0 8.0
Steamship (Bermuda) 71 800 82 800 7.6 305.4 30.1 40.1 9.0 20.8 0.0
UK P&I Club 161 000 176 500 16.1 447.2 46.0 36.0 0.0 12.0 6.0
West of England 69 700 68 800 6.3 239.6 45.6 33.0 8.3 13.1 0.0
The Swedish Club 37 930 45 300 4.1 78.7 45.0 54.0 1.0 0.0 0.0
Total (available data) 1 058 842 1 095 561 100.0 3 240.8 44.4 32.0 3.6 17.1 3.0
market players from developing countries are emerging which have the potential to grab market share from the established P&I clubs of the International Group.
Country case study: China and the Republic of Korea strengthening their P&I business
As developing countries expand their own banking, insurance and services sectors, it is to be expected that, at some point in time, shipowners will consider it beneficial to be members of local clubs closer to home or in which most fellow members have similar interests and backgrounds. In recent years, several developing countries in Asia – notably China and the Republic of Korea – have built up their own P&I clubs. The China P&I Club and the Korea P&I Club are both willing to join the IGP&I. Reportedly, formal approval of the China P&I Club joining IGP&I is expected in February 2012, and observers anticipate that the Korea P&I Club will be approved in the near future too.32
The China P&I Club, which was set up in 1984, hosts members from China, Hong Kong SAR, Singapore, and elsewhere in Asia. The club holds a free reserve of around $355 million, and it insures some 24 million GT. Compared to the UK P&I Club’s 176.5 million GT,
this is still a relatively small account. The Korea P&I Club comprises more than 900 ships with around 9 million GT, and at the end of 2010 had free reserves estimated at $14 million.33
9. Seafarersupply
The 20 biggest suppliers of seafarers, as per the definition of the Baltic and International Maritime Council (BIMCO), are displayed in table 6.12. This table covers two different employment groups: officers and ratings.
Seven out of the ten biggest suppliers of ratings are developing countries. China ranks first with 90,295 ratings and a share of 12.1 per cent, followed by Indonesia with 61,821 ratings.
Increasingly, developing countries are also supplying officers. While the largest academies for marine officers have traditionally been in developed countries, the six largest suppliers today are in developing/transition economies. The Philippines leads the ranking with 57,688 officers (2010 figures); China comes second with 51,511 officers. Next is India, with 46,497 officers employed. Taken together, these three countries account for one quarter of the world’s supply.

CHapteR 6: DeveLopinG CoUntRies’ paRtiCipation in MaRitiMe BUsinesses 159
Table 6.12. The 20 biggest suppliers of officers and ratings in 2010
Source: Compiled by the UNCTAD secretariat on the basis of data supplied by BIMCO in Manpower Update (2010).
Country Number of officers supplied
Market share
officers, percentage
of world
Accumulated market share,
percentage of world
Country Number of ratings supplied
Market share
ratings, percentage of world
Accumulated market share,
percentage of world
Philippines 57 688 9.2 9.2 China 90 296 12.1 12.1
China 51 511 8.3 17.5 Indonesia 61 821 8.3 20.4
India 46 497 7.5 24.9 Turkey 51 009 6.8 27.2
Turkey 36 734 5.9 30.8 Russian Federation 40 000 5.4 32.5
Ukraine 27 172 4.4 35.2 Malaysia 28 687 3.8 36.4
Russian Federation 25 000 4.0 39.2 Philippines 23 492 3.1 39.5
United States 21 810 3.5 42.7 Bulgaria 22 379 3.0 42.5
Japan 21 297 3.4 46.1 Myanmar 20 145 2.7 45.2
Romania 18 575 3.0 49.1 Sri Lanka 19 511 2.6 47.8
Poland 17 923 2.9 52.0 United States 16 644 2.2 50.0
Norway 16 082 2.6 54.5 India 16 176 2.2 52.2
Indonesia 15 906 2.5 57.1 Honduras 15 341 2.1 54.3
United Kingdom 15 188 2.4 59.5 Cambodia 12 004 1.6 55.9
Canada 13 994 2.2 61.8 Viet Nam 11 438 1.5 57.4
Croatia 11 704 1.9 63.6 Italy 11 390 1.5 58.9
Myanmar 10 950 1.8 65.4 Ukraine 11 000 1.5 60.4
Bulgaria 10 890 1.7 67.1 Pakistan 9 327 1.2 61.6
Viet Nam 10 738 1.7 68.8 France 9 316 1.2 62.9
Greece 9 993 1.6 70.5 Egypt 9 000 1.2 64.1
Republic of Korea 9 890 1.6 72.0 United Kingdom 8 990 1.2 65.3
World 624 062 100.0 100.0 World 747 306 100.0 100.0
The evolution confirms the changing role of developing nations in this business. Developing countries now supply crews with broader and higher educational profiles. Notably, Cambodia and Myanmar (two LDCs) are among the major suppliers, with Myanmar in the top 20 for supply of officers. This suggests that the education of seafarers is also a development opportunity for LDCs, providing access to foreign currency revenue.34
Country case study: Philippines becoming the world’s largest supplier of maritime officers
The Philippines is a typical example of an economy that has diversified its maritime industry. According to the Philippine Overseas Employment Administration (table 6.13), approximately 330,000 Philippine seafarers were employed on maritime vessels in 2009 (note that this is not fully comparable with the data provided by BIMCO, which only includes seafarers currently registered and licensed in accordance with the IMO STCW convention).
According to the Philippine Joint Manning Group, almost 30 per cent of the world’s employed seafarers come from the Philippines, and this group has set a target of increasing the share to 50 per cent in 2016.35; 36 The territory of the Philippines comprises 7,107 islands and 36,289 km of coastline, which historically has led to high national levels of demand for seafarers. In addition, the Philippines has invested in an educational infrastructure of 100 maritime academies which graduate some 40,000 seafarers each year. In addition, there are 421 licensed crewing agents in the country.37
This sector is also important to the country’s economic welfare. Out of the $16 billion generated by Philippine nationals employed outside the country, $7 billion is contributed by seafarers.38 Remittances from workers employed overseas prevent up to 3 million Philippine nationals from falling below the poverty line.39
Table 6.13 specifies the flags employing Philippine seafarers. Panama is first, employing 67,000

Review of MaRitiMe tRanspoRt 2011160
Table 6.13. Top 10 flags employing Philippine seafarers, and top 10 occupations of Philippine seafarers
Source: Compiled by the UNCTAD secretariat based on data from the Philippine Overseas Employment Administration.
Note: Data not fully comparable with that in table 6.12.
Country 2007 2008 2009 Occupation 2007 2008 2009
Panama 51 619 53 912 67 362 Able Seaman 31 818 34 563 45 338
Bahamas 29 681 29 177 36 054 Oiler 19 491 20 941 27 483
Liberia 21 966 21 632 29 796 Ordinary Seaman 17 355 18 715 23 737
Marshall Islands 9 772 11 859 18 068 Chief Cook 7 778 9 022 12 651
Singapore 10 308 12 130 15 674 Second mate 7 873 8 694 12 119
Malta 7 513 11 025 14 786 Bosun 7 737 8 603 11 555
Norway 8 188 8 883 11 447 Messman 7 810 8 320 10 536
United Kingdom 8 172 8 232 10 313 Third engineer officer 7 056 7 995 11 307
Cyprus 7 052 7 446 9 425 Third mate 6 559 7 349 9 857
Netherlands 7 017 7 796 9 281 Second engineer officer 6 369 6 878 9 557
Total top 10 161 288 172 092 222 206 Total top 10 119 846 131 080 174 140
Total 226 900 244 144 329 728 Total 226 900 244 144 329 728
Philippine seafarers, followed by the Bahamas with 36,000 and Liberia with 30,000. But flags from developed countries are in the top 10 list too – such as Malta, the Netherlands and the United Kingdom. The total number of Philippine seafarers employed has experienced continuous growth, with an increase of 45 per cent between 2006 and 2009.
10. Portoperation(containerterminaloperators)
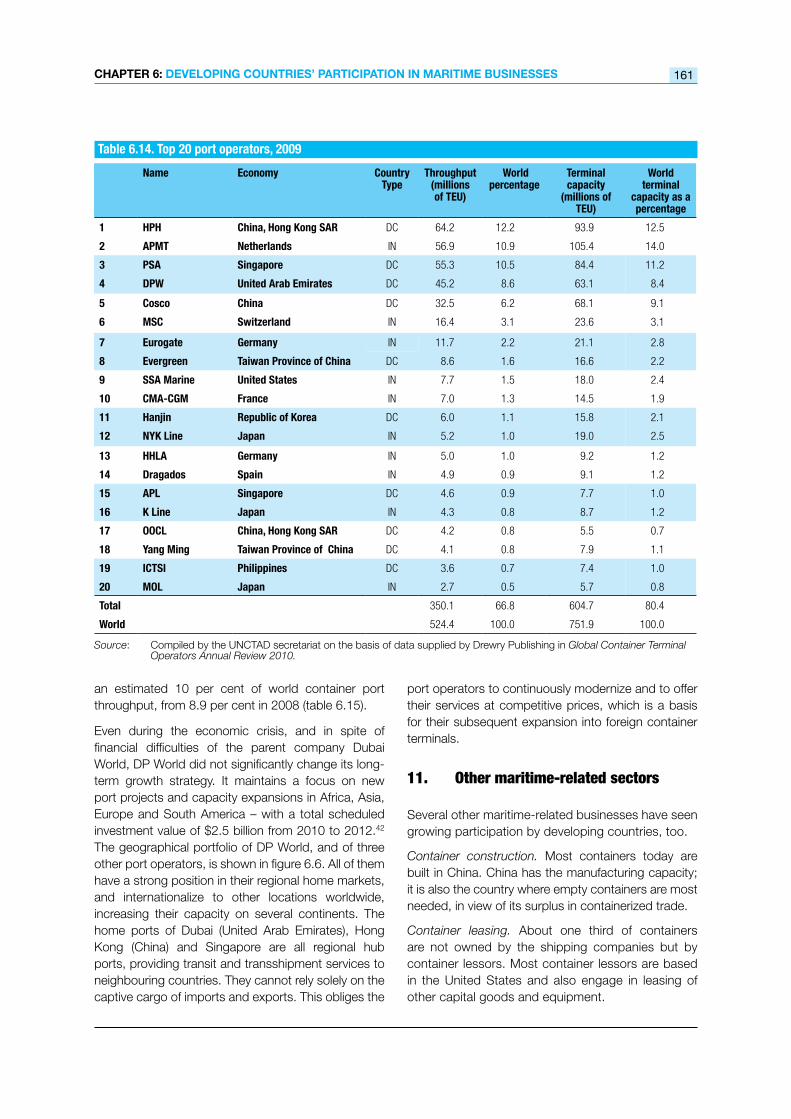
With the increased containerization of manufactured goods trade, and the extended use of transshipment “hubs”, containerized port traffic has grown at high annual rates (see also chapter 4). Today, containerized port traffic is mostly handled by global operators, many of which are companies from developing countries. Table 6.14 lists the world’s largest container terminal operators. The three largest service terminal operators are Hutchison Port Holdings (HPH), APM Terminals, and the Port of Singapore Authority (PSA). Together they handle about 34 per cent of the world’s container traffic.
None of the major container terminal operators entered the business as a complete newcomer. Several of them were initially operating in a home port and subsequently took on concessions in foreign ports; this is the case of HPH and PSA, coming from two of the world’s busiest container ports, namely Hong Kong (China) and Singapore. Other operators
were linked to a shipping company that initially focused on dedicated terminal operations for the mother company. Today, the distinction is becoming less relevant. APM Terminals, for example, although belonging to the same group as the Maersk shipping line, provides services to all shipping companies.
Country case study: United Arab Emirates: Recovery of Dubai Ports World from the economic crisis
The case of Dubai and port operator Dubai Ports World (DP World) is an example of a logistics provider expanding its operations abroad. DP World started taking on concessions in foreign ports slightly later than most of its main competitors. Its growth was partly realized through the purchase of P&O from the United Kingdom in 2006, which at that time was the world’s fourth-largest ports operator. Today, DP World operates around 50 terminals in more than 30 countries.40
DP World has realized relatively stable profits during the past four years, managing to preserve them despite a fall in TEU throughput of 7.9 per cent between 2008 and 2009, which was still better than the total world decline of almost 10 per cent.41
One reason for the company’s resilience to economic turbulence lies in its geographical presence, which is evenly spread over all continents, with a focus on the Middle East (figure 6.6). DP World has grown faster than the market during the economic recovery that began in 2009, increasing its market share to
CHapteR 6: DeveLopinG CoUntRies’ paRtiCipation in MaRitiMe BUsinesses 161
Table 6.14. Top 20 port operators, 2009
Source: Compiled by the UNCTAD secretariat on the basis of data supplied by Drewry Publishing in Global Container Terminal Operators Annual Review 2010.
Name Economy Country Type
Throughput (millions of TEU)
World percentage
Terminal capacity
(millions of TEU)
World terminal
capacity as a percentage
1 HPH China, Hong Kong SAR DC 64.2 12.2 93.9 12.5
2 APMT Netherlands IN 56.9 10.9 105.4 14.0
3 PSA Singapore DC 55.3 10.5 84.4 11.2
4 DPW United Arab Emirates DC 45.2 8.6 63.1 8.4
5 Cosco China DC 32.5 6.2 68.1 9.1
6 MSC Switzerland IN 16.4 3.1 23.6 3.1
7 Eurogate Germany IN 11.7 2.2 21.1 2.8
8 Evergreen Taiwan Province of China DC 8.6 1.6 16.6 2.2
9 SSA Marine United States IN 7.7 1.5 18.0 2.4
10 CMA-CGM France IN 7.0 1.3 14.5 1.9
11 Hanjin Republic of Korea DC 6.0 1.1 15.8 2.1
12 NYK Line Japan IN 5.2 1.0 19.0 2.5
13 HHLA Germany IN 5.0 1.0 9.2 1.2
14 Dragados Spain IN 4.9 0.9 9.1 1.2
15 APL Singapore DC 4.6 0.9 7.7 1.0
16 K Line Japan IN 4.3 0.8 8.7 1.2
17 OOCL China, Hong Kong SAR DC 4.2 0.8 5.5 0.7
18 Yang Ming Taiwan Province of China DC 4.1 0.8 7.9 1.1
19 ICTSI Philippines DC 3.6 0.7 7.4 1.0
20 MOL Japan IN 2.7 0.5 5.7 0.8
Total 350.1 66.8 604.7 80.4
World 524.4 100.0 751.9 100.0
an estimated 10 per cent of world container port throughput, from 8.9 per cent in 2008 (table 6.15).
Even during the economic crisis, and in spite of financial difficulties of the parent company Dubai World, DP World did not significantly change its long-term growth strategy. It maintains a focus on new port projects and capacity expansions in Africa, Asia, Europe and South America – with a total scheduled investment value of $2.5 billion from 2010 to 2012.42 The geographical portfolio of DP World, and of three other port operators, is shown in figure 6.6. All of them have a strong position in their regional home markets, and internationalize to other locations worldwide, increasing their capacity on several continents. The home ports of Dubai (United Arab Emirates), Hong Kong (China) and Singapore are all regional hub ports, providing transit and transshipment services to neighbouring countries. They cannot rely solely on the captive cargo of imports and exports. This obliges the
port operators to continuously modernize and to offer their services at competitive prices, which is a basis for their subsequent expansion into foreign container terminals.
11. Othermaritime-relatedsectors
Several other maritime-related businesses have seen growing participation by developing countries, too.
Container construction. Most containers today are built in China. China has the manufacturing capacity; it is also the country where empty containers are most needed, in view of its surplus in containerized trade.
Container leasing. About one third of containers are not owned by the shipping companies but by container lessors. Most container lessors are based in the United States and also engage in leasing of other capital goods and equipment.

Review of MaRitiMe tRanspoRt 2011162
Figure 6.6. Regional focus of major port operators
Source: DP World company presentations, available at http://www.dpworld.com and accessed in April 2011.
7% 6%
10%
19%
29%
56%
81%
11%
30%
28%
18%
1%
5%
40%
2%
13%
6%
2%
1%
4%
20%
11%
0% 10% 20% 30% 40% 50% 60% 70% 80% 90% 100%
Dubai Port World
APM Terminals
Hutchison Port Holdings
Port of Singapore Authority
Oceania Africa Middle East East and South-East Asia Europe South Asia Americas
Performance Indicators Dubai Ports World 2007 2008 2009 2010
Consolidated throughput TEU million 24.0 27.8 25.6 27.8
Terminal utilization rate, percentage 81.0 80.0 74.0 80.0
Revenue, $ million 2 613 3 283 2 821 3 078
Adjusted EBITDA, $ million 1 063 1 340 1 072 1 240
Adjusted EBITDA margin, percentage 40.7 40.8 38.0 40.3
TEU throughput world market, percentage 8.8 8.9 9.5 10.0
Table 6.15. Performance figures of Dubai Ports World
Source: DP World company presentations, available at http://www.dpworld.com and accessed in April 2011. Also, data re-ceived directly from DP World.
CHapteR 6: DeveLopinG CoUntRies’ paRtiCipation in MaRitiMe BUsinesses 163
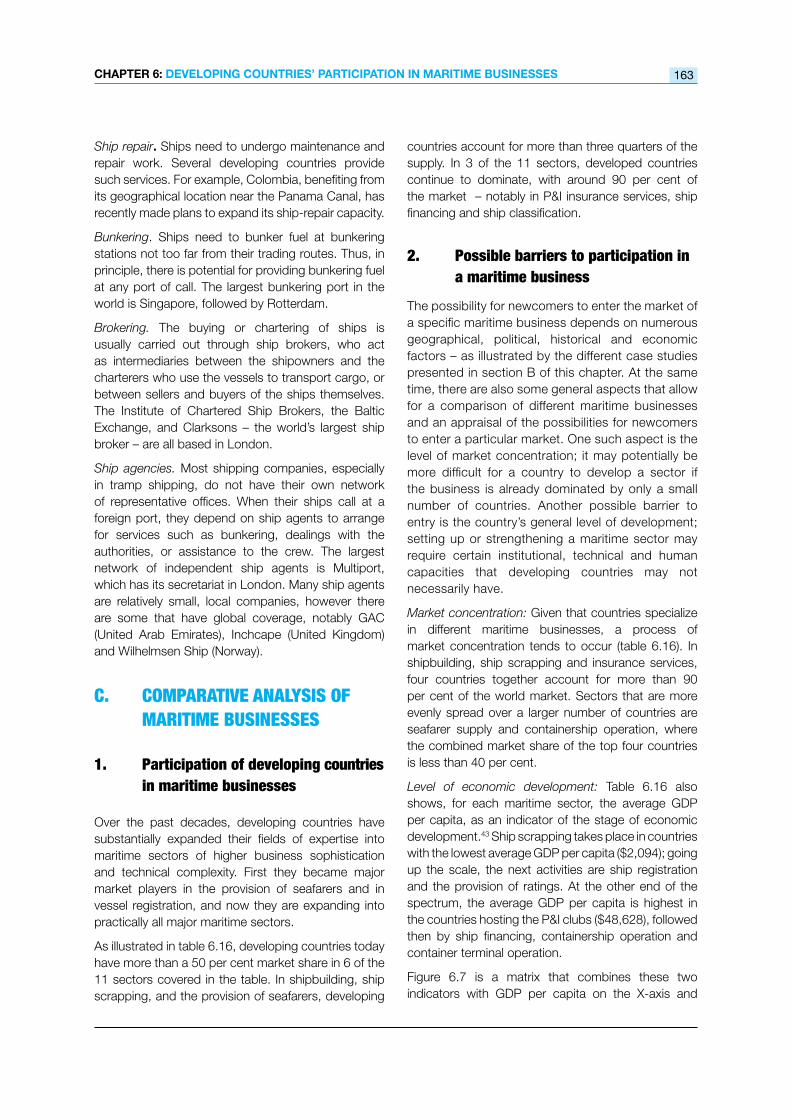
Ship repair. Ships need to undergo maintenance and repair work. Several developing countries provide such services. For example, Colombia, benefiting from its geographical location near the Panama Canal, has recently made plans to expand its ship-repair capacity.
Bunkering. Ships need to bunker fuel at bunkering stations not too far from their trading routes. Thus, in principle, there is potential for providing bunkering fuel at any port of call. The largest bunkering port in the world is Singapore, followed by Rotterdam.
Brokering. The buying or chartering of ships is usually carried out through ship brokers, who act as intermediaries between the shipowners and the charterers who use the vessels to transport cargo, or between sellers and buyers of the ships themselves. The Institute of Chartered Ship Brokers, the Baltic Exchange, and Clarksons – the world’s largest ship broker – are all based in London.
Ship agencies. Most shipping companies, especially in tramp shipping, do not have their own network of representative offices. When their ships call at a foreign port, they depend on ship agents to arrange for services such as bunkering, dealings with the authorities, or assistance to the crew. The largest network of independent ship agents is Multiport, which has its secretariat in London. Many ship agents are relatively small, local companies, however there are some that have global coverage, notably GAC (United Arab Emirates), Inchcape (United Kingdom) and Wilhelmsen Ship (Norway).
C. COMPARATIVEANALySISOfMARITIMEBUSINESSES
1. Participationofdevelopingcountriesinmaritimebusinesses
Over the past decades, developing countries have substantially expanded their fields of expertise into maritime sectors of higher business sophistication and technical complexity. First they became major market players in the provision of seafarers and in vessel registration, and now they are expanding into practically all major maritime sectors.
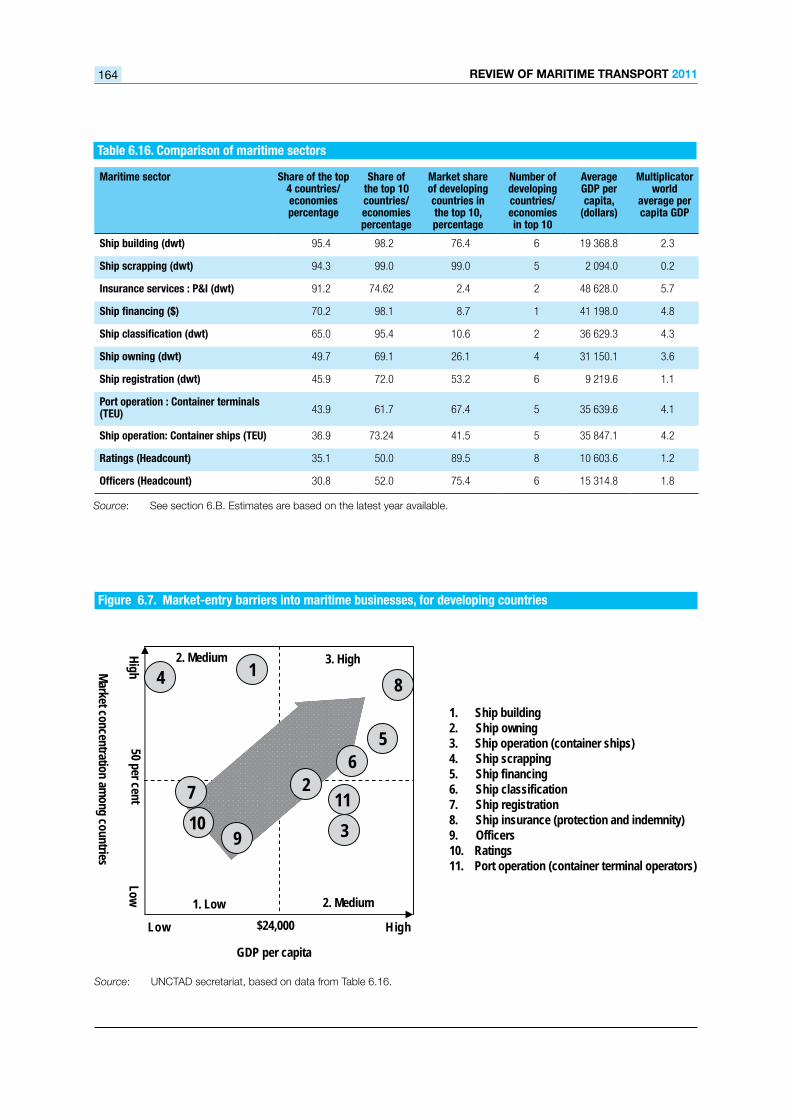
As illustrated in table 6.16, developing countries today have more than a 50 per cent market share in 6 of the 11 sectors covered in the table. In shipbuilding, ship scrapping, and the provision of seafarers, developing
countries account for more than three quarters of the supply. In 3 of the 11 sectors, developed countries continue to dominate, with around 90 per cent of the market – notably in P&I insurance services, ship financing and ship classification.
2. Possiblebarrierstoparticipationinamaritimebusiness
The possibility for newcomers to enter the market of a specific maritime business depends on numerous geographical, political, historical and economic factors – as illustrated by the different case studies presented in section B of this chapter. At the same time, there are also some general aspects that allow for a comparison of different maritime businesses and an appraisal of the possibilities for newcomers to enter a particular market. One such aspect is the level of market concentration; it may potentially be more difficult for a country to develop a sector if the business is already dominated by only a small number of countries. Another possible barrier to entry is the country’s general level of development; setting up or strengthening a maritime sector may require certain institutional, technical and human capacities that developing countries may not necessarily have.
Market concentration: Given that countries specialize in different maritime businesses, a process of market concentration tends to occur (table 6.16). In shipbuilding, ship scrapping and insurance services, four countries together account for more than 90 per cent of the world market. Sectors that are more evenly spread over a larger number of countries are seafarer supply and containership operation, where the combined market share of the top four countries is less than 40 per cent.
Level of economic development: Table 6.16 also shows, for each maritime sector, the average GDP per capita, as an indicator of the stage of economic development.43 Ship scrapping takes place in countries with the lowest average GDP per capita ($2,094); going up the scale, the next activities are ship registration and the provision of ratings. At the other end of the spectrum, the average GDP per capita is highest in the countries hosting the P&I clubs ($48,628), followed then by ship financing, containership operation and container terminal operation.
Figure 6.7 is a matrix that combines these two indicators with GDP per capita on the X-axis and
Review of MaRitiMe tRanspoRt 2011164
Source: See section 6.B. Estimates are based on the latest year available.
Table 6.16. Comparison of maritime sectors
Maritime sector Share of the top 4 countries/ economies percentage
Share of the top 10 countries/ economies percentage
Market share of developing countries in the top 10, percentage
Number of developing countries/ economies in top 10
Average GDP per capita,
(dollars)
Multiplicator world
average per capita GDP
Ship building (dwt) 95.4 98.2 76.4 6 19 368.8 2.3
Ship scrapping (dwt) 94.3 99.0 99.0 5 2 094.0 0.2
Insurance services : P&I (dwt) 91.2 74.62 2.4 2 48 628.0 5.7
Ship financing ($) 70.2 98.1 8.7 1 41 198.0 4.8
Ship classification (dwt) 65.0 95.4 10.6 2 36 629.3 4.3
Ship owning (dwt) 49.7 69.1 26.1 4 31 150.1 3.6
Ship registration (dwt) 45.9 72.0 53.2 6 9 219.6 1.1
Port operation : Container terminals (TEU) 43.9 61.7 67.4 5 35 639.6 4.1
Ship operation: Container ships (TEU) 36.9 73.24 41.5 5 35 847.1 4.2
Ratings (Headcount) 35.1 50.0 89.5 8 10 603.6 1.2
Officers (Headcount) 30.8 52.0 75.4 6 15 314.8 1.8
Figure 6.7. Market-entry barriers into maritime businesses, for developing countries
Source: UNCTAD secretariat, based on data from Table 6.16.
8M
arket concentration among countries
1
2
3
4
6
7
910
11
GDP per capita
1. Ship building2. Ship owning3. Ship operation (container ships)4. Ship scrapping5. Ship financing6. Ship classification7. Ship registration8. Ship insurance (protection and indemnity)9. Officers10. Ratings11. Port operation (container terminal operators)
hgiHwoL
LowH
igh
2. Medium
2. Medium
1. Low
3. High
$24,000
50 per cent
5
CHapteR 6: DeveLopinG CoUntRies’ paRtiCipation in MaRitiMe BUsinesses 165
market concentration among countries on the Y-axis. The sector-specific data used to create this graph were taken from table 6.16. The matrix groups the observed sectors into four quadrants that evaluate barriers to market entry by developing countries into each maritime business. A high level of concentration combined with a high average GDP per capita (quadrant 3) implies that only a few countries (principally developed countries) participate in the business (e.g. ship financing and ship insurance). It is likely that it will be more difficult for developing countries to enter these sectors than to establish maritime industries with a low market concentration located in economies with a lower level of economic development (quadrant 1).
3. Linkagesbetweenmaritimebusinesses
Increasingly, maritime businesses are geographically spread among different countries, with each country specializing in one or a few sectors. As a result of the increasing distance between most industries, it may seem that they are developing ever more independently from each other. While this is true for some sectors, linkages between them remain. Such linkages can be twofold.
Firstly, one sector may provide services to another, and geographical closeness can be an advantage. While this is less relevant today than it was in past decades, there may still be advantages to a shipowner in having, for example, insurance and financing services in the same country. Another example is ship classification, where the societies may find it convenient to be closer to their clients in ship building and operation and in the banks that finance the ships that require classification.
Secondly, different sectors may require the same type of inputs and framework. Low labour costs may be a cost advantage both for ship scrapping and for seafaring. An industrial base is important for manufacturing, be it of ships or port cranes. A developed services sector and a strong legal framework are preconditions for competitive banking and insurance services.
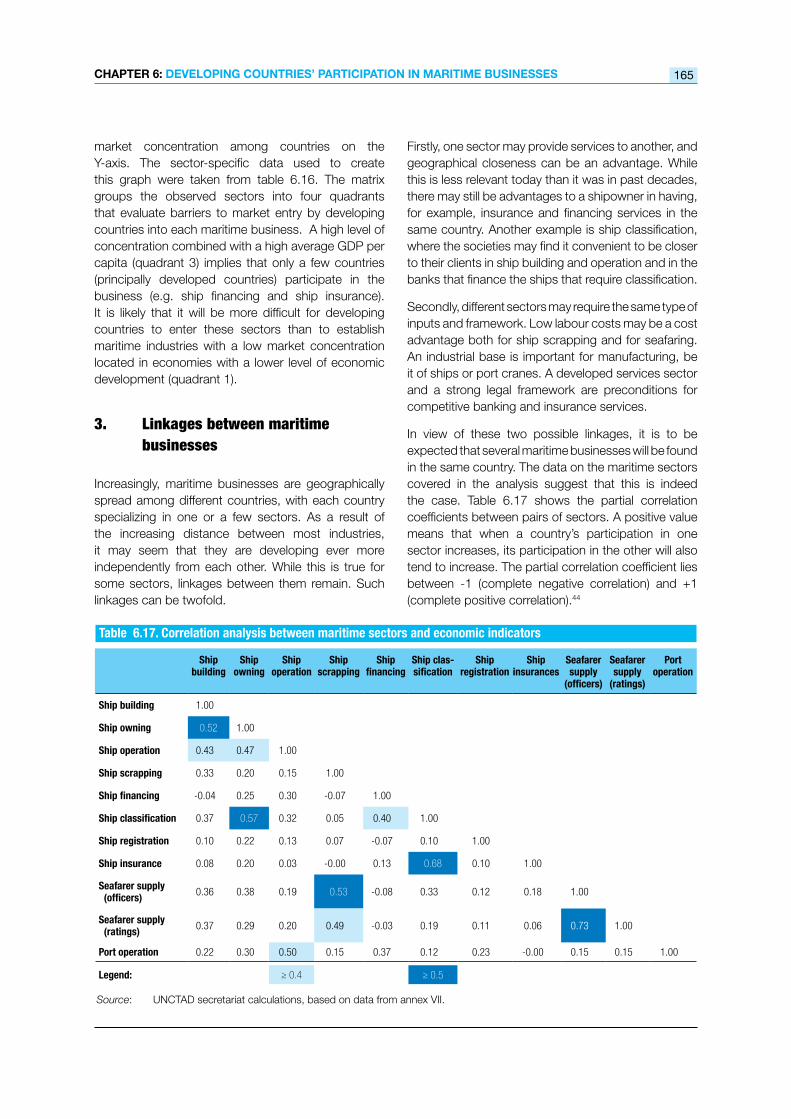
In view of these two possible linkages, it is to be expected that several maritime businesses will be found in the same country. The data on the maritime sectors covered in the analysis suggest that this is indeed the case. Table 6.17 shows the partial correlation coefficients between pairs of sectors. A positive value means that when a country’s participation in one sector increases, its participation in the other will also tend to increase. The partial correlation coefficient lies between -1 (complete negative correlation) and +1 (complete positive correlation).44
Table 6.17. Correlation analysis between maritime sectors and economic indicators
Source: UNCTAD secretariat calculations, based on data from annex VII.
Ship building
Ship owning
Ship operation
Ship scrapping
Ship financing
Ship clas-sification
Ship registration
Ship insurances
Seafarer supply
(officers)
Seafarer supply
(ratings)
Port operation
Ship building 1.00
Ship owning 0.52 1.00
Ship operation 0.43 0.47 1.00
Ship scrapping 0.33 0.20 0.15 1.00
Ship financing -0.04 0.25 0.30 -0.07 1.00
Ship classification 0.37 0.57 0.32 0.05 0.40 1.00
Ship registration 0.10 0.22 0.13 0.07 -0.07 0.10 1.00
Ship insurance 0.08 0.20 0.03 -0.00 0.13 0.68 0.10 1.00
Seafarer supply (officers) 0.36 0.38 0.19 0.53 -0.08 0.33 0.12 0.18 1.00
Seafarer supply (ratings) 0.37 0.29 0.20 0.49 -0.03 0.19 0.11 0.06 0.73 1.00
Port operation 0.22 0.30 0.50 0.15 0.37 0.12 0.23 -0.00 0.15 0.15 1.00
Legend: ≥ 0.4 ≥ 0.5

Review of MaRitiMe tRanspoRt 2011166
The correlation coefficient between officers and ratings is 0.73, implying that countries that provide officers are also highly likely to provide ratings. Countries such as the Philippines have built up their educational infrastructure for ratings, and now supply officers with a higher qualification profile. There is also a correlation between ship operation and shipowning (0.47). One of the reasons for this is that ship operators often own a share of their fleet and charter the missing capacity in order to react more flexibly to demand volatilities. Some other sectors, on the other hand, are rarely located in the same country; for example, the correlation coefficient between ship scrapping and insurance is zero.
More examples of countries that are active in different groups of sectors that correlate with each other can be found in annex VII, which shows the market shares of individual countries. For instance, Bangladesh and Pakistan are both leading countries in ship scrapping, and also have some participation in the provision of seafarers. Liberia and Saint Vincent and the
Grenadines have open registries, but are not active in any other maritime sector. Apart from being of different sizes in economic terms, Argentina, Brazil and China have similar maritime profiles: all three countries are active in shipbuilding, and have national shipowners and containership operators.
The linkages between different maritime sectors from the previous correlation analysis have been extracted and can be seen in figure 6.8. Correlations of moderate strength or higher (r > 0.4) are illustrated by a solid line. The graph groups the sectors according to the intensity of the barriers to entry into each maritime business, based on the results in figure 6.7. It indicates the probability for a developing country to establish each maritime industry. Establishing a maritime business from group 3, for instance, appears to be difficult for developing countries. Firstly, they face high market barriers when entering the sector. Secondly, few linkages to sectors with lower market-entry barriers exist that may encourage the businesses to be located in the same country.
Figure 6.8. Linkages between maritime sectors
Source: UNCTAD secretariat, based on data from tables 6.16 and 6.17.
Ship registrationOfficersRatings
Ship building Ship owningShip operationPort operators
Ship classification
Ship insuranceShip financing
Ship scrapping
1. Low
2. Medium
3. High
Moderate correlation between sectors or higher (r > 0.4)
Market entry barriers for developing countries

CHapteR 6: DeveLopinG CoUntRies’ paRtiCipation in MaRitiMe BUsinesses 167
4. Theglobalizationofshipping
Within the globalized production of maritime transport services, developing countries are expanding into more and more sectors. They almost entirely dominate labour-intensive low-cost domains such as ship scrapping and the provision of seafarers. They also have an important and growing market share in manufacturing and in more capital-intensive maritime sectors such as ship building, owning and operation. Only the service sectors such as insurance, ship financing and ship classification have so far remained largely in the hands of developed countries, although developing countries are expanding in this area, too.
Shipping companies from both developed and developing countries alike increasingly rely on goods and services from developing countries in order to remain competitive. As far back as the 1970s, shipowners have been making use of open registries, enabling them to hire crews from countries with lower labour costs. In more recent decades, shipping companies have also started purchasing their vessels from shipyards in developing countries, as vessels constructed in European or United States shipyards may be too expensive. Today, the globalization of
maritime businesses allows shipping companies to source from the most cost-effective suppliers. This has led to a reduction of international transport costs, which benefits global merchandise trade.
The participation of developing countries in global maritime and related businesses has followed different paths and strategies, depending on the sectors and on comparative advantages and policy choices. Some developing countries have relied on the cost advantage of low wages, others have offered fiscal incentives, and yet others have chosen to support the development of national maritime sectors through industrial policies and targeted aid. For many developing countries, participation in different maritime businesses has been a trigger for economic progress.
Policymakers who aim at further strengthening their country’s participation in different maritime businesses need to understand the possible linkages between them. They also need to take into account the already existing level of market concentration, as well as possible linkages between a country’s level of development and its capacity to be a competitive player in a particular market. It is hoped that the data and experiences presented and discussed in this chapter may contribute to this endeavour.
ENDNOTES1 The classification of countries as “developing” in this chapter follows the official terminology of the United Nations (see
also annex I).2 Porter M (1998). Competitive Advantage: Creating and Sustaining Superior Performance. New York. Free Press: 30 et
seqq. 3 Ibid.4 Lloyd’s List (2011). Chinese yards churn out record bulk newbuilders. 12 January. Available at http://www.lloydslist.
com/ll/sector/dry-cargo/article353837.ece (accessed in April 2011). 5 Germany Trade and Invest (2010). VR Chinas Schiffsbau mit positivem Jahresergebnis. Available at http://www.gtai.
de/fdb-SE,MKT201003168012,Google.html (accessed in April 2011).6 Ciccantell PS and Shin K-H (2009). The steel and shipbuilding industries of South Korea: Rising East Asia and
globalization. Available at http://jwsr.ucr.edu/archive/vol15/Shin_Ciccantell-vol15n2.pdf (accessed in May 2011).7 World Steel Association (2010). World crude steel output increases by 15 per cent in 2010. Available at http://www.
worldsteel.org/?action=newsdetail&id=319 (accessed in April 2011).8 Bureau of Labour Statistics (2011). Unit labour costs in national currency, compensation, and output. Available at
http://www.bls.gov/news.release/prod4.t02.htm (accessed in April 2011) Also: Hourly compensation costs for all employees: Transportation equipment manufacturing. Available at ftp://ftp.bls.gov/pub/special.requests/ForeignLabor/aeind336naics.txt (accessed in April 2011).
9 Petrobras (2011). Petrobras in numbers. Available at http://www.petrobras.com/en/about-us/profile/ (accessed in May 2011).
10 UNCTAD secretariat, on the basis of fleet statistics from Containerisation International Online. Available at http://www.ci-online.co.uk (accessed in May 2011).

Review of MaRitiMe tRanspoRt 2011168
11 Based on data from Containerisation International Online.12 The data in this paragraph are based on CSAV company presentations. Available at http://www.csav.cl/ir/presentations-
en.htm (accessed in March 2011).13 United States Commercial Service (2009). Chile: Maritime ports. Available at http://www.amchamchile.cl/sites/default/
files/maritime_ports_io.pdf (accessed in September 2011). Also: ECLAC (2009). Port planning in Latin America and the evolution of container traffic with Asia-Pacific. FAL Bulletin. Edition no. 277, issue 9. Available at http://www.eclac.org/Transporte/noticias/bolfall/4/38994/FAL_277_port_planning.pdf.
14 Numbers based on presentations and websites of national shipbreaking associations. 15 Profit margins estimated by Xu Hui, Executive Manager, China Ship Fund. Article available at http://www.chinadaily.
com.cn/bizchina/2010-04/08/content_9703387.htm (accessed in April 2011).16 UNCTAD (2010). Review of Maritime Transport 2010. United Nations publication. Sales no. E.10.II.D.4. New York and
Geneva.17 World Bank (2010). The Ship Breaking and Recycling Industry in Bangladesh and Pakistan. Available at http://
siteresources.worldbank.org/SOUTHASIAEXT/Resources/223546-1296680097256/Shipbreaking.pdf (accessed in April 2011).
18 Ibid.19 Lloyd’s List (2011). The return of Bangladesh. Available at http://www.lloydslist.com/ll/sector/dry-cargo/article357812.
ece (accessed in April 2011).20 Marine Money (2010). Shipping China. Presentation. Available from http://www.marinemoney.com.21 Clarkson Research Services (2010). Will Chinese banks make significant inroads into the international ship financing
arena? Article is available from http://www.marinemoney.com.22 Standard Chartered (2010). Presentation. Available from http://www.marinemoney.com.23 Ince & Co. (2011). Chinese fund for Greek shipowners. Available at http://incelaw.com/news-and-events/News/ch-
greek-fund (accessed in May 2011).24 BIMCO (2009): Ship classification in the world of free competition. Available at https://www.bimco.org/en/
News/2009/10/21_Feature_Week_43.aspx (accessed in April 2011).25 Europa Press Releases (2009). Antitrust: Commission paves way for more competition in ship classification market by
making IACS’s commitments legally binding. Available at http://europa.eu/rapid/pressReleasesAction.do?reference=IP/09/1513&format=HTML&aged=0&language=EN&guiLanguage=en (accessed in April 2011).
26 Maritime Professional (2010). IRS membership of IACS will put an end to dual class. Available at http://www.maritimeprofessional.com/Blogs/IRS-membership-of-IACS-will-put-an-end-to-dual-cla/June-2010/IRS-membership-of-IACS-will-put-an-end-to-dual-cla.aspx (accessed in April 2011).
27 Lloyd’s List (2010). Class societies wait in line as IACS admits Indian Register. Available at http://www.lloydslist.com/ll/sector/regulation/article171956.ece (accessed in April 2011).
28 CombinedMar supplied UNCTAD with its results of a recent flag cost comparison.29 http://www.parismou.org/. 30 http://www.igpandi.org/.31 Ibid.32 Omni (2010). P&I Report 2010. Available at http://omniltd.ca/PDFS/OMNI_PandI_Report_2010.pdf (accessed in April
2011).33 Ibid.34 UN-OHRLLS (2011). Role of shipping in sustainable development. Available at http://www.un.org/special-rep/ohrlls/
UN_system/imo.htm (accessed in September 2011).35 Philippine News (2011). Philippines targets to capture 50 per cent of global seafarer demand by 2016. Available at
http://www.megascene.net/?p=6229 (accessed in October 2011).36 The Joint Manning Group is an organizational body that represents the five leading Philippine manning associations.37 Safety4Sea (2011). Philippines in bid to stamp out illegal seafarer recruitment. Available at http://safewaters.wordpress.
com/2010/10/20/shipping-philippines-in-bid-to-stamp-out-illegal-seafarer-recruitment/ (accessed in October 2011).38 ABS-CBN News (2010). RP likely to ratify ILO convention for seafarers. Available at http://www.abs-cbnnews.com/
global-filipino/10/07/10/rp-likely-ratify-ilo-convention-seafarers (accessed in May 2011).39 ABS-CBN News (2011). Remittances saved up to 3-M Pinoys from poverty. Available at http://www.abs-cbnnews.
com/business/05/03/11/remittances-saved-2-3m-pinoys-poverty (accessed in May 2011).40 DP World (2010). Company presentations. Available at http://www.dpworld.com (accessed in April 2011). Also: data
received directly from port operator.41 Drewry Publishing (2010). Global Container Terminal Operators: Annual Review and Forecast 2010. London.

CHapteR 6: DeveLopinG CoUntRies’ paRtiCipation in MaRitiMe BUsinesses 169
42 DP World (2010). Company presentations. Available at http://www.dpworld.com (accessed in April 2011). Also: data received directly from port operator.
43 The average GDP per capita for each sector has been calculated by (a) multiplying each country’s market share in the business with its average GDP per capita; and (b) adding the results for all countries participating in the business.
44 The correlations are calculated by Excel, using the Pearson correlation. This calculates the correlation coefficient between two measurement variables (here, maritime sector data) when measurements on each variable are observed for each of N subjects (countries). Any missing observation for any subject causes that subject to be ignored in the analysis. The formula applied is shown below:
The following list includes the data behind each variable of the correlation analysis:
1. Ship building. Ships built in country, in GT (2009).
2. Ship owning. Owned ships of companies with nationality of country, in dwt (2010).
3. Ship operation. Containership operators from country, in TEU (2010).
4. Ship scrapping. Ships scrapped in country, in GT (2010).
5. Ship finance. Ship-financing portfolio of banks in country, in dollars; the data only comprise the 25 largest ship-financing banks (2010).
6. Ship classification. Ships classified by classification society from the country, in GT (2010).
7. Ship registration. Ships registered by registries from country, in dwt (2010).
8. Ship insurance. Ships insured by P&I club from country, in GT (2010).
9. Seafarer supply (officers). Number of officers supplied by country (2010).
10. Seafarer supply (ratings). Number of ratings supplied by country (2010).
11. Port operation. Container terminal port operators headquartered in country, port traffic in TEU (2009).