Review of concepts of dynamic 1ecosystems and their...
94
Review of concepts of dynamic ecosystems and their services 1 Review paper on concepts of dynamic ecosystems and their services M. Vandewalle 1 , M.T. Sykes 1 , P.A. Harrison 2 , G.W. Luck 3 , P. Berry 2 , R. Bugter 4 , T.P. Dawson 5 , C.K. Feld 6 , R. Harrington 7 , J.R. Haslett 8 , D. Hering 6 , K.B. Jones 9 , R. Jongman 4 , S. Lavorel 10 , P. Martins da Silva 11 , M. Moora 12 , J. Paterson 2 , M.D.A. Rounsevell 13 , L. Sandin 14 , J. Settele 15 , J.P. Sousa 11 and M. Zobel 12 1 Department of Physical Geography and Ecosystems Analysis, Lund University, Sölvegatan 12, 223 62 Lund, Sweden 2 Environmental Change Institute, Oxford University Centre for the Environment, South Parks Road, Oxford OX1 3QY, UK 3 School of Environmental Sciences, Charles Sturt University, PO Box 789, Albury NSW 2640, Australia 4 ALTERRA Green World Research, Wageningen UR, The Netherlands 5 School of Geography, University of Southampton, Highfield, Southampton SO17 1BJ, UK 6 Applied Zoology/Hydrobiology, Faculty of Biology and Geography, University of Duisburg- Essen, Universitaetsstrasse 2, 45141 Essen, Germany; 7 Department of Plant and Invertebrate Ecology, Rothamsted Research, Harpenden AL5 2JQ, UK; 8 Department of Organismal Biology, University of Salzburg, Hellbrunner Strasse 34, A-5020 Salzburg, Austria 9 U.S. Geological Survey, Reston, Virginia, USA 10 Laboratoire d’Ecologie Alpine, UMR CNRS 5553, Université Joseph Fourier, 38041, Grenoble, France; 11 IMAR-CIC, Department of Zoology, University of Coimbra, P3004-517 Coimbra, Portugal; 12 Institute of Ecology and Earth Sciences, University of Tartu, Lai 40, 51005 Tartu, Estonia 13 Centre for the study of Environmental Change and Sustainability (CECS), School of Geosciences, University of Edinburgh, Drummond Street, Edinburgh EH8 9XP, UK 14 Department of Environmental Assessment, Swedish University of Agricultural Sciences, Box 7050, SE 750 07 Uppsala, Sweden 15 Department of Community Ecology, Helmholtz Centre for Environmental Research (UFZ), Theodor-Lieser-Str. 4, D-06120 Halle (Saale), Germany The Project Rationalising Biodiversity Conservation in Dynamic Ecosystems Funded under the European Commission Sixth Framework Programme (Contract Number: 036890)
-
Upload
truongdiep -
Category
Documents
-
view
214 -
download
0
Transcript of Review of concepts of dynamic 1ecosystems and their...

Review of concepts of dynamic ecosystems and their services 1
����
Review paper on concepts of dynamic ecosystems and their services
M. Vandewalle1, M.T. Sykes1, P.A. Harrison2, G.W. Luck3, P. Berry2, R. Bugter4, T.P. Dawson5,
C.K. Feld6, R. Harrington7, J.R. Haslett8, D. Hering6, K.B. Jones9, R. Jongman4, S. Lavorel10, P. Martins da Silva11, M. Moora12, J. Paterson2, M.D.A. Rounsevell13, L. Sandin14, J. Settele15,
J.P. Sousa11 and M. Zobel12 1 Department of Physical Geography and Ecosystems Analysis, Lund University, Sölvegatan
12, 223 62 Lund, Sweden 2 Environmental Change Institute, Oxford University Centre for the Environment, South
Parks Road, Oxford OX1 3QY, UK 3 School of Environmental Sciences, Charles Sturt University, PO Box 789, Albury NSW
2640, Australia 4ALTERRA Green World Research, Wageningen UR, The Netherlands
5 School of Geography, University of Southampton, Highfield, Southampton SO17 1BJ, UK 6Applied Zoology/Hydrobiology, Faculty of Biology and Geography, University of Duisburg-
Essen, Universitaetsstrasse 2, 45141 Essen, Germany; 7Department of Plant and Invertebrate Ecology, Rothamsted Research, Harpenden AL5 2JQ,
UK; 8 Department of Organismal Biology, University of Salzburg, Hellbrunner Strasse 34, A-5020
Salzburg, Austria 9 U.S. Geological Survey, Reston, Virginia, USA
10 Laboratoire d’Ecologie Alpine, UMR CNRS 5553, Université Joseph Fourier, 38041, Grenoble, France;
11IMAR-CIC, Department of Zoology, University of Coimbra, P3004-517 Coimbra, Portugal; 12 Institute of Ecology and Earth Sciences, University of Tartu, Lai 40, 51005 Tartu, Estonia
13 Centre for the study of Environmental Change and Sustainability (CECS), School of Geosciences, University of Edinburgh, Drummond Street, Edinburgh EH8 9XP, UK
14Department of Environmental Assessment, Swedish University of Agricultural Sciences, Box 7050, SE 750 07 Uppsala, Sweden
15 Department of Community Ecology, Helmholtz Centre for Environmental Research (UFZ), Theodor-Lieser-Str. 4, D-06120 Halle (Saale), Germany
The����������������Project Rationalising Biodiversity Conservation in Dynamic Ecosystems Funded under the European Commission Sixth Framework Programme (Contract Number: 036890)

Review of concepts of dynamic ecosystems and their services 2
Contents 1. Introduction ........................................................................................................................ 3
2. Review of ecosystem services in the literature ................................................................. 4
2.1 Brief history/background to the study of ecosystem services ................................. 4
2.2 Definitions and terminology .................................................................................... 5
2.3 The Millennium Ecosystem Assessment (MA) ....................................................... 6
3. Services provided by terrestrial and freshwater biodiversity ............................................ 9
3.1 Agro-ecosystems ...................................................................................................... 9
3.2 Forest ecosystems ................................................................................................... 12
3.3 Semi-natural grassland ecosystems ........................................................................ 14
3.4 Heath and shrub ecosystems .................................................................................. 16
3.5 Montane ecosystems .............................................................................................. 18
3.6 Soil ecosystems ...................................................................................................... 20
3.7 Wetland ecosystems ............................................................................................... 22
3.8 River and floodplain ecosystems ........................................................................... 25
3.9 Lake ecosystems ..................................................................................................... 27
3.10 Landscapes ............................................................................................................. 29
4. Quantification of ecosystem services .............................................................................. 31
4.1 The service-providing unit (SPU) concept ............................................................ 32
4.2 Ecosystem dynamics and the SPU concept ........................................................... 37
4.3 Frameworks for quantifying the effect of drivers of change on service provision .................................................................................................... 38
4.4 Case studies illustrating the quantification of services in dynamic ecosystems ............................................................................................... 46
5. Discussion and conclusions ............................................................................................. 63
5.1 Overview of ecosystems studied ............................................................................ 64
5.2 Quantification of ecosystem services ..................................................................... 66
6. References ........................................................................................................................ 67
Appendix I: RUBICODE glossary ............................................................................................ 87

Review of concepts of dynamic ecosystems and their services 3
1. Introduction Nature is fundamentally dynamic and ecological research therefore emphasises more and more the dynamic processes in populations, habitats, ecosystems and landscapes. Furthermore, the pressure of human activities on biodiversity is also, increasingly, dynamic. Yet most conservation strategies are still developed around a static and uniform view of nature and environment. For the realisation of current and future conservation objectives it is therefore critical that new coherent nature conservation strategies are developed and implemented that concentrate on managing dynamic ecosystems for maintaining their capacity to undergo disturbance, while retaining their functions, services and control mechanisms (ecological resilience; Gunderson, 2000). Ecosystems are multifunctional systems which provide humanity with vital services. Forest ecosystems for example, provide wood and a wide range of non-wood products, regulate the climate and water supply, purify air and drinking water, protect against soil erosion and support soil fertility. They also play an important role in the aesthetics of landscapes and in some regions have a religious value. Such services can be locally limited but can also be of global importance, e.g. climate regulation. Ecosystems can only continue to provide these services in a rapidly changing world if multifunctionality is taken into account in their management. Inappropriate developments such as excessive intensification, extensification, mechanisation, over-exploitation of resources, environmental pollution and urbanisation are only some of the factors that increasingly threaten the multifunctionality of ecosystems. A key element in ecosystems which allows them to deliver a range of services is the level of biodiversity within them. It is generally accepted that the welfare of humans is, in almost every respect, integrally linked to the welfare of the other species with which we share the planet and therefore biodiversity loss is recognised as a critical issue. Technological advances may to some extent disguise the depletion of biological resources and provide some compensation for it, but our partial isolation from the rest of life is artificial and almost certainly unsustainable in the longer term. There is now a wide acceptance, based on an increasingly strong theoretical framework, that if the current rate of loss of biological resources is continued, the result will be catastrophic for humankind within a very few generations. Europe is the most urbanised and together with Asia the most densely populated continent in the world and thus the pressure on biodiversity from human activities is high. The EU has recognised the threat to biodiversity and is committed to finding solutions for its conservation. The Sixth Environmental Action Plan highlights nature and biodiversity as a top priority, stating that responses must be found to the pressures from human activities on nature and the biodiversity it supports, while the sustainable development strategy makes halting the loss of biodiversity in the EU by 2010 a priority. One of the key difficulties the political system faces in trying to achieve these goals, is being able to translate the overall threat into a tangible factor in decision-making processes on specific policy measures. The threat to biodiversity remains somehow distant, abstract, and remote when having to take concrete decisions on complex policy items. This link between threat and action in relation to biodiversity services is missing. Furthermore, it is unclear
Review of concepts of dynamic ecosystems and their services 4
what the costs of biodiversity loss will be as long as what biodiversity does for us is not explicit. While conservation of biodiversity is an important societal need, it is not the only one. How can society prioritise these needs? How can biodiversity conservation strategies be better integrated with issues such as economic activities, job creation and recreation? The concept of ecosystem services aims to contribute to solving this problem by increasing knowledge and awareness of what biodiversity does for us. If those biological units that provide specific services to society can be identified and measured, the value of biodiversity in specific circumstances can be defined and compared with more traditionally economically valued activities. Research on ecosystem services is a relatively recent, but rapidly expanding field of science. This report aims to review the current state-of-the-art with regard to concepts and frameworks for the assessment and quantification of ecosystem services. It will also clarify the terminology surrounding the ecosystem services concept, review case study examples from a wide range of terrestrial and freshwater ecosystems, and identify knowledge gaps and research needs. In addition to this review on concepts of ecosystem services, five parallel reviews on related issues have been undertaken and are available from the RUBICODE website (http://www.rubicode.net/rubicode/outputs.html): • Review on the dynamics of economic values and preferences for ecosystem goods and
services (Kontogianni et al., 2008). • Identifying and assessing socio-economic and environmental drivers that affect
ecosystems and their services (Anastasopoulou et al., 2007). • Assessing and monitoring ecosystems – indicators, concepts and their linkage to
biodiversity and ecosystem services (Feld et al., 2007). • Functional traits underlie the delivery of ecosystem services in different trophic levels (de
Bello et al., 2008) • European habitat management strategies for conservation: Current regulations and
practices with reference to dynamic ecosystems and ecosystem service provision (Haslett et al., 2007).
2. Review of ecosystem services in the literature
2.1 Brief history/background to the study of ecosystem services As happened with the related term “biodiversity” 15 years ago, the concept of “ecosystem services” can now be found in many scientific articles, conference proceedings, research projects, debate topics, etc. It has also reached the public arena attracting media attention, notably in advertisements, such as those concerning energy usage. Similarly to the use of the term biodiversity, scientists and lay members of the public are using the term, even before there is a clear definition of what it really means (Table 2.1). It is only with the depletion of natural resources (e.g. soil fertility, oil and water scarcity, etc.) that the concept of ecosystem services has entered human consciousness. However, the concept has a long history. One of the first to understand the concept was Plato (c. 400 BC) who realised that deforestation could lead to soil erosion and the drying up of springs (Daily, 1997).

Review of concepts of dynamic ecosystems and their services 5
The modern ideas of ecosystem services probably began with Marsh in 1864 when he suggested that Earth’s natural resources were not unlimited by pointing to changes in soil fertility in the Mediterranean. Unfortunately, his observations passed largely unnoticed at the time and it wasn’t until the late 1940s that society’s attention was again caught by the idea. During this era, three key authors, Osborn (1948), Vogt (1948), and Leopold (1949) promoted the recognition of human dependence on the environment with the idea of ‘natural capital’. In 1956, Sears brought attention to the critical role of the ecosystem in processing wastes and recycling nutrients. An environmental science textbook (Ehrlich and Ehrlich, 1970) suggested that “the most subtle and dangerous threat to man’s existence… is the potential destruction, by man’s own activities, of those ecological systems upon which the very existence of the human species depends”. The term ‘environmental services’ was finally introduced in a report of the Study of Critical Environmental Problems in 1970, which listed services including insect pollination, fisheries, climate regulation and flood control. In the succeeding years, variations of the term were applied but eventually ‘ecosystem services’ became the standard in the scientific literature (Ehrlich and Ehrlich, 1981). 2.2 Definitions and terminology A review has been made using Web of Science, to search for peer-reviewed articles dealing with ecosystem services. As several terms are often used interchangeably with the term ‘ecosystem services’, we used a combination of synonyms to make the search: “environmental services”, “nature’s services”, “ecological services” and of course “ecosystem services”. 208 articles were found which considered the concept of ecosystem services (Figure 2.1). The first article in Web of Science was published in 1983 (Ehrlich and Mooney, 1983), but this paper refers to many works that talk about the degradation of ecosystem services without citing the term. Their article provides a good overview of studies from the 1960s and 1970s dealing with the loss of services and its consequences, as well as the failure of “human-made” substitution. They discuss toxification, desertification and weedification of the entire planet, unless we implement a careful preservation of ecosystems, populations and species that function within them. They emphasised the need for more research and the importance to establish a vocabulary on the subject. However, more than 20 years later, the research community is still discussing definitions. Examples of the many definitions for ecosystem services and functional diversity are shown in Tables 2.1 and 2.2. A review of all the terms related to the study of ecosystem services and ecosystem dynamics was undertaken in order to create a glossary of standard definitions to be used within the RUBICODE project. Definitions for a selection of key terms are shown in Table 2.3 and the full glossary is available in Appendix I. There are many definitions of ecosystem services (Table 2.1) and all have merit. However, it is important to emphasise the critical nature of ecosystem services and their link to human survival, which is not emphasised in all current definitions. Further, none of the definitions listed indicate that ecosystem services are only part of a range of processes some of which may or may not become classified as services to humanity. The definition shown in our glossary is intended to be more inclusive (Table 2.3). There are also several definitions of functional diversity (Table 2.2), many are vague with regard to the characters or traits of the organisms that are involved with ecosystem dynamics

Review of concepts of dynamic ecosystems and their services 6
and thus ecosystem function. The definition used in our glossary aims to reflect these points (Table 2.3).
0
5
10
15
20
25
30
35
40
45
50
No
of s
tudi
es
1983 1985 1987 1989 1991 1993 1995 1997 1999 2001 2003 2005 2007
"Ecosystem services" relatedstudiesDealing with valuation
�
Figure 2.1: Results of a review showing in blue the number of articles per year dealing with “ecosystem services” (synonyms: nature’s services, ecological services or environmental services) since the first article in 1983 citing the term within Web of Science and in red, the number of articles dealing with economic valuation. The main approach to quantifying ecosystem services has been to provide an economic valuation (Figure 2.1) (e.g. Costanza et al., 1997). However, although this approach might provide information about the importance of ecosystem services, and consequently might influence conservation decisions, economic valuations are not adequate in conservation management and more precisely in habitat management strategies affecting service provision and biodiversity conservation (Egoh et al., 2007). In 2007, several authors (e.g. Boyd and Banzhaf, 2007; Egoh et al., 2007) stressed the urgent need to quantify ecological services other than economically, and to develop a measurement of biophysical service units (see section 4 of this report). 2.3 The Millennium Ecosystem Assessment (MA) The Millennium Ecosystem Assessment (MA) investigated the consequences of ecosystem change for human well-being through a scientific appraisal of ecosystem services. It was established in 2001, involved an international work programme run by 1300 researchers from 95 countries and reported in March 2005. The MA is the most comprehensive review of the state of the planet ever conducted. The assessment synthesised a wide range of available evidence and investigated options for responses at different scales. The results suggest that human activities have changed most ecosystems and threaten the Earth’s ability to support future generations. It remains the best scientific review currently available of the sustainability of the world’s ecosystems (MA, 2005; www.MAweb.org).

Review of concepts of dynamic ecosystems and their services 7
Table 2.1: Examples of existing definitions of ecosystem services according to the type of study (ecological or economic).
Type of study Definitions References
Ecological The conditions and processes through which natural ecosystems and the species that make them up, sustain and fulfil human life.
Daily, 1997
Economic
The benefits human populations derive directly or indirectly from ecosystem functions. They consist of flows of materials, energy and information from natural capital stocks which combine with manufactured and human capital services to produce human welfare.
Constanza et al., 1997
Ecological and economic
”Fundamental ecosystems services”: services that are essential for ecosystem function and resilience, such as nutrient cycling. These are ultimately a prerequisite for human existence, irrespective of whether humans are aware of it or not. ”The demand-derived ecosystem services”, such as recreational values, are formed by human values and demands, and not necessarily fundamental for the survival of human societies.
Holmlund and Hammer, 1999
Ecological The set of ecosystem functions that is useful to humans. Many of these are critical to our survival while others enhance it.
Kremen, 2005
Ecological and economic
The benefits people obtain from ecosystems. These include provisioning, regulating, and cultural services that directly affect people and the supporting services needed to maintain other services.
MA, 2005
Ecological The benefits provided by ecosystems that contribute to making human life both possible and worth living Diaz et al., 2006
Ecological Ecosystem functions that provide benefits to humans, i.e. a human beneficiary (current or future) must be explicit. Egoh et al., 2007
Table 2.2: Examples of existing definitions of functional diversity.
Definitions References The variety of different responses to environmental change, especially the diverse space and time scales with which organisms react to each other and to the environment.
Steele, 1991
The number, type and distribution of functions performed by organisms within an ecosystem.
Diaz and Cabido, 2001
The value and range of those species and organismal traits that influence ecosystem functioning. Tilman, 2001
The functional multiplicity within a community. Tesfaye et al., 2003 The distribution of the species and abundance of a community in niche space, including functional richness, functional evenness and functional divergence. Mason et al., 2005
A component of biodiversity that generally concerns the range of things that organisms do in communities and ecosystems.
Petchey and Gaston, 2006

Review of concepts of dynamic ecosystems and their services 8
Table 2.3: Selected definitions from our glossary (see Appendix I for the full glossary). Term Definition
Ecosystem processes The interactions (events, reactions or operations) among biotic and abiotic elements of ecosystems that lead to a definite result.
Ecosystem services
Benefits that humans obtain from ecosystems that support, directly or indirectly, their survival and quality of life. These include provisioning, regulating and cultural services that directly affect people, and the supporting services needed to maintain the direct services. They are a subset of ecosystem processes, which include roles that are not easily definable in terms of human needs. (Enlarged from MA, 2005)
Functional diversity The variety of characters (traits) found across organisms that dictate their response to, and influence on, ecosystem dynamics.
Ecosystem dynamics
Ecosystem change in space and time resulting from the effect of external and internal forces on ecological functions. There may be continual change in biotic composition and structure at specific localities. Collectively, these changes may represent internal flux, or substantive and permanent alteration of the ecosystem regionally.
The MA categorises ecosystem services into four different classes. These are:
• Provisioning services which are the products obtained from ecosystems, including food, fibre, fuel, genetic resources, ornamental resources, freshwater, biochemical, natural medicines and pharmaceuticals.
• Regulating Services which are the benefits obtained from the regulation of ecosystem processes including air quality regulation, climate regulation, water regulation, erosion regulation, water purification and waste treatment, disease regulation, pest regulation, pollination and natural hazard regulation.
• Cultural Services which are the non-material benefits people obtain from ecosystems through spiritual enrichment, cognitive development, reflection, recreation, and aesthetic experiences, including cultural diversity, spiritual and religious values, knowledge systems, educational values, inspiration, aesthetic values, social relations, sense of place, cultural heritage values, recreation and ecotourism.
• Supporting services which are necessary for the production of all other ecosystem services. They differ from provisioning, regulating, and cultural services in that their impacts on people are often indirect or occur over a very long time, whereas changes in the other categories have relatively direct and short-term impacts on people. Some services, like erosion regulation, can be categorised as both a supporting and a regulating service, depending on the time scale and immediacy of their impact on people. These services include soil formation, photosynthesis, primary production, and nutrient and water cycling.
The publication of the MA has stimulated widespread, international debate about the importance of the links between ecosystems and human well-being. The MA found that at global scales, 60% of the ecosystem services on which people depend were being damaged through human action or mismanagement. As a result there is now considerable interest in assessing ecosystem services at regional and national scales. The MA was unable however to provide adequate scientific information to answer a number of important policy questions

Review of concepts of dynamic ecosystems and their services 9
related to ecosystem services and human well-being. In some cases, the scientific information may well exist already but the process used and time frame available prevented either access to the needed information or its assessment. In many cases it is clear that either the data needed to answer the questions were unavailable or the knowledge of the ecological or social system was inadequate.
3. Services provided by terrestrial and freshwater biodiversity The services provided by six terrestrial (agro-ecosystems, forests, semi-natural grasslands, heath and shrubs, montane and soils) and three freshwater (wetlands, rivers and floodplains and lakes) ecosystems are identified in Table 3.1 categorised according to the MA definitions. Soil ecosystems were assessed as a separate ecosystem given their general nature and the importance they have for all other terrestrial ecosystems. From this table, we can see that some services are provided by all ecosystems. These include the provision of food, fibre, fuel and genetic resources, climate regulation, primary production, nutrient and water cycling, and the provision of habitats for flora and fauna. Finally all ecosystems have aesthetic values and consequently they all have recreational importance. Services such as biochemical/natural medicines, pollination and disease regulation are restricted to the terrestrial ecosystems, whereas the provision of fresh water, energy (through hydroelectric power) and water regulation are more focused on the aquatic ecosystems. Only one ecosystem provides all the MA categories of services, montane, which itself comprises a variety of habitat types across its altitudinal variation. When one particular service is provided by several ecosystems this doesn’t necessarily mean that there is redundancy among ecosystems regarding this particular service. Indeed a combination of several processes in different ecosystems may be needed to deliver the service. It is evident from Table 3.1 that most services are identified for most ecosystems. The information supplied in Table 3.1 could be greatly enhanced through further research by creating a qualitative ranking of importance, with for example four categories: no contribution, some contribution, key contribution and contribution poorly known. 3.1 Agro-ecosystems Agriculture represents the major land use throughout Western Europe as over half of European territory is maintained by farmers (Robinson and Sutherland, 2002). Agricultural landscape management practices thus have a tremendous impact on biodiversity at the European level (Donald et al., 2002). When dealing with the services provided by the biodiversity of agricultural (including horticultural) ecosystems, it is useful to distinguish between the primary crops that are planted there by man and the naturally colonising flora and fauna, the success of which will be partly determined by management practices associated with crop production (Table 3.1). The biodiversity associated with provisioning’ services of agricultural landscapes, comprising crops grown for food, fibre, fuel, genetic resources, ornamental resources, pharmaceuticals, perfumes and other uses, fall mainly in the former category (although some wild foods are found within agro-ecosystems). In such cases, the service provider is a crop with characteristics that maintain an adequate income to the grower, or food to a defined

Review of concepts of dynamic ecosystems and their services 10
Table 3.1: Services provided by terrestrial and freshwater ecosystems, categorised according to the MA.
MA category Ecosystem service Agro-ecosystems
Forests Grasslands Heath/ shrubs
Montane Soils Wetlands Rivers and floodplains
Lakes
Provisioning services Food, fibre and fuel • • • • • • • • • Genetic resources • • • • • • • • • Biochemical/natural medicines • • • • • Ornamental resources • • • • • • Fresh water • • • • • • Energy • • • • • Regulatory services Pollination • • • • • Seed dispersal • • • • • • • • Pest regulation • • • • • • • • Disease regulation • • • • • • Climate regulation • • • • • • • • • Air quality regulation • • • • • • • Water regulation • • • • • • • • Erosion regulation • • • • • • • • Natural hazard regulation • • • • • • • • Invasion resistance • • • • • • Herbivory • • • • • • • • Water purification/waste treatment • • • • • • • • Cultural services Spiritual and religious values • • • • • • • • Knowledge system • • • • • • • Education and inspiration • • • • • • • Recreation and ecotourism • • • • • • • • • Cultural heritage • • • • • • • Aesthetic values • • • • • • • • • Sense of place • • • • • • • • • Supporting services Primary production • • • • • • • • • Photosynthesis • • • • • • • • Provision of habitat • • • • • • • • • Soil formation and retention • • • • • • • Nutrient cycling • • • • • • • • • Water cycling • • • • • • • • •

Review of concepts of dynamic ecosystems and their services 11
stakeholder population. At a farm scale, the crop is often a monoculture whilst, over larger areas, genetic diversity within the crop becomes increasingly important in order to cater for a variety of end uses, to cope with spatially and temporally variable conditions and to provide resilience. The services provided by the associated natural biodiversity include those which support the production of crops (which fall mainly into the regulatory’ and supporting’ categories of the MA), and those which are incidental to such production (which fall mainly into the cultural’ category). However, certain organisms may contribute to services in more than one category, and may also antagonise certain services. Soil condition is clearly of vital importance to support agriculture and is dependent on biodiversity. Legumes function to supply nitrogen, whilst the efficiency with which nutrients are cycled depends on physical and chemical characteristics of non-harvested plant material and on characteristics of detritivores and soil aerators such as earthworms. Pollinators are necessary in about two thirds of the World’s 1500 crop species and are directly or indirectly essential for an estimated 15-30% of food production (Kremen et al., 2002). Plants with traits which encourage the timely presence of pollinators on farms are thus of great importance, and can be encouraged by appropriate management techniques. These plants may sometimes be present in a different ecosystem and hence provide a cross-ecosystem service. For example, natural pollination of the coffee crop in Costa Rica is greatly enhanced by the proximity of forest habitat (Ricketts et al., 2004). 20 ha of tropical forest are required within 1 km of coffee plantations in order to maximise economic benefits of pollination by the native bee community. Biocontrol of pests is also a key service of agro-ecosystems which is dependent on the presence of appropriate flora to provide shelter for the biocontrol agents and to support alternative prey at times when these are not provided by the crop itself (Altieri, 1994; Wratten et al., 1998; Landis et al., 2000; Zehnder et al., 2007 for organic context). Support of both pollinators and biocontrol agents can often be provided by the same flora, which may be sown deliberately or arrive naturally. In either case, appropriate management is required to maintain function. These plants may also support birds, butterflies and other fauna of aesthetic beauty, and provide aesthetic beauty in their own right, an important service which encourages people to visit the countryside and contribute to its economy. The birds may be important in dispersing the seeds of the desired flora and it becomes clear that the services provided by natural biodiversity are often interdependent. The Combined Food and Energy’ system being trialled in Denmark (Kuemmel et al., 1998) delivers a sustainable integrated package of ecosystem services at a farm scale. The services include food, fodder, biomass for energy, pollination support, wind-breaking for protection of crops and soil erosion control, nutrient retention, mineralisation of nutrients, fixation of nitrogen, carbon sequestration and mitigation, biocontrol of pests, biodiversity and recreation. Work is in hand to put a value on the services provided by biodiversity within this closed system. Service-providing biodiversity may also have some detrimental effects on crop production by harbouring pests or diseases and, especially when present in the crop rather than in the margins, through direct competition with the crop for light and nutrient resources. It is thus important to identify functional groups of arable flora that combine a relatively low competitive ability with a high value for invertebrates and birds (Storkey, 2006).

Review of concepts of dynamic ecosystems and their services 12
3.2 Forest ecosystems The impact of human activities was recognised much earlier for forests than other ecosystems. The first references can be traced back to Plato (ca 400 BC), who suggested that soil erosion and the drying up of springs could be due to deforestation (Daily, 1997). Human activities, such as land use change, forest exploitation and management, the impact of industrialisation (leading to acidification and eutrophication) has impacted, through changes in geographic distribution, biodiversity and nutritional/toxic status of the upper soil horizon, on almost all forests over recent centuries. Some forest habitats are seriously endangered; for example, riparian forests (an important ecotone for terrestrial-aquatic linkages) are considered one of Europe’s most threatened ecosystems and are classed as a priority forest habitat type in the EU habitats directive. Improving agricultural technologies are likely to lead to abandoned land and increased successional forest and opportunities for biodiversity conservation. Nowadays, forest ecosystems cover approximately one third of the European land area and the services they provide, regulate or support are numerous and varied (Table 3.1). However, there are several definitions of forests. One of the internationally most common definitions is stipulated by the FAO. In addition to this, the Habitats directive has its own definition, and many countries have their own definition. For example, in Sweden there is 3.5 Mha of high mountains and subalpine coniferous woodlands according to the Swedish definition, but only 0.7 Mha according to the FAO definition. A major provisioning service from forests is timber production. According to the MA global timber production has increased by 60% in the last four decades (Sampson et al., 2005). Plantations provide an increasing volume of harvested wood, amounting to 35% of the global harvest in 2000. Roughly 40% of forest area has been lost during the industrial era and land forests continue to be lost in many regions resulting in the degradation of this service. However, forests are now recovering in some temperate countries and thus this service has been enhanced (from this lower baseline) in these regions in recent decades. Global consumption of fuel wood appears to have peaked in the 1990s and is now believed to be slowly declining but remains the dominant source of domestic fuel in some regions. Non-wood products, such as meat (from hunting), fruit and mushrooms, are also provided by forest ecosystems although they have less economic importance now than in the past. Forest genetic resources are also invaluable for the human population for example for their potential in areas such as medical research. Forests play an important role in the global carbon cycle and contribute to climate regulation through the long term storage of carbon in forest soils and woody biomass. The forests of the Amazon for example account for about 10% of global terrestrial productivity and biomass (Mahli and Grace, 2000) thus providing a significant sink for carbon and reducing the rate of greenhouse gas increase in the atmosphere. However deforestation, also mainly in the tropics, is a major land use change which promotes the tropics as a source of atmospheric CO2 through the release of carbon into the atmosphere (IPCC, 2007). Deforestation has local, regional and global effects and these effects can occur over different timescales (Foley et al., 2007). Afforestation and reforestation have yet to impact strongly on climate regulation, though some regional sinks have been created through afforestation, such as in China (IPCC, 2007). Forest regrowth particularly in middle and high latitudes is a current trend caused by the intensification and mechanisation of agriculture requiring less land for food production.

Review of concepts of dynamic ecosystems and their services 13
This regrowth may enhance the climate regulatory service provided by forests in the longer term at least outside the tropics. Additionally there is the discussion about liquid biofuels and their use for carbon mitigation as opposed to using the land for forestry. For significant substitution of fossil fuels by liquid biofuels existing forest and grasslands would need to be cleared, increasing carbon emissions. Further, if climate regulation is the main objective then increased efficiency of fossil fuel use, conservation of exiting forests and restoring natural forests may be the better policy in the short to medium term (Righelato and Spracklen, 2007). Modelled results based around measured carbon and water fluxes at the EUROFLUX sites scattered throughout Europe (Papala and Valentini, 2003) suggest that the future role of forests in the carbon cycle is complex and is dependent, not only on land use decisions but also on, for example, future climate, forest type, the fertilisation effect of increased CO2 and interactions with the water cycle (Davi et al., 2006). Forests are also associated with the regulation of water through both effects on runoff and water quality. These forest services are more prominent in tropical areas and there are data available from small tropical catchments that show that runoff and stream discharge increases with increasing deforestation and that the degree of water yield from forests is also dependent on the tree species that dominate in a forest (Sahin and Hall, 1996). At large scales such as the whole Amazon Basin, model results suggest increases in average runoff and water discharge of 20% as a result of widespread deforestation (Foley et al., 2007). Forests can also promote water quality. Intensive use of land for agriculture in Europe has altered nitrogen budgets, increasing nitrogen pollution of fresh water, however soil water from forests in Europe has low concentrations of nitrogen (Bastrup-Birk and Gundersen, 2004). Results from forest models show that converting to mature forests reduced runoff by 30-45% and nitrate soil water concentrations by 50-70%. Around 50% of the population in Nordic countries use drinking water originating from surface waters. In non-polluted waters, most of the organic matter originates from the soils. These substances are called humus and colour the water yellow or brown. Humus has always created problems in water treatment plants producing drinking water of high quality. Humus is a substrate for bacteria and fungi that may contribute to excess microorganism growth in the water distribution system, causing secondary problems such as diseases, taste and odour. It has been hypothesised that the increased forest production during the 20th century has increased the carbon pools in the soils, causing excess humus leakage to surface waters (Löfgren, 2003). Additionally, model simulations indicate increased humus leakage, as an effect of global warming. Núñez et al. (2005) estimated the value of Chilean native temperate forest for fresh drinking water supply to one of the main cities in southern Chile and found it to be US$0.06/cubic meter in summer and US$0.025 for the rest of the year. The economic benefits per hectare of native forests were US$162.4 for the summer and US$61.2 for the rest of the year. Forests have been shown to have an important regulatory role also with regard to soil erosion. In Taiwan where rainfall intensity can exceed 100mm/h, Cheng et al. (2002) state that the 100 year policy with regard to designating protection forests has been successful for streamflow regulation and soil conservation, thus making overland flow rare. They express

Review of concepts of dynamic ecosystems and their services 14
concern about rapid urbanisation that may, however, give future problems. Simulations using ecosystem and erosion models (Ito, 2007) suggest that climate change and land cover change could lead to increased vulnerability to significant soil carbon disturbance and movement globally further affecting the carbon cycle. Schipper et al. (2007) confirm this with a study in New Zealand assessing the conversion from native forests to pasture, where initial conversion caused little change to soil organic carbon stocks. However, resampling the sites up to 30 years later showed significant losses in carbon and nitrogen, in part caused by soil erosion and leaching, but suggesting that losses due to increased respiration may be significant. In the European limestone alps, Strunk (2003) showed that the soils of the subalpine forests of northern Italy with a field capacity of more than 60% are susceptible to fires, clear-cutting and trampling and overgrazing by cattle. This degradation leads to a serious decrease in field and infiltration capacity. After such disturbances rainfall from an average thunderstorm will cause overland flow, soil erosion and deep gully formation. Finally forests can also act as buffers against pests and diseases, for example crop-raiding by primates (e.g. banana crops) in Africa may be reduced if key forest fruit trees are available (Naughton-Treves et al., 1998) but the planting of agroforestry buffers may not be the best option as it creates ideal habitats for crop-raiders. 3.3 Semi-natural grassland ecosystems Temperate grasslands are among the most species-rich vegetation types in Europe and have great conservational value (Eriksson et al., 2002; Poschlod and WallisDeVries, 2002; WallisDeVries et al., 2002). These grasslands usually endure due to moderate disturbances such as animal husbandry, mowing and collection of firewood (Settele and Henle, 2003). This is why grassland ecosystems in Europe are often ‘semi-natural’ (van Dijk, 1991). Although such grasslands represent ecosystems that have developed and endured due to historical and current human impact, the flora of European semi-natural grasslands is spontaneous (Svenning, 2002; Mitchell, 2005). The history of grassland ecosystems in Europe is at least 1.8 million years old, but the extensive development of semi-natural grasslands in Europe began in the Roman Era due to different types of land use (Poschlod and WallisDeVries, 2002), and these grasslands have become especially widespread since the Middle Ages. Due to the abandonment of traditional small-scale farming during the last century, the number and size of semi-natural grasslands have dramatically declined in Europe (Willems, 2001; van Dijk, 1991; WallisDeVries et al., 2002; Poschlod et al., 2005). The MA pays little attention to grasslands with scarce mention of the services of temperate grasslands (Safriel et al., 2005: 634). At the same time, the ecosystem services provided by grasslands may be very significant on a local European scale (Table 3.1). The most important and widely recognised ecosystem service provided by grasslands concern the provision of food, since the entire history of temperate grasslands in Europe has been associated with animal husbandry. Although the intensification of agriculture has resulted in the conversion of some semi-natural grasslands to either cultivated permanent pastures or hayfields and in the abandonment of others, the significance of grasslands as a source of clean and sustainably-produced fodder has been recently recognised (Bullock et al., 2007). On farmed land in Europe, agri-environment schemes encourage farmers to create species-rich grasslands on arable land or agriculturally improved pastures (Pywell et al., 2002). Bullock et al. (2007) and Drechsler et al. (2007) showed that the aims of conservationists and farmers do not necessarily conflict. The re-creation of diverse grasslands of conservation

Review of concepts of dynamic ecosystems and their services 15
value can have a positive impact on hay yield, which benefits the farm economically. Because the effect is maintained over time, farm income will increase in the long term. Grasslands may also provide genetic resources. European temperate grasslands, as well as their early successional stage, are extremely rich in species (van der Maarel, 2005; Skórka et al., 2007), but also rich in genetic variability within species (Prentice et al., 2006). For example, in extensive calcareous alvar grassland (‘Great Alvar’) on Öland, Sweden, there were a large number of genotypes of a grass species Festuca ovina under different microenvironmental conditions (Prentice et al., 2000). There is evidently a huge, though largely unexploited, source of genotypes that might contribute to the development of new breeds of agricultural plants, medical plants, etc. At the European scale the within and between species variability of typical grassland insects such as Large Blue Butterflies (Thomas and Settele, 2004; Als et al., 2004) is astonishing. Temperate grasslands in Europe provide different regulatory services. Semi-natural grasslands harbour a diverse community of natural pollinators, while reduction of the area of such grasslands in landscapes and an increase in intensively managed land may lead to a decline in pollination services in agricultural landscapes (Tscharntke et al., 2005; Öckinger and Smith, 2007). Habitat fragmentation and intensified agricultural practices are thus considered to be a threat against services provided by pollinators. In order to sustain the abundance and diversity of insect pollinators in intensively-farmed agricultural landscapes, the preservation of the remaining semi-natural grasslands or re-creation of flower-rich grasslands is essential. Semi-natural grasslands within a matrix of agricultural landscape may also provide an important pest regulation service by regulating the population density of pests via biocontrol and resisting outbreaks of newly-introduced pests (Tscharntke et al., 2005), thus reducing the need to use pesticides. Grasslands have invasion resistance, since these ecosystems are among the least invaded in temperate Europe (Pysek et al., 2002; Deutschewitz et al., 2003). In particular conditions, grassland ecosystems may also provide other regulatory services such as erosion regulation in mountainous or alluvial grasslands, water purification in flooded grasslands or seed dispersal via the bird species foraging or nesting in grassland habitats. In principle, grasslands may play an important role in regulating climate changes through carbon sequestration. Accumulation of carbon in grassland ecosystems occurs mostly below-ground and changes in soil organic carbon stocks may result from both land-use changes (e.g. conversion of arable land to grassland) and grassland management (Soussana and Lüscher, 2007). The evidence, however, comes mostly from agricultural grasslands, since biomass production and, hence, carbon sequestration in semi-natural grasslands tends to be modest due to nitrogen and phosphorus limitation (Niklaus and Körner, 2004). Grassland ecosystems provide multiple cultural services. Semi-natural grasslands have developed under the impact of traditional agriculture and the landscapes they are part of may be valued as cultural heritage (WallisDeVries et al., 2002; Poschlod et al., 2005). Diverse semi-natural grasslands with their many charismatic plant, bird and insect species (WallisDeVries et al., 2002; Settele et al., 2005; Moora et al., 2007) serve as focal points for local tourism and ecotourism in particular, enabling inhabitants to enjoy the aesthetic values of semi-natural grassland communities and landscapes. The protected grassland areas provide a framework for ecotourism and education, particularly with the help of informative exhibitions, nature trails and guided walks. For instance, the Öland Skogsby research station

Review of concepts of dynamic ecosystems and their services 16
of Uppsala University, Sweden, located in the ‘Great Alvar’, the largest north European calcareous grassland (Rosen and Borgegard, 1999), has became an attractive and frequently visited information centre, providing knowledge of nature and cultural values related to grassland ecosystems and traditional landscapes (http://www.portentillalvaret.nu/). Even if local inhabitants only know about a particularly interesting and endangered element in the grasslands of their direct surroundings, it is the combination of “knowledge system” and “sense of place” which creates a surprisingly high willingness to pay for the maintenance of the required grassland management (Lienhoop et al., 2005; Drechsler et al., 2007). Furthermore, concepts of the application of mosaic cycles are about to be implemented in order to guarantee the survival of regional grassland species pools (Kleyer et al., 2007). Supporting services provided by grassland ecosystems are manifold. For instance, soil formation is a continuous process in all terrestrial ecosystems and depends on the nature of parent materials, biological processes, topography, climate and human impact. Soils of calcareous grasslands are characterised by high carbon content and high physical and chemical stability (Zobel, 1985;Vanderdeelen, 1995), thus providing an uninterrupted supply of nutrients and other important functions over time. 3.4 Heath and shrub ecosystems In Europe, and similarly in the whole Mediterranean basin, heathlands and shrublands have been coevolving for millennia with human societies. They are semi-natural ecosystems traditionally maintained by low to intermediate intensity management or disturbance events and they represent a distinctive set of European habitats for their biodiversity, and their aesthetic and cultural values (Wessel et al., 2004; Quétier et al., 2007a). Today, heath and shrub ecosystems are threatened as a consequence of large-scale human activities, specifically by land use changes (driven in part by CAP policy), atmospheric pollution and climate change. The interaction of broad scale environmental drivers, management and local ecological processes, can result in significant changes in the composition, condition and functioning of heath and shrub ecosystems, and in the delivery of ecosystem services associated with them (Table 3.1). Some heath and shrub plants can be directly used for human consumption, the fruit and cladodes of Opuntia cacti, for example are used in Peru as food by Andean peasants. Opuntia spp. are also present in Catalonia as an exotic species and the fruit is picked here too (Vilà et al., 2003). Heath and shrub ecosystems, however, are more important in providing grazing (Fliescher and Sternberg, 2006; Rodriguez et al., 2006). This can either be for agricultural production or for wildlife that may subsequently be hunted. In the UK uplands, grazing is mostly by sheep and it forms an important part of agricultural production of both meat and wool (Stewart et al., 2005). Lowland heath, like the Mediterranean shrublands, is not usually part of agricultural production, but shrubs can form an important source of forage for sheep, goats and donkeys (Perevolotsky and Seligman, 1998; Rogosic et al., 2006). Upland heath in the UK may be managed by rotational burning to promote new grass or heather growth for wildlife, such as red grouse (Lagopus lagopus scoticus) and red deer (Cervus elaphus) for hunting (Gimingham, 1972; Rollins et al., 1988; Stewart et al., 2005). Hunting opportunities on shrublands are also important in Spain (Wessel et al., 2004) and elsewhere in Europe. The grazing and burning are an important component of many heath and shrub ecosystems, helping to maintain them in their current state. As in most areas of the northern rim of the Mediterranean Basin, rural abandonment in north eastern Spain is causing successional changes (de Bello et al., 2005) as modernisation of livestock production has
Review of concepts of dynamic ecosystems and their services 17
resulted in a decline of the use of extensive rangelands and grasslands in the last few decades (Rook et al., 2004). Shrub vegetation and turfs can also be used as a fuel source (Pardo, 2002). Fuel extraction and prescribed burning also have been applied traditionally to regenerate herbs for fodder while decreasing shrub dominance (Perevolostky and Seligman, 1998; Papanastasis, 2004). Heathlands and cladodes from Opuntia can be used for biogas (Contrera and Toha, 1984). In the New Forest in the UK, heather was used as a bedding material. There is less evidence for the other provisioning services, but Fliescher and Sternberg (2005) mention that natural rangelands can provide genetic resources. Mulas and Mulas (2005) report on an investigation of the screening of Sardinian populations of rosemary for their potential as new cultivars for their biomass quality and chemical composition of the essential oil. Rosemary, like many other Mediterranean species, is a culinary herb and the oils are used in beauty products. Opuntia scrub is important in hosting cochineal insects which are a source of carminic acid, a natural dye used in the food, textile, and pharmaceutical industries (Rodriguez et al., 2006). In Peru, the wood of Opuntia is sometimes used in the manufacture of ornamental and rustic work, such as picture frames or lamps (Le Houérou, 1996). A survey of the perceived goods and services from shrublands in four European countries identified drinking water obtained from groundwater as important in Denmark, the Netherlands and the UK but not Spain (Wessel et al., 2004). The same research highlights how service demands dramatically changed in the last decades, from more provisioning services to more cultural ones (recreation, etc). There is evidence of heath and shrub ecosystems regulating climate, air, water and erosion, and probably other services, such as seed dispersal by birds and pest regulation. Shrub-steppe habitat in the inter-mountain West helps moderate climate at local to regional scales (Rogers et al., 1988) and Opuntia shrubland can be important in rehabilitating marginal lands by improving the levels of humidity (Rodriguez et al., 2006). While there is no evidence of direct air regulation, the regulation of soil erosion can lead to improved air quality, visibility and human health through the reduction in dust storms and in PM10 particles (Scott et al., 1998). The reduction in the former also constitutes natural hazard regulation and can reduce the number of traffic accidents (Scott et al., 1998). In shrubland ecosystems, both the shrubs and plant litter have been shown to reduce water runoff and hence reduce soil erosion and help curb desertification (Scott et al., 1998; Boeken and Orenstein, 2001; Rodriguez et al., 2006). Shrublands may also help in water purification, Opuntia mucilage, for example, flocculates turbid water (Rodriguez et al., 2006) and the minimal management inputs and the relatively low deposition of elements means that the groundwater below many of the shrublands studied by Wessel et al. (2004) can be used for drinking water. Shrublands may have a negative role in fire regime management through their flammability. A study of pollinators in different Mediterranean habitats showed that in a post-fire regenerating system intermediate-aged shrub habitats have the lowest species diversity and lowest level of pollination services (Potts et al., 2006). European heaths and shrublands have inspired writers like Thomas Hardy and artists such as Turner. Wessel et al. (2004) identify European shrublands in their four countries as cultural landscapes. They also identified education and research services for the shrub–steppe habitat of the intermountain West. This habitat is also used for horseback riding, nature hikes, birdwatching and hunting. Other researchers also identify recreation as an important service

Review of concepts of dynamic ecosystems and their services 18
for heath and shrublands (Wessel et al., 2004; Fliescher and Sternberg, 2005). There are several species with high conservation status that increase the recreation/tourism value of heath and shrublands. The wildcat (Felis silvestris) is a very rare and charismatic mammal with high conservation status in the Mediterranean area, with shrub cover being important for hunting and for shelter in bad conditions (Lozano et al., 2003), while the Dartford warbler (Sylvia undata), a rare insectivorous passerine at its northern limit in England, is found only on dry lowland heath. Gorse (Ulex europaeus), for example, is one of the most important shrub species found in heathland in England for maintaining animal biodiversity, in particular populations of the Dartford warbler, which has a high recreation and conservation value (van den Berg et al., 2001). Along with heather (Calluna vulgaris) and bell heather (Erica cinerea), gorse provides essential cover, nesting and feeding habitat and it seems to provide higher levels of invertebrate food than any other shrub/tree (van den Berg et al., 2001). The presence of heathland can also provide a sense of place in that heathland is often an important characteristic of the Character Areas into which England is divided (English Nature et al., 2006). It should be noted though that when shrubs are becoming dominant such that it is difficult to walk through them, then there is a negative aesthetic and recreational value. Heath and shrub ecosystems will affect nutrient cycling. Opuntia scrubland, for example, increases the organic matter (40%) and nitrogen content (200%) of the soil compared with open fields (Rodriguez et al., 2006), while above and below ground carbon sequestration can be enhanced by the presence of woody shrubs and heath plants (Wessel et al., 2004; Olenick et al., 2005). There is, however, a debate about the importance of shrublands for carbon storage. Jackson et al. (2002) found a negative relationship between precipitation and changes in soil organic carbon and nitrogen content when grasslands were invaded by woody vegetation, with drier sites gaining, and wetter sites losing, soil organic carbon, but the reverse true if they are replacing cropland. Other services identified in the literature include Opuntia plants that can be used to form living fences for protecting crops, provide organic material for composting and building material for adobe making (Rodriguez et al., 2006). Wessel et al. (2004) also identify the importance of shrublands as military training grounds. A shift from grassland to shrubland can detrimentally affect grassland-associated wildlife, especially grassland birds which are declining at a faster rate than any other bird group in North America (Peterjohn and Sauer, 1999). Habitat heterogeneity at a local scale appears to be a key factor in maintaining bird diversity in fire driven Mediterranean landscapes (Brotons et al., 2004), while rural depopulation in an area of southern France has led to the loss of open habitats and shrublands and their associated birds (Preiss et al., 1997). Such a shift will also affect herbivory and the type and quality of grazing and can have a negative effect on water yield (Olenick et al., 2005) and carbon storage depending on the moisture levels (Jackson et al., 2002). 3.5 Montane ecosystems Mountains and their ecosystems are inherently different to other areas because of their altitudinal variations, complex topography and associated habitat mosaics, atmospheric influences and because the effects of gravity link higher areas to places below. They are also areas of particularly high biodiversity (e.g. Körner and Spehn, 2002; Nagy et al., 2003). Even though mountains cover only about a fifth of the terrestrial surface of the world, about half of the global human population relies on mountains and the services they provide (Messerli and
Review of concepts of dynamic ecosystems and their services 19
Ives, 1997). Europe has many mountain areas – most European countries have some and our reliance on them is high. The MA devotes a full chapter to mountain systems (Körner et al., 2005). That chapter acknowledges the variety and importance of mountain services that cover all four categories and indeed just about all types defined in the MA, including all those listed in Table 3.1. Some of the most important and widely recognised ecosystem services provided by mountains involve the provision of fresh water. Mountains play a key role in the water cycle by extracting water from the rising air masses passing over them. This feeds back to regulate the regional climate, and the air mixing also contributes to air quality regulation. Mountains also store water in glaciers, snowpacks, soil, vegetation and underground aquifers, and regulate water flow by modulating the run-off regime and groundwater seepage. The run-off flow may be harnessed to provide hydro-electric power. Mountain ecosystems are also important for water purification - the vegetation acts as a filter to remove pollutants. Results from arctic systems (Jones et al., 2002) indicate that the alpine moss flora, (which is especially threatened by climate warming and nitrogen deposition), may be particularly important for providing this service. Water is also the medium in which nutrients are cycled and transported, both vertically through the substrate and regionally to areas at lower altitudes. Due to their topography and often slow-forming, fragile soils, high mountain landscapes are especially prone to erosion. The instability of upslope areas has a multitude of detrimental effects to human welfare even in the lowlands, including floods or mud slides. Within drinking water catchments, surface run-off can decrease water quality. The only means of securing upslope stability is intact high mountain vegetation, which is likely to be threatened especially by climate warming. It is also clear that a large proportion of alpine herbs heavily depend on sexual reproduction (Forbis, 2003), so recruitment of alpine vascular plant flora is dependent on a sufficiently abundant and diverse pollinator community (Körner, 1999). Seed dispersal by birds and mammals is a similarly necessary regulatory service required to maintain mountain ecosystem function across a range of altitudes. Traditional extensive agricultural practices in European mountains continue to provide foods (such as dairy products, meat, honey, etc). Herbivory by livestock is key in maintaining biodiversity-rich alpine pastures below the tree line, which are part of the cultural landscape. Land use changes, including intensification or abandonment on mountain pastures has severe effects on the vegetation and thus a wide spectrum of ecosystem services. Timber production from the forests is a major source of fibre and fuel. The large areas of forest (and other mountain vegetation) contribute to the production of atmospheric oxygen through photosynthetic activity. Mountain forests also have a major function as stores of carbon. Also, wild populations of animals and plants are harvested to provide foods – game, fish, berries, mushrooms and much more. Wild organisms in mountains also provide sources of natural medicines, including medicinal plants such as Arnica and many others (Planta Europa and Council of Europe, 2002). Flowering plants and some animals (and rocks and minerals) are often exploited as ornamental resources. These and the diversity of mountain organisms in general, provide a major source of genetic resources, many still probably unrecognised or untapped. Mountain ranges and their ecosystems may also have strong effects on the dispersal of organisms. Physical conditions and topography, in combination with mountain habitats that are different to those of lowlands, can act to provide ecological corridors that facilitate

Review of concepts of dynamic ecosystems and their services 20
dispersal, or can function as barriers that inhibit species movements. These effects may in turn have positive or negative consequences, as they may influence not only population viability for biodiversity maintenance and service provision, but also influence the spread of pests, diseases and invasive species (Council of Europe, 2000). The cultural services provided by mountains are manifold. The mountain environment offers a strong sense of place and may have spiritual or religious values for local inhabitants. The latter may be related to the landscape itself or to other services, such as traditional agriculture. Humans have inhabited and used mountains for so long that traditional mountain ways of life and the landscape mosaics that have been created may be valued as part of our cultural heritage. The Alps and other European mountains serve as focal points of international tourism, to the extent that human usage in this way is now often detrimental and even destroys those services that are of value to the visitors in the first place (winter sports, walking, biking, etc). Identification and conservation of the species and landscape features most relevant to this service are thus essential for arriving at a sustainable form of mountain eco-tourism. Species diversity, with many endemic or charismatic animals and plants and spectacular landscapes are of strong aesthetic value. Various mountain species and habitats are listed under the EU Birds and Habitats Directives because of their recognised conservation importance. In particular, the proportion of regional endemics is pronounced among high mountain biota (Pawlowski, 1970; Médail and Verlaque, 1997). These endemic floras and faunas increasingly attract visitors (and represent a major genetic resource). The associated National Parks and other protected areas in mountains provide a framework for eco-tourism and also have an important role in education and awareness, particularly with the help of guided walks, nature trails, informative exhibitions, literature and information presented using other media. In summary, mountains and their ecosystems provide many services from each of the four main MA categories. Importantly, services in each category are included that make specific contributions to lowland as well as highland economics. 3.6 Soil ecosystems Soil functions provide supporting services that are essential to sustain all of the ecosystem services described above, giving economic and non-economic benefits to human populations (e.g. provision of habitat, nutrient cycling, primary production) (Decaëns et al., 2006). Soils are also implicated in several regulatory services, such as climate regulation, the hydrological cycle and flood control, detoxification and pest regulation (Lavelle and Spain, 2001). Finally, soils contribute indirectly to some cultural services, such as recreation and ecotourism, aesthetic values and sense of place. Services are provided by a large range of soil inhabitants. In fact, soil habitats comprise one of the most diverse assemblages of living organisms on Earth (Giller et al., 1997). According to recent estimates, soil animals may represent as much as 23% of the total biodiversity that has been already described (Decaëns et al., 2006). Besides the vast functional diversity provided by microorganisms (e.g. bacteria, fungi), three size classes of soil fauna are important: the microfauna (e.g. Nematoda, Protozoa) that colonize the water-filled pores; the mesofauna (e.g. Enchytraeidae, Microarthropoda – Acari, Collembola) that live in the air-filled soil pores; and the macrofauna (e.g. largest annelids, largest arthropods), that live in the

Review of concepts of dynamic ecosystems and their services 21
surface litter or in nests and burrows that they create in the soil (Coleman and Crossley, 2003; Lavelle et al., 2006). The latter encompass the so-called ‘ecosystem engineers’ (mainly earthworms, termites and ants), i.e. organisms that directly or indirectly modulate the availability of resources to other species, by causing physical state changes in biotic or abiotic materials (Jones et al., 1994, Jouquet et al., 2006). Ecosystem engineers play a key-role in the soil by supporting ecosystem services such as decomposition and nutrient cycling. Even though microorganisms are directly involved in the biochemical decomposition of organic matter (OM) and nutrient transformations, their functions are closely related to the burrowing and casting activities of soil engineers (Cole et al., 2006). These activities provide habitat for microbes and facilitate the availability of organic substrates, regulating their decomposition activities (e.g. Jégou et al., 2001; Smith and Bradford, 2003; Frouz et al., 2006; Postma-Blaaw et al., 2006). The macrofauna itself, as well as organisms from the mesofauna, also directly cause OM break-down by their feeding activities, contributing to its efficient and fast decomposition (e.g. Ketterings et al., 1997; Schrader et al., 1997; Filser, 2002; Dechaine et al., 2005). These functions are also performed by the ‘litter transformers’, i.e. organisms from the macro and mesofauna that normally ingest purely organic material, developing external mutualistic associations with microflora which feeds on the fragmented and moistened OM of the faunal faecal pellets (Lavelle and Spain, 2001). OM comminution and bioturbation activities of soil macro and mesofauna are also intimately related to other supporting services such as soil formation, water cycling and primary production. Concerning soil formation, despite the importance of organic matter inputs to improving soil physical structure and aggregation, OM itself does not create soil aggregates. Those are mostly dependent on the use of organic inputs by the invertebrate ecosystem engineers that transform the nutrients and energy contained in OM into solid and persistent aggregates (biogenic structures, e.g. compact casts) (Jiménez and Lal, 2006; Lavelle et al., 1997, 2006). The creation of surface roughness by biogenic structures is also supported by a variety of mesofaunal organisms (e.g. Collembola, Enchytraeidae) ( Marinissen and Didden, 1997; Langmaack et al., 2001). Regarding water cycling, soil fauna bioturbation effects on the properties of the soil surface are the most important factors controlling the hydrological behaviour of the soils (Lobry de Bruyn, 1999; Nkem et al., 2000). Soil bioturbation creates a network of galleries and chambers that increases soil porosity and drainage (Folgarait, 1998), facilitating an efficient use of water by plants. Food and fibres produced by agriculture are strictly dependent on the activity of soil organisms as their services create suitable habitat and increase nutrient availability and its efficient up-take by plants (e.g. Helling and Larink, 1998; Brown et al., 1999; Villenave et al., 1999; Scheu, 2003; Brown et al., 2004; Ortiz-Ceballos et al., 2007). In addition to supporting food production in agro-ecosystems, soil organisms themselves (mainly earthworms) have economic value as food resources for other ecosystem service providers. For example, earthworm biomass is consumed by 63% of small game in France (Decaëns et al., 2006). For this reason soil fauna also play an important role in conservation biology as they constitute a keystone resource for many mammals, birds, reptiles and amphibians, some of them with important conservation value. Moreover, earthworms, as well as soil arthropods (mainly ants and termites) are direct food resources for several ethnic groups (e.g. in Amazonia) (Decaëns et al., 2006).

Review of concepts of dynamic ecosystems and their services 22
Most soil functions leading to ecosystem supporting services are also connected with some regulatory services. For instance, earthworm burrowing and casting activities, through their OM storage in stable biogenic macroaggregates play an important role in carbon sequestration, contributing to climate regulation (Lavelle et al., 2006). Some experiments revealed higher carbon contents in earthworm casts when compared with the surrounding soil (e.g. Blanchart et al., 1997; Hedde et al., 2005; Jiménez and Lal, 2006). Feeding activities of soil fauna, besides supporting nutrient cycling via regulation of microorganism activities, also contribute to protection of plants against pests and diseases (e.g. Yeates and Bongers, 1999; Koehler, 1999; Shiraishi et al., 2003; Cole et al., 2006). Along with soil formation and water cycling, soil fauna have a decisive role in flood and erosion control (natural hazards regulation). In fact, the creation of surface roughness and the maintenance of stable porosity play a critical role in the regulation of water runoff and soil erosion processes (e.g. Leonard and Rajot, 2001; Lavelle et al., 2006). Soils also regulate ecosystem contamination (e.g. by heavy metals) due to their buffer capacity. This function is dependent on the adsorption processes performed by soil colloidal particles (mainly organic matter, humus, clay minerals and iron oxides) that result from physical and chemical weathering processes (Sipos et al., 2005). Colloidal particles have generally a negative charge which allows them to attract and retain positively charged nutrients (‘cation exchange capacity’) such as some soil contaminants (e.g. lead, nickel, cadmium) (Varennes, 2003). Furthermore, soils regulate the degradation of organic compounds (e.g. pesticides, fertilisers) through bacterial activities since they directly use them as sources of carbon. These soil functions, providing contaminant immobilisation and degradation, avoid the impairment of soil organisms as well as the pollution of ground and/or surface water. 3.7 Wetland ecosystems Wetlands are diverse environments; spatially and temporally, but also in terms of physical location, ecology, hydrology and geomorphology. The Ramsar Bureau was one of the first organisations to embrace this variation within a single definition; grouping together a wide variety of landscape units whose ecosystems share the fundamental characteristic of being strongly influenced by water. Since 1971 the bureau has considered wetlands to be “areas of marsh, fen, peatland or water, whether natural or artificial, permanent or temporary, with water that is static or flowing, fresh, brackish or salt, including areas of marine water the depth of which at low tide does not exceed six metres” (Davis, 1994). The Ramsar classification system for wetlands (Davis, 1994) illustrates the diversity of wetland types that occur around the globe, focusing on a range of hydrological, ecological, geomorphological and economic characteristics. Dugan (1990) suggests that these can be grouped and simplified according to seven common landscape units, indicative of specific geomorphologies: (i) estuaries; (ii) open coasts ; (iii) floodplains; (iv) freshwater marshes; (v) lakes and ponds; (vi) bogs and peatlands; and (vii) swamp forests. Man-made wetlands, such as paddy systems, irrigation tanks and waterlogged areas, could be added to these groups. There is a clear overlap between wetland systems and other ecosystems such as agro-ecosystems, lakes and forest. The overall area of wetlands in the world has been estimated to be over 1,280 million hectares, depending on the variations in the definitions used for identification (Finlayson et al., 2005). Although wetlands are a common landscape feature across all continents, there is an uneven distribution in specific types. For example, the cool, wet climate of the temperate and sub-arctic zones favour the development of bogs which, according to Mitsch et al.

Review of concepts of dynamic ecosystems and their services 23
(1994), probably account for over half of the world’s wetlands. In tropical areas, however, bogs and peat are relatively scarce and most are located in highland areas which receive abundant rainfall (Hughes, 1996) as well as in the humid tropics of Indonesia (Kalimantan). Mangrove forests are the tropical and sub-tropical equivalent of temperate saltwater marshes (Hughes, 1996). The value of wetlands has been recognised in the last decades. In the developed world, where the majority of wetland degradation has occurred, there is now recognition that wetlands are actually multi-functional natural resources with a range of inherent values (Maltby, 1986; Dugan, 1990; Barbier et al., 1997; Roggeri, 1998). The Ramsar convention in 1971 was an important step in highlighting their importance for global biodiversity. The environmental functions and socio-economic benefits that wetlands can provide as ecosystem services are of strategic importance for the world and especially economies in developing countries (Adams, 1993) as whole communities are dependant upon their productivity and hydrological benefits. Discussions of the functions associated with wetlands are numerous (Adamus and Stockwell, 1983; Maltby, 1986; Dugan, 1990, Barbier, 1993, Roggeri, 1998; Finlayson et al., 2005), and considerable research has been carried out on the specific roles wetlands play and how these interact with the local environment. Despite the wealth of literature, however, classifications of the functions and benefits are rarely consistent. It is useful to view wetland functions and benefits broadly as ecosystem services and these are discussed below, although as highlighted in Table 3.2, it is important to recognise that not all wetlands support the full range of ecosystem services; specific services may be associated with specific types of wetland. Table 3.2: Ecosystem services provided by different types of wetlands. Freshwater
wetlands Estuaries Floodplains Lakes Bog and
peatland Provisioning services Agricultural production • • Fibre, fuel, medicinal and dietary supplements
• • •
Fish production • • • • Water supply • • • Energy supply • • • Regulation services Water regulation • • • • Sediment trapping • • • Water purification • • • • • Climate regulation • • • • Pest regulation • • Cultural services Spiritual and inspirational • • • • Aesthetic values • • • • • Recreation and ecotourism • • • Sense of place • • • • • Supporting services Primary production • • • • Provision of habitat • • • • • Nutrient cycling • • • • • Water retention and cycling • • • •

Review of concepts of dynamic ecosystems and their services 24
The provisioning services provided by wetlands tend to be associated with the direct exploitation of wetland products for economic gain or subsistence. Agricultural production takes place in and around many wetlands, where crops such as rice, maize, and various vegetables and fruit are cultivated (Dries, 1989; Soerjani, 1992; Omari, 1993). Seasonal wetlands can provide a valuable resource for livestock grazing as a result of the high biomass associated with these areas. In savannah wetlands (Africa, Latin America) agricultural production is dominated by cattle breeding (Sarmiento and Pinillos, 2000; Roberts, 1988; Turner, 1994). The agricultural use of wetlands, ponds and river margins can also provide important services to farming systems such as pollination, the harbouring of natural predators of agricultural pests, and hatching and breeding areas for fish. Fibre, fuel, medicinal and dietary supplements are also products that can be derived from wetlands. In Indonesia, 70% of the 266 species of weeds associated with wetland rice cultivation can be utilised for medicine, cattle fodder, household purposes or human consumption (Soerjani, 1992). Fish can also be an important product from wetlands, particularly in the developing world where there is often a localised economic and nutritional dependence on this resource as fish provides a crucial source of proteins (Maltby, 1986; DeMerona, 1992). Most wetlands can provide a potable supply of water for the surrounding population, which is a critical function in many semi-arid or seasonally dry areas (Scoones, 1991). A wetland’s ability to regulate and store water can also be beneficial in the production of hydro-electric power by moderating and thereby improving the constancy of supply of water for power production. Depending upon their ecohydrological and geomorphological characteristics, wetlands are able to provide a diversity of services that play a key role in the regulation and stability of the physical environment. It is important to recognise that not all wetlands provide every service and that in many cases it is difficult to identify precisely the extent of the service and the value which can be put on it. For example, water table recharge and discharge is infrequent and very difficult to quantify; natural wetlands are most likely to occur in natural depressions in the landscape with low permeable soils and/or high water tables. Flood control and river regulation is very site specific, and exploitable mostly with respect to urban centres. Sediment trapping is common in floodplains and deltas; in other wetlands it is too complex to measure positive impacts. Biosphere and micro-climate stabilisation is limited, except for in mist rain forests. However, carbon sequestration is important in bogs and peatlands and is a part of the world’s climate regulation system. They are one of the biggest carbon sink in the world, probably more important than most forests. Pest regulation through the biological control of the water hyacinth, Eichhornia crassipes, by the weevil Neochetina eichhorniae is very important in wetlands, lakes and still reaches of water. Finally, water purification and the maintenance of water quality is a significant regulatory service of wetlands which is both manageable and economically exploitable. Wetlands have important functions in many cultures in the world. How these cultural services are valued depends on the community, varying from the sacred source of life to the permanent threat of dangerous nature, what is often the case for bogs. There are many examples of cultures around the world where wetlands or water have a spiritual significance as the life-force or mauri (Maoris) for which people are obligated to have a duty of care (Williams, 1991). Wetlands also have aesthetic value; all over the world people are attracted by the beauty of wetlands, as can be seen in paintings, pictures and the numerous tourists

Review of concepts of dynamic ecosystems and their services 25
going to the Everglades, Pantanal, Camargue and the Coto Doñana. Futhermore, wetlands are host to a rich biodiversity and often represent areas of high endemicity for rare or endangered species (Dugan, 1990). Wetland ecosystems in different forms can provide important primary production services. Wetlands can be highly productive systems as they are collectors of nutrients (freshwater wetlands, estuaries, river floodplains and lakes). They also contribute to nutrient cycling and can purify water, store nutrients and make them available for other functions. A large variety of habitats are provided by wetlands ranging from ponds and temporary wetlands within agricultural systems to permanent habitats for macrofauna, fish, amphibians, birds and mammals. Finally, wetlands are essential in retaining water in periods of flooding. The character of the wetlands determines how long water is stored and passed on to other parts of the landscape. Healthy bogs retain water much longer than river floodplains. Despite the importance of wetlands, some recent research has argued that the ecohydrological relationships in many wetlands remain poorly understood (Bullock and Acreman, 2003). It is important, therefore, to exercise caution when generalising about the regulating services performed by wetlands, and also the socio-economic benefits that emanate from these services. A key criticism of global wetlands policy to date has been the popularisation of universal wetland values as a means of justifying and promoting wetland preservation. In reality, there is a need for a more site specific approach, with sensitivity to the biophysical and socio-economic diversity. 3.8 River and floodplain ecosystems Rivers and floodplains are among the most diverse ecosystems worldwide and play an important role within the freshwater cycle. Intrinsically, they constitute one ecosystem because of multiple interactions and interdependencies. Although the area covered by rivers and floodplains is relatively small, they are almost omnipresent and closely interlinked with terrestrial ecosystems in all ecoregions worldwide except deserts. The major environmental characteristics - altitude, slope and size - gradually change along the river continuum (Vannote et al., 1980): upstream zones are characterised by strong current, coarse sediment and low water temperatures; the downstream sections usually have a lentic (slow flowing) character, fine sediments and higher water temperatures. While small upland streams typically flow in a straight V-shaped valley without a floodplain, the channel of larger lowland rivers usually meanders in a regularly inundated floodplain reaching up to several kilometres in width. In addition to the longitudinal river continuum, a distinct gradient from the main channel to the floodplain edges is apparent, along which habitat conditions gradually change from aquatic to terrestrial. Typically, floodplains form a mosaic of aquatic, terrestrial and semi-terrestrial habitat patches in different successional stages thus supporting a large number of species and acting as biodiversity hot-spots in the landscape (e.g. Ward et al., 1999; 2002). Few attempts have been made to estimate the overall species number in a river. In a small European mountain brook in Central Europe, which has been continuously investigated for more than 40 years, more than 1,000 animal species have been recorded, but still many more might occur (Zwick, 1992). Floodplain communities in temperate ecoregions might have several thousand species, possibly some tens of thousands.

Review of concepts of dynamic ecosystems and their services 26
Two main stressor types are supposed to be responsible for the deterioration of river and floodplain ecosystems worldwide: pollution (with sewage, nutrients, acid and toxic substances) and hydraulic engineering disconnecting the river and the floodplain. While the impact of pollution is often reversible, river and floodplain engineering can ultimately destruct a river ecosystem, particularly in lowland areas. Rivers provide, regulate and support processes, functions and services to all ecosystem types they are interconnected with, particularly through the provision of fresh water. The principal service of river ecosystems is the provision of fresh water, which is supported and regulated by biodiversity components. The contribution of river and floodplain species, populations, functional and structural components of biodiversity to the provision of fresh water is manifold, yet often indirect. Abiotic rather than biotic components of river ecosystems provide this service, whereas the biotic components account for regulatory and supportive services, for instance by preventing deterioration or supporting rehabilitation of fresh water resources. Freshwater fish, crayfish and molluscs are important sources of proteins in many parts of the world. Overall inland capture fishery production was 9.22 million tons in 2004 (FAO Fisheries and Aquaculture Department, 2007). Biotic communities play a pivotal role in securing fresh water quality and quantity, which is classified as regulatory and supporting services according to the Millennium Ecosystem Assessment definitions (MA, 2005). For instance, microbial communities (bacteria and fungi) are the main processors of organic sewage and regulate the self purification of rivers (Spellman and Drinan, 2001). Self purification is a prerequisite for access to clean, fresh water as it supports the technical purification in wastewater treatment plants. In many regions of the world, self-purification is still the only form of wastewater treatment. Further, some fish species are effective in controlling mosquito vectors, thus limiting the spread of diseases (Goodsell and Kats, 1999). Riparian vegetation buffers sediments, pollutants and nutrients from adjacent areas. The retention positively affects water quality and several riverine processes, such as primary production and reproduction of benthic invertebrates. Width, density and zonation of the riparian vegetation determine retention effectiveness (Dosskey, 2001; Correll, 2005). Another important service of the wooded riparian vegetation is the provision of wood to the river system. Tree trunks, branches, twigs and leaves constitute the main source of carbon for the river community. Benthic invertebrates feed on the particulate organic material (POM) and process it to finer particle sizes (Wallace and Webster, 1996). This ultimately affects the productivity of economically important fishes. Terrestrial insects falling from the canopy of the riparian forest onto the water surface often significantly contribute to the diet of fish (Romero et al., 2005). Sediments from hillslopes may enter rivers especially in agri- and sylvicultural areas. These cover the coarse substrata, which are the spawning habitats of many economically important fish (trout, char). In temperate and boreal regions of the northern hemisphere the storage of sediment (and of water and organic matter) in upstream reaches is greatly enhanced by beavers (Castor canadensis in North America and Castor fiber in Europe). For a watershed in Quebec, Naiman et al. (1986) estimated that beaver dams retained a quantity of sediment that would cover the stream bottom with a layer of 42 cm of sediment if evenly distributed throughout all streams in the watershed.
Review of concepts of dynamic ecosystems and their services 27
Fallen trees influence hydromorphological processes, for instance the formation of pools, which greatly increases a river’s water and sediment storage capacity. In boreal regions coniferous trees are most important since they decay relatively slowly and form structures which persist for decades. Deciduous trees, however, which decay rapidly, are more important for enhancing the river’s productivity and ultimately the fish production (Harmon et al., 1986). Rivers transport water, nutrients, sediment and organic matter downstream as well as laterally into the floodplain. Several ecosystems – besides floodplains – depend on the continuous provision of these resources, such as lakes connected to the river and wetlands. However, the transport of water may also impose threats to human properties and well-being. Floods affect life, estates and farmland along large rivers, which can result partly from changes in annual precipitation patterns, but also from continuous hydromorphological modification and regulation of rivers. Floodplains (literally) serve human well-being in that they provide the area to retain floods. Moreover, floodplains store water for some time and, hence, regulate river discharge; they cut-off peak flows and balance the overall hydrograph. Rivers and floodplains have always been strongly linked to culture and attracted people in all regions of the world. Most world religions have traditions and rites related to rivers, such as ritual bathing and baptism. Sacred river pools in North India, for instance, are protected because of their religious importance. The pools serve as spawning and breeding habitats for fish, since fishing is strictly prohibited in the pools (Capistrano et al., 2005, p. 272). Rivers and floodplains are intensively used for recreational activities (bathing, boating, rafting, canoeing, game fishing, hiking, photography and wildlife viewing). In general, near-natural, diverse floodplains are more attractive, while particular species (mainly fish and birds) are of economic importance for tourism and related local business. Economic benefits of particularly rural areas from sport anglers are significant (overview in Everard, 2004). National parks worldwide aim at the protection of river and/or floodplain systems and help to raise the public awareness of nature’s value to human beings. Moreover, by their educational conception, river national parks (park rangers, visitor centres, etc.) aim at raising public awareness and provide the knowledge to make people aware of the direct and indirect benefits of intact rivers and floodplains to them. Since water quality is important for human well-being, it is subject to continuous monitoring in most countries. Besides a number of standard physico-chemical parameters, multiple biological indicators are being used: protozoa, algae, aquatic macrophytes, zooplankton, benthic invertebrates, and fish. By using different bioindicators, the monitoring programs allow integration over time and space and, hence, provide an important advantage over physico-chemical spot measures (Hering et al., 2006). 3.9 Lake ecosystems There are many services provided by inland waters (including lakes). These include provisioning, regulating, cultural as well as supporting services. Whether fresh water should be defined as a supporting, provisioning or regulatory service is discussed within the MA chapter on fresh waters (Vörösmarty et al., 2005) because “….the water cycle plays so many roles in the climate, chemistry, and biology of Earth”. These authors also note that water is both an ecosystem service as well as a system (inland waters). Water is one of the main ecosystem services delivered to humans (together with nutrients and energy) (Falkenmark
Review of concepts of dynamic ecosystems and their services 28
and Folke, 2003). The total volume of fresh water on Earth is estimated to be around 35,029 thousand cubic kilometres (Shiklomanov and Rodda 2003), which is about 2.5% of the total volume of water on the planet. Out of these, 91 thousand cubic kilometres (0.26% of the total fresh water volume or 0.007% of the total volume of water) consists of lakes, with most of the water held in glaciers/permanent ice (68.7% of the total fresh water volume), and fresh groundwater (30.1% of the total fresh water volume). The use of water by humans can be divided into three main categories: domestic use, industrial use and agricultural use. The total water use according to the MA (Vörösmarty et al., 2005) is 3,560 cubic kilometres per year (which is about 25% of the continental runoff to which the majority of the population has access during the year). Most of it is used in agriculture (69.7%), with 21.2% used in industry and another 9.2% for domestic purposes. Most water is used in Asia (43.5%) with the OECD countries being second using 28.7%. There is, however, quite a large degree of uncertainty in these figures. The MA also projects that there will be a 10% increase in fresh water use from 2000 to 2010, slowing down from a 20% per decade increase between 1960 and 2000. Between 5 and 25% of global freshwater use exceeds long-term accessible supply. Also most of the fresh water supply used by humans comes from forest (57% of the total runoff) or mountain (28%) ecosystems, with very small quantities actually coming from cultivated (16%) and urban areas (0.2%). The MA describes a large number of other important services provided by lake and inland water ecosystems (Finlayson et al., 2005). These include: provisioning services such as food, fibre and fuel, biochemical (extraction of materials from biota), genetic material and biodiversity (species and gene pool); regulating services such as climate regulation, hydrological flows (e.g. storage of water for industry and agricultural use), pollution control and detoxification (retention, recovery and removal of excess nutrients and pollutants), erosion control through the retention of soils, preventing natural hazards through flood control and storm protection; cultural services such as spiritual values, education and inspiration, recreation and ecotourism, and aesthetic beauty; and finally supporting services such as soil formation through sediment retention and accumulation of organic matter as well as nutrient cycling through the storage, recycling, processing, and acquisition of nutrients. The majority of the provisioning, cultural and supporting services are provided by the biodiversity within freshwater ecosystems. Dudgeon et al. (2006) divides the services provided by freshwater biodiversity into four main categories: (i) direct contribution to economic productivity (e.g. fisheries); (ii) an insurance value in light of unexpected events; (iii) a storehouse for genetic material; and (iv) its value in supporting the provision of ecosystem services. The value of inland water ecosystem services is estimated to be 2-5 trillion (1012) US$ annually (Costanza et al., 1997; Postel and Carpenter, 1997; as cited in Finlayson et al., 2005). Despite uncertainties associated with these estimates, Finlayson et al. (2005) conclude that “it is well established that these systems are highly valued and extremely important for people in many parts of the world. It is speculated, but not well documented globally, that the loss and degradation of inland water systems has resulted in an immense loss of services.” Even though the value of these services are very high, they are “….often taken for granted or treated as a common good, with the real value only being recognized after the services have been degraded or lost” (Finlayson et al., 2005). Freshwater ecosystems are highly endangered (Dudgeon et al., 2006), with the decline in freshwater biodiversity being far greater than in most terrestrial ecosystems (Sala et al.,

Review of concepts of dynamic ecosystems and their services 29
2000). This is because freshwater ecosystems contain a disproportionate richness of plants and animals (Dudgeon et al., 2006). For example, they contain over 10,000 fish species (Lundberg et al., 2000), which is 40% of the global fish diversity and 25% of the global vertebrate biodiversity. Hence, even though freshwaters contain only 0.01% of the world’s water and cover only 0.8% of the surface area, they contain around 100,000 out of the 1.75 million (5.7%) described species in the world (Hawksworth and Kalin-Arroyo, 1995; as cited in Dudgeon et al., 2006). Dudgeon et al. (2006) lists five major threats to freshwater biodiversity: (i) overexploitation; (ii) water pollution; (iii) flow modification; (iv) destruction or modification of habitats; and (v) invasion by exotic species. Further, global environmental changes, such as nitrogen deposition and climate change are superimposed upon all of these threat categories. Finlayson et al. (2005) recognise six major drivers of change in inland waters: (i) physical changes including drainage, clearing, and filling; (ii) modification of water regimes; (iii) invasive species; (iv) fisheries and other harvesting; (v) water pollution and eutrophication; and (vi) climate change. The particular vulnerability of freshwater biodiversity and its services stems in part from the fact that lakes (and rivers) are (almost always) positioned at the bottom of valleys which makes them ‘receivers’ of wastes, sediments and pollutants in runoff (Dudgeon et al., 2006). Many drivers of change in freshwater ecosystems also operate in concert, even though often the drivers are considered in isolation and “without an adequate information base” (Finlayson et al., 2005). 3.10 Landscapes Landscapes consist of a mixture of ecosystems such as wetlands, streams, forests, woodlands, agriculture, and human settlements (Wickham and Norton, 1994; Mucher et al., 2003; Wascher, 2005; Pedroli et al., 2006). Some landscapes are dominated by a few ecosystem types, whereas others are comprised of highly diverse mosaics of ecosystem types (Wickham and Norton, 1994). Some patterns of ecosystems (landscapes) tend to repeat themselves across specific geographic areas, often depending on the spatial arrangement of underlying biophysical conditions (e.g. soils, parent rock materials, topography and landform, etc., Jongman et al., 2006). It is the interactions of these ecosystems in space and time that often determine the outcome of species and communities and their cumulative impact on ecosystem services (Hovel and Lipcius, 2001; Murphy and Lovell-Doust, 2004). Relationships between landscape patterns and species traits, food-webs, populations and entire biotic communities have been described at a number of scales, ranging from relatively small areas (Wiens et al., 1997; Komonen et al., 2000; Valladares et al., 2006) to regions and continents (Robinson et al., 1995; O’Connor et al., 1996; Atauri et al., 2001; Donovan and Flather, 2002). Advances in sensors that map important earth surface features, and in computing capacity, have resulted in the development of ecological and landscape indicators and models to track and forecast changes in important ecosystem processes and services across a range of scales (O’Neill et al., 1988; Baker et al., 2004; Running et al., 2004; Allen et al., 2006; Dale and Polasky, 2007). Landscape composition and pattern strongly influence fluxes and flows of the four primary ecological elements: water, nutrients, biota, and materials (Turner, 1989). These fluxes and flows in turn determine the quality and diversity of ecosystem services derived from a landscape, catchment or river basin (Rapport et al., 1998). Moreover, the spatial intersection
Review of concepts of dynamic ecosystems and their services 30
of biotic (vegetation) and abiotic (soils) factors often determine the quality of any specific service provided in the landscape (Rapport et al., 1998). Finally, the cumulative fluxes and flows associated with entire basins often influence the quality of, and impairment to, estuaries, lagoons and near-shore habitats (Basnyat et al., 1999; Hale et al., 2004). Because of the importance of position and pattern of ecosystem elements in landscapes, the whole (the landscape and its associated ecological patterns) is greater than the sum of its parts (additive value of the individual ecosystem components, Rapport et al., 1998). The landscape matrix determines the effectiveness and importance of the individual biotic components rather than simply adding up the individual components to obtain a range of benefits (Ricketts, 2001; Baum et al., 2004; Tubelis et al., 2004). Yet the position of the landscape elements within the matrix is also important. For example, forests located along stream margins may yield greater benefits for water related services than forests in upland areas (Jones et al., 2006). Horizontal flows and fluxes also are influenced by position of biotic and abiotic elements in the landscape (Reiners and Driese, 2001; Urban and Keitt, 2001; Voinov et al., 2004; Ludwig et al., 2005; Peters et al., 2006). All of the ecosystem services given in Table 3.1 are influenced by landscape composition, pattern, geographic position and context. Landscapes comprised of relatively large amounts of natural vegetation tend to maintain a greater variety and quality of ecosystem services, primarily because they tend to reduce energy from wind and water, increase water filtration, maintain soils (nutrients, elements, biota), maintain native habitats for terrestrial and aquatic species, increase photosynthetic capacity and resist invasive species establishment (Costanza et al., 1997; Rapport et al., 1998). Landscapes and catchments with natural vegetation along stream margins and in head water areas tend to dissipate energy from flood waters, retain soils and nutrients and filter water coming into rivers and streams (removal of nutrients and sediments, Lowrance et al., 1984; Baker et al., 2006). Retaining soils and nutrients helps sustain timber and agricultural products (food). These landscapes also provide habitat for aquatic and terrestrial organisms which are critical in sustaining wildlife-related recreational and commercial services. Additionally, connectivity of certain land cover types (e.g. forests, woodlands and grasslands) often promotes and enhances species richness (Damschen et al., 2006). The amount and pattern of anthropogenic land use and land cover across a landscape or basin often determines the relative quality and diversity of ecosystem services (Baker et al., 2004; Naidoo and Ricketts, 2006). Landscapes with high amounts of impervious surface (industrial areas, urban centers) tend to lose their capacity to: (i) filter nutrients and contaminants from water; (ii) abate flood waters associated with extreme climatic events, (iii) retain water, soils, and nutrients; (iv) resist invasive species establishment; and (v) provide for natural predators of pests (Slonecker et al., 2001; Jennings and Jarnagin, 2002). These landscapes also produce significant inputs of, and exposures to, contaminants that affect ecosystem quality (Ator et al., 2003). The key issue is the degree to which you can distribute people and communities within landscapes without impairing or losing important ecosystem services. Solutions to these problems will depend on the biophysical setting (some landscapes are more forgiving than others due to soils, climate, landform, etc.), the ability to implement strategic actions across the landscape that protect and enhance ecosystem services, the magnitude of external forces and drivers that constrain or influence landscape conditions (e.g. upper basin landscape conditions, climate change, external economic drivers), and the cultural diversity and patterns that have shaped the landscape (Christensen et al., 1996; Jongman et al., 2006).
Review of concepts of dynamic ecosystems and their services 31
One of the best examples of the importance of landscape composition and pattern and ecosystem services is the case of New York City’s drinking water. The primary supply of drinking water for more than 10 million residents of New York City comes from two basins in Upstate New York. These basins are largely undeveloped. However, water quality monitoring in the 1990s suggested spikes in fecal coliforms and other potential pollutants (Mehaffey et al., 2005). At the same time, there was concern over changes in land use and development within both basins, and the potential contribution of these changes to the observed water quality issues. The high quality water from these basins, and the delivery system, has resulted in the exemption of the City from building a filtration system. Estimated costs for building a filtration system to address the issues ranged between $4 and $7 billion US dollars. The major question was whether or not strategic land conservation activities (set aside, land-use practice changes, etc.) could mitigate the problem (cost range of $400 - $600 million US dollars) or whether a multi-billion dollar filtration system needed to be built. Detailed landscape analyses revealed that strategic conservation activities could mitigate this problem (Mehaffey et al., 2005). Therefore, the value of water filtration services provided by these landscapes is several billion dollars. Broad-scale landscape planning often determines the effectiveness of many of the individual species and community traits in maintaining and restoring a variety of ecosystem services. For example, re-establishment of natural pest control in agricultural landscapes is dependent upon the network of suitable habitats for natural predators across the landscape (Bhar and Fahrig, 1998). Specific types of farming practices and systems can dramatically influence important aspects of habitat quality including connectivity (Baudry et al., 2003). Corridors can increase species richness (Damschen et al., 2006), and their establishment and maintenance are fundamental to many conservation programs (Dixon et al., 2006). A landscape perspective (spatial composition, pattern and position) also provides for a common framework to evaluate social, economic and cultural dynamics and their relationship to ecosystem services (Naidoo and Ricketts, 2006). However, considerable additional research is needed to understand linkages between landscape-scale ecosystem services and socio-economic, demographic, and cultural drivers of landscape change. Advances in earth observations and computing will continue to advance our understanding of landscape-scale processes that sustain a wide range of ecosystem services. 4. Quantification of ecosystem services While research on the contribution of biodiversity to ecosystem services is in its infancy, related work on its contribution to selected ecosystem processes is relatively well established. This has focused on the role species and functional diversity (particularly in plants) play in modulating ecosystem processes such as primary production, nitrogen retention, decomposition and stability (Huston 1997; Schwartz et al., 2000; Díaz and Cabido, 2001; Loreau et al., 2001; Tilman et al., 2001; Duffy, 2002; Srivastava and Vellend, 2005; Tilman et al., 2006). It is logical to extend such work to include ecosystem services (e.g. Balvanera et al., 2006; Díaz et al., 2006; Tilman et al., 2006). Carpenter et al. (2006) recently highlighted the lack of a theoretical framework to link ecological diversity with ecosystem service provision and human well-being. There is a clear need to develop approaches that identify and quantify changes in ecosystem dynamics and their implications for ecosystem services. This has been attempted by Luck et al. (2003),
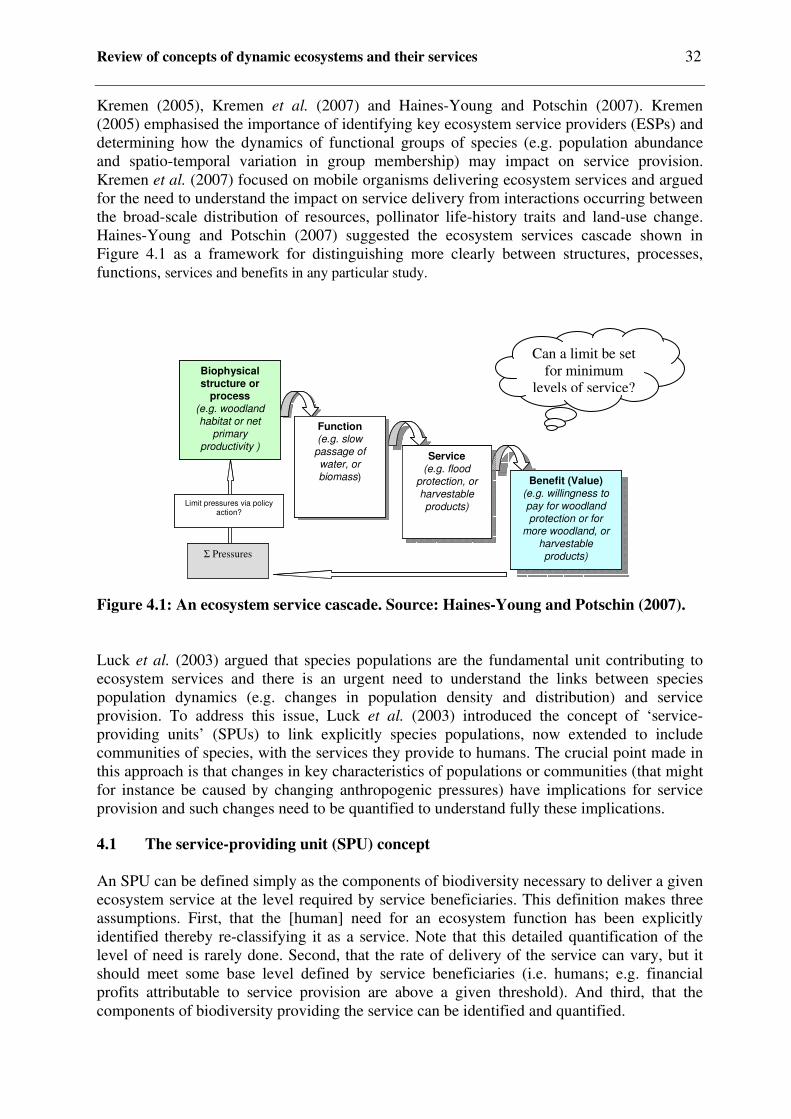
Review of concepts of dynamic ecosystems and their services 32
Kremen (2005), Kremen et al. (2007) and Haines-Young and Potschin (2007). Kremen (2005) emphasised the importance of identifying key ecosystem service providers (ESPs) and determining how the dynamics of functional groups of species (e.g. population abundance and spatio-temporal variation in group membership) may impact on service provision. Kremen et al. (2007) focused on mobile organisms delivering ecosystem services and argued for the need to understand the impact on service delivery from interactions occurring between the broad-scale distribution of resources, pollinator life-history traits and land-use change. Haines-Young and Potschin (2007) suggested the ecosystem services cascade shown in Figure 4.1 as a framework for distinguishing more clearly between structures, processes, functions, services and benefits in any particular study. Figure 4.1: An ecosystem service cascade. Source: Haines-Young and Potschin (2007). Luck et al. (2003) argued that species populations are the fundamental unit contributing to ecosystem services and there is an urgent need to understand the links between species population dynamics (e.g. changes in population density and distribution) and service provision. To address this issue, Luck et al. (2003) introduced the concept of ‘service-providing units’ (SPUs) to link explicitly species populations, now extended to include communities of species, with the services they provide to humans. The crucial point made in this approach is that changes in key characteristics of populations or communities (that might for instance be caused by changing anthropogenic pressures) have implications for service provision and such changes need to be quantified to understand fully these implications. 4.1 The service-providing unit (SPU) concept An SPU can be defined simply as the components of biodiversity necessary to deliver a given ecosystem service at the level required by service beneficiaries. This definition makes three assumptions. First, that the [human] need for an ecosystem function has been explicitly identified thereby re-classifying it as a service. Note that this detailed quantification of the level of need is rarely done. Second, that the rate of delivery of the service can vary, but it should meet some base level defined by service beneficiaries (i.e. humans; e.g. financial profits attributable to service provision are above a given threshold). And third, that the components of biodiversity providing the service can be identified and quantified.
Biophysical structure or
process(e.g. woodland habitat or net
primary productivity )
Service(e.g. flood
protection, or harvestable products)
Service(e.g. flood
protection, or harvestable products)
Function(e.g. slow
passage of water, or biomass)
Function(e.g. slow
passage of water, or biomass)
Benefit (Value)(e.g. willingness to pay for woodland protection or for
more woodland, or harvestable products)
Benefit (Value)(e.g. willingness to pay for woodland protection or for
more woodland, or harvestable products)� Pressures
Limit pressures via policy action?
Biophysical structure or
process(e.g. woodland habitat or net
primary productivity )
Service(e.g. flood
protection, or harvestable products)
Service(e.g. flood
protection, or harvestable products)
Function(e.g. slow
passage of water, or biomass)
Function(e.g. slow
passage of water, or biomass)
Benefit (Value)(e.g. willingness to pay for woodland protection or for
more woodland, or harvestable products)
Benefit (Value)(e.g. willingness to pay for woodland protection or for
more woodland, or harvestable products)
Biophysical structure or
process(e.g. woodland habitat or net
primary productivity )
Service(e.g. flood
protection, or harvestable products)
Service(e.g. flood
protection, or harvestable products)
Function(e.g. slow
passage of water, or biomass)
Function(e.g. slow
passage of water, or biomass)
Benefit (Value)(e.g. willingness to pay for woodland protection or for
more woodland, or harvestable products)
Benefit (Value)(e.g. willingness to pay for woodland protection or for
more woodland, or harvestable products)� Pressures
Limit pressures via policy action?
Can a limit be set for minimum
levels of service?
Review of concepts of dynamic ecosystems and their services 33
The SPU concept originally focused on species populations. A population can be defined using genetic, geographic or demographic criteria, but Luck et al. (2003) argued that defining a population(s) based on its contribution to ecosystem services was most relevant to documenting the impact that changes in that population would have on human wellbeing. Recognising logistical difficulties (although not impossibilities) in applying the SPU approach using species populations in real landscapes, Luck et al. (2003) suggested that the concept could be extended beyond the population level to include functional groups and ecological communities. In this sense, an SPU is a collection of individuals from one or more species that possess certain characteristics, or trait attributes, required for service provision. As extended, the SPU approach is potentially freed from traditional organisational hierarchies by defining any collection of individuals or species as an SPU irrespective of organisational level. SPUs often comprise more than one species and there may be interspecific differences in the contribution to a given service. Species or populations may also contribute to more than one service or be antagonistic to the supply of another service. For example, non-crop plants may provide continuous nectar that supports wild bee populations that will pollinate crop plants that are only in flower for a short period. The same non-crop plants may provide an alternative source of prey for predators of crop pests at times when the pests are absent. They may also be of aesthetic value and hence provide a recreation service, or provide a food source for birds. However, in relation to some services they may be antagonistic. For example, non-crop plants may harbour crop pests or may have the potential to become weeds. Thus, the concept of an ecosystem service antagoniser (ESA) needs to be included in this approach. An ESA is defined as a collection of individuals (at any level of organisation), or their trait attributes, that interferes with ecosystem service provision. Such interference may be direct (e.g. through eating the provider) or indirect (e.g. through competition for resources or through direct interference with organisms that support ESPs). The steps that need to be undertaken to identify and quantify an ecosystem service using the SPU concept are specified in Figure 4.2. However, it should be recognised that completion of all these steps represents best practice and data are rarely available to this standard, as illustrated in the examples in Section 4.4. The steps can be divided into three stages of analysis: (i) identify beneficiaries and providers of the ecosystem service; (ii) quantify demand and supply of the service; and (iii) appraise the service value and implications for management and policy. Stage 1: Identification The most logical place to start the identification stage is with the ecosystem service beneficiaries (ESBs). ESBs are defined as those stakeholders who benefit from a physical resource, ecosystem service, institution, or social system, or people who are or may be affected positively by a public policy. Identification of the spatial and temporal scale of service demand usually determines the scale of service delivery and provides the boundaries for identifying those components of biodiversity that provide the service, the ecosystem service providers (ESPs). ESPs are defined as those organisms, species, functional groups, populations or communities, or their trait attributes, that contribute to the provision of the specified ecosystem service. In practice, the order of the identification steps may vary, for example, where clear spatial units such as riparian zones deliver service(s).

Review of concepts of dynamic ecosystems and their services 34
Define the ecosystem service: - identify the ecosystem service beneficiaries (ESBs) - identify the spatio-temporal scale of service delivery - identify the ecosystem service providers (ESPs)
Quantify the ecosystem service demand: - assess conflicts between beneficiaries/losers - determine the net level of demand/need for the service
Quantify the service-providing unit (SPU): - determine the characteristics of the ESP necessary for service provision,
e.g. population size, distribution, diversity, behaviour or functional traits - determine the quantitative relationship between the characteristics of the
ESP and supply of the service - identify and quantify the components of biodiversity that support the
ESP -
2. QUANTIFICATION
Identify and value potential alternatives for providing the service
Value the service as provided by the SPU
Evaluate options: - compare valuations and examine trade-offs - determine implications for biodiversity conservation - determine implications for policy and sustainable livelihoods
1. IDENTIFICATION
3. APPRAISAL
Figure 4.2: Guidelines for the identification and quantification of an ecosystem service.
Review of concepts of dynamic ecosystems and their services 35
Stage 2: Quantification The first step of the quantification stage focuses on service demand. It is important to appraise conflicts between ESBs and those stakeholders who may be affected negatively by the service. Balancing negative and positive effects (which is the result of a societal process) enables the quantification of net service requirements. After the required level of service delivery has been established in this way, the requirements for service provision can be determined. Quantifying the characteristics of the ESP that are required for service delivery delineates the service-providing unit (SPU). The relevant SPU characteristics which need quantifying will depend on the service in question and the organism(s) that supply it. Knowledge of population size may be important because an SPU may become functionally extinct below a critical threshold size. Population phenology may be important because the timing of service provision, for example pollination, is often critical while population distribution can affect the functioning of an SPU. For example, if a population of a given size is highly aggregated, it may not perform its function as well as a more dispersed population of the same size. If the SPU is a functional group, important characteristics include the intra and interspecific dynamics of the members of that group, the functional importance of each member (defined by factors such as abundance and relative contribution to service delivery) and the functional compatibility among members (i.e. if a member species is lost from the group will other species compensate completely to ensure no disruption to service delivery?). Intra and interspecific dynamics are also important at the community level, but basic measures may be used to gauge relationships between communities and service delivery such as the area of a forest needed to provide a water filtration service. In the case of services that can be provided by more than one genotype or species, the traits that are important to service provision ( effect traits’) must be known, as different genotypes or species may contribute to service provision to a different degree at different times or in different places. This is likely to be the case for most services. For example, in the case of conservation biocontrol of aphids, insects such as hoverflies, ladybirds and lacewings can be valuable. Quantification of the traits present such as voracity, prey handling time and intrinsic rate of population increase is therefore more useful than quantification of the species themselves. Once the relevant SPU characteristics have been defined, it is important to understand how incremental changes in these particular characteristics impact on service provision. The form of relationships between incremental change in SPUs and service provision may be linear, non-linear, saturating or threshold-related. The challenge is to determine when particular relationships are likely to occur (e.g. are certain ecosystem services likely to be associated with particular functional forms), if generalisations can be identified and what implications the type of incremental change has for service provision. Relationships between SPUs and service provision may be complex, particularly for multi-species SPUs, and it can be useful to define associations with organisms or systems that support them. In such circumstances, it is then possible to quantify surrogate measures which may be easier to obtain, such as habitat cover, and how these may impact on service provision. For example, Kremen et al. (2004) calculated the habitat area required to support bee populations that provide pollination services. Approximately 40% cover of upland habitat

Review of concepts of dynamic ecosystems and their services 36
(oak woodland and chaparral) within 2.4 km of a crop was required if landholders wished to obtain their entire pollination service from native bees. Quantifying the minimum size of a SPU can be compared with establishing minimum viable population (MVP) size and the concepts are linked through the ESPs. MVPs are defined for a certain extinction risk threshold taking account of normal population dynamics. For sustainable service delivery, the components of the SPU will have to be part of a sustainable population or community. However, this alone will not guarantee service delivery at the required level and the definition of additional, locally specific, thresholds might be necessary. Nevertheless, if the extensive amount of MVP data can be used to help establish thresholds for SPUs, this would be a major advantage for the practical application of the concept. Although establishing MVPs is not without problems the concept is firmly established in conservation and widely implemented through the use of the linked surrogate measure of minimum area (MA) (Schaffer, 1981; Reed et al., 1998; Traill et al., 2007). As already remarked, defining surrogate measures such as minimum required area is also an option for SPUs. But in this respect there is a marked difference between the two concepts when anthropogenic dynamics are taken into account. In MVPs these might just raise the threshold levels for population or required habitat area, while in SPUs this might (also) lead to a difference in community and therefore habitat composition, the detection of which is a very important feature for conservation and management. To summarise these first two stages of analysis, we wish to know which sections of the human community use the service (the ESBs) and at what level is it required, what components of the ecosystem provide the service (the ESPs), and what characteristics of these components are required to provide the service at the desired level (SPUs). Stage 3: Appraisal The third and final stage of analysis involves the valuation of the service as provided by the SPU and potential alternatives, and the appraisal of implications for biodiversity conservation and policy. The valuation of ecosystem services has been studied extensively and a review of valuation methodologies and how they link to the SPU concept is given in Kontogianni et al. (2007). Taking account of the true value of ecosystem services in decision-making, rather than viewing them as ‘free goods’, will enable better informed decisions about how to balance different objectives and appraise trade-offs. Information on how service provision changes as the characteristics of SPUs change along a continuum of variation, is fundamental to policy-makers and land managers who need to decide between trade-offs attached to different management strategies (e.g. protecting habitat for service providers vs. clearing a certain proportion for production). Indeed, it is this quantitative information that is of most value to policy-makers and land managers because it facilitates specific rather than vague management guidelines, which ensure the sustainability of ecosystem services. The ecosystem service approach should never be considered as a replacement for traditional conservation strategies. However, there is great potential for the approach to add value to these traditional strategies and act as a powerful force for species conservation in human-dominated regions. When SPUs can be identified and protected, the magnitude of human reliance on ecosystems is likely to ensure that species populations are maintained at a level well above that required for species protection. Services provided by exotic species, or the notion of functional replaceability among species potentially undermines the contribution that the ecosystem service approach may make to conservation. A ranking of species or systems based on their service-providing ‘value’ must be reconciled with considerations of resilience
Review of concepts of dynamic ecosystems and their services 37
to environmental change and contribution to the conservation of indigenous biodiversity. Only then can informed decisions about ecosystem management be made. 4.2 Ecosystem dynamics and the SPU concept
The value of the SPU concept is greatly enhanced if some consideration is given to ecosystem dynamics. Ecosystems are in a constant state of flux and ensuring systems have the capacity to cope with likely changes is crucial if desirable ecosystem functions (i.e. services) are to be maintained. This is especially true if variation leads to species extinction or substantial fluctuations in population abundance. Researchers have approached this issue by focusing on the level of functional redundancy occurring in a system, whereby a large number of species with a high degree of functional similarity should help to maintain a given ecosystem function in the light of environmental variability (Walker, 1992; Naeem, 1998; Fonseca and Ganade, 2001; Rosenfeld, 2002). Further, increased biodiversity per se is expected to contribute positively to ecosystem stability and secure continuation of ecosystem functions despite environmental variability (Tilman, 1996; Yachi and Loreau, 1999; Hooper et al., 2005). However, recent evidence suggests that the buffering effects of biodiversity are dependent on the type of disturbance and may be non-existent in some circumstances (Balvanera et al., 2006). Above all, evidence is still lacking for the stabilising effect of biodiversity (Loreau et al., 2001, Balvanera et al., 2006). Ensuring continuation of service provision via SPUs requires consideration of their resilience to change and the maintenance of future options. The level of resilience in an ecosystem is defined by its capacity to cope with environmental change, through buffering, adaptation and re-organisation, and still maintain crucial ecosystem functions (Holling, 1973; Walker, 1995; Elmqvist et al., 2003). Resilience is relevant within a given SPU and across multiple SPUs, but its management is dependent on the type of SPU. For example, if an SPU has been identified as a population of a key species, resilience may be maintained by ensuring that life-history (e.g. reproductive success), population and genetic characteristcs (e.g. variability) are appropriate to cope with likely changes in the environment. This potentially leads us to the contentious topic of minimum viable populations (Shaffer, 1981), which are generally defined from a conservation perspective (i.e. how many individuals are needed to ensure the persistence of a species into the future?). This raises a crucial question: if a population is maintained to guarantee a desired level of service provision will this also be adequate to ensure population persistence (sustainability) in the light of possible future change? For example, Mols and Visser (2007; also see 2002) document the capacity of Great Tits (Parus major) to provide a pest control service in apple orchards by substantially reducing caterpillar damage to the crop. The ESP is Parus major, the SPU is the density of breeding pairs within the orchard required to deliver the service. In this example, service delivery is provided as long as there is at least one breeding pair of Parus major every 2 ha within the apple orchard. However, the low number of individuals needed to control the pest and thus forming the SPU may be well below MVP limits. When the SPU is part of a population or metapopulation that is large enough to be sustainable there is no problem. However, if only part of the population is necessary for the required level of service delivery, the whole population would still need to be kept above MVP levels to guarantee sustainable service delivery. The supporting system for the SPU in this case consists of the rest of the MVP (the individuals of which may, or may not, be implicated in delivery of the same service in
Review of concepts of dynamic ecosystems and their services 38
adjoining areas) or, one level down, the amount of habitat necessary to support the MVP. In a fragmented landscape the protection of a local SPU, or at least local service provision, may be maintained by ensuring a degree of connectivity between regional populations/habitat patches, analogous to the concept of metapopulation dynamics (Hanski, 1999). If a local population becomes extinct (in a functional sense), dispersal from associated populations may re-instate service provision and enhance species persistence. If SPUs are defined by functional groups, resilience at the local level is likely best maintained if there is a high degree of functional redundancy within a group, ensuring that the service is preserved even if some species are lost. This can be facilitated by maximising ecosystem diversity (although the value of this approach appears to be context-dependent; Balvarena et al., 2006). If functional redundancy is low, we are resigned to focusing on protecting populations of key species. At the ecosystem level, resilience is conferred by maintaining system diversity and appropriate spatio-temporal characteristics (e.g. area and seasonal fluxes) that enhance adaptability and reorganising capacity (Elmqvist et al., 2003). Protection of whole ecosystems that provide services is crucial since their replacement is extremely difficult. Clearly, resilience is a relative term dependent on the interactions between ecosystems and the magnitude and types of environmental and anthropogenic pressures. For ecosystem services, greater resilience is required if there are substantial cultural, social or financial implications of service provision failure. Sensitivity to environmental change and the implications of service disruption is a potential approach to prioritising the protection of ecosystem services (and their service providers). The value of the SPU concept in relation to dynamics is further enhanced when the influence of external, anthropogenic dynamics like climate change is considered. A permanent shift in conditions or an increase of stress can lead to changes in the balance between species, changes in species and/or functional composition and therefore to changes in (the composition of) SPUs, with possibly important consequences for conservation and management. A framework for quantifying and assessing these factors is discussed in the next section. 4.3 Frameworks for quantifying the effect of drivers of change on service provision Predicting environmental change and its impacts on human well-being and natural ecosystems at local to global scales remains a significant challenge for the international scientific community (MA, 2005). Uncertainty on the interactions and feedbacks between the natural and human drivers of environmental change that may operate at different spatial and temporal scales, make it difficult for societies to resolve an appropriate course of collective action to pursue sustainable livelihoods. Recent studies on ecosystem - social system interactions have recognised that human societies and the economic and legal institutions they develop drive, both directly and indirectly, changes in biodiversity, changes in ecosystems, and ultimately changes in the services ecosystems provide (MA, 2005). Various frameworks conceptualising the links between human and natural systems have been developed. Two dominant conceptual models are the DPSIR and social-ecological systems (SES). These are briefly described below. Finally, a new approach is proposed which links the concepts of social-ecological systems (SES) to the DPSIR framework.

Review of concepts of dynamic ecosystems and their services 39
4.3.1 DPSIR Originally derived from the social sciences (Rapport and Friend, 1979) and later more widely adopted as a general framework for organising information about the state of the environment, the Drivers-Pressures-State-Impact-Responses (DPSIR) framework was established (Figure 4.3) (EEA, 1995). This assumes cause-effect relationships between interacting components of social, economic and environmental systems, which are:
• Driving forces of environmental change (e.g. increasing atmospheric greenhouse gas emissions)
• Pressures on the environment (e.g. global temperature and precipitation changes) • State of the environment (e.g. level of crop production) • Impact on population, economy, ecosystems (e.g. food insecurity and malnutrition) • Responses of society (e.g. policy responses, such as the UNFCCC Kyoto protocol for
reducing greenhouse gas emissions) Figure 4.3: The DPSIR Framework for reporting on environmental issues (EEA, 1999). The guidelines for identifying and quantifying ecosystem services using the SPU concept, shown in Figure 4.2, can be readily expanded to fit the DPSIR framework (Figure 4.4). Drivers are the underlying exogenous (to the region) causes of environmental change, e.g. climate and socio-economic change, national and international policy. They are often identified and described using qualitative, narrative storylines, such as the IPCC-SRES framework (Naki�enovi� et al., 2000). The DPSIR’s drivers are equivalent to the ‘indirect drivers’ in the MA. Pressures are the variables that quantify the drivers within the region, e.g. temperature, precipitation, land cover, regional population, per capita water demand, crop prices or gross margins, and are usually assessed by developing regional, quantitative scenarios. The DPSIR’s pressures are equivalent to ‘direct drivers’ in the MA, which are defined as physical, biological or chemical processes that tend to influence directly changes in ecosystem goods and services (Nelson et al., 2005). Table 4.1 lists drivers and pressures of relevance to ecosystem services derived from a literature review undertaken by Anastasopoulou et al. (2007).

Review of concepts of dynamic ecosystems and their services 40
DRIVERS:
- Identify the underlying causes of environmental change relevant to the ecosystem service that are exogenous to a region or ecosystem
- Create qualitative storylines for the relevant socio-economic, policy, technology and/or governance variables
-
PRESSURES: - Identify variables that quantify the relevant drivers that are endogenous
to a region or ecosystem - Construct quantitative projections for these variables, e.g. population,
GDP, land use, climate variables -
STATE1: - Identify ESBs and ESPs - Quantify ecosystem service demand and supply (the SPU)
IMPACT: - Identify changes in the characteristics of the SPU in response to the
pressures - Compute the change in service provision related to the changes in the
SPU - Value the service provided by the SPU and potential alternatives
RESPONSE: - Evaluate adaptation options that minimise negative impacts on service
provision - Assess conflicts/synergies with biodiversity conservation -
Figure 4.4: The DPSIR framework for analysing the impacts of drivers and pressures on ecosystem services. 1 See Figure 4.2 for full description.
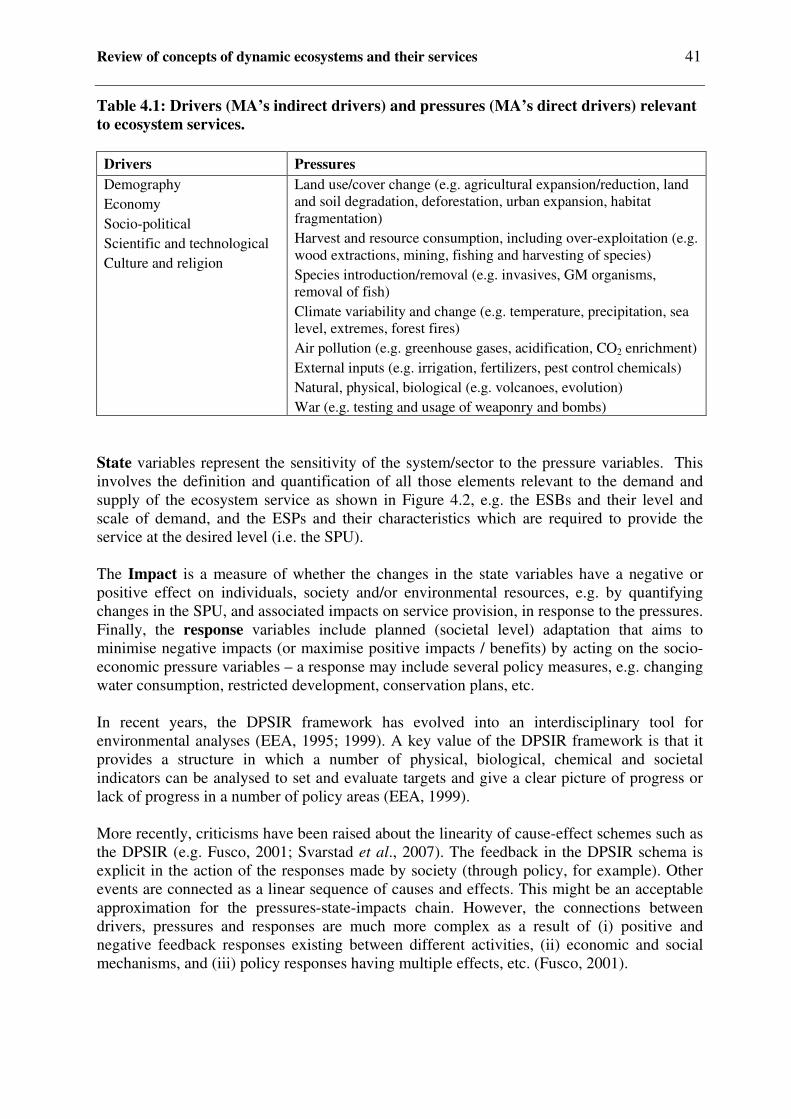
Review of concepts of dynamic ecosystems and their services 41
Table 4.1: Drivers (MA’s indirect drivers) and pressures (MA’s direct drivers) relevant to ecosystem services. Drivers Pressures Demography Economy Socio-political Scientific and technological Culture and religion
Land use/cover change (e.g. agricultural expansion/reduction, land and soil degradation, deforestation, urban expansion, habitat fragmentation) Harvest and resource consumption, including over-exploitation (e.g. wood extractions, mining, fishing and harvesting of species) Species introduction/removal (e.g. invasives, GM organisms, removal of fish) Climate variability and change (e.g. temperature, precipitation, sea level, extremes, forest fires) Air pollution (e.g. greenhouse gases, acidification, CO2 enrichment) External inputs (e.g. irrigation, fertilizers, pest control chemicals) Natural, physical, biological (e.g. volcanoes, evolution) War (e.g. testing and usage of weaponry and bombs)
State variables represent the sensitivity of the system/sector to the pressure variables. This involves the definition and quantification of all those elements relevant to the demand and supply of the ecosystem service as shown in Figure 4.2, e.g. the ESBs and their level and scale of demand, and the ESPs and their characteristics which are required to provide the service at the desired level (i.e. the SPU). The Impact is a measure of whether the changes in the state variables have a negative or positive effect on individuals, society and/or environmental resources, e.g. by quantifying changes in the SPU, and associated impacts on service provision, in response to the pressures. Finally, the response variables include planned (societal level) adaptation that aims to minimise negative impacts (or maximise positive impacts / benefits) by acting on the socio-economic pressure variables – a response may include several policy measures, e.g. changing water consumption, restricted development, conservation plans, etc. In recent years, the DPSIR framework has evolved into an interdisciplinary tool for environmental analyses (EEA, 1995; 1999). A key value of the DPSIR framework is that it provides a structure in which a number of physical, biological, chemical and societal indicators can be analysed to set and evaluate targets and give a clear picture of progress or lack of progress in a number of policy areas (EEA, 1999). More recently, criticisms have been raised about the linearity of cause-effect schemes such as the DPSIR (e.g. Fusco, 2001; Svarstad et al., 2007). The feedback in the DPSIR schema is explicit in the action of the responses made by society (through policy, for example). Other events are connected as a linear sequence of causes and effects. This might be an acceptable approximation for the pressures-state-impacts chain. However, the connections between drivers, pressures and responses are much more complex as a result of (i) positive and negative feedback responses existing between different activities, (ii) economic and social mechanisms, and (iii) policy responses having multiple effects, etc. (Fusco, 2001).

Review of concepts of dynamic ecosystems and their services 42
4.3.2 Social-Ecological Systems (SES) Berkes and Folke (1998) introduced the term Social-Ecological System (SES) to capture social and ecological dynamics and to emphasise the concept of ‘humans-in-nature’. Gallopin (1991) defined the SES as a system that includes societal (human) and ecological (biophysical) subsystems in mutual interaction. Both social and ecological systems contain units that interact interdependently and each may contain interactive subsystems as well. A special attribute of the SES is that both social and ecological subsystems need to support and sustain each other in order to sustain themselves (Gatzweiler and Hagedorn, 2002). Social systems include economy, actors and institutions in mutual interaction. Institutions are understood here as durable systems of established and embedded social rules (convention, norms and legal rules) that structure social interaction (Hodgson, 2002) and thus are different from organisations and other actors. Institutions regulate relationships among actors and between social and ecological systems (Ostrom et al., 1993; Gatzweiler et al., 2001). Ecological systems include self-regulating communities of organisms interacting with one another and with their environment (Folke, 2003). The concept of SES is particularly relevant for global change research, where understanding system dynamics involves the consideration of both the social and ecological components and their mutual interactions (Gallopin, 2006). Dynamic management of SES must be an integrated and interdisciplinary process which addresses the interdependencies between institutions and ecosystem dynamics (Rammel et al., 2007; Gatzweiler and Hagedorn, 2002). Stirling (2007) proposed a set of properties for an SES that illustrates the dynamic properties of the system as resilience, stability, durability and robustness, and how they are related to temporality and provenance of drivers and pressures (Figure 4.5). The framework identifies the provenance of the drivers of environmental change as belonging to two classes: endogenous or exogenous to the overall system. An endogenous driver or pressure arises as a process internal to the system while an exogenous driver arises outside of the system. The scale of the (geographical) area of interest and the boundaries of the system of interest are critical for determining whether a factor is endogenous or exogenous to the system. At the landscape or catchment scale, global climate change and world commodity prices are two examples of exogenous drivers whereas land-use change would be endogenous to the SES.
Figure 4.5: Dynamic system properties in terms of their temporality and provenance (adapted from Stirling, 2007).
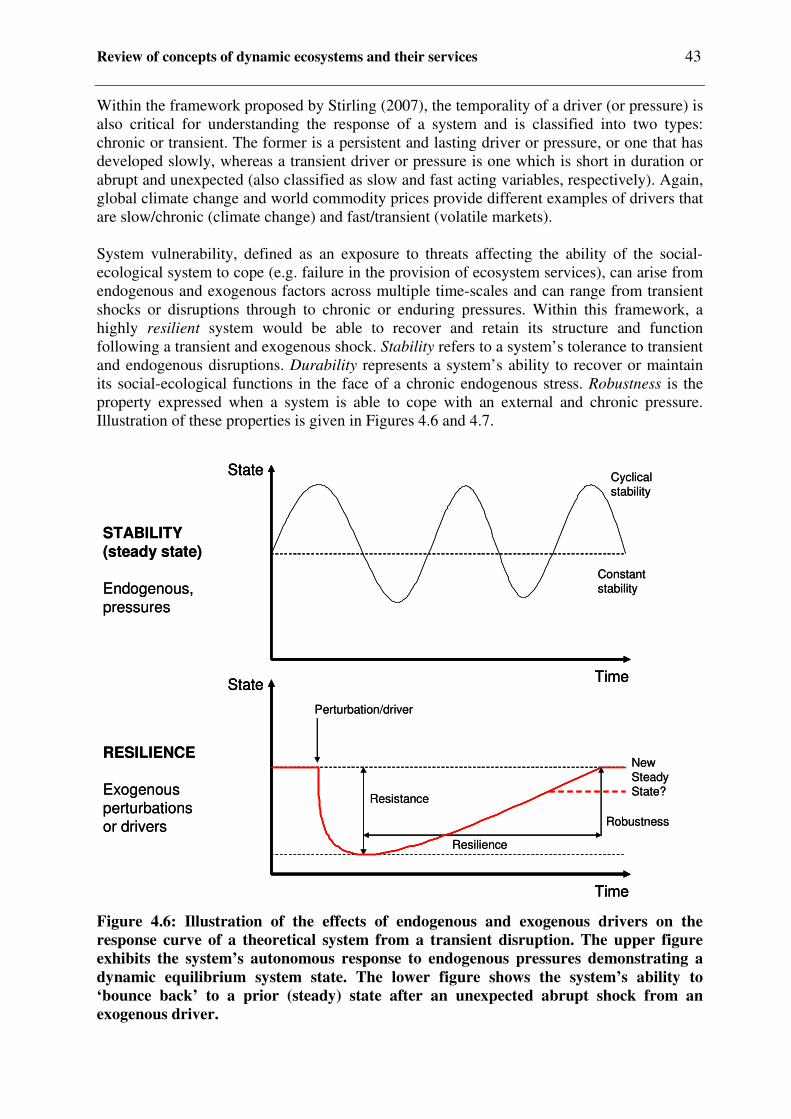
Review of concepts of dynamic ecosystems and their services 43
Within the framework proposed by Stirling (2007), the temporality of a driver (or pressure) is also critical for understanding the response of a system and is classified into two types: chronic or transient. The former is a persistent and lasting driver or pressure, or one that has developed slowly, whereas a transient driver or pressure is one which is short in duration or abrupt and unexpected (also classified as slow and fast acting variables, respectively). Again, global climate change and world commodity prices provide different examples of drivers that are slow/chronic (climate change) and fast/transient (volatile markets). System vulnerability, defined as an exposure to threats affecting the ability of the social-ecological system to cope (e.g. failure in the provision of ecosystem services), can arise from endogenous and exogenous factors across multiple time-scales and can range from transient shocks or disruptions through to chronic or enduring pressures. Within this framework, a highly resilient system would be able to recover and retain its structure and function following a transient and exogenous shock. Stability refers to a system’s tolerance to transient and endogenous disruptions. Durability represents a system’s ability to recover or maintain its social-ecological functions in the face of a chronic endogenous stress. Robustness is the property expressed when a system is able to cope with an external and chronic pressure. Illustration of these properties is given in Figures 4.6 and 4.7. Figure 4.6: Illustration of the effects of endogenous and exogenous drivers on the response curve of a theoretical system from a transient disruption. The upper figure exhibits the system’s autonomous response to endogenous pressures demonstrating a dynamic equilibrium system state. The lower figure shows the system’s ability to ‘bounce back’ to a prior (steady) state after an unexpected abrupt shock from an exogenous driver.
Time
State Time
State
STABILITY(steady state)
Endogenous, pressures
RESILIENCE
Exogenous perturbations or drivers
Cyclicalstability
Constantstability
Resistance
Perturbation/driver
Resilience
NewSteadyState?
Robustness
Time
State
Time
State Time
State
Time
State
STABILITY(steady state)
Endogenous, pressures
RESILIENCE
Exogenous perturbations or drivers
Cyclicalstability
Constantstability
Resistance
Perturbation/driver
Resilience
NewSteadyState?
Robustness

Review of concepts of dynamic ecosystems and their services 44
Figure 4.7: Properties of Durability (endogenous) and Robustness (exogenous) arise from a system’s response to a chronic or enduring pressure, which can be exogenous or endogenous. As Stirling (2007) states, each property is individually necessary and collectively sufficient for achieving sustainability. If these system components have been eroded, a disturbance may be more likely to push the system beyond a threshold state (Kinzig et al., 2006), from which it may not recover or may take many years to return to its previous state through natural processes. This type of shift from one state to another has been called a “regime shift” (Scheffer et al., 2001; Carpenter, 2003) and may be desirable or undesirable. The identification of sustainable development trajectories for a SES requires an understanding of the temporality and provenance of drivers and pressures and an understanding of the way in which the system will respond to these. The cross-scale and dynamic nature of both transient and chronic changes that are transforming and taking place within adaptive systems is termed panarchy (Gunderson and Holling, 2002). An understanding of these dynamic interactions and the system configurations that they may produce can help guide select interventions in social, economic and technological systems, and other qualities of human agency, that may enhance adaptation to environmental change. Since social-ecological systems are dynamic and are shaped by a variety of processes acting across different spatio-temporal scales, human development and natural resource managers need to identify the potential alternative functioning pathways that may exist for a system. These might include strategies for adaptation (Smit and Wandel, 2006) or building of functional redundancy (Berks et al., 2003). If the system exhibits the essential properties of resilience, stability, durability and robustness, then it should be able to maintain functioning and, hence, achieve sustainability.
Time
State
Time
State
Shifting trendNo SteadyState
Examples: Climate change (exogenous), evolution (endogenous)

Review of concepts of dynamic ecosystems and their services 45
4.3.3 The DPSIR-SES integrated framework Figure 4.8 provides a proposed framework for the integration of the DPSIR and SES concepts, which incorporates the SPU concept. This integration is desirable for a number of reasons: it creates a common framework for applications in different contexts; it standardises concepts and terminology; it makes explicit the exogenous and endogenous components of the system and it builds on well established approaches that are embedded in a number of policy and decision-making organisations. The DPSIR is specifically geared towards policy and management development, explicitly structuring statistics and indicators across the interactions between man and nature, which should ensure ‘buy-in’ from many stakeholder organisations involved with monitoring of indicators related to demographic, socio-economic and environmental conditions (EEA, 1999). Figure 4.8: The integrated DPSIR-SES Framework. The boundary of the system itself is represented in Figure 4.8 by the large hashed-line box. Everything within the box is endogenous to the system. The Drivers (or Indirect Drivers in the MA) are exogenous to the system. This means they are influenced primarily by factors, processes and interactions that occur outside of the ecosystem under consideration. The Pressures (or the MA’s Direct Drivers) represent the variables that act upon the ecosystem state. The states change in response to the Pressures, and these dynamics (in time and space) are characterised by the concepts such as resilience, robustness, durability and stability discussed in Section 4.3.2. As the state changes it may reach a certain threshold (the SPU),

Review of concepts of dynamic ecosystems and their services 46
above which service provision is at a level demanded by the service beneficiary, below which it is not. Thus, the SPU is a function of: (i) the attributes of the biology of the species providing the service (the ESPs); (ii) the attributes of the supporting system; and (iii) the attributes of the service beneficiaries (the ESBs). If any of these attributes change there could be a different SPU. The impact is assessed using valuation techniques to examine trade-offs between the level of service provision from biodiversity and alternative (non-biological) approaches to the provision of the same service. The nature of the impact on the provision of multiple services within a habitat will influence conflicts between ESBs and thus the desired response. Responses, such as policy measures and/or conservation management, are then implemented in accordance with the measured costs of the impact. These responses act on the Pressures, as these are endogenous to the system. Policy cannot act on the Drivers in any meaningful way as these are exogenous to the system and, therefore, are beyond the influence of the human actors operating within the system. It could be argued that, for example, carbon sequestration at a regional scale feeds back to the (broader) climate system, but at the scale of an individual ecosystem this feedback would be trivial. The integration of the DPSIR and SES frameworks can promote insight into the properties of socio-ecological systems and their responses to a variety of drivers and pressures, thus aiding understanding of sustainable conservation strategies. 4.4 Case studies illustrating the quantification of services in dynamic ecosystems A literature review was undertaken to identify case studies where quantification of ecosystem service demand and/or supply has been undertaken. Information on 64 case studies was gathered covering all nine ecosystems discussed in Section 3 (Figure 4.9) and the four ecosystem service categories of the MA (Figure 4.10). We aimed to gather 8 to 10 case studies for each ecosystem covering the different MA service categories to test the framework for identifying and quantifying ecosystem services using the SPU concept and establish gaps in knowledge. Figure 4.9: Distribution of the 64 case studies between the nine terrestrial and freshwater ecosystems. Note some case studies cover more than one ecosystem.

Review of concepts of dynamic ecosystems and their services 47
15
28
11
10
Cultural services
Provisioning services
Cultural services
Provisioning services
Regulatory services
Supporting services
The availability of good examples was more limited for montane, wetlands and lakes than other ecosystems. For montane and lake ecosystems, this seems to reflect a real gap in present knowledge. Information appears to be mainly confined to journalistic press releases, proposals for future research and a few internal departmental reports for mountain systems in Europe. All provide only anecdotal information. It may be speculated that this gap arises from the spectrum of physical and other practical difficulties inherent in undertaking research in mountain regions. Comprehensive analyses of services provided by lakes has not been carried out, except for fresh water as a provisioning service (e.g. for human use, industry and irrigation for agriculture), nor has the relationship between biodiversity and service provisioning in freshwaters (including lakes) been well studied (Finlayson et al., 2005). One reason might be that the tradition in applied freshwater research has for a long time been on the monitoring and assessment of ecological and chemical status of e.g. lakes through the development of different kinds of biological and chemical indicators. This has usually also included some form of measurement of biodiversity (usually taxon richness), but not any measurement that can be directly linked to ecosystem services. Figure 4.10: Distribution of the 64 case studies between MA service categories. All four MA ecosystem service categories are reasonably well represented by the case studies, but the majority fall under the regulatory class (Figure 4.10). In general, there appears to be more evidence for regulatory services than for others in the literature. This observation is particularly pronounced for agro-ecosystems and forests where over 75% of case studies fall in the regulatory class. This partly reflects our focus on the services that biodiversity provides within these ecosystems rather than on provisioning services provided through monocultures of crops or forest plantations. As expected the majority of case studies for soil ecosystems fall into the supporting services class. The case studies cover a range of scales from local to regional to broadscale (Table 4.2), although more examples were available at the local scale where the provision and use of services is often most easily recognised. The SPUs identified in the case studies covered a range of organism types, including animals (52%), plants (41%), fungi (2%) and the remaining 5% correspond to SPU studies where the unit encompasses multi-trophic levels. Indeed, examples included both single species SPUs (27%) and multi-species SPUs (73%), although the latter was more common.

Review of concepts of dynamic ecosystems and their services 48
Table 4.2: Scale of case study examples. Scale No. of examples Local 25 Local to regional 11 Regional 15 Regional to broadscale 1 Broadscale 4 Local to broadscale 8 Total no. of examples 64
The quality and detail of information available varied considerably between the case studies. Table 4.3 shows the percentage of studies which contained information on each stage of analysis (as specified in Figure 4.2) for identifying and quantifying an ecosystem service using the SPU concept. Half of studies identified the ESBs and all studies specified the scale, but quantification of the level of ecosystem service demand was rare (16%) with none of the examples providing thresholds (or related information) under which the level of service delivery is unsatisfactory. Nearly all studies identified the ESPs, which reflects the focus of the literature search. One fourth identified relevant supporting systems, but quantification of the characteristics of the ESP that are necessary for service provision was not commonly undertaken (39%). This percentage corresponds to examples that have quantified at least one relevant SPU characteristic (i.e. population size or distribution in time or space, etc). For those studies which did provide quantitative information, most SPUs were characterised in terms of population size or spatial distribution. Table 4.3: Percentage of studies with information on the different stages of analysis. Stage of analysis Percentage ECOSYSTEM SERVICE DEMAND: Identify the beneficiaries/end-user(s) of the service (ESBs) 53 Determine the level of demand/need for the service 16 Specify the spatial scale of demand 100 ECOSYSTEM SERVICE SUPPLY: Identify the ecosystem service providers (ESPs) 94 Identify the supporting systems 25 Quantify the service-providing unit (SPU): 39 - in terms of population size 19 - in terms of distribution in time 2 - in terms of distribution in space 14 - in terms of diversity 5 - in terms of traits 9 APPRAISAL: Value the service as provided by the SPU 16 Identify and value potential alternatives for providing the service 5 Determine implications for habitat management 75 Determine implications for conservation policy 58

Review of concepts of dynamic ecosystems and their services 49
Only one-sixth of studies undertook a valuation of the service as supplied by the SPU, but fewer studies compared trade-offs with potential alternatives for providing the service. Many examples have tried to find or propose suitable habitat management actions (75% propose at least one way to preserve the service), however these are mainly speculative as only 45% have actually implemented the habitat management strategy or have been attempted to prove the effectiveness of the strategy through experimentation. Implications for conservation policy were considered in just over half the examples. In the following sections, several examples from the literature are summarised in a consistent format which highlights the key stages of analysis in terms of the identification and quantification of ecosystem service demand and supply, and the appraisal of resulting implications. 4.4.1 Provisioning services Forage for livestock production in Mediterranean heath and shrublands (Rogosic et al., 2006): The service: This a provisioning service as the shrubs provide the most important source of forage for goats, sheep and donkeys in the maquis and garrigue ecosystems of the Mediterranean. The shrubs have a better nutritional value than grasses, are available all year round (evergreen) and are adapted to the semi-arid environment. The ESB: The farmers are the main beneficiaries, as livestock production is a significant activity in this region. The ESP: The maquis and garrigue heath and shrublands. The SPU: The shrubs which provide the forage, including Quercus ilex L., Erica multiflora L., Arbutus unedo L., Juniperus phoeniceae L., Viburnum tinus L. and Pistacia lentiscus L. The dominant shrub species are generally of low nutritional quality and contain secondary metabolites, such as tannins, terpenes and volatile oils. These SPU shrubs are often selected by grazing animals because their leaves have more protein and less fibre than leaves and stems of grasses. Valuation: Sheep and goat production comprises 60–80% of the total agricultural output in this region. The direct use value can, in principle, be estimated by a straightforward application of market values for sheep and goat, including the consumer and producer surplus. Relevant drivers and pressures: The heath and shrublands are under pressure from infrastructure development from tourism and housing, as well as overgrazing (Platis and Papanastasis, 2003). The projected increase in drought incidence due to climate change could lead to shrub decline and changes in the quality of the forage. Appraisal: The use of maquis and garrigue for livestock grazing may, if it is carried out at an appropriate level, not only provide an important economic return for farmers in the region but also help to ensure its conservation as several types of Mediterranean scrub are listed under the EU Habitats Directive. Fodder quantity and quality in subalpine grasslands (Quétier et al., 2007b): The service: The production of sufficient forage quantity for summer grazing and/or storage for winter feed is a provisioning service. Forage quality is a second provisioning service that depends on the types of plants present. The ESB: Farmers of subalpine grasslands. In this study the farmers identified the ESP and SPU through semi-directed interviews, rather than scientists deciding a priori which ESP / SPU are relevant.

Review of concepts of dynamic ecosystems and their services 50
The ESP: Species-rich subalpine grassland plant communities are perceived as providers of fodder in sufficient quantity and of good value for grazing. More species-poor communities, dominated by one large tussock grass, Festuca paniculata, are perceived as providers of a large quantity of fodder, but of poor quality. The SPU: This study examined the relevance of plant functional traits as SPUs for the provision of this (and other) services by subalpine grasslands from the central French Alps. SPUs differed across the two services: (i) Farmers used sward height as an indicator of fodder quantity. This was linearly related to one functional trait, plant stature (considered through its community weighted mean value), and to the abundance of two plant functional groups: the ‘Festuca paniculata’ functional group, made of large tussocks with fibrous and nitrogen-poor leaves, and the ‘Dactylis glomerata’ functional group, made of large tussocks with tender and nitrogen-rich leaves. Leaf Nitrogen Content was identified as an additional SPU specific to hay meadows through its positive linear effects on aboveground biomass. It is important to note that fodder quantity could also be related to one abiotic variable: nitrogen availability for plant growth (Díaz et al., 2007). (ii) Farmers considered legume abundance as the indicator of fodder quality, i.e. the abundance of the nitrogen-fixers functional group. This was related to the community’s average leaf nitrogen content. Studies elsewhere have shown that plant, and especially grass, phenology could also be considered as an SPU for mountain grassland pastoral value (Cruz et al., 2002; Duru et al., 2004). Valuation: No economic valuation has been made of these two services. The study conducted a valuation based on perceived value by local stakeholders. Both of these services were highly valued by farmers. An independent study (Picart and Fleury, 1999) found that late mowing and grazing, as they are practiced here, led to poor fodder quality (in relation to plant phenology). Relevant drivers and pressures: Subalpine grassland functional composition is driven by past and present land use (Tasser and Tappeiner 2002; Quétier et al., 2007a; Gaucherand and Lavorel, 2007). Current or projected decreases in management intensity, through both decreases in organic fertilisation and the cessation of mowing, drive grassland functional composition towards states that are associated with decreased quantity and quality on former cropland, but increased quantity and strong loss of quality in never-ploughed grasslands (Quétier et al., 2007a; 2007b). The effects of climate change, and especially increasing drought and modified snow regimes, are likely to be quite significant but have not been quantified yet. Nitrogen deposition could also interact with land use change to effect fodder quantity and quality. Appraisal: A comparison of alternative management scenarios, resulting from the downscaling of IPCC scenarios (from Rounsevell et al., 2005), showed that in order to maintain fodder production and quality at its current level the continuation of traditional fertilisation and mowing practices is required (Quétier et al. 2007b). This requires market (e.g. through specific branding of certain mountain products – Appelation d’Origine Contrôlée in France) and/or direct financial support (e.g. through agri-environmental schemes or other environmental payment systems) to farmers. Production of hydroelectricity in the Yangtze River watersheds (Guo et al., 2000): The service: This is a provisioning service as it relates to the provisioning of energy for human use. It could also be argued that the forests are providing a regulatory service since it’s the appropriate regulation of water that leads to the desired energy production. Adequate hydroelectricity production requires a constant flow of water at a given capacity. Flows above this capacity are not necessarily beneficial if they result in excess production of electricity that is not required by beneficiaries.

Review of concepts of dynamic ecosystems and their services 51
The ESB: The hydroelectric power plant supplies electricity to people in eastern and central China. The ESP: Vegetation + soil type + slope angle. The SPU: There are 90 different combinations of vegetation-soil type-slope angle in the study area and all have different effects on water regulation. On average, crops and grasslands had the lowest water regulation capacity (~50-450mm) and forests had the highest (~100-1400mm). Maximum water conservation capacity is obtained by a combination of mixed evergreen-deciduous broadleaf forests-yellow brown soil-slope angle < 15 degrees. It is not clear how area of vegetation type may impact on water regulation. Valuation: The authors provide an economic valuation of water flow regulation via increased production of electricity (regardless of whether this is surplus to needs). The total annual economic value from water flow regulation from all ecosystems ~ 5.05 million RMB (0.125 RMB per kWh; RMB = Chinese currency). However, surplus production does not bring benefits since it can not be used. Therefore, the authors provide an analysis of marginal social benefit vs. marginal social cost. The marginal value of water/electricity (and hence marginal benefit) declines slowly with each increase in unit supply until maximum demand is reached, after which it declines rapidly. Marginal social cost is reflected in a decrease in timber sales (since forests are protected for water regulation) and therefore steadily increases as more forests are conserved. Relevant drivers and pressures: Deforestation, fragmentation, forestry, climate change (will affect rainfall patterns and evapotranspiration), economic/population growth, increasing demand for electricity. Appraisal: This is an excellent example linking requirements of service beneficiaries, ecosystem service supply (varying across vegetation-soil-slope complexes) and marginal costs and benefits. There are positive implications for biodiversity conservation in relation to appropriate forest types in areas where water regulation is required. A follow-up paper (Guo et al., 2007) describes a mechanism whereby landholders who forgo land clearance to protect forests that regulate water are paid for their ecosystem service by service beneficiaries, hence, there are obvious policy directions here. 4.4.2 Regulatory services Pollination of watermelon plants in California (Kremen et al., 2002; 2004): The service: Pollination is clearly identified as a regulatory service. This example demonstrates pollination of watermelon crops by native bees. It is likely that many other crops also benefit from native pollinators. The need for the service is demonstrated in a general way via the following: 30% of US food supply depends on animal pollination (of which bee species are the most important); many farmers rely on European honeybees that they import into crops - however, honeybees are not always the most effective pollinators and honeybee colonies have declined by 50-70%. The ESB: Local watermelon farmers in California (and supposedly the consumers of this product may benefit through lower prices if pollination by native bees is more cost effective than importing European honeybees colonies). The ESP: Native bee species: Melissodes, four species; Lasioglossum (Evylaeus), four morphospecies; Lasioglossum (Dialictus), four morphospecies; Lasioglossum (Lasioglossum), two species; Hylaeus, three species. The SPU: A diverse set of about 20 species required to cope with temporal and spatial variation in the population dynamics of any one species and pollination requirements. Different species are also differentially effective as pollinators. Important traits include: foraging behaviour (visit frequency, foraging time, foraging distances, preferred flower type),

Review of concepts of dynamic ecosystems and their services 52
temporal fluctuations in abundance and activity, pollination effectiveness (pollen deposition etc), body size, size/type of mouthparts. Valuation: There is no economic valuation of the contribution of native bees to watermelon production. If farmers were to rely entirely on pollination from native bees, their farms would need to be situated in landscapes containing about 40% of natural habitat within a 2.4 km radius or 30% within 1.2 km (maximum bee foraging distances for this region are about 2.2 km). Native bees can provide sufficient pollination for watermelons on organic farms (but on most farms honeybees are still required). Agricultural intensification reduces pollination services by roughly 3- to 6-fold. Farmers rent honeybee colonies to deliver pollination services, so trade-offs between rental costs, protection of native bee habitat, opportunity costs (e.g. loss of farmland to native bee habitat), crop yield, crop price, etc. could be assessed. Relevant drivers and pressures: Deforestation, fragmentation, agricultural intensification, climate change (temperature change may affect bee foraging/crop flowering interaction), disease (apparently affecting honeybee colonies), competition with honeybee/Africanized bee, market demand for product (including crop prices, consumer preferences, industry trends, etc.). Appraisal: There could be positive implications for biodiversity conservation if a balance can be obtained between protecting native habitat for bees and losing land area for crops. Wider acceptance of the contribution of native bees to pollination is required in addition to a cost-benefit analysis of this contribution to crop yields vs. land area lost to production and importing honeybee colonies. Pest regulation in coffee plantations in Costa Rica (Varon et al., 2007): The service: Reducing herbivory by leaf cutting ants (Atta and Acromyrmex spp.) in coffee (Coffea arabica) plantations. Shade trees reduce attack on the crop by the ants by encouraging growth of a range of plants which the ants prefer to coffee. Ants can consume as much as 12-17% of coffee leaf production. Ants defoliate bushes up to 13 m from the colony and damage roots adjacent to the colony. The proportion of coffee within plant material harvested by ants was 40% in monocultures and 1-10% in diversified systems. The ESB: Coffee growers. The ESP: Shade trees, especially poró (Erythrina poeppigiana), that are suitable for the ants to culture fungus on. The SPU: The optimum density and distribution of shade trees has not been calculated. Valuation: This has not been done, but it would be relatively easy to calculate the value of the increased coffee yield resulting from the reduced herbivory achieved by the use of shade plants. Relevant drivers and pressures: Intensification of coffee growing in response to demand for land for other uses, and concentration in the most pest-free areas, would reduce the viability of diverse plantations, which tend to be maintained on a small scale. Appraisal: The alternative to using shade trees as part of a pest control strategy is to grow coffee as a monoculture. Monocultures are notoriously susceptible to pest outbreaks, and there will likely be need for chemical control. This may lead to insecticide resistance and hence increasingly expensive control costs, or crop losses once control becomes impossible. The costs of maintaining shade trees (and hence having a reduced area of coffee) as opposed to using chemicals have not been calculated. Shade trees also provide other services such as improved microclimate for the coffee crop, addition of organic matter through leaf litter, fixing nitrogen, enhanced nutrient cycling, and decreased soil erosion, and the value of all of these services needs taking into account.

Review of concepts of dynamic ecosystems and their services 53
Climate regulation in Changbaishan Mountain Biosphere Reserve in Northeast China (Xue and Tisdell, 2001): The service: The reduction of the greenhouse effect through increased carbon sequestration is a regulatory service. CO2 fixation and carbon storage occurs through photosynthesis and forests provide a vast storage bank for carbon through their wood. The ESB: The global population. The ESP: The multi-species forest populations of Changbaishan Reserve, China. It is an area of 167,081 ha of forest made up of diverse communities over a range of different altitudes. The primary forest comprises mainly mixed populations of Korean pine, broad-leaved species and spruce. The SPU: The quantification of the SPU is through a calculation of the area of each species in the SPU, the biomass and thus amount of pure carbon stored per year in the area of the reserve – 1,174,135 t/a. Valuation: A valuation (in million yuan per year) has been undertaken on the amount of carbon stored. The valuation of all the recognised ecosystem services provided by the forest in the reserve is estimated at 510 million yuan per year. These costs are 10 times higher than the opportunity cost if the reserve was used for regular timber production. Relevant drivers and pressures: Forestry and timber demand, deforestation, fragmentation, climate change. Appraisal: Reducing CO2 is an obligation for the parties to implement the UN Climate Change Framework Convention. Additionally it is a reserved area, with high biodiversity with rare plants and animals. It also functions as a reserve for water conservation, soil erosion prevention, nutrient cycling and disease control. Erosion regulation in a shrub/steppe habitat (Scott et al., 1998): The service: The maintenance of the shrub-steppe vegetation cover minimises soil erosion, by protecting the soil from the impacts of wind (and water) in this arid region, thus providing a primary regulatory service. Other related services include reduction in dust emissions (PM10), which cause related health (respiratory) incidence, traffic accidents, road closure and household and vehicle cleaning, while increasing aesthetics and maintaining a suitable habitat for game. The ESB: The beneficiaries are the farmers who are using the land for crop production or poor-quality grazing, and residents of the region who benefit from improved health, safety, reduced cleaning costs and improvement in their environment. The ESP: Plant communities of the shrub-steppe habitat. The SPU: The service will depend on the protective ability of the plants which will relate to the size of their canopy cover, root growth and their abundance and distribution. Valuation: Various valuation techniques were used (e.g. opportunity costs, estimating benefits) to cost different services. The following figures are in dollars/acre/year (but may include some double counting): soil stabilisation (contingent valuation) - benefits transfer to reduce PM10 count is 4–14, cost of Conservation Reserve Program land acquisition program is 47, cost of soil stabilisation program with farming (analog) is 6–21, expected cost of traffic accidents and road closures is 15–50, extra cleaning and maintenance costs are 48–169. The annualised value opportunity costs were: grazing land 3.35, farmland (dry) 12.4, farmland (irrigated) 74.2, and urban building sites 460.4. Relevant drivers and pressures: There is a pressure from the expansion of cropping which would increase ploughing and thus erosion risk from bare land. Increases in cattle grazing would reduce biomass and thus protective cover, reduce seed production for vegetation regeneration and increase poaching (bare earth from cattle congregating). Climate change may also increase the aridity of the area leading to a high risk of wind erosion.

Review of concepts of dynamic ecosystems and their services 54
Appraisal: The regulation of erosion through the maintenance of the shrub-steppe vegetation cover could maintain the biodiversity of the habitat which has a unique character, including species not found elsewhere. Water purification by riparian buffers (Correl, 2005; Dosskey, 2001): The service: Buffering of nutrient and sediment pollution. Riparian vegetation regulates the flow of water, nutrients and sediment from uplands to the stream through reducing surface runoff and promoting infiltration. It filters surface runoff (nutrients, pollutants and sediment). It also filters groundwater runoff (nutrients, pollutants) and reduces bank erosion. Riparian shade regulates water temperature and solar radiation. The ESB: The general public. The ESP: The multi-species-multi-zone riparian plant community (different trees, shrubs, herbs and grasses in the area, located in different zones of a sufficient width to provide the service). The SPU: The service depends on the number of constituent zones, and the density and width of the buffers: for example 30 m of mixed riparian buffer remove 92-100% of ground water nitrate (Correl, 2005) and 5–20 m grass strips retain 40–100% of sediments (Dosskey, 2001). Valuation: Calculation of replacement costs if the service was provided by conventional waste water treatment plants: Removal of NO3: 15–30 �/E•a (person equivalent and year) (4.2–8.3 �/kg); removal of PO4: 1–3 �/E•a; removal of C, N and P together: 45–75 �/E•a (personal communication, Emscher Water Board, Ruhr Metropolitan Area, Germany). Relevant drivers and pressures: The main pressure is agricultural land use, driven by demand for food. Intensification of land use is linked to the amount of fertilisers and pesticides applied, which in turn enhances the load of nutrients and toxic substances in rivers. Current rising demand for renewable primary products (‘green energy’) is likely to drive the enhancement of pressures and related problems. Appraisal: Restoration of riparian buffers is unavoidable to meet the demands of the Water Framework Directive, as there are no practical alternatives available. The lack of intact riparian buffer strips has severe negative implications for river water and habitat quality, the removal of nutrients elsewhere is impracticable and the removal of sediments elsewhere impossible. Both nutrients and sediments also severely impact the riverine fauna and flora and may have additional implications at the landscape level. The latter is particularly linked to European nature protection policies, such as the Birds and Habitat Directives and the NATURA 2000 network. Rivers and riparian buffers constitute an aquatic-terrestrial corridor and, thus, promote the dispersal of many plants and animals. They constitute a network of habitats that serve as the connecting means between other ecosystems and, hence, impact local to landscape-level biodiversity. To meet a good ecological status of rivers, an extensive restoration of riparian areas along river ecosystems is necessary. 4.4.3 Cultural services Recreational service provided by the Stockholm National Urban Park, Sweden (Hougner et al., 2006): The service: The maintenance of the main characteristics of the National Urban Park (NUP) in central Stockholm through the natural regeneration of the oak forest, where oak is the keystone species. This results in many indirect biodiversity benefits through dependency of many other organisms on the oak forest. The NUP forms the largest green area in northern and eastern Stockholm. It is 26 km2 in area with a unique and well-known biodiversity with many rare species. The park is protected by law and the area has to be maintained in its natural state or at least essentially unchanged.

Review of concepts of dynamic ecosystems and their services 55
The ESB: The park is an important recreational area being the most visited urban park in Sweden by both locals and tourists and is the world’s first National Urban Park. The ESP: A hierarchy of ESPs occur at this site including the oak forest which provides a direct service to humanity. The Eurasian Jay (Garrulus glandarius) is however the ESP described in detail in this example, which provides a seed dispersal service for the oaks. It collects and hides acorns during the autumn for later winter consumption. A jay hides between 4500 to 11000 acorns per year at the ideal depth for germination (and reduced predation) along forest edges where light levels are suitable for germination. Jays tend to select the most viable acorns for storage and thus for germination. Such dispersal also enhances the gene pool of the oaks where 85% of the oaks are estimated to regenerate naturally. The SPU: Minimum species abundance is 12 pairs of jays for the 2700 ha park (this is a lower bound estimate and does not consider the need to buffer jay populations against environmental change – the current jay population is estimated at 42 pairs). This results in the establishment of 33,148 oak saplings per year (over a 14-year period), which is required for forest maintenance which is the direct service to the human population of Stockholm. Valuation: Alternatives to the service provided by the jays include humans actively seeding acorns, planting saplings and promoting natural regeneration through felling of trees and some sort of disturbance. Seeding methods would cost 109,389 SEK per year or 1.53 MSEK over 14 years. Planting by humans would cost 477,663 SEK in the first year and 6.7 MSEK over 14 years. Thus the replacement cost of losing the jays would be 160,000 SEK/pair. Relevant drivers and pressures: Epidemic oak disease, low natural regeneration rates, new land use developments, policy changes, forestry and timber demand, deforestation and fragmentation. Appraisal: Long-term management of the park began at the end of the 1600s when the park was a royal hunting ground. The park was managed with romantic ideals to improve scenic beauty through the maintenance of broad-leaved deciduous forest in an English landscape style. This has led to high levels of biodiversity in a city park very close to Stockholm. There is widespread public support for the maintenance of the park. The park received formal status in 1995 and is now classified in the Swedish Environmental code as an area of national interest. New developments in the area are allowed but only if they can be carried out without intruding on the park landscape and without affecting negatively the natural and cultural values of the area. Continued investment in management that safeguards the jay population at a level suitable for the continued and successfully regeneration of oak forest in the Stockholm NUP is required. Recreation and associated tourism (angling) (Everard, 2004): The service: Recreation by game fishing, especially of palatable species. The ESB: Anglers and eco-tourists. The ESP: The riverine (and lake) fish community, particularly economically important species (salmon, grayling, char and whitefish). The SPU: Abundance and maturity (age) of target game fish. Valuation: Anglers/eco-tourists pay for access to rivers and fishing licences; they spend money for accommodation and subsistence at site. Jobs related to eco-tourism may also increase (hotels, shops, restaurants, etc.). The indirect use value is usually estimated on the basis of the travel-cost method. Its numerical value has been estimated for Norway ranging between � 11.28 and � 72.84 per day (Navrud, 2001). Salmon fishing in Donegal, Ireland has been valued by Curtis (2002) at an average of IR £ 206 per day. Angling in the River Eden catchment in the UK has been studied by Everard (2004) who found that angling accounted for 1.2 M GBP in 2001 (of 111.9 M GBP total revenue from tourism).

Review of concepts of dynamic ecosystems and their services 56
Relevant drivers and pressures: Principal drivers are public demand of agricultural products and climate change. Both control land use intensity and lead to severe degradation of river water (pollution) and habitat quality (loss of spawning habitats, rising water temperatures), and affect the longitudinal connectivity of rivers needed by many target fish species to complete their life cycle (obligatory migration). The introduction of less sensitive alien species also puts threat on indigenous species. Appraisal: Conservation of rivers and riparian areas needs to address the recovery of entire catchments or extended river sections, respectively. Target fish species are sensitive to organic pollution and need a good water quality, low temperatures and a high oxygen content. Salmonids, for instance, also migrate between upstream spawning habitats (gravel beds) and downstream sections and depend on the longitudinal connectivity between these sections. Long-distance connectivity of entire rivers is needed, e.g. for salmon (Salmo salar) between upstream spawning habitats and the sea. Finally, hydromorphological structures (riffles, pools, debris dams) are needed during the fishes’ life cycle and put high demands on the overall river ecosystem quality. A high habitat diversity also promotes a high abundance of fish prey (insects, crayfish, worms) and, hence impacts the density of target fish populations. Besides these ecological demands, there is a strong need to manage rivers without the introduction of competitive alien species, such as the rainbow trout, Oncorhynchus mykiss. Aesthetic value of farmland birds (Butler et al., 2007): The service: Aesthetic beauty in the countryside. The ESB: Bird and Game NGOs, and the general bird-loving and bird-shooting public. The ESP: Farmland birds. The SPU: Combined populations of farmland birds with a range of desired traits and trait values (colour, size, song, taste, etc.). The Farmland Bird Index (FBI) aggregates the abundance of 19 species that depend on agricultural landscapes for feeding and/or nesting. The abundance and distribution of birds are important and are encapsulated in the index. The FBI at its current level can be considered to represent the SPU as, under the Rio Convention, the FBI must be stable of increasing by 2010. Valuation: Valuation of cultural services in monetary terms is very difficult but value is reflected in the number of people willing to pay to be members of relevant NGOs. There are mental and physical health benefits from visiting the countryside that could potentially be valued in termed of reduced costs of healthcare. Relevant drivers and pressures: Land use change, especially agricultural intensification (reduction in wild vegetation and increased use of pesticides) is known to affect the farmland bird index in complex ways. Appraisal: The threshold below which abundance must not drop is the current index level in order to comply with the 2010 target set by the Convention on Biological Diversity (Rio Convention). 4.4.4 Supporting services Nutrient cycling and organic matter decomposition in soils (Postma-Blaaw et al., 2006): The service: Nutrient cycling and organic matter decomposition in soils by soil fauna. Soil fauna not only support via comminution the decomposition of organic matter, but they also facilitate the viability of organic substrates to microbes, regulating the microbial biomass and activity that directly support nutrient cycling and decomposition. The ESB: Local farmers, who benefit financially from crop production, to the global population, who benefit from the availability of food and fibre.

Review of concepts of dynamic ecosystems and their services 57
The ESP:�Soil invertebrates with an emphasis on saprophagous organisms (e.g. detritivores and microbivores), in particular earthworms (e.g. Lumbricus rubellus, Lumbricus terrestris, Aporrectodea caliginosa). The SPU: Earthworm individual species densities are positively correlated with decomposition and nutrient cycling. For instance, 10g of earthworm biomass in a mesocosm of PVC with 20 cm diameter and 45 cm height enhance the % of N mineralisation during 56 days (Postma-Blaaw et al., 2006). Reduction of earthworm detritivore populations leads to more coarse organic matter remaining on the soil surface, indicating the importance of this group to the initial breakdown and incorporation of coarse organic material (Ketterings et al. 1997). Moreover, reduction in microbivore selective activity may lead to a decrease in succession rate of fungal colonisation leading to a decrease in organic breakdown and nutrient change. Valuation: Indirect economic value is related to food supply in agricultural activities through the importance of this SPU in supporting soil fertility and crop growth (particularly cereals and pastures) as discussed in numerous studies (Brown et al., 1999; Villenave et al., 1999; Scheu, 2003). In most of the studies shoot and root biomass of plants, as well as grain production, significantly increased with earthworm feeding activities since they provide available nutrients to plants, both directly (via litter breakdown, OM ingestion and excretion) (e.g. Helling and Larink, 1998; Ortiz-Ceballos et al., 2007) and indirectly (providing habitat for microorganisms, particularly earthworm macropores and casts, and stimulating their decomposing activity and thereby increasing nutrient cycling in the soil) (e.g. Helling and Larink, 1998; Lavelle et al., 2006). Relevant drivers and pressures: Land use change (e.g. land abandonment, afforestation and deforestation) and agricultural practices (e.g. intensive management, intensive grazing and soil mobilization and compaction). The accumulation of heavy metals derived from pesticide inputs, as well as diffuse pollution (both metals and organic compounds) resulting from aerial deposition, also affect soil fauna (particularly earthworms) and thereby deteriorate nutrient cycling and organic matter decomposition service. Appraisal: Several habitat management strategies may enhance nutrient cycling and organic matter decomposition by promoting earthworm abundance and diversity, such as: reduction of the number and area of plantations with exotic tree species (Paoletti, 1999); promotion of integrated and organic farming with minimum soil tillage (El Titi and Ipach, 1989; Paoletti et al., 1995); reduction of chemical inputs (e.g. Edwards and Bohlen, 1992); and replacement of chemical fertilisers with manure in grasslands and crop fields (Paoletti, 1999). The (maintenance of the) dynamics of soil organic matter is included in the objectives of the current Soil Thematic Strategy (EU, 2002) and the forthcoming Soil Framework Directive. Water cycling in soils (Leonard and Rajot, 2001): The service: Water cycling in soils supported by macrofauna. The burrowing activities of soil macrofauna (particularly subterranean termites) create a soil structure with macropores (bioturbation). These macropores, which result from the collection and removal of fine material for building and nesting, are a medium that permits water flow into soils and increases water retention (Mando and Miedema, 1997). The ESB: The global population, particularly those living in arid and semi-arid regions with eroded soils at risk of desertification (e.g. Sahel). The ESP: Soil macrofauna with an emphasis on bioturbators (e.g. termites, ants and earthworms) The SPU: At least 30 termite macropores per square meter are necessary to assure water retention by significantly decreasing runoff (Leonard and Rajot, 2001). Above the critical density of 30 macropores per m2 the influence of termite activity is more constant.

Review of concepts of dynamic ecosystems and their services 58
Valuation: Bioturbation activities have indirect and positive effects on crop productivity due to the increase in open voids that promote water infiltration and its availability to plants. In addition to the economic and social values of soil quality and crop production, the soil bioturbation process also decreases the potential of soil erosion by drought or rainfall (Lobry de Bruyn, 1999). Relevant drivers and pressures: Social, economic and demographic pressures resulting in desertification, land abandonment, urban expansion, deforestation and agricultural intensification. Indeed, the combined effects of climatic conditions, intensive cultivation, overgrazing and trampling by cattle have led to the depletion of soil fauna diversity or abundance and resulted in the spread of bare soils with a degraded structure and a sealed surface which impedes water infiltration and root growth. In addition, climate change is likely to increase soil erosion risk due to prolonged droughts and forest fires, erratic and high intensity rainfall events and windstorms. Appraisal: Conservation (reduced) tillage may strongly reduce soil erosion by water, improve soil physical properties, increase soil biodiversity and improve the energy efficiency of agriculture (Röhrig et al., 1998; Brennan et al., 2006). In the Sahel tillage is often used to create voids to allow water to infiltrate into sealed soils, but this practice has been proved to create unstable voids and thus has no lasting effect on infiltration (Kooistra et al., 1988; Stroosnijder and Hoogmoed, 1984). Soil management techniques that enhance termite activity, such as mulching are an alternative to soil tillage for the rehabilitation of degraded soil structure (Mando and Miedema, 1997). Further, sustainable livestock and grazing management practices, such as establishing the proper stocking rate, and the most suitable grazing animal, season and duration of grazing for each rangeland (van Camp et al., 2004), also benefit water infiltration in soils. In line with the CAP reform 2003, the principal instruments for most Member States to tackle soil erosion are economic instruments in the form of cross compliance (sanction) and agri-environment schemes (incentive) that take soil biodiversity into consideration. Monitoring Biodiversity and Soil Erosion is a specific target included in the objectives of the current Soil Thematic Strategy (EU, 2002) and the forthcoming Soil Framework Directive. Finally, through the Kyoto Protocol there may be a possibility to encourage soil carbon sequestration which, as well as combating climate change by reducing atmospheric carbon, would have a beneficial effect on reducing soil erosion and desertification. Provision of habitat for the endangered Alcon Blue butterfly in Belgium (Maes et al., 2004): The service: Potential habitat patches for the Alcon Blue butterfly (Maculinea alcon) were determined as wet Erica tetralix heathlands with Gentiana pneumonanthe populations and with Myrmica spp. ant nests. The ESB: People who visit heathland areas to see the Alcon Blue butterfly for recreation or ecotourism. Sightings of the butterfly are used as a major attraction for trips to Hungary, Slovenia and Portugal (www.ecotours.hu/butterflies/butterflies00/hungary00; www.naturalist.co.uk/tours2007/slovenia.php; www.responsibletravel.com/Trip/Trip100155. htm). Alcon blue also has cultural heritage value (it is used on a stamp in the Czech Republic: http://archiv.radio.cz/postfila/2002/0326-0329_e.html), and educational value (it was part of the BBC's Nature programme 'Life in the Undergrowth' in which David Attenborough highlighted the relationship between the butterfly, the Myrmica spp. ant and the Ichneumon eumerus parasitic wasp: http://news.bbc.co.uk/1/hi/sci/tech/4460030.stm). The ESP: G. pneumonanthe provides the only host plant for M. alcon and Myrmica spp. ant nests provide the host ants, which are also dependent on heathland diversity.

Review of concepts of dynamic ecosystems and their services 59
The SPU: M. alcon is able to survive in small habitat units (<1 ha) even with low host plant densities as long as suitable host ants are present. Larger non-isolated (<10km) patches are less likely to cause extinctions. Valuation: The provision of habitat for M. alcon butterfly has an indirect use value since it enables the preservation of a species which provides humans with a cultural/aesthetic service. Several published studies quantify such indirect use value for specific habitats/landscapes but there are no published studies on the valuation of this specific habitat. A future study on this topic could be based on either stated (i.e. contingent valuation method) or revealed preferences (i.e. travel cost method). Relevant drivers and pressures: Land use change, in particular habitat fragmentation, and climate change are likely to be key pressures that would affect the delivery of this service. Appraisal: Conservation management should focus on restoring habitat and creating new habitat between existing populations to increase network connectivity. Large heathland areas should be preferred as these have a larger habitat heterogeneity making them more resilient to environmental dynamics. Larger wet heathlands also have higher ant nest densities, which increases the necessary spatial overlap between host plant and host ant nests. 4.4.5 Summary of case study examples Table 4.4 summarises key information from the above 14 examples on the type of ecosystem service, the ESBs, the ESPs, the SPU, the supporting system (if relevant) and important drivers and pressures. The examples shown are some of the best we found in the literature, providing the most complete information on the identification and quantification of ESPs and SPUs, however, there are still many gaps in knowledge. They include three examples from the provisioning, cultural and supporting categories of the MA and five examples from the regulatory category, reflecting the greater amount of work published in this class, for a range of terrestrial and freshwater ecosystems. The ESBs are identified in all examples, but this information was not always available in the paper cited and was often added from other sources. Quantifying demand is only addressed in a few examples. Hougner et al. (2006) who describe the seed dispersal service provided by Eurasian Jays (Garrulus glandarius) in oak forest in the National Urban Park of Stockholm, Sweden (example 9) partly quantify the ecosystem service demand. First, they present general arguments of the cultural, recreational (e.g. 15 million visits/year) and biodiversity value of the park. They argue that oak forest makes a substantial contribution to these values in addition to oaks (Quercus spp.) being recognised as keystone species in the region. Second, they show that the foraging and dispersal behaviour of Garrulus facilitates acorn germination to an extent much greater than any other animal species in the park. Third, they estimate the replacement cost of the seed dispersal service provided by jays (i.e. the cost in dollars of seeding or planting oak trees by humans). While this example provides some convincing arguments demonstrating the need for and value of the ecosystem service, it is still not explicit how loss of oak trees would impact on the cultural, recreational or biodiversity value of the park (or how these values change with incremental changes in the area of oak forest).

Review of concepts of dynamic ecosystems and their services 60
Table 4.4: Summary of examples from the literature where (some) quantification of ecosystem service demand and/or supply has been undertaken. Service Ecosystem ESBs ESPs SPU Supporting system Main drivers and
pressures Forage for livestock1 Heath and
shrub Regional farmers (Mediterranean)
Quercus ilex L., Erica multiflora L., Arbutus unedo L., Juniperus phoeniceae L., Viburnum tinus L., Pistacia lentiscus L
Important traits identified: high leaf protein and low fibre, but no quantification.
Maquis and garrigue heath and shrublands.
Climate change, infrastructure development, overgrazing.
Fodder production2 Subalpine grasslands
Regional farmers (central French Alps)
Festuca paniculata functional group (fibrous and nitrogen-poor leaves) and Dactylis glomerata functional group (tender and nitrogen-rich leaves)
Fodder quantity related to plant stature and abundance of the 2 ESPs. Fodder quality related to the community’s average leaf nitrogen content.
Subalpine grassland plant communities.
Management intensity, land use change, nitrogen deposition, climate change.
Hydroelectricity production3
Terrestrial Power plant provides electricity to people in eastern and central China
Terrestrial vegetation Water regulation related to soil-slope-vegetation complexes.
Deforestation, fragmentation, forestry, climate change, economic/ population growth, demand for electricity.
Pollination of watermelons4
Agro-ecosystems
Local watermelon farmers in California
Native bees that pollinate watermelon crops
Functional group dynamics
defined as a sufficient diversity of bee species (20-30) and abundance of each species (not quantified) to cope with spatial and temporal environmental variation, and visitation rate and pollination effectiveness (pollen deposition rate).
40% upland habitat (oak woodland and chaparral) within 2.4km of a farm site.
Deforestation, fragmentation, agricultural intensification, climate change, disease, competition with honeybee/ Africanised bee, market demand for product (including crop prices, consumer preferences, industry trends, etc.).
Pest regulation in coffee plantations5
Agro-ecosystems
Coffee growers in Costa Rica
Shade trees, especially poró (Erythrina poeppigiana)
The optimum density and distribution of shade trees has not been calculated.
Intensification, land use change, climate change.
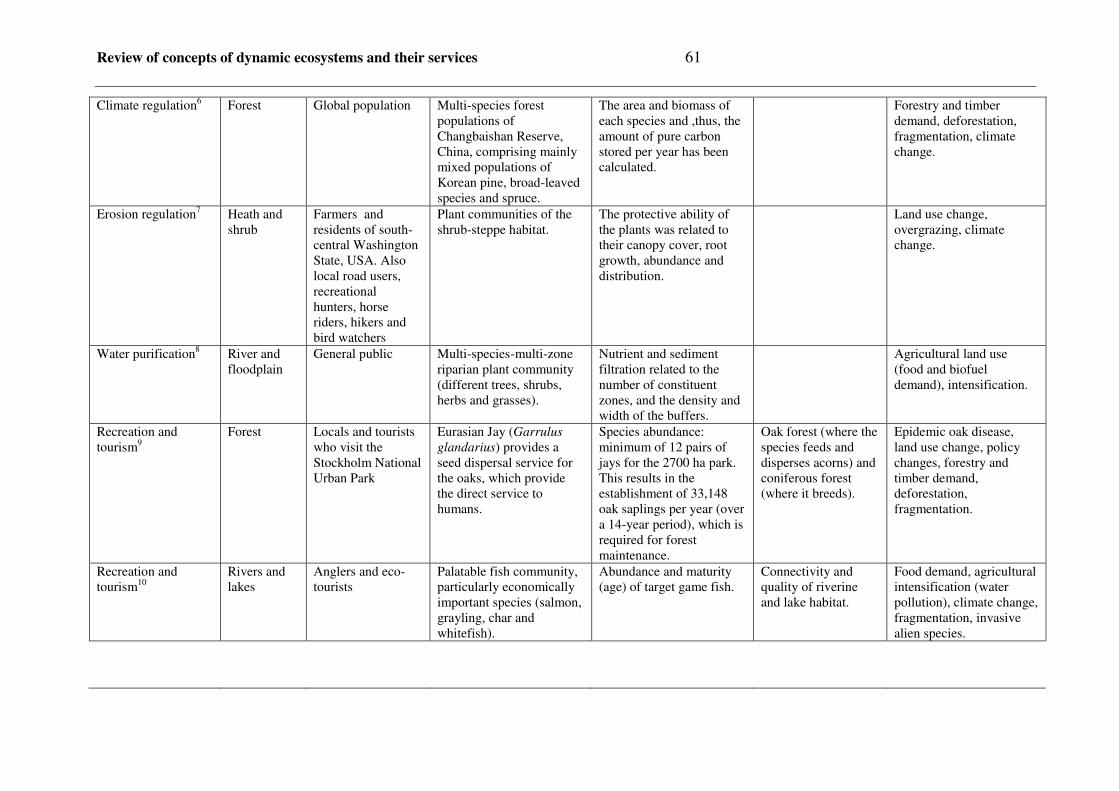
Review of concepts of dynamic ecosystems and their services 61
Climate regulation6 Forest Global population Multi-species forest populations of Changbaishan Reserve, China, comprising mainly mixed populations of Korean pine, broad-leaved species and spruce.
The area and biomass of each species and ,thus, the amount of pure carbon stored per year has been calculated.
Forestry and timber demand, deforestation, fragmentation, climate change.
Erosion regulation7 Heath and shrub
Farmers and residents of south-central Washington State, USA. Also local road users, recreational hunters, horse riders, hikers and bird watchers
Plant communities of the shrub-steppe habitat.
The protective ability of the plants was related to their canopy cover, root growth, abundance and distribution.
Land use change, overgrazing, climate change.
Water purification8 River and floodplain
General public Multi-species-multi-zone riparian plant community (different trees, shrubs, herbs and grasses).
Nutrient and sediment filtration related to the number of constituent zones, and the density and width of the buffers.
Agricultural land use (food and biofuel demand), intensification.
Recreation and tourism9
Forest Locals and tourists who visit the Stockholm National Urban Park
Eurasian Jay (Garrulus glandarius) provides a seed dispersal service for the oaks, which provide the direct service to humans.
Species abundance: minimum of 12 pairs of jays for the 2700 ha park. This results in the establishment of 33,148 oak saplings per year (over a 14-year period), which is required for forest maintenance.
Oak forest (where the species feeds and disperses acorns) and coniferous forest (where it breeds).
Epidemic oak disease, land use change, policy changes, forestry and timber demand, deforestation, fragmentation.
Recreation and tourism10
Rivers and lakes
Anglers and eco-tourists
Palatable fish community, particularly economically important species (salmon, grayling, char and whitefish).
Abundance and maturity (age) of target game fish.
Connectivity and quality of riverine and lake habitat.
Food demand, agricultural intensification (water pollution), climate change, fragmentation, invasive alien species.

Review of concepts of dynamic ecosystems and their services 62
Aesthetic value11 Agro-ecosystems
Bird and Game NGOs, and the general bird-loving and bird-shooting public
Farmland birds Abundance and distribution of 19 species of farmland birds with a range of desired traits and trait values (colour, size, song, taste, etc.).
Agricultural landscapes for feeding and/or nesting.
Land use change, agricultural intensification.
Nutrient cycling12 Soils Local farmers, who benefit financially from crop production, to the global population, who benefit from the availability of food and fibre.
Soil invertebrates with an emphasis on saprophagous organisms (e.g. detritivores and microbivores), in particular earthworms (e.g. Lumbricus rubellus, Lumbricus terrestris, Aporrectodea caliginosa).
Earthworm individual species densities were related to decomposition and nutrient cycling
Land use change (e.g. land abandonment, afforestation and deforestation), agricultural practices (e.g. intensive management, intensive grazing and soil mobilization and compaction), pollution.
Water cycling13 Soils The global population, particularly in arid and semi-arid regions with eroded soils at risk of desertification.
Soil macrofauna, in particular bioturbators (e.g. termites, ants and earthworms).
Species density: at least 30 termite macropores per square meter are necessary to assure water retention by significantly decreasing runoff.
Land abandonment, urban expansion, deforestation, agricultural intensification, climate change, overgrazing (and trampling by cattle).
Provision of habitat for the endangered Alcon Blue butterfly14
Heath and shrub
People who visit heathland areas to see the Alcon Blue butterfly for recreation or ecotourism.
Gentiana pneumonanthe provides the only host plant.
G. pneumonanthe density and distribution, but no quantification provided.
Myrmica spp. ant nests provide the host ants, which are also dependent on heathland diversity.
Land use change (intensification, abandonment), fragmentation, climate change.
References: (1) Rogosic et al., 2006; (2) Quétier et al., 2007b; (3) Guo et al., 2000; (4) Kremen et al., 2002; 2004; (5) Varon et al., 2007; (6) Xue and Tisdell, 2001; (7) Scott et al., 1998; (8) Correl, 2005; Dosskey, 2001; (9) Hougner et al., 2006; (10) Everard, 2004; (11) Butler et al., 2007; (12) Postma-Blaaw et al., 2006; (13) Leonard and Rajot, 2001; (14) Maes et al., 2004.

Review of concepts of dynamic ecosystems and their services 63
The ESPs are identified in all examples. These are single species in two of the examples (examples 9 and 14), functional groups in six examples and entire communities in six examples. All the examples identify the important characteristics or traits of the ESP(s) which are required for service provision, but only nine actually provide a quantification (or part quantification) of the SPU. Identification and quantification of all the desired characteristics of the ESP or SPU can be extremely challenging for services that are based on multiple species. For example in the Kremen et al. (2002) study, the ESP is the pollinator functional group maintained at an appropriate diversity (e.g. group composition and abundance of individual members) with suitable traits aggregated from each species. The SPU would be defined by the composition of the functional group (including the identity of each member), the functional traits of each member (which combined lead to the desired aggregate service), the population characteristics of each member (e.g. density) and appropriate spatial (e.g. distribution) and temporal (e.g. active during crop flowering) dynamics to deliver the service at the desired level. A more practical solution here was to focus on managing service delivery indirectly by quantifying the supporting system (i.e. habitat) required by the bee community. Moreover, concentrating on ‘supporting systems’ is already generally accepted in conservation, where protection measures based on the minimum habitat area required for the sustainability of populations are commonplace (e.g. Smallwood, 2001; Solomon et al., 2003). This approach assumes a reasonable understanding of the relationships between supporting habitat, service providers and service delivery, yet our knowledge of habitat – service provider dynamics needs to be substantially improved. Further, in most of the examples it was unclear how service provision varied with incremental changes in the ESP. This is important because it helps to identify the trade-offs in obtaining a given outcome through ecosystem services or anthropogenic alternatives (e.g. the cost-benefits along a continuum of options for controlling pests based on various combinations of natural control from native and/or exotic species and pesticides). One exception was in example 2 based on Quétier et al. (2007b) where the provision of ecosystem services to local stakeholders was continuously related to plant species traits that also respond to management. This made it possible to assess the outcomes of alternative land-use scenarios in terms of synergies or trade-offs in provision of services such as fodder production or quality. Finally, the main pressures listed in the examples are demand for agricultural and forestry products, climate change, land use change (including deforestation, urban expansion, land abandonment and fragmentation), and changes in land use/management practices (including intensification and overexploitation). SPUs, whether key species, functional groups or ecological communities, are affected positively or negatively by such changes and require a level of resilience that is sufficient to buffer against adverse impacts. 5. Discussion and conclusions This report reviews the current state-of-the-art with regard to concepts and frameworks for the assessment and quantification of ecosystem services in the context of biodiversity conservation. The framework for ecosystem service assessment proposed by the Millennium Ecosystem Assessment (MA, 2005) is perhaps the most well known. The MA report categorises ecosystem services into four different classes: provisioning, regulating, cultural and supporting services. The literature was searched for evidence of services identified by the MA within these different service classes for a range of terrestrial and freshwater ecosystems.

Review of concepts of dynamic ecosystems and their services 64
Most types of ecosystems provide similar services such as food, climate regulation, nutrient and water cycling, and recreation, whilst some services are restricted to only a few ecosystems, such as pollination and the provision of fresh water. However, consistent information across the ecosystems on the importance of different services for human well-being was not readily available. 5.1 Overview of ecosystems studied Among the ecosystems that have been assessed the ones using most land in Europe are agro- and forest ecosystems. The management of agro-ecosystems responds quickly to changing market demands and this response can have major and frequent impacts on biodiversity, through disturbance, fragmentation, monocultural practices, changing levels of soil nutrients, interactions between wild and cultivated crops at the genetic level, pest and disease control methods, etc. However, the services provided by natural biodiversity to agriculture remain important, particularly for example pollination services and more frequently the services provided by biocontrol agents. Similarly forest ecosystems are often heavily managed for the services they provide such as wood. But often incidental to this wood production are other important services with regard to water supply, though natural forests with their diverse ground flora are suggested to provide better water purification than plantations. Recreation service provision such as hunting, fruit and mushroom gathering are often seen as being cultural important in many societies and can be provided by both natural and managed forests. Reforestation as a response to climate change and the need to store carbon for the medium term in wood has become a major issue though with a longer time perspective than changes in agro-ecosystems. Forest ecosystems are many and range from alpine woodlands, through highly diverse lowland nature reserves, to heavily managed monocultural plantations. Some types of forest, their biodiversity and the services they provide are severely threatened, for example, riparian forests which occur in the ecotone on river margins and are, thus, important for example in flood protection. Recent modelling simulations for Europe (Zaehle et al., 2007) using future climate and land use change scenarios predicted increasing levels of woodiness in Europe, caused by the abandonment of agricultural land due to technological advances requiring less land for crop production. Such abandonment would in many places lead to forest through the natural processes of succession and an increase in forest biodiversity. However, with the recent emphasis on increasing biofuel production as a response to reducing carbon emissions this may be no longer likely. It emphasises the often rapid response to market and political forces in both agro- and forest ecosystems. One of the most human impacted ecosystems over much longer timescales is European grasslands which have usually been managed to some degree for hundreds if not thousands of years. This management has been often only been through moderate grazing by horses, cows and sheep leading to these semi-natural cultural landscapes being one of the most species rich ecosystems in Europe, particularly at finer scales. Grasslands in Europe have usually a long term historical involvement with man providing services such as hay for animal fodder, grazing, pollinators, pest regulation and cultural heritage values. They have, however, been seriously threatened through agricultural intensification and habitat fragmentation leading to biodiversity loss and service reductions.

Review of concepts of dynamic ecosystems and their services 65
Another seriously threatened and greatly reduced ecosystem is heath and shrublands. These ecosystems were prevalent in Europe until widespread agricultural intensification. Artificial fertilisers, conversion into arable fields, rural abandonment and successional forests have led to major declines in their area and those that are left are further threatened by agricultural policies, pollution and climate change. Services they provide often relate to meat and wool provision through grazing, particularly in mountainous regions, and recreational activities, for example, hunting. They also provide, along with most ecosystems, pollinating and water purification services. Heath and shrublands are often elements of mountain ecosystems. However, mountain ecosystems in general provide clear services that cannot be provided to the same degree by other ecosystems. The provision of fresh water is one of the most important services they provide both as drinking water and as hydropower. They are also huge repositories of water in glaciers, snow, underground aquifers, etc. They are also one of the most fragile ecosystems in Europe (and elsewhere) especially vulnerable to soil erosion due to over-grazing or fire leading to floods, mudslides, poor water quality, etc. Climate change is likely to cause major impacts to services that are provided by mountains as glaciers shrink and snowpack is reduced, though in some areas snow may well increase. Compared with many ecosystems, however, the changes in mountain services could be seen to be dramatic leading to major influences on both local rural and regional communities. Biodiversity and the various services will most likely be influenced detrimentally at the same time. Soil ecosystems were assessed as a separate ecosystem given their general nature and the importance they have for all other terrestrial ecosystems. The condition of this ecosystem influences directly the existence and quality of many services that are provided in the other ecosystems. The processes and engineering that occurs in soil particularly with regard to decomposition and nutrient provision directly affects services such as food provision. Soil organisms likewise are themselves food for mammals, birds and reptiles, thus promoting their service provision to humanity. Soil condition and soil fauna are involved with water cycling and thus also have relevance for non-terrestrial ecosystems, such as wetlands and riverine ecosystems. Wetland ecosystems are highly diverse and range from estuaries to coasts, marshes, bogs and swamp forests, which interact and link with many other ecosystems such as agro-ecosystems, forests and lakes. Wetland degradation that has occurred extensively in Europe has directly impacted on services for local communities. However, different types of wetlands provide different services. For example, freshwater wetlands and floodplains provide services to agricultural production, but not estuaries, lakes or bogs. Bogs, lakes and estuaries are involved with the supply of energy, whilst bogs and peatlands are an important carbon sink and provide a key contribution to the world’s climate regulation system. Thus, the diverse nature of the services provided by a mosaic of different wetland types serves to emphasise the need for better understanding of these complex ecosystems. Other important aquatic ecosystems that have a direct and obvious service to humanity are rivers and lakes which provide and regulate the quantity and quality of fresh water for domestic, industrial and agricultural use. Floodplains of rivers also provide the area to retain floods, thus, protecting human properties and well-being. Rivers and lakes are intensively used for recreational and tourism activities, such as bathing, boating and game fishing. There are a multitude of other services from rivers and lakes, many similar to the services provided by terrestrial ecosystems, however freshwater ecosystems are highly endangered with a

Review of concepts of dynamic ecosystems and their services 66
substantially greater decline in biodiversity than in terrestrial ecosystems, due to their disproportionately high animal and plant richness. In general, however, the problems that all ecosystems face with regard to service provision are similar and the decline in biodiversity in all ecosystems reflects this. Our survey of the literature clearly shows that climate change, land use change, pollution, habitat destruction and invasion by exotic species affect all ecosystems influencing many of the general services that most ecosystems provide, but more importantly affecting those services that can be viewed as more ecosystem specific. 5.2 Quantification of ecosystem services Understanding and assessing the value of ecosystem services to humanity requires some method of quantification. Often such quantification relates to some monetary assessment through valuation, though an ecosystem service need not necessarily always be assessed in financial terms. The service-providing unit (SPU) concept promotes the identification and quantification of the organisms and their characteristics that provide services and how changes in these organisms impact on service provision. Quantification is at the heart of the SPU approach and its value to policy makers and land managers is manifested through specific rather than vague management guidelines. While it is clear that species and functional diversity per se can affect the provision of certain ecosystem services, the SPU approach argues for quantifying relationships between service provision and key service providers, whether these be populations, functional groups or ecological communities. Collectively these approaches are mostly complementary and their applicability is likely to be context dependent – defined by level of knowledge, system properties, the particular ecosystem service(s) and the demands of service beneficiaries. The concept can be interpreted as identifying a threshold below which a service is not being provided at the desired level. However, it is crucial to understand how incremental changes in service-provider characteristics influence service provision, as this is a fundamental step to assessing the cost-benefit trade-offs of land management strategies. The value of the SPU concept is greatly enhanced if some consideration is given to ecosystem dynamics. Ecosystems are in a constant state of flux and ensuring systems have the capacity to cope with likely changes is crucial if desirable ecosystem functions (i.e. services) are to be maintained or if necessary quickly restored. This resilience may be through the ideas of functional redundancy (increased biodiversity) that is sometimes presumed to occur within an ecosystem though it has been pointed out that this may be less than previously presumed or non-existent in some circumstances (Balvanera et al., 2006). A permanent shift in conditions or an increase of stress (due to anthropogenic pressures such as climate change) can lead to changes in the balance between species, changes in species and/or functional composition and therefore to changes in (the composition of) SPUs, with possibly important consequences for conservation and management. Various frameworks for assessing the impacts of a range of drivers on ecosystem service provision are presented and discussed. Two of these, the Drivers-Pressures-State-Impact-Responses (DPSIR) and Social-Ecological Systems (SES), have been linked and integrated with the SPU concept (Figure 4.8) to create a common framework for applications in different contexts and to standardise terminology. The DPSIR-SES integrated framework can promote insight into the properties of socio-ecological systems and their responses to a

Review of concepts of dynamic ecosystems and their services 67
variety of drivers and pressures, thus aiding understanding of sustainable conservation strategies. A literature review was undertaken to identify case studies which could be used to test the framework for identifying and quantifying ecosystem services using the SPU concept and establish gaps in knowledge. Some ecosystems had more information available than others, for example, case studies for services provided by lakes and mountains seem to be fewer than for other ecosystems, in particular rivers and floodplains, and heath and shrubs. As pointed out, the reasons for this discrepancy are diverse, however, the literature study as a whole does highlight that clear service quantification is frequently not undertaken. This was also reflected in the quality and detail of the examples. Among the studies examined regulating service examples were most common, though as pointed out this may reflect to some extent the biodiversity focus of this report. Such regulatory services included pollination, pest, erosion, and climate (through carbon sequestration) controls and water purification. Cultural services similarly probably reflect a biodiversity focus within the project and include recreation, tourist and aesthetic services. Supporting and provisioning services were similar in number of examples and include fodder provision and hydroelectricty production as well as nutrient and water cycling and habitat provision. This review has shown that the quantification of many services provided by ecosystems is most often minimal. If quantification is made then most often it is made as part of a monetary valuation of the relevant service. However quantification based purely on monetary values may be dangerous and our review suggests that even with the difficulties in identifying the relevant actors involved in the service (ESB, ESP and SPU), a standardised approach to the quantification of ecosystem services could provide a better methodology for the conservation of a range of ecosystem services. 6. References Adams, W. M. (1993). Indigenous use of wetlands and sustainable development in West
Africa. Geographical Journal, 159, 209-218. Adamus, P.R. and Stockwell, L.T. (1983). A Method for Wetland Functional Assessment.
Vol. I. Critical Review and Evaluation Concepts. Report No. FHWA-IP-82-23, Federal Highway Administration, Washington, DC.
Alcamo, J., Van Vuuren, D., Cramer, W., Alder, J., Bennett, E., Carpenter, S., Christensen, V., Foley, J., Maerker, M., Masui. T., Morita, T., O’Neill, B., Peterson, G., Ringler, C., Rosegrant, M., Schulze, K., Bouwman, L., Eickhoudt, B., Floerke, M., Lal, R. and Takahashi, K. (2005). Changes in ecosystem services and their drivers across the scenarios. In: Carpenter, S., Pingali, P.L., Bennett, E.M. and Zurek, M.B. (eds.) Ecosystems and Human Well-being: Scenarios, Volume 2. Millennium Ecosystem Assessment, Island Press, Washington DC, pp. 297-373.
Allaby, M. (1994). The Concise Oxford Dictionary of Ecology. Oxford University Press, Oxford.
Allen, C.R., Johnson, A.R. and Parris, L. (2006). A framework for spatial risk assessments: potential impacts of non-indigenous invasive species on native species. Ecology and Society, 11, 39 [online] URL: http://www.ecologyandsociety.org/vol11/iss1/art39/.
Als, T.D., Vila, R., Kandul, N.P., Nash, D.R., Yen, S-H., Hsu, Y-F., Mignault, A.A., Boomsma, J.J. and Pierce, N.E. (2004). The evolution of alternative parasitic life histories in large blue butterflies. Nature, 432, 386–390.

Review of concepts of dynamic ecosystems and their services 68
Altieri, M.A. (1994). Biodiversity and Pest Management in Agrosystems. Food Product Press, New York, 185 pp.
Anastasopoulou, S., Chobotova, V., Dawson, T.E., Kluvankova-Oravska, T. and Rounsevell, M.D.A. (2007). Identifying and assessing socio-economic and environmental drivers that affect ecosystems and their services. RUBICODE Deliverable D3.1, European Commission contract 036890; http://www.rubicode.net/rubicode/outputs.html.
Armsworth, P.R. and Roughgarden, J.E. (2001). An invitation to ecological economics. Trends in Ecology and Evolution, 16, 229-234.
Atauri, J.A. and de Lucio, J.V. (2001). The role of landscape structure in species richness distribution of birds, amphibians, reptiles, and lepidopterans in Mediterranean landscapes. Landscape Ecology, 16, 147-159.
Ator, S.W., Olsen, A.R., Pitchford, A.M. and Denver, J.M. (2003). Application of a multipurpose unequal probability stream survey in the Mid-Atlantic Coastal Plain. Journal American Water Resources Association, 39, 873-885.
Baker, M.E., Weller, D.E. and Jordan, T.E. (2006). Improved methods for quantifying potential nutrient interception by riparian buffers. Landscape Ecology, 21, 1327-1345.
Baker, J.P., Hulse, D.W., Gregory, S.V., White, D., Van Sickle, J., Berger, P.A., Dole, D. and Schumaker, N.H. (2004). Alternative futures for the Willamette River Basin, Oregon. Ecological Applications, 14, 313-324.
Balvanera, P., Pfisterer, P.A., Buchmann, N., He, J-S., Nakashizuka, T., Raffaelli, D. and Schmid, B. (2006). Quantifying the evidence for biodiversity effects on ecosystem functioning and services. Ecology Letters, 9, 1146-1156.
Barbier, E.B. (1993). Sustainable use of wetlands - valuing tropical wetland benefits: economic methodologies and applications. The Geographical Journal, 159(1), 22-35.
Barbier, E.B., Acreman, M. and Knowler, D. (1997). Economic Valuation of Wetlands: A Guide for Policy Makers and Planners. Ramsar Convention Bureau, Gland, Switzerland.
Basnyat, P., Teeter, L., Flynn, K. and Lockaby, B.G. (1999). Relationships between landscape characteristics and non-point source pollution inputs to coastal estuaries. Environmental Management, 23, 539-549.
Bastrup-Birk, A. and Gundersen, P. (2004). Water quality improvements from afforestation in an agricultural catchment in Denmark illustrated with the INCA model. Hydrology and Earth System Sciences, 8, 764-777.
Baudry, J., Burel, F., Aviron, S., Martin, M., Ouin, A., Pain, G. and Henail, C. (2003). Temporal variability of connectivity in agricultural landscapes: do farming activities help? Landscape Ecology, 18, 303-314.
Baum, A.K., Haynes, K.J., Dillemuth, F.P. and Cronin, J.T. (2004). The matrix enhances the effectiveness of corridors and stepping stones. Ecology, 85, 2671-2676.
de Bello, F., Lepš, J. and Sebastià, M.-T. (2005). Predictive value of plant traits to grazing along a climatic gradient in the Mediterranean. Journal of Applied Ecology, 42, 824-833.
Berkes, F. and Folke C. (eds.) (1998). Linking Social Ecological Systems: Management Practices and Social Mechanisms for Building Resiliance. Cambridge University Press, Cambridge.
Berkes, F., Colding, J.F. and Folke, C. (eds.) (2003). Navigating Nature’s Dynamics: Building Resilience for Complexity and Change. Cambridge University Press, New York.
Bhar, R. and Fahrig, L. (1998). Local vs. landscape effects of woody field borders as barriers to crop pest movement. Conservation Ecology [online], 2(2), 3.

Review of concepts of dynamic ecosystems and their services 69
Blanchart, E., Lavelle, P., Braudeau, E., Bisonnais, Y. L., and Valentin, C. (1997). Regulation of soil structure by geophagous earthworm activities in humid savannas of Côte d’Ivoire. Soil Biology and Biochemistry, 29(3/4), 431–439.
Boeken, B. and Orenstein, D. (2001). The effect of plant litter on ecosystem properties in a Mediterranean semi-arid shrubland. Journal of Vegetation Science, 12(6), 825-832.
Boyd, J. and Banzhaf, S. (2007). What are ecosystem services? The need for standardized environmental accounting units. Ecological Economics, 63(2-3), 616-626.
Brennan, A., Fortune, T. and Bolger, T. (2006). Collembola abundances and assemblage structures in conventionally tilled and conservation tillage arable systems. Pedobiologia, 50, 135-145.
Brotons, L., Herrando, S. and Martin, J.L. (2004). Bird assemblages in forest fragments within Mediterranean mosaics created by wild fires. Landscape Ecology, 19(6), 663-75.
Brown, G.G., Edwards, C.A. and Brussaard, L. (2004). How earthworms affect plant growth: burrowing into the mechanisms. In: Edwards, C.A. (ed.) Earthworm Ecology. CRC Press, Boca Raton, pp. 13-49.
Brown, G.G., Pashanasi, B., Villenave, C., Patrón, J.C., Senapati, B.K., Giri, S., Barois, I., Lavelle, P., Blanchart, E., Blakemore, R.J., Spain, A.V. and Boyer, J. (1999). Effects of earthworms on plant production in the tropics. In: Lavelle, P., Brussaard, L. and Hendrix, P. (eds.) Earthworm Management in Tropical Agro-ecosystems. CABI Publishing, Oxon, pp. 87–147.
Bullock, A. and Acreman, M. (2003). The role of wetlands in the hydrological cycle. Hydrology and Earth System Science, 7, 358-389.
Bullock, J.M., Pywell, R.F. and Walker, K.J. (2007). Long-term enhancement of agricultural production by restoration of biodiversity. Journal of Applied Ecology, 44, 6-12.
Butler, S.J., Vickery, J.A. and Norris, K. (2007). Farmland biodiversity and the footprint of agriculture. Science, 315, 381-384.
Capistrano, D., Samper K.C., Lee, M.J. and Raudsepp-Hearne, C. (eds.) (2005). Ecosystems and Human Well-being: Multiscale Assessments, Volume 4. Island Press, Washington DC, 388 pp.
Carpenter, S.R., DeFries, R., Dietz, T., Mooney, H.A., Polasky, S., Reid, W.V. and Scholes, R.J. (2006). Millennium ecosystem assessment: research needs. Science, 314, 257-258.
Carpenter, S.R. (2003). Regime shifts in lake ecosystems: pattern and variation. Excellence in Ecology Series, Volume 15. Ecology Institute, Oldendorf/Luhe, Germany.
Cheng, J.D., Lin, L.L. and Lu, H.S. (2002). Influences of forests on water flows from headwater watersheds inTaiwan. Forest Ecology and Mangement, 165, 11-28.
Christensen, N.L., Bartuska, A.M., Brown, J.H., Carpenter, S., D’Antonio, C., Francis, R., Franklin, J.F., MacMahon, J.A., Noss, R.F., Parsons, D.J., Peterson, C.H., Turner, M.G. and Woodmansee, R.G. (1996). The report of the Ecological Society of America Committee on the scientific basis for ecosystem management. Ecological Applications, 6, 665-691.
Cole, L., Bradford, M.A., Shaw, P.J.A. and Bardgett, R.D. (2006). The abundance, richness and functional role of soil meso- and macrofauna in temperate grassland: A case study. Applied Soil Ecology, 33, 186-198.
Coleman, D.C. and Crossley Jr., D.A. (2003). Fundamentals of Soil Ecology. Academic Press, Elsevier Science (2ºed.), Massachusetts, 205 pp.
Contrera, S. and Toha, C. (1984). Biogas production from suspension of homogenized cladodes of the cactus Opuntia cacti. Journal of Fermentation Technology, 62, 601-605.
Correll, D.L. (2005). Principles of planning and establishment of buffer zones. Ecological Engineering, 24, 433-439.

Review of concepts of dynamic ecosystems and their services 70
Costanza, R. (2000). Social goals and the valuation of ecosystem services. Ecosystems, 3, 4-10.
Costanza, R., d’Arge, R., de Groot, R., Farber, S., Grasso, M., Hannon, B., Limburg, K. Naeem, S., O’Neill, R.V., Paruelo, J., Raskin, R.G., Sutton, P. and van den Belt, M. (1997). The value of the world’s ecosystem services and natural capital. Nature, 387, 253-260.
Council of Europe (2000). General Guidelines for the Development of the Pan-European Ecological Network. Nature and environment, No.107. Council of Europe Publishing, Strasbourg.
Cruz, P., Duru, M., Therond, O., Theau, J.P., Ducourtieux, C., Jouany, C., Al Haj Khaled, R. and Ansquer, P. (2002). Une nouvelle approche pour caractériser la valeur d'usage des prairies naturelles et semi-naturelles. Fourrages, 172, 335-354.
Curtis, J.A. (2002). Estimating the demand for salmon angling in Ireland. The Economic and Social Review, 33, 319-332.
Daily, G.C. (ed.) (1997). Nature’s Services: Societal Dependence on Natural Ecosystems. Island Press, Washington DC.
Dale, V.H. and Polasky, S. (2007). Measures of the effects of agricultural practices on ecosystem services. Ecological Economics, doi:10.1016/ j.ecolecon.2007.05.009.
Damschen, E.I., Haddad, N.M., Orrock, J.L., Tewksbury, J.J. and Levey, D.J. (2006). Corridors increase plant species richness at large scales. Science, 313, 1284-1286.
Davi, H., Dufrêne, E., François, C., le Maire, G., Lousteau, D., Bosc, A., Rambal, S., Granier, A. and Moors, E. (2006). Sensitivity of water and carbon fluxes to climate changes from 1960 to 2100 in European forest ecosystems. Agricultural and Forest meteorology, 141, 35-36.
Davis, T.J. (ed.) (1994). The Ramsar Convention Manual: A Guide to the Convention on Wetlands of International Importance. International Union for Conservation of Nature and Natural Resources, Ramsar Convention Bureau, Gland, 207 pp.
de Bello, F., Lavorel, S., Díaz, S., Harrington, R., Bardgett, R., Berg, M., Cipriotti, P., Cornelissen, H., Feld, C., Hering, D., Martins da Silva, P., Potts, S., Sandin, L., Sousa, J.P., Storkey, J. and Wardle, D. (2008). Functional traits underlie the delivery of ecosystem services across different trophic levels. RUBICODE Deliverable D5.1, European Commision contract 036890; http://www.rubicode.net/rubicode/outputs.html.
Decaëns, T., Jiménez, J.J., Gioia, C., Measey, G.J. and Lavelle, P. (2006). The values of soil animals for conservation biology. European Journal of Soil Biology, 42, 23–38.
Dechaine, J., Ruan, H., Sanchez-de Leon, Y. and Zou, X. (2005). Correlation between earthworms and plant litter decomposition in a tropical wet forest of Puerto Rico. Pedobiologia, 49, 601-607.
DeMerona, B. (1992). Fish communities and fishing in a floodplain lake of central Amazonia. In: Maltby, E., Dugan, P.J. and Lefeuvre, J.C. (eds.) Conservation and Development: The Sustainable Use of Wetland Resources. Proceedings of the Third International Wetlands Conference, Rennes, France, 19-23 September 1988, IUCN, Gland, Switzerland, pp. 165-177.
Deutschewitz, K., Lausch, A., Kühn, I. and Klotz, S. (2003). Native and alien plant species richness in relation to spatial heterogeneity on a regional scale in Germany. Global Ecology and Biogeography, 12, 299-311.
Díaz, S. and Cabido, M. (2001). Vive la différence: plant functional diversity matters to ecosystem processes. Trends in Ecology and Evolution, 16, 646-655.
Díaz, S., Fargione, J., Chapin, F.S. and Tilman, D. (2006). Biodiversity loss threatens human well-being. PLoS Biology, 4(8), e277 doi:10.1371/journal.pbio.0040277.
Review of concepts of dynamic ecosystems and their services 71
Díaz, S., Lavorel, S., de Bello, F., Quetier, F., Grigulis, K. and Robson, T.M. (2007). Incorporating plant functional diversity effects in ecosystem service assessments. PNAS, 104(52), 20684-20689.
Dixon, J.D., Oli, M.K., Wooten, M.C., Eason, T.H., McCowins, J.W. and Paetkau, D. (2006). Effectiveness of a regional corridor in connecting two Florida black beer populations. Conservation Biology, 20, 155-162.
Donald, P.F., Pisano, G., Rayment, M.D. and Pain, D.J. (2002). The common agricultural policy, EU enlargement and the conservation of Europe’s farmland birds. Agriculture, Ecosystems and Environment, 89, 167-182.
Donovan, T.M. and Flather, C.H. (2002). Relationships among North American songbird trends, habitat fragmentation and landscape occupancy. Ecological Applications, 12, 364-374.
Dosskey, M.G. (2001). Toward quantifying water pollution abatement in response to installing buffers on crop land. Environmental Management, 28(5), 577-598.
Drechsler, M., Wätzold, F., Johst, K., Bergmann, H. and Settele, J. (2007). A model-based approach for designing cost-effective compensation payments for conservation of endangered species in real landscapes. Biological Conservation, 140, 174-186.
Dries, I. (1989). Development of wetlands in Sierra Leone: farmers rationality opposed to government policy. In: Marchand, M. and Udo, H.A. (eds.) The People’s Role in Wetland Management. Proceedings of the International Conference in Leiden, The Netherlands, June 5-8th 1989. Centre for Environmental Studies, Leiden University, pp. 833-843.
Dudgeon, D., Arthington, A.H., Gessner, M.O., Kawabata, Z-I., Knowler, D.J., Lévêque, C., Naiman, R.J., Prieur-Richard, A-H., Soto, D., Stiassny, M.L.J. and Sullivan, C.A. (2006). Freshwater biodiversity: importance, threats, status and conservation challenges. Biological Reviews, 81, 163-182.
Duffy, J.E. (2002). Biodiversity and ecosystem function: the consumer connection. Oikos, 99, 201-219.
Dugan, P.J. (1990). Wetland Conservation: A Review of Current Issues and Action. IUCN, Gland, Switzerland
Duru, M., Cruz, P. and Magda, D. (2004). Using plant traits to compare sward structure and composition of grass species across environmental gradients. Applied Vegetation Science, 7, 11-18.
Edwards, C.A. and Bohlen, P.J. (1992). The effects of toxic chemicals on earthworms. Archives of Environmental Contamination and Toxicology, 125, 23-99.
EEA (1995). Europe’s Environment: the Dobris Assessment. European Environment Agency, Copenhagen.
EEA (1999). Environmental Indicators: Typology and Overview. Technical Report No. 25, European Environment Agency, Copenhagen.
Egoh, B., Rouget, M., Reyers, B., Knight, A.T., Cowling, R.M., van Jaarsveld, A.S. and Welz, A. (2007). Integrating ecosystem services into conservation assessments: a review. Ecological Economics, 63, 714-721.
Ehrlich, P.R. and Ehrlich, A.H. (1981). Extinction: The Causes and Consequences of the Disappearance of Species. Random House, New York.
Ehrlich, P.R. and Ehrlich, A.H. (1970). Population, Resources, Environment: Issues in Human Ecology. W.H. Freeman, San Francisco. 383 pp. - see p.157.
Ehrlich, P.R. and Mooney, H.A. (1983). Extinction, substitution, and ecosystem services. BioScience, 33, 248-254.

Review of concepts of dynamic ecosystems and their services 72
El Titi, X. and Ipach, U. (1989). Soil fauna in sustainable agriculture: results of an integrated farming system at Lautenbach, FRG. Agriculture, Ecosystems and Environment, 27, 561-572.
Elmqvist, T., Folke, C., Nyström, M., Peterson, G., Bengtsson, J., Walker, B. and Norberg, J. (2003). Response diversity, ecosystem change, and resilience. Frontiers in Ecology and the Environment, 1, 488-494.
English Nature, Rural Development Service and Countryside Agency (2006). Landscape: Beyond the View. Countryside Agency, Peterborough, 24 pp.
Eriksson, O., Cousins, S.A.O. and Bruun, H.H. (2002). Land-use history and fragmentation of traditionally managed grasslands in Scandinavia. Journal of Vegetation Science, 13, 743-748.
EU (2002). Towards a Thematic Strategy for Soil Protection. Communication from the Commission to the Council, the European Parliament, the Economic and Social Committee and the Committee of the Regions. COM (2002) 179 final, Brussels, 35 pp.
Everard, M. (2004). Investing in sustainable catchments. Science of the Total Environment, 324, 1-24.
Falkenmark, M. and Folke, C. (2003). Freshwater and welfare fragility – introduction. In: Falkenmark, M. and Folke, C. (eds.) Freshwater and welfare fragility: syndromes, vulnerabilities and challenges. Philosophical Transactions of the Royal Society of London: Series B, Biological Sciences, 358, 1440.
FAO Fisheries and Aquaculture Department (2007). The Status of World Fisheries and Aquaculture. Food and Agriculture Organization of the United Nations, Rome.
Feld, C.K., de Bello, F., Bugter, R., Grandin, U., Hering, D., Lavorel, S., Mountford, O., Pardo, I., Partel, M., Römbke, J., Martins da Silva, P., Sousa, J.P. and Jones, K.B. (2007). Assessing and monitoring ecosystems – indicators, concepts and their linkage to biodiversity and ecosystem services. RUBICODE Deliverable D4.1, European Commission contract 036890; http://www.rubicode.net/rubicode/outputs.html.
Filser, J. (2002). The role of Collembola in carbon and nitrogen cycling in soil. Pedobiologia, 46, 234-245.
Finlayson, C.M., D’Cruz, R., Aladin, N., Barker, D.R., Beltram, G., Brouwer, J., Davidson, N., Duker, L., Junk, W., Kaplowitz, M.D., Ketelaars, H., Kreuzberg-Mukhina, E., de la Lanza Espino, G., Lévêque, C., Lopez, A., Milton, R.G., Mirabzadeh, P., Pritchard, D., Revenga, C., Rivera, M., Hussainy, A.S., Silvius, M., Steinkamp, M., Aparin, V., Bykova, E., Calderón, J.L.G., Gorelkin, N., Hagemeijer, W., Kreuzberg, A., Rodríguez, E.M., Mirabdullaev, I., Mumba, M., Plotnikov, I., Talskykh, V. and Toryannikova, R. (2005). Inland Water Systems. In: Hassan, R., Scholes, R. and Ash, N. (eds.) Ecosystems and Human Well-being: Current State and Trends, Volume 1. Millenium Ecosystem Assessment, Island Press, Washington DC, pp. 551-583.
Fleischer, A. and Sternberg, M. (2006). The economic impact of global climate change on Mediterranean rangeland ecosystems: A Space-for-Time approach. Ecological Economics, 59(3), 287-295.
Foley, J., Asner, G.P., Costa, M.H., Coe, M.T., DeFries, R., Gibbs, H.K., Howard, E.A., Olson, S., Patz, J., Ramankutty, N. and Snyder, P. (2007). Amazonia revealed: forest degradation and loss of ecosystem goods and services in the Amazon basin. Frontiers in Ecology, 5(1), 25-32.
Folgarait, P.J. (1998). Ant biodiversity and its relationship to ecosystem functioning: a review. Biodiversity and Conservation, 7, 1221-1244.
Folke, C. (2003). Social-ecological resilience and behavioural responses. In: Biel, A., Hansson, B. and Mårtensson, M. (eds.) Individual and Structural Determinants of Environmental Practice. Ashgate Publishers, London, pp. 226-242.

Review of concepts of dynamic ecosystems and their services 73
Folke, C. (2006). Resilience: the emergence of a perspective for social-ecological systems analyses. Global Environmental Change, 16, 253-267.
Fonseca, C.R. and Ganade, G. (2001). Species functional redundancy, random extinctions and the stability of ecosystems. Journal of Ecology, 89, 118-125.
Forbis, A. (2003). Seedling demography in an alpine ecosystem. American Journal of Botany, 90, 1197-1206.
Freeman III, A.M. (1997). On valuing the services and functions of ecosystems. In: Simpson, R.D. and Christensen Jr., N.L. (eds) Ecosystem Function and Human Activities. Reconciling Economics and Ecology. Chapman and Hall, London, pp. 242-254.
Frouz, J., Elhottova, D., Kuráz, V. and Sourková, M. (2006). Effects of soil macrofauna on other soil biota and soil formation in reclaimed and unreclaimed post mining sites: Results of a field microcosm experiment. Applied Soil Ecology, 33, 308-320.
Fusco, G. (2001). Conceptual modelling of the interaction between transportation, land use and the environment as a tool for selecting sustainability indicators of urban mobility. 12th European Colloquium on Quantitative and Theoretical Geography, St-Valery-en-Caux, France, September 7-11, 2001.
Gallopin, G.C. (1991). Human dimensions of global change: linking the global and the local processes. International Social Science Journal, 130, 707-718.
Gallopin, G.C. (2006). Linkages between vulnerability, resilience and adaptive capacity. Global Environmental Change, 16, 293-303.
Garnier, E., Cortez, J., Billès, G., Navas, M.-L., Roumet, C., Debussche, M., Laurent, G., Blanchars, A., Aubry, D., Bellmann, A., Neill, C., and Toussaint, J.-P. (2004). Plant functional markers capture ecosystem properties during secondary succession. Ecology, 85, 2630-2637.
Gatzweiler, F. and Hagedorn, K. (2002). The evolution of institutions in transition. International Journal of Agricultural Resources, Governance and Ecology, 2(1), 37-58.
Gatzweiler, F., Sipilainen, T., Backman, S. and Zellei, A. (2001). Analysing Institutions, Policies and Framing Systems for Sustainable Agriculture in CEEC Countries in Transition. CEESA Discussion Paper No. 2/3/2001, Humboldt University of Berlin, Chair of Resource Economics, Berlin.
Gaucherand, S. and Lavorel, S. (2007). A new protocol for a quick survey of functional traits values in a plant community. Austral Ecology, 32, 927-936.
Giller, K.E., Beare, M.H., Lavelle, P., Izac, A.-M.N. and Swift, M.J. (1997). Agricultural intensification, soil biodiversity and agroecosystem function. Applied Soil Ecology, 6, 3-16.
Gimingham, C.H. (1972). Ecology of Heathlands. Chapman and Hall, London. Goodsell, J.A. and Kats, L.B. (1999). Effect of introduced mosquitofish on pacific treefrogs
and the role of alternative prey. Conservation Biology, 13, 921-924. Gunderson, L. (2000). Ecological resilience - in theory and application. Annual Review of
Ecological Systems, 31, 425-439. Gunderson, L.H., and Holling, C.S. (eds.) (2002). Panarchy: Understanding Transformations
in Human and Natural Systems. Island Press, Washington DC. Guo, Z., Xiangming, X., and Dianmo, L. (2000). An assessment of ecosystem services: water
flow regulation and hydroelectric power production. Ecological Applications, 10, 925-936.
Guo, Z., Li, Y., Xiao, X., Zhang, L. and Gan, Y. (2007). Hydroelectricity production and forest conservation in watersheds. Ecological Applications, 17(6), 1557-1562.
Haines-Young, R. and Potschin, M. (2007). England’s Terrestrial Ecosystem Services and the Rationale for an Ecosystem Approach. Technical Report, Defra Project Code NR0107, Defra, London.

Review of concepts of dynamic ecosystems and their services 74
Hale, S.S., Paul, J.F. and Heltshe, J.F. (2004). Watershed landscape indicators of estuarine benthic condition. Estuaries, 27, 283-295.
Hanski, I. (1999). Metapopulation Ecology. Oxford University Press, Oxford. Harmon, M.E., Franklin, J.F., Swanson, F.J., Sollins, P., Gregory, S.V., Lattin, J.D., Anderson,
N.H., Cline, S.P., Aumen, N.G., Sedell, J.R., Lienkaemper, G.W., Cromack, K. and Cummins, K.W. (1986). Ecology of coarse woody debris in temperate ecosystems. Advances in Ecological Research, 15, 133-302.
Haslett, J.R., Berry, P.M. and Zobel, M. (2007). European habitat management strategies for conservation: Current regulations and practices with reference to dynamic ecosystems and ecosystem service provision. RUBICODE Deliverable D6.1, European Commission contract 036890; http://www.rubicode.net/rubicode/outputs.html.
Hawksworth, D.J. and Kalin-Arroyo, M. T. (1995). Magnitude and distribution of biodiversity. In: Heywood, V.H. (ed.) Global Biodiversity Assessment. Cambridge University Press, Cambridge, pp. 107-191.
Hedde, M., Lavelle, P., Joffre, R., Jiménez, J.J., Decaëns, T. (2005). Specific functional signature in soil macro-invertebrate biostructures. Functional Ecology, 19(5), 785-793.
Helling, B. and Larink, O. (1998). Contribution of earthworms to nitrogen turnover in agricultural soils treated with different mineral N-fertilizers. Applied Soil Ecology, 9, 319-325.
Hering, D., Johnson, R.K., Kramm, S., Schmutz, S., Szoszkiewicz K. and Verdonschot, P.F.M. (2006). Assessment of European rivers with diatoms, macrophytes, invertebrates and fish: A comparative metric-based analysis of organism response to stress. Freshwater Biology, 51, 1757-1785.
Hodgson, G. (2002). Evolution of institutions: an agenda for future theoretical research. Constitutional Political Economy, 13(2), 111-27.
Holling, C.S. (1973). Resilience and stability of ecological systems. Annual Review of Ecology and Systematics, 4, 1-23.
Holmlund, C.M. and Hammer, M. (1999). Ecosystem services generated by fish populations. Ecological Economics, 29(2), 253-268.
Hooper, D.U., Chapin III F.S., Ewel J.J., Hector A., Inchausti P., Lavorel S., Lawton J.H., Lodge D.M., Loreau M., Naeem S., Schmid B., Setala, H., Symstad, A.J., Vandermeer, J. and Wardle, D.A. (2005). Effects of biodiversity on ecosystem functioning: a consensus of current knowledge. Ecological Monographs, 75, 3-35.
Hougner, C., Colding, J. and Söderqvist, T. (2006). Economic valuation of a seed dispersal service in the Stockholm National Urban Park, Sweden. Ecological Economics, 59, 364-374.
Hughes, F.M. R. (1996). Wetlands. In: Adams, W.M., Goudie, S.A. and Orme, A.R. (eds.) The Physical Geography of Africa. Oxford University Press, Oxford, pp. 267-286.
Huston, M.A. (1997). Hidden treatments in ecological experiments: re-evaluating the ecosystem function of biodiversity. Oecologia, 110, 449-460.
IPCC (2007). Climate Change 2007 – Impacts, Adaptation and Vulnerability. Working Group II contribution to the Fouth Assessment Report of the Intergovernmental Panel on Climate Change, Cambridge University Press, Cambridge.
Ito, A. (2007). Simulated impacts of climate and land-cover change on soil erosion and implication for the carbon cycle, 1901 to 2100. Geophysical Research Letters, 34(9), L09403, doi:10.1029/2007GL029342.
Jackson, R.B., Banner, J.L., Jobbágy, E.G., Pockamn, W.T. and Wall, D.H. (2002). Ecosystem carbon loss with woody invasion of grasslands. Nature, 418, 623-626.
Review of concepts of dynamic ecosystems and their services 75
Jégou, D., Schrader, S., Diestel, H. and Cluzeau, D. (2001). Morphological, physical and biochemical characteristics of burrow walls formed by earthworms. Applied Soil Ecology, 17, 165-174.
Jennings, D.B. and Jarnagin, S.T. (2002). Impervious surfaces and stream flow discharge: a historical perspective in a Mid-Atlantic subwatershed. Landscape Ecology, 17, 471-489.
Jiménez, J.J. and Lal, R. (2006). Mechanisms of C sequestration in soils of Latin America. Critical Reviews in Plant Sciences, 25, 337-365.
Jones, C.G., Lawton, J.H. and Shachak, M. (1994). Organisms as ecosystems engineers. Oïkos, 69, 373-386.
Jones, K.B., Riitters, K.H, Wickham, J.D., Tankersley, R.D.,Jr., O’Neill, R.V., Chaloud, D.J., Smith, E.R. and Neale, A.C. (1997). An Ecological Assessment of the United States Mid-Atlantic Region: A Landscape Atlas. EPA/600/R-97/130, US EPA, Office of Research and Development, Washington DC.
Jones, K.B., Neale, A.C., Wade, T.G., Cross, C.L., Wickham, J.D., Nash, M.S., Edmonds, C.M., Riitters, K.H., O’Neill, R.V., Smith, E.R. and Van Remortel, R. (2006). Multiscale relationships between landscape characteristics and nitrogen concentrations in streams. In: Wu, J., Jones, K.B., Li, H. and Loucks, O.L (eds.) Scaling and Uncertainty Analysis in Ecology: Methods and Applications. Springer, The Netherlands, pp. 205-224.
Jones, M.L.M., Oxley, E.R.B. and Ashenden, T.W. (2002). The influence of nitrogen deposition, competition and desiccation on growth and regeneration of Racomitrium lanuginosum (Hedw.) Brid. Environmental Pollution, 120, 371-378.
Jongman, R.H.G., Bunce, R.G.H., Metzger, M.J., Mucher, C.A., Howard, D.C. and Mateus, V.L. (2006). Objectives and applications of a statistical environmental stratification of Europe. Landscape Ecology, 21, 409-419.
Jouquet, P., Dauber, J., Lagerlöf, J., Lavelle, P. and Lepage, M. (2006). Soil invertebrates as ecosystem engineers: intended and accidental effects on soil and feedback loops. Applied Soil Ecology, 32, 153-164.
Ketterings, Q.M., Blair, J.M. and Marinissen, J.C.Y. (1997). Effects of earthworms on soil aggregate stability and carbon and nitrogen storage in a legume cover crop agroecosystem. Soil Biology and Biochemistry, 29(3/4), 401-408.
Kinzig, A.P., Ryan, P., Etienne, M., Allyson, H., Elmqvist, T. and Walker, B.H. (2006). Resilience and regime shifts: assessing cascading effects. Ecology and Society, 11(1), 20.
Kleyer, M., Biedermann, R., Henle, K., Obermaier, E., Poethke, H-J., Poschlod, P., Schröder, B., Settele, J. and Vetterlein, D. (2007). Mosaic cycles in agricultural landscapes of Northwest Europe. Basic and Applied Ecology, 8, 295-309.
Koehler, H.H. (1999). Predatory mites (Gamasina, Mesostigmata). Agriculture, Ecosystems and Environment, 74, 395-410.
Komonen, A., Penttila, R., Lindgren, M. and Hanski, I. (2000). Forest fragmentation truncates a food chain based on an old-growth forest bracket fungus. Oikos, 90, 119-126.
Kontogianni, A., Skourtos, M.S. and Tsoumas, A. (2008). Review on the dynamics of economic values and preferences for ecosystem goods and services. RUBICODE Deliverable D2.2, European Commission contract 036890; http://www.rubicode.net/rubicode/outputs.html.
Kooistra, M.J., Juo, A.S. and Schoonderbeek, D. (1988). Soil degradation in cultivated alifisols under different management systems in Southern Nigeria. In: Douglas, L.A.

Review of concepts of dynamic ecosystems and their services 76
(ed.) Soil Micromorphology: A Basic and Applied Science. Developments in Soil Science, 19, 61-68.
Körner C. and Spehn, E.M. (eds.) (2002). Mountain Biodiversity: A Global Assessment. Parthenon Publishing, London, New York.
Körner, C. (1999). Alpine Plant Life. Springer, Berlin. Körner, C., Ohsawa, M. et al. (2005). Mountain Systems. In: Hassan, R., Scholes, R. and
Ash, N. (eds.) Ecosystems and Human Well-being: Current State and Trends, Volume 1. Millennium Ecosystem Assessment, Island Press, Washington DC, pp. 681-716.
Kremen, C. (2005). Managing ecosystem services: what do we need to know about their ecology? Ecology Letters, 8, 468-479.
Kremen, C., Williams, N.M. and Thorp, R.W. (2002). Crop pollination from native bees at risk from agricultural intensification. Proceedings of the National Academy of Sciences, 99, 16812-16816.
Kremen, C., Williams, N.M., Bugg, R.L., Fay, J.P. and Thorp, R.W. (2004). The area requirements of an ecosystem service: crop pollination by native bee communities in California. Ecology Letters, 7, 1109-1119.
Kremen, C., Williams, N.M., Aizen, M.A., Gemmill-Herren, B., LeBuhn, G., Minckley, R., Packer, L., Potts, S.G., Roulston, T., Steffan-Dewenter, I., Vázquez, D.P., Winfree, R., Adams, L., Crone, E.E., Greenleaf, S.S., Keitt, T.H., Klein, A-M., Regetz, J. and Ricketts, T.H. (2007). Pollination and other ecosystem services produced by mobile organisms: a conceptual framework for the effects of land-use change. Ecology Letters, 10, 299-314.
Kreuter, U.P., Harris, H.G., Matlock, M.D. and Lacey, R.E. (2001). Change in ecosystem service values in the San Antonio area, Texas. Ecological Economics, 39(3), 333-346.
Kuemmel, B., Langer, V., Magid, J., de Neergaard, A. and Porter, J.R. (1998). Energetic, economic and ecological balances of a combined food and energy system. Biomass and Bioenergy, 15, 407-416.
Landis, D.A., Wratten, S.D. and Gurr, G.M. (2000). Habitat management to conserve natural enemies of arthropod pests in agriculture. Annual Review of Entomology, 45, 175-201.
Langmaack, M., Schrader, S. and Helming, K. (2001). Effect of mesofaunal activity on the rehabilitation of sealed soil surfaces. Applied Soil Ecology, 16, 121–130.
Lavelle, P., Bignell, D. and Lepage, M. (1997). Soil function in a changing world: the role of invertebrate ecosystem engineers. European Journal of Soil Biology, 33, 159-193.
Lavelle, P., Decaëns, T., Aubert, M., Barot, S., Blouin, M., Bureau, F., Margerie, P., Mora, P. and Rossi, J-P. (2006). Soil invertebrates and ecosystem services. European Journal of Soil Biology, 42, 3-15.
Lavelle, P. and Spain, A.V. (2001). Soil Ecology. Kluwer Academic Publishers, The Netherlands, 654 pp.
Le Houérou, H.N. (1996).The role of cacti (Opuntia spp.) in erosion control, land reclamation, rehabilitation and agricultural development in the Mediterranean basin. Journal of Arid Environments, 33, 135-159.
Leonard, J. and Rajot, J.L. (2001). Influence of termites on runoff and infiltration: quantification and analysis. Geoderma, 104, 17-40.
Leopold, A. (1949). A Sand County Almanac and Sketches from Here and There. Oxford University Press, New York, 226 pp.
Lepš, J., de Bello, F., Lavorel, S. and Berman, S. (2006). Quantifying and interpreting functional diversity of natural communities: practical considerations matter. Preslia, 78, 481-501.
Lienhoop, N., Koschel, S. and Settele, J. (2005). The other side of the coin: the economic value of butterfly conservation. In: Settele, J., Kühn, E. and Thomas, J.A. (eds.) Studies

Review of concepts of dynamic ecosystems and their services 77
on the Ecology and Conservation of Butterflies in Europe, Vol. 2: Species Ecology along a European Gradient: Maculinea Butterflies as a Model. Pensoft, Sofia/Moscow, pp. 219-220.
Lobry de Bruyn, L.A. (1999). Ants as bioindicators of soil function in rural environments. Agriculture, Ecosystems and Environment, 74, 425-441.
Löfgren, S. (2003). The color of water. Climate induced water color increase in Nordic lakes and streams due to humus. Nordic Council of Ministers brochure, Oslo.
Loreau, M., Naeem, S., Inchausti, P., Bengtsson, J., Grime, J.P., Hector, A., Hooper, D.U., Huston, M.A., Raffaelli, D., Schmid, B., Tilman, D. and Wardle, D.A. (2001). Biodiversity and ecosystem functioning: current knowledge and future challenges. Science, 294, 804-808.
Lowrance, R.R., Leonard, R. and Sheridan, J. (1984). Managing riparian ecosystems to control nonpoint pollution. Journal Soil Water Conservation, 40, 87-91.
Lozano, J., Virgos, E., Malo, A.F., Huertas, D.L. and Casanovas, J.G. (2003). Importance of scrub-pastureland mosaics for wild-living cats occurrence in a Mediterranean area: implications for the conservation of the wildcat (Felis silvestris). Biodiversity and Conservation, 12(5), 921-935.
Luck, G.W., Daily, G.C. and Ehrlich, P.R. (2003). Population diversity and ecosystem services. Trends in Ecology and Evolution, 18, 331-336.
Ludwig, J.A., Wilcox, B.P., Breshears, D.D., Tongway, D.J. and Imeson, A.C. (2005). Vegetation patches and runoff-erosion as interacting ecohydrological processes in semiarid landscapes. Ecology, 86, 288-297.
Lundberg, G., Kottela, T.M., Smith, G.R., Stiassny, M.L.J. and Gill, A.C. (2000). So many fishes, so little time: an overview of recent ichthyological discovery in continental waters. Annals of the Missouri Botanical Gardens, 87, 26-62.
MA (2005). Ecosystems and Human Well-being: Synthesis. Millennium Ecosystem Assessment, Island Press, Washington DC, 137 pp.
Maes, D., Vanreusel, W., Talloen, W. and Van Dyck, H. (2004). Functional conservation units for the endangered Alcon Blue butterfly, Maculinea alcon, in Belgium (Lepidoptera: Lycaenidae). Biological Conservation, 120, 229-241.
Malhi, Y. and Grace, J. (2000). Tropical forests and atmospheric carbon dioxide. TREE, 15, 332-337.
Maltby, E. (1986). Waterlogged Wealth: Why Waste the World’s Wet Places? Earthscan, IIED, London.
Mando, A. and Miedema, R. (1997). Termite-induced change in soil structure after mulching degraded (crusted) soil in the Sahel. Applied Soil Ecology, 6, 241-249.
Marinissen, J.C.Y. and Didden, W.A.M. (1997). Influence of the enchytraeid worm Buchholzia appendiculata on aggregate formation and organic matter decomposition. Soil Biology and Biochemistry, 29(3/4), 387-390.
Mason, N.W.H., Mouillot, D., Lee, W.G. and Bastow Wilson, J. (2005). Functional richness, functional evenness and functional divergence: the primary components of functional diversity. Oikos, 111, 112-2118.
McGeoch, M. (1998). The selection, testing and application of terrestrial insects as bioindicators. Biological Reviews of the Cambridge Philosophical Society, 73, 181-201.
Médail, F. and Verlaque, R. (1997). Ecological characteristics and rarity of endemic plants from southeastern France and Corsica: implications for biodiversity conservation. Biological Conservation, 80, 269-281.

Review of concepts of dynamic ecosystems and their services 78
Mehaffey, M.H., Nash, M.S., Wade, T.G., Ebert, D.W., Jones, K.B. and Rager, A. (2005). Linking land cover and water quality in New York City’s water supply watersheds. Environmental Monitoring and Assessment, August 2005.
Mertz, O., Ravnborg, H.M., Lovei, G.L., Nielsen, I. and Konijnendijk, C.C. (2007). Ecosystem services and biodiversity in developing countries. Biodiversity Conservation, 16, 2729-2737.
Messerli, B. and Ives, J.D. (1997). Mountains of the World: A global Priority. Parthenon Publishing, Carnforth and New York.
Mitchell, F.J. (2005). How open were European primeval forests? Hypothesis testing using paleoecological data. Journal of Ecology, 93, 168-177.
Mitsch, W.J., Mitsch, R.H. and Turner, R.E. (1994). Wetlands of the old and new worlds: ecology and management. In: Mitsch, W.L. (ed.) Global Wetlands: Old World and New. Elsevier, Amsterdam, pp. 3-56.
Mols, C.M.M. and Visser, M.E. (2002). Great tits can reduce caterpillar damage in apple orchards. Journal of Applied Ecology, 39, 888-899.
Mols, C.M.M. and Visser, M.E. (2007). Great tits (Parus major) reduce caterpillar damage in commercial apple orchards. PLoS One, 2(2), e202.
Moora, M., Kose, M. and Jõgar, Ü. (2007). Optimal management of the rare Gladiolus imbricatus in Estonian coastal meadows indicated by its population structure. Applied Vegetation Science, 10, 161-168.
Mucher, C.A., Bunce, R.G.H., Jongman, R.H.G., Klijn, J.A., Koomen, A.J.M., Metzger, M.J., and Wascher, D.M. 2003. Identification and characterization of environments and landscape in Europe. Alterra Report Number 832, Wageningen, The Netherlands.
Mulas, M. and Mulas, G. (2005). Cultivar selection from rosemary (Rosmarinus officinalis L.) spontaneous populations in the Mediterranean area. Acta Hortorticulturae, 676, 127-133.
Murphy, H.T. and Lovett-Doust, J. (2004). Context and connectivity in plant metapopulations and landscape mosaics: does the matrix matter? Oikos, 105, 3-14.
Naeem, S. (1998). Species redundancy and ecosystem reliability. Conservation Biology, 12, 39-45.
Nagy, L., Grabherr, G., Körner, C. and Thompson, D.B.A. (eds.) (2003). Alpine Biodiversity in Europe. Ecological Studies 167. Springer, Berlin.
Naidoo, R. and Ricketts, T.H. (2006). Mapping the economic costs and benefits of conservation. PLoS Biology, 4(11), e360. DOI: 10.1371/journal.pbio.0040360.
Naiman, R.J., Melillo, J.M. and Hobbie, J.E. (1986). Ecosystem alteration of boreal forest streams by beaver (Castor canadensis). Ecology, 67, 1254-1269.
Naki�enovi�, N., Alcamo, J., Davis, G., de Vries, B., Fenhann, J., Gaffin, S., Gregory, K., Grübler, A., Jung, T.Y., Kram, T., Emilio la Rovere, E., Michaelis, L., Mori, S., Morita, T., Pepper, W., Pitcher, H., Price, L., Riahi, K., Roehrl, A., Rogner, H.-H., Sankovski, A., Schlesinger, M.E., Shukla, P.R., Smith, S., Swart, R.J., van Rooyen, S., Victor, N. and Dadi, Z. (2000). Special Report on Emissions Scenarios. Cambridge University Press, Cambridge.
Naughton-Treves, L., Treves, A., Chapman, C. and Wrangham, R. (1998). Temporal patterns of crop-raiding by primates: linking food availability in croplands and adjacent forest. Journal of Applied Ecology, 35, 596-606.
Navrud, S. (2001). Economic valuation of inland recreational fisheries: empirical studies and their policy use in Norway. Fisheries Management and Ecology, 8, 369-382.
Nelson, G.C., Bennett, E., Asefaw Berhe, A., Cassman, K.G., DeFries, R., Dietz, T., Dobson, A., Dobermann, A., Janetos, A., Levy, M., Marco, D., O’Neill, N., Nakicenovic, R., Norgaard, R., Petschel-Held, G., Ojima, D., Pingali, P., Watson, R. and Zurek, M.
Review of concepts of dynamic ecosystems and their services 79
(2005). Drivers of change in ecosystem condition and services. In: Carpenter, S., Pingali, P.L., Bennett, E.M. and Zurek, M.B. (eds.) Ecosystems and Human Well-being: Scenarios, Volume 2. Millennium Ecosystem Assessment, Island Press, Washington DC, pp. 173-222.
Niklaus, P.A. and Körner, C. (2004). Synthesis of a six-year study of calcareous grassland responses to in situ CO2 enrichment. Ecological Monographs, 74, 491-511.
Nkem, J.N., Lobry de Bruyn, L.A., Grant, C.D., Hulugalle, N.R. (2000). The impact of ant bioturbation and foraging activities on surrounding soil properties. Pedobiologia, 44, 609-62.
Núñez, D., Nahuelhual, L. and Oyarzun, C. (2006). Forests and water: the value of native temperate forests in supplying water for human consumption. Ecological Economics, 58, 606-616.
Öckinger, E. and Smith, H.G. (2007). Semi-natural grasslands as population sources for pollinating insects in agricultural landscapes. Journal of Applied Ecology, 44, 50-59.
O’Connor, R.J., Jones, M.T., White, D., Hunsaker, C., Loveland, T., Jones, B. and Preston, E. (1996). Spatial partitioning of environmental correlates of avian biodiversity in the conterminous United States. Biodiversity Letters, 3, 97-110.
OECD (2002). Handbook of Biodiversity Valuation: A Guide for Policy Makers. ENV/EPOC/GEEI/BIO(2000)2/FINAL, Paris.
Olenick, K.L., Kreuter, U.P. and Conner, J.R. (2005). Texas landowner perceptions regarding ecosystem services and cost-sharing land management programs. Ecological Economics, 53(2), 247-260.
Omari, C.K. (1993). Social and cultural values of wetlands in Tanzania. In: Kamukala, G.L. and Crafter, S.A. (eds.) Wetlands of Tanzania. Proceedings of a Seminar on the Wetlands of Tanzania, Morogoro, Tanzania, 27-20th November 1991. IUCN, Gland, Switzerland, pp. 95-102.
O’Neill, R.V., Krummel, J.R., Gardner, R.H., Sugihara, G., DeAngelis, D.L., Milne, B.T., Turner, M.G., Zygmunt, B., Christensen, S.W., Dale, V.H. and Graham, R.L. (1988). Indices of landscape pattern. Landscape Ecology, 1, 153-62.
Ortiz-Ceballos, A.I., Fragoso, C. and Brown, G.G. (2007). Synergistic effect of a tropical earthworm Balanteodrilus pearsei and velvetbean Mucuna pruriens var. utilis on maize growth and crop production. Applied Soil Ecology, 35, 356-362.
Osborn, F. (1948). Our Plundered Planet. Little, Brown and Company, Boston, 217 pp. Ostrom, E., Schroeder, L. and Wynne, S. (1993). Institutional Incentives and Sustainable
Development: Infrastructure Policies in Perspective, Westview Press, Boulder, CO. Paoletti, M.G. (1999). The role of earthworms for the assessment of sustainability and as
bioindicators. Agriculture, Ecosystems and Environment, 74, 137-155. Paoletti, M.G., Schweigl, U. and Favretto, M.R. (1995). Soil microinvertebrates, heavy
metals and organochlorines in low and high input apple orchards and coppiced woodland. Pedobiologia, 39, 20-33.
Papala, D. and Valentini, R. (2003). A new assessment of European forests carbon exchanges by Eddy fluxes and artificial neural network spatialization. Global Change Biology, 9, 525-535.
Papanastasis, V.P. (2004). Traditional vs contemporary management of Mediterranean vegetation: the case of the island of Crete. Journal of Biology Research, 1, 39-46.
Pardo, O. (2002). Etnobotánica de algunas cactáceas y suculentas del Perú . Chloris Chilensis Año 5. N8 1. http://www.chlorischile.cl.
Pawlowski, B. (1970). Remarques sur l’endémisme dans la flore des Alpes et des Carpates. Vegetatio 21, 181-243.

Review of concepts of dynamic ecosystems and their services 80
Pedroli, B., Pinto-Correia, T. and Cornish, P. (2006). Landscape – what’s in it? Trends in European landscape science and priority themes for concerted research. Landscape Ecology, 21, 421-430
Perevolotsky, A. and Seligman, N.G. (1998). Role of grazing in Mediterranean rangeland ecosystems - Inversion of a paradigm. Bioscience, 48(12), 1007-17.
Petchey, O.L. and Gaston, K.J. (2006). Functional diversity: back to basics and looking forward. Ecology Letters, 9(6), 741-758.
Petchey, O.L., Hector, A. and Gaston, K.J. (2004). How do different measures of functional diversity perform? Ecology, 85, 847-857.
Peterjohn, B.G. and Sauer, J.R. (1999). Population status of North American species of grassland birds from the North American breeding bird survey, 1966-1996. Studies of Avian Biology, 19, 27-44.
Peters, D.P.C., Gosz, J.R., Pockman, W.T., Small, E.E., Parmenter, R.R., Collins, S. and Muldavin, E. (2006). Integrating patch and boundary dynamics to understand and predict biotic transitions at multiple scales. Landscape Ecology, 21, 19-33.
Picart E. and Fleury P. (1999). Valorisation de l’herbe dans le canton de La Grave. Villar d’Arène, Groupement Scientifique des Alpes du Nord, 21 pp + annexes.
Planta Europa and Council of Europe (2002). European Plant Conservation Strategy. Council of Europe, Strasbourg.
Platis, P.D. and Papanastasis, V.P. (2003). Relationship between shrub cover and available forage in Mediterranean shrublands. Agroforestry Systems, 57(1), 57-65.
Poschlod, P. and WallisDeVries, M.F. (2002). The historical and socio-economic perspective of calcareous grasslands: lessons from the distant and recent past. Biological Conservation, 104, 361-376.
Poschlod, P., Bakker, J.P. and Kahmen, S. (2005). Changing land use and its impact on biodiversity. Basic and Applied Ecology, 6, 93-98.
Postel, S. and Carpenter, S. (1997). Freshwater Ecosystem Services In: Nature’s Services: Societal Dependence on Natural Ecosystems. Island Press, Washington DC. pp. 195-214.
Postma-Blaaw, M.B., Bloem, J., Faber, J.H., van Groenigen, J.W., de Goede, R.G.M., Brussaard, L. (2006). Earthworm species composition affects the soil bacterial community and net nitrogen mineralization. Pedobiologia, 50, 243-256.
Potts, S.G., Petanidou, T., Roberts, S., O'Toole, C., Hulbert, A. and Willmer, P. (2006). Plant-pollinator biodiversity and pollination services in a complex Mediterranean landscape. Biological Conservation, 129 (4), 519-529.
Preiss, E., Martin, J-L. and Debussche, M. (1997). Rural depopulation and recent landscape changes in a Mediterranean region: consequences to the breeding avifauna. Landscape Ecology, 12, 51-61.
Prentice, H.C., Lönn, M., Rosquist, G., Ihse, M. and Kindström, M. (2006). Gene diversity in a fragmented population of Briza media: grassland continuity in a landscape context. Journal of Ecology, 94, 87-97.
Prentice, H.C., Lönn, M., Lager, H., Rosén, E. and van der Maarel, E. (2000). Changes in allozyme frequencies in Festuca ovina populations after a 9-year nutrient-water experiment. Journal of Ecology, 88, 331-347.
Pysek, P., Sadlo, J. and Mandak, B. (2002). Catalogue of alien plants of the Czech Republic. Preslia, 74, 97-186.
Pywell, R.F., Bullock, J.M., Hopkins, A., Walker, K.J., Sparks, T.H., Burke, M.J.W. and Peel, S. (2002). Restoration of species-rich grassland on arable land: assessing the limiting processes using a multi-site experiment. Journal of Applied Ecology, 39, 294-309.

Review of concepts of dynamic ecosystems and their services 81
Quétier, F., Thébault, A. and Lavorel, S. (2007a). Linking vegetation and ecosystem response to complex past and present land use changes using plant traits and a multiple stable state framework. Ecological Monographs, 77, 33-52.
Quétier, F., Lavorel, S., Thuiller, W. and Davies, I.D. (2007b). Plant trait-based assessment of ecosystem service sensitivity to land-use change in mountain grasslands. Ecological Applications, 17, 2377–2386.
Rammel, C., Stagl, S. and Wilfing, H. (2007). Managing complex adaptive systems: a co-evolutionary perspective on natural resource management. Ecological Economics, 63, 9-21.
Rapport, D. and Friend, A. (1979). Towards a Comprehensive Framework for Environmental Statistics: A Stress-response Approach. Statistics Canada Catalogue 11-510. Minister of Supply and Services Canada, Ottawa.
Rapport, D., Gaudet, C., Karr, J.R., Baron, J.S., Bohlenli, C., Jackson, W., Jones, B., Naiman, R.J., Norton, B. and Pollock, M.M., IIII. (1998). Evaluating landscape health: integrating societal goals and biophysical process. Journal of Environmental Management, 53, 1-15.
Reed, J.M., Murphy D.D. and Brussard P.F. (1998). Efficacy of population viability analysis. Wildlife Society Bulletin, 26(2), 244-251.
Reiners, W.A. and Driese, K.L. (2001). The propogation of ecological influences through heterogeneous environmental space. BioScience, 51, 939-950.
Ricketts, T.H. (2001). The matrix matters: effective isolation in fragmented landscapes. American Naturalist, 158, 87-99.
Ricketts, T.H., Daily, G.C., Ehrlich, P.R. and Michener, C.D. (2004). Economic value of tropical forest to coffee production. Proceedings of the National Academy of Sciences, 101, 12579-12582.
Righelato, R. and Spracklen, D. (2007). Carbon mitigation by biofuels or by saving and restoring forests? Science, 317, 902.
Roberts, N. (1988). Dambos in development: management of a fragile ecological resource. Journal of Biogeography, 15, 141-148.
Robinson, R.A. and Sutherland, W.J. (2002). Post-war changes in arable farming and biodiversity in Great-Britain. Journal of Applied Ecology, 30, 157-176.
Robinson, S.K., Thompson, F.R., III, Donovan, T.M., Whitehead, D.R. and Faaborg, J. (1995). Regional forest fragmentation and the nesting success of migratory birds. Science, 267, 1987-90.
Rodriguez, L.C., Pascual, U. and Niemeyer, H.M. (2006). Local identification and valuation of ecosystem goods and services from Opuntia scrublands of Ayacucho, Peru. Ecological Economics, 57(1), 30-44.
Rogers, L.E., Fitzner, R.E., Cadwell, L.L. and Vaughan, B.E. (1988). Terrestrial animal habitats and responses. In: Rickard, W.H., Rogers, L.E., Vaughan, B.E. and Liebetrau, S.F. (eds.) Shrub steppe balance and change in a semi-arid terrestrial ecosystem, Elsevier, Amsterdam.
Roggeri, H. (1998). Tropical Freshwater Wetlands: A Guide to Current Knowledge and Sustainable Management. Kluwer Academic Publishers, Dordrecht.
Rogosic, J., Pfister, J.A., Provenza, F.D. and Grbesa, D. (2006). Sheep and goat preference for and nutritional value of Mediterranean maquis shrubs. Small Ruminant Research, 64(1-2), 169-179.
Röhrig, R., Langmaack, M., Schrader, S. and Larink, O. (1998). Tillage systems and soil compaction: their impact on abundance and vertical distribution of Enchytraeidae. Soil Tillage Research, 46, 117-127.

Review of concepts of dynamic ecosystems and their services 82
Rollins, D., Bryant, F.C., Waid, D.D. and Bradley, L.C. (1988). Deer response to brush management in Central Texas. Wildlife Society Bulletin, 16, 277- 284.
Romero, N., Gresswell, R.E. and Li, J.L. (2005). Changing patterns in coastal cutthroat trout (Oncorhynchus clarki clarki) diet and prey in a gradient of deciduous canopies. Canadian Journal of Fisheries and Aquatic Sciences, 62(8), 1797-1807.
Rook A.J., Dumont B., Isselstein J., Osoro K., WallisDeVries M.F., Parente G., Mills J. (2004). Matching type of livestock to desired biodiversity outcomes in pastures – a review. Biological Conservation, 119, 137–150.
Rosen, E. and Borgegard, S.O. (1999). The open cultural landscape. Acta Phytogeographica Suecica, 84, 113-134.
Rosenfeld, J.S. (2002). Functional redundancy in ecology and conservation. Okios, 98(1), 156-162.
Rounsevell, M.D.A., Ewert, F., Reginster, I., Leemans, R. and Carter, T.R. (2005). Future scenarios of European agricultural land use. II: Projecting changes in cropland and grassland. Agriculture, Ecosystems and Environment, 107, 117-135.
Running, S.W., Nemani, R.R., Heinsch, F.A., Zhao, M., Reeves, M. and Hashimoto, H. (2004). A continuous satellite-derived measure of global terrestrial primary production. BioScience, 54, 547-560.
Safriel, U., Adeel, Z., Niemeijer, D., Puigdefabregas, J., White, R., Lal, R., Winslow, M., Ziedler, J., Prince, S., Archer, E., King, C., Shapiro, B., Wessels, K., Nielsen, T., Portnov, B., Reshef, I., Thonell, J., Lachman, E. and McNab, D. (2005). Dryland systems. In: Hassan, R., Scholes, R. and Ash, N. (eds.) Ecosystems and Human Well-being: Current State and Trends, Volume 1. Millenium Ecosystem Assessment, Island Press, Washington DC, pp. 623-664.
Sahin, V. and Hall, M. (1996). The effects of afforestation and deforestation on water yields. Journal of hydrology, 178, 293-309.
Sala, O.E., Chapin, F.S., Armesto, J.J., Berlow, R., Bloomfield, J., Dirzo, R., Huber-Sanwald, E., Huenneke, L.F., Jackson, R.B., Kinzig, A., Leemans, R., Lodge, D., Mooney, H.A., Oesterheld, M., Poff, N.L., Sykes, M.T., Walker, B.H., Walker, M. and Wall, D.H. (2000). Global biodiversity scenarios for the year 2100. Science, 287, 1770-1774.
Sampson, R.N., Bystriakova, N., Brown, S., Gonzalez, P., Irland, L.C., Kauppi, P., Sedjo, R., Thompson, I.D., Barber, C.V. and Offrell, R. (2005). Timber, Fuel and Fiber. In: Hassan, R., Scholes, R. and Ash, N. (eds.) Ecosystems and Human Well-being: Current State and Trends, Volume 1. Millenium Ecosystem Assessment, Island Press, Washington DC, pp. 243-269.
Sarmiento, G. and Pinillos, M. (2000). A conceptual model relating ecological constraints to livestock production in tropical American seasonal savannas. In: Mander, Ü and Jongman, R.H.G. (eds.) Consequences of Land Use Change. WIT Press, Advances in Ecological Sciences 5, pp. 295-314.
Schaffer, M.L. (1981). Minimum population sizes for species conservation. BioScience, 31(2), 131-134.
Scheffer, M., Carpenter, S.R., Foley, J., Folke, C. and Walker, B.H. (2001). Catastrophic shifts in ecosystems. Nature, 413, 591-596.
Scheu, S. (2003). Effects of earthworms on plant growth: patterns and perspectives. Pedobiologia, 47, 846-856.
Schrader, S., Langmaack, M. and Helming, K. (1997). Impact of Collembola and Enchytraeidae on soil surface roughness and properties. Biology of Fertile Soils, 25, 396-400.

Review of concepts of dynamic ecosystems and their services 83
Schwartz, M.W., Brigham, C.A., Hocksema, J.D., and Kyons, K.G. (2000). Linking biodiversity to ecosystem function: implications for conservation ecology. Oecologia, 122, 297-305.
Scoones, I. (1991). Wetlands in Drylands: The Agro-ecology of Savannah Systems in Africa. IIED Drylands programme, London.
Scott, M.J., Bilyard, G.R., Link, S.O., Ulibarri, C.A., Westerdahl, H.E., Ricci, P.F. and Seely, H.E. (19980. Valuation of ecological resources and functions. Environmental Management, 22(1), 49-68.
Settele, J. and Henle, K. (2003). Grazing and cutting regimes for old grassland in temperate zones. In: Gherardi, F., Corti, C. and Gualtieri, M. (eds.) Biodiversity Conservation and Habitat Management. Encyclopedia of Life Support Systems (EOLSS; chapter E1-67-03-02), Developed under the Auspices of the UNESCO, Eolss Publishers, Oxford. [http://www.eolss.net; Internet-version 11pp.]
Settele, J., Kühn, E. and Thomas, J.A. (2005). Studies on the Ecology and Conservation of Butterflies in Europe, Vol. 2: Species Ecology along a European Gradient: Maculinea Butterflies as a Model. Pensoft, Sofia/Moscow. 289 pp.
Shiklomanov, I.A. and Rodda, J. (2003). World Water Resources at the Beginning of the 21st Century, UNESCO, Paris.
Schipper, L.A., Baisden, W.T., Parfitt, R.L., Ross, C., Claydon, J.J. and Greg, A. (2007). Large losses of soil C and N from soil profiles under pasture in New Zealand during the past 20 years. Global Change Biology, 13(6), 1138-1144.
Shiraishi, H., Enami Y. and Okano, S. (2003). Folsomia hidakana (Collembola) prevents damping-off disease in cabbage and Chinese cabbage by Rhizoctonia solani. Pedobiologia, 47, 33-38.
Sipos, P., Németh, T., Mohai, I. and Dódony, I. (2005). Effect of soil composition on adsorption of lead as reflected by a study on a natural forest soil profile. Geoderma, 124, 363-374.
Skórka, P., Settele, J. and Woyciechowski, M. (2007). Effects of management cessation on grassland butterflies in southern Poland. Agriculture, Ecosystems and Environment 121, 319-324.
Slonecker, E.T., Jennings, D.B. and Garofalo, D. (2001). Remote sensing of impervious surfaces: a review. Remote Sensing Reviews, 20, 1231-1242.
Smallwood, K.S. (2001). Linking habitat restoration to meaningful units of animal demography. Restoration Ecology, 9, 253-61.
Smit, B. and Wandel, J. (2006). Adaptation, adaptive capacity and vulneability. Global Environmental Change, 16(3), 282-292.
Smith, V.C. and Bradford, M.A. (2003). Litter quality impacts on grassland litter decomposition are differently dependent on soil fauna across time. Applied Soil Ecology, 24, 197-203.
Soerjani, M. (1992). Utilisation of wetland plant resources by rice farmers in Indonesia. In: Maltby, E., Dugan, P.J. and Lefeuvre, J.C. (eds.) Conservation and Development: The Sustainable Use of Wetland Resources. Proceedings of the Third International Wetlands Conference, Rennes, France, 19-23 September 1988, IUCN, Gland, Switzerland, pp. 21-29.
Solomon, M., Van Jaarsveld, A.S. et al. (2003). Conservation targets for viable species assemblages? Biodiversity and Conservation, 12, 2435-2441. Soussana, J.F. and Luscher, A. (2007). Temperate grasslands and global atmospheric change:
a review. Grass and Forage Science, 62, 127-134. Spellman, F.R. and Drinan, J.E. (2001). Stream Ecology and Self-Purification. An
Introduction. 2nd edition. Technomic Publishing Co. Inc., Lancaster, PA, USA, 261 pp.

Review of concepts of dynamic ecosystems and their services 84
Srivastava, D.S. and Vellend, M. (2005). Biodiversity-ecosystem function research: is it relevant to conservation? Annual Review of Ecology Evolution and Systematics, 36, 267-94.
Steele, J.H. (1991). Marine functional diversity. BioScience, 41(7), 470-474. Stewart, G.B., Coles, C.F. and Pullin, A.S. (2005). Applying evidence-based practice in
conservation management: lessons from the first systematic review and dissemination projects. Biological Conservation, 126(2), 270-278.
Stirling, A. (2007). Resilience, robustness, diversity: dynamic strategies for sustainability. Abstracts, 7th International Conference of the European Society for Ecological Economics, Leipzig, Germany, 5-8th June 2007.
Stroosnijder, L. and Hoogmoed, W.G. (1984). Crust formation on sandy soils in the Sahel, II: Tillage and its effects on the water balance. Soil Tillage Research, 4, 321-337.
Storkey, J. (2006). A functional group approach to the management of UK arable weeds to support biological diversity. Weed Research, 46, 513-522.
Strunk, H. (2003). Soil degradation and overland flow as causes of gully erosion on mountain pastures and in forests. Catena, 50, 185-198.
Svarstad, H., Petersen, K.L., Rothman, D., Siepel, H. and Watzold, F. (2007). Discursive biases of the environmental research framework DPSIR. Land use Policy, 25, 116-125.
Svenning, J.C. (2002). A review of natural vegetation openness in north-western Europe. Biological Conservation, 104, 133-148.
Tasser, E. and Tappeiner, U. (2002). Impact of land use changes on mountain vegetation. Applied Vegetation Science, 5, 173-184.
Tesfaye, M., Dufault, N.S., Dornbusch, M.R., Allan, D.L., Vance, C.P. and Samac, D.A. (2003). Influence of enhanced malate dehydrogenase expression by alfalfa on diversity of rhizobacteria and soil nutrient availability. Soil Biology and Biochemistry, 35, 1103-1113.
Thomas, J.A. and Settele, J. (2004). Evolutionary biology: butterfly mimics of ants. Nature, 432, 283-284.
Tilman, D. (1996). Biodiversity: population versus ecosystem stability. Ecology, 77, 350-363.
Tilman, D. (2001). Functional diversity. In: Levin, S.A. (ed.) Encyclopedia of Biodiversity, Volume 3. Academic Press, San Diego, CA, pp. 109-120.
Tilman, D., Reich, P.B., Knops, J., Wedin, D., Mielke, T. and Lehman, C. (2001). Diversity and productivity in a long-term grassland experiment. Science, 294, 843-845.
Tilman, D., Reich, P.B. and Knops, J.M.H. (2006). Biodiversity and ecosystem stability in a decade-long grassland experiment. Nature, 441, 629-632.
Tirri, R., Lehtonen, J., Lemmetyinen, R., Pihakaski, S. and Portin, P. (1998). Elsevier’s Dictionary of Biology. Elsevier, Amsterdam.
Traill, L.W., Bradshaw C.J.A. and Brook, B.W. (2007). Minimum viable population size: a meta-analysis of 30 years of published estimates. Biological Conservation, 139, 159- 166.
Tscharntke, T., Klein, A.M., Kruess, A., Steffan-Dewenter, I. and Thies, C. (2005). Landscape perspectives on agricultural intensification and biodiversity: ecosystem service management. Ecology Letters, 8, 857-874.
Tubelis, D., Lindenmayer, D.B. and Cowling, A. (2004). Novel patch-matrix interactions: patch width influences matrix use by birds. Oikos, 107, 634-644.
Turner, B. (1994). Small-scale irrigation in developing countries. Land Use Policy, 11, 4, 251-261.
Turner, M.G. (1989). Landscape ecology: the effect of pattern on process. Annual Reviews Ecological Systems, 20, 171-197.

Review of concepts of dynamic ecosystems and their services 85
Urban, D. and Keitt, T. (2001). Landscape connectivity: a graph-theoretic perspective. Ecology, 82, 1205-1218.
Valladares, G., Salvo, A. and Cagnolo, L. (2006). Habitat fragmentation effects on trophic processes of insect-plant food webs. Conservation Biology, 20, 212-217.
van Camp, L., Bujarrabal, B., Gentile, A-R., Jones, R.J.A., Montanarella, L., Olazabal, C. and Selvaradjou, S-K. (2004). Reports of the Technical Working Groups Established under the Thematic Strategy for Soil Protection. EUR 21319 EN/3, 872 pp. Office for Official Publications of the European Communities, Luxembourg.
van den Berg, L.J.L., Bullock, J.M., Clarke, R.T., Langston, R.H.W. and Rose, R.J. (2001). Territory selection by the Dartford warbler (Sylvia undata) in Dorset, England: the role of vegetation type, habitat fragmentation and population size. Biological Conservation, 101(2), 217-228.
van der Maarel, E. (2005). Vegetation Ecology. Blackwell, Oxford. van Dijk, G. (1991). The status of semi-natural grasslands in Europe. In: Goriup, P.D. (ed.)
The Conservation of Lowland Dry Grassland Birds in Europe. JNCC Publication, Newbury, pp. 15-36.
Vanderdeelen, J. (1995). Phosphate immobilization in an uncropped field experiment on a calcareous soil. Plant and Soil, 171, 209-215.
Vannote, R.L., Minshall, G.W., Cummins, K.W., Sedell, J.R. and Cushing, C.E. (1980). The river continuum concept. Canadian Journal of Fisheries and Aquatic Sciences, 37, 130-137.
Varennes, A. de (2003). Produtividade dos Solos e Ambiente. Escolar Editora, Lisboa, 490 pp.
Varon, E.H., Eigenbrode, S.D., Bosque-Perez, N.A. and Hilje, L. (2007). Effect of farm diversity on harvesting of coffee leaves by the leaf-curring ant Atta cephalotes. Agricultural and Forest Entomology, 9, 47-55.
Vilà, M., Burriel J.A., Pino, J., Chamizo. J., Llach, E., Porterias. M.and Vives, M. (2003). Association between Opuntia spp. invasion and changes in land-cover in the Mediterranean region. Global Change Biology, 9, 1234-1239.
Villenave, C., Charpentier, F. Lavelle, P., Feller, C., Brussaard, L., Pashanasi, B., Barois, I., Albrecht, A. and Patrón, J.C. (1999). Effects of earthworms on soil organic matter and nutrient dynamics following earthworm inoculation in field experimental situations. In: Lavelle, P., Brussaard, L. and Hendrix, P. (eds.) Earthworm Management in Tropical Agroecosystems. CABI Publishing, Oxon, pp. 173-197.
Violle, C., Navas, M.-L., Vile, D., Kazakou, E., Fortunel, C., Hummel, I. and Garnier, E. (2007). Let the concept of the trait be functional. Oikos, 116, 882-892.
Vogt, W. (1948). Road to Survival. William Sloan, New York, 335 pp. Voinov, A., Costanza, R., Boumans, R.M.J., Maxwell, T. and Voinov, H. (2004). Patuxent
landscape model: integrated modeling of a watershed. In: Costanza, R. and Voinov, A. (eds.) Landscape Simulation Modeling. Springer-Verlag, New York, pp. 197-232.
Vörösmarty, C.J., Lévêque, C., Revenga, C., Bos, R., Caudill, C., Chilton, J., Douglas, E.M., Meybeck, M., Prager, D., Balvanera, P., Barker, S., Maas, M., Nilsson, C., Oki, T. and Reidy, C.A. (2005). Fresh Water. In: Hassan, R., Scholes, R. and Ash, N. (eds.) Ecosystems and Human Well-being: Current State and Trends, Volume 1. Millennium Ecosystem Assessment, Island Press, Washington DC, pp. 165-207.
Walker, B.H. (1992). Biodiversity and ecological redundancy. Conservation Biology, 6, 18-23.
Walker, B.H. (1995). Conserving biological diversity through ecosystem resilience. Conservation Biology, 9, 747-752.
Wallace, J.B. and Webster, J.R. (1996). The role of macroinvertebrates in stream ecosystem
Review of concepts of dynamic ecosystems and their services 86
functions. Annual Review of Entomolgy, 41, 115-139. Wallace, K.J. (2007). Classification of ecosystem services: problems and solutions.
Biological Conservation, 139, 235-246. WallisDeVries, M.F., Poschlod, P. and Willems, J.H. (2002). Challenges for the conservation
of calcareous grasslands in northwestern Europe: integrating the requirements of flora and fauna. Biological Conservation, 104, 265-273.
Ward, J.V., Tockner, K. and Schiemer, F. (1999). Biodiversity of floodplain river ecosystems: ecotones and connectivity. Regulated Rivers – Research & Management, 15(1-3), 125-139.
Ward, J.V., Tockner, K., Arscott, D.B. and Claret, C. 2002. Riverine landscape diversity. Freshwater Biology, 47, 517–539.
Wascher, D.M. (ed.) (2005). European Landscape Character Areas: Topologies. Cartography and Indicators for the Assessment of Sustainable Landscapes. Final Project Report for the European Union’s FP5 Landscape Character Assessment Initiative (ELCAI). 150 pp.
Wessel, W.W., Tietema, A., Beier, C., Emmett, B.A., Penuelas, J. and Riis-Nielsen, T. (2004). A qualitative ecosystem assessment for different shrublands in western Europe under impact of climate change. Ecosystems, 7(6), 662-671.
Wickham, J.D. and Norton, D. (1994). Mapping and analyzing landscape pattern. Landscape Ecology, 9, 7-23.
Wiens, J.A. (1995). Landscape mosaics and ecological theory. In: Hansson, L. Fahrig, L. and Merriam, G. (eds.) Mosaic Landscapes and Ecological Processes. Chapman and Hall, London, pp. 1-26.
Wiens J.A., Schooley, R.L. and Weeks, R.D., Jr. (1997). Patchy landscapes and animal movements: do beetles percolate? Oikos, 78, 257-64.
Willems, J.H. (2001). Problems, approaches and results in restoration of Dutch calcareous grassland during the last 30 years. Restoration Ecology, 9, 147-154.
Williams, M. (1991). The human use of wetlands. Progress in Human Geography, 15(1), 1-22.
Wratten, S.D., van Emden, H.F. and Thomas, M.B. (1998). Within-field and border refugia for the enhancement of natural enemies. In: Pickett, C.H. and Bugg, R.L. (eds.) Enhancing Biological Control: Habitat Management to Promote Natural Enemies of Agricultural Pests. University of California Press, Berkeley, pp. 375-404.
Xue, D. and Tisdell, C. (2001). Valuing ecological functions of biodiversity in Changbaishan Mountain Biosphere Reserve in Northeast China. Biodiversity and Conservation, 10(3), 467-481.
Yachi, S. and Loreau, M. (1999). Biodiversity and ecosystem functioning in a fluctuating environment: the insurance hypothesis. PNAS, 96, 1463-1468.
Yeates G.W. and Bongers, T. (1999). Nematode diversity in agroecosystems. Agriculture, Ecosystems and Environment, 74, 113-135.
Zaehle, S., Bondeau, A., Cramer, W., Erhard, M., Prentice, I.C., Sitch, S., Smith, B., Smith, P.C. and Sykes M.T. (2007). Projected changes in terrestrial carbon storage in Europe under climate and land-use change, 1990-2100. Ecosystems, 10, 380-401.
Zehnder, G., Gurr, G.M., Kühne, S., Wade, M.R., Wratten, S.D. and Wyss, E. (2007). Arthropod pest management in organic crops. Annual Review of Entomology, 52, 57-80.
Zobel, M. (1985). Ecology of alvar soils in the coastal zone of Baltic Sea. Soviet Journal of Soil Sciences, 12, 14-23.
Zwick, P. (1992). Stream habitat fragmentation - a threat to biodiversity. Biodiversity and Conservation, 1, 80-97.

Review of concepts of dynamic ecosystems and their services 87
Appendix I: RUBICODE Glossary
This document is a combination of existing published definitions and RUBICODE-generated definitions. If taken verbatim from a published definition, reference is given. This document remains open to discussion, and some specific discussion points are noted. BIODIVERSITY The variety of living organisms and the ecological complexes of which they are part. This includes diversity within and among species and diversity within and among ecosystems. (Adapted from MA, 2005) SUSTAINABLE USE The use of components of biological diversity in a way and at a rate that does not lead to the long-term decline of biodiversity, thereby maintaining its potential to meet the needs and aspirations of present and future generations. (Convention on Biological Diversity, 1992) ECOSYSTEM A dynamic complex of plant, animal and micro-organism communities and their non-living environment interacting as a functional unit. (Convention on Biological Diversity) Humans, where present, are an integral part of ecosystems. DYNAMIC ECOSYSTEM The concept of a dynamic ecosystem, central to RUBICODE, acknowledges the temporal and spatial variability in ecosystem characteristics due to natural or anthropogenic changes affecting the organisms individually or collectively, and hence the reality that a given ecosystem service cannot be maintained indefinitely at a given location. However, as all ecosystems are dynamic, the term is somewhat redundant and just serves as a reminder that a static approach to conservation will have limited usefulness. ECOSYSTEM DYNAMICS Ecosystem change in space and time resulting from the effect of external and internal forces on ecological functions There may be continual change in biotic composition and structure at specific localities. Collectively, these changes may represent internal flux, or substantive and permanent alteration of the ecosystem regionally. HABITAT The place or type of site where an organism or population naturally occurs. (Convention on Biological Diversity, 1992) LANDSCAPE Heterogeneous mosaics of habitat patches, physical conditions or other spatially variable elements viewed at scales relevant to the organisms or processes under consideration. (Adapted from Wiens, 1995) LANDSCAPE ECOLOGY The study of how the complexity of spatial structure of landscapes affects ecological patterns and processes over any given range of scales. (Adapted from Wiens, 1995)

Review of concepts of dynamic ecosystems and their services 88
CORRIDOR Linear landscape structures that link similar landscape elements and facilitate movement of organisms between them. (Adapted from Wiens, 1995) POPULATION A group of organisms, all of the same species, which occupies a particular area (a geographic population), is genetically distinct (genetic population) or fluctuates synchronously (demographic population) BIOME The largest unit of ecosystem classification that it is convenient to recognise below the entire globe. Terrestrial biomes are typically based on dominant vegetation structure (e.g., forest, grassland). Ecosystems within a biome function in a broadly similar way, although they may have very different species composition. For example, all forests share certain properties regarding nutrient cycling, disturbance and biomass that are different from the properties of grasslands. COMMUNITY (= ASSEMBLAGE) Any grouping of populations of different organisms found living together in a particular environment; essentially the biotic component of an ecosystem (Based on Allaby, 1994) ECOSYSTEM PROCESSES The interactions (events, reactions or operations) among biotic and abiotic elements of ecosystems that lead to a definite result (Tirri et al., 1998; Wallace, 2007) ECOSYSTEM FUNCTION Redundant term synonymous with Ecosystem Processes (Wallace, 2007) For discussion. Many RUBICODERS do not agree that this term is redundant. This needs a rethink. ECOSYSTEM SERVICES Benefits that humans obtain from ecosystems that support, directly or indirectly, their survival and quality of life These include provisioning, regulating and cultural services that directly affect people, and the supporting services needed to maintain the direct services. (Enlarged from MA, 2005) PROVISIONING SERVICE Products obtained from ecosystems (MA, 2005) REGULATING SERVICE Benefits obtained from regulation of ecosystem processes (MA, 2005) CULTURAL SERVICE Non-material benefits obtained from ecosystems (MA, 2005)

Review of concepts of dynamic ecosystems and their services 89
SUPPORTING SERVICE Services necessary for the production of all other ecosystem services (MA, 2005) ECOSYSTEM SERVICE PROVIDER (ESP) An organism, species, functional group, population or community, or trait attributes (defined below) thereof, that contributes to ecosystem service provision and hence to an SPU SERVICE-PROVIDING UNIT (SPU) The total collection of organisms and their trait attributes required to deliver a given ecosystem service at the level needed by service beneficiaries The SPU must be quantified in terms of metrics such as abundance, phenology and distribution. For discussion. The definition of an ecosystem includes non-living aspects of the environment such as rock structure and topography. The SPU definition only relates to biodiversity, and thus assumes that supporting structures (abiotic conditions and physical structures) are suitable. For discussion. It is important to define the level of service required. If it is simply `the more the better’ it is impossible to define an SPU. There needs to be a level of service that is considered the minimum adequate. Where there is a threshold relationship between biodiversity and service level, defining an SPU may be easier than where the service increases in proportion to the providers. For discussion. The need for resilience needs taking into account. For discussion. Defining SPUs from a functional (rather than species) perspective. Functional diversity is the part of biodiversity that provides the service of interest because of a particular trait attribute composition. Consequently WP5 will define SPUs as: `The collection of trait attributes required to deliver a given ecosystem service at the level needed by service beneficiaries’. This is proposed as a generic definition of SPUs applicable in all cases except when the service of interest is provided by a single species, although even within species there will be genetic variation, so this definition can still apply. Even a monoculture is only a special and simplified case. SPUs may therefore be quantified by any of the metrics of functional diversity (defined below), by a specific syndrome, or by a combination of otherwise independent trait attributes. Understanding service provision from a functional perspective is seen as a necessary condition to track and predict the dynamics of services linked to species’ trait attributes. ECOSYSTEM SERVICE ANTAGONISER (ESA) An organism, species, functional group, population or community, or trait attributes thereof, which interferes with ecosystem service provision Such interference may be direct (e.g. through eating the provider) or indirect (e.g. through competition for resources or through direct interference with organisms that support ESPs). (SERVICE-ANTAGONISING UNIT) This term will not be used as it is virtually intractable. Following the definition of an SPU, it would be ` The total collection of organisms and their trait attributes required to disrupt delivery of a given ecosystem service at the level needed by service beneficiaries’. However, this will depend on whether the service is only just adequately being provided (i.e. there is an SPU but no excess ESPs) or whether some ESPs can be lost without losing the SPU.

Review of concepts of dynamic ecosystems and their services 90
FUNCTIONAL TRAIT A feature of an organism, which has demonstrable links to the organism’s function As such, a functional trait determines the organism’s response to pressures (RESPONSE TRAIT), and/or its effects on ecosystem processes or service (EFFECT TRAIT). Functional traits are considered as reflecting adaptations to variation in the physical and biotic environment and trade-offs (ecophysiological and/or evolutionary) among different functions within an organism. In plants, functional traits include morphological, ecophysiological, biochemical and regeneration traits, including demographic traits (at population level). In animals, these traits are combined with life-history and behavioural traits (e.g. guilds, organisms that use similar resources-habitats). FUNCTIONAL TRAIT ATTRIBUTE The value/state of a functional trait It may be categorical (e.g. C3 vs C4 for plant photosynthetic pathway) or quantitative. FUNCTIONAL GROUP A group of species with similar functional trait attributes Groups can be associated with similar responses to pressures and/or effects on ecosystem processes. A functional group is often referred to as ‘guild’, especially when referring to animals, e.g. the feeding types of aquatic organisms having the same function within the trophic chain: the group (guild) of shredders or grazers. FUNCTIONAL SYNDROME A suite of co-occurring trait attributes, sometimes associated with particular environmental conditions or processes FUNCTIONAL DIVERSITY The range, actual values and relative abundance of functional trait attributes (Díaz & Cabido, 2001; Díaz et al., 2007) This distribution can be characterised by different metrics, including the weighted average, and different indices of functional diversity (See Petchey et al. 2004 for a review). The most relevant metrics are as follows.
COMMUNITY WEIGHTED MEAN (also called aggregated mean or community weighted average) The mean of trait attributes in the community, weighted by the relative abundance of the species or populations carrying each value (Garnier et al., 2004; Violle et al., 2007) It is usually calculated as the mean across species of their trait values weighted by their relative abundances (i.e. the mean across individuals). It can also be used for instances where a trait expresses only one value for the whole community (e.g. total root density).
FUNCTIONAL RICHNESS can be defined in two ways: a) the range of trait attributes represented in the community i.e. the amount of niche space filled by species in the community (Mason et al. 2005) b) the number of functional groups or trait attributes in the community (Petchey et al. 2004)

Review of concepts of dynamic ecosystems and their services 91
FUNCTIONAL DIVERGENCE The functional differentiation within the community i.e. the degree to which abundance distribution in niche space maximises divergence in functional traits within the community (Mason et al. 2005). This represents the probability that two random samples within the community will have different trait values. (Lepš et al. 2006).
FUNCTIONAL REDUNDANCY A characteristic of species within an ecosystem in which certain species (or other taxa) contribute in equivalent ways to ecosystem processes such that one species may substitute for another Note that species that are redundant for one ecosystem process may not be redundant for others. (MA, 2005) INDICATOR An indicator is a simple, measurable and quantifiable characteristic responding in a known and communicable way to a changing environmental condition, to a changing ecological process or function, or to a changing element of biodiversity. The definition basically follows the criteria defined by McGeoch (1998), but includes the categories recently defined by the EEA (EEA, 2007). McGeoch principally distinguishes between environmental, ecological and biodiversity indicators. For the latter, the EEA has given four functions to be served by suitable indicators: 1) simplification as it summarises often complex and disparate data, 2) quantification as statistically sound and comparable measures are related to a reference or baseline value, 3) standardisation as they are based on comparable scientific observations and 4) communication as they provide a clear message that can be communicated. DPSIR The scoping framework for describing the interactions between society and the environment adopted by the European Environment Agency: driving forces, pressures, states, impacts, responses (extension of the PSR model developed by OECD) The framework assumes cause-effect relationships between interacting components of social, economic, and environmental systems, which are:
Driving forces of environmental change (e.g. industrial production); Pressures on the environment (e.g. discharges of waste water); State of the environment (e.g. water quality in rivers and lakes); Impacts on population, economy, ecosystems (e.g. water unsuitable for drinking) and Response of the society (e.g. watershed protection).
DRIVER Any natural or human-induced factor that directly or indirectly causes a change in an ecosystem
(MA, 2005) The MA’s direct drivers’ (equivalent to DPSIR’s pressures’) are physical, biological or chemical processes that tend to influence directly changes in ecosystem goods and services. The MA’s indirect drivers’ (equivalent to DPSIR’s drivers’) are factors that operate more diffusely than direct drivers, often by altering one or more of the direct drivers. (Alcamo et al., 2005; Nelson et al., 2005)

Review of concepts of dynamic ecosystems and their services 92
RESILIENCE The capacity of an ecosystem to tolerate impacts of drivers and pressures without complete loss of processes that ensure self-regulation, sustainability and capacity to recover from perturbations (Gary Luck) STAKEHOLDER A person or group of people having an interest in a physical resource, ecosystem service, institution, or social system, or someone who is or may be affected by a public policy (MA, 2005) BENEFICIARY A stakeholder who benefits from a physical resource, ecosystem service, institution, or social system, or someone who is or may be affected positively by a public policy LOSER A stakeholder who loses from a physical resource, ecosystem service, institution, or social system, or someone who is or may be affected negatively by a public policy SOCIO-ECOLOGICAL SYSTEM A system that includes societal (human) and ecological (biophysical) subsystems in mutual interactions (Gallopin, 1991) and thus captures interactions between people, biodiversity and ecosystems. SOCIO-ECOLOGICAL RESILIENCE The adaptive capacity of socio-ecological systems for regeneration after disturbance, and reorganisation or evolution of new trends, trajectories or states (Folke, 2006). TERMS ASSOCIATED WITH VALUE AND VALUATION (The following definitions and discussion were provided by Michalis Skourtos.) The process of assigning importance and necessity is called valuation. The reason we have to value (=evaluate) is choice: ‘The issue of valuation is inseparable from the choices and decisions we have to make about ecological systems’ (Constanza 2000). The criteria for choice can be manifold: economic, moral, cultural, aesthetic, ecological etc. The economic criterion of choice is tantamount to choosing the least cost option to achieve a certain utility level or, in its dual form, choosing the maximum utility option to be achieved with certain expenditure. An ecological criterion of choice (e.g. choosing which species to prioritise for protection) could be the degree of rarity. By the act of choosing we inevitably produce rankings, that is (relative) values. Such values are always instrumental: ‘We use the term ‘value’ to mean the contribution of an action or object to user-specified goals, objectives or conditions’ (Costanza, 2000). On the contrary, we define as intrinsic all those values that are disassociated from the concept of choice: items or beings possessing intrinsic value are to be preserved in their own right, irrespective of them serving any user-specified goals, objectives or conditions. It is common in the environmental literature to identify instrumental values with anthropocentrism and intrinsic values with biocentrism. However, instrumental values can be non-anthropocentric and intrinsic values can be anthropocentric (see table below). All values are quantified on the basis of a value metric (or numeraire): energy, money, commodities.

Review of concepts of dynamic ecosystems and their services 93
Anthropocentric Non-anthropocentric Instrumental Total Economic Value (TEV): use
and non-use (incl. value related to others’ potential or actual use) / utilitarian
The values to other animals, species, ecosystems, etc. (independent of humans). For instance, each species sustains other species (through different types of interactions) and contributes to the evolution and creation of new species (co-evolution).
Intrinsic “Stewardship” value (unrelated to any human use) / non-utilitarian
Value an entity possesses independently of any valuer
Classification of environmental values (Source: Adapted from DEFRA, 2006)
DEFRA (Department for Environment, Food and Rural Affairs), 2006. Valuing our Natural Environment. Report No. 0103. Economic values for ecosystem services are characterised as subjective values because they are based on human preferences and quantified on the basis of the intensity of these preferences. The intensity of preferences is expressed in the amount (usually of money) an individual is willing to pay in order to enjoy a certain level of provision of services (Willingness to Pay, WTP). Reversing the standpoint of the trade-off, the intensity of preferences can also be expressed in the amount an individual is willing to accept as compensation in order to tolerate a certain level of loss in the provision of services (Willingness to Accept, WTA): ‘The process of inferring preferences and estimating the willingness of individuals to sacrifice to achieve some outcome is termed ‘VALUATION’’ (Armsworth and Roughgarden 2001). On the other hand, choices based on scientific criteria (e.g. the criterion of rarity mentioned above) produce what are conventionally called objective values (e.g. ecological values). Quoting from Webster’s New World Dictionary 1988, Freeman (1997) asserts that ‘I have found that economists and ecologists typically use the term ‘value’ (….) in two different senses when they use it in discussions of ecosystems. Ecologists usually use the term to mean ‘that which is desirable or worthy of esteem for its own sake; thing or quality having intrinsic worth’. Economists use the term in a sense more akin to ‘a fair or proper equivalent in money, commodities, etc..., where ‘equivalent in money’ represents that sum of money which would have an equivalent effect on the welfare or utilities of individuals’ (p. 241). In instrumentally valuing a resource such as an ecosystem, the total economic value (TEV) can be usefully broken down into a number of categories. The initial distinction is between use value and non-use value. Use value involves some interaction with the resource, either directly or indirectly. 1) Indirect use value derives from services provided by the ecosystem. This might, for example, include the removal of nutrients, providing cleaner water to those downstream, or the prevention of downstream flooding. 2) Direct use value, on the other hand, involves interaction with the ecosystem itself rather than via the services it provides. It may be consumptive use such as the harvesting of reeds or fish, or it may be non-consumptive such as with some recreational and educational activities.

Review of concepts of dynamic ecosystems and their services 94
There is also the possibility of deriving value from ‘distant use’ through media such as television or magazines, although whether or not this type of value is actually a use value, and to what extent it can be attributed to the ecosystem involved, is unclear. Non-use value is associated with benefits derived simply from the knowledge that a resource, such as an individual species or an entire ecosystem, is maintained. It is by definition not associated with any use of the resource or tangible benefit derived from it, although users of a resource might also attribute non-use value to it. Non-use value is closely linked to ethical concerns, often to altruistic preferences, although for some analysts it stems ultimately from self-interest. It can be split into three basic components, although these may overlap depending upon exact definitions. 3) Existence value can be derived simply from the satisfaction of knowing that some feature of the environment continues to exist, whether or not this might also benefit others. This value notion has been interpreted in a number of ways and seems to straddle the instrumental/intrinsic value divide. 4) Bequest value is associated with the knowledge that a resource will be passed on to descendants to maintain the opportunity for them to enjoy it in the future. 5) Philanthropic value is associated with the satisfaction from ensuring resources are available to contemporaries (the current generation). Finally, two categories not associated with the initial distinction between use values and non-use values include: 6) Option value, in which an individual derives benefit from ensuring that a resource will be available for use in the future. In this sense it is a form of use value, although it can be regarded as a form of insurance to provide for possible future but not current use. 7) Quasi-option value is associated with the potential benefits of awaiting improved information before giving up the option to preserve a resource for future use. It suggests a value in particular of avoiding irreversible damage that might prove to have been unwarranted in the light of further information. An example of a quasi-option value is in bio-prospecting, where biodiversity may be maintained on the off-chance that it might in the future be the source of important new medicinal drugs. It has been suggested that quasi-option value is less a distinct category of total value than the difference between an ex-ante perspective yielding ‘option price’ (consumer surplus plus option value) and an ex-post perspective giving expected consumer surplus, as a measure of value. 8) Insurance value is conceptually linked to the above notions of option values: ‘Identifying how close a system might be to collapse of some or all functions is itself extremely difficult, yet one would expect willingness to pay to avoid that collapse to be related in some way to the chances that the collapse will occur. If the chances are known, the value sought is then the premium that would be paid to conserve resilience.’ (OECD, 2002, p.31).