Retooling For Growth in a Dynamic Market · Retooling For Growth in a Dynamic Market ......
29
Retooling For Growth in a Dynamic Market CAR MANAGEMENT BRIEFING SEMINARS August 1, 2017 Mike Jackson Executive Director, Strategy and Research Original Equipment Suppliers Association [email protected] +1-248-430-5954
Transcript of Retooling For Growth in a Dynamic Market · Retooling For Growth in a Dynamic Market ......

Retooling For Growthin a Dynamic MarketCAR MANAGEMENT BRIEFING SEMINARS
August 1, 2017
Mike Jackson
Executive Director, Strategy and Research
Original Equipment Suppliers Association
+1-248-430-5954

2Retooling for Growth in a Dynamic Market

Championing the business interests of the automotive
OE supplier community:Founded in 1998, the Original Equipment Suppliers Association (OESA), serves as
the voice of the automotive supplier and a valuable resource for member
organizations. Throughout the supply chain and on legislative and regulatory issues,
OESA represents the collective voice of suppliers.
Exclusively for automotive suppliers: Supplier membership is exclusive to original equipment automotive suppliers that
directly provide components, tools, materials and services to the OE light vehicle
industry.
Strength in numbers: Membership is comprised of approximately 375 Tier 1,2, and 3 automotive suppliers
with North American OE sales that range from $10 million to $5+ billion. Affiliate
members support the supplier community with thought leadership, industry analysis
and other key information.
LED By supplier industry executives: OESA’s interests are guided by a board of directors consisting of CEOs from
member companies of all sizes.
Staff that works for members: Members enjoy direct access to a staff of dedicated association employees in
Detroit and Washington, D.C.
Retooling for Growth in a Dynamic Market

4
• Vehicle Sales Dynamics
• Production Outlook
• Supplier Implications
• Summary
AGENDA
Retooling for Growth in a Dynamic Market
4
6
8
10
12
14
16
18
20
22
199
6
199
8
200
0
200
2
200
4
200
6
200
8
201
0
201
2
201
4
201
6
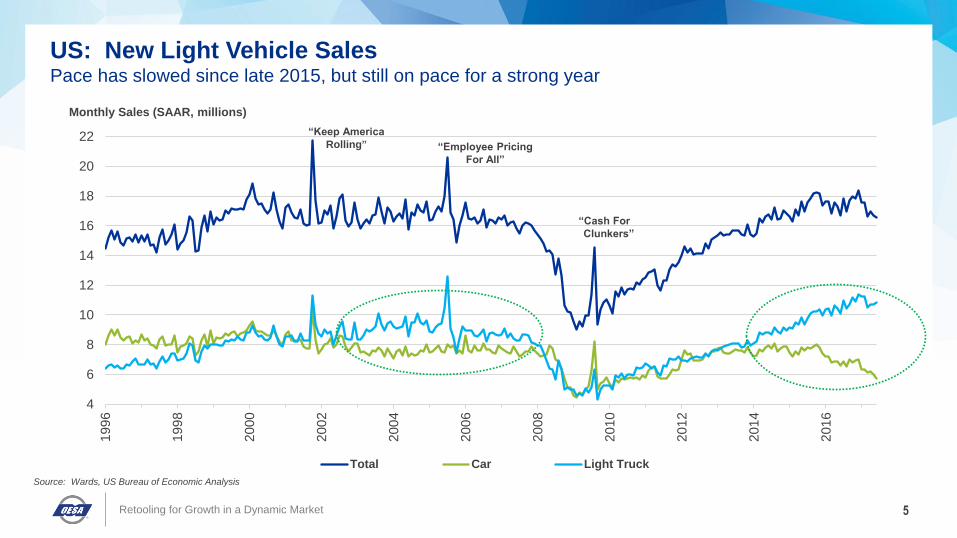
Total Car Light Truck
5
“Keep America
Rolling” “Employee Pricing
For All”
“Cash For
Clunkers”
Monthly Sales (SAAR, millions)
Source: Wards, US Bureau of Economic Analysis
US: New Light Vehicle SalesPace has slowed since late 2015, but still on pace for a strong year
Retooling for Growth in a Dynamic Market

US Light Vehicle Incentives and Inventory
6
2.0
2.5
3.0
3.5
4.0
4.5
-50%
-25%
0%
25%
50%
Mill
ions
Y/Y (%) US InventorySource: Automotive News Data Center, Autodata
Vehicle Inventory (millions)
$2.0
$3.0
$4.0
-25%
-15%
-5%
5%
15%
25%
Thou
sa
nd
s
Y/Y (%) US Incentive/Unit
Vehicle Incentive Spending (thousands)
Retooling for Growth in a Dynamic Market
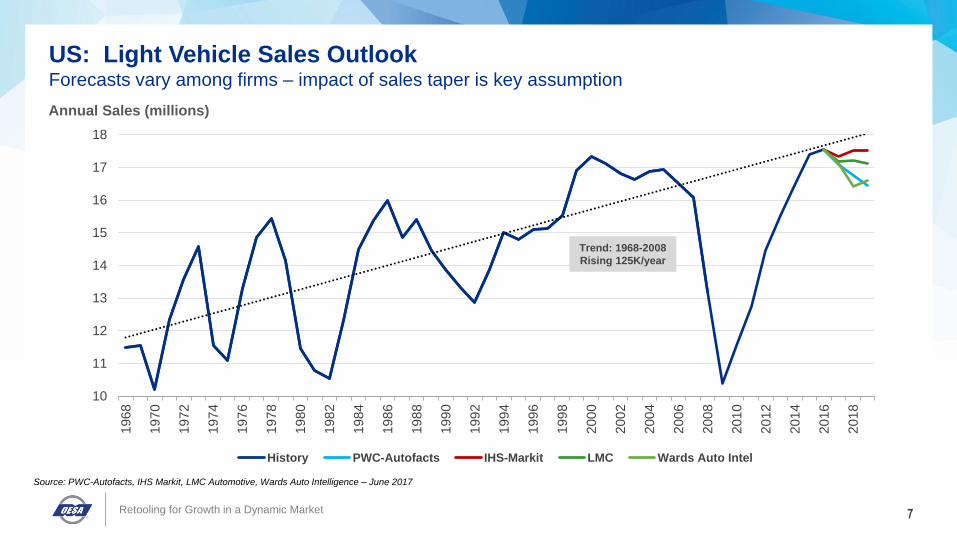
US: Light Vehicle Sales OutlookForecasts vary among firms – impact of sales taper is key assumption
Annual Sales (millions)
10
11
12
13
14
15
16
17
181
96
8
197
0
197
2
197
4
197
6
197
8
198
0
198
2
198
4
198
6
198
8
199
0
199
2
199
4
199
6
199
8
200
0
200
2
200
4
200
6
200
8
201
0
201
2
201
4
201
6
201
8
History PWC-Autofacts IHS-Markit LMC Wards Auto Intel
Trend: 1968-2008
Rising 125K/year
7
Source: PWC-Autofacts, IHS Markit, LMC Automotive, Wards Auto Intelligence – June 2017
Retooling for Growth in a Dynamic Market

8
14%
16%
18%
20%
22%
24%
26%
2010 2011 2012 2013 2014 2015 2016 2017
Lease Share Fleet Share
Lease and Fleet Share of New LV Registrations
0.0
0.5
1.0
1.5
2.0
2.5
3.0
3.5
4.0
4.5
5.0
1996 2000 2004 2008 2012 2016
Lease Originations (millions)
Source: Cox Automotive, IHS Markit, Manheim Consulting
Lease and Fleet ShareRetail Slowing, Industry Reverting to Bad Habits? Current Strength Borrows from Tomorrow
Retooling for Growth in a Dynamic Market
9
90
95
100
105
110
115
120
125
130
199
5
199
7
199
9
200
1
200
3
200
5
200
7
200
9
201
1
201
3
201
5
201
7
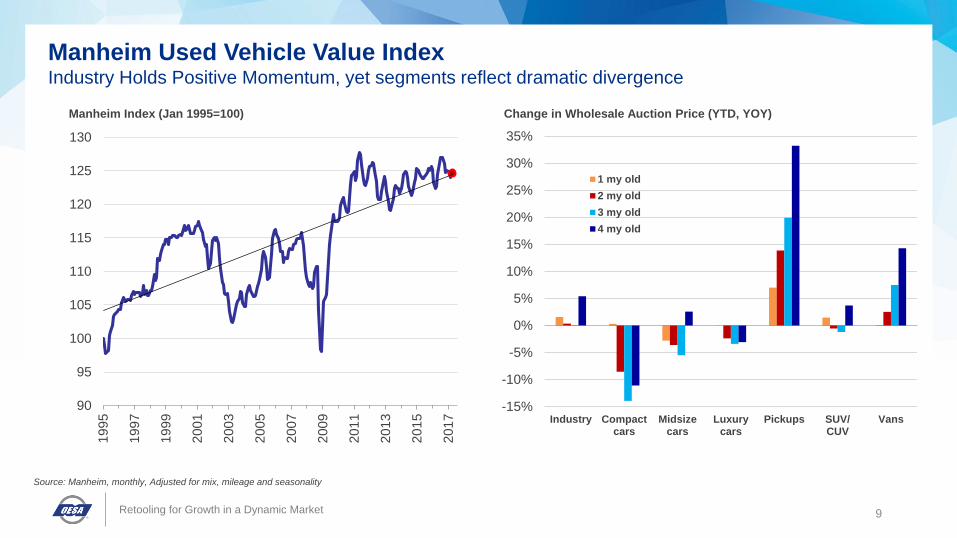
Manheim Index (Jan 1995=100)
-15%
-10%
-5%
0%
5%
10%
15%
20%
25%
30%
35%
Industry Compactcars
Midsizecars
Luxurycars
Pickups SUV/CUV
Vans
1 my old
2 my old
3 my old
4 my old
Change in Wholesale Auction Price (YTD, YOY)
Manheim Used Vehicle Value IndexIndustry Holds Positive Momentum, yet segments reflect dramatic divergence
Source: Manheim, monthly, Adjusted for mix, mileage and seasonality
Retooling for Growth in a Dynamic Market
10
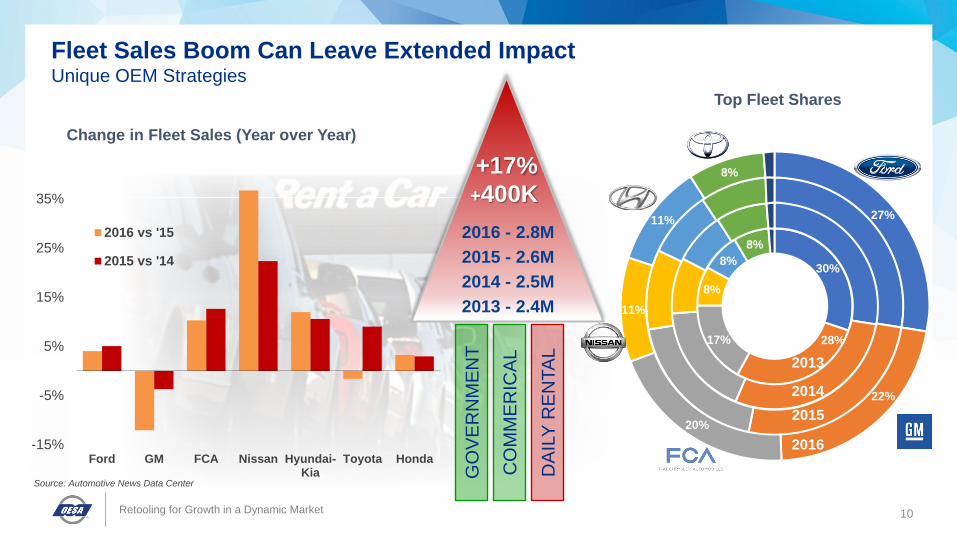
Source: Automotive News Data Center
Fleet Sales Boom Can Leave Extended ImpactUnique OEM Strategies
Change in Fleet Sales (Year over Year)
30%
28%17%
8%
8%
8%
27%
22%
20%
11%
11%
8%
Top Fleet Shares
2013
2014
2015
2016
2016 - 2.8M
2015 - 2.6M
2014 - 2.5M
2013 - 2.4M
+400K
+17%
GO
VE
RN
ME
NT
CO
MM
ER
ICA
L
DA
ILY
RE
NTA
L
-15%
-5%
5%
15%
25%
35%
Ford GM FCA Nissan Hyundai-Kia
Toyota Honda
2016 vs '15
2015 vs '14
Retooling for Growth in a Dynamic Market

US Light Vehicle Sales Outlook By Type
11
0
2
4
6
8
10
12
14
16
18
20
2005 2010 2015 2020
Mill
ions
Car
Utility
Truck
-5%(865K)
No Change
(6K)
+16%1,180K
-30%(2,039K)
2016 - ∆ 2024
Source: Wards Auto Intelligence
17.516.6
Retooling for Growth in a Dynamic Market

12
• Vehicle Sales Dynamics
• Production Outlook
• Supplier Implications
• Summary
AGENDA
Retooling for Growth in a Dynamic Market
OESA Automotive Supplier Barometer- July 2017
20
30
40
50
60
70
80
Ja
n-2
008
Ja
n-2
009
Ja
n-2
010
Ja
n-2
011
Ja
n-2
012
Ja
n-2
013
Ja
n-2
014
Ja
n-2
015
Ja
n-2
016
Ja
n-2
017
13
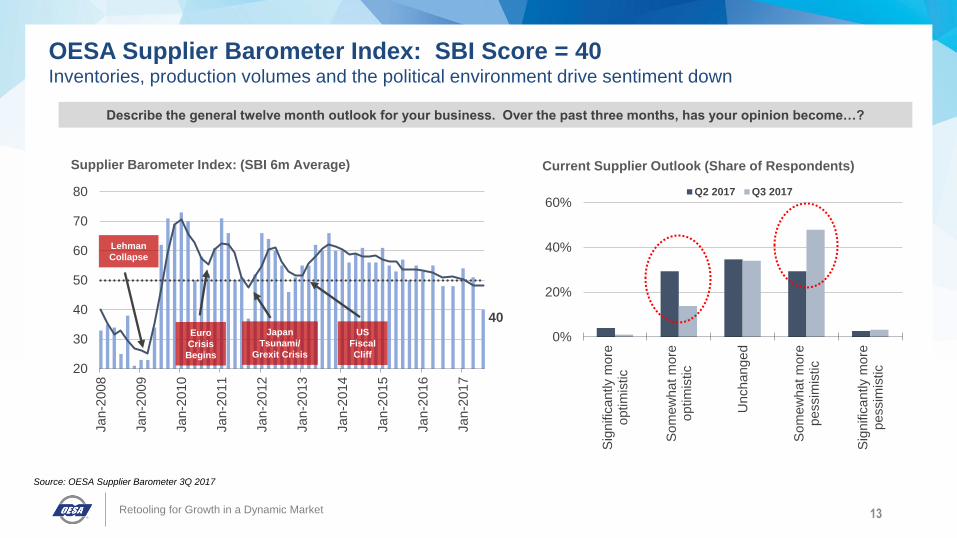
Supplier Barometer Index: (SBI 6m Average)
Describe the general twelve month outlook for your business. Over the past three months, has your opinion become…?
OESA Supplier Barometer Index: SBI Score = 40Inventories, production volumes and the political environment drive sentiment down
Euro
Crisis
Begins
Japan
Tsunami/
Grexit Crisis
US
Fiscal
Cliff
Lehman
Collapse
40
0%
20%
40%
60%
Sig
nific
an
tly m
ore
optim
istic
So
mew
ha
t m
ore
op
tim
istic
Un
ch
ang
ed
So
mew
ha
t m
ore
pessim
istic
Sig
nific
an
tly m
ore
pessim
istic
Q2 2017 Q3 2017
Current Supplier Outlook (Share of Respondents)
Source: OESA Supplier Barometer 3Q 2017
Retooling for Growth in a Dynamic Market
OESA Automotive Supplier Barometer- July 2017
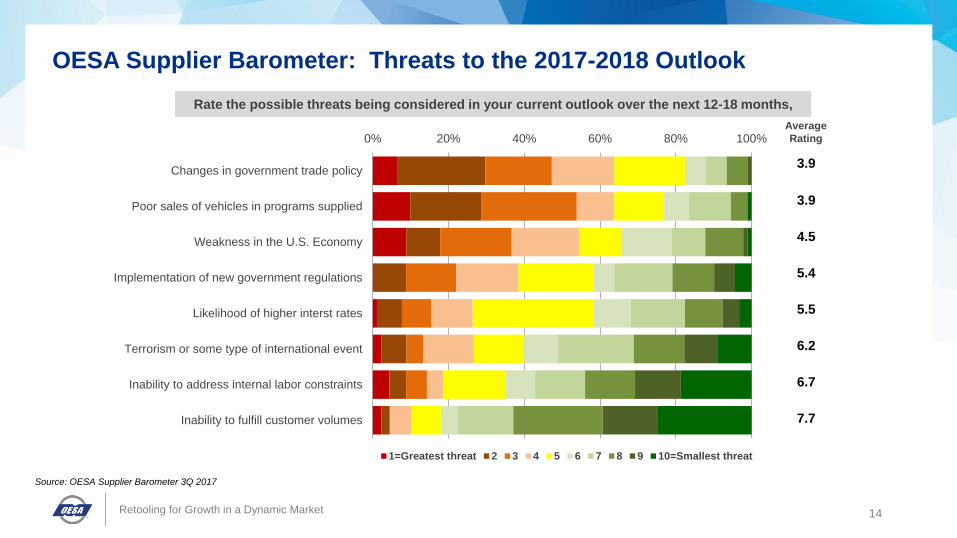
0% 20% 40% 60% 80% 100%
Changes in government trade policy
Poor sales of vehicles in programs supplied
Weakness in the U.S. Economy
Implementation of new government regulations
Likelihood of higher interst rates
Terrorism or some type of international event
Inability to address internal labor constraints
Inability to fulfill customer volumes
1=Greatest threat 2 3 4 5 6 7 8 9 10=Smallest threat
14
Rate the possible threats being considered in your current outlook over the next 12-18 months,
Average
Rating
3.9
3.9
4.5
5.4
5.5
6.2
6.7
7.7
OESA Supplier Barometer: Threats to the 2017-2018 Outlook
Source: OESA Supplier Barometer 3Q 2017
Retooling for Growth in a Dynamic Market

15
(in millions)
20172018
Forecast
2019
Forecast1Q
Actual
2Q
Forecast
3Q
Forecast
4Q
Forecast
2017
Forecast
4.474.49
↓0.06
4.21
↓0.06
4.30
↓0.12
17.47
↓0.29
17.97
↓0.22
18.65
↓0.27
4.534.53
↓0.08
4.20
↑0.02
4.29
↑0.06
17.56
Δ0
17.72
↓0.19
17.90
↓0.27
4.564.54
↓0.18
4.24
↓0.04
4.44
↓0.01
17.78
↓0.21
17.88
↓0.46
18.02
↓0.42
Forecast Average 4.52 4.52 4.22 4.34 17.60 17.86 18.19
Forecast Spread 0.05 0.04 0.15 0.31 0.25 0.75
2016 Average 4.47 4.61 4.39 4.34 17.81
Source: OESA Forecast Snapshot – June 2017
Retooling for Growth in a Dynamic Market
NORTH AMERICA2017-2019 Production Forecast Comparison(VOLUMES REPRESENT NA CAR, LT TRUCK CLASS 1-5)

North America – Industry Production Cycles
16
0
2
4
6
8
10
12
14
16
18
20
1970 1975 1980 1985 1990 1995 2000 2005 2010 2015 2020
Mill
ions
NA Production
Recession
Linear (NA Production)
-26%-3.8M
-42%-6.4M
-19%-2.6M
-10%-1.7M
-48%-7.8M
Source: Wards Auto Intelligence
Stress
testing
-10%?
-20%?
-30%?
?-2.2%-385K
Retooling for Growth in a Dynamic Market

North American ProductionDemand Drives Divergent Growth
17
6.54.0
6.9 6.0
5.1
2.7
7.2 8.5
4.1
1.8
3.8 3.5
0
3
6
9
12
15
18
21
2004 2006 2008 2010 2012 2014 2016 2018 2020 2022 2024
Milli
on
s
Car Utilities Truck
-271K
-7%
+1.3M
+19%
-878K
-13%
Source: IHS Markit
Retooling for Growth in a Dynamic Market
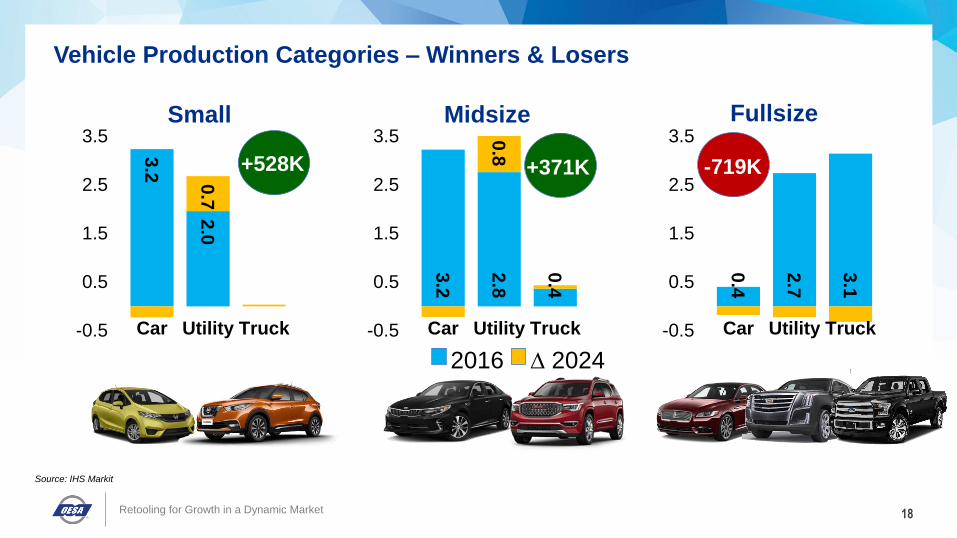
3.2
2.8
0.4
0.8
-0.5
0.5
1.5
2.5
3.5
Car Utility Truck
Vehicle Production Categories – Winners & Losers
18
3.2
2.0
0.7
-0.5
0.5
1.5
2.5
3.5
Car Utility Truck
0.4
2.7
3.1
-0.5
0.5
1.5
2.5
3.5
Car Utility Truck
Small Midsize Fullsize
+528K +371K -719K
Source: IHS Markit
2016 ∆ 2024
Retooling for Growth in a Dynamic Market
19
• Vehicle Sales Dynamics
• Production Outlook
• Supplier Implications
• Summary
AGENDA
Retooling for Growth in a Dynamic Market

Future Launch Activity
20
19 1925
16
34
19 20 24
1017
12 148 9
25
33
29
13
1620
0
10
20
30
40
50VehiclesCarsTrucks
Source: IHS Markit, Kelly Blue Book
Average Transaction Price
By Segment ($) – June 2017
0 10 20 30 40
B-Segment
C-Segment
D-Segment
Thousands
Utility
Car
+46%
+39%
+51%
Retooling for Growth in a Dynamic Market

Priorities & Positioning for Profitability
21
$17,250 profit/unit
.24 Million units sold - 2016
$4.1 Billion
~$10,000 profit/unit
2.28 Million units sold - 2016
$22.8 Billion
Retooling for Growth in a Dynamic Market
MARGIN MARKET
COMPETENCY SCALE

Production Portfolio Comparison - 2016
22
OEM Units Car SUV Truck
General Motors 3,647 32% 34% 34%
Ford 3,068 25% 36% 39%
FCA 2,516 13% 61% 27%
Toyota 2,125 47% 36% 17%
Honda 1,957 47% 51% 2%
Renault-Nissan 1,846 56% 28% 16%
Hyundai 859 66% 34% 0%
BMW 411 0% 100% 0%
Daimler 354 20% 69% 11%
Volkswagen 517 98% 2% 0%
Other 524 95% 5% 0%
Unit volume - 6,866 7,130 3,829
NA average 17,825 39% 40% 21%
$
Source: IHS Markit
Retooling for Growth in a Dynamic Market
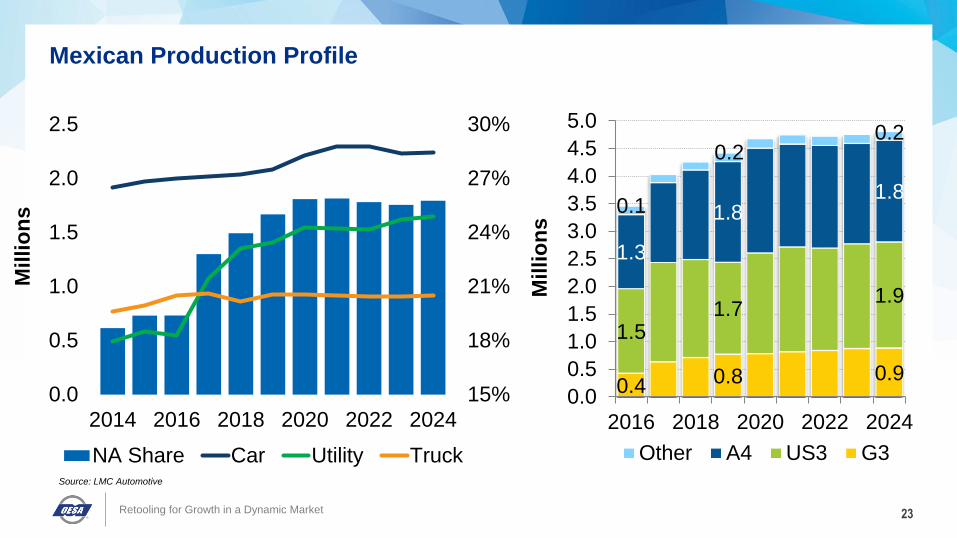
Mexican Production Profile
23
15%
18%
21%
24%
27%
30%
0.0
0.5
1.0
1.5
2.0
2.5
2014 2016 2018 2020 2022 2024
Milli
on
s
NA Share Car Utility Truck
0.4 0.8 0.9
1.51.7
1.9
1.3
1.81.8
0.1
0.20.2
0.0
0.5
1.0
1.5
2.0
2.5
3.0
3.5
4.0
4.5
5.0
2016 2018 2020 2022 2024
Milli
on
s
Other A4 US3 G3Source: LMC Automotive
Retooling for Growth in a Dynamic Market

Passenger Cars: Under PressureSteady March To Reduce US3 Car Portfolios and Utilize Global Sourcing
24
Fiesta
Dart Focus
200
Sonic
Taurus
Verano
LaCrosse? Impala? CT6?
Volt? Cruze?
Segment
A/B
C
D
E
Retooling for Growth in a Dynamic Market

Top Automotive States
25
0 50 100
VirginiaIowa
MissouriWisconsinNew York
GeorgiaPennsylvania
CaliforniaTexas
South CarolinaNorth Carolina
IllinoisAlabama
KentuckyTennessee
IndianaOhio
Michigan
Top 20 - Supplier Employment (000s) US Vehicle Output - 2016 (Millions)
5%6%
49%8%
32%
Regional Share %
Source: 2017 MEMA Economic Study – 2015CY ; Share of total direct employment Source: LMC Automotive, OESA Analysis
0 1 2
California
Kansas
Georgia
South Carolina
Mississippi
Texas
Illinois
Missouri
Tennessee
Alabama
Kentucky
Indiana
Ohio
Michigan
5%1%
Midwest, 56%
S-East, 38%
Regional Share %
Retooling for Growth in a Dynamic Market
CAR TRUCK

• ENGINEERS
• TECHNICIANS
• HOURLY SKILLED26
OESA Supplier Barometer Survey: HR & Talent Focus
SKILLS +
CULTURE
GAP
63%MODERATE
TO WIDE
NEW
VALUES:
TIME
FLEXIBILITY
TALENT
SCARCITY
CHANGE ROLESTO FIT SKILLS
Retooling for Growth in a Dynamic Market
CROSS
FUNCTIONAL
TRAINING
APPRENTICESHIPS
NEW HIRING
PRACTICES
∆ SKILL SETS
•SPECIALIZED
•AUTONOMOUS
•COLLABORATIVE
ACTION PLANS:
27
• Vehicle Sales Dynamics
• Production Outlook
• Supplier Implications
• Summary
AGENDA
Retooling for Growth in a Dynamic Market
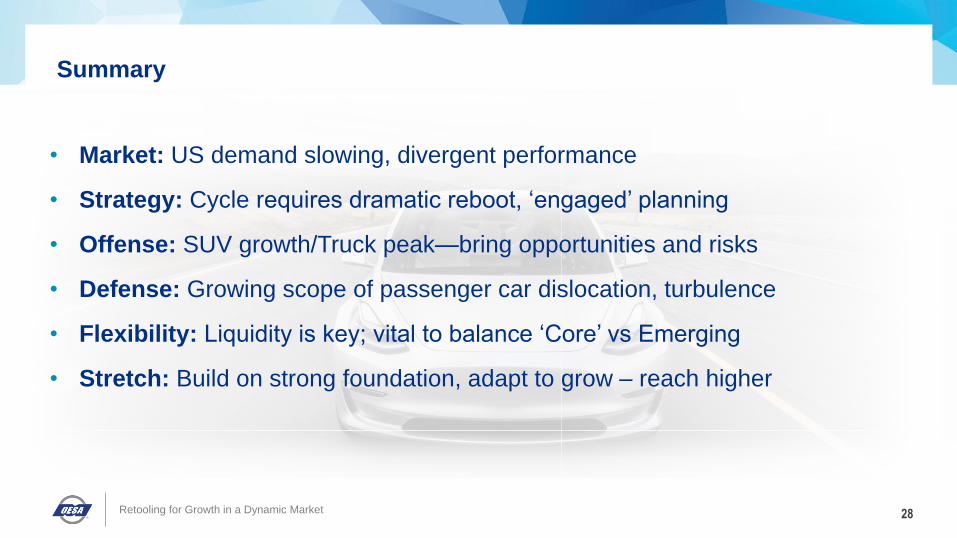
Summary
28
• Market: US demand slowing, divergent performance
• Strategy: Cycle requires dramatic reboot, ‘engaged’ planning
• Offense: SUV growth/Truck peak—bring opportunities and risks
• Defense: Growing scope of passenger car dislocation, turbulence
• Flexibility: Liquidity is key; vital to balance ‘Core’ vs Emerging
• Stretch: Build on strong foundation, adapt to grow – reach higher
Retooling for Growth in a Dynamic Market

Thank You...CAR MANAGEMENT BRIEFING SEMINARS
August 1, 2017
FOR QUESTIONS OR ASSISTANCE,
PLEASE FEEL FREE CONTACT ME:
Mike Jackson
Executive Director, Strategy and Research
Original Equipment Suppliers Association
+1-248-430-5954