Research into barriers to deployment of district heating - Gov.uk
114
Research into barriers to deployment of district heating networks Research study by BRE, University of Edinburgh and the Centre for Sustainable Energy for the Department of Energy & Climate Change 26 March 2013
Transcript of Research into barriers to deployment of district heating - Gov.uk
Research into barriers to deployment of district heating networks
Research study by BRE, University of Edinburgh and the Centre for Sustainable Energy for the Department of Energy & Climate Change
26 March 2013

Research into barriers to deployment of district heating networks in suitable locations
2
Disclaimer
The views expressed in this report are those of the authors, not necessarily those of the Department of Energy and Climate Change (nor do they reflect Government policy).

Research into barriers to deployment of district heating networks in suitable locations
3
Executive summary
Introduction DECC wishes to support the deployment of district heating networks in suitable locations, through the removal of barriers to the market, and has consequently commissioned this quantitative and qualitative study of existing and planned district heating networks. The aim of the research was to help DECC understand the full range of barriers affecting, and enablers that may assist, the deployment of district heating, in order to inform the design and assessment of appropriate policy options.
The study was developed so that the full range of barriers at each stage of setting up a heat network could be identified and explored. Key themes that were addressed include those that were identified in the DECC Heat Strategy (March 2012) and through stakeholder engagement. These themes included difficulties or uncertainties with funding arrangements, future heat demands and available heat sources, the role of local authorities and issues associated with an unregulated market.
DECC also wished to obtain views on the types of support which are needed. Hypothetical measures ranged from possibilities for developing a model customer charter and model contract documentation, to underwriting of risk.
Project Methodology In order to carry out this study, project teams and individuals with experience of developing or planning heat networks were targeted. Focusing on scheme initiatives developed over the past 10 years, the sample represented a range of delivery organisations, sizes, and locations.
A quota sampling method was used to select the schemes to be approached for participation in the study. The quotas were based on scheme size, location, lead organisation, and whether serving existing buildings or new-build developments. The sample frame was based on DECC’s existing District Heating Database which was supplemented by a database pulled together by the project team. The final sample comprised 34 operational district heating schemes, together with 7 which are in development, and 3 which were planned but which did not proceed. A total of 63 people were interviewed.
The research carried out was both quantitative and qualitative: the respondents were asked to fill out a quantitative on-line questionnaire, and to be interviewed face-to-face using a series of questions devised to address a wide variety of the barrier issues arising at various stages of project development.

Research into barriers to deployment of district heating networks in suitable locations
4
Quantitative data
The on-line submissions of scheme data confirmed that UK district heating schemes vary widely in size and type of buildings served. Of the operational schemes that responded, three-quarters serve a mixture of domestic and non-domestic buildings and two-thirds have been expanded at least once. This indicates that, once established, heat networks do tend to grow.
For the established schemes that responded the predominant supply technology was gas-fired CHP with back-up gas boilers, although there was also a significant minority of schemes using heat from waste-to-energy plant or that are renewables-based. Another significant feature to emerge was that three-quarters of the established schemes include thermal storage.
The submissions for the planned schemes were not dissimilar to those for the operational schemes. Similar ranges were observed for estimations of both heat and electricity generation as for the actual values reported for the operational schemes. Furthermore, CHP remained the predominant envisaged supply technology.
Key areas where barriers to district heating have been identified
The schemes emerging in the UK over the last ten years can be split into two distinct types:
Local authority led schemes which initially serve existing buildings under the control of the authority but where a strategic aim exists to expand the scheme in the future.
Property developer led schemes that serve new buildings but which were designed to allow connection to larger, area wide networks in the future.
Local authority representatives identified lack of funding as the principal impediment to the wider development of district heating. This issue was not just focused on capital funding, but also included in-house staff resources, feasibility work, legal advice, and procurement. It was consequently regarded as a key issue at each stage. Several of those who had received grant funding pointed out that the scheme would not have proceeded without.
Linked with the need for resource is the internal lack of knowledge and skills in all aspects of district heating that was also identified as a significant barrier, as was the difficulty in aligning all the stakeholders from the outset. The need for a stronger planning framework within which to take schemes forward was also highlighted.
Issues regarded as important both by local authority and property developer representatives included the need for suitably qualified consultants, the need to ensure transparency in heat pricing, and a lack of generally accepted contractual arrangements.
Among the possible ways of splitting the data, the key one was whether a scheme was local authority or property developer led. Table 1 summarises the key barriers identified by respondents within these two groups at each stage in the process of setting up a heat network. Interviewees were asked which were the most significant barriers to their projects.

Research into barriers to deployment of district heating networks in suitable locations
5
The relative impact on heat network projects, as indicated by the interviewees, is shown by the number of stars in brackets after the text describing the barrier:
*** Big impact: potential to stop the project
** Medium impact: likely to lead to sub-optimal outcomes and/or significantly slow progress
* Modest impact: likely to slow progress
Table 1 Barriers to establishing a heat network at individual stages - impact
Local Authority Led Property Developer Led
Objective setting and mobilisation
• Identifying internal resources to instigate scheme and overcome lack of knowledge (**)
• Persuading building occupants to accept communal heat (mandated by the planning authority) (*)
• Customer scepticism of technology (*)
Technical Feasibility and Financial Viability
• Obtaining money for feasibility/viability work (***)
• Selecting suitably qualified consultants (**)
• Identifying and selecting suitably qualified consultants (**)
• Uncertainty regarding longevity and reliability of heat demand e.g. lack of heat demand in new buildings (*)
• Uncertainty regarding longevity and reliability of heat demand (*)
• Uncertainty regarding reliability of heat sources (*)
• Uncertainty regarding reliability of heat sources (*)
• Correctly interpreting reports prepared by consultants (*)
Implementation and Operation
• Paying the upfront capital cost (***)
• Concluding agreement with energy services provider including obtaining a contribution to the capital cost (**)
• Obtaining money for independent legal advice (***)
• Lack of generally accepted contract mechanisms (**)
• Lack of generally accepted contract mechanisms (**)
• Inconsistent pricing of heat (**)
• Inconsistent pricing of heat (**)
• Up-skilling LA procurement team on DH (*)

Research into barriers to deployment of district heating networks in suitable locations
6
Table 2 summarises the prevalence of each issue among interviewees, by the number of stars in brackets after the text describing the barrier:
*** Most respondents
** Some respondents
* Several respondents
No stars: one respondent
Table 2 Barriers to establishing a heat network at individual stages - prevalence
Local Authority Led Property Developer Led
Objective setting and mobilisation
• Identifying internal resources to instigate scheme and overcome lack of knowledge (***)
• Persuading building occupants to accept communal heat (mandated by the planning authority) (*)
• Customer scepticism of technology (**)
Technical Feasibility and Financial Viability
• Identifying and selecting suitably qualified consultants (**)
• Selecting suitably qualified consultants (**)
• Obtaining funding for feasibility/viability work (**)
• Uncertainty regarding longevity and reliability of heat demand e.g. lack of heat demand in new buildings (*)
• Uncertainty regarding longevity and reliability of heat demand (*)
• Uncertainty regarding reliability of heat sources
• Uncertainty regarding reliability of heat sources (*)
• Correctly interpreting reports prepared by consultants
Implementation and Operation
• Paying the upfront capital cost (**) • Lack of generally accepted contract mechanisms (**)
• Up-skilling LA procurement team on DH (**)
• Concluding agreement with energy services provider including obtaining a contribution to the capital cost (*)
• Obtaining money for independent legal advice (**)
• Inconsistent pricing of heat (*)
• Lack of generally accepted contract mechanisms (*)
• Inconsistent pricing of heat (*)

Research into barriers to deployment of district heating networks in suitable locations
7
Enablers and possible types of support
Local authorities were considered to have a key role in setting the strategic context for, and initiating the development of, district heating networks within the UK’s towns and cities. However, they need more support if they are to fulfil this role. Prominent among views expressed by interviewees were that:
Some form of financial incentive would be required to make schemes happen until the market reached a greater stage of maturity.
The government could help by implementing a mechanism for underwriting risk, enabling low cost finance to be raised.
Local authority staff would benefit from access to an external advisory service through the development process, particularly for the initial stages.
Part funding for development work would help to move potential schemes forward.
Training of local authority procurement staff and part funding for legal advisors would help to avoid schemes stalling at the procurement stage
Waste-to-energy plants have great potential to become the primary heat source of the future but their more widespread use was considered to be hampered as operators were not sufficiently incentivised to recover heat.
Local planning policies, particularly in London, promote and support the development of heat networks through the planning process. This often meant that property developers were compelled to investigate and commit to the installation of heat networks. This requirement to provide heat network infrastructure meant that the costs have to be borne by the developer or their appointed energy services provider. Hence, funding was not such an obstacle in the new build sector.
Interviewees from both local authorities and property developers identified the following:
Procedures need to be established to enable selection of high quality consultant support.
The difficulties associated with selling electricity from gas CHP installations (the predominant primary heating source) need to be addressed.
Inconsistent pricing of heat was a barrier to district heating; interviewees considered that transparency in pricing was the essential ingredient in obtaining customer confidence.
The development of the following initiatives can potentially be helpful, although some warned against being too prescriptive:
a model customer charter dealing with aspects of customer service;

Research into barriers to deployment of district heating networks in suitable locations
8
additional examples of standardised contracts dealing with different types of scheme and circumstances;
guidance on generic technical requirements.
Sources of existing information were not signposted as clearly as they could be and some guidance was considered to be out of date or too shallow. There was a clear need to provide an up to date repository of relevant information that was coordinated with the trade associations to avoid duplication.
Conclusions
Local authorities were considered to have a critically important role in setting the strategic context for, and initiating the development of, district heating networks within the UK’s towns and cities. Their local knowledge, capacity for organisation, and key functions as planning authorities and service providers, put them in a unique position.
With the appropriate types and level of support, interviewees considered that they could orchestrate the initiation of, and nurture the growth of, sustainable community based infrastructure.
Interviewees considered that the areas where local authorities most often struggle span the different stages of scheme development. Some respondents cited each of the stages: initial mobilisation, technical feasibility, and financial appraisal. However, only two respondents cited the implementation and operation stage. Areas recommended for targeted financial support include feasibility work; it was also reflected that most schemes that have progressed during the last 10 years have benefited from some form of grant support.
For both local authority and property developer led schemes, interviewees commonly felt that there is a need for some form of customer charter and standardised contract mechanisms, although caution was also often expressed to build in flexibility. They would also like to see more guidance materials, and for these to be regularly updated.
The traditional starting point for heat networks in the UK is small-scale gas-fired CHP. Interviewees pointed out that difficulties persist, however, for selling electricity. They also pointed out that the use of waste-to-energy plant for supplying heat is currently hampered through lack of a strong enough incentive.
In general, interviewees reflected that the benefits of successful district heating schemes are substantial, but that there needs to be a stronger sense that district heating is supported by central government.

Research into barriers to deployment of district heating networks in suitable locations
9
Contents
Executive summary .............................................................................................................................. 3
1 Introduction ................................................................................................................................ 11
2 Project Methodology .................................................................................................................. 13
2.1 Overall research design ............................................................................................................ 13
2.2 Sampling .................................................................................................................................. 14
2.3 Data collection .......................................................................................................................... 16
2.4 Data collation and analysis ....................................................................................................... 19
3 Quantitative data ........................................................................................................................ 21
3.1 The Findings ............................................................................................................................. 21
3.2 The Schemes ........................................................................................................................... 21
3.3 Operational Projects ................................................................................................................. 21
3.4 Planned Projects ...................................................................................................................... 25
4 Key areas where barriers to district heating have been identified ......................................... 27
4.1 Difficulties with meeting development and capital costs ............................................................ 28
4.2 Uncertainty regarding longevity and reliability of customer heat demand .................................. 34
4.3 Uncertainty regarding reliable heat sources .............................................................................. 36
4.4 Lack of regulation and inconsistent pricing of heat.................................................................... 40
4.5 Lack of generally accepted contract mechanisms ..................................................................... 42
4.6 Lack of a generally accepted and established role for local authorities ..................................... 44
4.7 The choices made by heat providers (technical feasibility) ....................................................... 46
4.8 Skills gaps ................................................................................................................................ 48
4.9 Other key factors affecting scheme development ..................................................................... 52
4.10 Ranking barriers in terms of their relative importance........................................................... 53
5 Enablers and possible types of support .................................................................................. 55

Research into barriers to deployment of district heating networks in suitable locations
10
5.1 Views on the types of support identified in the research specification ....................................... 56
5.2 Other types of support identified by interviewees ...................................................................... 59
6 Conclusions ................................................................................................................................ 61
6.1 Local authority led schemes ...................................................................................................... 61
6.2 Property developer led schemes ............................................................................................... 62
6.3 Barriers and associated enablers common to different types of schemes ................................. 62
Appendix A E-mail to potential participants ................................................................................ 65
Appendix B Pre-interview questionnaire ..................................................................................... 67
Appendix C Interview schedule .................................................................................................... 76
Appendix E Interpreting comments ........................................................................................... 113

Research into barriers to deployment of district heating networks in suitable locations
11
1 Introduction
Background
The take up of district heating in the United Kingdom in comparison to comparable EU Member States in northern Europe is still very low even in areas of high density in major cities and towns.
The Department of Energy and Climate Change (DECC) wished to build on its existing understanding of barriers which may be impeding the deployment of heat networks with a sufficiently detailed assessment to determine where policy interventions should be made and what impact those interventions should have.
BRE has been engaged to undertake the research and analysis, and has worked in a consortium along with the Centre for Sustainable Energy and the University of Edinburgh.
‘The Future of Heating: a strategic framework for low carbon heating in the UK’ (DECC, 2011) states that, provided they can be used to distribute heat from low carbon sources, heat networks can be core to the UK’s heat strategy and have the potential to play a critical role in helping buildings and industry decarbonise their heat supply out to 2050.
There are, however, substantial barriers that impede the deployment of heat networks. Consequently, DECC decided to commission the research presented here in order to build on its existing understanding of these barriers and to carry out a sufficiently detailed assessment to determine where policy interventions should be made and what impact those interventions should have. The results of this project will feed into DECC modelling and be used to provide wider evidence to inform the ‘Heat Policy Paper’ requested by the Secretary of State.
Research objectives
The overall purpose of the research was to inform DECC’s design and assessment of policy options to support the deployment of district heating networks, where they are the most cost effective way of reducing emissions from heating. The key objectives were:
• to identify the full range of barriers at each stage in the process of setting up a heat network
• for each barrier to understand o the relative level of impact on heat network projects o how common each barrier is relative to others o for each barrier whether there are thresholds above or below which district heating
projects are feasible o at what point the barrier occurs/reoccurs
• to qualitatively explore barriers in depth, in order to allow DECC to fully understand when, why and how these barriers emerge, how these have been overcome, or what would help address these, which will enable DECC to understand the implication of policy interventions.

Research into barriers to deployment of district heating networks in suitable locations
12
Themes
The study was developed so that the full range of barriers at each stage of setting up a heat network could be identified and explored. Key themes that were addressed include those which were identified in the DECC Heat Strategy (March 2012) and through stakeholder engagement. These themes included difficulties or uncertainties with funding arrangements, future heat demands and available heat sources the role of local authorities and issues associated with an unregulated market.
a) difficulties with funding, particularly barriers to making networks investable and to the provision of funding and access to funding sources.
b) uncertainty regarding the longevity and reliability of customer heat demand and the risks involved in gaining a return on heat networks with long payback periods in the context of unguaranteed heat demand.
c) uncertainty regarding reliable heat sources and the risks associated with individual heat sources, or changing heat source.
d) the lack of regulation and inconsistent pricing of heat, including related factors such as the sale value of electricity from small-scale CHP plants.
e) The lack of generally accepted or understood commercial and contract mechanisms for distributing or reducing risk related to the network assets, their installation and operation
f) the lack of a generally accepted and understood role for local authorities in promoting or supporting the development of heat networks, including an assessment of the powers and opportunities they have and the barriers they face.
g) the choices made by heat providers at the initiation phase, particularly why they chose district heating against other options for supplying heat.
Structure of the report
The report is structured as follows:
Chapter 2 outlines the methodology that was pursued in order to obtain a case list of samples for both the quantitative and qualitative research, and how each type of research was done. The methodology included developing an interview schedule (shown in Appendix C) that comprises questions devised to address the research objectives, and cover the themes identified in DECC’s heat strategy and stakeholder consultations.
Chapter 3 outlines results from the quantitative research.
Chapter 4 comprises a discussion of the results emerging from the qualitative part of the research which took place through face-to-face interviews.
Chapter 5 also reflects the results of the qualitative work, providing details of the enablers both those suggested by DECC and further ones that respondents have suggested. The discussion also links these to the associated barriers identified in Chapter 4.
Chapter 6 provides overall conclusions from the study.
The letter to participants, the questionnaire used for the quantitative work, and the interview schedule used for the interview are included respectively in Appendices A, B and C.

Research into barriers to deployment of district heating networks in suitable locations
13
2 Project Methodology
2.1 Overall research design
The objective of the research was to collect detailed qualitative and quantitative data from a
range of district heating schemes. The main aim was to understand the experiences of district
heating delivery teams and the barriers they faced when developing district heating schemes in
the UK.
Working with DECC to understand exactly what data and information should be collected, the
team developed a two phase data collection plan:
1. An electronic questionnaire was used to collect basic quantitative information about the schemes.
2. Face-to-face semi-structured interviews were conducted with representatives from each of the selected project teams.
Further information on each of these phases is outlined later in this section.
The research team considered a number of options for collecting the data to try and establish
the most reliable, valid and best value design. The team considered running workshops to
collect the views from key sector groups (e.g. industry suppliers, developers, local authorities).
However, the conclusion was that as the schemes are so case-specific it would be more fruitful
to carry out scheme-based interviews as proposed in the original DECC specification. Where
appropriate, experience with more than one scheme would be collected.
The team considered carrying out these interviews via telephone or video conferencing calls.
Whilst these methods would have reduced the environmental impact associated with the data
collection (i.e. reducing travel) and reduced the delivery cost associated with the data collection
phase, past experience has shown that face-to-face interviews often produce richer findings and
are easier to facilitate. It was anticipated that the interviews could take up to half a day as there
was a lot to cover. Conducting a telephone interview of this length would be impractical.
It was initially planned to collect the quantitative data through two separate questionnaires for
the following reasons:
1. There was too much information to collect in one questionnaire.
2. There was concern that sending out a very long and complicated questionnaire at the
very start of the data collection phase may have a negative impact on recruitment for the
interviews. i.e. some recipients may be put off taking part in the project or feel they don’t
have enough information or expertise to take part.
In the end the planned second questionnaire was not distributed as an alternative means of approaching this part of the dataset was identified, outside of this project.

Research into barriers to deployment of district heating networks in suitable locations
14
2.2 Sampling
2.2.1 Sampling specification The final sample comprised 34 operational district heating schemes, together with 7 which are in development, and 3 which were planned but which did not proceed. The vast majority of these schemes have been developed within the last 10 years. However, within the sample were 5 schemes that were more than 10 years old but had been significantly expanded during the last 10 years.
In most cases the personnel responsible for taking forward these district heating schemes had been responsible for a particular scheme. There were a few exceptions where several schemes had been taken forward by the same team and these were covered in the same interview, such that a total of 39 such interviews were carried out. In addition 4 further interviews were carried out with personnel involved commercially with schemes: 3 energy services providers and an engineering consultant. A total of 63 people were interviewed.
The sampling process aimed to include a wide range of schemes including those from across the UK with representation from a broad spread of regions. While aiming to include schemes from a wide range of regions, it was recognised that the majority of recent projects were in London and Scotland. To reflect this in the sample a larger proportion of the schemes included were represented from these regions.
When sampling schemes to be included in the project the delivery team looked for schemes that had been developed by a range of delivery organisations and represented a broad range of sizes. The sample included heat networks serving one particular type of building (eg residential) and also those serving a range of building types.
The district heating market in the UK is relatively small compared with other European countries. The benefits of district heating accrue more strongly for larger schemes. There is very little activity in the UK at the scale to be found in neighbouring countries where the district heating market is mature, such that even the relatively large UK schemes are quite small by comparison. While including schemes in each size category (smaller size schemes can of course form the core loads for a future larger scheme), the study draws as much as possible from the larger schemes that do exist.
The research aimed to highlight the experiences of individuals or teams in both new-build and retrofit, predominantly by private developers and local authorities.
2.2.2 Sampling methodology BRE used a quota sampling method to select the schemes that should be approached for inclusion. The sample frame was based on DECC’s existing District Heating Database which was then supplemented by a database pulled together by the project team. Both these databases comprised distinct schemes, so this was the basis for the sampling. The final sample frame included 86 district heating schemes that were 10 years old or less and 3 schemes that were more than 10 years old but which had seen significant expansion in the last decade. The case list was formed from a sample drawn from these databases of existing schemes, as described in Section 2.2.1, together with a number of planned and failed schemes identified by the project team.

Research into barriers to deployment of district heating networks in suitable locations
15
2.2.3 Final sample Table 3 sets out the sample frame of existing schemes, the original case list and the number of interviews achieved from this.
The project team made attempts to contact representatives of all schemes on the case list to arrange an interview. When this did not succeed the project team examined the characteristics of the schemes that were not able to be the subject of an interview and sought to identify schemes with similar characteristics (however, the number of medium size schemes fell by three). The ‘further schemes added’ column in the table refers to schemes in this category.
The final column of the table shows the final number of schemes that were interviewed.
Table 3 Number of schemes approached and interviewed
Type of
scheme
Sample
frame of
existing
schemes
Case list
schemes
approached
Case list
schemes
interviewed
Further
schemes
added
TOTAL
schemes
interviewed
Large 21 20 17 3 20
Medium 26 13 7 3 10
Small 39 4 2 2 4
Planned 5 5 2 7
Failed 3 2 1 3
Note: The total number of schemes that were the subject of interviews slightly exceeds the number of interviews carried out because in a few cases the same interview covered more than one scheme.
Table 4 provides a breakdown of the characteristics of the schemes included in terms of their size and the procuring body. In the vast majority of cases, the schemes which were procured by a local authority served predominantly existing buildings, whereas the schemes procured by a property developer served new (or refurbished) buildings.
The local authority schemes also featured a wider mix of connected buildings, while the developer led schemes were predominantly residential. Heat networks have also been applied to university campuses, and these are also well represented.
Aside from there being relatively more schemes in London (driven by the London Plan) and Scotland (where the benefits are more widely understood), initiatives are more thinly spread elsewhere, although there is also a cluster of schemes in Midlands cities.

Research into barriers to deployment of district heating networks in suitable locations
16
Table 4 Final Sample breakdown
Procuring body Schemes of different
size1
Location Total
number
Large Med Small England Scotland
Local Authority 9 5 1 9 6 15
New build developer (including
social housing providers)
8 3 3 12 2 14
Other e.g. university 3 2 0 2 3 5
Total 20 10 4 23 11 34
Note: In addition, the sample included 7 planned schemes and 3 schemes that did not proceed, so that a total of 44 schemes were included in the study. The planned and failed schemes were predominantly local authority driven, aiming to be large in planned final scale, and were regionally well distributed.
The total number of schemes that were the subject of interviews slightly exceeds the number of interviews carried out because in a few cases the same interview covered more than one scheme.
2.3 Data collection
Detailed qualitative and quantitative data was collected via online surveys and in-depth face-to-face interviews. There were two stages of data collection for each of the schemes.
2.3.1 Stage 1. Quantitative pre-interview questionnaire An online questionnaire was developed with DECC to collect key quantitative information about the schemes. The questionnaire was designed to collect basic key information to populate DECC’s National Heat Model, and provide background information for the project interviewers and analysts.
Key representatives from over 40 project teams were sent an e-mail (see Appendix A) introducing the project and how they could be involved. The e-mail included hyperlinks to an online questionnaire developed by BRE. Before completing the questionnaire respondents were informed of the aim of the research project, the purpose of the questionnaire, what would happen to the data collected and how it would be used.
1 As defined in the DECC district heating database

Research into barriers to deployment of district heating networks in suitable locations
17
An example of the questionnaire can be found in Appendix B. Each questionnaire collected data on a single scheme, meaning respondents who were connected with several schemes completed more than one questionnaire. The questionnaire contained routing to ensure respondents were only asked questions relevant to the particular type and scale of the scheme and the stage of development.
The questionnaire covered the following:
• Information regarding the project development
• Basic technical information regarding the:
o output of the system
o heat generating technologies and fuel types
o the volume of the thermal storage unit (if present)
o size of the network
• Number and type of buildings served by the network
• Contact details for key members of the project team.
The information collected from the completed questionnaires was intended to help select the
most relevant project teams and schemes to include at the interview stage. However, in order to
comply with the time-scale schemes were more often contacted directly with the questionnaire
following this but preceding the interview.
2.3.2 Stage 2. Qualitative interview
Approach
Face-to-face structured interviews were conducted with representatives of the delivery team from each of the schemes. The aim of the interviews was to collect detailed, in-depth information about how the schemes were developed, what barriers were faced at each stage of the process, how these barriers were overcome and what would help to remove them for future schemes.
Audio recordings were taken of all interviews to enable accurate collation and analysis of the findings.
Development of the interview schedule
The interview schedule (Appendix C) was based on a list of key research questions posed by DECC. It was developed and refined by BRE’s Social Research team and District Heating experts in conjunction with DECC.

Research into barriers to deployment of district heating networks in suitable locations
18
The interview was structured to take the interviewees chronologically through the stages of development. The questions were designed to identify what was done at each stage, the barriers faced and how these could be reduced or removed for future schemes. The schedule was structured as follows:
• Overview of the stages of development and how long each stage lasted
• Objectives and mobilisation – the drivers behind the scheme and the barriers faced in the
early stages of development
• Scoping the scheme and assessing the technical feasibility
• Financial appraisal – assessing if the scheme was economically viable
• Implementation and operation.
A semi-structured interview schedule was used to allow the interviewers some flexibility with regard to the order the questions were asked and the use of probes, whilst still ensuring there was consistency in terms of the questions asked by the different interviewers. For example if, when answering one question, the interview participants started referring to issues relevant to questions later in the interview, the interviewers had the flexibility to follow this area of discussion before returning to their original place in the schedule.
The schedule was made up of key questions asked by all interviewers as well as follow up probe questions related to the area of discussion. For example, interviewees were asked:
“What (if any) external support did you receive at this stage?”
The interviewers could then follow up this question with the following probes, if the interviewees
had not already covered these aspects in their original answer:
- How easy was it to define and find the support you needed?
- Did you use consultancy support? If so, how did you identify consultancy support
and how did you procure it?
- Was there any additional support that would have helped at this stage?
- What kind of support would help future schemes at this stage?
Interviewer briefing
The interviews were conducted by four staff from BRE, Centre for Sustainable Energy, and Edinburgh University. To ensure the data collected was unbiased and there was consistency in the delivery of the interviews, a briefing workshop day was run by BRE’s Social Research Team.

Research into barriers to deployment of district heating networks in suitable locations
19
The aim of the workshop was to:
• Introduce the interviewers to the pre-interview questionnaire and the information it
covered about the schemes they would be interviewing.
• Introduce the interviewers to the participant briefing document and consent form.
• Give interviewer facilitation training to those who had less prior experience.
• Outline the use of recording devices.
• Review the latest draft of the interview schedule and outline the key focus of each
question to ensure the questions were not interpreted in different ways by the
interviewers.
• Introduce the accompanying data entry tool and how to use it.
To check the quality of the interviews and the findings being submitted, a member of BRE’s Social Research team subsequently also observed one of the interviews and reviewed the findings from several other interviews, providing feedback to interviewers.
Carrying out the interviews
In general the interviews took 2.5 to 3 hours, although this had sometimes to be reduced according to interviewee commitments. All of the interviews were recorded.
The interviewers always travelled to the most convenient location for the interviewee(s), most commonly the premises of local authorities, developers, or energy services companies.
A total of 63 people were interviewed. The most authoritative source for such projects were scheme champions. Most of the interviews were carried out having tracked down that person. Although most of the interviews were therefore with that individual, sometimes they build a project team and where possible interviews were sought with project teams. Where there was more than one interviewee, there were no significant disagreements, so that facilitation was limited to ensuring that the interview kept to time and that views were fully expressed within the available time constraints.
The same schedule was used for all interviewees. For the energy services providers the responses were more generic because they were responding to the circumstances for multiple schemes.
2.4 Data collation and analysis
2.4.1 Pre-interview Questionnaire Individual data output files were created for each scheme and (where possible) these were sent to the relevant interviewers to provide them with background information and help them

Research into barriers to deployment of district heating networks in suitable locations
20
prepare for the interview. In addition, the latest questionnaire dataset has been analysed to provide cross-sample statistics for the schemes taking part in the project.
2.4.2 Interview findings Due to the very tight time constraints and budget available for this project it was not possible to produce full transcripts of the interviews. Instead an online data entry tool was created to allow the interviewers to record the findings of their interviews from anywhere and at any time. The tool was designed to ensure there was consistent reporting of the findings from all interviewers. The tool collected all the findings into one data file meaning responses to the interview questions could easily be compared across all schemes. It was designed to allow quick analysis across schemes to identify consistent barriers. PDF files were also produced showing the findings from each interview.
The district heating experts at BRE analysed the interview data extracted from the data collection tool and audio recordings. The analysis was led by one expert who looked at all the data from all of the interviews. This expert was supported by other members of the team with the collation of the data and the interpretation of the findings. The findings from each interview were analysed and the key barriers and enablers were identified and highlighted. The analysts then looked at how the reported barriers and enablers clustered across the schemes reviewed. The analysis looked to see which schemes reported similar barriers and which barriers consistently emerged. As well as looking at how the identified barriers clustered across the different schemes, the analysts also examined how schemes differed in terms of the barriers they experienced.
Using the information collected through the pre-interview questionnaire (where available) and the interviews themselves the analysts looked at the main themes that emerged for particular types of scheme. The analysis looked at the types of buildings served by the networks, the size of the schemes, who led the scheme development (e.g. private developer, local authority), and the stage of development (including if the scheme had been extended). The analysts looked for consistencies in the reported barriers across these factors. Where possible, they also looked at who within the teams identified the barriers and which parts of the project teams the barriers affected.

Research into barriers to deployment of district heating networks in suitable locations
21
3 Quantitative data
3.1 The Findings
The following outlines the findings of the pre-interview questionnaire. The findings are presented in the following two sections.
• Operational Projects: quantitative information about the design and performance of
complete and operational schemes
• Planned Projects: basic quantitative information about the planned design and
estimated performance of schemes which are still in development
Appendix D contains details of the data from the pre-interview questionnaires.
3.2 The Schemes
The findings below are based on survey responses from 40 district heating schemes located across the country. The responses have been received from a total 39 survey forms issued. It should be noted that some respondents have submitted details on more than one scheme. Table 5 summarises the breakdown between operational schemes, planned schemes, and those that did not proceed.
Table 5 Scheme status
Frequency Percentage
Complete and operational 28 70.0
Still in development 11 27.5
Did not proceed 1 2.5
Total 40 100.0
Note: The questionnaires were sent to all case list schemes for which interviews were sought. Some interview respondents did not return questionnaires, and some submitted details of more than one scheme.
3.3 Operational Projects
There were 28 schemes reported to be complete and operational; however, no further information was provided for 3 of those schemes. As a result the findings presented below concern factors that focus on the performance and design of 25 of the 28 district heating schemes which were reported to be complete and operational.

Research into barriers to deployment of district heating networks in suitable locations
22
Respondents were asked how long it took for the projects to become operational following completion of construction. One project took 24 months to become operational after construction, 4 times as long as any other project. On average, it took just over 1.5 months for the remaining schemes to become operational after construction was completed.
Since becoming operational, 18 of the 25 schemes have been expanded.
Of the 25 schemes, 12 have been expanded at least once, with 2 schemes reported undergoing as many as 4 expansions. The length of time after which a scheme underwent expansion after their becoming operational varied considerably from 3 months to 4 years. However, on average the first expansion generally occurred about 19 months after the scheme had become operational.
The 25 operational schemes vary widely in terms of size, configuration and buildings served. To illustrate, the smallest scheme serves just 2 non-domestic buildings, whilst the largest scheme serves 3000 dwellings and 26 non-domestic buildings. This and other variations are reflected in the statistics related to system performance and design.
The reported total heat supplied to networks by systems ranged from 1981 to 108,000 MWh. A median of 16,909 MWh (average 26,071 MWh) of total heat was supplied to networks by systems in the last 12 months. The same wide variation is also present in the reported peak heat output of the system over the last 12 months. Values ranged from 0.3 to 40 MW, with a median of 4.407MW (average 8.486 MW).
Figure 1 Operational schemes reporting primary heat source. (N=25, 1 missing)

Research into barriers to deployment of district heating networks in suitable locations
23
Respondents were asked to detail the heat generating technologies and fuel types within their schemes. They were able to specify a primary, secondary and back-up heating system.
Looking solely at the primary heat source (Figure 1), it can be seen that CHP is by far the most used heat generating technology. Gas boilers are the most commonly used heat generating technology for secondary heating systems (Figure 2).
Figure 2 Operational schemes reporting secondary heat sources. (N=25, 4 missing)
Approximately half, (12 out of 25) of the complete and operational projects report their schemes incorporate a thermal storage unit. The volume of these units varied considerably, with one unit reported as being 2,300 m3, two and a half times larger than the next largest unit. The remaining units ranged from a much lower 30 to 950 m3, with median volume of 100 m3 (average 198.30 m3).
In addition to indicating the presence or not of a thermal store, respondents were also asked if their schemes incorporated a CHP system to indicate how much electricity was generated in the system in the last 12 months.
Of the 18 schemes for which this information was provided, one had managed to generate 95,559 MWh of electricity, more than twice as much as any other scheme reported. The 18 systems reported values ranging between 214 and 95,559 MWh. A median of 8,350 MWh (average 14,489 MWh) of electricity was generated.

Research into barriers to deployment of district heating networks in suitable locations
24
Figure 3 The breakdown of building types served by operational schemes. (N=25, 1 missing)
The schemes differ widely in terms of the composition of buildings they serve, (Figure 3). Three quarters of all schemes serve a mixture of domestic and non-domestic buildings. A total of 21 complete and operational systems are connected to non-domestic buildings. Across these 21 schemes buildings from all sectors are served, however the most commonly connected are, in ascending order, Commercial Offices (80 units), Retail (151 units) and Education buildings (163 units).
Unsurprisingly, there is a large variation in the floor area covered by non-domestic buildings, one scheme was reported to serve non-domestic buildings that covered 500,000 m2 and another buildings covering 800,000 m2. The remaining schemes were connected with non-domestic buildings that covered more modest sized spaces, ranging from 1,000 to 200,000 m2, with a median approximate floor area of 40,000 m2 (average 57,871 m2).
Respondents were asked to provide some information on the external distances that pipework covered within their schemes.
The largest total length of external pipe work trench for a network was reported to be 50 km, this scheme also reported to have the largest distance (4.5 km) between the energy centre and the furthest buildings served by the network.
In total, seven schemes reported external pipework at least 10 km long and one scheme reported a value of 0 m. The median total length of pipework for the network is just over 3 km (average 7.6 km).
Although the distances are shorter, there is as much variation in the reported distance between energy centres and the furthest building served by the network as there is in the total length of
Research into barriers to deployment of district heating networks in suitable locations
25
pipework. Distances range between 4.5 km and 90 m, with a median distance of 64 m (average 1.08 km).
3.4 Planned Projects
Those respondents who indicated that their schemes were still in development were asked to provide information on the estimated performance of the system once operational. This section presents the findings in relation to estimated performance and planned design and is based on 11 schemes.
With regard to performance the respondents were asked to indicate the estimated total heat to be supplied to the network per annum as well as the estimated peak output of the system. The system specifications along with the number and types of buildings served by the proposed networks vary considerably. The smallest scheme serves 2 non-domestic buildings compared to the largest scheme which serves 28 non-domestic buildings. This variation leads to significant variation in the estimated performance of the schemes.
The estimated total heat supplied to the proposed networks per annum range between 4,000 and 101,406 MWh with a median of 8,978 MWh (average 22,677 MWh). The estimated peak output of the proposed systems has a median of 6.0 MW (average 7.6 MW) and ranges between 2.0 and 20.0 MW.
Respondents were asked to detail the proposed heat generating technologies and fuel types that will be used for their schemes. As with the operational schemes, CHP units are the most frequently specified heat generating technology for proposed primary heating systems. Gas boilers are the most frequently specified technology for the proposed secondary and back-up systems.
Seven out of ten of the proposed projects intend to incorporate a thermal store within their systems. The proposed volume of the thermal stores within the schemes ranges between 35 and 750 m3 with a median of 118 m3 (average 247 m3).
Respondents were asked to estimate how much electricity would be generated per annum, if their proposed schemes included a CHP system. Looking at the five cases where CHP is specified the expected amount of electricity generated per annum ranges from 100 to 49,857 MWh, with a median of 7,957 MWh (average 16,692 MWh).
Half of all schemes propose to serve a mixture of domestic and non-domestic buildings. Nine of the 11 systems are intended to connect to non-domestic buildings. Across the 9 schemes buildings from all sectors with the exception of hotels and industrial are served. The non-domestic buildings most commonly proposed to be connected to the developing systems are in ascending order Commercial offices (10 units), Government buildings (26 units) and Education buildings (27 units). The median approximate floor area covered by all non-domestic buildings in developing schemes is 30,000 m2, (average 42,803 m2).
Respondents were asked to provide some information on the external distances that pipework will cover within their proposed schemes.

Research into barriers to deployment of district heating networks in suitable locations
26
The largest total length of external pipe work trench proposed for any one network is 75 km; this is bigger than any reported scheme either operational or in development. Unsurprisingly this scheme is also the one to have the largest proposed distance (3.5 km) between its energy centre and the furthest buildings served by the network.
With the exception of the scheme mentioned above the total length of external pipe work in proposed schemes ranges between 0 and 7000 m (indicating that at least one scheme reported will have no external pipe work at all). The median total length of pipework for these proposed networks is just over 2 km (average 2.6 km).
The distance between the energy centres and the furthest building served by the proposed networks range between 0.2 and 3.5 km, with a median distance of 0.5 km (average 1.03 km). These values are in line with those seen in the complete and operational schemes.

Research into barriers to deployment of district heating networks in suitable locations
27
4 Key areas where barriers to district heating have been identified
The sub-sections below address themes, highlighted in the DECC research specification and through the interviews, where barriers to district heating were identified.
In the text of the sub-sections, the key objectives of the research are addressed and the stage in the process at which particular barriers occurred is highlighted. The answers to the research questions that DECC posed in the research specification are interwoven within the sub-sections below. Appendix E contains a table which describes how to interpret comments in the report relating to the magnitude of the response.
Where the interview data set contained sufficient detail, the text makes reference to the specific roles of the individuals. However, for the majority of project teams, the primary contact point identified themselves as either the project manager or an energy manager. In a large proportion of the remaining cases, the primary contact did not fall into one of the standard categories. These included planners and housing officers, and is a reflection of the fact that in some cases a staff member is simply asked to take on an additional role.
Barriers and issues covered include:
• Difficulties with meeting development and capital costs
• Uncertainty regarding longevity and reliability of customer demand
• Uncertainty regarding reliable heat sources
• Lack of regulation and inconsistent pricing of heat
• Lack of generally accepted contract mechanisms
• Lack of a generally accepted and established role for local authorities
• Choice of heating system
• Skills gaps
• Access to land
• Tax and business rates
• Air quality approval.

Research into barriers to deployment of district heating networks in suitable locations
28
4.1 Difficulties with meeting development and capital costs
Internal and external resources were required during the development and implementation stages of all projects. As well as needing to secure the money required, for example for consultancy advice, the instigators of the projects (e.g. local authorities, property developers) stated that they were also required to devote considerable in-house resources to progressing the project. One local authority project team concurred that the provision (or otherwise) of adequate resource to properly cover these aspects is the key difference between schemes that are able to proceed and those that stall.
The first two sub-sections below address the particular difficulties found with meeting the development and capital costs in local authority and property developer led schemes. The final sub-section examines the common problem of accommodating the extra costs involved in sizing the initial scheme to allow future expansion without the guarantee of additional revenue.
4.1.1 Local authority led schemes The first of the two main sections under this sub-section considers the internal and external costs that fell on the local authorities during the development stages of the projects. The second section specifically considers how the capital costs to implement the schemes were raised and describes the associated difficulties.
4.1.1.1 Development costs
The text below is split into the process stages adopted in the project interviews:
• Objective setting and mobilisation
• Technical feasibility and financial viability
• Implementation.
Objective setting and mobilisation
For the projects investigated, the resources required to mobilise the initial scheme investigative work were mostly provided from in-house staff. Several respondents referred to the time-consuming nature of this task where it was necessary to liaise and meet with many people in different departments and organisations on multiple occasions. This sometimes resulted in initial slow progress as local authority personnel often had to juggle a range of competing priorities. One local authority project manager stated “Individuals are facing immense pressure just to focus on more traditional infrastructure aspects.”
However, in a few cases the scheme instigator provided a dedicated resource to drive the project forward. A consultant involved in several of the projects, highlighted how pro-active local authorities sometimes appointed a dedicated decentralised energy officer to drive schemes forward, although often no such resource existed.

Research into barriers to deployment of district heating networks in suitable locations
29
Technical Feasibility and Financial Viability
Several local authority respondents referred to the difficulty of raising internal money to conduct a detailed investigation of a scheme that may not ultimately proceed. At the technical feasibility and financial viability stages, several local authority led schemes obtained external development grants to support work undertaken by consultants examining the technical and economic feasibility of their schemes. This work was often a key component in building confidence to obtain approval for implementation of the scheme.
The interviewees for one such scheme highlighted that the feasibility study demonstrated that, while there was an investment required to make the scheme happen, the scheme was economic and do-able.
Local authority personnel identified that an initial barrier to progressing schemes was identifying money for the external feasibility work. A local authority project manager stated: “Without this external money we certainly wouldn’t be doing any studies of this nature now.” A consultant who had been involved in undertaking feasibility work for several of the projects also identified this as a significant barrier which local authority personnel encountered early in a project.
Unusually, the local authority representative, a housing officer, for two related schemes in the same city indicated that the technical feasibility studies were undertaken by a consultant working at their own risk in return for a professional fee. This was set as a percentage of the total capital cost of the development, payable only if the project went ahead. The financial appraisal for these schemes was paid for from internal council resources.
Another local authority was able to share the costs of the feasibility study 50/50% with the regional planning authority. However, two other local authority project managers pointed out that the withdrawal of support provided by Regional Development Agencies (technical, financial, and facilitation) now constitutes a new significant barrier.
A prominent energy services provider (ESP) thought that consultants were charging too much for feasibility studies, sometimes £50-60k. This view was supported by a manager from an authority who had been involved in several large schemes. For a few schemes the consultancy arm of an ESP assisted with undertaking technical feasibility and financial viability work. As this placed the ESP in a strong position to proceed with implementing the scheme, obtaining a large fee for the feasibility study was not such an important consideration. Despite the possible lack of impartiality with adopting this route, some project managers seemed willing to adopt this approach as they perceived the ESP had greater understanding of the commercial aspects.
One local authority described how they used an assessment from one of the Big Four accountancy practices to formulate their thoughts on how financing could be provided and the rate of return expected for each option. Break-even analysis and net present value (NPV) over 30 years was then used to determine an ‘acceptable’ heat price i.e. the heat price required to achieve the required return on investment.
Implementation including Procurement
Interviewees from a few local authority led schemes identified that one barrier was the substantial costs associated with undertaking a procurement exercise, for example legal fees, to enable implementation of schemes. One of these interviewees, a local authority officer,

Research into barriers to deployment of district heating networks in suitable locations
30
suggested that this could be £500k for a large scheme following the competitive dialogue path. This represented a significant cost to them, although they had obtained a grant to help with initial soft market testing.
One energy services provider (ESP1) also expressed the strong view that the procurement phase, where tender documents and the final business case were prepared, was the point in the process where the scheme usually stalled. Although schemes could fail for many reasons, in their view the most common reason was that the local authority did not have enough money to carry out the procurement process. They were advised that the costs for implementing scheme procurements were typically £200-250k per scheme.
4.1.1.2 Capital costs
Given that many of the schemes falling into this category benefited from central government support, the text below starts off by considering capital grants before discussing other forms of monetary support and finance. It concludes by discussing private sector finance which was required to close the gap to enable projects to proceed.
Capital grants and other financial incentives
When it came to constructing the scheme, some local authority led schemes received capital grants from two notable (but no longer active) programmes, DEFRA’s Community Energy Programme (CEP) or HCA Low Carbon Infrastructure Fund (LCIF). In the case of CEP supported schemes, up to 40% of the installed capital cost was secured, with the balance obtained from private sector or public sources or a mixture of the two. The interviewees for these schemes often identified this grant support as a critical element in allowing the required economic return to be achieved and their scheme to progress. The interviewees for several schemes explicitly stated that DH would not have been installed but for the existence of the capital grant. A manager for one of these local authority led schemes stated that they “would not have considered DH without that financial support”. Similarly, a project manager for a different scheme stated “without the government money (HCA grant) this scheme wouldn’t have worked”.
Such grants do not necessarily need to be huge: the grant received by one scheme was small in comparison to the overall scale of the project, but was sufficient to transform a negative NPV to a positive one. At one site, scheme developers were persuaded to accept lower IRRs than usual because they perceived a longer term strategic benefit i.e. increased security of supply.
Where the date by which the capital grant had to be paid could be extended, this helped to facilitate delivery of the scheme as delays to the implementation schedule inevitably occurred. In contrast, a couple of schemes that were allocated capital grant support under the CEP identified the tight deadline for spending the grant as a problem which had to be closely managed. The detailed procedures and processes involved in applying for grants were also identified as a difficulty.
ESP1 also considered that some kind of future financial incentive from government was needed to get schemes off the ground (further details of the proposal are contained in section 5.2.3). In their view, while this may not always be needed after economies of scale had driven down installed capital costs, the current cost of schemes in many cases necessitated some form of external support to proceed. It was also considered that the UK market was hampered by a lack of suitably qualified contractors in the UK, as well as a reluctance of UK contractors to
Research into barriers to deployment of district heating networks in suitable locations
31
adopt the latest installation techniques. They considered that this would be rectified if there were many more schemes, as in Scandinavia. The project manager for a large growing scheme also considered that there was a need to reduce prices for pipes, pipework and construction, as UK prices remained very high compared to Scandinavian Countries. Recently there have been reports of plans to expand pipe manufacturing capacity in the UK and this may serve to reduce pipe costs.
Avoided cost contributions and energy company support
In a couple of schemes the money which would otherwise have been spent on installing a replacement individual heating plant, i.e. the avoided cost, was provided as a contribution towards the installed capital cost. For one of these, a scheme serving high rise apartment blocks, the avoided costs of the individual heating plant were suggested to amount to 60% of the installed capital cost of the district heating.
Other sources of grant were also accessed in a number of schemes. For example, a local authority led scheme obtained support from energy suppliers through the Carbon Emission Reduction Target (CERT) and other regional monies. Another ESP (ESP2) considered that the Energy Company Obligation (ECO) offered particular opportunities for retrofitting existing residential properties. However, they considered that certain barriers made it more difficult than it should be. For example, as some of the ECO money could only be applied to deprived areas, identified by postcode, this meant there were limitations to its widespread use for district heating.
Private sector finance
One local authority led scheme made up the gap in the capital cost from the housing capital programme budget. However, in several other cases, although they did not necessarily want to follow this path due to perceived loss of control and repayment charges, the scheme instigators had to access private finance to close the gap and enable the scheme to proceed.
A local authority project team described how their scheme had recently progressed without a capital grant. In the case of this large scheme, this was achieved by the local authority committing several of their buildings to a long-term heat supply contract and being prepared to drop optional items with high capital costs e.g. individual heat metering for dwellings. This enabled the scheme to achieve the required return on investment, and private sector finance to be obtained through the energy services provider.
Another planned local authority led scheme was considering borrowing the money themselves. They considered that they were able to borrow money at a lower rate than the ESP (they suggested the ESP could borrow at 8%). A consultant involved in several schemes suggested that, where local authorities wanted to maintain maximum control over schemes, they sometimes considered raising money themselves, rather than through a ‘one stop shop’ ESP. A local authority with an established larger scheme serving multiple non-domestic buildings felt that the government should allow the authority to borrow money outside prudential borrowing arrangements where there was a guaranteed revenue stream.
Of particular note was that the ESPs that wanted to invest in a particular scheme usually had to obtain the specific approval of their parent company. To obtain this they had to demonstrate

Research into barriers to deployment of district heating networks in suitable locations
32
that the scheme was robust and would achieve the required rate of return. In this sense, the parent company was often fulfilling the role of the investor. ESPs were generally reluctant to reveal any information about the required rates of return (see section 4.1.2 for further information on this issue).
The project manager for a local authority supported scheme established a cash flow model for their business plan and found that the actual scheme achieved a better return than expected. However, the hurdle internal rate of return (IRR) in that case was very low at 3%. In that case other factors such as retaining money within the local economy were bigger drivers than the return on investment.
4.1.2 Property developer led schemes In the case of property developer led schemes serving new buildings, several were obliged to be served by heat networks in order to meet local planning policy requirements. As such the cost of feasibility work was included in the developer’s overall planning costs and it was concerned with how the network would be accommodated rather than whether a network should be adopted. The property developer had to ensure that the network was developed in order for construction of the new buildings to occur, even if this reduced land values or profit margins.
A developer who was critical of this requirement viewed this as effectively a tax on new-build developments. Another developer questioned whether the potential benefits in new buildings justified the increased capital cost compared to electric heating systems. A different developer noted that the development viability implications arising from the additional capital cost of district heating had to be balanced against other local authority requirements, for example affordable housing. They also suggested that the potential to absorb the cost of DH varied according to locations across the country.
In most cases, the capital cost of installing the heat network was either shared by the property developer and a private ESP, or borne by the ESP. Where the ESP made a capital contribution to the scheme, this was reflected in the developer’s broader viability assessment. The willingness of the ESP to invest in the scheme was dependent on the financial return they were able to achieve.
Hurdle rates and scale necessary for ESPs to invest in new-build schemes
ESPs were understandably reluctant to talk about the hurdle rates for specific projects. In the case of a large scheme serving new buildings, the ESP aimed to achieve an IRR of 12%; however, they were unwilling to reveal the actual hurdle rate adopted for commercial reasons. Another ESP believed new DH schemes for new build developers were less risky than new DH schemes for existing buildings due to various factors e.g. less risk of obstacles being identified in the ground causing cost increases. This caused them to adopt a 1-2% reduction in the hurdle IRR for those schemes.
However, achieving a satisfactory return was also dependent on scale and there was a minimum scheme size (circa 300 dwellings) below which they were not interested in delivering schemes. Another ESP (ESP3) primarily involved in residential led schemes stated that they aimed to have at least 400 flats as a minimum size of scheme. At that threshold they considered that CHP started to stack up economically. Another provider indicated that 500 dwellings was the minimum size of scheme they would be interested in.

Research into barriers to deployment of district heating networks in suitable locations
33
One developer considered that while increased scale improved the investment potential, the scheme operator got more benefit from it than the scheme instigator. Aside from NPV and IRR, property developers were ultimately concerned with two costs: 1) the capital cost per dwelling and 2) the heat cost per dwelling.
In general, for schemes serving new buildings, where the driver was meeting planning policy, the upfront capital cost was often not as big a barrier as in local authority led schemes serving existing buildings.
4.1.3 Sizing schemes to allow future expansion without guaranteed additional revenues For both local authority and property developer led schemes, a significant barrier to making networks investable was the additional cost of allowing capacity for future expansion in the initial scheme design. This cost was sometimes difficult to accommodate in the absence of guaranteed additional revenues. Conversely, several schemes depended on realising future expansion capacity to make the schemes stack up over the longer term.
Some schemes were designed with the ability to expand through, for example, oversizing pipes and building in additional space in the energy centres. It was noticeable that for these schemes, the instigators approached the scheme from the start with a strategic perspective.
An ESP responsible for a large scheme serving multiple new buildings was able to build in a significant amount of additional space in the energy centre to allow extra plant to be installed at a later date as demand increased. Allowance was also made in the pipe sizing to accommodate significant new expansion.
This additional investment was possible due to the land owner providing the ESP with a concession agreement requiring all new buildings built within a defined geographic area to connect to the heat network. While it was not possible to provide that level of certainty for all schemes, it did provide an example of the kind of guarantee required to ensure provision is made for future expansion.
A scheme with similar characteristics was also able to build the energy centre with significant extra space to accommodate additional plant to allow the scheme to expand. In this case, it was again due to the scheme instigator’s strategic objective for the scheme to grow as part of wider regeneration plans.
The cost of installing pipework for scheme expansion in dense urban areas was highlighted by ESPs as a constraint on expansion. ESP2 suggested this can be as high as £2k/m in London compared to £1.2k/m to £1.5k/m in other cities. ESP1 suggested a figure of £2k/m in urban areas. For one local authority involved for the first time it was the difficulty of actually establishing costs that was disconcerting. In their attempt to secure an estimate for a specific pipe run to serve the first phase of a system, they reported that: “The range of costs that we found for laying pipes was ridiculous… We haven’t been able to get… an accurate costing.”
Satellite schemes were often designed (future proofed) to allow them to be connected to area wide district heating networks. In one city housing estates with communal heating built decades ago were being linked together into a wider city scheme. However, their generally small scale sometimes meant there was less likelihood of them expanding in their own right.

Research into barriers to deployment of district heating networks in suitable locations
34
Occasionally schemes were built in locations where little regeneration was taking place and the surrounding area consisted of low density housing, meaning there was little potential for scheme expansion. While there was sometimes potential for linking adjacent developments, there was little appetite amongst developers for doing this when they were constructed, perhaps due to mismatches in construction timetables and a desire to maintain independence of operation.
An ESP highlighted the problems of building in space for a large energy centre (capable of serving the whole development) in the initial phase of a multi-phase new build development. Even though there were life-cycle benefits in adopting the single large energy centre, they highlighted that the developer often wanted to install a small energy centre per phase to keep down the capital cost of the initial phases. The reluctance to spend money now for phases that may be built in 5 or more years was a barrier to achieving the optimal configuration of technology.
Taking into account the requirement for new homes to be zero carbon by 2016, some ESPs have made a virtue of the fact that their network will be able to facilitate developments meeting these requirements. This enabled both provider and customer to think longer term. However, a property developer also considered that there was a lack of clarity regarding the future direction of government policy and targets relating to 2016, resulting in more uncertainty for scheme developers.
4.2 Uncertainty regarding longevity and reliability of customer heat demand
An important consideration during the technical feasibility, financial viability, as well as implementation stages of a project, was the longevity and reliability of the heat demands. The sub-sections below discuss the different issues that affected the build-up and retention of heat loads in local authority led and property developer led schemes.
4.2.1 Local authority led schemes Interviewees for local authority led schemes seldom identified uncertainty regarding the longevity and reliability of customer heat demand as a significant barrier. The impact of reduced heat demand, for example through building refurbishment or building closures, was tested at the feasibility stage to ensure the scheme was still economic at different sensitivity levels.
A local authority representative suggested that it would be challenging to retrofit existing public sector buildings in a city centre with external thermal insulation in order to substantially reduce heat demand. Hence, they considered that these heat loads were reliable.
A consultant involved in several of the schemes considered the risk of future demand disappearing to be a ‘huge red herring’. Even if demand did reduce this could be replaced by linking other heat loads, thereby replacing the lost demand.
Occasionally the uncertainty associated with future private sector heat loads was identified as a barrier to scheme expansion. A consultant suggested private sector customers were only prepared to sign up for a maximum of 5 years in advance. However, as local authority led
Research into barriers to deployment of district heating networks in suitable locations
35
schemes have public sector buildings, with associated long life times, at their heart this was not identified as a particular barrier to instigating schemes.
A local authority in an inner city area stated that social housing, provided directly by the council or via a registered social landlord (RSL), represented around 45% of dwellings. This together with the high density (dwellings/hectare) meant that they were confident of replacing any lost or reduced heat demand. This substantially reduced their perceived risk.
ESP1 aimed to compensate for any reduction in heat load of connected buildings, for example through increased energy efficiency measures, by connecting additional buildings. They did not operate a take-or-pay contract and considered that such an arrangement would give the industry a bad name. However, within the last couple of years they had seen a reduction in the heat consumption of a large scheme they operated even accounting for new connections - the reasons for the reduction, allowing for temperature corrections, were not clear.
A couple of schemes indicated that while it was relatively straightforward to obtain heat consumption data for council owned buildings, accessing this information from organisations over which the council had little influence was much more difficult.
4.2.2 Property developer led schemes In the case of schemes serving new buildings across an area, the financial crisis of recent years had meant that planned new buildings had sometimes not been constructed. A few large schemes serving new buildings found that this resulted in significantly slower build-up of cumulative heat demand than originally envisaged.
However, this reduced demand for heat was sometimes compensated by identifying other buildings outside the original project area. In another case, the developer agreed to pay ESP2 a flat fee per dwelling if, for economic reasons, the full number of dwellings approved as part of the planning application were not built out. A consultant involved in several projects considered the build-up times and magnitude of heat loads in new buildings to be uncertain when compared to existing buildings.
The largest scheme developed to serve new buildings was the beneficiary of a concession agreement which required all new buildings developed within a defined geographic area to obtain their heat supply from the district heating network. This helped to facilitate rapid investment in energy generation and distribution infrastructure to meet the critical time frame required for the core buildings in the area. Another very similar type of scheme did not benefit from such an arrangement, meaning there was less certainty regarding future heat loads and scheme expansion.
ESP2 identified that one difficulty was the process of reliably calculating the heat consumption of new buildings including dwellings when developing schemes. They used empirical data from existing new developments to supplement information arising from building simulation models.
In some smaller schemes, particularly those serving a clearly defined area, the potential for future expansion was not always considered at the initial stages. ESP2 highlighted that, once a scheme was established, the marginal cost of connecting additional buildings was often relatively low.
Where an established scheme was in existence, new build developments did not always connect due to factors such as the cost of connection and uncertainty regarding the long-term

Research into barriers to deployment of district heating networks in suitable locations
36
future of the network. Developers also liked to maintain control over their schemes to avoid the risks of relying on another party to supply heat to consumers who had bought apartments from them.
A couple of very mild winters were also cited by one scheme developer as significantly impacting the financial projections. It is important that the possibility of an increasing frequency of milder winters is taken into account in projections of heat demand and/or the benchmark assumptions for heat demand of buildings.
4.3 Uncertainty regarding reliable heat sources
At the technical feasibility stage the reliability of different heat sources was considered, together with the risks associated with individual heat sources. Once a scheme was operational, in due course the operator also needed to consider whether the primary heat source would be replaced with a like-for-like replacement or an alternative heat source.
When a scheme expanded, the reliability of additional heat sources was also considered. A couple of interviewees stated that one barrier to district heating was the perceived vulnerability arising from committing to obtaining heat from a single source. However, another large scheme planned to mitigate this risk by accessing heat from a new power station to supplement that already obtained from an established source in another part of the city.
4.3.1 Combined heat and power (CHP) As highlighted in chapter 3, in most cases, schemes used natural gas fired CHP as the primary heat source for the district heating network. The text in this sub-section discusses the issues with adopting this common technology.
There was little concern regarding the reliability of the main heat source, at least during the short to medium term operating period. ESP1 did highlight that carbon savings from gas fired CHP would decrease as the electricity grid was decarbonised. This would cause them to consider other technologies which enabled them to continue to offer a heat supply which provided continued carbon savings.
A few interviewees considered that people didn’t understand that gas CHP could still deliver major carbon savings and that the push for renewable energy technologies had caused them to lose sight of the benefits of gas CHP. As the Head of Environmental Management at a local authority put it “… we rapidly realised that the more traditional approach of gas CHP was the first step to taking groups with us.”
Some heat sources only become financially viable when certain size thresholds are reached. One scheme that has started with gas CHP intends to introduce large scale biomass CHP later on when they have secured sufficient connections. They have designed the energy centre accordingly.
CHP electricity sales and connections
A few interviewees also highlighted that managing the sale of relatively small amounts of electricity from gas CHP could present challenges which impacted on the price of heat and

Research into barriers to deployment of district heating networks in suitable locations
37
were best managed by the ESP. A property developer who did not fully involve an ESP reverted to just using the CHP electricity for landlord supplies within their development.
A few local authority led schemes identified spark spread2 as a financial viability risk. In particular, the risk of the income from electricity sales revenue, net of CHP gas and maintenance costs, resulting in too high a cost of heat production was highlighted.
Other interviewees highlighted that a barrier to CHP-based district heating schemes was the removal of Levy Exemption Certificates (LECs) from CHP electricity sales. Operators have had to absorb the lost revenue of 0.45p/kWh of electricity generated which was an unforeseen risk which has impacted upon the profitability of the schemes. One of the ESPs who was a ‘big six’ energy supplier sells the CHP electricity to themselves.
A representative for a local authority derived scheme which exports electricity to the grid stated that "Government can help make urban heat networks happen by getting it accepted that CHP can be used to 'hatch' heat networks and therefore help CHP operators get a better deal for their electricity".
ESP2 thought there would be benefit if the price differential between what customers paid for electricity, and that paid for CHP electricity in the wholesale market could be captured for the benefit of the district heating scheme. Another ESP has adopted direct supply of electricity at a number of their schemes. This followed Ofgem guidance allowing customers to be legally tied into private wire arrangements provided third party access was offered.
ESP3 took the view that, due to the changes in the private wire legislation (resulting from the Citiworks ruling), private wire was no longer do-able. They had a scheme serving several hundred apartments where the apartments were on a private wire arrangement but they were considering disposing of this arrangement. The manager of a local authority led scheme with experience of private wire networks considered that it was better to sell CHP electricity direct to customers rather than selling to a supplier via the grid.
A consultant involved in several schemes, highlighted that utility connections could cost a considerable sum of money. Particularly in London, there could be constraints to installing embedded electricity generation, such as CHP. If a connection had to be made further up the electricity network due to lack of capacity at the local sub-station, this could by itself make a project unviable.
Other interviewees suggested that there was a need to simplify the licensing regime related to the generation and supply of electricity for small operators.
4.3.2 Other heat sources In a few cases schemes relied on other sources of heat and the issues surrounding these are described in the text below. In some cases, these were less reliable sources; for example, engines fuelled by landfill gas where the landfill gas supply was time limited. However, the long term uncertainty regarding the heat supply source was not always apparent to interviewees at the feasibility stage.
2 Spark spread is the difference between the price for selling a unit of CHP electricity and that paid for a unit of fuel.

Research into barriers to deployment of district heating networks in suitable locations
38
Biomass
Several of the schemes used or planned to use biomass as a fuel. A couple of these schemes reported no problems with the operation of the biomass boilers.
However, some interviewees who expressed a view considered there to be uncertainty associated with adopting biomass as a fuel source. For example, a property developer providing a scheme serving new buildings in a dense urban environment indicated that they did not consider biomass in detail due to issues associated with air quality, delivery, technology risk and fuel sourcing.
Other schemes using biomass encountered difficulties in gaining accreditation under the Renewable Heat Incentive (RHI). ESP1 and a scheme instigator also pointed out the low level of price support provided for large scale biomass under the RHI. ESP3 stated that they tried to avoid biomass because, in their view, it did not save money and undermined CHP. An equipment supplier considered that there was potential risk specifically with biomass CHP although they were aware of examples of this technology being adopted in non-district heating applications.
Heat from waste
One local authority scheme strategically considered the options for replacement of their existing waste incineration plant with opportunities to develop district heating. The scheme was successfully developed on a heat only basis despite a major power station generation company withdrawing from the process because they did not want to supply heat at the temperature required by the district heating network (due to the related loss in electricity output).
The availability of very low cost heat from the Waste-to-Energy plant was a key factor in being able to provide customers with energy cost savings compared to alternative individual heating technologies. Uniquely, this scheme was initiated without any guaranteed heat customers (not even local authority buildings). However, they also identified the risk of the waste source reducing or disappearing as a barrier. The limit on heat available from the incinerator became a constraint to the expansion of the scheme. However, the local authority scheme instigator thought that there was significant potential for Waste-to-Energy in the UK. They felt that Waste-to-Energy operators could cover their cost through gate fees (in lieu of avoided landfill tax). Therefore, they should be able to provide low cost heat, enabling the capital cost of the pipework to be accommodated.
A few interviewees for local authority led schemes that planned to use heat from Waste-to-Energy plants considered that government must get the balance of incentives between heat and power generation right if schemes were to proceed. The same issue arose in relation to a stalled scheme whose primary heat source was to be a very large fossil fuelled power station.
A different scheme considered a risk/barrier to be uncertainty regarding the future feedstock availability for Waste-to-Energy plant. However, a consultant believed the increasing requirement to deal with waste locally presented opportunities. And one local authority considered that by using waste as the primary heat source they helped remove themselves from vulnerability to the volatile gas markets.

Research into barriers to deployment of district heating networks in suitable locations
39
ESP1 considered that waste heat, for example from the combustion of municipal waste, was the ‘big nut to crack’ in terms of heat sources. While they have managed to exploit an existing source of heat in a recently signed scheme, they considered that this was difficult to do.
The reasons they cited for the difficulty were the lack of a register of waste heat in the UK and the complexity of the contractual interface between the heat generator and heat distributor. As no standard contract form existed for buying heat, a Heads of Terms agreement had to be put together and negotiations started from there. As the amount of money that would be paid for heat was small in comparison to the amount the heat generator earned from other core business revenue streams, they tended to not be interested in selling it.
This was compounded where the extraction of heat impacted on their ability to maintain production e.g. electricity. However, the ESP considered that government needed to really focus on that interface if they genuinely believed that waste heat could play a significant role in meeting UK energy requirements.
In the case of a large scheme serving new buildings, they decided not to proceed with an energy supply system based on gasification of waste due to viability issues associated with the technology.
Large heat pumps
None of the schemes that were the subject of an interview used heat pumps, although a few investigated their use. A property developer indicated that they were examining a ground source heat pump in conjunction with a very low temperature heat network to supply one of their new developments. ESP3 also indicated that they were considering heat pumps to supply district heating and cooling schemes. While it was only at the design stage they considered that it looked promising. While considering new technologies, ESP3 also included additional centralised boilers in their schemes to achieve reliability and ensure customer heat supplies were maintained at all times. Another scheme rejected a heat pump system as too risky.
A local authority representative for one planned scheme indicated that they were considering deep geothermal in addition to other heat sources.
Heat Storage
Although nearly half of schemes with gas CHP included thermal storage, it was mentioned relatively few times in the interviews. A Waste-to-Energy scheme which initially found it difficult to raise the money to include a thermal store, found that when they did install the system it paid for itself in five years. The benefit arose from being able to obtain more heat from the primary heat source, thereby reducing the use of expensive back-up fuel. They were investigating an electric boiler powered by surplus wind electricity generation.

Research into barriers to deployment of district heating networks in suitable locations
40
4.4 Lack of regulation and inconsistent pricing of heat
When it came to convincing customers to connect to district heating, ensuring they would be treated reasonably and be charged a fair price was an important factor. The subsections below discuss the general difficulties perceived to arise from a lack of regulation and the specific issues due to inconsistent pricing of heat.
4.4.1 General A few scheme instigators considered a barrier to the more widespread use of district heating to be the lack of regulation. A property developer had some difficulty convincing potential customer about a number of issues including security of supply, pricing, and lack of regulation.
Despite introducing scheme specific procedures to reassure heat network customers, including benchmarking heat prices to provide a discount against alternative forms of heating, the developer found difficulty in convincing them.
The developer therefore saw merit in government providing customer side regulation. In anticipation of increased future regulation in the heat market, they also decided to put in place separate operating arrangements relating to the heat network infrastructure and the energy generation plant.
Another new-build development also separated the contractual arrangements relating to the heat network and energy centre in order to simplify agreements. A different developer stated that a major barrier was the lack of regulation in the supply of heat. They believed that some prescriptive action was needed in order to ensure a reasonable heat price.
In contrast, ESP1 considered that on balance there was no case for regulating the district heating market. They considered that flexibility was the overriding principle required to initiate heat networks in the UK context. Wherever a scheme was considered, different barriers had to be overcome and agreements negotiated between the different parties.
However, there were some scheme specific measures that could be put in place; for example, the equivalent to statutory undertaker rights were provided to the district heating company in one city. They considered that an ESP’s need to maintain its reputation was sufficient a driver to avoid the need for regulation. In their view, issues associated with monopoly supply were completely dealt with through the contract, with customers treated fairly and information provided transparently.
4.4.2 Inconsistent pricing of heat Heat networks invariably involved the customer accepting a monopoly supply situation. In return there is expected to be some price incentive and a degree of certainty about the price in the longer term – this was a major driver at one new scheme. There were a whole array of methods used to charge for heat including flat-rate charging, charging based on individual consumer’s heat consumption and a combination of fixed and

Research into barriers to deployment of district heating networks in suitable locations
41
variable elements. As there was no universally adopted methodology for calculating the price of heat then this could form a potential barrier to building customer understanding and confidence.
Schemes with heat metering
The ability to charge based on an individual user’s consumption assumed that individual heat meters were installed for each dwelling and/or customer.
In nearly all schemes serving new-build developments which provided information for this study, heat meters were installed as standard, usually embedded within the hydraulic interface unit (HIU). The mandatory introduction of heat meters for schemes serving new buildings was not, therefore, seen as a barrier. The common approach was to offer a standard tariff with two or more elements, a variable heat charge based upon a price for heat in pence per kWh (as metered) and a fixed or standing charge.
The danger of customers’ heat tariffs changing dramatically was identified as a reputational risk by property developers. They wanted the heat charge to reflect the energy consumed and be less than or comparable with that which a consumer would normally pay for heat from a conventional source e.g. an individual boiler. A developer indicated that they mitigated this risk by adopting an ‘open book’ approach and declared to customers how the heat tariff was calculated. The tariff took into account the highest and lowest cost gas providers and was capped against the highest value. They also considered that as the ESP was also a major utility company they had a good communication and marketing programme to provide explanation for residents.
Two ESPs also indicated that, having learned from experience, they pegged heat prices to gas prices. However, one of these providers also stated that they charged the heat customer what they could in order to maximise their capital contribution to the heat network costs, thus reducing the amount that had to be put in by the developer. Also this commercial model set out to recover the costs and provide an IRR that was acceptable to the ESP.
One property developer felt that, in retrospect, they did not pay enough attention at the feasibility stage to establishing the life cycle costs of the heat network and the future cost of heat to customers.
A retrofit scheme which included residential consumers within its customer base and employed Danish consultants used heat meters as they believed it minimised the waste of heat and was fairer to households of different size. However, a small social housing scheme experienced problems with the systems used to charge customers based on metered heat and eventually reverted to a service charge.
ESP1, while highlighting that all major heat loads were metered, considered that individual domestic heat metering was unreliable and indicated that they pro-rated charges based on floor area.
Schemes without heat metering
Most local authority led retrofit schemes examined for this current piece of work did not install individual heat meters. The local authority representatives for two of them, considered metering every flat to be expensive to implement and administer, preferring a flat-rate charging system.

Research into barriers to deployment of district heating networks in suitable locations
42
This provided an indication that the mandatory introduction of individual heat meters in new schemes serving existing dwellings, where the social housing provider had other drivers e.g. reducing fuel poverty, was significantly more contentious.
Flat rate charges, which were pro-rated based, for example, on the size of the dwelling, typically reflected the cost of fuel and operation & maintenance (as well as any contribution towards a system refurbishment fund). This approach was often based upon a non-profit pricing mechanism with the actual cost of the fuel (usually gas) being increased to cover conversion to heat in either a conventional boiler or a CHP plant. This cost of production heat model was often used by local authorities or not-for-profit schemes.
The same local authority housing officer referred to above stated that a ‘not-for-profit’ approach had been taken with a dedicated energy services company (ESCO) set up specifically to operate schemes in the particular local authority area. Tenants on one such scheme were overwhelmingly in favour of the flat rate single payment with rent model, so they could budget more easily.
Transparency in pricing
Whether scheme tariffs were constructed around individual heat metering or not, scheme instigators generally considered that it was essential to ensure operators were open with customers about how charges had been established. For example, a local authority led scheme considered that transparency in pricing and costs was fundamental to building confidence in district heating and allowing standardised price comparisons.
A local authority had identified a local district heating network that could supply heat but were unable to successfully negotiate an acceptable pricing method for heat with the operator. Therefore this option, the first preferred option of the regional planning policy, was not followed.
4.5 Lack of generally accepted contract mechanisms
One scheme instigator relayed that a barrier was the uncertainty regarding allocation and ownership of risks in district heating development and the process involved in formation of an ESCO. They considered that the complexities of multi-party negotiations regarding questions they were not used to dealing with could result in contract amendments with uncertain results.
However, when it came to the implementation stage of schemes, opinions were split regarding the benefits of standardised commercial and contract mechanisms.
Several interviewees argued that there would be benefit in standardised documents covering areas such as generic project agreements, customer charters, etc. A local authority project manager of a newly emergent scheme: “I think this can only help – but need to be designed in conjunction with the market...”

Research into barriers to deployment of district heating networks in suitable locations
43
However, others argued that due to the bespoke nature of projects there would not be benefit in such a prescriptive approach. “a base standard is good… but we need flexibility.”
With regard to standard contracts, one local authority respondent went further: “while in theory this makes matters easier, in practice they become so complicated that ordinary businesses can’t understand them.”
4.5.1 Procuring an energy services provider partner and distributing risks Several organisations implementing schemes appointed a private sector ESP to support the implementation of the scheme. These arrangements ranged from undertaking the complete design, building, financing and operation to companies taking responsibility for one particular aspect of a scheme.
However, a few schemes identified that the procurement process itself was a barrier. Local authority personnel implementing a large scheme and partnering with an ESP identified navigating the procurement routing as the most significant barrier they had to overcome.
Another scheme, after they had shortlisted companies, spent 18 months involved in a competitive dialogue process with on-going negotiations over proposed amendments to the development contract.
ESP3 also highlighted the difficulties of getting property developers to sign long-term (e.g. 25 years) heat supply contracts. However, it is this which provides the revenues that allow the ESP to provide a capital contribution. A consultant involved in several schemes considered there to be a significant difference between customers talking about joining and actually signing up to join.
Agreeing that procurement was the most difficult part of the development process and supported standard forms of contract and standardised pricing methodology, one ESP also highlighted existing guidance on procuring energy services to deliver to community heat and power schemes (GPG377) which contained a standard agreement. They suggested that in some cases the legal team involved in implementing a new project often tried to reinvent the wheel by developing new contract documentation before reverting to this existing source. However, they suggested that it would be useful to have more examples in relation to different types of scheme.
ESP2 stated that, in order to build confidence, they always started with the contractual side to demonstrate how they were going to protect the customer, for example through fixing heat prices in relation to gas prices, and worked that back into their financial model using NPV and IRR. They saw the adoption of transparent pricing through clear heat price formulas as a key principle to building trust between the customer and heat supplier.
A consultant involved in schemes where the local authority commissions the design and build of new schemes, stressed the need for genuine risk transfer to occur in contract documentation. However, they considered that there was a lack of expertise available for drafting contracts.
A few schemes adopted innovative approaches to reducing and distributing risk. For example, two schemes where the heat source was uncommon operated the heat source and heat distribution systems under separate arrangements. Ownership and operation of the heat

Research into barriers to deployment of district heating networks in suitable locations
44
source was undertaken by a private sector company but the heat network remained under council ownership.
While individual ESPs were already adopting their own forms of standardised contracts, a barrier was the lack of a universally accepted standard contract form - this information gap slowed the progression of these types of schemes.
4.6 Lack of a generally accepted and established role for local authorities
Amongst the interviewees, many understandably seemed to have a clear grasp of the enabling role of local authorities in establishing heat networks and this is discussed in the sub-sections below. As such, the primary barrier in this area appeared to relate to how to educate local authorities who have not been involved in schemes.
4.6.1 Establishing the strategic context At the objective setting and mobilisation stage, local authorities had many different reasons for considering district heating. This was propelled by their overarching need to meet economic, environmental and social objectives. However, key drivers identified by interviewees for the local authority schemes included:
• Achieving carbon emission reductions to mitigate climate change;
• Attracting inward investment to facilitate regeneration and job growth;
• Providing affordable warmth and tackling fuel poverty
• Retaining energy expenditure within the local economy.
In this wider context, heat mapping to identify opportunity areas for district heating, where high heat density loads and sources of waste heat existed in close proximity, was identified by several interviewees as a key strategic activity led by local authorities. This required local knowledge/data and was enhanced through the use of geographical information systems (GIS).
A couple of local authorities described how reports examining the potential for renewable energy in the region first brought district heating to their attention. These reports acted as a catalyst to consider the applicability of district heating for specific areas in more detail through examination of the energy density. This highlighted which areas were suited to district heating and also helped them to avoid spending time on those locations that were not. Driven by the need to reduce emissions and save costs, they subsequently worked with other public sector bodies to examine the feasibility of district heating in specific areas. This covered the potential to supply existing buildings, as well additional loads provided by growth areas of new-build development.

Research into barriers to deployment of district heating networks in suitable locations
45
ESP1 considered that it was essential that area identification was done in a professional and robust manner otherwise opportunities for schemes may be missed or efforts concentrated on sub-optimal areas. They considered that local authorities needed further educating and their awareness to be raised about where schemes were likely to be viable. This could be undertaken through workshops similar to those that ran under the Community Energy Programme.
4.6.2 Initiating schemes serving LA owned and other buildings There appeared to be at least two approaches adopted by local authorities in relation to initiating schemes based around their own buildings.
In the first case, local authorities identified a group of buildings under their (or public) ownership that were in close proximity with a significant demand for heat and committed to long-term heat supply contracts. On the back of these contracts ESPs were able to finance and then construct schemes. Arrangements were also built into project agreements to encourage future growth of the scheme to serve private sector and other buildings. One local authority representative involved in a planned scheme suggested that it was difficult to get other public sector organisations, particularly the National Health Service, to actively collaborate in trying to get a scheme off the ground. The difficulties with taking on the development of expensive infrastructure projects were also vividly expressed by one local authority representative with a finance background: “How can you fund the infrastructure in the ground before you have buildings to connect to it? You get caught in a conundrum: no-one wants to sign up to connect if you cannot demonstrate the infrastructure is actually there, and you cannot afford to put the infrastructure in the ground unless you can demonstrate you have buildings to join.” In other cases, local authorities developed smaller heat networks, for example serving separate housing estates. The strategic intention was then to connect these satellite schemes at a later date to create a scheme serving a wider area.
In both these scenarios the inclusion of public buildings was critical to the success of the heat network project, providing it with long-term, secure heat loads.
Driving the project forward and building broad support
For both approaches the commitment and dedication of an individual person within the local authority was essential in achieving the scheme mobilisation. Obtaining early political commitment was also identified by a couple of interviewees as a factor which helped to drive the scheme forward at the mobilisation stage. This can require great commitment and enthusiasm on the part of the champion because district heating was ‘a very alien concept’ to some in influential positions.
ESP1 considered that both high and low level champions were required within an organisation in order to get projects to progress. The continued drive of individuals appeared to be crucial right up until the point the scheme received final approval to go ahead from the key decision makers e.g. elected members, leader of the council, director of housing.
One local authority led scheme held workshops for potential scheme customers as a way of building confidence among potential customers. They considered these to be a key factor in enabling the scheme to move forward. However, another planned large scheme where there was an established network in another part of the city with different infrastructure ownership highlighted that getting the different parties to work together was challenging.

Research into barriers to deployment of district heating networks in suitable locations
46
One established scheme described how, even though they considered the scheme would not make commercial level returns, it would have significant local economic benefits which justified investment and provided control of energy supply.
4.6.3 Encouraging new schemes through the planning process In relation to new-build developments, the local authority’s role primarily revolved around encouraging heat networks through the planning process, rather than direct involvement in schemes.
Respondents from several local authorities expressed their views that planning frameworks were not sufficiently robust or supported (by planning guidance) for heat networks to be encouraged. Specifically, they felt the planning framework driving low carbon development was being ‘watered down’ and that the carbon reduction agenda was ‘evaporating’ at national level. This made it more difficult to garner crucial cross-party political support among councillors, and to galvanise senior decision makers.
A few local authority interviewees highlighted how they had established policies to promote district heating and established area specific masterplans incorporating district heating. One local authority described how they were identifying zones in their local development framework within which new buildings were expected to connect. Representatives of another local authority stated that a local policy is needed which says: “if there is district heating in place, you have got to take the heat otherwise you cannot develop”.
Several property developers highlighted how the local authority had required new-build developments to install heat networks as a condition for receiving planning permission. This was carried out in accordance with local planning policies.
A few interviewees identified local authority planners as key decision makers in the mobilisation process. The project manager for one of these schemes also highlighted how the local authority identified potential future links to local authority owned existing buildings. By contrast, in another case the area masterplan had not included district heating and this made integrating a heat network into the development more difficult. The developer had to work closely with the equipment supplier to effectively retrofit the scheme into the new-build development.
Helping to identify a suitable location for an energy centre capable of supplying district heating serving an entire area was also identified as an important task for local authorities. A consultant involved in several of the projects concurred that finding a suitable location for the energy centre was often a difficult task.
4.7 The choices made by heat providers (technical feasibility)
At the project initiation phase the reasons for choosing district heating over other forms of heating varied depending on a range of factors including the policy drivers and the relative costs. The sub-sections below discuss the decision from the perspective of both local authority and property developer led schemes.

Research into barriers to deployment of district heating networks in suitable locations
47
4.7.1 Local authority led The choices made by local authorities were determined by their key drivers. These drivers tended to be long-term and policy led. They included the need to renovate housing (particularly multi-storey blocks) to enable rental values to be preserved, legislation such as the Home Energy Conservation Act 1995, affordable warmth and the overall reduction of energy costs to the local authority. A key driver had been the availability of grants under the Community Energy Programme together with energy supplier obligations.
A housing officer responsible for three schemes stated that an ambitious commitment to reduce CO2 emissions was also a key driver. In the case of this local authority there was an existing stock of electrically heated multi-storey blocks of dwelling. The switch from grid electricity to a district heating scheme served by CHP presented the opportunity to make a substantial reduction in CO2 emissions and energy costs, helping to reduce fuel poverty.
4.7.2 Property developer led In the case of new-build developments, some were compelled to install heat networks in order to comply with local planning policies to obtain planning permission. This was particularly the case in London where the GLA implemented the London Plan and local boroughs implemented local planning policies. These organisations were identified as key decision makers.
Despite difficulties arising due to the phasing of large new-build developments, developers were forced to choose between having a development served by a heat network or not having permission granted to develop.
One property developer was concerned about the saleability of houses connected to district heating. Another developer had initial difficulties in convincing occupiers of the buildings on the development that being supplied by a heat network was a robust and cost-effective way of obtaining heat. However, these were overcome through a transparent approach linked to clearly understandable parameters e.g. pegging heat prices to gas prices.
A few interviewees questioned whether, with the high insulation levels and low space heating demands of new dwellings, district heating was an appropriate technology. Some schemes specifically recognised the lower demand of new buildings and looked to accommodate this in the design of their systems.
In a few new-build developments district heating, although not mandated, was installed for other reasons e.g. efficiency, sustainability. In small social housing schemes the main driver was the lowest cost energy for their tenants, while guaranteeing security of supply.
4.7.3 Selling the idea of district heating to sceptical potential customers A few schemes had difficulty selling the idea of district heating to potential customers who were sceptical about the technology. One scheme highlighted how there were preconceptions about issues such as the inefficiencies of networks and its use only being applicable to social housing. These were only overcome by clearly explaining the benefits of the scheme and why it made sense.

Research into barriers to deployment of district heating networks in suitable locations
48
4.8 Skills gaps
Throughout the development and implementation process it was essential that the project instigator had access to the knowledge they needed and suitably skilled support in order that the optimum outcome was achieved and problems were avoided.
The sub-sections below discuss the skills gaps found amongst project instigators, consultants and those installing district heating.
4.8.1 Among local authority and property developer staff A few schemes highlighted how residual knowledge of DH within the local authority from earlier development of existing schemes helped to facilitate the consideration of the new opportunity.
However, several schemes highlighted how, at the start of the process, no-one involved in initiating the scheme had any knowledge about district heating schemes. This included not only the technical aspects as might be expected, but also more basic information about potential cost saving, carbon emission reductions, and easing fuel poverty.
One new-build scheme initially relied on advice from their architects. However, another scheme received advice from an experienced industry figure. A consultant considered the biggest barrier to local authority led schemes was the lack of knowledge of district heating potential among local authorities.
In terms of written guidance to help with up skilling, a few scheme instigators were not aware of existing sources of information, for example good practice guides, instead relying purely on consultants who were themselves not always well-informed.
One scheme identified that a barrier to the development of the scheme was gathering heat profile data, showing the demand over time rather than peak demand. However, a few interviewees managed to make use of existing sources of information on district heating. For example, a project manager for a new-build scheme made use of an overview guide which dealt with planning, heat mapping, the philosophy of district heating and ESCO creation.
Another local authority scheme used guidance and policies from a planning trade association and a regional authority, while yet another accessed information from trade associations and international sources.
Some interviewees also made use of events to help dispel pre-conceived ideas and fill in knowledge gaps. In some cases these workshops were held by programmes providing capital grants e.g. LCIF. Another local authority obtained information from other heat network operators.
However, ESP1 considered that local authorities needed further educating and awareness-raising about where schemes were likely to be viable. This could be undertaken through workshops similar to those that ran under the Community Energy Programme.

Research into barriers to deployment of district heating networks in suitable locations
49
Another property developer led scheme identified additional support through networking and considered that people providing advice needed to have been involved in building schemes not just considering the theoretical side of schemes.
Selecting consultants for technical and financial assessments
Despite the costs involved, project instigators inevitably recognised the need to outsource work examining the technical feasibility and financial viability to external consultants but a number found difficultly in undertaking this process.
Firstly, writing a specification to tender for specific technical consultancy support was not straightforward, as usually they had not instigated such a project before. As well as the effect on in-house resource it also led to the risk that the report did not address all the issues the local authority needed to know. A consultant who had provided support to several of the projects also raised this as a skills barrier amongst local authority personnel.
Secondly, interviewees found difficulty in evaluating the best bid from different consultants including identifying those with actual experience of implementing schemes. This was an area where the need for additional support was identified. At the end of the technical feasibility and financial viability stage, a scheme instigator found difficulty in interpreting and understanding the results and had to gain external support for help with this process.
A consultant involved in several of the projects considered that local authority procurement departments were increasingly seeking value, which placed great weight on quality rather than price. A realisation that cheapest was not necessarily best meant experienced consultants were often securing the work.
Sometimes the local availability of consultancies was an important consideration. For example, one small scheme led by a housing association appointed a locally based mechanical and electrical consultant.
Procurement
ESP1 and a local authority considered that there was a significant skills gap among local authority personnel when it came to the procurement stage.
This could be a drawn out process because it involved an unfamiliar contracting policy i.e. a long-term (25 year) energy services agreement, rather than a 1-2 year gas supply contract. While there were benefits from a life-cycle costing perspective, procurement procedures which local authorities were commonly using did not always capture these benefits. Also the local authority did not always understand the implications of adopting different procurement routes:
• Restrictive: the council issued procurement documents and the ESP prices for it
• Competitive dialogue: involved a much longer process lasting over a year.
They considered that providing training for local authority procurement staff planning to implement a scheme would help to make the process smoother and quicker.

Research into barriers to deployment of district heating networks in suitable locations
50
A consultant involved in several schemes also considered there to be little knowledge of how to procure schemes, which often involved £2-5m of expenditure.
4.8.2 Among consultants Some interviewees highlighted a barrier to the implementation of schemes to be issues arising due to the appointed engineer’s lack of experience with district heating. A developer highlighted how in one scheme serving new buildings they retrospectively had to cut a big hole in the basement roof as provision had not been made in the consultant’s design to accommodate the thermal store.
In another of their schemes the centralised boiler capacity design seemed to be excessive and they had it redesigned by their ESP (whom they considered to be their most valuable form of support).
An engineer from a different ESP also highlighted that the technical knowledge of mechanical and electrical designers employed by property developers generally needed to be improved, as they sometimes over-complicated designs with negative implications such as over-pricing and lack of flexibility in system extension.
The ESP needed to be involved early on to have maximum influence and reduce the risks arising from adopting another organisation’s outline design. However, the ESP was often reluctant to commit large amounts of time until the property developer showed commitment to adopting them as their partner. The delay in engagement between the property developer and ESP sometimes led to sub-optimal solutions as decisions had already been taken, for example, in relation to network routes, the energy centre location, size and the type of energy generation plant. One developer, realising the benefits of early engagement with an ESP, talked to them before the planning application.
A few interviewees for local authority led schemes considered that consultants often did not have the required level of commercial understanding. To quote one local authority based project manager referring to consultants: ‘there seems to be a lack of commercial awareness within these organisations’. As a result they sometimes appointed the consultancy arm of an ESP to undertake the financial viability study.
ESP1 considered that while many consultants claimed to have experience they often did not in practice. Although the local authority sometimes took comfort from appointing a large consulting engineer firm, the person undertaking the work did not always have knowledge of district heating. The ESP considered that some form of accreditation was necessary, especially if government support were provided. More generally, one representative from an arm’s length management organisation considered that "Professional engineers are curiously blind to how a district heating system works.”
One equipment supplier indicated that there could be a substantial amount of work to be done to ‘unpick’ a scheme to change an original design to allow for a suitably positioned energy centre, revised thermal store sizing and distribution pipework within the buildings.
There was evidence of over-sizing of various elements of the district heating primary (inter building) and secondary (intra-building) resulting from a lack of experience in a number of the design consultancies. This skills gap could translate into a barrier, particularly if it involved revising the design or an oversized system with a higher capital cost was installed.

Research into barriers to deployment of district heating networks in suitable locations
51
Linked to this, several interviewees perceived that the design guidance adopted by building services engineers in the UK needed to be updated. As currently drafted, it often led to the oversizing of plant and pipes which could lead to inherent inefficiencies in the systems when built out.
A manager among this group indicated that a barrier was the poor UK plumbing and building engineering practices that arose due to this guidance. He considered that these practices militated against designing systems for the low return temperatures required to operate DH optimally.
Some interviewees considered that it would be useful for local authorities to have access to a register of people that could provide competent support. They suggested that should be based on individuals, not a list of companies.
Recognising the lack of appropriate consultancy skills and knowledge of Waste-to-Energy plant linked to district heating in the UK, the project manager for one scheme, which had grown to become one of the UK’s largest, appointed a Danish consultancy to do the option appraisal. They gained from this Scandinavian experience and through visiting Danish schemes with similar characteristics to that being planned.
However, another planned scheme who worked with Scandinavian consultants found that the installed capital cost estimates did not closely relate to the actual cost of installing pipework in the UK market place.
4.8.3 Energy services providers and installers Although they did not question the expertise of the existing energy services providers involved in the market, one scheme instigator considered that there was a lack of a market in district heating project design and development skills. This restricted the ability of councils to compare different commercial offers and options. However, a consultant involved in several schemes suggested there were more players in the ESP market, although they were quite differentiated in the markets they go for.
A few of the ESPs used specialist district heating consultants to inform the detailed designs for the schemes they were implementing. ESP1 highlighted that there were relatively few people with experience of actually designing district heating schemes in the UK stating: “to get someone to be able to do the detailed design on DE is a long road. You can almost count 20-30 people in UK as designer…... The most business critical part is design…”. As the design, rather than the feasibility study, was the most business critical element of the scheme this created a problem with a lack of resource availability for a critical element of the engineering.
Operational problems with new-build schemes
Where the design of schemes serving new buildings had been undertaken by a developer’s regular mechanical and electrical consultant, a number of recurrent operational issues came to light which may have impacted on customer perceptions of district heating.
A few schemes experienced problems with overheating of corridors within the apartment blocks. Although pipes were insulated, high return temperatures (e.g. 70ºC flow) due to lower than expected heat demand sometimes resulted in problems with overheating. Following refurbishment of buildings and the introduction of communal heating, another scheme

Research into barriers to deployment of district heating networks in suitable locations
52
experienced problems with overheating again despite the riser and lateral pipes being lagged. In the case of the former scheme, the problem became so bad that mechanical cooling had to be used to make temperatures acceptable. On some of the developer’s other schemes they were considering how they could improve the design through adopting lower flow and return temperatures and further increase the level of lagging on pipes. They were also investigating designing the building to accommodate more risers with less need for lateral pipework in corridors.
To learn the lessons arising, one developer suggested that there should be investigation of a number (20-30) of completed new-build schemes. This should encompass measuring the actual heat demand of new-build dwellings, taking into account occupancy and outside temperatures. They considered that this would demonstrate that this infrastructure was being installed when there was no need for it.
Installers
Whether schemes were developed by a dedicated ESP or by multiple contractors, they sometimes relied on dedicated sub-contractors to install pipework. A few interviewees identified problems with a lack of skilled labour to undertake these tasks e.g. pipe laying.
4.9 Other key factors affecting scheme development
Based on the interviews, a number of other factors came to light which impacted on the delivery of schemes. These are briefly discussed in the sub-sections below.
4.9.1 Access to land ESP1 highlighted that while there were statutory rights allowing the electricity network to cross land owned by third parties, the same arrangements do not exist in relation to heat networks. Instead a financial penalty would be payable to the third party land owner to allow the heat network to cross and this was subject to negotiation between the parties. However, single district heating providers should not have to negotiate these arrangements. Other interviewees who also experienced problems with obtaining permission to put pipes in roads called for district heating operators to have the same way leave and access rights as utilities.
The same ESP also highlighted that the greater time required to install pipes compared to, say, gas pipes or optical fibre cables was not always recognised by those tasked with authorising road closures.
As property developers were relatively new to the concept of DH they were sometimes unprepared for the size of the infrastructure that would be required. For example, one property developer commented that they had no idea of the size of pipes going into the ground and they also underestimated the number of isolation valves that would be required. Another scheme instigator considered that having a blank canvas on new-build developments made it easier than retrofitting, although they had experienced problems with programming construction works that resulted in a blame game amongst contractors. However, in general, new-build developments encountered few issues with regard to access to land.

Research into barriers to deployment of district heating networks in suitable locations
53
4.9.2 Tax and business rates Financial viability appraisals for the not-for-profit ESCO schemes yielded interesting responses regarding cash flow that occurred as a result of aiming to balance income with expenditure with surplus charged Corporation Tax. One of these was the need to set the heat price annually in advance of 1 April against a gas purchase contract typically renewed every three years. One scheme gift-aided their profits to a charitable trust, in order to avoid liability for corporation tax.
Differences were also apparent between Scotland and England & Wales in the treatment of the application of business rates to district heating plant rooms and energy centres.
A couple of schemes were involved in discussions with the tax authority regarding whether the energy centre was subject to VAT. Although the energy centre would primarily serve residential customers, one heat load related to a non-domestic customer which was subject to VAT. The project manager for one of these schemes considered that there was no established guidance relating to how this should be resolved – this caused delays in contract signing.
One scheme instigator called for the wider carbon benefits of district heating to be recognised and factored in to how tax rules were dealt with. ESP1 also called for the benefits to be captured within the tax system and considered that at present district heating was discriminated against. For example, they highlighted that schemes serving multiple buildings could be captured within the thresholds of the EU Emissions Trading Scheme (EUETS) whereas individual buildings served by their own plant would not be.
4.9.3 Air quality approval One property developer identified a specific problem with obtaining air quality approval for their scheme. The energy centre flue was retrospectively dealt with. In contrast a planned scheme expecting to obtain its heat from a large source saw this as a way of improving air quality by avoiding multiple boilers spread out in the individual buildings. The large scale of this scheme enabled the cost effective application of flue management technologies.
4.10 Ranking barriers in terms of their relative importance
Table 1 below sets out the key barriers identified by respondents at each stage in the process of setting up a heat network. The relative impact on heat networks projects, as indicated by the interviewees, is shown by the number of stars in brackets after the text describing the barrier:
*** Big impact: potential to stop the project
** Medium impact: likely to lead to sub-optimal outcomes and/or significantly slow progress
* Modest impact: likely to slow progress

Research into barriers to deployment of district heating networks in suitable locations
54
Table 1 Barriers to establishing a heat network at individual stages - impact
Local Authority Led Property Developer Led
Objective setting and mobilisation
• Identifying internal resources to instigate scheme and overcome lack of knowledge (**)
• Persuading building occupants to accept communal heat (mandated by the planning authority) (*)
• Customer scepticism of technology (*)
Technical Feasibility and Financial Viability
• Obtaining money for feasibility/viability work (***)
• Selecting suitably qualified consultants (**)
• Identifying and selecting suitably qualified consultants (**)
• Uncertainty regarding longevity and reliability of heat demand e.g. lack of heat demand in new buildings (*)
• Uncertainty regarding longevity and reliability of heat demand (*)
• Uncertainty regarding reliability of heat sources (*)
• Uncertainty regarding reliability of heat sources (*)
• Correctly interpreting reports prepared by consultants (*)
Implementation and Operation
• Paying the upfront capital cost (***)
• Concluding agreement with an energy services provider including obtaining a contribution to the capital cost(**)
• Obtaining money for independent legal advice (***)
• Lack of generally accepted contract mechanisms (**)
• Lack of generally accepted contract mechanisms (**)
• Inconsistent pricing of heat (**)
• Inconsistent pricing of heat (**)
• Up-skilling LA procurement team on DH (*)
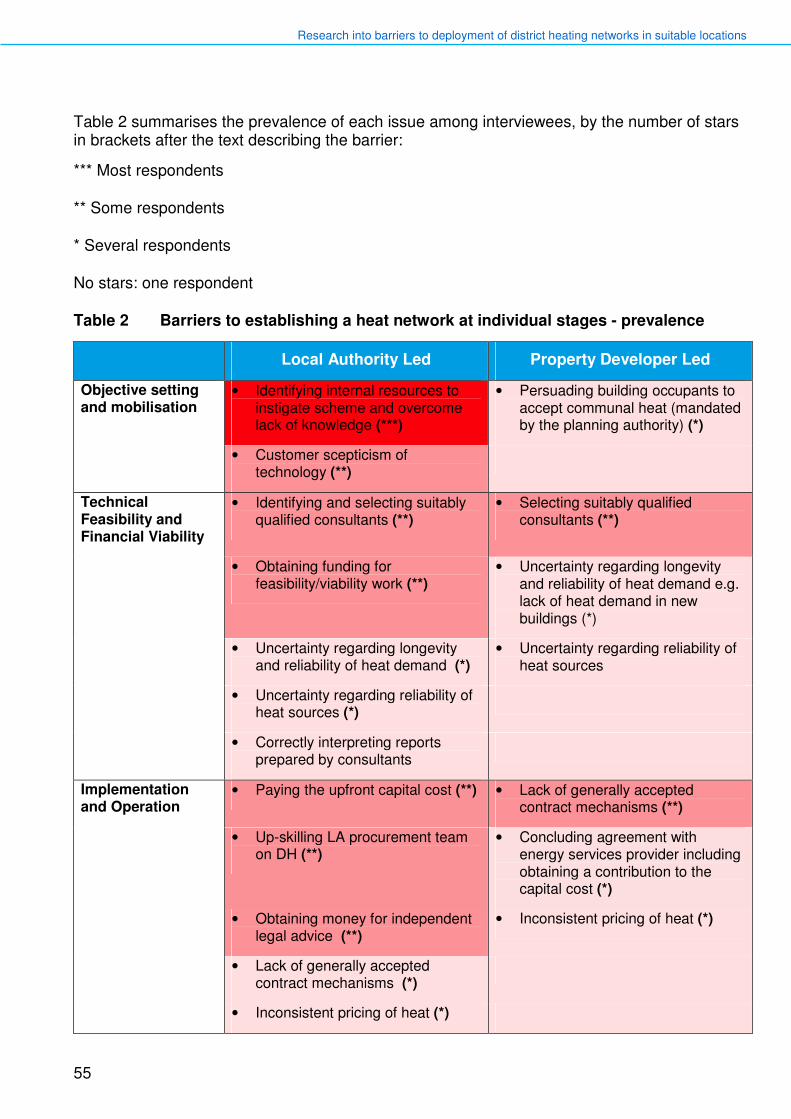
Research into barriers to deployment of district heating networks in suitable locations
55
Table 2 summarises the prevalence of each issue among interviewees, by the number of stars in brackets after the text describing the barrier:
*** Most respondents
** Some respondents
* Several respondents
No stars: one respondent
Table 2 Barriers to establishing a heat network at individual stages - prevalence
Local Authority Led Property Developer Led
Objective setting and mobilisation
• Identifying internal resources to instigate scheme and overcome lack of knowledge (***)
• Persuading building occupants to accept communal heat (mandated by the planning authority) (*)
• Customer scepticism of technology (**)
Technical Feasibility and Financial Viability
• Identifying and selecting suitably qualified consultants (**)
• Selecting suitably qualified consultants (**)
• Obtaining funding for feasibility/viability work (**)
• Uncertainty regarding longevity and reliability of heat demand e.g. lack of heat demand in new buildings (*)
• Uncertainty regarding longevity and reliability of heat demand (*)
• Uncertainty regarding reliability of heat sources
• Uncertainty regarding reliability of heat sources (*)
• Correctly interpreting reports prepared by consultants
Implementation and Operation
• Paying the upfront capital cost (**) • Lack of generally accepted contract mechanisms (**)
• Up-skilling LA procurement team on DH (**)
• Concluding agreement with energy services provider including obtaining a contribution to the capital cost (*)
• Obtaining money for independent legal advice (**)
• Inconsistent pricing of heat (*)
• Lack of generally accepted contract mechanisms (*)
• Inconsistent pricing of heat (*)

Research into barriers to deployment of district heating networks in suitable locations
56
5 Enablers and possible types of support
The interviews also brought to light enablers and views on possible types of support that could be used to mitigate the barriers identified in the previous section. Sections 5.1 and 5.2 set out respectively the views of interviewees on issues identified in the DECC research specification, and additional issues raised by the interviewees themselves. The possible solutions encompassed in the sub-sections below contain references back to the barrier they are designed to address.
5.1 Views on the types of support identified in the research specification
The DECC research specification highlighted a number of possible types of support. The sub-sections below provide feedback on the views of interviewees with regard to these specific support measures.
5.1.1 Model customer charter/code of conduct, or statutory customer protection rules Several project instigators supported the idea of a model customer charter/code of conduct with suggested content including forms of payment, service standards, treatment of bad debt and disconnection procedures. However, one property developer didn’t see the need as they considered that they treat their customers well and that was what distinguished them from their competitors.
A consultant involved in several of the schemes supported the idea for both local authority and developer led schemes supplying residential customers. The same consultant saw this as part of the process of ‘professionalising the supply of heat’.
One ESP who supported the idea of a model customer charter/code of conduct had provided input into documentation covering metering, guaranteed standard services and transparency of prices which was being written by the Combined Heat and Power Association (CHPA). Another of the main energy services providers, while recognising the need to provide input into model customer charters, thought that transparency in how prices were determined was the key issue. One other ESP supported the principle of a customer charter/code of conduct but was less supportive of statutory customer protection rules.
5.1.2 Provision of an independent advisory service to support progress at each stage Most interviewees who expressed a view supported the principle of an independent advisory service. This could be used to answer questions and provide independent advice.

Research into barriers to deployment of district heating networks in suitable locations
57
However, some stressed that such a service needed to be trusted to be genuinely expert, independent of commercial interests, and available to work systematically with the developer according to need, providing more than merely tokenistic support. Consultants selected to provide the service should have experience of actually implementing schemes and be registered to demonstrate their competence. Not all consultants were considered to have the right experience to give scheme instigators the support they needed. This service might also help to address the barrier, identified in section 4.8.1 of this report of, selecting appropriately qualified consultants.
One ESP thought a one-stop-shop would be useful as a way of providing the scheme instigator with the support they need in order to have the confidence to sign up for schemes.
A consultant involved in several of the schemes considered an advisory service would be helpful if properly structured and that those providing the advice were truly experts in the field. The same consultant considered that local authorities particularly needed help with the first step, as this was probably the most important. A lot of politics (rather than technical issues) could be involved at the first stage when building support for the project. Providing the support was delivered by individuals who understood local authority mechanisms they considered that this could be the most effective support mechanism.
Where they expressed a view, interviewees generally thought that the service should be provided free. One of these, a local authority housing officer, made the point that they already paid for advice from consulting engineers.
The need for long-term hand-holding was also highlighted. Some schemes found visits to other successful schemes to be a useful source of information and a way of building confidence – this could be orchestrated by an advisory service. One scheme perceived this as a way to avoid mistakes which delayed the implementation of successful schemes. They also considered the ability to share information between local authorities through established information networks to be a key enabler which helped to drive the scheme forward. However, they felt government could have a role in pulling together this learning of how to coordinate the different parties involved in a scheme.
5.1.3 Model commercial and corporate structures Some scheme instigators considered that standard contracts would help. As highlighted in section 4.5.1, one ESP drew attention to the existing guidance and standard agreement contained in Good Practice Guide 377. A manager from an authority highlighted that in London the Greater London Authority were preparing a manual with commercial templates and customer charters. Another local authority representative suggested that model documentation should not be too prescriptive as this could stifle innovation. However, nearly all interviewees accepted that there was a need for additional guidance and examples of agreements dealing with different types of scheme.
Some scheme instigators considered that standardised price comparators would help. Others did not see this as a particular barrier. As discussed in section 4.4.2, the pricing mechanisms and opportunity to standardise approaches varied depending on whether the residential element of schemes had individual heat metering, and the approach to tariff calculation. However, interviewees stressed the need for transparency in pricing, even if the method of price calculation was not standardised.

Research into barriers to deployment of district heating networks in suitable locations
58
5.1.4 Generic technical requirements for heat networks Most instigators who expressed a view considered that developing generic technical requirements would offer benefits e.g. operating temperatures and pressures which allowed schemes to be optimised, helping to run calculations and determine costing. However, some interviewees who supported the general principle made the point that they needed to be flexible, for example, to cater for the needs of smaller discrete schemes.
Those stakeholders who had been directly involved in the design of district heating networks, for example ESPs, offered more views on the advantages and disadvantages of generic technical requirements. An ESP considered that certain items should be standardised as a minimum. However, they considered that setting too prescriptive general technical standards, for example in relation to temperature and pressure, could make it hard to deliver heat to some customers and the possible disadvantages could then outweigh the benefits. They also highlighted that the UK District Energy Association (UKDEA) would be issuing a technical standard document that they hoped would be adopted by the industry.
Other ESPs also thought that general additional guidance on technical requirements would be helpful rather than a prescriptive standard which everyone had to adopt. In the case of new-build, they highlighted that there was often a temptation for the developer to get a plumber, often without direct experience of district heating, to install services prior to the ESP getting involved. This presented a risk to an ESP looking to adopt the system as they may not be able to determine the standards it has been built to. The higher risk then gets reflected in the cost they will look to charge.
A consultant who had supported projects during the technical feasibility and financial viability stages considered that requirements were location specific.
5.1.5 Mandatory requirement for local authorities to assess the potential for district heating Among those who expressed a view, most interviewees felt it would be helpful to mandate local authorities to consider the potential for decentralised energy. However, a local authority officer made the point that, while it may be appropriate for authorities with urban settlements over a certain size, it would not be a good use of resources in a rural area. ESP1 considered that it would be useful to have guidance issued to local authorities requiring them to incentivise district energy.
5.1.6 Risk underwriting Most scheme instigators who expressed a view supported the principle of government putting in place mechanisms to underwrite risks.
A few schemes had been underwritten by the local authority. An innovative local authority created a ‘not-for-profit’ energy services company. In this case the local authority underwrote the debt of the company. However, they highlighted that this needed close control of income and costs to ensure sound finances. On the basis of the benefit to the local economy as a whole, another scheme also had its finances underwritten by the local authority allowing the scheme to be established. However, they suggested that their scheme had unique circumstances linked to its geographic location.
Several interviewees called for the connection of buildings to heat networks to be mandated in specific circumstances. ESP2 thought there should be a presumption that public sector buildings should be required to connect. A mechanism could be used to set a standard heat

Research into barriers to deployment of district heating networks in suitable locations
59
price, thereby protracted negotiations were avoided. ESP3 also called for the mandatory connection of buildings under government control but additionally thought de-risking projects through a method of cost recovery in the event that the scheme did not proceed as planned would be helpful. However, the call for obliging public buildings to connect was not universally supported among ESPs. One such company claimed that customers who were forced to connect did not make good customers.
A local authority led scheme suggested that zones should be established, similar to the system adopted in Denmark, whereby all buildings within a defined geographic area were required to connect. However, another local authority led scheme called for government to encourage a collaborative approach, with public sector organisations that hold large estates being incentivised to collaborate with local authorities to bring forward networks. A consultant involved in several of the projects also called for there to be a requirement for different parts of government to work together, such as the National Health Service (NHS) and local authorities.
The same consultant considered that government had a key role to play in ensuring agencies work together and think laterally to encourage district heating. For example, the requirements of waste contracts should not be considered in isolation; energy generation potential, including supply to district heating, should be an integral part of contracts. This could best be achieved by the coordination of energy, waste, and water at a municipality level.
5.2 Other types of support identified by interviewees
Aside from those discussed in the section above, a number of other possible support measures were suggested by interviewees. These are discussed in the sub-sections below.
5.2.1 Power purchase agreements for CHP electricity As discussed in section 4.3.1, selling electricity from CHP was identified as a barrier impeding the establishment and operation of some schemes. To address the uncertainty regarding where CHP electricity may be sold at reasonable prices, several interviewees proposed that collective centrally operated power purchase agreements should be established to reduce the uncertainty and complexity involved.
5.2.2 Provision of written guidance relating to different aspects of scheme development A few scheme instigators specifically called for better signposting to information on the technical requirements of district heating - in one case they relied on the equipment supplier. This suggested that additional actions were required to bring existing guidance to the attention of those looking to instigate new schemes.
ESP3 identified the documents produced by the International Energy Agency (IEA) District Heating and Cooling programme as an information source that they utilise. However, a few interviewees also thought there was a need for additional written guidance on specific issues. ESP1 considered that previous guidance on DH was often too shallow and they were in the process of writing a guide that could be kept on the desk as a source of advice.

Research into barriers to deployment of district heating networks in suitable locations
60
A few scheme instigators suggested that case studies illustrating how schemes mitigated particular difficulties/risks and how well that has worked in practice would be useful. A few interviewees also suggested that a network of helpful friends with direct experience of developing similar schemes would be helpful. One scheme instigator also called for government to develop a spreadsheet tool providing key financial data which council financial managers would use to take a view on DH viability.
5.2.3 Financial support for district heating Some interviewees called for government to provide capital grant support. At the same time, a few highlighted that when capital grants were provided they needed to comply with state aid rules and proving that it does could be complex in certain situations. A scheme instigator considered that a type of RHI payment should be available to heat networks. Another scheme suggested that DECC should introduce a hedging mechanism on fuel prices to help de-risk schemes.
ESP1 considered that several schemes were stalled at the procurement stage as the savings were not big enough to allow the schemes to progress. They called for a low carbon heat incentive to support district heating. They suggested this would work by a specific fund meeting the difference between the cost of laying the pipework and the connection charge for the building. The fund would then be repaid as other connection charges were received from other buildings joining. A local authority led scheme also called for a similar approach.
One local authority respondent with a finance background believed “We could do with the equivalent of a Green Bank which provides publicly financed, almost free loans, because at first you have nothing to service the loan with. With a view to repaying it as and when you make connections.”
5.2.4 Further tightening of power station consents policy A planned scheme identified how the existing power station consents policy had acted as an enabler for their scheme. The power station developer had undertaken work examining the potential to take heat from the power station and supply this to the local area through district heating. A manager of a scheme which had seen significant expansion suggested that power stations should only be allowed to proceed if they were CHP and government should insist on co-location of generation plant with heat loads.

Research into barriers to deployment of district heating networks in suitable locations
61
6 Conclusions The schemes emerging in the UK over the last ten years can be split into two distinct types:
1. Local authority led schemes which initially serve existing building under the control of the authority but where a strategic aim exists to expand the scheme in the future.
2. Property developer led schemes that serve new buildings but which were designed to allow connection to larger, area wide networks in the future.
Some barriers to and enablers for district heating vary depending in to which category the scheme falls. Others were common to both local authority and property developer led schemes.
In this section the concluding remarks are presented as a series of issues where principal barriers are linked with potential enablers.
6.1 Local authority led schemes: barriers and associated enablers
For local authority led schemes, respondent views of the principal issues were as follows:
External advisory service
Local authority staff often struggled to navigate through the different stages of the scheme development process. This was particularly the case during the early mobilisation stage of schemes, when support needed to be built amongst the council’s key decision makers. Interviewees agreed that local authority staff would benefit from access to an external advisory service through the development process. Most interviewees also felt that this should be a service that is free-of-charge particularly in the initial stages.
Money for feasibility studies
Scheme instigators struggled to identify money to commission technical feasibility and economic viability studies. They often relied on money from an external source. Most interviewees considered that a source of monetary support for development work would help to move potential schemes forward.
Lack of in-house skills
Schemes sometimes stalled at the procurement stage due to a lack of in-house skills to successfully navigate the process and money for legal and contractual advice. Interviewees felt that training of local authority procurement staff and monetary support for appointing legal advisors would help to overcome these barriers.
Grants and financial incentives

Research into barriers to deployment of district heating networks in suitable locations
62
The local authority led schemes that proceeded in the last decade usually benefited from grant support to close gaps and make the scheme financially viable. Most interviewees considered that some form of financial incentive, of which various types were suggested, would be required to make schemes happen until the market reached a greater stage of maturity. As an alternative, implementing a mechanism for underwriting risk, enabling low cost finance to be raised, was broadly supported.
A particularly difficult barrier to initiating schemes was absorbing the additional cost of including extra capacity, for example increased pipe sizes and additional space in the energy centre, to allow the future expansion without a guarantee that extra revenue from additional heat sales would materialise. Building in capacity to serve additional buildings beyond those involved in the core scheme sometimes meant that financial returns were less than the hurdle rates required.
6.2 Property developer led schemes
Local planning policies, particularly in London, promote and support the development of heat networks through the planning process. This often meant that property developers were compelled to investigate and commit to the installation of heat networks. This requirement to provide heat network infrastructure meant that the costs have to be borne by the developer or their appointed energy services provider. Hence, the upfront capital cost was not such an obstacle in the new build sector.
6.3 Barriers and associated enablers common to different types of schemes
There were a number of issues that were common to both local authority and developer led schemes. Respondent views of these principal issues were as follows:
Consultancy support
Regardless of whether a scheme was local authority or property developer led, scheme instigators often had problems identifying appropriate consultant support with the required level of expertise. This could lead to later problems where schemes either did not progress or proceeded only for problems to be identified during the construction and/or operational phase. Interviewees considered that they needed support in establishing procedures to enable selection of high quality consultant support.
Selling electricity from CHP
Interviewees identified difficulties associated with selling electricity from gas CHP installations (the predominant primary heating source) but generally considered it to be a reliable heat source. Waste-to-energy plants were considered to have great potential to become the primary

Research into barriers to deployment of district heating networks in suitable locations
63
heat source of the future but its more widespread use was considered to be hampered as operators were not sufficiently incentivised to recover heat. Too often they preferred to maximise electricity generation.
Pricing of heat
Inconsistent pricing of heat was a barrier to district heating, although the extent to which it was a barrier varied depending on whether the scheme had individual dwelling heat metering or not. However, regardless of whether billing was based on individual users’ consumption or not, interviewees considered that transparency in pricing was the essential ingredient in obtaining customer confidence. Interviewees also supported the development of a model customer charter dealing with other aspects of customer service.
Contract mechanisms
Interviewees agreed that the lack of commonly accepted contract mechanisms was a barrier to district heating. While there were already examples of standardised contracts, for example in existing good practice guides, there was a general consensus that additional examples were required dealing with different types of scheme and circumstances. However, there was also a plea for flexibility and simplicity, amid fear that an attempt to ease a barrier could itself become one.
Guidance
Building heating systems and small heat networks were not always designed to allow easy interconnection to large district heating networks. Hence, interviewees supported the development of guidance on generic technical requirements. However, there was no consensus on how prescriptive they should be with some arguing that they needed to be flexible to accommodate schemes of different size and type.
Sources of existing information were not signposted as clearly as they could be and some guidance was considered to be out-of-date or too shallow. Interviewees considered that there was a clear need to provide an up-to-date (and regularly updated) repository of relevant information that was coordinated with the trade associations to avoid duplication.
Generic support
In general, interviewees considered that central government needs to view district heating as energy infrastructure, similar to other utility networks. Stronger planning guidance and frameworks were thought to be needed, and the sense that district heating is supported at the national level.
Local authorities were considered to have a critically important role in setting the strategic context for, and initiating the development of, district heating networks within the UK’s towns and cities.
The alignment of wills was crucial (owners, neighbourhood infrastructure, supply chain, customers). It was here that local authorities, with their local knowledge, capacity for organisation, and key functions as planning authorities and service providers, were believed to

Research into barriers to deployment of district heating networks in suitable locations
64
be in a unique position. With the appropriate types and level of support, interviewees considered that they could orchestrate the initiation of, and nurture the growth of, appropriate and sustainable community based energy infrastructure.

Research into barriers to deployment of district heating networks in suitable locations
65
Appendix A E-mail to potential participants
Dear (inset name)
BRE has been commissioned by the Department for Energy and Climate Change (DECC) to carry out a research project exploring the barriers to the deployment of district heating schemes in the UK.
The aim of this research project is to understand better the barriers to the deployment of schemes in suitable locations. The research will help DECC to determine where policy interventions can be most effective, and exactly what impact those interventions should aim to have. The findings will help shape DECC's policy paper on heat that is due to be published in March 2013.
We would very much like to get your views on the subject and talk to you about your experiences. We are particularly interested in finding out more about (insert scheme of interest) and how it was developed.
The research team aim to speak to representatives from at least 40 district heating teams from across UK. Data and information will be collected through group interviews with project team members. The interviews will focus on how you developed the scheme(s), what barriers you faced at each stage, how these were overcome and what would help to address these for future schemes.
This project is a great opportunity to help shape future government policy and help the growth of the district heating market in the UK. Your input will greatly contribute to the success of the project.
If you are happy to take part in the project, we first need to collect some basic quantitative information about the scheme(s) you have helped develop. The link below will take you to a short web based questionnaire. The questionnaire focuses on just one scheme. Please could you complete this questionnaire for the (insert scheme of interest)
District Heating Questionnaire - Scheme 1
If you have been involved in more than one district heating scheme (developed in the last 10 years) that you would like to tell us about, please could you complete a questionnaire for each scheme by clicking on the links below.
District Heating Questionnaire - Scheme 2
District Heating Questionnaire - Scheme 3
District Heating Questionnaire - Scheme 4
District Heating Questionnaire - Scheme 5

Research into barriers to deployment of district heating networks in suitable locations
66
If you have any questions about the research, please don’t hesitate to contact me.
Kind regards

Research into barriers to deployment of district heating networks in suitable locations
67
Appendix B Pre-interview questionnaire

Research into barriers to deployment of district heating networks in suitable locations
68

Research into barriers to deployment of district heating networks in suitable locations
69

Research into barriers to deployment of district heating networks in suitable locations
70

Research into barriers to deployment of district heating networks in suitable locations
71

Research into barriers to deployment of district heating networks in suitable locations
72

Research into barriers to deployment of district heating networks in suitable locations
73

Research into barriers to deployment of district heating networks in suitable locations
74

Research into barriers to deployment of district heating networks in suitable locations
75

Research into barriers to deployment of district heating networks in suitable locations
76
Appendix C Interview schedule Basic information
1. We are interested in all aspects of the scheme from conception (initial idea) to the completion of the
project. Q. Can you briefly describe what stages the project went through and approximately how long
each stage lasted? (write stages on a flip chart and refer back to the stages identified throughout the
interview)
- Did any of the stages overlap at all? If so, which stages overlapped and by how much?
Getting started – Objectives and mobilisation (X minutes)
This section of questions focuses on the early stages of the project. We’ll explore what the drivers were and what barriers you experienced.
2. What were the principal drivers for the scheme?
Prompts: Meeting government targets
carbon emissions
fuel poverty
energy security
regeneration
revenues
planning permission
3. What was the decision making process at this early stage and who was involved?
4. Were there any mobilisation issues that caused problems for the project or slowed progress at this stage?
If so, what were they? (put the barriers identified on post it notes)
Prompts: Understanding
Legitimacy of the technology (proven)
Political support
Resource
[For each of the barriers identified ask the following]
- What impact did it have on the project?
- How did you overcome this barrier? (probe – was there anything that particularly helped you to
proceed?)
- What changes would need to happen to reduce or remove this barrier for future schemes? (Probe –
who would need to make these changes?)
5. Who were the key decision makers you needed to get on board at this stage?
6. What (if any) skills gaps did you identify at this stage?
Where did you go to fill these gaps?

Research into barriers to deployment of district heating networks in suitable locations
77
How easy was it to fill these gaps?
7. What information/knowledge gaps (if any) did you identify at this stage?
- How did you fill these gaps?
- What additional support/information would have been helpful at this stage?
- Should local authorities be required to assess the potential for district heating?
8. Did you consult any ‘best practice guides’ at this stage?
- How much of a help or hindrance did you find them?
9. What (if any) external support did you receive at this stage?
- How easy was it to define and find the support you needed?
- Did you use consultancy support? If so, how did you identify consultancy support and how did you
procure it?
- Was there any additional support that would have helped at this stage?
- What kind of support would help future schemes at this stage?
10. How was this first stage of the project resourced?
- What proportion of the funding for this stage was external funding?
- Where did the external funding come from?
- How easy was it to secure the funding required for this stage?
11. During this first stage of the project were there any other factors that helped to drive the project forward?
(record on post-its)

Research into barriers to deployment of district heating networks in suitable locations
78
Scoping the scheme and assessing the technical feasibility (X minutes)
The next section focuses on how you assed the technical feasibility of the scheme and scoped out
its potential.
12. How did you assess the technical feasibility of a district heating scheme for this site?
- Why did you use this approach?
- Who did you bring in (if anyone) to conduct this work?
- Where did you source the relevant information from?
13. How did you fund this stage of the project?
- What proportion of the funding for this stage was external funding?
- How easy was it to secure the funding required for this stage?
14. What technologies and heat sources did you consider for the site?
- What were the risks and barriers associated with each of these technologies?
- Was the reliability of the heat sources available considered, if so, what were the considerations?
15. How did you decide which technology and heat source would be most appropriate for the site?
- E.g. How did you assess the strengths and weaknesses of the technologies and heat sources under
consideration for this site?
16. Why did you choose district heating over individual building heating?
17. Did the type of buildings (e.g. public, private, domestic, non domestic) linked to the district heating
scheme have an impact on the outcome of the feasibility process/study?
18. During the scoping and technical feasibility stage of this project, was the potential for future expansion
considered?
- Probe – How? , Who was involved? Were any challenges around future expansion raised?
- Did you consider using alternative heat sources in the future?
19. Other than those already identified, what risks and barriers did you identify at this stage?
- Was the risk of the heat demand reducing or even disappearing in the future
considered/discussed? How did you assess / manage this risk?
- Were there any risks identified for which you needed specific technical support?
20. What (if anything) helped you move forward during the feasibility stage of this project? (enablers)
21. What type of support would have been helpful at this stage and why? (e.g. Help with interpreting the
results of the feasibility study.)

Research into barriers to deployment of district heating networks in suitable locations
79
22. How easy was it for you to access the information you needed at this stage?
- Having been through the process, what information would you have liked/needed at this stage?
23. If generic technical requirements for heat networks were introduced, do you think this would help or
hinder this stage? (e.g. minimum system performance standards)
24. In the future heat meters may be mandatory for all new schemes. Would the requirement to have heat
meters have been a barrier for this project?
Break 10-15 minutes

Research into barriers to deployment of district heating networks in suitable locations
80
Financial appraisal – assessing if the scheme was economically viable (X minutes)
The next set of questions is about any type of financial appraisal you carried out to assess if the scheme was economically viable.
25. How did you assess if the scheme was going to be economically viable?
- What appraisal technique was used? (Prompt - Net present value (NPV) or Internal rate of return
IRR?)
- Why was this technique chosen?
- Who carried it out? (internal, external)
26. How was this appraisal funded?
- What proportion of the funding for this stage was external funding?
- How easy was it to secure the funding required for this stage?
27. Did you calculate a required rate of return?
- If so, what rate of return was required?
- What was this based upon? E.g. cost of capital?
- How effective was the appraisal technique (NPV, IRR) at ensuring the heat network delivered the
projected/required rates of return?
28. Was the future cost of the heat generated calculated at this stage?
- If so, how was this calculated?
29. Were maintenance and repair costs considered and included in your financial calculations?
30. In what ways were changes to future energy demand accounted for?
31. Was the potential for future expansion factored into the financial appraisal? If yes, how was this done?
- To what extent does increasing the scale of a heat network reduce risk and improve investment
potential?
32. Other than those already identified, what risks and barriers did you identify through this process? (e.g. long
payback periods, future energy prices)
[For each of the barriers identified ask the following]
- What impact did it have on the project?
- How did you overcome this barrier? (probe – was there anything that particularly helped you to
proceed?)
- What changes would need to happen to reduce or remove these barriers for future schemes? (probe –
who would need to make these changes?)

Research into barriers to deployment of district heating networks in suitable locations
81
- What could the government do to reduce or remove any of the barriers you identified?
33. Of all the barriers that you have identified during the financial appraisal, which were the most significant,
and why?
34. Did you have to adjust your original proposal in any way to ensure the scheme was going to economically
viable?
- If yes, what changes needed to be made and why?
35. Was this project affected by tax rules in any way?
- If yes, in what ways was it affected?
- What changes to the tax rules would have made this project easier?
36. What support (if any) did you receive at this stage that helped you to proceed with the district heating
scheme?
- What additional support (if any) would have been helpful at this stage?
- Would it help if there was a mechanism for under-writing of risk?
For CHP schemes only – [check electronic questionnaire results to determine this]
37. Did you conduct any type of options appraisal of the alternative mechanisms available for sale of electricity
from CHP? If so, what conclusions were drawn from that?
38. Did you encounter any difficulties when seeking to sell electricity?
- How did you overcome them?
39. What could the government do to reduce the risks for future schemes?
Break 10-15 minutes

Research into barriers to deployment of district heating networks in suitable locations
82
Implementation and operation – ‘Sealing the deal’, ‘sourcing the funding’, ‘making it happen’ (X minutes)
Final go ahead decision
40. What was the decision making process and who was involved?
41. Who were the key decision makers you needed to get on board?
42. How easy was it to get their buy-in and final approval at this stage?
43. What factors had the biggest influence on their decisions?
Prompt – including any none energy benefits of the scheme
- If there were multiple decision makers, were different decision makers influenced by different
factors?
44. What information/data was required at this stage?
45. Were there any barriers to sign off?
- If yes, what were they?
- What would reduce or remove these barriers for future schemes?
Securing funds and procurement
46. Where did the funding for the project come from? (Single or multiple sources?)
47. What funding sources did you consider/approach? (Public / private sector)
48. What proportion of the final project funding was external funding?
49. How easy/difficult did you find it to obtain funding and attract investors?
- What, if any, difficulties did you face when trying to obtaining internal or external funding?
- What aspects of District Heating put investors off or encouraged investment?
- What did investors look for to justify investment in the project?
- What would encourage investors to put their money into future schemes?
- What would reduce or remove the barriers to obtaining funding for future schemes?
50. Would standardised price comparators help future schemes?
51. What could DECC produce to help future schemes secure funding and get the go ahead from decision
makers?

Research into barriers to deployment of district heating networks in suitable locations
83
- Probe - If DECC or some other body produced model commercial and corporate structures, risk
distribution mechanisms, and contract documents, would this help future schemes?
Customers / end users
52. Was the potential customer base consulted at any stage?
- If so, when and how were they consulted?
- Were both domestic and non-domestic customers consulted?
- What concerns if any did they express and how did you address these?
53. How easy/difficult was it to establish a customer base?
- What factors influenced this?
54. Did you encounter any difficulties getting access to land/properties?
- If yes, what were the implications for the project?
55. How did you decide how much to charge customers for their heat?
- What benchmarks (if any) did you use?
- What difficulties, if any, did you encounter?
Post completion
56. Who operates the scheme? How is the scheme managed and structured?
57. Have you identified/encountered any issues since installation?
- If yes, what were they? Have these issues had cost implications?
58. Do you think there should be a model customer charter/code of conduct, or statutory customer protection
rules?
- If so what should this look like and include?
59. (Question for those who connected to an existing heat source) What specific difficulties, if any, did you
experienced when connecting to existing heat sources?
60. (For those who went for a low/zero carbon heat source ask…) What lessons did you learn from changing the
heat sources to a low/zero carbon alternative?
Expanding schemes [see questionnaire answers]
61. Has the scheme been expanded in any way since it was first developed?
- If so how has it been expanded?

Research into barriers to deployment of district heating networks in suitable locations
84
- Why was the scheme expanded?
- What factors have facilitated expansion?
- What difficulties have been experienced when expanding existing heat networks?
Summary questions (10-15 minutes)
Referring back to the stages identified on the flip chart ask…
62. What stage or aspect of the development process did you find most difficult?
Referring to the post-it notes ask…
63. Which were the most significant barriers you had to overcome?
- What were the time and cost implications of each barrier? (where possible we need to try and
quantify the costs associated with the key barriers identified)
64. What was the most valuable support you received and why?
65. What barriers should DECC focus on reducing / removing to ensure more DH schemes are successful in the
future?
66. Would some kind of independent (one stop) advisory service have been helpful at any stage up to
procurement?
- If yes… would that be something you would have been willing to pay for?
-If no… why not?

Research into barriers to deployment of district heating networks in suitable locations
85
Appendix D Summary data of the
district heating scheme questionnaire
Summary data of the district heating scheme questionnaire
Table A1 Date of the first project development / planning meeting
Date of the first project development / planning meeting
Frequency Percent Valid Percent * Cumulative
Percent *
Valid
JAN 1987 1 4 5 5
FEB 1997 1 4 5 10
JAN 1999 1 4 5 15
JAN 2001 1 4 5 20
JAN 2004 1 4 5 25
JUN 2004 1 4 5 30
SEP 2004 1 4 5 35
JAN 2005 1 4 5 40
FEB 2005 1 4 5 45
OCT 2005 1 4 5 50
JAN 2006 1 4 5 55
NOV 2006 1 4 5 60
MAY 2007 1 4 5 65
JUL 2007 1 4 5 70
JAN 2008 1 4 5 75
SEP 2008 2 8 10 85
JUN 2009 1 4 5 90
JUN 2010 2 8 10 100
Total 20 80 100
Missing System 5 20
Total 25 100.0
*Due to rounding, values may not sum to 100.

Research into barriers to deployment of district heating networks in suitable locations
86
Table A2 At what stage of development is the scheme?
At what stage of development is the scheme?
Frequency Percent Valid Percent * Cumulative
Percent *
Valid
Complete and operational 17 68 68 68
Still in development 7 28 28 96
Did not proceed 1 4 4 100
Total 25 100 100
*Due to rounding, values may not sum to 100.

Research into barriers to deployment of district heating networks in suitable locations
87
Summary data for the complete and operational schemes
Table A3 Date of when the scheme first became operational
Date of when the scheme first became operational
Frequency Percent Valid Percent * Cumulative
Percent *
Valid
FEB 1950 1 4 5 5
JAN 1988 1 4 5 9
NOV 1998 1 4 5 14
OCT 2000 1 4 5 18
SEP 2003 2 8 9 27
DEC 2003 1 4 5 32
SEP 2004 1 4 5 36
SEP 2005 2 8 9 46
NOV 2006 1 4 5 50
FEB 2007 1 4 5 55
JUN 2007 1 4 5 59
AUG 2007 1 4 5 34
DEC 2007 1 4 5 38
AUG 2008 1 4 5 73
JUN 2009 1 4 5 77
OCT 2009 1 4 5 82
APR 2010 1 4 5 86
SEP 2010 2 8 9 96
DEC 2010 1 4 5 100
Total 22 88 100
Missing System 3 12
Total 25 100
*Due to rounding, values may not sum to 100.
Table A4 Has the scheme been expanded at all since it first became operational?
Has the scheme been expanded at all since it first became operational?
Frequency Percent Valid Percent * Cumulative
Percent *
Valid
Yes 18 72 72 72
No 7 28 28 100
Total 25 100 100
*Due to rounding, values may not sum to 100.

Research into barriers to deployment of district heating networks in suitable locations
88
Table A5 Date of the 1st expansion of the scheme
Date of the 1st expansion of the scheme
Frequency Percent Valid Percent * Cumulative
Percent *
Valid
JAN 1988 1 6 8 8
NOV 2000 1 6 8 17
AUG 2006 1 6 8 25
AUG 2007 1 6 8 33
SEP 2008 1 6 8 42
JAN 2009 1 6 8 50
JUL 2010 1 6 8 58
NOV 2010 2 11 17 75
MAY 2011 1 6 8 83
JUL 2011 1 6 8 92
JUL 2012 1 6 8 100
Total 12 67 100
Missing System 6 33
Total 18 100
*Due to rounding, values may not sum to 100.
Table A6 Date of the 2nd expansion of the scheme
Date of the 2nd expansion of the scheme
Frequency Percent Valid Percent * Cumulative
Percent *
Valid
JAN 1990 1 6 11 11
AUG 2008 1 6 11 22
SEP 2009 1 6 11 33
JAN 2010 1 6 11 44
JUN 2011 1 6 11 56
JUL 2011 1 6 11 67
SEP 2011 1 6 11 78
MAR 2012 1 6 11 89
DEC 2012 1 6 11 100
Total 9 50 100
Missing System 9 50
Total 18 100
*Due to rounding, values may not sum to 100.

Research into barriers to deployment of district heating networks in suitable locations
89
Table A7 Date of the 3rd expansion of the scheme
Date of the 3rd expansion of the scheme
Frequency Percent Valid Percent * Cumulative
Percent *
Valid
JUN 2010 1 6 33 33
MAY 2011 1 6 33 67
DEC 2013 1 6 33 100
Total 3 17 100
Missing System 15 83
Total 18 100
*Due to rounding, values may not sum to 100.
Table A8 Date of the 4th expansion of the scheme
Date of the 4th expansion of the scheme
Frequency Percent Valid Percent * Cumulative
Percent *
Valid
JAN 2012 1 6 50 50
SEP 2018 1 6 50 100
Total 2 11 100
Missing System 16 89
Total 18 100
*Due to rounding, values may not sum to 100.

Research into barriers to deployment of district heating networks in suitable locations
90
Table A9 Number of months after the scheme become operational that expansion occurred
Number of months after the scheme become operational that expansion
occurred
Frequency Percent Valid Percent * Cumulative
Percent *
Valid
-107 1 6 8 8
0 1 6 8 17
3 1 6 8 25
5 1 6 8 33
8 1 6 8 42
17 1 6 8 50
22 1 6 8 58
23 1 6 8 67
35 1 6 8 75
41 1 6 8 83
43 1 6 8 92
48 1 6 8 100
Total 12 67 100
Missing System 6 33
Total 18 100
*Due to rounding, values may not sum to 100.

Research into barriers to deployment of district heating networks in suitable locations
91
Table A10 Summary descriptive statistics for number of months to expansion
Three of the schemes were expanded as opposed to developed in the last 10 years. Due to the way in which this
was reported it appears that the scheme became operational 107 months prior to the first expansion. To prevent
misleading results the information from this scheme is not included in the table below.
Number of months after the scheme
become operational that expansion
occurred
N Valid 11
Missing 0
Mean 22
Median 22
Mode 0a
Std. Deviation 17.327
Skewness .191
Std. Error of Skewness .661
Kurtosis -1.548
Std. Error of Kurtosis 1.279
Range 48
Minimum 0
Maximum 48
Percentiles
25 5
50 22
75 41

Research into barriers to deployment of district heating networks in suitable locations
92
Table A11 Summary descriptive statistics for total heat and peak heat
Statistics
What was the total
heat supplied to the
network by the system
in the last 12 months?
(MWh)
What was the peak
heat output of the
system over the last 12
months? (MW)
N Valid 20 20
Missing 5 5
Mean 25072 8.48610
Median 14399 4.40700
Mode 20a 10.000
a
Std. Deviation 28812.0576 9.934240
Skewness 1.790 1.884
Std. Error of Skewness .512 .512
Kurtosis 2.940 4.280
Std. Error of Kurtosis .992 .992
Range 107980.0 39.700
Minimum 20.0 .300
Maximum 108000.0 40.000
Percentiles
25 5927 1.38375
50 14399 4.40700
75 39825 12.00000
a. Multiple modes exist. The smallest value is shown

Research into barriers to deployment of district heating networks in suitable locations
93
Table A12 Primary - heat generating technology
Primary - heat generating technology
Frequency Percent Valid Percent * Cumulative
Percent *
Valid
1 4 4 4
CHP - 2 x Janbacher 3MW CHP 1 4 4 8
Boiler - 700kw 1 4 4 12
Boiler 4 16 16 28
CHP 12 44 44 76
CHP - and central boilers 1 4 4 80
CHP - incinerator 1 4 4 84
CHP - Co-Genco 300KW CHP - MAN generator 1 4 4 88
Waste to energy 1 4 4 92
CHP - generator 1 4 4 96
CHP - Jenbacher 2 x 1000kW 1 4 4 100
Total 25 100 100
*Due to rounding, values may not sum to 100.
Table A13 Primary - fuel source
Primary - fuel source
Frequency Percent Valid Percent * Cumulative
Percent *
Valid
1 4 4 4
Gas 17 68 68 72
Gas - landfill 1 4 4 76
Biomass - wood chip 4 16 16 92
Waste - domestic 2 8 8 100
Total 25 100 100
*Due to rounding, values may not sum to 100.

Research into barriers to deployment of district heating networks in suitable locations
94
Table A14 Secondary - heat generating technology
Secondary - heat generating technology
Frequency Percent Valid Percent * Cumulative
Percent *
Valid
4 16 16 16
Boiler 14 56 56 72
Boiler - LTHW 3 12 12 84
Boiler – 1200 kw 1 4 4 88
Boiler – stand alone 1 4 4 92
CHP 2 8 8 100
Total 25 100 100
*Due to rounding, values may not sum to 100.
Table A15 Secondary - fuel source
Secondary - fuel source
Frequency Percent Valid Percent * Cumulative
Percent *
Valid
5 20 20 20
Gas 19 76 76 96
Oil 1 4 4 100
Total 25 100 100
*Due to rounding, values may not sum to 100.
Table A16 Back-Up - heat generating technology
Back-Up - heat generating technology
Frequency Percent Valid Percent * Cumulative
Percent *
Valid
16 64 64 64
Boiler - 10 MW 1 4 4 68
Boiler - 2 x 1600kw 1 4 4 72
Boiler 7 28 28 100
Total 25 100 100
*Due to rounding, values may not sum to 100.

Research into barriers to deployment of district heating networks in suitable locations
95
Table A17 Back-Up - fuel source
Back-Up - fuel source
Frequency Percent Valid Percent * Cumulative
Percent *
Valid
17 68 68 68
Biofuel 1 4 4 72
Oil 3 12 12 84
Gas 4 16 16 100
Total 25 100 100
*Due to rounding, values may not sum to 100.
Table A18 Summary descriptive statistics primary and secondary heat supply and fuel
Statistics
Primary -
proportion of the
overall annual
heat supply
produced by this
system (%)
Primary -
amount of fuel
used in the last
12 months
(MWh/annum)
Secondary -
proportion of the
overall annual
heat supply
produced by this
system (%)
Secondary -
amount of fuel
used in the last
12 months
(MWh/annum)
N Valid 23 17 20 18
Missing 2 8 5 7
Mean 56.304 16251.1318 41.750 10275.86339
Median 56.000 7000.0000 43.000 4650.00000
Mode 46.5a 26.00
a 35.0
a 14.000
a
Std. Deviation 22.1322 16773.69814 20.5366 15901.588642
Skewness -.350 .757 -.161 2.377
Std. Error of Skewness .481 .550 .512 .536
Kurtosis .658 -.774 .526 5.175
Std. Error of Kurtosis .935 1.063 .992 1.038
Range 95.0 51974.00 85.0 57986.000
Minimum 5.0 26.00 .0 14.000
Maximum 100.0 52000.00 85.0 58000.000
Percentiles
25 46.500 1903.1100 32.500 1159.00000
50 56.000 7000.0000 43.000 4650.00000
75 68.000 32511.9500 52.875 11038.27500

Research into barriers to deployment of district heating networks in suitable locations
96
Table A19 Summary descriptive statistics Back-Up heat supply and fuel
Statistics
Back-Up - proportion of the
overall annual heat supply
produced by this system (%)
Back-Up - amount of fuel
used in the last 12 months
(MWh/annum)
N Valid 6 4
Missing 19 21
Mean 22.00 2421.25
Median 8.00 1301.00
Mode 1a 0
a
Std. Deviation 36.737 3340.613
Skewness 2.175 1.305
Std. Error of Skewness .845 1.014
Kurtosis 4.904 .977
Std. Error of Kurtosis 1.741 2.619
Range 95 7083
Minimum 0 0
Maximum 95 7083
Percentiles
25 .75 .50
50 8.00 1301.00
75 38.75 5962.25
a. Multiple modes exist. The smallest value is shown
Table A20 Thermal storage unit
Is there a thermal storage unit?
Frequency Percent Valid Percent * Cumulative
Percent *
Valid
Yes 12 48 52 52
No 11 44 48 100
Total 23 92 100
Missing System 2 8
Total 25 100
*Due to rounding, values may not sum to 100.

Research into barriers to deployment of district heating networks in suitable locations
97
Table A21 Summary descriptive statistics of the volume the thermal storage unit
Statistics
What is the volume of the thermal
storage unit? (m3)
N Valid 11
Missing 1
Mean 389.36
Median 100.00
Mode 40a
Std. Deviation 686.038
Skewness 2.619
Std. Error of Skewness .661
Kurtosis 7.007
Std. Error of Kurtosis 1.279
Range 2270
Minimum 30
Maximum 2300
Percentiles
25 40.00
50 100.00
75 300.00
a. Multiple modes exist. The smallest
value is shown

Research into barriers to deployment of district heating networks in suitable locations
98
Table A22 Summary descriptive statistics, electricity generated
If the scheme includes a CHP
system, how much electricity was
generated in the last 12 months?
(MWh)
N Valid 18
Missing 0
Mean 96.00
Median 11.00
Mode 0
Std. Deviation 199.010
Skewness 2.391
Std. Error of Skewness .845
Kurtosis 5.765
Std. Error of Kurtosis 1.741
Range 500
Minimum 0
Maximum 500
Percentiles
25 882.575
50 8200.000
75 13523.575

Research into barriers to deployment of district heating networks in suitable locations
99
Table A23 Summary descriptive statistics, the number of dwelling types served by the heat networks
Statistics
How many flats
are served by
the heat
network?
How many
terraced houses
are served by
the heat
network?
How many
semi-detached
houses are
served by the
heat network?
How many
detached
houses are
served by the
heat network?
How many other
types of
dwelling are
served by the
heat network?
N 21 21 11 11 10 8
4 4 14 14 15 17
Mean 666.71 29.64 52.36 30.70 12.50
Median 240.00 .00 .00 .00 .00
Mode 0 0 0 0 0
Std. Deviation 909.885 63.289 149.385 78.616 35.355
Skewness 1.485 2.433 3.246 2.955 2.828
Std. Error of Skewness .501 .661 .661 .687 .752
Kurtosis 1.080 5.744 10.637 8.914 8.000
Std. Error of Kurtosis .972 1.279 1.279 1.334 1.481
Range 3000 200 500 250 100
Minimum 0 0 0 0 0
Maximum 3000 200 500 250 100
Percentiles
24.00 24.00 .00 .00 .00 .00
240.00 240.00 .00 .00 .00 .00
969.00 969.00 20.00 20.00 17.75 .00
Table A24 Are any non-domestic buildings connected to the heat network?
Are any non-domestic buildings connected to the heat network?
Frequency Percent Valid Percent * Cumulative
Percent *
Valid
Yes 21 84 88 88
No 3 12 13 100
Total 24 96 100
Missing System 1 4
Total 25 100
*Due to rounding, values may not sum to 100.

Research into barriers to deployment of district heating networks in suitable locations
100
Table A25 Summary descriptive statistics, number of different types of non-domestic buildings served by
the network
Statistics
How many
commercial
offices are served
by the heat
network?
How many central
and local
government
buildings are
served by the heat
network?
How many
healthcare
buildings are
served by the heat
network?
How many hotels
are served by the
heat network?
N Valid 11 12 11 10
Missing 14 13 14 15
Mean 7.27 2.08 3.27 2.10
Median 1.00 1.00 1.00 .50
Mode 0 0a 0 0
Std. Deviation 12.846 2.937 5.985 3.814
Skewness 2.027 1.761 2.585 2.368
Std. Error of Skewness .661 .637 .661 .687
Kurtosis 3.869 2.220 7.138 5.748
Std. Error of Kurtosis 1.279 1.232 1.279 1.334
Range 40 9 20 12
Minimum 0 0 0 0
Maximum 40 9 20 12
Percentiles
25 .00 .00 .00 .00
50 1.00 1.00 1.00 .50
75 15.00 2.75 4.00 2.75

Research into barriers to deployment of district heating networks in suitable locations
101
Table A26 Summary descriptive statistics, number of different types of non-domestic buildings served by
the network
Statistics
How many leisure
buildings are
served by the
heat network?
How many retail
buildings are
served by the
heat network?
How many
education
buildings are
served by the
heat network?
How many
industrial
buildings are
served by the
heat network?
N Valid 15 12 17 9
Missing 10 13 8 16
Mean 3.00 12.58 9.59 1.56
Median 1.00 .50 2.00 .00
Mode 1 0a 0 0
Std. Deviation 3.910 18.681 17.248 3.321
Skewness 1.969 1.358 2.784 2.556
Std. Error of Skewness .580 .637 .550 .717
Kurtosis 3.894 .555 8.579 6.716
Std. Error of Kurtosis 1.121 1.232 1.063 1.400
Range 14 50 68 10
Minimum 0 0 0 0
Maximum 14 50 68 10
Percentiles
25 1.00 .00 .00 .00
50 1.00 .50 2.00 .00
75 4.00 22.25 11.50 2.00
a. Multiple modes exist. The smallest value is shown

Research into barriers to deployment of district heating networks in suitable locations
102
Table A27 Summary descriptive statistics, total floor area, length of pipe work and distance between energy
centre and the further buildings
Statistics
What is the
approximate total floor
area of the non-
domestic buildings
served by the heat
network? (m2)
What is the total
length of the external
pipe work trench for
the network? (Metres)
What is the distance
between the energy
centre and the furthest
buildings served by
the network? (Metres)
N Valid 14 23 23
Missing 11 2 2
Mean 138327.29 5426.17 1081.04
Median 40500.00 3000.00 640.00
Mode 0a 10000 200
a
Std. Deviation 231666.878 6984.319 1330.958
Skewness 2.324 2.291 1.794
Std. Error of Skewness .597 .481 .481
Kurtosis 5.111 6.328 2.069
Std. Error of Kurtosis 1.154 .935 .935
Range 800000 30000 4410
Minimum 0 0 90
Maximum 800000 30000 4500
Percentiles
25 3975.00 700.00 250.00
50 40500.00 3000.00 640.00
75 147500.00 10000.00 1200.00

Research into barriers to deployment of district heating networks in suitable locations
103
Summary data for the schemes still in development
Table A28 Summary descriptive statistics, amount of heat supplied and peak output
Statistics
What is the
estimated total heat
to be supplied to the
network by the
system per annum?
(MWh)
What is the
estimated peak heat
output of the
system? (MW)
N Valid 8 8
Missing 3 3
Mean 22676.58200 7.557725
Median 8798.50000 6.000000
Mode 4000.000a 5.0000
Std. Deviation 33344.440993 5.8187368
Skewness 2.397 1.577
Std. Error of Skewness .752 .752
Kurtosis 5.869 2.817
Std. Error of Kurtosis 1.481 1.481
Range 97406.000 17.8122
Minimum 4000.000 2.1878
Maximum 101406.000 20.0000
Percentiles
25 5228.66400 2.955500
50 8798.50000 6.000000
75 29373.75000 10.250000
a. Multiple modes exist. The smallest value is shown
Table A29 Proposed primary - heat generating technology
Proposed primary - heat generating technology
Frequency Percent Valid Percent * Cumulative
Percent *
Valid
1 9 9 9
CHP 6 55 55 64
CHP – ACT 1 9 9 73
Boiler 2 18 18 91
Waste to energy 1 9 9 100
Total 11 100 100
*Due to rounding, values may not sum to 100.

Research into barriers to deployment of district heating networks in suitable locations
104
Table A30 Proposed primary - fuel source
Proposed primary - fuel source
Frequency Percent Valid Percent
*
Cumulative
Percent *
Valid
1 9 9 9
Waste - wood 1 9 9 18
Waste – domestic 1 9 9 27
Biomass – wood 1 9 9 36
Gas 7 64 64 100
Total 11 100 100
*Due to rounding, values may not sum to 100.
Table A31 Proposed secondary - heat generating technology
Proposed secondary - heat generating technology
Frequency Percent Valid Percent * Cumulative
Percent *
Valid
2 18 18 18
Boiler 7 64 64 29
Boiler - LTHW 1 9 9 91
CHP 1 9 9 100
Total 11 100 100
*Due to rounding, values may not sum to 100.
Table A32 Proposed secondary - fuel source
Proposed secondary - fuel source
Frequency Percent Valid Percent * Cumulative
Percent *
Valid
2 18 18 18
Gas 6 55 55 73
Biomass - unspecified 1 1 9 82
Biomass - wood pellets 1 1 9 91
Biodiesel 1 1 9 100
Total 11 100 100
*Due to rounding, values may not sum to 100.

Research into barriers to deployment of district heating networks in suitable locations
105
Table A33 Proposed back-up - heat generating technology
Proposed back-up - heat generating technology
Frequency Percent Valid Percent * Cumulative
Percent *
Valid
6 55 55 55
Boiler 5 46 46 100
Total 11 100 100
*Due to rounding, values may not sum to 100.
Table A34 Proposed back-up - fuel source
Proposed back-up - fuel source
Frequency Percent Valid Percent * Cumulative
Percent *
Valid
6 55 55 55
Gas 5 46 46 100
Total 11 100 100
*Due to rounding, values may not sum to 100.
Table A35 Summary descriptive statistics primary and secondary heat supply and fuel
Statistics
Proposed primary -
proportion of the
overall annual heat
supply produced by
this system (%)
Proposed primary -
amount of fuel used
in the last 12 months
(MWh/annum)
Proposed secondary
- proportion of the
overall annual heat
supply produced by
this system (%)
Proposed secondary
- amount of fuel
used in the last 12
months
(MWh/annum)
N Valid 8 1 8 1
Missing 3 10 3 10
Mean 70.88 .00 31.50 .00
Median 65.00 .00 27.50 .00
Mode 60 0 30 0
Std. Deviation 17.192 30.317
Skewness .717 1.916
Std. Error of Skewness .752 .752
Kurtosis -.865 4.491
Std. Error of Kurtosis 1.481 1.481
Range 47 0 99 0
Minimum 53 0 1 0
Maximum 100 0 100 0
Percentiles
25 57 0 12 0
50 65. 0 28 0
75 87 0 38 0

Research into barriers to deployment of district heating networks in suitable locations
106
Table A36 Summary descriptive statistics, amount of back-up heat supply and fuel
Statistics
Proposed back-up -
proportion of the overall
annual heat supply
produced by this system
(%)
Proposed back-up -
amount of fuel used in
the last 12 months
(MWh/annum)
N Valid 4 2
Missing 7 9
Mean 20.25 142330.00
Median 15.00 142330.00
Mode 5 0
Std. Deviation 18.264 201285.016
Skewness 1.362
Std. Error of Skewness 1.014
Kurtosis 1.621
Std. Error of Kurtosis 2.619
Range 41 284660
Minimum 5 0
Maximum 46 284660
Percentiles
25 6.25 0
50 15.00 142330
75 39.50 .
Table A37 Is a thermal storage unit proposed as part of the system?
Is a thermal storage unit proposed as part of the system?
Frequency Percent Valid Percent * Cumulative
Percent *
Valid
Yes 7 64 70 70
No 3 27 30 100
Total 10 91 100
Missing System 1 9
Total 11 100
*Due to rounding, values may not sum to 100.

Research into barriers to deployment of district heating networks in suitable locations
107
Table A38 Summary descriptive statistics of the volume the thermal storage unit
Statistics
What is the proposed volume of the
thermal storage unit? (m3)
N Valid 6
Missing 1
Mean 246.67
Median 117.50
Mode 35a
Std. Deviation 279.243
Skewness 1.527
Std. Error of Skewness .845
Kurtosis 1.638
Std. Error of Kurtosis 1.741
Range 715
Minimum 35
Maximum 750
Percentiles
25 53.75
50 117.50
75 487.50

Research into barriers to deployment of district heating networks in suitable locations
108
Table A39 Summary descriptive statistics, estimated electricity generated per annum by CHP system
If the scheme includes a CHP
system, how much electricity was
generated in the last 12 months?
(MWh)
N Valid 5
Missing 0
Mean 96.00
Median 11.00
Mode 0
Std. Deviation 199.010
Skewness 2.391
Std. Error of Skewness .845
Kurtosis 5.765
Std. Error of Kurtosis 1.741
Range 500
Minimum 0
Maximum 500
Percentiles
25 3804
50 7597
75 34129

Research into barriers to deployment of district heating networks in suitable locations
109
Table A40 Summary descriptive statistics, the expected number of different types of dwelling served by the heat networks
Statistics
How many flats
are expected to
be served by the
heat network?
How many
terraced houses
are expected to
be served by the
heat network?
How many semi
semi-detached
houses are
expected to be
served by the
heat network?
How many
detached houses
are expected to
be served by the
heat network?
How many other
types of dwelling
are expected to
be served by the
heat network?
N Valid 7 3 3 3 3
Missing 4 8 8 8 8
Mean 680.71 90.00 .00 .00 966.67
Median 503.00 .00 .00 .00 .00
Mode 0 0 0 0 0
Std. Deviation 659.258 155.885 .000 .000 1674.316
Skewness .982 1.732 1.732
Std. Error of Skewness .794 1.225 1.225 1.225 1.225
Kurtosis 1.150
Std. Error of Kurtosis 1.587
Range 1900 270 0 0 2900
Minimum 0 0 0 0 0
Maximum 1900 270 0 0 2900
Percentiles
25 0 0 0 0 0
50 503 0 0 0 0
75 980 . 0 0 .
Table A41 Are any non-domestic buildings expected to be connected to the heat network?
Are any non-domestic buildings expected to be connected to the heat
network?
Frequency Percent Valid Percent * Cumulative
Percent *
Valid
Yes 9 82 90 90
No 1 9 10 100
Total 10 91 100
Missing System 1 9
Total 11 100
*Due to rounding, values may not sum to 100.

Research into barriers to deployment of district heating networks in suitable locations
110
Table A42 Summary descriptive statistics, expected number of different types of non-domestic buildings
served by the network
Statistics
How many
commercial
offices are
expected to be
served by the
heat network?
How many
central and local
government
buildings are
expected to be
served by the
heat network?
How many
healthcare
buildings are
expected to be
served by the
heat network?
How many
hotels are
expected to be
served by the
heat network?
N Valid 5 4 3 2
Missing 6 7 8 9
Mean 2.00 6.50 .33 .00
Median 1.00 4.50 .00 .00
Mode 0 1a 0 0
Std. Deviation 2.345 6.557 .577 .000
Skewness .581 1.589 1.732
Std. Error of Skewness .913 1.014 1.225
Kurtosis -2.628 2.913
Std. Error of Kurtosis 2.000 2.619
Range 5 15 1 0
Minimum 0 1 0 0
Maximum 5 16 1 0
Percentiles
25 .00 1.75 0 0
50 1.00 4.50 0 0
75 4.50 13.25 . 0
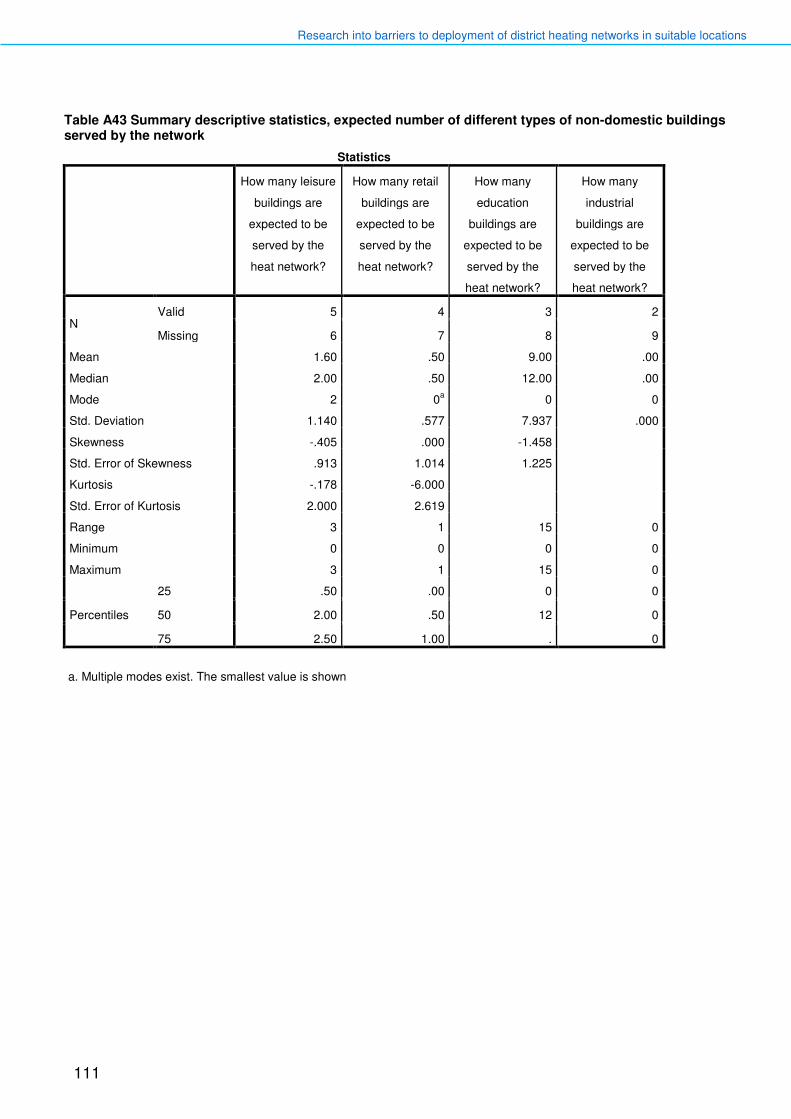
Research into barriers to deployment of district heating networks in suitable locations
111
Table A43 Summary descriptive statistics, expected number of different types of non-domestic buildings served by the network
Statistics
How many leisure
buildings are
expected to be
served by the
heat network?
How many retail
buildings are
expected to be
served by the
heat network?
How many
education
buildings are
expected to be
served by the
heat network?
How many
industrial
buildings are
expected to be
served by the
heat network?
N Valid 5 4 3 2
Missing 6 7 8 9
Mean 1.60 .50 9.00 .00
Median 2.00 .50 12.00 .00
Mode 2 0a 0 0
Std. Deviation 1.140 .577 7.937 .000
Skewness -.405 .000 -1.458
Std. Error of Skewness .913 1.014 1.225
Kurtosis -.178 -6.000
Std. Error of Kurtosis 2.000 2.619
Range 3 1 15 0
Minimum 0 0 0 0
Maximum 3 1 15 0
Percentiles
25 .50 .00 0 0
50 2.00 .50 12 0
75 2.50 1.00 . 0
a. Multiple modes exist. The smallest value is shown

Research into barriers to deployment of district heating networks in suitable locations
112
Table A44 Summary descriptive statistics, expected total floor area, length of pipe work and distance
between energy centre and the further buildings
Statistics
What is the
approximate total floor
area of the non-
domestic buildings
expected to be served
by the heat network?
(m2)
What is the expected
total length of the
external pipe work
trench for the proposed
network? (Metres)
What is the proposed
maximum distance
between the energy
centre and the furthest
buildings served by the
network? (Metres)
N Valid 8 10 9
Missing 3 1 2
Mean 42802.75 9835.00 1029.44
Median 29999.50 2350.00 500.00
Mode 1000a 0
a 500
Std. Deviation 47311.298 23022.646 1155.131
Skewness .992 3.099 1.740
Std. Error of Skewness .752 .687 .717
Kurtosis -.031 9.700 1.899
Std. Error of Kurtosis 1.481 1.334 1.400
Range 129000 75000 3300
Minimum 1000 0 200
Maximum 130000 75000 3500
Percentiles
25 4711.50 575.00 375.00
50 29999.50 2350.00 500.00
75 80435.25 6437.50 1622.50
a. Multiple modes exist. The smallest value is shown

Research into barriers to deployment of district heating networks in suitable locations
113
Appendix E Interpreting comments How to interpret comments in the report relating to magnitude of response
Comment/observation in the report What this means
One response or a reference to an individual response
One respondent provided an insightful comment which we felt should be reported, but, unless otherwise stated this was not mentioned by other respondents and is not necessarily a representative view.
A few or several More than one but less than five of the relevant respondents
Some Five or more respondents but not exceeding 50% of relevant respondents
Most More than 50% but less than 95% of relevant respondents
Nearly all 95% or more of respondents

© Crown copyright 2013
Department of Energy & Climate Change
3 Whitehall Place
London SW1A 2AW
www.gov.uk/decc
URN 13D/073