Reproductions supplied by EDRS are the best that …ED 459 639 AUTHOR TITLE INSTITUTION SPONS AGENCY...
136
ED 459 639 AUTHOR TITLE INSTITUTION SPONS AGENCY PUB. DATE NOTE, CONTRACT AVAILABLE FROM PUB TYPE EDRS PRICE DESCRIPTORS ABSTRACT DOCUMENT RESUME HE 034 527 Hoffer, Thomas B.; Dugoni, Bernard L.; Sanderson, Allen R.; Sederstrom, Scott; Ghadialy, Rashna; Rocque, Peter Doctorate Recipients from United States Universities: Summary Report 2000. Survey of Earned Doctorates. National Opinion Research Center, Chicago, IL. National Endowment for the Humanities (NFAH), Washington, DC.; Department of Education, Washington, DC.; Department of Agriculture, Washington, DC.; National Science Foundation, Arlington, VA.; National Institutes of Health (DHHS), Bethesda, MD.; National Aeronautics and Space Administration, Washington, DC. 2001-00-00 141p.; For the 1998 report, see ED 451 805. SRS-9712655 For full text: http://www.norc.uchicago.edu/issues/docdata.htm. Numerical/Quantitative Data (110) Reports Descriptive (141) Tests/Questionnaires (160) MF01/PC06 Plus Postage. *Doctoral Degrees; Educational Trends; Ethnicity; *Graduate Students; Graduate Study; Higher Education; *Racial Differences; Tables (Data); Trend Analysis This report presents data on recipients of research doctorates awarded by U.S. universities from July 1, 1999 through June 30, 2000. The information is taken from the Survey of Earned Doctorates, an annual census of new doctoral recipients. The 406 universities in the United States that confer research doctorates awarded a total of 41,368 doctorates in the 1999-2000 academic year. This is an increase of 0.8% over the previous year, marking the seventh year that the total number of new research doctorates has exceeded 41,000. The greatest number of research doctorates were awarded in the life sciences, 8,529 Ph.D.s. Other broad areas were the social sciences, education, the physical sciences and mathematics, the humanities, engineering, and business and other professional fields. Women received 43.81 of all doctorates granted in 2000, the highest percentage ever. More than 16% of all doctorates awarded to U.S. citizens in 2000 were earned by members of racial and ethnic minority groups. U.S. citizens received 70.61 of all doctorates earned in 2000. The median time to degree since receipt of the baccalaureate was 10.3 years in 2000, slightly down from 1999. Most doctoral recipients in 2000 received the majority of their financial support for graduate education from program- or institution-based sources such as fellowships or teaching and research assistantships. About one-half of new Ph.D.s reported no educational indebtedness at the completion of the degree; about 711 had definite postgraduate commitments for employment or continued study. Five appendixes contain the survey questionnaire, basic and trend tables, and technical notes. (Contains 12 figures and 41 tables.) (SLD) Reproductions supplied by EDRS are the best that can be made from the original document.
Transcript of Reproductions supplied by EDRS are the best that …ED 459 639 AUTHOR TITLE INSTITUTION SPONS AGENCY...
ED 459 639
AUTHOR
TITLE
INSTITUTIONSPONS AGENCY
PUB. DATE
NOTE,CONTRACTAVAILABLE FROM
PUB TYPE
EDRS PRICEDESCRIPTORS
ABSTRACT
DOCUMENT RESUME
HE 034 527
Hoffer, Thomas B.; Dugoni, Bernard L.; Sanderson, Allen R.;Sederstrom, Scott; Ghadialy, Rashna; Rocque, PeterDoctorate Recipients from United States Universities:Summary Report 2000. Survey of Earned Doctorates.National Opinion Research Center, Chicago, IL.National Endowment for the Humanities (NFAH), Washington,DC.; Department of Education, Washington, DC.; Department ofAgriculture, Washington, DC.; National Science Foundation,Arlington, VA.; National Institutes of Health (DHHS),Bethesda, MD.; National Aeronautics and SpaceAdministration, Washington, DC.2001-00-00141p.; For the 1998 report, see ED 451 805.SRS-9712655For full text:http://www.norc.uchicago.edu/issues/docdata.htm.Numerical/Quantitative Data (110) Reports Descriptive(141) Tests/Questionnaires (160)MF01/PC06 Plus Postage.*Doctoral Degrees; Educational Trends; Ethnicity; *GraduateStudents; Graduate Study; Higher Education; *RacialDifferences; Tables (Data); Trend Analysis
This report presents data on recipients of researchdoctorates awarded by U.S. universities from July 1, 1999 through June 30,2000. The information is taken from the Survey of Earned Doctorates, anannual census of new doctoral recipients. The 406 universities in the UnitedStates that confer research doctorates awarded a total of 41,368 doctoratesin the 1999-2000 academic year. This is an increase of 0.8% over the previousyear, marking the seventh year that the total number of new researchdoctorates has exceeded 41,000. The greatest number of research doctorateswere awarded in the life sciences, 8,529 Ph.D.s. Other broad areas were thesocial sciences, education, the physical sciences and mathematics, thehumanities, engineering, and business and other professional fields. Womenreceived 43.81 of all doctorates granted in 2000, the highest percentageever. More than 16% of all doctorates awarded to U.S. citizens in 2000 wereearned by members of racial and ethnic minority groups. U.S. citizensreceived 70.61 of all doctorates earned in 2000. The median time to degreesince receipt of the baccalaureate was 10.3 years in 2000, slightly down from1999. Most doctoral recipients in 2000 received the majority of theirfinancial support for graduate education from program- or institution-basedsources such as fellowships or teaching and research assistantships. Aboutone-half of new Ph.D.s reported no educational indebtedness at the completionof the degree; about 711 had definite postgraduate commitments for employmentor continued study. Five appendixes contain the survey questionnaire, basicand trend tables, and technical notes. (Contains 12 figures and 41 tables.)(SLD)
Reproductions supplied by EDRS are the best that can be madefrom the original document.
NATIONAL ENDOWMENT FOR THE
HUMANITIES
ATES OF N
USDA
31k
Doctorate Recipients from
United States Universities:
Summary Report 2000
U.S. DEPARTMENT OF EDUCATIONOffice of Educational Research and improvement
EDUCATIONAL RESOURCES INFORMATIONCENTER (ERIC)
0.0Th"rs document has been reproduced asreceived from the person or organizationoriginating it.
0 Minor changes have been made toimprove reproduction quality.
Points of view or opinions stated in thisdocument do not necessarily representofficial OERI position or policy.
Survey of Earned Doctorates
SPONSORED BY THE NATIONAL SCIENCE FOUNDATION, THE NATIONAL INSTI-TUTES OF HEALTH, THE U.S. DEPARTMENT OF EDUCATION, THE NATIONALENDOWMENT FOR THE HUMANITIES, THE U.S. DEPARTMENT OF AGRICUL-TURE, AND THE NATIONAL AERONAUTICS AND SPACE ADMINISTRATION
- -

HIGHLIGHTS
This report presents data on recipients of research doctorates awarded by U.S. universities from July 1, 1999,through June 30, 2000. This information is taken from the 2000 Survey of Earned Doctorates (SED), an annualcensus of new doctorate recipients.
The 406 universities in the United States conferring research doctorates during the 1999-2000academic year (the eligibility period for the 2000 SED) awarded a total of 41,368 doctorates. Thiscompares to 41,060 doctorates awarded in 1999 (an increase of 0.8 percent), and marks the seventhconsecutive year that the total number of new research doctorates has exceeded 41,000.
The number of doctorates awarded in 2000 was greatest in the life sciences, which conferred 8,529Ph.D.s. The numbers in the other broad areas were 7,115 in social sciences; 6,420 in education;6,077 in the physical sciences and mathematics (combined); 5,634 in the humanities; 5,330 inengineering; and 2,263 in business and other professional fields.
Women received a total of 18,121 doctorates, or 43.8 percent of all doctorates granted in 2000. This isthe highest percentage ever for women, continuing a 30-year upward trend. The proportions ofdoctorates earned by women in each of the broad fields of study increased to all-time highs. Womenearned 46.9 percent of the doctorates granted in life sciences, 54.6 percent in social sciences, 50.3percent in humanities, 64.9 percent in education, and 41.8 percent in business/other professionalfields. In the physical sciences and engineering, they constituted 24.2 percent and 15.8 percent,respectively.
Over 16 percent of all doctorates awarded to U.S. citizens in 2000 were earned by U.S. racial/ethnicminority groups. This is the largest percentage ever, and continues a steady upward trend. Among the27,300 doctorates earned in 2000 by U.S. citizens who identified their race/ethnicity (97.9 percent of allU.S. citizen doctorates), 1,656 doctorates were earned by blacks, 1,157 were earned by Hispanics,1,407 were earned by Asians, and 169 were earned by American Indians. The broad fields with thelargest percentages of minorities were education, in which blacks were the predominant minoritygroup, and engineering, in which Asians were predominant.
Of the individuals who reported their citizenship status (95.4 percent of all doctorate recipients), U.S.citizens received 70.6 percent of all doctorates earned in 2000. One half (49.4 percent) of thedoctorates earned by U.S. citizens were awarded to women. The percentage of doctorates earned byU.S. citizens ranged from the lows of 44.1 percent in engineering and 56.2 percent in the physicalsciences, to the highs of 89.3 percent in education and 81.7 percent in the humanities.
A total of 11,597 doctorates (29.4 percent) were earned by non-U.S. citizens. The largest number ofnon-U.S. citizen doctorate recipients were from the People's Republic of China (2,594), followed byKorea with 1,048, India with 985, Taiwan with 936, and Canada with 514.
Median time to degree since receipt of the baccalaureate was 10.3 years in 2000, slightly down from1999 (10.4 years), 1998 (10.4 years), and 1997 (10.5 years). Median time to degree since firstenrollment in any graduate program was 7.4 years in 2000, also slightly lower than 1999, 1998, and1997 (7.3 years in all three years).
Most of the 2000 doctorate recipients (61.1 percent) received the majority of their financial support forgraduate education from such program- or institution-based sources as university fellowships orteaching and research assistantships. One-half (49.3 percent) of the 2000 doctorate recipientsreported no educational indebtedness at completion of the Ph.D.; 15.1 percent reported cumulativeeducation debt levels of $30,000 or more.
About 71 percent of the new Ph.D.s had definite postgraduation commitments for employment orcontinued study when they completed the SED questionnaire. Of those, 71.3 percent will work and28.7 percent will continue their studies as postdoctorates. For U.S. citizens, 52.1 percent of those withfirm employment commitments noted higher education as their intended work sector. About one-fifth(19.9 percent) indicated industry or self-employment; 8.6 percent said some level of government; theremaining 19.4 percent indicated various other types of employment.

Information on Standard Survey of Earned Doctorates Products
Issue Briefs and Reports
Federal sponsors of the Survey of Earned Doctorates (SED) issue short reports, based onSED data, highlighting issues and trends in doctoral education. These are distributed freethrough the National Science Foundation's World Wide Web site (see below) or onrequest from the agencies.
Science and Engineering Doctorate Awards: 2000(http://www.nsf.gov/sbe/srs/sengdr/start.htm)
The data presented in this report show trends in doctorate awards by science andengineering (S&E) field and recipient characteristics, institutions awarding doctorates,and postgraduate plans of recipients. These tables present detailed data on S&E doctoraterecipients, with some totals provided for broad non-S&E fields. These data are availablein printed form from NSF by e-mailing Susan Hill, Director, Doctorate Data Project, [email protected].
Annual Summary Report Early Release Tables on NORC Web site(http://www.norc.uchicago.edu/issues/docdata.htm)
A standard set of tables reporting SED data appears in Appendices A and B in theSummary Report. These tables are posted on the National Science Foundation's WorldWide Web site or are available on request from the National Opinion Research Center(NORC). Early release tables are distributed before the Summary Report is printed.
Doctorate Recipients from United States Universities: Summary Report 2000
Data on doctorates are reported annually by academic year (from July 1 of one year toJune 30 of the following year) and include research and applied research doctorates in allfields. Doctoral degrees such as Ph.D., D.Sc., and Ed.D. are covered by this survey.Professional degrees (e.g., M.D., D.D.S., J.D., Psy.D.) are not. A hard copy SummaryReport is available free on request from the National Opinion Research Center, and aPDF version is available on the NORC's Web site provided above.
Tabulations of Research Doctorates, by Race/Ethnicity, Gender, and Fine Fieldof Doctorate: 1990-2000
These tabulations, available in hard copy or electronic (Microsoft Excel spreadsheet)form, provide national-level counts of doctorate recipients by fine field of doctorate,gender, race/ethnicity and citizenship. These data are available at cost from NORC. Seethe enclosed order form.

Association Profiles
This product allows scholarly and professional organizations (or other interested datausers) to obtain trend data from 1960 to the present on research doctorate recipients infields of their choosing. The profiles present trend data on research doctorates'demographic characteristics and employment plans for the selected fields, comparingthem to national profiles.
Institution Profiles and Datasets
All Graduate Deans who participate in the SED receive a profile of their institution'sresearch doctorates comparing them to all research doctorates in the U.S. and to researchdoctorates at peer institutions. In addition, Graduate Deans may order, at cost, anelectronic file on CD-ROM or diskette reporting data for all of that institution's doctoraterecipients recorded in the Survey of Earned Doctorates from 1920 to 2000. A codebookand other aids are provided to facilitate computer processing of the dataset.
Custom Tabulations
NORC will perform, at cost, tabulations customized to requesters' researchspecifications. NORC will provide estimates of cost and delivery date for customerapproval before performing work. For further information on this service, contact:
Lance Selfa - Doctorate Data ProjectNational Opinion Research Center (NORC)55 East Monroe Street - Suite 4800, Chicago, IL 60603Phone: (312) 759-4031 Fax: (312) 759-4005E-mail: [email protected]

NORC1112:1=1111,UNIVERSITY OF CHICAGO
ORDER FORM FOR INSTITUTION DATASETS
DOCTORATE RECORDS DATA, 1920-2000from the Survey of Earned Doctorates (SED)
To order Doctorate Records data for your institution, please complete and return the form belowwith a check for $225 (for cost of materials/mailing) made to "NORC." The charge includes thedataset of all Doctorate Records File variables for your institution's research doctorate recipients,provided in ASCII, fixed column format; full documentation of the dataset; and an electronic layoutfile to read the dataset. The layout can be adapted for use in software packages like SPSS andSAS. Doctorate Records Data will be shipped by Federal Express, so please provide a streetaddress for delivery. The data are distributed on one of two media: a CD-ROM or a 3.5-inch,high-density diskette.
These data are confidential. The signature of the graduate dean is required to ensure that yourinstitution will use the data only for statistical and analytic purposes.
Product Medium Check one:
ASCII, fixed-column length dataset of your institution's DISKETTEresearch doctoral graduates, 1920-2000
CD-ROM
Authorized by:
Signed:
Deliver to:
Name (Please print)
Title
Institution Telephone
Graduate Dean or equivalent
Name
Address (Important: Please provide a street address).
City State Zip
PAYMENT MUST ACCOMPANY ORDER. Please return order form with check to:MAKE CHECKS PAYABLE TO NORC.
Doctorate Data ProjectNational Opinion Research Center55 E. Monroe AvenueSuite 4800Chicago, IL 60603Attn: Lance Selfa
Telephone: (312) 759-4031
NORCLIMM11111111111UNIVERSITY OF CHICAGO ORDER FORM
TABULATIONS OF RESEARCH DOCTORATES,BY RACE/ETHNICITY, GENDER, AND FINE FIELD OF DOCTORATE: 1990-2000
FROM THE SURVEY OF EARNED DOCTORATESAVAILABLE EARLY 2002
To order these tabulations, please complete and return the form below with a check made to "NORC." These datawill be shipped by Federal Express, so please provide a street address (no P.O. boxes) for delivery. The data aredistributed in one of two media: a hardcopy printout or a Microsoft Excel 97 spreadsheet on a 3.5-inch, high-densitydiskette. PLEASE MAKE SURE TO SIGN BELOW. ORDER CANNOT BE PROCESSED WITHOUT SIGNATURE.
Table 1: Number of Research Doctorates, by Fine Field of Doctorate, Race/Ethnicity,Citizenship, and Gender: 2000
Bound Paper Copy $75 Microsoft Excel Diskette $75
Table 2: Research Doctorates Awarded to U.S. Citizens, by Race/Ethnicity, Gender, andFine Field of Doctorate: 1990-2000
Bound Paper Copy $75 Microsoft Excel Diskette $75
Table 3: Research Doctorates Awarded to U.S. Citizens and Permanent Residents,by Race/Ethnicity, Gender, and Fine Field of Doctorate: 1990-2000
Bound Paper Copy $75 Microsoft Excel Diskette $75
Table 4: Number of Research Doctorates, by Fine Field of Doctorate, Race/Ethnicity,Citizenship, and Gender: 1999 (revised)
Bound Paper Copy $75 Microsoft Excel Diskette $75
I certify that the data are to be used for statisticalpurposes only and that no attempt will be made toidentify individuals from the tabulations.
Signature Date
Total number of paper copiesTotal number of diskettesTotal
Total amount due
x $75.00
Requester name (PRINT)
Institution
Street address (very important)
City, State, ZIP
Telephone
PAYMENT MUST ACCOMPANY ORDER. NOPURCHASE ORDERS CAN BE ACCEPTED.MAKE CHECKS PAYABLE TO NORC.
Please return order form with check to:
Doctorate Data ProjectNational Opinion Research Center55 E. Monroe AvenueSuite 4800Chicago, IL 60603Attn: Lance Selfa
Telephone: (312) 759-4031
Doctorate Recipients fromUnited States Universities:Summary Report 2000
The Survey of Earned Doctorates is funded byand conducted under the direction of the followingagencies of the U.S. government:
National Science FoundationNational Institutes of HealthU.S. Department of EducationNational Endowment for the HumanitiesU.S. Department of AgricultureNational Aeronautics and Space Administration
Thomas B. HofferBernard L. DugoniAllen R. SandersonScott SederstromRashna GhadialyPeter Rocque
OF 6-
O"Nre%te, iittA
Toz--LNiti%kg,
NORC at the University of Chicago
National Opinion Research CenterChicago, Illinois2001
NATIONAL ENDOWMENT FOR THE USDAHUMANITIES
0

NOTICE
This report is based on data collected in the Survey of Earned Doctorates (SED) conducted for the National ScienceFoundation (NSF), the National Institutes of Health (NIH), the U.S. Department of Education (USED), the NationalEndowment for the Humanities (NEH), the U.S. Department of Agriculture (USDA), and the National Aeronautics andSpace Administration (NASA), by National Opinion Research Center (NORC) under NSF Contract No. SRS-9712655.Findings in this publication represent analyses developed by NORC, and do not necessarily reflect the views of thesponsoring agencies.
NSF publications from the Survey of Earned Doctorates and the Doctorate Records File are available free on request (seeinside back cover). Standardized tables on baccalaureate origins of Ph.D.s by major field of doctorate and trend tables oncitizenship, race/ethnicity, and sex of Ph.D.s by fine field of doctorate are available for a fee. Customized tables can alsobe prepared at cost. For more information, please contact:
Doctorate Data Project Phone: (773) 753-7500NORC Fax: (773) 753-78861155 East 60th Street E-mail: [email protected], IL 60637
Material in this publication is in the public domain and, with appropriate credit, may be reproduced without permission.Recommended citation:
Hoffer, T., B. Dugoni, A. Sanderson, S. Sederstrom, R. Ghadialy, and P. Rocque. 2001. Doctorate Recipients from UnitedStates Universities: Summary Report 2000. Chicago: National Opinion Research Center. (The report gives the results ofdata collected in the Survey of Earned Doctorates, conducted for six Federal agencies, NSF, NIH, USED, NEH, USDA,and NASA by NORC.)
This report is available on the NORC web-site: http://www.norc.uchicago.edu/issues/docdata.htm. Reports on science andengineering doctorates can be found on the National Science Foundation's web-site:
http://www.nsf.gov/sbe/srs/sengdr/start.htm.
ACKNOWLEDGMENTS
Academic officers at the nation's doctorate-granting universities distribute, collect, and forward SEDquestionnaires to NORC. The project gratefully acknowledges the support and assistance of graduate deans and their staff,registrars, dissertation secretaries, and other administrators who participate in the SED effort and contribute to its success.The sponsoring Federal agencies and NORC also extend their heartfelt thanks to the over 38,000 new research doctoraterecipients who took the time to complete and return their copy of the academic year 2000 SED survey.
The conduct of the SED, the maintenance of the resulting data file, and the publication of this report are fundedjointly by the National Science Foundation (NSF), the National Institutes of Health (NIH), the U.S. Department ofEducation (USED), the National Endowment for the Humanities (NEH), the U.S. Department of Agriculture (USDA), andthe National Aeronautics and Space Administration (NASA). Susan Hill (NSF) serves as the project officer for the sixparticipating agencies. The survey's relevance to national policy issues has increased, thanks to the involvement andconstructive reviews of the design and analysis of the survey by representatives from the six agencies: Walter Schaffer(NIH), Nancy Borkow (USED), Frank Shaw (NEH), K. Jane Coulter (USDA), Malcom Phelps (NASA), and MaryGolladay (NSF). Comments from reviewers Peter Syverson of the Council of Graduate Schools, Judi Sui of the Universityof California-Berkeley, and Jed Marsh of Northwestern University were invaluable and greatly appreciated.
Isabel Guzman-Barron, Administrative Assistant, continued to provide expert assistance with table production,graphics, and text formatting on this Summary Report. The authors also eratefully acknowledge the contributions of theirNORC colleagues who provided valuable counsel, direction, and assistance with various survey responsibilities over thepast year: Bronwyn Nichols and Sharon Myers, Associate Project Directors; Lance Selfa, Research Analyst; Syed Ahsan,Programming Manaeer; Jie Yin, Senior Programmer; Sharnia Bullock, Coordinator for the Data Preparation Center; JamieFriedman, Director of Institutional Contacting; Crystal Williams, Data Preparation Supervisor, and the Production CenterStaff; and Imelda Perez of the Communications Department.
Printed in the United States of America
II

CONTENTS
Page
HIGHLIGHTS inside front cover
LIST OF FIGURES iv
LIST OF TABLES iv
IMPORTANT NOTICE vii
INTRODUCTION 1
Organization 1
Related Publications 2
TRENDS IN DOCTORATE RECIPIENTS 3
Overall Trends and Rates of Change 3
Doctorate-granting Institutions, Doctorates Recipients per Institution, and Geographical Distribution 5
Doctorates by Broad Field 6
Doctorates by Sex 10
Doctorates by Race/Ethnicity 12
Doctorates by Citizenship 15
Doctorates by Parental Education Background 17
Time to Degree 18
FINANCIAL RESOURCES IN SUPPORT OF DOCTORATE RECIPIENTS, INCLUDING INDEBTEDNESS 21
POSTGRADUATE PLANS, EMPLOYMENT, AND LOCATION 25
Definite versus Indefinite Plans 25
Career Employment versus Postdoctorates 26
Postdoctoral Location of Non-U.S. Citizens 26
Employment Sectors in the United States. 27
DATA TABLES 29
APPENDICES 59
A The Eight Basic Tables, 2000 61
B Trend Tables, 1990-2000 90
C Technical Notes 98
D Survey of Earned Doctorates Questionnaire, Academic Year 2000 109
E Field Classification and Research Degree Titles 123
NSF PUBLICATIONS FROM THE DOCTORATE DATA PROJECT inside back cover
1 0

LIST OF FIGURESPage
Figure 1 Doctorates awarded by U.S. colleges and universities, 1957-2000 4
Figure 2 Annual growth or decline in doctorates awarded by U.S. collegesand universities, 1957-2000 4
Figure 3 Top 20 doctorate granting states, 2000 6
Figure 4 Science and engineering doctorates awarded by broad field, 1970-2000 8
Figure 5 Humanities, education, and professional/other fields doctorates awarded, 1970-2000 8
Figure 6 Distribution of doctorate recipients by broad field, 1970 and 2000 9
Figure 7 Doctorate recipients by sex, 1990-2000 10
Figure 8 Percent of female doctorate recipients by broad field, 1970, 1980, 1990, 2000 11
Figure 9 Doctorates awarded to minority U.S. citizens, by race/ethnicity, 1980-2000 12
Figure 10 Percentage of doctorates earned by minority U.S. citizens, 1980 and 2000 13
Figure 11 Percentage of doctorates earned by minority U.S. citizens, by broad field, 2000 13
Figure 12 Percentage of doctorates earned by minority U.S. citizens, by sex, 2000 14
Figure 13 Median number of years to doctorate from baccalaureate award and age atdoctorate, 1975-2000 19
Figure 14 Age distribution at doctorate by broad field of study, 2000 20
Figure 15 Primary sources of financial support for doctorate recipients, 2000 22
LIST OF TABLESPage
Table 1 Number of doctorates awarded and annual percentage change in doctoratesawarded by U.S. colleges and universities, 1957-2000 31
Table 2 Number of doctorates awarded by U.S. colleges and universities andaverage doctorate recipients per institution, 1962-2000 32
Table 3 Top 20 doctorate-granting institutions, by broad field of doctorate, 2000 33
Table 4 Number of doctorate recipients by state, including the District of Columbiaand Puerto Rico, 2000 35
Table 5 Major field of doctorate recipients for selected years, 1970-2000 36
Table 6 Doctorate recipients and percent earned by females, by selected subfields, 1990 and 2000 37
Table 7 Number and percent of doctorate recipients, by sex within broad field for selectedyears, 1970-2000 38
iv

LIST OF TABLES (Continued)Page
Table 8 Number of U.S. citizen doctorate recipients by race/ethnicity within broad field for selectedyears, 1980-2000 39
Table 9 Major field of U.S. citizen doctorate recipients, by race/ethnicity, 2000 40
Table 10 Leading doctorate-granting institutions of U.S.-minority doctorate recipients byracial/ethnic group, 1996-2000 41
Table 11 Citizenship status of doctorate recipients, by broad field for selected years, 1970-2000 42
Table 12 Top 30 countries of origin of non-U.S. citizens earning doctorates atU.S. colleges and universities (ranked by number of earned doctorates), 2000 43
Table 13 Top 20 institutions in the number of doctorate recipients who were non-U.S. citizens, 2000 44
Table 14 Top 20 institutions in the percentage of doctorate recipients who were non-U.S. citizens, 2000 44
Table 15 Parental educational attainment of doctorate recipients, 2000 45
Table 16 Median number of years from baccalaureate to doctorate award, by broad fieldfor selected years, 1975-2000 46
Table 17 Median number of years from baccalaureate to doctorate award, by demographicgroup and broad field, 2000 47
Table 18 Distribution of doctorate recipients, by age at doctorate, 2000 48
Table 19 Primary sources of financial support for doctorate recipients, by broad fieldand demographic group, 2000 49
Table 20 Cumulative debt related to education of doctorate recipients, by broad field, 2000 50
Table 21 Cumulative debt related to education of doctorate recipients, by demographic group, 2000 50
Table 22 Postgraduation status of doctorate recipients, by broad field for selected years,1980-2000 51
Table 23 Postgraduation status of doctorate recipients, by demographic group for selected years,1980-2000 52
Table 24 Postgraduation commitments of doctorate recipients, by type of plans and broad fieldfor selected years, 1980-2000 53
Table 25 Postgraduation commitments of doctorate recipients, by type of plans and demographic groupfor selected years, 1980-2000 54
Table 26 Postdoctoral location of non-U.S. citizen doctorate recipients with postgraduationcommitments, by major field and visa status, 2000 55
Table 27 Postdoctoral location of non-U.S. citizen doctorate recipients with postgraduationcommitments, by visa status for selected years, 1980-2000 56
Table 28 Employment sector of doctorate recipients with postgraduation commitments inthe United States, by demographic group for selected years, 1980-2000 57
v

APPENDIX TABLES
Table A-1 Number of doctorate recipients, by sex and subfield, 2000 66
Table A-2 Number of doctorate recipients, by citizenship, race/ethnicity, and subfield, 2000 68
Table A-3 Statistical profile of doctorate recipients, by major field, 2000 72
Table A-4 Statistical profile of doctorate recipients, by race/ethnicity and citizenship, 2000 78
Table A-5 Doctorate recipients' financial resources in support of doctoral programs, by broad fieldand sex, 2000 80
Table A-6 State of doctoral institution of doctorate recipients, by broad field and sex, 2000 81
Table A-7 Institutions granting research doctorates, by major field, 2000 82
Table A-8 Top 50 doctorate-granting institutions, 2000 89
Table B-1 Number of doctorate recipients, by subfield, 1990-2000 91
Table B-2 Number of doctorate recipients, by sex, race/ethnicity, and citizenship, 1990-2000 95
Table C-1 Survey response rates, 1967-2000 98
Table C-2 Profiles of respondents versus nonrespondents for critical item data, by source ofresponse, 2000 100
Table C-3 Item response rates, 1990-2000 102
vi

*** IMPORTANT NOTICE ***
The estimates reported for the Survey of Earned Doctorates (SED) are simpletabulations of all available information, with no adjustment for nonresponse. Therefore,differences in response rates from year to year can produce numerical fluctuations that maynot be related to real trends.
Although response to the SED has been as high as 95 to 98 percent over time, itdeclined to 92 percent during the 1980s. In an effort to improve the response rate, the surveymethodology was modified in the years after 1989. Response rose, stabilizing around95 percent from 1991 to 1995. The rates have declined somewhat since then, to 92.8 percentin 1996; 91.4 percent in 1997; and 91.9 percent in 1998, 1999, and 2000. See appendix C fora table giving survey response rates from 1967 to 2000. (Note: These percentages representself-report rates, that is, the proportion of questionnaires completed by research doctoraterecipients. While survey forms containing partial information filled in by either the doctoralinstitution or the survey contractor are not included in these rates, tables in this reportincorporate the available data from these sources.)
Item response rates have shown a pattern of improvement since 1990a naturalconsequence of the increase in the overall self-report rate, as well as a result of formatrevisions to the questionnaire and follow-ups for missing information. In 1990, newfollow-up procedures were implemented to increase coverage of several variables: birth year,sex, race/ethnicity, citizenship status, country of citizenship, baccalaureate year andinstitution, and postgraduation plans. Response rates for these variables have sinceimprovedespecially for citizenship and race/ethnicity, resulting in an increase in thereported numbers of minority Ph.D.s. Whether or not individuals completed the surveyquestionnaire, the following four data items are available for most all recipients: sex, Ph.D.institution, Ph.D. field of specialization, and Ph.D. year.
The data for a given year are updated the following year with any responses receivedafter survey closure. Postsurvey adjustment was most significant for 1990 and 1991 Ph.D.s,with the largest impact on the number of blacks. For both of these years, the total number ofblack Ph.D.s increased by about 7.5 percent in the year after survey closure. The survey cyclewas then extended to allow receipt of more follow-up information before closure, resulting inmuch smaller postsurvey adjustments after 1991. But some completed questionnaires andrevised information on doctorate recipients typically are still received after the annual closuredeadline, and universe counts and item response rates change accordingly. Adjustments todata are presented in reports subsequent to the initial report for a survey. For example,updates for 1999 appear in Summary Report 2000. Updates to 2000 data will be presented innext year's report.
14vii

DOCTORATE RECIPIENTS FROM UNITED STATESUNIVERSITIES: SUMMARY REPORT 2000
Introduction
Doctorate Recipients from United States Universities: Summary Report 2000 is the
thirty-fourth in a series of reports on research doctorates awarded by colleges and universities in
the United States.' The data presented in this report are from the annual Survey of Earned
Doctorates (SED), a census of research doctorate recipients who earned their degrees between
July 1, 1999, and June 30, 2000. This survey, conducted since 1958, is sponsored by six Federal
agencies: the National Science Foundation, the National Institutes of Health, the U.S.
Department of Education, the National Endowment for the Humanities, the U.S. Department of
Agriculture, and the National Aeronautics and Space Administration. All survey responses
become part of the Doctorate Records File (DRF), a virtually complete database on research
doctorate recipients from 1920 to 2000. The overall response rate for the 2000 survey was 92
percent.2
Organization
Summary Report 2000 begins by reviewing overall trends in research doctorates awarded
by U.S. universities and continues by discussing trends in the seven broad fields in which
research doctorate recipients earn their degrees. Trends in doctorate awards by sex,
race/ethnicity, citizenship, parental education, and time to degree are also described. The report
concludes with a discussion of the sources of financial support during graduate school, and the
postgraduation status and plans of doctorate recipients.
Figures displaying selected trend data accompany the brief narratives of key survey
findings. The numbers and percentages from which the figures are drawn are contained in a set
of tables following the main text. A reference at the bottom of each figure indicates the
The Survey of Earned Doctorates collects information on research doctorate recipients only. Thissurvey differs from the U.S. Department of Education's collection of the number of doctoral degreesawarded per institution for all fields. For an evaluation of the differences, see National ScienceFoundation, 1993, Science and Engineering Doctorates 1960-1991, NSF 93-301, Detailed StatisticalTables, pp. 2-6, Washington, DC.2 See appendix C for information on response rates for the SED.
1
corresponding table number. Basic tables of statistics for the 2000 research doctorate recipients
are shown in appendix A, and trend tabulations for the previous ten-year period (1990 to 2000)
are presented in appendix B. Appendix C provides technical notes, including response rates, and
other information related to tables and figures in the report. Appendix D is the SED
questionnaire for the 2000 academic year. Appendix E lists field of study classifications and
research degree titles included in the SED.
Related Publications
The methodology of the SED 2000 survey is described in detail in the annual Survey of
Earned Doctorates Quality Profile Report: 2000. This report is posted on the National Science
Foundation, Division of Science Resources Statistics (SRS) web site
(http://www.nsf.gov/sbe/srs/ssed/sedmeth.htm). The NSF also publishes an annual volume of
tabulations using the SED data, Science and Engineering Doctorate Awards: 2000 that is
available from NSF-SRS in printed form or on the NSF-SRS web site. Copies of the annual
Summary Report from previous years are available on both the NSF-SRS web site and the
NORC web site (http://www.norc.uchicago.edu/issues/docdata.htm).
I C 2

Trends in Doctorate Recipients
The primary respondents to the Survey of Earned Doctorates are the actual research
doctorate recipients3 from all U.S. universities. These individuals are identified each year by the
universities and the information is transmitted to the SED data collection contractor (NORC at
the University of Chicago has been the contractor since 1997). The lists of new doctorate
recipients are carefully checked and edited by the data collection contractor working closely with
the universities over the course of the SED eligibility year, and for a period of several months
after the end of the eligibility period. The result of this process is a remarkably comprehensive
picture of the universe of new doctorate recipients each year. Thus, these data provide a solid
basis for charting trends in the numbers and characteristics of this important population.
Overall Trends and Rates of Change
For the twelve-month period ending June 30, 2000, U.S. universities awarded 41,368
research doctorate degrees, compared with 41,060 for the previous year (see table 1). This was a
percentage increase from 1999 to 2000 of 0.8 percent. For the last 40 years, the increase in the
number of doctorates awarded by U.S. universities has averaged 3.8 percent per year.
Between 1961 when the number of annual doctorates awarded exceeded 10,000 for the
first time and 1967, the annual growth rate was almost 12 percent, and the number of
doctorates awarded virtually doubled (20,403). Only four years later, in 1971, the annual total
topped 30,000 (31,867) for the first time. The number of doctorate degrees annually awarded
during the decades of the 1970s and 1980s remained fairly stable at about 30,000 degrees
awarded each year. In 1986 a second period of growth began that continued through the early
1990s. The total figure did not exceed 40,000 until 1994 (41,034), 23 years after it had reached
the 30,000 mark. Over the past few years, the annual rates of increase have become smaller than
they were in the first half of the decade of the 1990s, including gains of only 0.3 percent for 1997
3 Doctorates are reported by academic year (from July 1 of one year through June 30 of the followingyear) and include research doctorates in all fields. Doctoral degrees such as the Ph.D., D.Sc., andresearch Ed.D. are covered by this survey; professional degrees (e.g., M.D., D.D.S., J.D., Psy.D.) are not.A full list of included degrees can be found in appendix E. For convenience throughout this report, theterms "Ph.D." or "doctorate" are used to represent any of the research doctoral degrees covered by thesurvey. Please note that if an individual earned a second research doctorate, the second doctorate is notincluded in the SED.
3
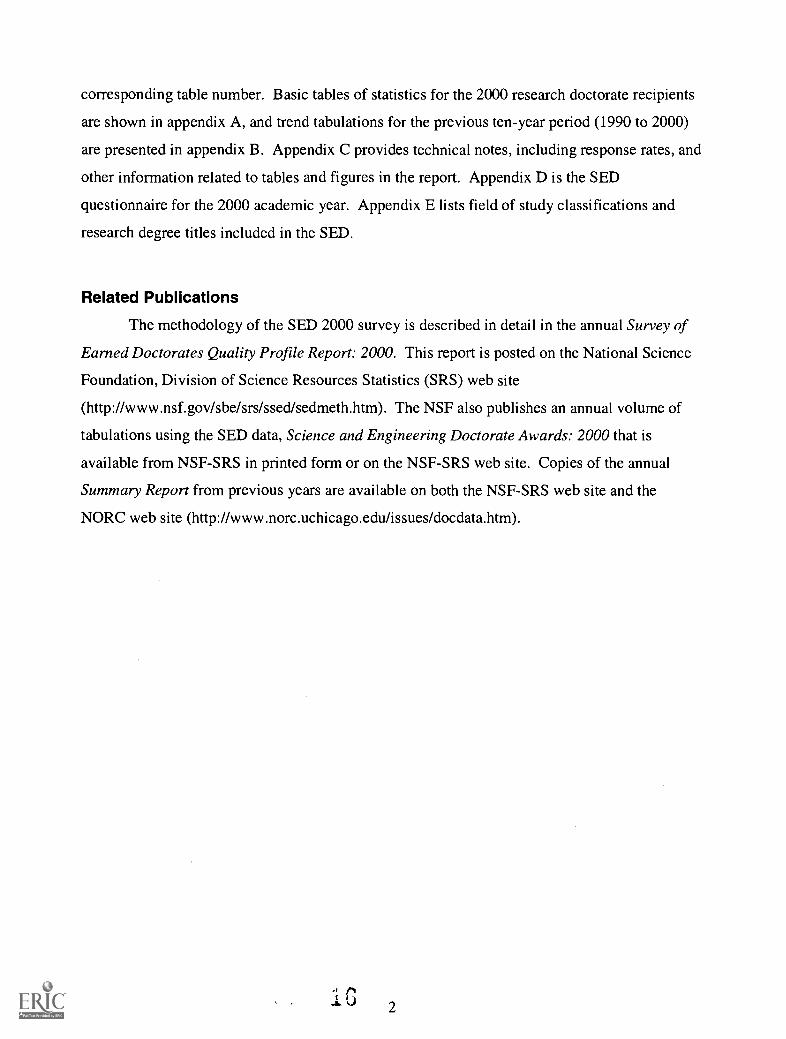
and 0.2 for 1998. The total number of doctorates declined in 1999 from the previous year for the
first time in fourteen years. The total rebounded somewhat in 2000, but was still at about the
level of 1994. (See figures 1 and 2.)
4 5,0 0 0
4 0,0 0 0
3 5,0 0 0
3 0,0 0 0
2 5,0 0 0
2 0,0 0 0
1 5,0 0 0
1 0,0 0 0
5.000
0
Figure 1. Doctorates awarded by U.S. colleges and universities, 1957-2000
1 9 5 7 1 9 6 0 1 9 6 3 1 9 6 6 1 9 6 9 1 9 7 2 1 9 7 5 1 9 7 8 1981 1 9 8 4 1 9 8 7 1 9 9 0 1 9 9 3 1 9 9 6 1 9 9 9
Year
20
1 5
10
5
0
Figure 2. Annual growth or decline in doctorates awarded by U.S. collegesand universities, 1957-2000
41.Annual percentage change0Long-term average (3.8%)
19
5
57 1960 1963 1966 1969 1972 75 19 8 1981 1984 1987 1990 1993 1996 99
Year
See Table 1.Source: NSF/NIH/USED/NEH/USDA/NASA, Survey of Earned Doctorates
4

Doctorate-granting Institutions, Doctorate Recipients per Institution,and Geographical Distribution
The SED closely monitors the universe of doctorate-granting institutions and makes a
strong effort to include all accredited institutions recognized by the U.S. Department of
Education. Newly-identified institutions granting one or more of the doctorates listed in
appendix E are contacted by the SED data collection contractor and included in the SED
universe as soon as they award a recognized research doctorate. The full list of institutions
granting doctorates in the 2000 academic year is included in appendix table A-7.
During the 2000 academic year, 406 universities in the United States and Puerto Rico
awarded at least one research doctorate. This number is the highest number of institutions ever
recorded in the SED, and reflects a trend of fairly steady increases in the number of doctorate-
granting institutions from the early 1960s (175 in 1962). (See table 2.)
The mean number of doctorates awarded per institution in 2000 was 102; the median was
40.5. (See table 2 for the mean and median numbers of doctorates awarded per institution from
1962 to 2000.) As the substantial difference between the mean and the median suggests, a
relatively small number of institutions grant a disproportionately large number of doctorates.
Just 48 institutions granted 50 percent of all doctoral degrees in 2000. Eighteen institutions
accounted for 25 percent of all doctorate degrees granted; the second quartile contained 30
institutions, the third quartile included 55 universities; and the remaining 303 institutions
together accounted for the final 25 percent of doctorates.4
The University of California-Berkeley granted the largest number of doctorates, 751, or
1.8 percent of all doctorates awarded, followed by the University of Wisconsin-Madison (728)
and the University of Minnesota-Twin Cities (684). The fourth largest was the University of
Texas-Austin (656), which was the largest U.S. doctorate-granting institution in 1999 with
almost 100 more graduates than it had in 2000. In 1999 and 2000, the top 10 institutions granted
15.6 percent of all doctorates. (See table 3.)
California universities led the nation by awarding 4,706 doctorates, or 11.4 percent of all
doctorates in 2000. New York institutions granted the next highest number of doctorates
(3,528), followed by institutions in Texas (2,545), Illinois (2,181), Massachusetts (2,104),
Calculations derived from appendix table A-7.
5 1 9

Pennsylvania (2,101), Florida (1,889), and Ohio (1,795). These eight states accounted for more
than half 56.8 percent of all doctorates awarded in 2000. (See figure 3 and table 4.)
5,000
4,500
4,000
3,500
3,000
2,500
2,000
1,500
1,000
500
Figure 3. Top 20 doctorate granting states, 2000
CA NY TX IL MA PA FL OH MI IN NC VA MD GA NJ WI MN CO AZ MOState
See Table 4.Source: NSFINIH/USED/NEH/USDNNASA, Survey of Earned Doctorates
Doctorates by Broad Field
The SED classifies research doctorate degrees into approximately 290 fields of
specialization (these are listed on pages 8 and 9 of the questionnaire included in appendix D).
Since fields of specialization are dynamic entities which reflect the evolving programs of
researchers and their constituencies, the SED list is reviewed each year to identify emerging
fields and periodically revised to accommodate changes in the world of doctoral education. The
SED is able to collect information on the specialization fields of virtually all the new doctorates
each year; coverage in 2000 was attained for all but 5 of the 41,368 doctorate recipients.
For presentation purposes here, the fields of specialization are grouped into seven broad
fields: physical sciences,5 engineering, life sciences,6 social sciences (including psychology),
5 The physical sciences also include mathematics and computer sciences.6 The life sciences encompass biological, agricultural, and medical sciences.
6
humanities, education, and a heterogeneous group of professional and other fields (including
business, communications, social work, and theological programs). The numbers of graduates in
all fields are included in appendix tables A-1, A-2, and B-1.
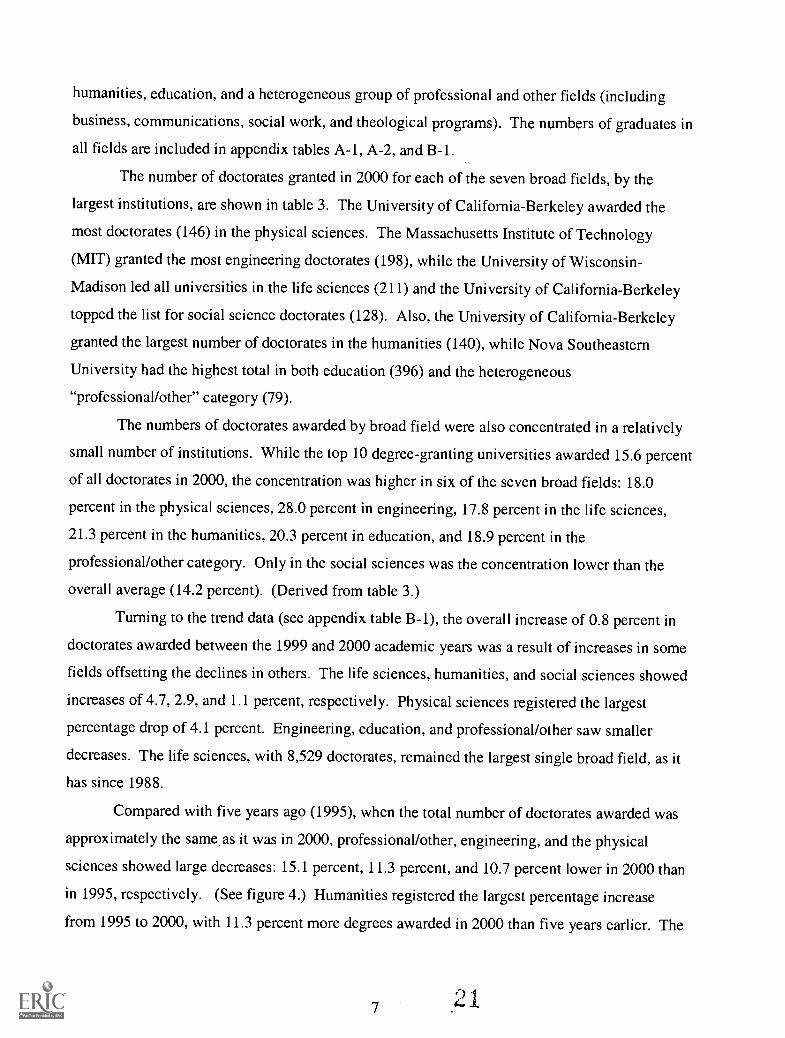
The number of doctorates granted in 2000 for each of the seven broad fields, by the
largest institutions, are shown in table 3. The University of California-Berkeley awarded the
most doctorates (146) in the physical sciences. The Massachusetts Institute of Technology
(MIT) granted the most engineering doctorates (198), while the University of Wisconsin-
Madison led all universities in the life sciences (211) and the University of California-Berkeley
topped the list for social science doctorates (128). Also, the University of California-Berkeley
granted the largest number of doctorates in the humanities (140), while Nova Southeastern
University had the highest total in both education (396) and the heterogeneous
"professional/other" category (79).
The numbers of doctorates awarded by broad field were also concentrated in a relatively
small number of institutions. While the top 10 degree-granting universities awarded 15.6 percent
of all doctorates in 2000, the concentration was higher in six of the seven broad fields: 18.0
percent in the physical sciences, 28.0 percent in engineering, 17.8 percent in the life sciences,
21.3 percent in the humanities, 20.3 percent in education, and 18.9 percent in the
professional/other category. Only in the social sciences was the concentration lower than the
overall average (14.2 percent). (Derived from table 3.)
Turning to the trend data (see appendix table B-1), the overall increase of 0.8 percent in
doctorates awarded between the 1999 and 2000 academic years was a result of increases in some
fields offsetting the declines in others. The life sciences, humanities, and social sciences showed
increases of 4.7, 2.9, and 1.1 percent, respectively. Physical sciences registered the largest
percentage drop of 4.1 percent. Engineering, education, and professional/other saw smaller
decreases. The life sciences, with 8,529 doctorates, remained the largest single broad field, as it
has since 1988.
Compared with five years ago (1995), when the total number of doctorates awarded was
approximately the same as it was in 2000, professional/other, engineering, and the physical
sciences showed large decreases: 15.1 percent, 11.3 percent, and 10.7 percent lower in 2000 than
in 1995, respectively. (See figure 4.) Humanities registered the largest percentage increase
from 1995 to 2000, with 11.3 percent more degrees awarded in 2000 than five years earlier. The
c)
7

life sciences (+7.7 percent) and social sciences (+7.2 percent) were also higher in 2000;
education was 3.4 percent lower. (See table 5 and figures 4 and 5.)
Figure 4. Science and engineering doctorates awarded by broad field, 1970-2000
9,000
8,000
7,000
.1 6,000
5,000
'64,000
2 3,000
2,000
1,000
0
1970
8,000
7,000
6,000
5,000
o 4,000
3,000
2,000 -
1,000
1975 1980 1985
Year1990 1995
Figure 5. Humanities, education, and professional/other fields doctorates awarded, 1970-2000
Sci/Math
4--Life Sciences44Social Sciences14 Engineering
2000
IFEducation
4Humanities
A-- Professional/otherfields
1970 1975 1980 1985 1990 1995 2000
Year
See Table 5.Source: NSF/NIH/USED/N EH/USDA/NASA, Survey of Earned Doctorates
8

The four broad fields that together constitute "science and engineering" (S&E) physical
sciences, life sciences, and social sciences, plus engineering represented 65.4 percent of all
doctorates awarded in 2000. Ten years ago (1990), they accounted for approximately the same
percentage of all doctorates (65.0 percent), but compared with 25 years ago (1975), the S&E
fields represent a larger percentage of total degrees in 2000 than in 1975 (57.5 percent). (See
table 5.) Less than half a percent change is seen in these combined S&E fields between 1999
and 2000 or between 1995 and 2000.
Of the 25 subfields included in table 5, 14 experienced declines in the number of
doctorates awarded between 1999 and 2000 (see appendix table B-1 for the 1999 totals).
Subfields in the education category, teacher education (11.0 percent) and teaching fields
(7.1 percent), saw larger declines, while smaller declines were seen in the physical sciences. The
largest gains were within the S&E category, in the subfields of sociology (+13.3 percent) and
health sciences (+12.7 percent) between the 1999 and 2000 academic years. Comparing 1995
with 2000, 11 of the 25 subfields had larger absolute numbers of doctorates in 2000, and 14 had
smaller numbers; within S&E fields in these same two years, 7 subfields had larger totals in 2000
than in 1995, and 8 had smaller ones. For both the one-year and five-year comparisons within
S&E, the physical sciences and engineering categories displayed the largest declines, while the
life sciences and social sciences showed the biggest gains. (See figure 6.)
25%
20%
15%
10%
5%
0%Physical Sciences
/Math
Figure 6. Distribution of doctorate recipients by broad field, 1970 and 2000
Engineering Lila Sciences Social Sciences Humanities
See Table 5.Source: NSF/NIH/USED/NEH/USDA/NASA, Survey of Earned Doctorates
9 s 4.1'3
Education ProlessionagOther Fields

Doctorates by Sex
The aggregate increase in doctorates between 1999 and 2000 0.8 percent reflects a 1.0
percent decline for males and a 1.3 percent increase for females. The numbers of doctorates
awarded to men in 2000 fell by 245, while 657 more women received doctorates in 2000 than in
1999. The net effect is that for 2000, females received 43.8 percent of all doctorates, up from
42.5 percent in 1999, which had been the highest percentage ever for women.' This marks the
fifth consecutive year in which the representation of female doctorate recipients has exceeded 40
percent. Five years ago (1995), females constituted 39.3 percent of all doctorate recipients; 10
years ago (1990), that percentage was 36.3 and 25 years ago (1975), it was 21.9 percent. (See
figure 7 and table 7.)
30,000
25,000
20,000
15,000
10,000
5,000
0
Figure 7. Doctorate recipients by sex, 1990-2000
1990 1992 1994 1996 1998 2000
Year
See Appendix Tables B-2b and B-2c.Source: NSF/NIH/USED/NEH/USDA/NASA, Survey of Earned Doctorates
Female0 Male
With respect to the distribution of doctorates by sex across broad fields of study, women
constituted 64.9 percent of all education doctorates for 2000, the majority in the social sciences
7 For 2000, sex could not be determined for 74 doctorate recipients; these 74 are not part of these andother percentage calculations. In 1999, the corresponding number of cases of undetermined sex was 187.

(54.6 percent), and half in the humanities (50.3 percent). By contrast, the representation of
females among doctorate recipients in the physical sciences and engineering for 2000 was only
24.2 percent and 15.8 percent, respectively (figure 8). However, even these still-low percentages
have shown remarkable change over time: 25 years ago, when females were only 21.9 percent of
all doctorate recipients, they constituted just 8.3 percent and 1.7 percent in the physical sciences
and engineering, respectively. Similar long-term trends are discernible in other broad fields as
well: in the life sciences, from 19.8 percent in 1975 to 46.9 percent in 2000; 25.1 percent to 54.6
percent in the social sciences over that same period; and from 33.4 percent in the humanities in
1975 to the current 50.3 percent. (See figure 8 and table 7.)
70%
60%
Figure 8. Percent of female doctorate recipients, by broad field, 1970, 1980, 1990, 2000
50% -
40%
30%
20%
10%
0% JTAll Fields Physical
SciencesEnginee ing Life Sciences Social Humanities Education Prof/Other
Sciences
See Table 7.Source: NSF/NIH/USED/NEH/USDA/NASA, Survey of Earned Doctorates
1970
O 1980
0 19900 2000
In 2000, females represented 37.7 percent of S&E doctorate recipients and 55.5 percent
of degrees in non-S&E fields. With respect to finer field distinctions, of the 25 selected subfields
listed in table 6, women were the majority of doctorate recipients in seven fields and constituted
at least 40 percent of the doctorate population in five more areas. In 10 of the 25 fields, the
percentage increase in female doctorate recipients between 1990 and 2000 was over 40 percent.
11

Doctorates by Race/Ethnicity
While the total number of doctorates rose between 1999 and 2000 by 0.8 percent, the
aggregate number of minority doctorate recipients increased by 2.5 percent for U.S. citizens.
Within minority race/ethnic categories, Asians and blacks showed the largest percentage gains,
6.4 percent and 3.9 percent, respectively; the corresponding figure for Hispanics was 0.5 percent.
American Indians were the only minority group to register a decrease in the number of
doctorates from 1999 to 2000, falling from 217 to 169. By comparison, the number of white
doctorate recipients remained almost unchanged. (See appendix table B-2a.)
A total of 4,389 doctorates were awarded to members of U.S. racial/ethnic minority
groups in 2000. This figure is, as noted above, 2.5 percent higher than one year earlier; it is also
25.1 percent higher than the total five years earlier (1995) and nearly double the number for 1990
(86.0 percent higher). The figures in the first panel of table 8 generally indicate that doctorates
awarded to U.S. minority groups increased much more in the 1990's than the 1980's. The
twenty-year gains were greater for Asians (207 percent), Hispanics (177 percent), and American
Indians (125 percent) than for blacks (61 percent). (See figures 9 and 10 and table 8.)
Figure 9: Doctorates awarded to minority U.S. citizens, by race/ethnicity,
1980-2000
1,800
1,600
1,400
1,200
1,000
800
600
400
2000
1980 1985 1990
Year
1995
See Table 8.Source: NSF/N1H/USED/NEH/USDAINIASA, Survey of Earned Doctorates
12
aBlack0Asian
A.1 Hispanic0American Indian
2000
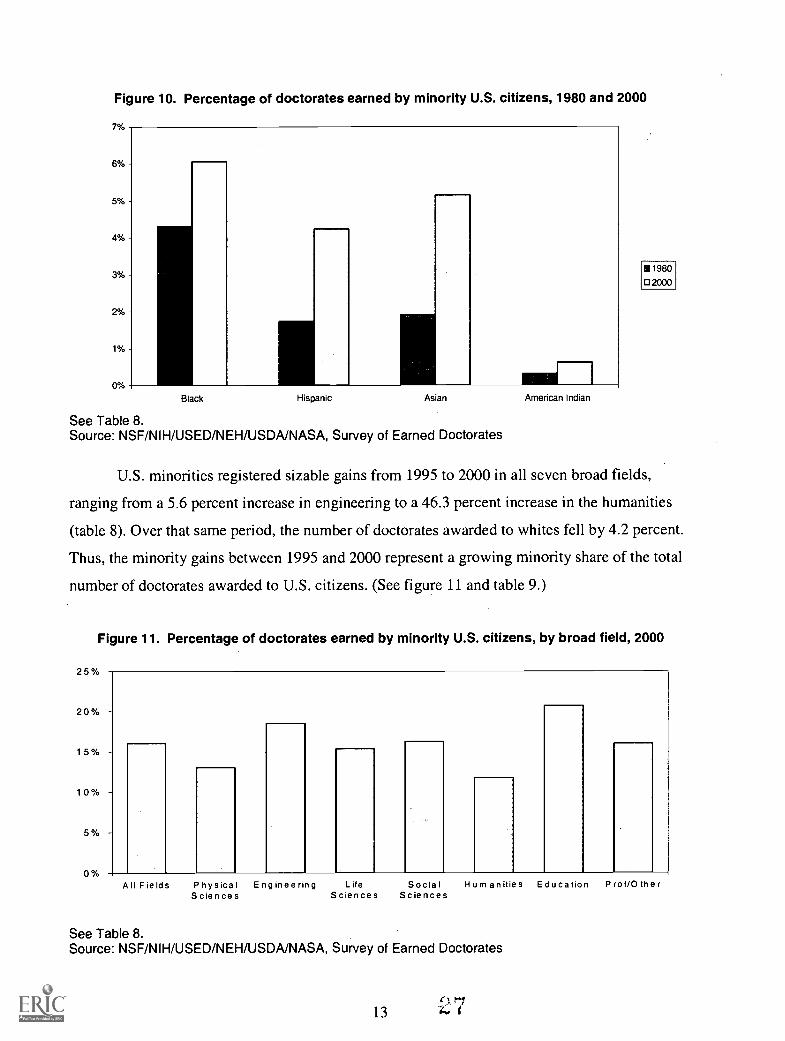
Figure 10. Percentage of doctorates earned by minority U.S. citizens, 1980 and 2000
Black Hispanic Asian American Indian
See Table 8.Source: NSF/NIH/USED/NEH/USDA/NASA, Survey of Earned Doctorates
1980
02000
U.S. minorities registered sizable gains from 1995 to 2000 in all seven broad fields,
ranging from a 5.6 percent increase in engineering to a 46.3 percent increase in the humanities
(table 8). Over that same period, the number of doctorates awarded to whites fell by 4.2 percent.
Thus, the minority gains between 1995 and 2000 represent a growing minority share of the total
number of doctorates awarded to U.S. citizens. (See figure 11 and table 9.)
Figure 11. Percentage of doctorates earned by minority U.S. citizens, by broad field, 2000
2 5%
2 0% -
1 5% -
1 0% -
5% -
0%All Fields Physical Engineering Life
Sciences SciencesSocial Hum anities Education P of/0 !her
Sciences
See Table 8.Source: NSF/NIH/USED/NEH/USDA/NASA, Survey of Earned Doctorates
13

Within racial/ethnic groupings, the trends for the broad fields shown in table 8 indicate
that the overall pattern for minorities generally holds for the separate minority groups within the
seven broad fields. One exception is that the number of Asian doctorate recipients in engineering
grew rapidly from 1980 to 1995, but leveled off from 1995 to 2000. The general pattern,
however, was one of relatively small increases from 1980 to 1990 followed by large increases
from 1990 to 2000. (See table 8.)
The balance of male and female doctorate recipients differs between racial/ethnic groups.
Among U.S. citizens, of doctorates earned by whites, 48.4 percent were awarded to women; for
blacks, various Hispanic groups, and American Indians, women were in the majority, earning
between 51.0 percent and 65.7 percent of doctorates received by persons of those races or
ethnicities. Among Asian Americans, women were 45.9 percent of the total. (See figure 12 and
appendix table A-4.)
70%
60%
50%
40%
30%
20%
10%
0%
Figure 12. Percentage of doctorates earned by minority U.S. citizens, by sex, 2000
Black Hispanic Asian
See Appendix Tables B-2b and B-2c.Source: NSF/NIH/USED/NEH/USDA/NASA, Survey of Earned Doctorates
American Indian
0 Male
IS Female
Table 10 lists the universities that awarded the largest number of doctorates to members
in each of the four minority groups between 1996 and 2000, and the absolute number granted.
Over that interval, three California institutions Berkeley, UCLA, and Stanford and two in
14

Massachusetts Harvard and MIT awarded more than 1,000 doctorates (1,126) to Asian
Americans, or 17.9 percent of all doctorates awarded by U.S. universities to Asian Americans.
Nova Southeastern University and Howard University awarded, by far, the most doctorates to
blacks (287 and 241, respectively), 7.1 percent of all the doctorates granted to this racial
category. In general, the leading institutions awarding doctorates to Hispanics lie in the
Southwest, including California, and in Puerto Rico. Lastly, Oklahoma State University and the
University of Oklahoma grant the largest number of doctorates to American Indians.
The concentration of U.S. minority doctorate recipients among institutions is
considerably greater than for the doctoral population as a whole. In 2000, for example, the
leading 10 universities granted 15.6 percent of all doctorates. But over the 1996-2000 period, the
10 universities awarding the most degrees to minority students in each of the four groupings
accounted for nearly 20 percent of those totals. The top 10 institutions that awarded doctorates
to Asians in table 10 granted 27.5 percent of all Asian doctorates between 1996 and 2000; for
blacks the corresponding figure is 19.7 percent; for Hispanics it was 23.1 percent, and for
American Indians it was 19.6 percent. (See table 10.)
Doctorates by Citizenship
The SED collects information on the citizenship status and country of citizenship of the
new doctorate recipients each year. 8 Of the 2000 doctorate recipients with known citizenship
status (96.5 percent of the total), 70.6 percent were U.S. citizens, 5.0 percent were non-U.S.
citizens permanent residents with visas for the United States, and 24.4 percent were non-U.S.
citizens in the U.S. on temporary visas. (See table 11.)
With regard to broad field of study, of the doctoral population with known citizenship
status, U.S. citizens earned more than 80 percent of the doctorates awarded in the social sciences,
humanities, and education (80.8 percent, 81.7 percent, and 89.3 percent, respectively) in 2000.
(See table 11.) In absolute numbers, U.S. citizens earned more doctorates in education than in
'Citizenship status (U.S. versus non-U.S.) and country of citizenship are variables with somewhat higherthan average non-response in the SED, and the figures presented in this section are therefore less certainthan others in the report. The percentage of cases with missing data on these variables has also fluctuatedmore year to year than other SED variables, and the over-time comparisons are thus also subject to someuncertainty. For example, in 1995 citizenship status was unknown for 2.1 percent of recipients, but thisnumber was 3.8 percent in 1990 and 1.8 percent in 1975.
15
any of the other broad fields; permanent residents had their highest total in the life sciences, and
for those in the United States on temporary visas, engineering was the most popular field.
The convergence of male and female representation in the doctoral cohorts is particularly
striking for U.S. citizens. In 2000, 49.4 percent of all doctorates awarded to U.S. citizens went to
women, up from 47.9 percent in 1999 and continuing a long-term trend of U.S. women
approaching parity with their male counterparts. For example, in 1990, among U.S. citizens,
women earned 43.1 percent of all doctorates. In the 1990s while the number of doctorates going
to U.S. males was relatively level, the number earned by U.S. women increased every year
except 1999. (See appendix tables A-4 and B-2.)
Among permanent residents earning doctorates in 2000, 41.6 percent were female, and
among those doctorate recipients holding temporary visas, only 29.1 percent were female
(appendix table A-4). Women holding temporary visas are more concentrated in the S&E fields
of study than women who are U.S. citizens. While women with temporary visas represented
15.5 percent of all female doctorates in 2000, they earned 30.1 percent of the doctorates granted
to females in the physical sciences, 36.0 percent of the female-earned doctorates in engineering,
and 21.0 percent of the doctorates earned by females in the life sciences (appendix table A-3c).
Citizens of the People's Republic of China (PRC) 9 earned 2,594 doctorates in 2000, or
6.3 percent of the total 41,368 degrees awarded. (See table 12 for a listing of the top 30 countries
of origin of non-U.S. citizen doctorate recipients.) The top 15 countries in terms of the number
of doctorates awarded to its citizens in 1999 remained the same for 2000, although Korea moved
from third to second on the list, changing places with India, and a few other nations changed
modestly in the rankings as well. The leading five countries accounted for 14.7 percent of all
doctorates awarded by U.S. universities in 2000. Only 5.3 percent of the total doctoral
population are citizens of next 10 nations listed in table 12, and only 3.1 percent are citizens of
the next 15 nations. Doctoral students who are citizens of one of the 30 nations shown in the
table thus account for 23.1 percent of the 41,368 doctorates awarded in 2000.
Table 13 lists the institutions awarding the largest numbers of doctorates to non-U.S.
citizens in 2000; table 14 provides a complernentary ranking those institutions awarding the
largest percentage of doctorates relative to the total number of Ph.D.s they granted.
9 Includes Hong Kong beginning with the 2000 SED cycle.
u16

Doctorates by Parental Education Background
Since 1963, the SED has asked new doctorate recipients to report their fathers' and
mothers' levels of educational attainment. For purposes here, the responses are grouped into
three categories: high school diploma or less; some college, including earning the baccalaureate;
and advanced degree, including the master's, doctorate, or a professional degree. While only the
data for 2000 are described here, analysis of the historical record would be a useful subject for
further research on the social origins of the doctorate population.
The 2000 data (see table 15) show that 30.9 percent of recipients' fathers had only earned
a high school diploma or less; the corresponding figure for their mothers was 40.2 percent.
Slightly over one-third (35.0 percent) of doctorate recipients had a father who had gone to
college (but may not have earned a baccalaureate degree); 39.2 percent of the mothers of
doctorate recipients in 2000 had some college background. Finally, for 34.1 percent of the
doctorate recipients, the father held an advanced degree, compared with 20.6 percent whose
mothers had an advanced degree.
Although similar in general, parental education backgrounds of male and female 2000
doctorate recipients differed with respect to mothers' education. Female doctorate recipients
were more likely than their male counterparts to have a mother who attended college or who
earned an advanced degree.
There is considerable variation in parental education attainment by race/ethnicity,
citizenship status, and broad field of study. Compared with other racial/ethnic categories, Asian
American doctorate recipients were more likely to come from families in which both the father
and mother had advanced degrees; black, Hispanic and American Indian recipients' parents were
the least likely to have gone beyond high school. U.S. citizen doctorate recipients were more
likely than those with either permanent residency status or holding temporary visas to have
parents with advanced degrees (and less likely than these two groups to have parents whose
formal education did not extend beyond the high school level).
The distributions of parental education by the broad fields in table 15 reflect, in part, the
different race/ethnic and citizenship compositions of the fields. Doctorate recipients in the
humanities displayed the highest percentages of both fathers (42.2 percent) and mothers (25.3
percent) with advanced degrees. Education doctorate recipients had the lowest percentages of
advanced degrees by fathers or mothers, 20.7 percent and 12.0 percent, respectively. These two
17

broad fields are also the least and most represented, respectively, with regard to the fraction of
parents whose formal education stopped at high school or before.
Time to Degree
The amount of time needed to complete a doctorate is a key concern not only for those
pursuing the degree, but also for the faculties and administrations of the degree-granting
institutions, as well as national public agencies and private organizations that support doctoral
study. Time to degree is likely to be affected by individual preferences and economic
constraints, as well as by the labor markets and cultures of the academic disciplines and
institution-specific program characteristics.
The SED measures time to degree in three ways: (1) the total time elapsed from
completion of the baccalaureate to completion of the doctorate, (2) the total time elapsed while
actually registered in graduate school to completion of the doctorate, and (3) the simple age of
the doctorate recipients at the time the doctorate is awarded. In this section, the 2000 data and
the historical trends for each of these measures is reviewed for the whole population of doctorate
recipients and, separately, by broad field and the background variables of sex, race/ethnicity, and
citizenship.
The median total time span from baccalaureate to doctorate for the 2000 doctorate
recipients was 10.3 years (table 16), nearly the same as in 1999. The total time span was shortest
in the physical sciences (8.0 years) and longest in education (19.4 years). The latter broad field
includes large numbers of individuals who have worked full-time before starting their graduate
degree programs, and who even continue to work full-time while earning their doctorates.
The historical data in table 16 show that the 2000 median total time to degree was about 6
months shorter than in 1995. The long-term trend has been one of increases in length from 1975
to 1995 (see figure 13 and table 16). The broad fields of engineering, physical sciences, life
sciences, social sciences, humanities, and education follow this overall pattern toward shorter
times; but median time to degree for the professional/other fields increased from 1995 to 2000.
18
40
35
30
25
20
15
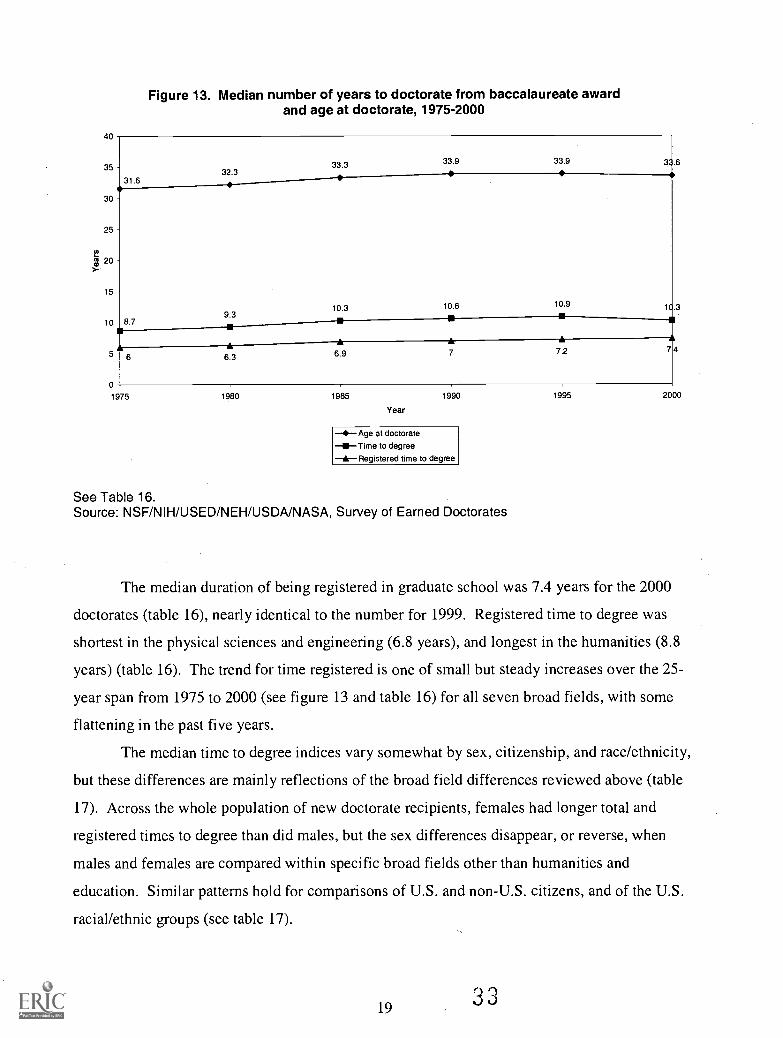
Figure 13. Median number of years to doctorate from baccalaureate awardand age at doctorate, 1975-2000
32.331.6
10 8.7
0
1975
33.3 33.9 33.9
10.39.3
6.3 6.9
1980 1985
10.6
7
10.9
7.2
.6
1C 3
7 4
Year
1990
40Age at doctorateETime to degreeaRegistered time to degree
See Table 16.Source: NSF/NIH/USED/NEH/USDNNASA, Survey of Earned Doctorates
1995 2000
The median duration of being registered in graduate school was 7.4 years for the 2000
doctorates (table 16), nearly identical to the number for 1999. Registered time to degree was
shortest in the physical sciences and engineering (6.8 years), and longest in the humanities (8.8
years) (table 16). The trend for time registered is one of small but steady increases over the 25-
year span from 1975 to 2000 (see figure 13 and table 16) for all seven broad fields, with some
flattening in the past five years.
The median time to degree indices vary somewhat by sex, citizenship, and race/ethnicity,
but these differences are mainly reflections of the broad field differences reviewed above (table
17). Across the whole population of new doctorate recipients, females had longer total and
registered times to degree than did males, but the sex differences disappear, or reverse, when
males and females are compared within specific broad fields other than humanities and
education. Similar patterns hold for comparisons of U.S. and non-U.S. citizens, and of the U.S.
racial/ethnic groups (see table 17).
19

The third measure of time to degree compiled in the SED is age at doctorate. The median
ages of the 2000 doctorate recipients are tabulated in appendix tables A-3 by major field of
degree and A-4 by citizenship and race/ethnicity. Overall, the median age at receipt of the
doctorate in 2000 was 33.6 years. Again, age at degree varies with field of study. Doctorate
recipients in the S&E fields typically earn their degrees in their early 30s; the median for all
2000 doctorate recipients in the S&E fields was 31.9 years old. In contrast, age at doctorate was
34.8 years in the humanities, 44.4 years in education, and 37.8 years in the professional/other
fields category. (See appendix table A-3a and table 18). The modal age spans evident in figure
14 and table 18 reflect this ordering.
70%
Figure 14. Age distribution at doctorate by broad field of study, 2000
60%
50%
40%
30%
20%
10%
0%
All Fields PhysicalSciences
Engineering Life Sciences Social Sciences Humanities Education Prof/Other
See Table 18.Source: NSF/NIH/USED/NEH/USDA/NASA, Survey of Earned Doctorates
3 120
21-30
0 31-40
0 41 and over
Financial Resources in Support of Doctorate Recipients,Including Indebtedness
The SED asks two questions that, taken together, provide information on the financial
sources of support utilized by the new doctorate recipients (for the exact formats and wordings,
see the copy of the questionnaire in Appendix D). The first question is a checklist of 13 different
potential sources of support, such as fellowships and scholarships, dissertation grants, teaching
and research assistantships, and various personal arrangements. The second question asks which
of the checked sources was the primary source of support and which was the second most
important. For purposes here, respondents are grouped in terms of their primary sources of
support. The 13 sources are combined into the seven categories that form the rows in table 19.
Three in five 61.1 percent of the 2000 doctorate recipients received the majority of
their support for doctoral study from program- or institution-based sources, such as teaching
assistantships, research assistantships/traineeships, and fellowships/dissertation grants.1° About
one third (32.2 percent) of all 2000 doctorate recipients reported that their own resources (which
include funds from loans, one's spouse, savings, and non-academic employment) were the
primary sources they used to finance their doctoral studies. Foreign government, employer
contributions, and "other" sources accounted for the remaining 6.6 percent of the cases. (See
figure 15 and table 19.)
10 The Federal government and other governments can be the original source of these funds.
2137)

80%
70%
60%
50%
40%
30%
20%
10%
0%
Figure 15. Primary sources of financial support for doctorate recipients, 2000
All Fields Physical Engineer ng Life Social Humanities Education Prof/Other
Sciences Sciences Sciences
See Table 19.Source: NSF/NIH/USED/NEH/USDA/NASA, Survey of Earned Doctorates
Teaching
o Research
o Fellow ship
o Ow n
0 Other
Overall, women were more dependent upon personal resources than were men (40.5
percent versus 25.7 percent). The same was true for U.S. citizens (40.4 percent) compared to
foreign citizens on permanent or temporary visas (22.7 percent and 10.2 percent, respectively).
However, sources of support vary considerably by field of study. For example, within the
physical sciences, a much higher than average percentage of new doctorate recipients reported
program- or institution-based programs as primary sources of support (86.0 percent).
In engineering, 77.5 percent of the research doctorate recipients in 2000 listed
teaching/research assistantships or fellowships as their principal form of support, as did 76.0
percent of those in the life sciences. In contrast, only 58.4 percent of doctorate recipients in the
humanities, 52.9 percent of those in the social sciences, and 20.0 percent of those in education
reported these categories as the primary sources of financial support for their doctoral program.
The gender differences and contrasts between U.S. and non-U.S. citizens reflect these
differences among the broad fields. Nonetheless, in all the broad fields of study except
engineering and humanities, new women doctorates were more likely to depend on their own
resources than new men doctorates (table 19). Similarly, non-U.S. citizens tend to be more
concentrated in fields where the majority of doctoral students receive institution- and/or
22

program-based support. Reflecting this concentration, non-U.S. citizens reported lower
percentages of reliance on their own resources than did U.S. citizens. The differences were
much smaller within the broad fields of study than overall, but U.S. citizens were still more
likely to rely on their own resources than non-U.S. citizens (table 19).
Differences in the various modes of financial support are also apparent with regard to
race/ethnicity. Black doctorate recipients indicated the greatest reliance on their own resources
to finance their doctoral program (47.0 percent), followed by American Indians (44.7 percent),
whites (40.4 percent), Hispanics (39.6 percent), and Asians (20.7 percent). Within most of the
broad fields of study, the race/ethnicity differences in reliance on own resources diminish. Some
large race/ethnic differences within fields are found, however, in terms of use of the different
types of program- and institution-based supports. In the physical sciences and engineering,
Asians and whites were more likely than blacks and Hispanics to rely on teaching and research
assistantships and less likely to have fellowships or dissertation grants as their primary source of
support.
The SED also asks the new doctorate recipients to indicate the amount of money they
owe that is directly tied to their undergraduate or graduate education. This is defined as debt
related to tuition and fees, living expenses and supplies, and transportation to and from school.
The response categories begin with "none" and proceed upward in $5,000 increments, with
"$30,001 or more" at the top. " A total of 37,513 (91 percent) graduates responded to the
question.
Almost half (49.3 percent) of the respondents in 2000 reported having no education-
related debt, and another 22.6 percent reported cumulative debt of $15,000 or less (table 20).
However, a distinct bulge at the high end of the debt distribution is also evident, with 15.1
percent of all new doctorate recipients reporting debt over $30,000.
Looking at the debt distributions within each of the seven broad fields, graduates in the
physical sciences, engineering, education, and the life sciences are most likely to complete the
doctorate with no education-related debt (table 20). Social scientists and humanities graduates
are more likely to have debt. Debt levels in excess of $30,000 or more are most common among
" See the special section on indebtedness in the Sununary Report 1998 for more detail on debt levels andfinancial support for doctoral education. The report is available on the NORC web site
, (http://www.norc.uchicago.edu/issues/docdata.htm).
23
social scientists (27.2 percent), graduates in the professional/other fields areas (18.5 percent), and
the humanities (17.9 percent).
The pattern of debt levels for the main demographic groups are shown in table 21.
Particularly noteworthy in these tabulations is the much higher incidence of blacks, Hispanics,
and American Indians incurring high levels of education-related debt. Three in ten (30.0
percent) of black doctorate recipients, 23.5 percent of American Indians, and 23.2 percent of
Hispanics owed more than $30,000; these figures compare to 11.1 percent of Asians and 16.6
percent of whites owing that much. At the other extreme, Asians and whites are much more
likely than the other groups to have no education-related debt upon completion of the doctorate.
Slight differences are observed in the debt level pattern between the sexes. New female
doctorates were more likely to have some debt than their male counterparts (51.9 percent vs.
49.8 percent). Among new doctorates, U.S. citizens were more likely to incur higher education
related debt than graduates with permanent or temporary visas (57.7 percent, vs. 34.9 percent,
and 33.3 percent, respectively).
24

Postgraduate Plans, Employment, and Location
The SED questionnaire includes a number of questions about the graduates' immediate
plans for work or further study.12 The responses provide a useful overview of the numbers
planning to enter academic positions, government and industry, and postdoctoral programs of
research and further study. Information is also collected on the main types of work activities
research, teaching, administration, and professional services to individuals that the graduates
anticipate in their new positions.
Three aspects of postgraduation plans are examined in this report. The first is whether
the new doctorate recipient has a definite commitment for employment or a postdoctoral
position. These data are examined by broad field of study, sex, citizenship, and race/ethnicity
(tables 22 and 23). The second aspect is the distribution of graduates with definite commitments
for career employment versus postdoctorate research and study programs. This distribution is
also examined separately by broad field of study, sex, citizenship, and race/ethnicity (tables 24
and 25), as well as by visa status and anticipated location (foreign versus U.S.) for non-U.S.
citizens (tables 26 and 27). The third aspect is the distribution of graduates across employment
sectors, broken down by sex, race/ethnicity, and citizenship status (table 28).
Definite versus Indefinite Plans
Seven in ten (71.1 percent) of all doctorate recipients in 2000 reported having definite
commitments for employment or postdoctoral study or research. This rate is consistent with
those for recent years, but somewhat lower than the rates in the 1980s (table 22). With the
notable exception of the humanities, the percentages with definite commitments in 2000 vary
little by broad field. In the humanities, only 61.5 percent have a definite commitment.
The percentages with definite commitments also differed little among demographic
groups (table 23). About three percent fewer women than men (69.4 versus 72.5 percent) had
definite plans. U.S. citizens were more likely to have definite commitments (72.9 percent) than
12 The items in the postgraduation plans section of the questionnaire are not classified as "critical items"which become the focus of missing data follow-ups. Thus, the response rates to the postgraduation plansitems mirror the returns of the actual questionnaire, minus a low rate of item nonresponse. For the 2000SED cycle, the overall response rate for the first item, asking whether the respondent has definite plansfor either career employment or study, was 90.8 percent.
3 9 25
individuals with permanent (62.1 percent) or temporary visas (67.7 percent). Among U.S.
citizens and permanent residents, whites, American Indians, and Hispanics were more likely to
have definite plans than blacks and Asians.
Career Employment versus Postdoctorates
Among the doctoral recipients reporting definite plans, the majority (71.3 percent)
indicated that they plan to enter career employment as opposed to pursuing further study within a
postdoctoral research or teaching program (table 24). Postdoctorate study was more common
among graduates in the life sciences (60.5 percent) and the physical sciences (45.3 percent) than
in the other broad fields. Although percentages of new doctorate recipients entering
postdoctorate study programs has increased in all of the broad fields since 1980, decreases are
evident between 1995 and 2000 (table 24) in the life sciences, the physical sciences, and
engineering.
Differences among demographic subgroups are shown in table 25. Men were slightly
more likely than women to have definite plans for postdoctorate study (30.4 versus 26.4 percent).
Students with temporary visas were more likely than permanent residents and U.S. citizens to
pursue postdoctorate studies (the student visa allows the student to remain in the U.S. for two
years of additional training after completing the doctorate). Among U.S. citizens and permanent
residents, Asian doctorate recipients were more likely than other race/ethnicity subgroups to plan
postdoctorates followed by Hispanic and white recipients, respectively. Black and American
Indian doctorate recipients were least likely to report postdoctorates. These differences among
citizenship and race/ethnicity subgroups reflect the greater number of postdoctorates in the
physical and life sciences, and the greater concentrations of non-U.S. citizens and Asian
American students in those fields.
Postdoctoral Location of Non-U.S. Citizens
As the number of international students earning research doctorates in the United States
has steadily increased over the past two decades, so has the tendency for those students to remain
in the United States following graduation. Table 26 shows that, among non-U.S. citizens with
definite plans for work or study, 92.2 percent of all new doctorate recipients holding permanent
visas and 69.9 percent of temporary visa holders indicated that they will remain in the United
4 0 26
States following graduation. The fields with the highest concentrations of new doctorate
recipients with temporary visas staying in the United States were chemistry (85.7 percent),
biology (85.4 percent), and computer science (84.6 percent); and the lowest concentrations were
found in the fields of education (27.9 percent), humanities (48.7 percent) and social sciences
(56.2 percent) (table 26). A similar pattern is observed among new doctorate recipients with
permanent visa status staying in the United States. The fields with the highest concentrations of
new doctorate recipients with permanent visas staying in the United States were mathematics
(100 percent), biology (96.8 percent), and chemistry (96.2 percent) (table 26).
The trend shown in table 27 is one of increasing numbers and percentages of new
doctorate recipients with temporary visas planning to stay in the United States after receiving
their doctorate. In 1980, 39.4 percent of those with temporary visas had firm commitments to
positions in the United States. A decade later, 53.9 percent of them had firm commitments to
stay in the United States; in 2000, that number had further grown to 69.9 percent.
Employment Sectors in the United States
Higher education remains the most common destination of the 2000 doctorates with
definite commitments within the United States, identified by half (51.8 percent) of the 2000
respondent subpopulation (see table 28). The next largest group, 21.1 percent, had commitments
to industry or some form of self-employment, and 8.4 percent planned to work for Federal, state,
or local government. The historical trends show reductions in academic and in government
employment, coupled with an increase in the industry/self-employment sector.
Among 2000 female doctorates, one in seven (14.5 percent) had commitments to industry
or some form of self-employment, in comparison to one in four (27.5 percent) among their male
counterparts. With regard to U.S. racial/ethnic groups, Asians were less likely than others to go
immediately into higher education and were more likely than all others to go into industry or
self-employment. Industry or self-employment was also the main destination of non-U.S.
citizens with definite plans to remain in the United States after graduation.
27 41

DATA TABLES
2000 SURVEY OF EARNED DOCTORATES
29

Table 1. Number of doctorates awarded and annual percentage change in doctoratesawarded by U.S. colleges and universities, 1957-2000
Year Number ofPh.D.s
PercentChange' Year Number of
Ph.D.sPercentChange"
1957 8,611 1.1 1979 31,239 1.2
1958 8,773 1.9 1980 31,020 -0.71959 9,213 5.0 1981 31,356 1.1
1960 9,733 5.6 1982 31,111 -0.81961 10,413 7.0 1983 31,281 0.51962 11,500 10.4 1984 31,337 0.21963 12,728 10.7 1985 31,297 -0.1
1964 14,325 12.5 1986 31,902 1.9
1965 16,340 14.1 1987 32,370 1.5
1966 17,949 9.8 1988 33,500 3.51967 20,403 13.7 1989 34,327 2.51968 22,937 12.4 1990 36,067 5.1
1969 25,743 12.2 1991 37,534 4.1
1970 29,498 14.6 1992 38,890 3.61971 31,867 8.0 1993 39,800 2.31972 33,041 3.7 1994 41,034 3.1
1973 33,755 2.2 1995 41,742 1.7
1974 33,047 -2.1 1996 42,413 1.6
1975 32,952 -0.3 1997 42,545 0.31976 32,946 0.0 1998 42,634 0.21977 31,716 -3.7 1999 41,060 -3.71978 30,875 -2.7 2000 41,368 0.8
a From previous year.
Source: NSF/NIH/USED/NEH/USDA/NASA, Survey of Earned Doctorates
31
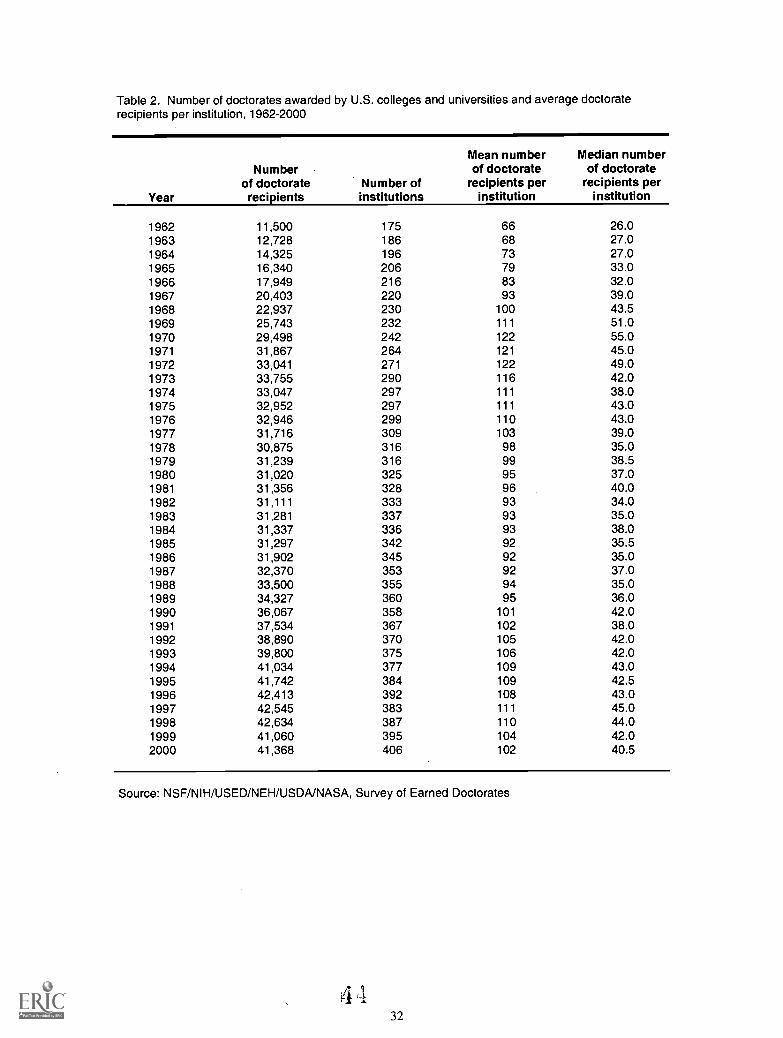
Table 2. Number of doctorates awarded by U.S. colleges and universities and average doctoraterecipients per institution, 1962-2000
Year
Numberof doctoraterecipients
Number ofinstitutions
Mean numberof doctorate
recipients perinstitution
Median numberof doctorate
recipients perinstitution
1962 11,500 175 66 26.01963 12,728 186 68 27.01964 14,325 196 73 27.01965 16,340 206 79 33.01966 17,949 216 83 32.01967 20,403 220 93 39.01968 22,937 230 100 43.51969 25,743 232 111 51.01970 29,498 242 122 55.01971 31,867 264 121 45.01972 33,041 271 122 49.01973 33,755 290 116 42.01974 33,047 297 111 38.01975 32,952 297 111 43.01976 32,946 299 110 43.01977 31,716 309 103 39.01978 30,875 316 98 35.01979 31,239 316 99 38.51980 31,020 325 95 37.01981 31,356 328 96 40.01982 31,111 333 93 34.01983 31,281 337 93 35.01984 31,337 336 93 38.01985 31,297 342 92 35.51986 31,902 345 92 35.01987 32,370 353 92 37.01988 33,500 355 94 35.01989 34,327 360 95 36.01990 36,067 358 101 42.01991 37,534 367 102 38.01992 38,890 370 105 42.01993 39,800 375 106 42.01994 41,034 377 109 43.01995 41,742 384 109 42.51996 42,413 392 108 43.01997 42,545 383 111 45.01998 42,634 387 110 44.01999 41,060 395 104 42.02000 41,368 406 102 40.5
Source: NSF/NIH/USED/NEH/USDA/NASA, Survey of Earned Doctorates
4 I32

Table 3. Top 20 doctorate-granting institutions, by broad field of doctorate, 2000
InstitutionNumber ofdoctorates
All FieldsUniversity of California-Berkeley 751
University of Wisconsin-Madison 728
University of Minnesota-Twin Cities 684
The University of Texas at Austin 656
University of Michigan-Ann Arbor 653
Ohio State University-Main Campus 609
University of California-Los Angeles 604
University of Illinois at Urbana 600
Nova Southeastern University 590
Stanford University 567
Harvard University 547
Pennsylvania State University-Main Campus 541
Texas A & M University 507
University of Washington 486
Purdue University-Main Campus 470
University of Maryland-College Park 460
Massachusetts Institute of Technology 460
Columbia University in the City of New York 457
Cornell University-Endowed Colleges 449
Indiana University-Bloomington 440
EngineeringMassachusetts Institute of Technology 198
Stanford University 181
University of Michigan-Ann Arbor 179
Georgia Institute of Technology-Main Campus 159
University of Illinois at Urbana 141
University of California-Berkeley 139
Texas A & M University 135
The University of Texas at Austin 131
Purdue University-Main Campus 122
Pennsylvania State University-Main Campus 110
University of Wisconsin-Madison 104
University of Minnesota-Twin Cities 91
Northwestern University 91
Virginia Polytechnic Institute and State Univ 86
Carnegie Mellon University 82
University of Maryland-College Park 81
Ohio State University-Main Campus 79
North Carolina State University at Raleigh 79
University of Southern California 79
Cornell University-Endowed Colleges 78
InstitutionNumber ofdoctorates
Physical Sciences aUniversity of California-Berkeley 146
Massachusetts Institute of Technology 130
University of Michigan-Ann Arbor 110
University of Wisconsin-Madison 108
The University of Texas at Austin 107
University of Illinois at Urbana 102
Stanford University 102
University of California-Los Angeles 100
University of Minnesota-Twin Cities 96
University of Arizona 95
University of Washington 94
Purdue University-Main Campus 91
University of Maryland-College Park 88
Columbia University in the City of New York 87
Texas A & M University 85
Ohio State University-Main Campus 83
University of Colorado at Boulder 83
Cornell University-Endowed Colleges 80
University of California-San Diego 78
Harvard University 77
Life SciencesUniversity of Wisconsin-MadiSon 211
Johns Hopkins University 170
University of Minnesota-Twin Cities 168
University of California-Davis 157
Harvard University 148
Ohio State University-Main Campus 147
University of North Carolina at Chapel Hill 133
University of California-Berkeley 131
University of Washington 129
Cornell University-Endowed Colleges 128
Texas A & M University 124
University of California-Los Angeles 124
University of Florida 122
Purdue University-Main Campus 120
University of Michigan-Ann Arbor 119
Pennsylvania State University-Main Campus 115
Michigan State University 113
University of Illinois at Urbana 107
University of Pennsylvania 106
University of Arizona 94
33
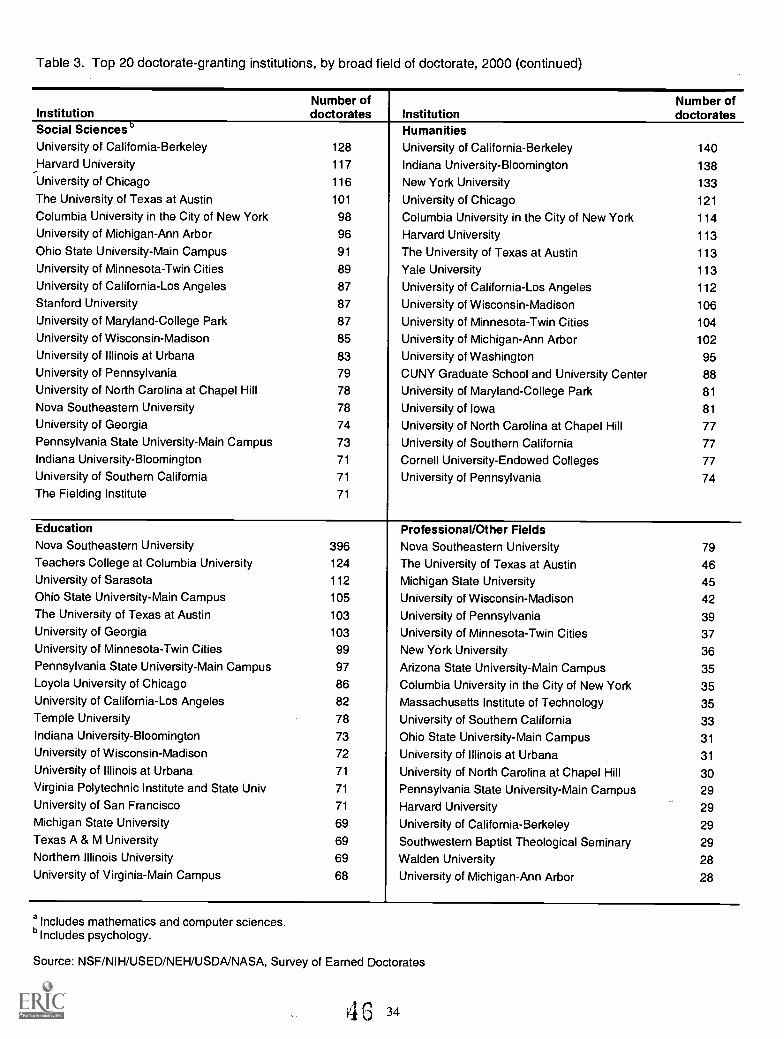
Table 3. Top 20 doctorate-granting institutions, by broad field of doctorate, 2000 (continued)
InstitutionNumber ofdoctorates
Social Sciences b
University of California-Berkeley 128
Harvard University 117
University of Chicago 116
The University of Texas at Austin 101
Columbia University in the City of New York 98
University of Michigan-Ann Arbor 96Ohio State University-Main Campus 91
University of Minnesota-Twin Cities 89University of California-Los Angeles 87
Stanford University 87
University of Maryland-College Park 87
University of Wisconsin-Madison 85
University of Illinois at Urbana 83University of Pennsylvania 79
University of North Carolina at Chapel Hill 78
Nova Southeastern University 78
University of Georgia 74Pennsylvania State University-Main Campus 73
Indiana University-Bloomington 71
University of Southern California 71
The Fielding Institute 71
EducationNova Southeastern University 396Teachers College at Columbia University 124
University of Sarasota 112
Ohio State University-Main Campus 105
The University of Texas at Austin 103
University of Georgia 103
University of Minnesota-Twin Cities 99
Pennsylvania State University-Main Campus 97Loyola University of Chicago 86University of California-Los Angeles 82
Temple University 78Indiana University-Bloomington 73
University of Wisconsin-Madison 72
University of Illinois at Urbana 71
Virginia Polytechnic Institute and State Univ 71
University of San Francisco 71
Michigan State University 69Texas A & M University 69Northern Illinois University 69
University of Virginia-Main Campus 68
a Includes mathematics and computer sciences.b Includes psychology.
InstitutionNumber ofdoctorates
HumanitiesUniversity of California-Berkeley 140
Indiana University-Bloomington 138
New York University 133
University of Chicago 121
Columbia University in the City of New York 114
Harvard University 113
The University of Texas at Austin 113
Yale University 113
University of California-Los Angeles 112
University of Wisconsin-Madison 106
University of Minnesota-Twin Cities 104
University of Michigan-Ann Arbor 102
University of Washington 95
CUNY Graduate School and University Center 88University of Maryland-College Park 81
University of Iowa 81
University of North Carolina at Chapel Hill 77
University of Southern California 77
Cornell University-Endowed Colleges 77University of Pennsylvania 74
Professional/Other FieldsNova Southeastern University 79
The University of Texas at Austin 46Michigan State University 45University of Wisconsin-Madison 42University of Pennsylvania 39University of Minnesota-Twin Cities 37New York University 36Arizona State University-Main Campus 35Columbia University in the City of New York 35Massachusetts Institute of Technology 35
University of Southern California 33Ohio State University-Main Campus 31
University of Illinois at Urbana 31
University of North Carolina at Chapel Hill 30Pennsylvania State University-Main Campus 29Harvard University 29University of California-Berkeley 29Southwestern Baptist Theological Seminary 29Walden University 28University of Michigan-Ann Arbor 28
Source: NSF/NIH/USED/NEH/USDNNASA, Survey of Earned Doctorates
4 34

Table 4. Number of doctorate recipients by state, including theDistrict of Columbia and Puerto Rico, 2000
Rank StateNumber ofdoctorates
1. Cal ifornia 4,706
2. New York 3,528
3. Texas 2,545
4. Illinois 2,181
5. Massachusetts 2,104
6. Pennsylvania 2,101
7. Florida 1,889
8. Ohio 1,795
9. Michigan 1,482
10. Indiana 1,169
11. North Carolina 1,109
12. Virginia 1,039
13. Maryland 954
14. Georgia 936
15. New Jersey 883
16. Wisconsin 869
17. Minnesota 830
18. Colorado 744
19. Arizona 738
20. Missouri 722
21. Tennessee 681
22. Washington 63423. Connecticut 618
24. Louisiana 609
25. Iowa 56626. District of Columbia 537
27. Alabama 518
28. Kansas 416
29. South Carolina 401
30. Oklahoma 382
30. Oregon 382
32. Kentucky 352
33. Mississippi 351
34. Utah 348
35. Nebraska 297
36. New Mexico 272
37. Rhode Island 242
38. Delaware 184
39. Hawaii 152
40. West Virginia 134
41. Puerto Rico 130
42. Arkansas 129
43. Nevada 115
44. Idaho 99
45. New Hampshire 87
46. South Dakota 79
47. Wyoming 7248. Montana 65
48. Vermont 65
50. North Dakota 5851. Maine 49
52. Alaska 20
Source: NSF/NIH/USED/NEH/USDNNASA, Survey of Earned Doctorates
35 4 7

Table 5. Major field of doctorate recipients for selected years, 1970-2000
Field 1970 1975 1980 1985 1990 1995 2000
All Fields 29,498 32,952 31,020 31,297 36,067 41,742 41,368
Physical Sciences a 5,628 4,857 4,111 4,531 5,859 6,808 6,077Engineering 3,434 3,002 2,479 3,166 4,894 6,008 5,330Life Sciences 4,693 5,026 5,461 5,780 6,605 7,917 8,529Social Sciences 4,566 6,066 5,855 5,765 6,093 6,635 7,115Humanities 4,278 5,046 3,872 3,429 3,822 5,061 5,634Education 5,857 7,360 7,586 6,733 6,510 6,649 6,420Professional/Other Fields 1,042 1,595 1,656 1,893 2,284 2,664 2,263 C
Physical SciencesPhysics & Astronomy 1,655 1,300 983 1,080 1,393 1,652 1,392Chemistry 2,238 1,776 1,538 1,836 2,100 2,162 1,990Earth, Atmos., & Marine Science 510 634 628 617 769 807 786Mathematics 1,225 1,147 744 688 892 1,190 1,048Computer Sciences b 218 310 705 997 861
Engineering 3,434 3,002 2,479 3,166 4,894 6,008 5,330
Life SciencesBiological Sciences 3,361 3,497 3,803 3,793 4,328 5,375 5,855Health Sciences 414 462 586 729 956 1,330 1,589Agricultural Sciences 918 1,067 1,072 1,258 1,321 1,212 1,085
Social SciencesPsychology 1,890 2,751 3,098 3,118 3,281 3,429 3,623Anthropology 217 386 370 353 324 375 446Economics 853 895 767 811 862 979 948Political Sci./International Rel. 636 862 585 484 559 673 747Sociology 505 680 600 461 428 540 615Other Social Sciences 465 492 435 538 639 639 736
HumanitiesHistory 1,091 1,183 745 543 612 889 1,060Amer. & Eng. Lang. & Lit. 1,098 1,290 952 729 796 1,079 1,070Foreign Lang. & Lit. 647 826 535 435 512 639 641
Other Humanities 1,442 1,747 1,640 1,722 1,902 2,454 2,863
EducationTeacher Education 563 570 639 463 419 390 260Teaching Fields 1,384 1,417 1,471 1,118 922 924 828Other Education 3,910 5,373 5,476 5,152 5,169 5,335 5,332
Professional/Other FieldsBusiness & Management 584 787 640 790 1,036 1,327 1,071
Communications 27 264 270 266 323 380 389Other Professional Fields 277 524 724 812 858 931 797Other Fields 154 20 22 25 67 26 1
a Includes mathematics and computer sciences.b Computer sciences first appeared on the survey form in 1978.Includes 5 persons for whom field was unknown.
Source: NSF/NIH/USED/NEH/USDNNASA, Survey of Earned Doctorates
4 S. 36

Table 6. Doctorate recipients and percent earned by females, by selected subfields, 1990 and 2000
Subfield
1990 2000
Numberof doctoraterecipients
Percent doctoraterecipientsto females
Numberof doctorate
recipients
Percent doctoraterecipientsto females
All Fields 36,067 36.3 41,368 43.8
Physical Sciences 5,859 18.3 6,077 24.1
Physics & Astronomy 1,393 10.8 1,392 14.7Chemistry 2,100 24.0 1,990 31.4Earth, Atmos. & Marine Sci. 769 19.4 786 30.3Mathematics 892 17.7 1,048 24.6Computer Science 705 15.6 861 16.5
Engineering 4,894 8.5 5,330 15.7
Life Sciences 6,605 37.6 8,529 46.9Biological Sciences 4,328 37.3 5,855 44.8Health Sciences 956 61.9 1,589 66.9Agricultural Sciences 1,321 20.7 1,085 28.8
Social Sciences 6,093 46.4 7,115 54.5Psychology 3,281 58.3 3,623 66.6Anthropology 324 53.4 446 56.5Economics 862 20.1 948 26.9Political Sciences & International Rel. 559 22.0 747 35.1Sociology 428 48.4 615 59.5Other Social Sciences 639 37.2 736 44.8
Humanities 3,822 45.7 5,634 50.2History 612 33.0 1,060 38.3Amer. & Eng. Lang. & Lit. 796 55.8 1,070 58.1
For. Lang. & Lit. 512 59.4 641 61.5Other Humanities 1,902 42.0 2,863 49.2
Education 6,510 57.6 6,420 64.9Teacher Education 419 69.9 260 72.7Teaching Fields 922 52.7 828 60.3Other Education 5,169 57.5 5,332 65.2
Professional/Other Fields 2,284 35.6 2,263 41.7Business & Management 1,036 25.6 1,071 31.7Communications 323 44.6 389 53.5Other Professional Fields 858 42.7 797 49.3Other Fields 67 56.7 6 33.3
Source: NSF/NIH/USED/NEH/USDNNASA, Survey of Earned Doctorates
37

Tab
le 7
. Num
ber
and
perc
ent o
f doc
tora
te r
ecip
ient
s, b
y se
x w
ithin
bro
ad fi
eld
for
sele
cted
yea
rs, 1
970-
2000
Fie
lds
1970
1975
1980
eh.
1985
1990
1995
2000
All
Fie
lds
Gro
up T
otal
29,4
9810
0.0
32,9
5210
0.0
31,0
2010
0.0
31,2
9710
0.0
36,0
67 a
100.
041
,742
b10
0.0
41,3
68c
100.
0
Mal
e25
,527
86.5
25,7
5178
.121
,612
69.7
20,5
5365
.722
,960
63.7
25,1
5860
.323
,173
56.0
Fem
ale
3,97
113
.57,
201
21.9
9,40
830
.310
,744
34.3
13,1
0636
.316
,414
39.3
18,1
2143
.8
Phy
sica
l Sci
ence
sd
Gro
up T
otal
5,62
810
0.0
4,85
710
0.0
4,11
110
0.0
4,53
110
0.0
5,85
910
0.0
6,77
810
0.0
6,06
210
0.0
Mal
e5,
308
94.3
4,45
491
.73,
609
87.8
3,81
784
.24,
789
81.7
5,27
977
.94,
596
75.8
Fem
ale
320
5.7
403
8.3
502
12.2
714
15.8
1,07
018
.31,
499
22.1
1,46
624
.2
Eng
inee
ring
Gro
up T
otal
3,43
410
0.0
3,00
210
0.0
2,47
910
0.0
3,16
610
0.0
4,89
410
0.0
5,96
610
0.0
5,30
210
0.0
Mal
e3,
419
99.6
2,95
098
.32,
389
96.4
2,96
893
.74,
479
91.5
5,27
088
.34,
463
84.2
Fem
ale
150.
452
1.7
903.
619
86.
341
58.
569
611
.783
915
.8
Life
Sci
ence
sG
roup
Tot
al4,
693
100.
05,
026
100.
05,
461
100.
05,
780
100.
06,
605
100.
07,
875
100.
08,
521
100.
0
Mal
e4,
084
87.0
4,03
180
.24,
047
74.1
3,91
067
.64,
124
62.4
4,54
557
.74,
524
53.1
Fem
ale
609
13.0
995
19.8
1,41
425
.91,
870
32.4
2,48
137
.63,
330
42.3
3,99
746
.9
Soc
ial S
cien
ces
Gro
up T
otal
4,56
610
0.0
6,06
610
0.0
5,85
510
0.0
5,76
510
0.0
6,09
310
0.0
6,61
310
0.0
7,10
610
0.0
Mal
e3,
829
83.9
4,54
474
.93,
810
65.1
3,38
8'
58.8
3,26
653
.63,
242
49.0
3,22
745
.4
Fem
ale
737
16.1
1,52
225
.12,
045
34.9
2,37
741
.22,
827
46.4
3,37
151
.03,
879
54.6
Hum
aniti
esG
roup
Tot
al4,
278
100.
05,
046
100.
03,
872
100.
03,
429
100.
03,
822
100.
05,
053
100.
05,
629
100.
0
Mal
e3,
296
77.0
3,35
966
.62,
339
60.4
1,94
056
.62,
074
54.3
2,60
751
.62,
799
49.7
Fem
ale
982
23.0
1,68
733
.41,
533
39.6
1,48
943
.41,
748
45.7
2,44
648
.42,
830
50.3
Edu
catio
nG
roup
Tot
al5,
857
100.
07,
360
100.
07,
586
100.
06,
733
100.
06,
510
100.
06,
639
100.
06,
417
100.
0
Mal
e4,
671
79.8
5,06
568
.84,
203
55.4
3,24
248
.22,
758
42.4
2,54
738
.42,
250
35.1
Fem
ale
1,18
620
.22,
295
31.2
3,38
344
.63,
491
51.8
3,75
257
.64,
092
61.6
4,16
764
.9
Pro
fess
iona
l/Oth
erG
roup
Tot
al1,
042
100.
01,
595
100.
01,
656
100.
01,
893
100.
02,
283
100.
02,
648
100.
02,
257
100.
0
Mal
e92
088
.31,
348
84.5
1,21
573
.41,
288
68.0
1,47
064
.41,
668
63.0
1,31
458
.2
Fem
ale
122
11.7
247
15.5
441
26.6
605
32.0
813
35.6
980
37.0
943
41.8
aG
roup
tota
l for
199
0 in
clud
es 1
indi
vidu
al o
f unk
now
n se
x.bG
roup
tota
l for
199
5 in
clud
es 1
70 in
divi
dual
s of
unk
now
n se
x.G
roup
tota
l for
200
0 in
clud
es 7
4 in
divi
dual
s of
unk
now
n se
x.dIn
clud
es m
athe
mat
ics
and
com
pute
r sc
ienc
es.
Sou
rce:
NS
F/N
IH/U
SE
D/N
EH
/US
DA
/NA
SA
, Sur
vey
of E
arne
d D
octo
rate
s
38
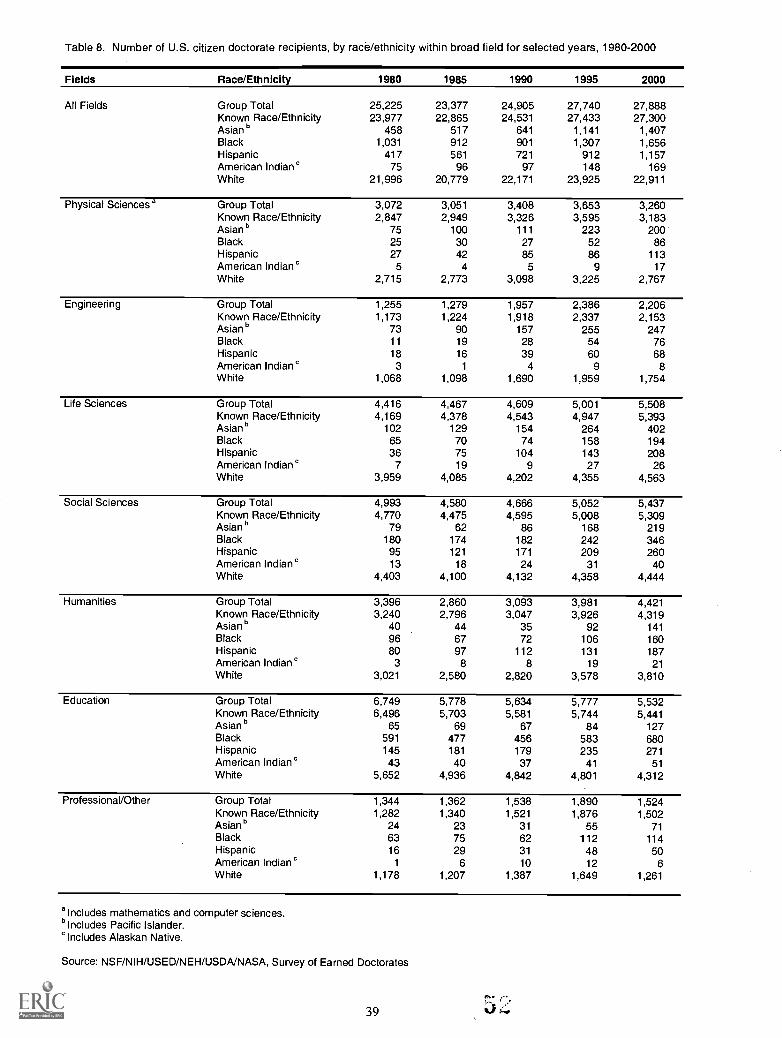
Table 8. Number of U.S. citizen doctorate recipients, by race/ethnicity within broad field for selected years, 1980-2000
Fields Race/Ethnicity 1980 1985 1990 1995 2000
All Fields Group Total 25,225 23,377 24,905 27,740 27,888Known Race/Ethnicity 23,977 22,865 24,531 27,433 27,300Asian b 458 517 641 1,141 1,407Black 1,031 912 901 1,307 1,656Hispanic 417 561 721 912 1,157American Indian b 75 96 97 148 169White 21,996 20,779 22,171 23,925 22,911
Physical Sciences a Group Total 3,072 3,051 3,408 3,653 3,260Known Race/Ethnicity 2,847 2,949 3,326 3,595 3,183Asian b 75 100 111 223 200Black 25 30 27 52 86Hispanic 27 42 85 86 113American Indian b 5 4 5 9 17White 2,715 2,773 3,098 3,225 2,767
Engineering Group Total 1,255 1,279 1,957 2,386 2,206Known Race/Ethnicity 1,173 1,224 1,918 2,337 2,153Asian b 73 90 157 255 247Black 11 19 28 54 76Hispanic 18 16 39 60 68American Indian b 3 1 4 9 8White 1,068 1,098 1,690 1,959 1,754
Life Sciences Group Total 4,416 4,467 4,609 5,001 5,508Known Race/Ethnicity 4,169 4,378 4,543 4,947 5,393Asian b 102 129 154 264 402Black 65 70 74 158 194Hispanic 36 75 104 143 208American Indian e 7 19 9 27 26White 3,959 4,085 4,202 4,355 4,563
Social Sciences Group Total 4,993 4,580 4,666 5,052 5,437Known Race/Ethnicity 4,770 4,475 4,595 5,008 5,309Asian b 79 62 86 168 219Black 180 174 182 242 346Hispanic 95 121 171 209 260American Indian b 13 18 24 31 40White 4,403 4,100 4,132 4,358 4,444
Humanities Group Total 3,396 2,860 3,093 3,981 4,421Known Race/Ethnicity 3,240 2,796 3,047 3,926 4,319Asian b 40 44 35 92 141Black 96 67 72 106 160Hispanic 80 97 112 131 187American Indian b 3 8 8 19 21White 3,021 2,580 2,820 3,578 3,810
Education Group Total 6,749 5,778 5,634 5,777 5,532Known Race/Ethnicity 6,496 5,703 5,581 5,744 5,441Asian b 65 69 67 84 127Black 591 477 456 583 680Hispanic 145 181 179 235 271American Indian b 43 40 37 41 51White 5,652 4,936 4,842 4,801 4,312
Professional/Other Group Total 1,344 1,362 1,538 1,890 1,524Known Race/Ethnicity 1,282 1,340 1,521 1,876 1,502Asian b 24 23 31 55 71Black 63 75 62 112 114Hispanic 16 29 31 48 50American Indian b 1 6 10 12 6White 1,178 1,207 1,387 1,649 1,261
a Includes mathematics and computer sciences.b Includes Pacific Islander.b Includes Alaskan Native.
Source: NSF/NIH/USED/NEH/USDNNASA, Survey of Earned Doctorates
39 0::;;

Table 9. Major field of U.S. citizen doctorate recipients, by race/ethnicity, 2000
Field
TotalU.S. Citizen
Ph.D.s
Number withKnown U.S. CitizensRace/
Ethnicity Asian a Black HispanicAmericanIndian b White
All Fields 27,888 27,300 1,407 1,656 1,157 169 22,911
Physical Sciences 3,260 3,183 200 86 113 17 2,767Physics & Astronomy 750 734 54 16 22 2 640Chemistry 1,116 1,089 48 36 48 7 950Earth, Atmos., & Marine Sci. 494 478 12 7 19 5 435Mathematics 513 506 44 14 13 2 433Computer Sciences 387 376 42 13 11 1 309
Engineering 2,206 2,153 247 76 68 8 1,754
Life Sciences 5,508 5,393 402 194 208 26 4,563
Biological Sciences 3,895 3,809 330 115 154 17 3,193Health Sciences 1,113 1,093 55 67 33 4 934Agricultural Sciences 500 491 17 12 21 5 436
Social Sciences 5,437 5,309 219 346 260 40 4,444
Psychology 3,146 3,085 124 188 187 22 2,564Anthropology 359 343 9 19 9 5 301
Economics 393 384 24 11 12 337
Political Sci./International Rel. 577 555 23 38 20 2 472
Sociology 468 460 19 52 23 6 360Other Social Sciences 494 482 20 38 9 5 410
Humanities 4,421 4,319 141 160 187 21 3,810History 910 883 23 37 36 10 777Amer. & Eng. Lang. & Lit. 952 936 31 44 28 2 831
Foreign Lang. & Lit. 434 426 19 5 62 1 339Other Humanities 2,125 2,074 68 74 61 8 1,863
Education 5,532 5,441 127 680 271 51 4,312Teacher Education 206 204 3 19 10 4 168
Teaching Fields 664 655 27 56 21 5 546Other Education 4,662 4,582 97 605 240 42 3,598
Professional/Other 1,524 1,502 71 114 50 6 1,261
Business & Management 669 657 43 37 19 4 554
Communications 286 283 4 20 9 1 249Other Professional Fields 568 561 23 57 22 1 458Other Fields 1 1 1 -
NOTE: See technical notes in Appendix C for the rate of nonresponse to the survey question on race/ethnicity.a Includes Pacific Islander.
Includes Alaskan Native.
Source: NSF/NIH/USED/NEH/USDNNASA, Survey of Earned Doctorates
40

Table 10. Leading doctorate-granting institutions of U.S. minority doctorate recipients, by racial/ethnic group, 1996-2000
InstitutionNumber ofdoctoraterecipients
InstitutionNumber ofdoctoraterecipients
Asian a BlackUniversity of California-Berkeley 330 Nova Southeastern University 287University of California-Los Angeles 311 Howard University 241Stanford University 197 University of Michigan-Ann Arbor 144Harvard University 144 Ohio State University 139Massachusetts Institute of Technology 144 University of Maryland-College Park 116University of Michigan-Ann Arbor 137 Virginia Polytechnic Institute and State Univ 116University of California-Davis 125 Wayne State University 111University of Illinois at Urbana-Champaign 121 Florida State University 101Columbia University in the City of New York 117 Temple University 101University of Washington-Seattle Campus 108 University of Illinois at Urbana-Champaign 97University of Southern California 107 University of North Carolina-Chapel Hill 94Purdue University-Main Campus 101 Teachers College at Columbia Univ 93University of California-Irvine 90 North Carolina State Univ-Raleigh 93New York University 87 The University of Texas at Austin 88University of Pennsylvania 85 University of California-Los Angeles 86Johns Hopkins University 84 Michigan State University 86University of Wisconsin-Madison 83 Clark Atlanta University 85University of Hawaii at Manoa 82 Univ of South Carolina-Columbia 82Northwestern University 80 Harvard University 81University of Maryland-College Park 78 University of Pennsylvania 79
Top 20 Institutions 2,611 Top 20 Institutions 2,320Total Institutions Reported (320) 6,297 Total Institutions Reported (327) 7,394
Hispanic American Indian b
The University of Texas at Austin 202 Oklahoma State University 32University of Puerto Rico-Rio Piedras Campus 193 University of Oklahoma 22Carlos Albizu University-Puerto Rico 160 The University of Texas at Austin 19University of California-Berkeley 146 University of Washington-Seattle Campus 19University of California-Los Angeles 122 University of California-Los Angeles 17Texas A & M University 112 Nova Southeastern University 15Harvard University 89 University of Michigan-Ann Arbor 15University of New Mexico 84 Pennsylvania State University-Main Campus 15Stanford University 84 Univ of Arkansas Main Campus 14University of Michigan-Ann Arbor 83 University of Minnesota-Twin Cities 14University of Arizona 80 University of Georgia 13Arizona State University-Main Campus 79 University of Wisconsin-Madison 13University of Wisconsin-Madison 79 Stanford University 13Inter American Univ of Puerto Rico-Metro 76 University of California-Berkeley 12University of California-Davis 74 University of Maryland-College Park 12Pennsylvania State University-Main Campus 70 University of New Mexico 12University of Miami 68 North Carolina State Univ-Raleigh 11University of Southern California 64 University of North Dakota 11New York University 63 Northern Arizona University 10University of California-Santa Barbara 61 Montana State University-Bozeman 10
Ohio State University 10
Top 20 Institutions 1,989 Top 20 Institutions 309Total Institutions Reported (318) 5,513 Total Institutions Reported (230) 928
a Includes Pacific Islander.Includes Alaskan Native.
Source: NSF/NIH/USED/NEH/USDNNASA, Survey of Earned Doctorates
41

Table 11. Citizenship status of doctorate recipients, by broad field for selected years, 1970-2000
Field/Citizenship 1970 1975 1980 1985 1990 1995 2000
Total 29,498 32,952 31,020 31,297 36,067 41,742 41,368
All FieldsU.S. Citizen 24,917 27,106 25,225 23,377 24,905 27,740 27,888Non-U.S., Permanent Visa 1,576 1,713 1,290 1,324 1,698 4,318 1,949
Non-U.S., Temporary Visa 2,572 3,536 3,644 5,227 8,093 8,810 9,648Unknown 433 597 861 1,369 1,371 874 1,883
Physical Sciences a
U.S. Citizen 4,631 3,662 3,072 3,051 3,408 3,653 3,260Non-U.S., Permanent Visa 354 349 252 233 293 1,169 359Non-U.S., Temporary Visa 568 750 688 1,066 1,939 1,850 2,161
Unknown 75 96 99 181 219 136 297
EngineeringU.S. Citizen 2,514 1,717 1,255 1,279 1,957 2,386 2,206Non-U.S., Permanent Visa 430 418 299 315 389 956 350
Non-U.S., Temporary Visa 471 815 851 1,419 2,277 2,524 2,444Unknown 19 52 74 153 271 142 330
Life SciencesU.S. Citizen 3,766 3,925 4,416 4,467 4,609 5,001 5,508Non-U.S., Permanent Visa 242 312 229 190 287 1,061 503Non-U.S., Temporary Visa 650 689 714 925 1,526 1,725 2,189Unknown 35 100 102 198 183 130 329
Social SciencesU.S. Citizen 3,886 5,186 4,993 4,580 4,666 5,052 5,437Non-U.S., Permanent Visa 224 214 195 210 245 400 251
Non-U.S., Temporary Visa 399 546 486 666 911 1,023 1,039
Unknown 57 120 181 309 271 160 388
HumanitiesU.S. Citizen 3,835 4,497 3,396 2,860 3,093 3,981 4,421
Non-U.S., Permanent Visa 202 222 136 150 196 336 252
Non-U.S., Temporary Visa 162 225 206 264 420 648 740Unknown 79 102 134 155 113 96 221
EducationU.S. Citizen 5,540 6,807 6,749 5,778 5,634 5,777 5,532Non-U.S., Permanent Visa 72 118 112 130 153 218 124
Non-U.S., Temporary Visa 201 347 507 570 501 502 541
Unknown 44 88 218 255 222 152 223
Professional/Other FieldsU.S. Citizen 745 1,312 1,344 1,362 1,538 1,890 1,524
Non-U.S., Permanent Visa 52 80 67 96 135 178 110
Non-U.S., Temporary Visa 121 164 192 317 519 538 534
Unknown 124 39 53 118 92 58 95
a Includes mathematics and computer sciences
Source: NSF/NIH/USED/NEH/USDA/NASA, Survey of Earned Doctorates
42

Table 12. Top 30 countries of origin of non-U.S. citizens earning doctorates at U.S. colleges and universities (ranked bynumber of doctorate recipients), 2000
Rank Country
Number ofdoctoraterecipients
1. China, Peoples Republic of a 2,5942. Korea 1,0483. India 9854. China, Republic of (Taiwan) 9365. Canada 5146. Turkey 3207. Japan 2978. Germany 2889. Mexico 248
10. Russia 23511. Thailand 22312. Great Britain, UK 18113. Brazil 17114. France 12115. Romania 118
[
Rank-
Number ofdoctorate
Country recipients
16. Italy 11117. Spain 10818. Greece 10019. Argentina 9520. Iran 8820. Venezuela 8820. Egypt 8823. Saudi Arabia 8424. Jordan 8225. Yugoslavia 8126. Indonesia 7427. Malaysia 7328. Australia 7129. Colombia 7030. Israel 65
a Includes Hong Kong
Source: NSF/NIH/USED/NEH/USDA/NASA, Survey of Earned Doctorates
43 56

Table 13. Top 20 institutions in the number of doctorate recipients who were non-U.S. citizens, 2000
Institution
Numberof doctoraterecipients Institution
Numberof doctoraterecipients
Ohio State University 269 University of California-Berkeley 176
University of Illinois at Urbana-Champaign 242 Columbia University 176
The University of Texas at Austin 223 University of California-Los Angeles 174
University of Minnesota-Twin Cities 217 Stanford University 174
Purdue University-Main Campus 215 Michigan State University 157
Texas A & M University 214 Harvard University 150
University of Wisconsin-Madison 208 University of Florida 148
University of Michigan-Ann Arbor 200 University of Maryland-College Park 148
Cornell University-Endowed Colleges 199 Rutgers University-New Brunswick 147
Pennsylvania State University-Main Campus 194 University of Southern California 139
Top 20 institutions 3,770Total institutions reported (334) 11,597
Source: NSF/NIH/USED/NEH/USDA/NASA, Survey of Earned Doctorates
Table 14. Top 20 institutions in the percentage of doctorate recipients who were non-U.S. citizens, 2000
Institution a Percent b Institution a Percent b
New Jersey Institute of Technology 82.2 Rockefeller University 52.6Polytechnic University 79.4 r Carnegie Mellon University 51.9Clarkson University 78.9 L Mount Sinai School of Medicine 51.9Illinois Institute of Technology 73.1 Michigan Technological University 48.8Medical College of Ohio 70.8 Iowa State University 48.7Stevens Institute of Tech 68.0 Drexel University 48.6Worcester Polytechnic Institute 64.7 Loma Linda University 46.2University of Missouri-Rolla 64.4 The University of Texas Health Science Center 46.0Northeastern University 60.6 Purdue University-Main Campus 45.7Rutgers University-Newark 56.1 University of Central Florida 45.5
a The ranking excludes institutions with fewer than 10 non-U.S. citizen doctorate recipients.b The percent column is based on the number of non-U.S. citizens as a percentage of the total doctorates awarded by that institution.
Source: NSF/NIH/USED/NEH/USDA/NASA, Survey of Earned Doctorates
44

Table 15. Parental educational attainment of doctorate recipients, 2000
Percent HighSchool or Less
PercentCollege
PercentAdvanced
DegreeTotal
PercentTotal
Number
TotalFathers Education 30.9 35.0 34.1 100.0 37,405Mother's Education 40.2 39.2 20.6 100.0 37,506
SexMale
Father's Education 31.5 34.7 33.8 100.0 20,980Mother's Education 42.1 38.0 19.8 100.0 21,028
FemaleFather's Education 30.2 35.4 34.4 100.0 16,425Mother's Education 37.6 40.8 21.6 100.0 16,478
Race/Ethnicity (U.S. citizens only)Asian a
Father's Education 23.2 30.1 46.7 100.0 1,338Mothers Education 36.2 37.5 26.3 100.0 1,343
BlackFathers Education 56.0 26.1 17.9 100.0 1,506Mother's Education 48.5 33.4 18.1 100.0 1,538
HispanicFather's Education 43.0 29.8 27.2 100.0 1,096Mother's Education 49.5 34.9 15.6 100.0 1,104
American Indian b
Father's Education 47.1 31.0 21.9 100.0 155Mother's Education 53.8 31.6 14.6 100.0 158
WhiteFather's Education 26.4 34.9 38.7 100.0 22,022Mother's Education 33.1 43.1 23.8 100.0 22,052
CitizenshipU.S. Citizen
Father's Education 28.6 33.9 37.5 100.0 26,455Mother's Education 34.9 41.8 23.3 100.0 26,535
Non-U.S., Permanent VisaFather's Education 33.0 35.5 31.4 100.0 1,837Mother's Education 48.1 33.4 18.5 100.0 1,844
Non-U.S., Temporary VisaFather's Education 37.2 38.1 24.7 100.0 9,093Mother's Education 53.9 32.9 13.2 100.0 9,106
Broad Field of StudyPhysical Sciences c
Father's Education 26.7 35.8 37.5 100.0 5,510Mother's Education 36.3 40.2 23.5 100.0 5,518
EngineeringFather's Education 27.3 40.0 32.7 100.0 4,792Mother's Education 41.9 40.2 17.9 100.0 4,799
Life SciencesFather's Education 28.5 36.6 35.0 100.0 7,858Mother's Education 38.6 40.3 21.1 100.0 7,882
Social SciencesFather's Education 27.5 34.6 37.9 100.0 6,346Mother's Education 34.3 40.8 24.8 100.0 6,365
HumanitiesFather's Education 25.5 32.3 42.2 100.0 5,148Mother's Education 34.3 40.4 25.3 100.0 5,163
EducationFather's Education 48.7 30.6 20.7 100.0 5,731Mother's Education 54.2 33.7 12.0 100.0 5,753
Professional/Other FieldsFather's Education 35.0 35.2 29.8 100.0 2,020Mother's Education 45.7 38.0 16.3 100.0 2,026
NOTE: Details may not add to the total due to rounding.a Includes Pacific Islander.b Includes Alaskan Native.
Includes mathematics and computer sciences.
Source: NSF/NIH/USED/NEH/USDA/NASA, Survey of Earned Doctorates
45 L.J

Table 16. Median number of years from baccalaureate to doctorate award, by broad field for selected years, 1975-2000
1975 1980 1985 1990 1995 2000
ALL FIELDSTotal 8.7 9.3 10.3 10.6 10.9 10.3Registered 6.0 6.3 6.9 7.0 7.2 7.4
PHYSICAL SCIENCES a
Total 6.9 7.0 7.3 7.8 8.4 8.0Registered 5.7 5.9 6.1 6.3 6.9 6.8
ENGINEERINGTotal 7.6 7.7 8.2 8.3 9.1 8.7Registered 5.6 5.7 6.0 6.1 6.4 6.8
LIFE SCIENCESTotal 7.2 7.4 8.5 9.1 9.5 9.0Registered 5.8 6.0 6.4 6.8 7.0 7.0
SOCIAL SCIENCESTotal 7.9 8.7 10.0 10.6 10.5 9.8Registered 5.8 6.5 7.2 7.7 7.5 7.5
HUMANITIESTotal 9.8 10.8 11.9 12.2 12.0 11.4Registered 6.9 7.9 8.4 8.3 8.4 8.8
EDUCATIONTotal 12.6 13.2 15.2 18.0 20.0 19.4Registered 6.5 7.0 7.7 8.0 8.2 8.1
PROFESSIONAL/OTHER FIELDSTotal 10.4 11.0 13.0 13.3 13.5 14.0Registered 6.2 6.5 7.3 7.6 7.6 8.0
a Includes mathematics and computer sciences.
Source: NSF/NIH/USED/NEH/USDNNASA, Survey of Earned Doctorates
o ::;1r f-1
46

Table 17. Median number of years from baccalaureate to doctorate award, by demographic group and broad field, 2000
AllFields
PhysicalSciences a Engineering
LifeSciences
SocialSciences Humanities Education
ProfJOther
ELAPSED TIME FROM BACCALAUREATE(YEARS)
Total 10.3 8.0 8.7 9.0 9.8 11.4 19.4 14.0
SexMale 9.9 8.0 8.8 8.9 10.0 11.6 18.6 13.7Female 11.0 7.8 8.2 9.3 9.6 11.3 20.0 14.4
CitizenshipU.S. Citizen 10.6 7.3 7.9 8.5 9.6 11.5 20.5 15.4Non-U.S., Permanent Visa 11.0 10.1 10.1 11.0 11.4 11.8 15.0 12.5Non-U.S., Temporary Visa 9.8 8.8 9.0 10.0 10.0 11.0 12.3 11.2
Race/Ethnicity (U.S. citizensonly)
Asianb 8.5 7.6 7.1 7.9 9.1 9.9 15.1 14.4Black 13.5 7.9 8.0 9.1 10.0 10.6 21.0 15.0Hispanic 10.4 8.0 8.6 8.9 9.0 11.0 17.7 13.0American Indiana 12.0 6.5 11.1 9.8 10.8 14.5 21.1 19.0White 10.6 7.3 8.0 8.6 9.7 11.6 20.7 15.6
REGISTERED TIME FROM BACCALAUREATE(YEARS)
Total 7.4 6.8 6.8 7.0 7.5 8.8 8.1 8.0
SexMale 7.3 6.8 6.8 6.9 7.5 8.6 8.0 8.0Female 7.6 6.6 6.7 7.0 7.6 8.9 8.2 8.0
CitizenshipU.S. Citizen 7.5 6.5 6.6 7.0 7.5 8.8 8.3 8.1Non-U.S., Permanent Visa 7.9 7.8 7.3 7.7 8.5 9.3 8.8 8.8Non-U.S., Temporary Visa 7.1 7.0 6.8 7.1 7.4 8.4 6.7 7.6
Race/Ethnicity (U.S. citizensonly)
Asian b 7.1 7.0 6.5 6.9 7.3 8.3 7.7 8.6Black 7.8 6.8 7.0 7.6 7.6 8.5 8.0 7.9Hispanic 7.7 7.1 7.1 7.1 7.6 8.6 8.0 8.0American Indian c 8.0 6.6 8.3 7.0 7.3 10.6 9.0 6.4White 7.5 6.5 6.5 6.9 7.5 8.9 8.3 8.2
a Includes mathematics and computer sciences.b Includes Pacific Islander.
Includes Alaskan Native.
Source: NSF/NIH/USED/NEH/USDNNASA, Survey of Earned Doctorates
47

Table 18. Distribution of doctorate recipients, by age at doctorate, 2000
Field of Study
Age GroupingMedian ageat doctorate 21-25 26-30 31-35 36-40 41-45 Over 45
All Fields 33.6 243 12,665 a 11,359 5,823 3,618 5,601
Broad FieldPhysical Sciences id 30.8 66 2,936 1,714 632 217 189
Engineering 31.4 65 2,244 1,665 672 211 126
Life Sciences 32.1 44 3,263 2,487 1,176 627 576
Social Sciences 33.0 41 2,284 2,096 951 614 732
Humanities 34.8 8 1,142 1,877 981 609 763
Education 44.4 11 472 962 959 1,034 2,717Professional/Other Fields 37.8 8 324 558 452 306 498
SexMale 33.0 144 7,519 6,925 3,457 1,779 2,192Female 34.5 99 5,145 4,434 2,366 1,839 3,409
CitizenshipU.S. Citizen 34.0 153 8,917 6,837 3,770 2,807 5,114Permanent Visa 34.6 9 435 705 413 211 135
Temporary Visa 32.6 79 3,244 3,759 1,599 573 307
Unknown 35.0 2 69 58 41 27 45
Race/Ethnicity (U.S. citizens only)Asian C 31.3 20 639 380 146 86 121
Black 38.4 6 379 301 247 217 491
Hispanic 34.6 7 321 321 182 123 194American Indian d 40.0 1 34 26 28 32 45
White 33.9 115 7,403 5,697 3,098 2,279 4,185
a Includes 1 individual whose sex was not reported.b Includes mathematics and computer sciences.c Includes Pacific Islander.d Includes Alaskan Native.
Source: NSF/NIH/USED/NEH/USDA/NASA, Survey of Earned Doctorates
48

Table 19. Primary sources of financial support for doctorate recipients, by broad field and demographic group, 2000(includes only doctorate recipients who reported primary source of support)
Primary Source of Support Total
Sex Citizenship U.S. Citizens and Permanent Residents
Men WomenU.S.
CitizenPerm
ResidentTemp
Resident Asian° Black HispanicAmerican
Indian° White
ALL FIELDS N 41,368 23,173 18,121 27,888 1,949 9,648 2,315 1,775 1,279 169 23,651
Teaching assistantships % 17.4 18.2 16.3 16.3 19.8 20.0 16.5 8.4 15.0 10.6 17.3
Research assistantships/Traineeships % 24.9 29.9 18.6 18.9 33.6 40.7 34.8 9.4 12.5 10.6 19.6
Fellowships/Dissertation grants % 18.8 18.5 19.2 19.3 18.8 17.4 23.6 30.2 28.4 24.8 17.5
Own resources % 32.2 25.7 40.5 40.4 22.7 10.2 20.7 47.0 39.6 44.7 40.4
Foreign government % 2.7 3.6 1.7 0.1 2.8 10.4 1.0 0.2 0.8 1.2 0.2Employer % 3.6 3.8 3.4 4.6 2.1 1.0 3.0 4.4 3.2 6.2 4.7
Other % 0.3 0.3 0.4 0.4 0.2 0.2 0.4 0.4 0.5 1.9 0.3
PHYSICAL SCIENCES0 N 5,498 4,162 1,336 3,118 345 2,019 363 92 117 16 2,818Teaching assistantships % 27.6 27.4 28.1 24.3 31.6 31.9 28.4 20.7 19.7 12.5 25.4Research assistantships/Traineeships % 43.0 43.8 40.4 40.3 42.9 47.1 42.7 17.4 34.2 43.8 41.1
Fellowships/Dissertation grants % 15.4 14.4 18.6 18.9 11.6 10.6 13.5 44.6 28.2 31.3 17.1
Own resources % 9.4 9.0 10.5 13.0 11.0 3.5 11.6 15.2 12.8 12.5 13.0Foreign government % 2.3 2.7 1.2 0.1 1.4 6.0 0.6 1.1 0.9 0.0 0.1
Employer % 2.2 2.5 1.1 3.2 1.4 0.6 3.0 1.1 4.3 0.0 3.1
Other % 0.2 0.2 0.1 0.2 0.0 0.1 0.3 0.0 0.0 0.0 0.2
ENGINEERING N 4,788 4,035 753 2,136 328 2,313 427 83 80 8 1,825
Teaching assistantships % 8.4 8.5 8.0 5.9 10.4 10.3 8.2 6.0 8.8 0.0 6.1
Research assistantships/Traineeships % 53.5 54.4 48.6 43.2 59.5 62.2 57.8 19.3 32.5 25.0 44.4
Fellowships/Dissertation grants % 15.6 13.6 26.4 23.9 9.8 8.8 14.1 56.6 32.5 37.5 21.8
Own resources % 12.3 12.6 10.4 18.1 13.7 6.7 13.8 14.5 12.5 25.0 18.7
Foreign government % 5.6 6.0 3.7 0.1 3.4 11.1 0.5 0.0 5.0 0.0 0.4
Employer % 4.5 4.8 2.8 8.5 3.4 0.9 5.6 3.6 8.8 12.5 8.3
Other % 0.1 0.1 0.1 0.2 0.0 0.0 0.0 0.0 0.0 0.0 0.2
LIFE SCIENCES N 7,822 4,148 3,674 5,292 469 2,056 649 207 232 23 4,563
Teaching assistantships % 10.8 11.4 10.1 10.6 10.7 11.2 9.7 6.8 9.1 13.0 10.9
Research assistantships/Traineeships % 36.9 39.0 34.6 32.0 45.8 47.5 43.5 23.2 21.1 8.7, 32.9
Fellowships/Dissertation grants % 28.3 29.1 27.4 30.2 26.9 23.7 33.4 44.4 46.1 39.1 27.9
Own resources % 18.1 14.5 22.2 23.3 13.2 6.0 9.9 23.7 20.7 30.4 24.3
Foreign government % 3.0 3.6 2.2 0.1 2.1 10.4 0.9 0.0 0.9 0.0 0.2
Employer % 2.6 2.1 3.1 3.3 1.3 1.1 2.3 1.4 2.2 8.7 3.3
Other % 0.3 0.3 0.4 0.4 0.0 0.2 0.3 0.5 0.0 0.0 0.4
SOCIAL SCIENCES N 6,303 2,880 3,423 5,106 231 964 293 343 257 38 4,332
Teaching assistantships % 19.8 22.8 17.3 18.1 20.8 28.8 20.8 10.2 13.6 5.3 19.2
Research assistantships/Traineeships % 13.6 12.3 14.7 13.8 11.7 13.2 14.3 9.9 5.8 10.5 14.5
Fellowships/Dissertation grants % 19.5 20.8 18.5 17.7 23.8 28.3 28.3 38.2 24.5 39.5 15.0
Own resources % 42.7 38.3 46.4 47.9 38.5 16.2 33.1 39.1 52.9 39.5 48.8
Foreign government % 2.1 3.2 1.1 0.1 3.5 12.1 1.4 0.0 0.8 2.6 0.1
Employer % 2.0 2.2 1.8 2.1 1.3 1.1 1.7 2.3 1.9 2.6 2.1
Other % 0.3 0.4 0.2 0.3 0.4 0.2 0.3 0.3 0.4 0.0 0.3
HUMANITIES N 5,120 2,536 2,584 4,215 230 670 189 162 213 21 3,780
Teaching assistantships % 33.2 32.0 34.4 33.0 35.7 34.0 33.9 15.4 33.8 33.3 34.1
Research assistantships/Traineeships % 1.4 1.2 1.5 1.2 1.3 2.2 1.1 4.3 1.9 0.0 1.0
Fellowships/Dissertation grants % 23.8 23.3 24.3 22.8 23.9 30.1 33.3 43.2 26.8 14.3 21.2Own resources % 38.3 39.9 36.7 41.1 34.8 21.6 30.2 33.3 36.2 47.6 41.6
Foreign government % 1.7 1.7 1.7 0.2 3.0 11.2 1.1 0.6 0.0 0.0 0.3
Employer % 1.4 1.7 1.0 1.5 1.3 0.4 0.5 1.2 1.4 0.0 1.6
Other % 0.2 0.1 0.3 0.2 0.0 0.3 0.0 1.9 0.0 4.8 0.1
EDUCATION N 5,669 1,993 3,676 5,085 111 470 155 624 253 50 4,074Teaching assistantships % 6.5 6.6 6.4 5.8 13.5 11.9 9.0 3.2 6.3 4.0 6.4
Research assistantships/Traineeships % 5.5 5.2 5.7 4.7 6.3 14.3 8.4 4.0 5.1 2.0 4.8Fellowships/Dissertation grants % 8.0 7.9 8.1 6.8 12.6 19.4 18.1 12.8 18.6 10.0 4.9
Own resources % 68.8 65.0 70.8 72.3 58.6 33.2 58.7 72.4 63.2 66.0 72.9Foreign government % 1.6 2.6 1.0 0.1 3.6 17.2 0.6 0.2 0.4 2.0 0.1
Employer % 9.0 12.0 7.3 9.6 3.6 3.2 3.9 7.1 4.3 12.0 10.4
Other % 0.7 0.7 0.7 0.6 1.8 0.9 1.3 0.3 2.0 4.0 0.6
PROF/OTHER FIELDS N 2,015 1,161 854 1,417 103 494 103 120 54 5 1,215
Teaching assistantships % 19.4 21.4 16.7 17.1 21.4 25.5 19.4 15.8 13.0 20.0 17.8Research assistantships/Traineeships % 10.8 10.9 10.8 8.6 14.6 16.4 16.5 5.8 7.4 20.0 8.7Fellowships/Dissertation grants % 14.4 14.5 14.4 12.6 18.4 18.8 13.6 26.7 16.7 0.0 11.7
Own resources % 45.1 41.4 50.1 54.1 33.0 21.9 39.8 42.5 59.3 60.0 54.0Foreign government % 4.1 5.1 2.7 0.1 4.9 15.2 4.9 0.0 0.0 0.0 0.1
Employer % 5.8 6.3 5.0 7.1 6.8 1.8 3.9 9.2 3.7 0.0 7.4
Other % 0.4 0.5 0.2 0.4 1.0 0.4 1.9 0.0 0.0 0.0 0.3
° Includes Pacific Islander.°Includes Alaskan Native.'Includes mathematics and computer sciences.
Source: NSF/NIH/NEH/USED/USDNNASA, Survey of Earned Doctorates
49 6

Tab
le 2
0. C
umul
ativ
e de
bt r
elat
ed to
the
educ
atio
n of
the
doct
orat
e re
cipi
ents
, by
broa
d fie
ld, 2
000
Cum
ulat
ive
Deb
tT
otal
Phy
sica
l Sci
ence
s a
Eng
inee
ring
Life
Sci
ence
sS
ocia
l Sci
ence
sH
uman
ities
Edu
catio
nP
rof/O
ther
Fie
lds
$5,0
00 o
r le
ss3,
284
8.8
538
9.7
415
8.6
746
9.5
460
7.2
472
9.1
478
8.3
175
8.7
$5,0
01-$
10,0
002,
859
7.6
467
8.4
319
6.6
674
8.6
469
7.4
443
8.6
364
6.3
123
6.1
$10,
001-
$15,
000
2,30
96.
235
06.
325
55.
355
97.
139
66.
237
97.
325
64.
511
45.
6$1
5,00
1-$2
0,00
02,
025
5.4
253
4.6
179
3.7
470
6.0
392
6.2
349
6.8
264
4.6
118
5.8
$20,
001-
$25,
000
1,54
34.
118
93.
413
72.
930
63.
931
14.
926
55.
123
94.
296
4.8
$25,
001-
$30,
000
1,36
43.
612
22.
211
12.
324
63.
135
55.
624
34.
721
13.
776
3.8
$30,
000+
5,64
715
.142
37.
642
78.
988
111
.21,
726
27.2
924
17.9
893
15.5
373
18.5
No
debt
18,4
8249
.33,
197
57.7
2,96
261
.64,
001
50.8
2,24
735
.42,
085
40.4
3,04
452
.994
646
.8T
otal
37,5
1310
0.0
5,53
910
0.0
4,80
510
0.0
7,88
310
0.0
6,35
610
0.0
5,16
010
0.0
5,74
910
0.0
2,02
110
0.0
Incl
udes
mat
hem
atic
s an
d co
mpu
ter
scie
nces
.
Sou
rce:
NS
F/N
IH/U
SE
D/N
EH
/US
DA
/NA
SA
, Sur
vey
of E
arne
d D
octo
rate
s
Tab
le 2
1. C
umul
ativ
e de
bt r
elat
ed to
the
educ
atio
n of
the
doct
orat
e re
cipi
ents
, by
dem
ogra
phic
gro
up, 2
000
Cum
ulat
ive
Deb
t
Sex
Citi
zens
hip
Rac
e/E
thni
city
(U
.S. c
itize
ns a
nd P
erm
ane
nt R
esid
ents
)M
ale
Fem
ale
U.S
. citi
zen
Per
m V
isa
Tem
p V
isa
Asi
an a
Bla
ckH
ispa
nic
Am
er In
dian
bW
hite
$5,0
00 o
r le
ss1,
918
9.1
1,36
68.
32,
258
8.5
127
6.9
896
9.9
156
7.1
162
9.7
107
8.8
106.
21,
924
8.4
$5,0
01-$
10,0
001,
645
7.8
1,21
47.
42,
236
8.4
103
5.6
518
5.7
173
7.9
135
8.1
104
8.6
148.
61,
882
8.3
$10,
001-
$15,
000
1,30
36.
21,
006
6.1
1,87
67.
195
5.2
334
3.7
148
6.7
122
7.3
756.
24
2.5
1,59
17.
0$1
5,00
1-$2
0,00
01,
117
5.3
908
5.5
1,73
06.
569
3.8
222
2.5
115
5.2
112
6.7
766.
314
8.6
1,46
06.
4$2
0,00
1-$2
5,00
084
04.
070
34.
31,
325
5.0
432.
317
41.
985
3.9
794.
887
7.2
116.
81,
099
4.8
$25,
001-
$30,
000
722
3.4
642
3.9
1,18
04.
443
2.3
139
1.5
552.
512
47.
575
6.2
84.
994
24.
1$3
0,00
0+2,
945
14.0
2,70
216
.44,
750
17.9
159
8.7
732
8.1
244
11.1
499
30.0
282
23.2
3823
.53,
785
1.6.
6N
o de
bt10
,569
50.2
7,91
248
.111
,234
42.3
1,19
265
.16,
031
66.7
1,22
355
.643
025
.940
933
.763
38.9
10,0
9744
.3T
otal
21,0
5910
0.0
16,4
5310
0.0
26,5
8910
0.0
1,83
110
0.0
9,04
610
0.0
2,19
910
0.0
1,66
310
0.0
1,21
510
0.0
162
100.
022
,780
100.
0
a In
clud
es P
acifi
cIs
land
erb
Incl
udes
Ala
skan
Nat
ive
Sou
rce:
NS
F/N
IH/U
SE
D/N
EH
/US
DN
NA
SA
, Sur
vey
of E
arne
d D
octo
rate
s
63G
I50

Table 22. Postgraduation status of doctorate recipients, by broad field for selected years, 1980-2000
AllFields
PhysicalSciences a Engineering
LifeSciences
SocialSciences Humanities Education
Prof/OtherFields
Total1980 N 31,020 4,111 2,479 5,461 5,855 3,872 7,586 1,6561985 N 31,297 4,531 3,166 5,780 5,765 3,429 6,733 1,8931990 N 36,067 5,859 4,894 6,605 6,093 3,822 6,510 2,2841995 N 41,742 6,808 6,008 7,917 6,635 5,061 6,649 2,6642000 N 41,368 6,077 5,330 8,529 7,115 5,634 6,420 2,263 b
Total Responses to Postgraduation Status1980 N 28,748 3,837 2,262 5,099 5,418 3,542 7,050 1,5401985 N 28,384 4,096 2,741 5,316 5,181 3,140 6,210 1,7001990 N 32,709 5,275 4,304 6,076 5,497 3,488 5,993 2,0761995 N 37,971 6,231 5,385 7,237 6,025 4,677 5,999 2,4172000 N 37,551 5,527 4,796 7,916 6,370 5,159 5,747 2,036
Definite Commitments for Employment or Study1980 % 76.2 80.3 81.1 79.0 73.7 64.8 76.2 85.21985 % 73.8 77.9 72.3 75.6 70.6 64.7 75.1 82.61990 % 71.6 72.9 65.9 74.6 69.1 66.0 74.6 78.31995 % 65.8 64.3 57.0 70.4 65.3 58.1 72.9 73.32000 % 71.1 74.1 69.7 72.5 69.9 61.5 75.2 78.1
Seeking Employment or Study1980 % 23.8 19.7 18.9 21.0 26.3 35.2 23.8 14.81985 % 26.2 22.1 27.7 24.4 29.4 35.3 24.9 17.41990 % 28.4 27.1 34.1 25.4 30.9 34.0 25.4 21.71995 % 34.2 35.7 43.0 29.6 34.7 41.9 27.1 26.72000 % 28.9 25.9 30.3 27.5 30.1 38.5 24.8 21.9
a Includes mathematics and computer sciences.b Includes 5 persons for whom field is unknown.
Source: NSF/NIH/USED/NEH/USDNNASA, Survey of Earned Doctorates
70 351
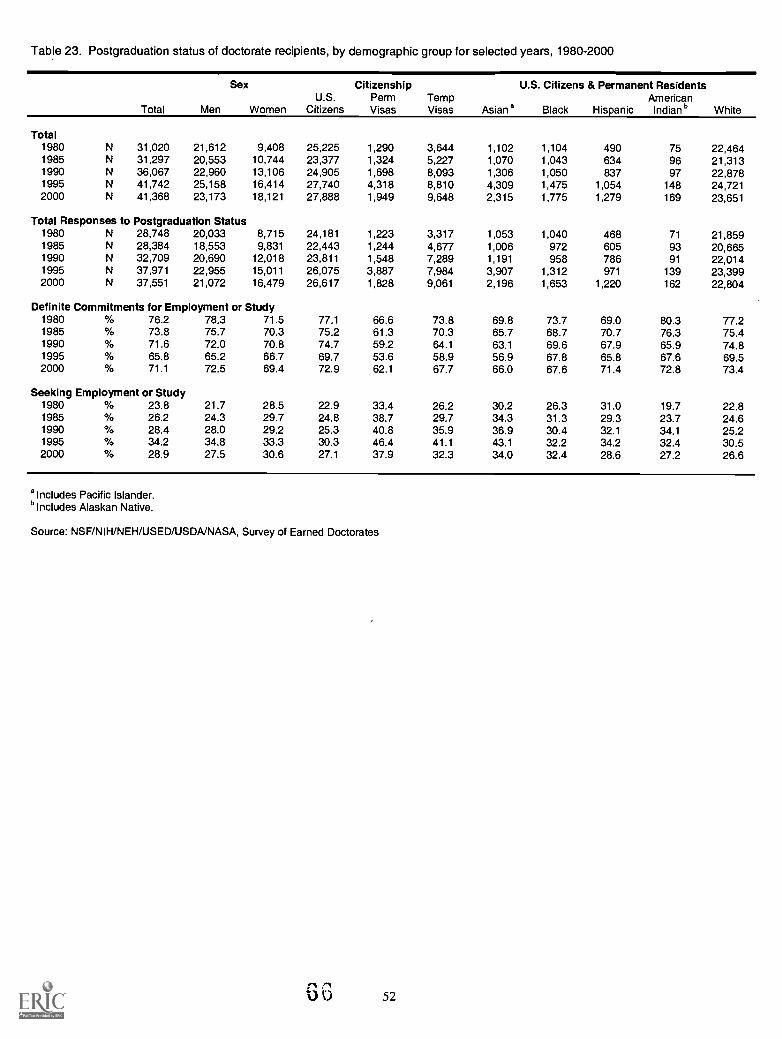
Table 23. Postgraduation status of doctorate recipients, by demographic group for selected years, 1980-2000
Total
Sex
Men WomenU.S.
Citizens
CitizenshipPermVisas
TempVisas Asian a
U.S. Citizens & Permanent ResidentsAmerican
Black Hispanic Indian b White
Total1980 N 31,020 21,612 9,408 25,225 1,290 3,644 1,102 1,104 490 75 22,4641985 N 31,297 20,553 10,744 23,377 1,324 5,227 1,070 1,043 634 96 21,3131990 N 36,067 22,960 13,106 24,905 1,698 8,093 1,306 1,050 837 97 22,8781995 N 41,742 25,158 16,414 27,740 4,318 8,810 4,309 1,475 1,054 148 24,7212000 N 41,368 23,173 18,121 27,888 1,949 9,648 2,315 1,775 1,279 169 23,651
Total Responses to Postgraduation Status1980 N 28,748 20,033 8,715 24,181 1,223 3,317 1,053 1,040 468 71 21,8591985 N 28,384 18,553 9,831 22,443 1,244 4,677 1,006 972 605 93 20,6651990 N 32,709 20,690 12,018 23,811 1,548 7,289 1,191 958 786 91 22,0141995 N 37,971 22,955 15,011 26,075 3,887 7,984 3,907 1,312 971 139 23,3992000 N 37,551 21,072 16,479 26,617 1,828 9,061 2,196 1,653 1,220 162 22,804
Definite Commitments for Employment or Study1980 % 76.2 78.3 71.5 77.1 66.6 73.8 69.8 73.7 69.0 80.3 77.21985 % 73.8 75.7 70.3 75.2 61.3 70.3 65.7 68.7 70.7 76.3 75.41990 % 71.6 72.0 70.8 74.7 59.2 64.1 63.1 69.6 67.9 65.9 74.81995 % 65.8 65.2 66.7 69.7 53.6 58.9 56.9 67.8 65.8 67.6 69.52000 % 71.1 72.5 69.4 72.9 62.1 67.7 66.0 67.6 71.4 72.8 73.4
Seeking Employment or Study1980 % 23.8 21.7 28.5 22.9 33.4 26.2 30.2 26.3 31.0 19.7 22.81985 % 26.2 24.3 29.7 24.8 38.7 29.7 34.3 31.3 29.3 23.7 24.61990 % 28.4 28.0 29.2 25.3 40.8 35.9 36.9 30.4 32.1 34.1 25.21995 % 34.2 34.8 33.3 30.3 46.4 41.1 43.1 32.2 34.2 32.4 30.52000 % 28.9 27.5 30.6 27.1 37.9 32.3 34.0 32.4 28.6 27.2 26.6
a Includes Pacific Islander.b Includes Alaskan Native.
Source: NSF/NIH/NEH/USED/USDNNASA, Survey of Earned Doctorates
r 652
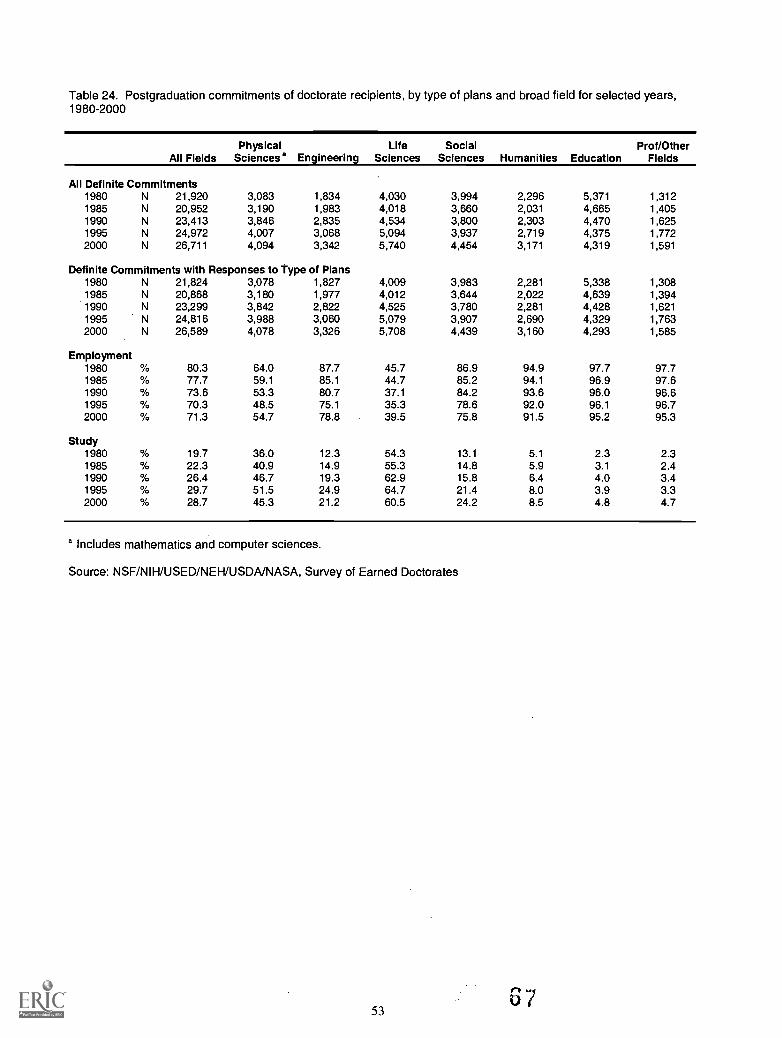
Table 24. Postgraduation commitments of doctorate recipients, by type of plans and broad field for selected years,1980-2000
All FieldsPhysical
Sciences a EngineeringLife
SciencesSocial
Sciences Humanities EducationProf/Other
Fields
All Definite Commitments1980 N 21,920 3,083 1,834 4,030 3,994 2,296 5,371 1,3121985 N 20,952 3,190 1,983 4,018 3,660 2,031 4,665 1,4051990 N 23,413 3,846 2,835 4,534 3,800 2,303 4,470 1,6251995 N 24,972 4,007 3,068 5,094 3,937 2,719 4,375 1,7722000 N 26,711 4,094 3,342 5,740 4,454 3,171 4,319 1,591
Definite Commitments with Responses to Type of Plans1980 N 21,824 3,078 1,827 4,009 3,983 2,281 5,338 1,3081985 N 20,868 3,180 1,977 4,012 3,644 2,022 4,639 1,3941990 N 23,299 3,842 2,822 4,525 3,780 2,281 4,428 1,6211995 N 24,816 3,988 3,060 5,079 3,907 2,690 4,329 1,7632000 N 26,589 4,078 3,326 5,708 4,439 3,160 4,293 1,585
Employment1980 80.3 64.0 87.7 45.7 86.9 94.9 97.7 97.71985 77.7 59.1 85.1 44.7 85.2 94.1 96.9 97.61990 73.6 53.3 80.7 37.1 84.2 93.6 96.0 96.61995 70.3 48.5 75.1 35.3 78.6 92.0 96.1 96.72000 71.3 54.7 78.8 39.5 75.8 91.5 95.2 95.3
Study1980 19.7 36.0 12.3 54.3 13.1 5.1 2.3 2.31985 22.3 40.9 14.9 55.3 14.8 5.9 3.1 2.41990 26.4 46.7 19.3 62.9 15.8 6.4 4.0 3.41995 29.7 51.5 24.9 64.7 21.4 8.0 3.9 3.32000 28.7 45.3 21.2 60.5 24.2 8.5 4.8 4.7
a Includes mathematics and computer sciences.
Source: NSF/NIH/USED/NEH/USDA/NASA, Survey of Earned Doctorates
53

Table 25. Postgraduation commitments of doctorate recipients, by type of plans and demographic group for selected years, 1980-2000
Total Male FemaleU.S.
CitizenPermVisa
TempVisa
U.S. Citizens and Permanent ResidentsAmerican
Asian a Black Hispanic lndianb White
All Definite Commitments1980 N 21,920 15,690 6,230 18,637 815 2,449 735 766 323 57 16,8681985 N 20,952 14,042 6,910 16,883 763 3,289 661 668 428 71 15,5901990 N 23,413 14,898 8,514 17,784 916 4,670 751 667 534 60 16,4741995 N 24,972 14,960 10,010 18,169 2,082 4,701 2,223 890 639 94 16,2552000 N 26,711 15,276 11,435 19,414 1,136 6,136 1,449 1,117 871 118 16,729
Definite Commitments with Responses to Type of Plans1980 N 21,824 15,622 6,202 18,575 813 2,417 734 755 322 57 16,8221985 N 20,868 13,985 6,883 16,827 757 3,267 657 659 425 70 15,5491990 N 23,299 14,823 8,475 17,705 911 4,640 749 661 531 60 16,4021995 N 24,816 14,877 9,937 18,059 2,068 4,669 2,207 877 631 93 16,1722000 N 26,589 15,202 11,387 19,347 1,127 6,093 1,440 1,111 864 116 16,679
Employment1980 % 80.3 79.3 82.8 81.0 77.2 76.0 73.7 93.8 87.0 86.0 80.61985 % 77.7 76.2 80.9 78.6 79.1 72.8 73.8 90.4 83.5 81.4 78.21990 % 73.6 71.4 77.4 76.4 69.4 63.3 65.0 87.0 77.6 86.7 76.21995 % 70.3 67.4 74.5 74.2 52.3 62.9 50.8 82.7 72.9 74.2 74.32000 % 71.3 69.6 73.6 74.0 68.9 63.3 62.1 81.6 71.4 79.3 74.3
Study1980 % 19.7 20.7 17.2 19.0 22.8 24.0 26.3 6.2 13.0 14.0 19.41985 % 22.3 23.8 19.1 21.4 20.9 27.2 26.2 9.6 16.5 18.6 21.81990 % 26.4 28.6 22.6 23.6 30.6 36.7 35.0 13.0 22.4 13.3 23.81995 % 29.7 32.6 25.5 25.8 47.7 37.1 49.2 17.3 27.1 25.8 25.72000 % 28.7 30.4 26.4 26.0 31.1 36.7 37.9 18.4 28.6 20.7 25.7
a Includes Pacific Islander.b Includes Alaskan Native.
Source: NSF/NIH/USED/NEH/USDA/NASA, Survey of Earned Doctorates
54

Table 26. Postdoctoral location of non-U.S. citizen doctorate recipients with postgraduation commitments, by major field and visastatus, 2000
Permanent Vis Temporary Vis
Resp. tolocation/type of
U.S.Location
ForeignLocation Resp. to
location/type of
U.S.Location
ForeignLocation
Employ Study Employ Study Employ Study Employ StudyField plans (%) (%) (e/e) (%) plans (%) (%) (%) (%)
All Fields 1,123 62.6 29.6 6.3 1.5 6,067 39.1 30.8 24.2 5.9
Physical Sciences a 232 64.7 31.0 3.0 1.3 1,414 38.9 42.8 10.6 7.7
Physics & Astronomy 48 52.1 43.8 2.1 2.1 318 33.0 50.6 6.3 10.1
Chemistry 78 57.7 38.5 3.8 0.0 428 24.5 61.2 8.4 5.8
Earth, Atmos., & Marine Sci. 20 45.0 50.0 0.0 5.0 123 21.1 43.9 22.8 12.2
Mathematics 33 78.8 21.2 0.0 0.0 298 43.0 35.2 10.7 11.1
Computer Sciences 53 84.9 7.5 5.7 1.9 247 75.3 9.3 13.8 1.6
Engineering 222 79.7 16.2 2.7 1.4 1,502 58.1 20.1 18.6 3.2
Life Sciences 290 31.7 61.7 5.5 1.0 1,449 14.8 58.3 20.4 6.5
Biological Sciences 215 20.5 76.3 1.9 1.4 939 9.3 76.1 9.3 5.3
Health Sciences 43 76.7 11.6 11.6 0.0 219 35.2 18.3 41.6 5.0
Agricultural Sciences 32 46.9 31.3 21.9 0.0 291 17.5 30.9 40.2 11.3
Social Sciences 124 62.9 21.8 13.7 1.6 685 45.8 10.4 39.0 4.8
Psychology 37 51.4 35.1 10.-8 2.7 99 39.4 32.3 18.2 10.1
Anthropology 8 37.5 37.5 25.0 0.0 31 29.0 9.7 45.2 16.1
Economics 30 70.0 10.0 20.0 0.0 345 51.3 4.1 42.3 2.3
Political ScilInt'l Relations 10 60.0 20.0 20.0 0.0 57 36.8 5.3 54.4 3.5Sociology 16 75.0 12.5 . 12.5 0.0 54 37.0 7.4 46.3 9.3Other Social Sciences 23 73.9 17.4 4.3 4.3 99 48.5 15.2 33.3 3.0
Humanities 124 86.3 1.6 9.7 2.4 378 42.6 6.1 43.9 7.4History 13 61.5 0.0 30.8 7.7 40 30.0 12.5 37.5 20.0English Language & Lit 13 92.3 0.0 0.0 7.7 32 31.3 3.1 62.5 3.1
Foreign Language & Lit 35 94.3 5.7 0.0 0.0 78 70.5 7.7 17.9 3.8Other Humanities 63 85.7 0.0 12.7 1.6 228 36.8 4.8 51.3 7.0
Education 67 77.6 11.9 7.5 3.0 283 23.0 4.9 59.7 12.4Teacher Education 5 100.0 0.0 0.0 0.0 17 11.8 0.0 70.6 17.6
Teaching Fields 10 80.0 0.0 20.0 0.0 71 23.9 4.2 52.1 19.7Other Education 52 75.0 15.4 5.8 3.8 195 23.6 5.6 61.5 9.2
ProfessionaVOther 64 73.4 12.5 12.5 1.6 356 54.5 3.1 39.6 2.8Business & Management 37 70.3 10.8 18.9 0.0 230 61.7 1.7 34.8 1.7Communications 7 100.0 0.0 0.0 0.0 43 48.8 4.7 44.2 2.3Other Professional Fields 20 70.0 20.0 5.0 5.0 83 37.3 6.0 50.6 6.0
NOTE: Only non-U.S. citizen doctorate recipients with definite commitments are included. Percentages are bas.,d on the number of doctorate recipients whoreported a definite commitment and a location. See technical notes in Appendix C for rates of nonresponse to the applicable survey questions and for furtherexplanation of postgraduation plans.
a Includes mathematics and computer sciences.
Source: NSF/NIH/USED/NEH/USDNNASA, Survey of Earned Doctorates
55

Table 27. Postdoctoral location of non-U.S. citizen doctorate recipients with postgraduation commitments,by visa status for selected years, 1980-2000
AllNon-U.S.Citizens
PermanentVisa
TemporaryVisa
All Definite Commitments1980 N 3,264 815 2,4491985 N 4,052 763 3,2891990 N 5,586 916 4,6701995 N 6,783 2,082 4,7012000 N 7,272 1,136 6,136
Definite Commitments with Responses to Location1980 N 3,059 762 2,2971985 N 3,712 706 3,0061990 N 5,133 823 4,3101995 N 6,731 2,065 4,6662000 N 7,235 1,130 6,105
U.S. Location1980 % 52.9 93.3 39.41985 % 54.6 89.7 46.41990 % 59.0 86.1 53.91995 % 65.1 91.6 53.42000 % 73.3 92.0 69.9
Foreign Location1980 % 47.1 6.7 60.61985 % 45.4 10.3 53.61990 % 41.0 13.9 46.11995 % 34.9 8.4 46.62000 % 26.7 8.0 30.1
NOTE: Only non-U.S. citizen doctorate recipients with definite commitments are included."All Definite Commitments" includes recipients who reported definite commitments, but notlocation (U.S. or foreign). Percentages are based on the number of doctorate recipientswho reported a definite commitment and a location (U.S. versus foreign).
Source: NSF/NIH/USED/NEH/USDNNASA, Survey of Earned Doctorates
7 056
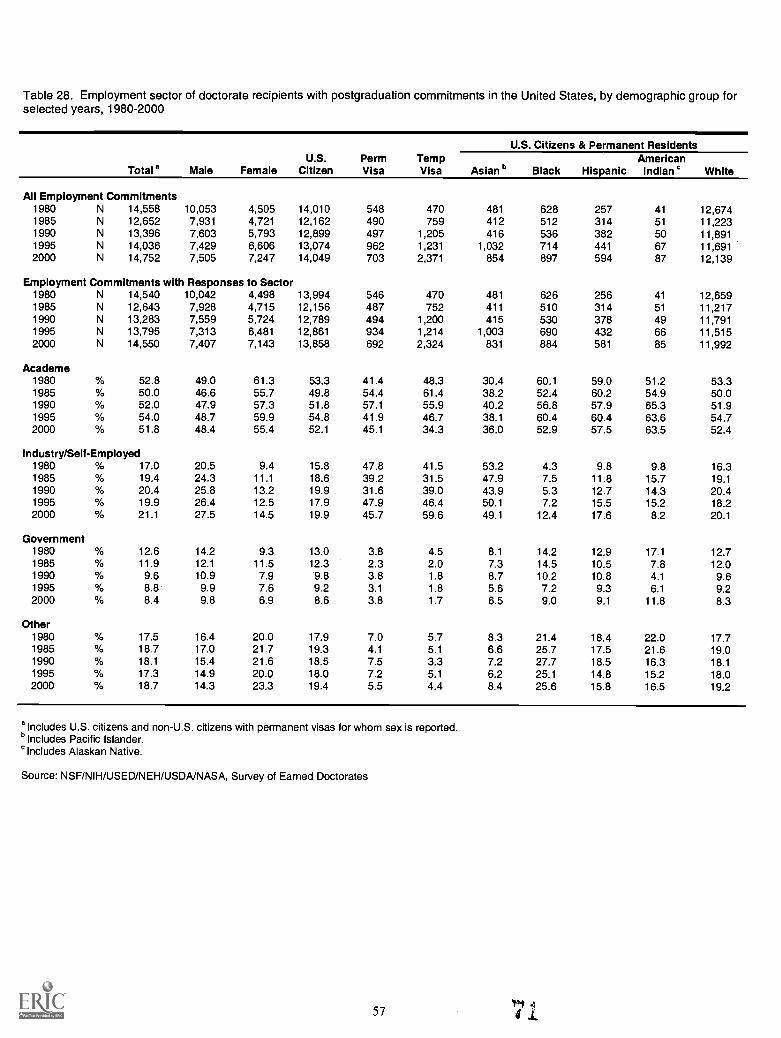
Table 28. Employment sector of doctorate recipients with postgraduation commitments in the United States, by demographic group forselected years, 1980-2000
Total a Male FemaleU.S.
CitizenPermVisa
TempVisa
U.S. Citizens & Permanent Residents
AslanbAmerican
Black Hispanic Indian ` White
All Employment Commitments1980 N 14,558 10,053 4,505 14,010 548 470 481 628 257 41 12,6741985 N 12,652 7,931 4,721 12,162 490 759 412 512 314 51 11,2231990 N 13,396 7,603 5,793 12,899 497 1,205 416 536 382 50 11,8911995 N 14,036 7,429 6,606 13,074 962 1,231 1,032 714 441 67 11,6912000 N 14,752 7,505 7,247 14,049 703 2,371 854 897 594 87 12,139
Employment Commitments with Responses to Sector1980 N 14,540 10,042 4,498 13,994 546 470 481 626 256 41 12,6591985 N 12,643 7,928 4,715 12,156 487 752 411 510 314 51 11,2171990 N 13,283 7,559 5,724 12,789 494 1,200 415 530 378 49 11,7911995 N 13,795 7,313 6,481 12,861 934 1,214 1,003 690 432 66 11,5152000 N 14,550 7,407 7,143 13,858 692 2,324 831 884 581 85 11,992
Academe1980 % 52.8 49.0 61.3 53.3 41.4 48.3 30.4 60.1 59.0 51.2 53.31985 % 50.0 46.6 55.7 49.8 54.4 61.4 38.2 52.4 60.2 54.9 50.01990 % 52.0 47.9 57.3 51.8 57.1 55.9 40.2 56.8 57.9 65.3 51.91995 % 54.0 48.7 59.9 54.8 41.9 46.7 38.1 60.4 60.4 63.6 54.72000 % 51.8 48.4 55.4 52.1 45.1 34.3 36.0 52.9 57.5 63.5 52.4
Industry/Self-Employed1980 % 17.0 20.5 9.4 15.8 47.8 41.5 53.2 4.3 9.8 9.8 16.31985 % 19.4 24.3 11.1 18.6 39.2 31.5 47.9 7.5 11.8 15.7 19.11990 % 20.4 25.8 13.2 19.9 31.6 39.0 43.9 5.3 12.7 14.3 20.41995 % 19.9 26.4 12.5 17.9 47.9 46.4 50.1 7.2 15.5 15.2 18.22000 % 21.1 27.5 14.5 19.9 45.7 59.6 49.1 12.4 17.6 8.2 20.1
Government1980 % 12.6 14.2 9.3 13.0 3.8 4.5 8.1 14.2 12.9 17.1 12.71985 % 11.9 12.1 11.5 12.3 2.3 2.0 7.3 14.5 10.5 7.8 12.01990 % 9.6 10.9 7.9 9.8 3.8 1.8 8.7 10.2 10.8 4.1 9.61995 % 8.8 9.9 7.6 9.2 3.1 1.8 5.6 7.2 9.3 6.1 9.22000 % 8.4 9.8 6.9 8.6 3.8 1.7 6.5 9.0 9.1 11.8 8.3
Other1980 % 17.5 16.4 20.0 17.9 7.0 5.7 8.3 21.4 18.4 22.0 17.71985 % 18.7 17.0 21.7 19.3 4.1 5.1 6.6 25.7 17.5 21.6 19.01990 % 18.1 15.4 21.6 18.5 7.5 3.3 7.2 27.7 18.5 16.3 18.11995 % 17.3 14.9 20.0 18.0 7.2 5.1 6.2 25.1 14.8 15.2 18.02000 % 18.7 14.3 23.3 19.4 5.5 4.4 8.4 25.6 15.8 16.5 19.2
a Includes U.S. citizens and non-U.S. citizens with permanent visas for whom sex is reported.b Includes Pacific Islander.a Includes Alaskan Native.
Source: NSF/NIH/USED/N EH/USDA/NASA, Survey of Earned Doctorates
57 4

APPENDICES
59
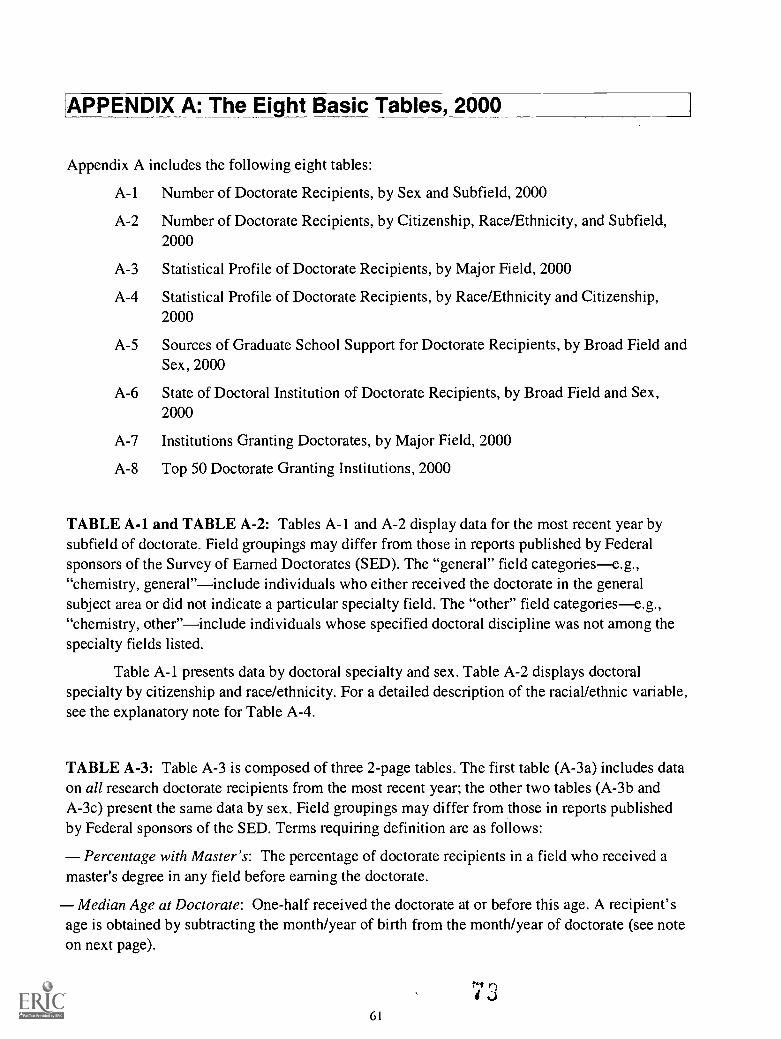
APPENDIX A: The Eight Basic Tables 2000
Appendix A includes the following eight tables:
A-1 Number of Doctorate Recipients, by Sex and Subfield, 2000
A-2 Number of Doctorate Recipients, by Citizenship, Race/Ethnicity, and Subfield,2000
A-3 Statistical Profile of Doctorate Recipients, by Major Field, 2000
A-4 Statistical Profile of Doctorate Recipients, by Race/Ethnicity and Citizenship,2000
A-5 Sources of Graduate School Support for Doctorate Recipients, by Broad Field andSex, 2000
A-6 State of Doctoral Institution of Doctorate Recipients, by Broad Field and Sex,2000
A-7 Institutions Granting Doctorates, by Major Field, 2000
A-8 Top 50 Doctorate Granting Institutions, 2000
TABLE A-1 and TABLE A-2: Tables A-1 and A-2 display data for the most recent year bysubfield of doctorate. Field groupings may differ from those in reports published by Federalsponsors of the Survey of Earned Doctorates (SED). The "general" field categoriese.g.,"chemistry, general"include individuals who either received the doctorate in the generalsubject area or did not indicate a particular specialty field. The "other" field categoriese.g.,"chemistry, other"include individuals whose specified doctoral discipline was not among thespecialty fields listed.
Table A-1 presents data by doctoral specialty and sex. Table A-2 displays doctoralspecialty by citizenship and race/ethnicity. For a detailed description of the racial/ethnic variable,see the explanatory note for Table A-4.
TABLE A-3: Table A-3 is composed of three 2-page tables. The first table (A-3a) includes dataon all research doctorate recipients from the most recent year; the other two tables (A-3b andA-3c) present the same data by sex. Field groupings may differ from those in reports publishedby Federal sponsors of the SED. Terms requiring definition are as follows:
Percentage with Master's: The percentage of doctorate recipients in a field who received amaster's degree in any field before earning the doctorate.
Median Age at Doctorate: One-half received the doctorate at or before this age. A recipient'sage is obtained by subtracting the month/year of birth from the month/year of doctorate (see noteon next page).
61

Median Time Lapse: "Total Time" refers to the total calendar time elapsed between themonth/year of baccalaureate and the month/year of doctorate. "Registered Time" refers to theactual time in attendance at colleges and universities between receipt of the baccalaureate and thedoctorate.
Postgraduation Plans: Each year's doctorate recipients provide information on post-graduation employment or study plans in response to items B1 through B9 on the survey form.Since the questionnaire is filled out around the time the doctorate is awarded, a recipient's plansare subject to change. However, comparisons with the longitudinal Survey of DoctorateRecipients (SDR) have shown SED data to be a reasonable indicator of actual employment statusin the year following the doctorate, although results vary by sector. (The SDR is a follow-upemployment survey of a sample of doctorate recipients in science, engineering, and, until 1995,humanities fields.)
In Table A-3 the postgraduation plans of doctorate recipients are grouped as follows:"Postdoctoral Study Plans" (fellowship, research internship, traineeship, other), "PlannedEmployment after Doctorate" (educational institution, industry, etc.), and "Postdoctoral PlansUnknown." These categories include recipients who were still negotiating or seeking positions atthe time of survey completion, as well as those whose plans were definite. The sum of these linesequals 100 percent for each column, with allowance for rounding: for example, 33.5 percent ofall agricultural sciences doctorate recipients had postdoctoral study plans, 59.0 percent plannedto be employed, and 7.6 percent did not report their post-graduation plans, totaling 100.1 percent.The additional .1 percent is due to the fact that the exact figure for each type of postdoctoralplans is not exact, but has been rounded (e.g. the actual figure for employment plans is 58.98618which rounds to 59.0). The postdoctoral study row is further subdivided by type of study orappointment (fellowships, research associateships, traineeships, and other study). Thepercentages in these subdivisions sum to the percent of respondents in the given column whoreported plans for postdoctoral study. The employment row is similarly subdivided by type ofemployer. The percentages for these rows add to percentage of respondents in the given columnwho planned employment. The category for educational institutions includes elementary andsecondary schools as well as colleges and universities, and the category for government includesmilitary service.
The four lines of data beginning with "Definite Postdoctoral Study" distinguish betweenindividuals who had definite postgraduation plans at the time of survey completion (item B I:"Am returning to, or continuing in, predoctoral employment" or "Have signed contract or madedefinite commitment") and those who were still seeking employment or postdoctoral study(item B I: "Am negotiating with one or more specific organizations," "Am seeking position buthave no specific prospects," or "Other"). These four lines, when added to the prior line,"Postdoctoral Plans Unknown," total 100 percent with allowance for rounding. The two lines"Definite Postdoctoral Study" and "Seeking Postdoctoral Study" add to give the percentage for"Postdoctoral Study Plans"; the two lines "Definite Employment" and "Seeking Employment"add to give the percentage for "Planned Employment After Doctorate."
62

Percentages showing the distribution of doctorate recipients by postdoctoral work activityand region of employment are based only on the number of recipients who had definiteemployment commitments at the time they completed the questionnaire. These percentagesexclude recipients who planned postdoctoral study (as described above) and recipients who werestill seeking employment at the time they completed the questionnaire. (Note that the rows onspecific postdoctoral study and employment plans discussed earlier include individuals whoseplans were not definite.)
The U.S. regions of employment shown in Table A-3 include the following states andterritories:
New England: Connecticut, Maine, Massachusetts, New Hampshire,Rhode Island, Vermont
Middle Atlantic: New Jersey, New York, Pennsylvania
East North Central: Illinois, Indiana, Michigan, Ohio, Wisconsin
West North Central: Iowa, Kansas, Minnesota, Missouri, Nebraska, NorthDakota, South Dakota
South Atlantic: Delaware, District of Columbia, Florida, Georgia,Maryland, North Carolina, South Carolina, Virginia, WestVirginia
East South Central: Alabama, Kentucky, Mississippi, Tennessee
West South Central: Arkansas, Louisiana, Oklahoma, Texas
Mountain: Arizona, Colorado, Idaho, Montana, Nevada, New Mexico,Utah, Wyoming
Pacific & Insular: Alaska, California, Hawaii, Oregon, Washington, AmericanSamoa, Guam, Puerto Rico, Trust Territory, Virgin Islands
TABLE A-4: Table A-4 contains data by race/ethnicity and citizenship for selected variablesincluded in Tables A-3 and A-5. Field groupings may differ from those in reports published byFederal sponsors of the SED.
The racial/ethnic question has undergone several revisions over the years. In 1977 it wasmodified to correspond to a standard question format recommended by the Federal InteragencyCommittee on Education and adopted by the Office of Management and Budget (OMB) for usein Federally sponsored surveys; an explanation of the effect of these changes is detailed onpage 13 of Summary Report 1977. (Note: Changes in the OMB guidelines prompted thereclassification of persons having origins in the Indian subcontinent from the white category tothe Asian category.) In 1980 the item was further revised in two ways: (1) the Hispanic categorywas subdivided into Puerto Rican, Mexican American, and other Hispanic to provide more detailfor users of the racial/ethnic data; and (2) respondents were asked to check only one racial
633

category. (Before 1980, doctorate recipients could check more than one category to indicate theirrace.)
The item was modified again in 1982 to separate the questions on race and ethnicity.Since then respondents have been asked to first indicate whether or not they are Hispanic, andthen check one of the four racial group categories (American Indian, Asian, black, or white). InTable A-4, doctorate recipients who reported Hispanic heritage, regardless of racial designation,are included in one of three Hispanic groups: Puerto Rican, Mexican American, or otherHispanic. The remaining survey respondents are then counted in the respective racial groups.(Note: Doctorate recipients who checked the category "American Indian or Alaskan Native" areidentified as American Indian in this report.)
In the section of "Doctoral Program Support" a recipient counts in more than onecategory if support was received from multiple sources. Because a student counts more than oncefor sources of support, the vertical percentages sum to more than 100 percent. See theexplanatory note on Appendix Table A-5 for further detail. (Data on the primary source ofsupport for doctorate recipients are presented in the body of the report.)
The other sections in Table A-4 correspond to many of those in Appendix Table A-3. Thereader is referred to the explanatory note on Table A-3 for additional information.
TABLE A-5: Table A-5 displays data reported in item All on financial resources used insupport of the respondent's doctoral program, by broad field and sex of recipient. Field groupingsmay differ from those in reports published by Federal sponsors of the SED.
A recipient counts in more than one category in Table A-5 if more than one financialresource was reported. Because a student counts once for each of his/her financial resources, thevertical percentages sum to more than 100 percent. (Data on the primary financial resources fordoctorate recipients are presented in the body of the report.) Please consult Appendix C:Technical Notes for additional information on changes in the coding of Sources ofSupport/Financial Resources.
TABLE A-6: Table A-6 shows, by broad field and sex, the number of persons receiving aresearch doctorate in the most recent year from institutions in each of the 50 states, the District ofColumbia, and Puerto Rico. Field groupings may differ from those in reports published byFederal sponsors of the SED. See Appendix E of the Summary Report for a description of fieldgroupings as reported in this table; see the questionnaire's Specialties List in Appendix D of theSummary Report for the names and codes of the subfields included.
TABLE A-7: Table A-7 displays data by doctorate-granting institution and major field. Itincludes all institutions in the United States (the 50 states, the District of Columbia, and PuertoRico) that awarded research doctoral degrees in the most recent year. Field groupings may differ
64

from those in reports published by Federal sponsors of the SED and from departmentaldesignations at institutions.
TABLE A-8: Table A-8 presents the 50 doctorate granting institutions which conferred thegreatest number of doctorates in AY 2000. The number of doctorate degrees granted is alsoshown for each ranked institution.
65

APPENDIX TABLE A-1. Number of doctorate recipients, by sex and subfield, 2000
Subfleld of DoctorateNumber of Doctorates
Subfield of DoctorateNumber of Doctorates
Total Men Women Total Men Women
TOTAL ALL FIELDS° 41,368 23,173 18,121 Operations Research 51 40 11
Petroleum 44 37 6PHYSICAL SCIENCES 6,077 4,596 1,466 Polymer/Plastics 62 47 15
Systems 34 28 6MATHEMATICS 1,048 789 258 Engineering, General 43 31 10
Engineering, Other 170 125 44Applied Mathematics 238 179 59Algebra 82 61 21 LIFE SCIENCES 8,529 4,524 3,997Analysis & Functional Analysis 81 66 15Geometry 59 51 8 BIOLOGICAL SCIENCES 5,855 3,228 2,621Logic 19 17 2Number Theory 40 35 5 Biochemistry 777 451 325Mathematical Statistics 194 123 71 Biomedical Sciences 155 85 68Topology 50 40 10 Biophysics 164 115 49Computing Theory & Practice 17 15 2 Biotechnology Research 14 8 6Operations Research 19 16 3 Bacteriology 15 9 6Mathematics, General 150 116 33 Plant Genetics 35 18 17Mathematics, Other 99 70 29 Plant Pathology 25 17 8
Plant Physiology 39 24 15COMPUTER SCIENCE 861 717 142 Botany, Other 92 39 53
Anatomy 40 23 17Computer Science 722 618 104 Biometrics and Biostatistics 92 51 41Information Sciences & Systems 139 99 38 Cell Biology 337 181 155
Ecology 297 181 116PHYSICS & ASTRONOMY 1,392 1,185 204 Developmental Biology/Embryology 111 51 60
Endocrinology 20 12 8Astronomy 80 55 25 Entomology 137 100 37Astrophysics 107 91 16 Biological Immunology 238 123 115Acoustics 10 9 1 Molecular Biology 705 387 318Chemical & Atomic/Molecular 110 89 21 Microbiology 383 193 190Elementary Particles 147 132 15 Neuroscience 495 300 195Fluids 10 10 0 Nutritional Sciences 150 24 126Nuclear 74 65 9 Parasitology 19 11 8Optics 117 99 16 Toxicology 123 65 58Plasma & High-Temperature 38 38 0 Human & Animal Genetics 225 112 113Polymer 21 15 6 Human & Animal Pathology 105 61 44Solid State & Low-Temperature 279 237 42 Human & Animal Pharmacology 267 143 123Physics, General 225 193 31 Human & Animal Physiology 244 143 101Physics, Other 174 152 22 Zoology, Other 133 78 55
Biological Sciences, General 200 117 83CHEMISTRY 1,990 1,362 624 Biological Sciences, Other 218 106 111
Analytical 326 205 121 HEALTH SCIENCES 1,589 524 1,063Inorganic 221 157 64Nuclear 9 6 3 Speech-Lang. Pathology & Audiology 106 27 79Organic 524 384 140 Environmental Health 52 24 28Medicinal/Pharmaceutical 107 55 51 Health Systems/Services Admin. 58 25 33Physical 271 195 76 Public Health 207 75 132Polymer 106 75 31 Epidemiology 190 59 131Theoretical 52 40 12 Exercise Physiology/Sci., Kinesiology 130 82 48Chemistry, General 264 181 81 Nursing 413 16 397Chemistry, Other 110 64 45 Pharmacy 164 91 73
Rehabilitation/Therapeutic Services 40 17 23EARTH, ATMOS., & MARINE SCI. 786 543 238 Veterinary Medicine 50 29 21
Health Sciences, General 50 20 30Atmospheric Physics & Chemistry 39 27 12 Health Sciences, Other 129 59 68Atmospheric Dynamics 17 14 3Meteorology 34 27 6 AGRICULTURAL SCIENCES 1,085 772 313Atmos. Sci./Meteorology, General 36 28 7Atmos. Sci./Meteorology, Other 17 12 5 Agricultural Economics 137 99 38Geology 124 94 29 Agricultural Business & Management 5 4 1
Geochemistry 48 35 13 Animal Breeding & Genetics 22 18 4Geophysics & Seismology 69 53 16 Animal Nutrition 46 38 8Paleontology 31 17 14 Dairy Science 9 9 0Mineralogy, Petrology 5 4 1 Poultry Science 9 6 3Stratigraphy, Sedimentation 13 9 4 Fisheries Science & Management 43 32 11Geomorphology & Glacial Geology 14 10 4 Animal Sciences, Other 73 47 26Geological & Related Sci., General 20 15 5 Agronomy & Crop Science 70 56 14Geological & Related Sci., Other 18 11 7 Plant Breeding & Genetics 68 45 23Environmental Science 94 50 42 Plant Pathology 63 51 12Hydrology & Water Resources 43 27 16 Plant Sciences, Other 29 19 10Oceanography 100 71 29 Food Engineering 10 8 2Marine Sciences 35 18 17 Food Sciences, Other 142 76 66Misc. Physical Sciences, Other 29 21 8 Soil Chemistry/Microbiology 26 18 8
Soil Sciences, Other 64 49 15ENGINEERING 5,330 4,463 839 Horticulture Science 55 39 16
Forest Biology 22 14 8Aerospace, Aeronautic., Astronautic. 215 192 21 Forest Engineering 3 3 0Agricultural 60 52 7 Forest Management 13 11 2Bioengineering & Biomedical 252 179 71 Wood Sci. & Pulp/Paper Tech, 11 10 1
Ceramic Sciences 22 14 8 Conservation/Renewable Nat. Res. 19 14 5Chemical 620 487 131 Forestry & Related Sci., Other 54 37 17Civil 482 404 78 Wildlife/Range Management 56 45 11Communications 42 35 7 Agricultural Sciences, General 10 8 2Computer 172 139 32 Agricultural Sciences, Other 26 16 10Electrical, Electronics 1,330 1,162 157Engineering Mechanics 57 50 7 SOCIAL SCIENCES & PSYCHOLOGY 7,115 3,227 3,879Engineering Physics 26 25 1
Engineering Science 34 28 6 SOCIAL SCIENCES 3,492 2,022 1,465Environmental Health Engineering 76 64 10Industrial/Manufacturing 176 140 35 Anthropology 446 194 252Materials Science 404 330 73 Area Studies 14 10 4Mechanical 807 717 89 Criminology 66 32 34Metallurgical 25 23 2 Demography/Population Studies 19 10 9Mining & Mineral 10 10 0 Economics 933 679 252Nuclear 98 89 9 Econometrics 15 12 3Ocean 18 15 3 Geography 197 127 70
66
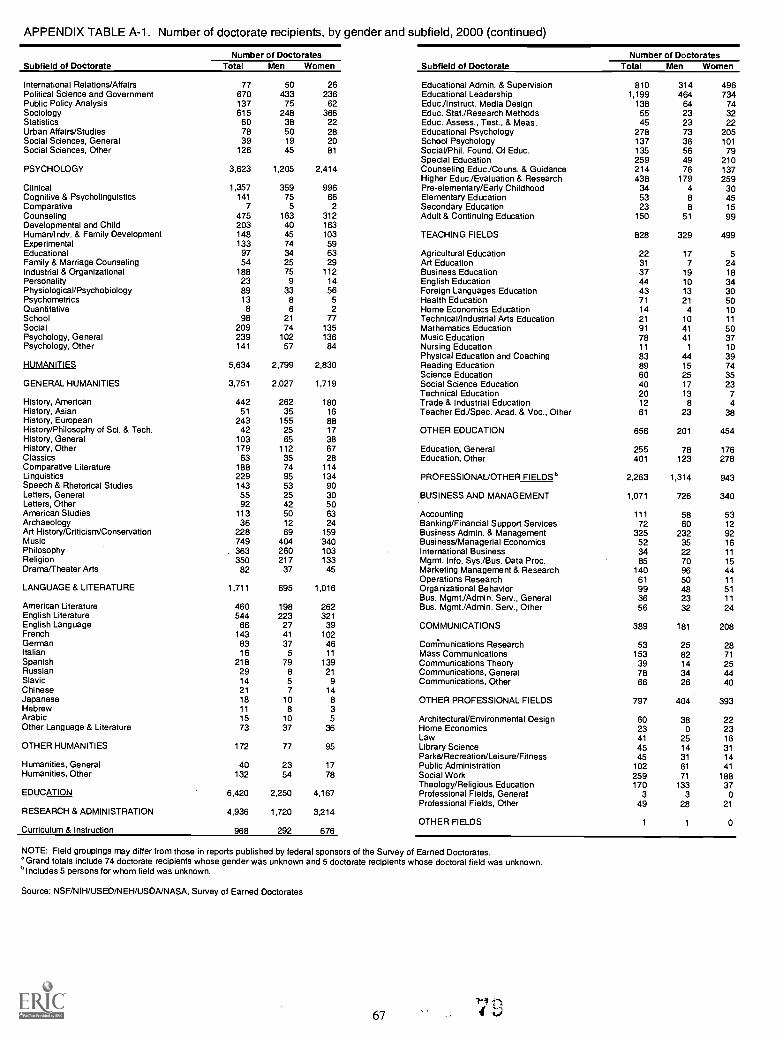
APPENDIX TABLE A-1. Number of doctorate recipients, by gender and subfield, 2000 (continued)
Subfield of DoctorateNumber of Doctorates
Subfleld of DoctorateNumber of Doctorates
Total Men Women Total Men Women
International Relations/Affairs 77 50 26 Educational Admin. & Supervision 810 314 496Political Science and Government 670 433 236 Educational Leadership 1,199 464 734Public Policy Analysis 137 75 62 Educil nstruct. Media Design 138 64 74Sociology 615 248 366 Educ. Stat./Research Methods 55 23 32Statistics 60 38 22 Educ. Assess., Test., & Meas. 45 23 22Urban Affairs/Studies 78 50 28 Educational Psychology 278 73 205Social Sciences, General 39 19 20 School Psychology 137 36 101Social Sciences, Other 126 45 81 Social/Phil. Found. Of Educ. 135 56 79
Special Education 259 49 210PSYCHOLOGY 3,623 1,205 2,414 Counseling Educ./Couns. & Guidance 214 76 137
Higher EduciEvaluation & Research 438 179 259Clinical 1,357 359 996 Pre-elementary/Early Childhood 34 4 30Cognitive & Psycho linguistics 141 75 66 Elementary Education 53 8 45Comparative 7 5 2 Secondary Education 23 8 15Counseling 475 163 312 Adult & Continuing Education 150 51 99Developmental and Child 203 40 163Human/Indy. & Family Development 148 45 103 TEACHING FIELDS 828 329 499Experimental 133 74 59Educational 97 34 63 Agricultural Education 22 17 5Family & Marriage Counseling 54 25 29 Art Education 31 7 24Industrial & Organizational 188 75 112 Business Education 37 19 18Personality 23 9 14 English Education 44 10 34Physiological/Psychobiology 89 33 56 Foreign Languages Education 43 13 30Psychometrics 13 8 5 Health Education 71 21 50Quantitative 8 6 2 Home Economics Education 14 4 10School 98 21 77 Technical/Industrial Arts Education 21 10 11Social 209 74 135 Mathematics Education 91 41 50Psychology, General 239 102 136 Music Education 78 41 37Psychology, Other 141 57 84 Nursing Education 11 1 10
Physical Education and Coaching 83 44 39HUMANITIES 5,634 2,799 2,830 Reading Education 89 15 74
Science Education 60 25 35GENERAL HUMANITIES 3,751 2,027 1,719 Social Science Education 40 17 23
Technical Education 20 13 7History, American 442 262 180 Trade & Industrial Education 12 8 4History, Asian 51 35 16 Teacher Ed./Spec. Acad. & Voc., Other 61 23 38History, European 243 155 88History/Philosophy of Sci. & Tech. 42 25 17 OTHER EDUCATION 656 201 454History, General 103 65 38History, Other 179 112 67 Education, General 255 78 176Classics 63 35 28 Education, Other 401 123 278Comparative Literature 188 74 114Linguistics 229 95 134 PROFESSIONAL/OTHER FIELDS ° 2,263 1,314 943Speech & Rhetorical Studies 143 53 90Letters, General 55 25 30 BUSINESS AND MANAGEMENT 1,071 726 340Letters, Other 92 42 50American Studies 113 50 63 Accounting 111 58 53Archaeology 36 12 24 Banking/Financial Support Services 72 60 12Art History/Criticism/Conservation 228 69 159 Business Admin. & Management 325 232 92Music 749 404 340 Business/Managerial Economics 52 35 16Philosophy 363 260 103 International Business 34 22 11Religion 350 217 133 Mgmt. Info. Sys./Bus. Data Proc. 85 70 15Drama/Theater Arts 82 37 45 Marketing Management & Research 140 96 44
Operations Research 61 50 11LANGUAGE & LITERATURE 1,711 695 1,016 Organizational Behavior 99 48 51
Bus. Mgmt./Admin. Serv., General 36 23 11American Literature 460 198 262 Bus. Mgmt./Admin. Serv., Other 56 32 24English Literature 544 223 321English Language 66 27 39 COMMUNICATIONS 389 181 208French 143 41 102German 83 37 46 Cominunications Research 53 25 28Italian 16 5 11 Mass Communications 153 82 71Spanish 218 79 139 Communications Theory 39 14 25Russian 29 8 21 Communications, General 78 34 44Slavic 14 5 9 Communications, Other 66 26 40Chinese 21 7 14Japanese 18 10 8 OTHER PROFESSIONAL FIELDS 797 404 393Hebrew 11 8 3Arabic 15 10 5 Architectural/Environmental Design 60 38 22Other Language & Literature 73 37 36 Home Economics 23 0 23
Law 41 25 16OTHER HUMANITIES 172 77 95 Library Science 45 14 31
Parks/Recreatioraeisure/Fitness 45 31 14Humanities, General 40 23 17 Public Administration 102 61 41Humanities, Other 132 54 78 Social Work 259 71 188
Theology/Religious Education 170 133 37EDUCATION 6,420 2,250 4,167 Professional Fields, General 3 3 0
Professional Fields, Other 49 28 21RESEARCH & ADMINISTRATION 4,936 1,720 3,214
OTHER FIELDS 1 1
Curriculum & Instruction 968 292 676
NOTE: Field groupings may differ from those in reports published by federal sponsors of the Survey of Earned Doctorates.°Grand totals include 74 doctorate recipients whose gender was unknown and 5 doctorate recipients whose doctoral field was unknown.°Includes 5 persons for whom field was unknown.
Source: NSF/NIH/USED/NEH/USDA/NASA, Survey of Earned Doctorates
67
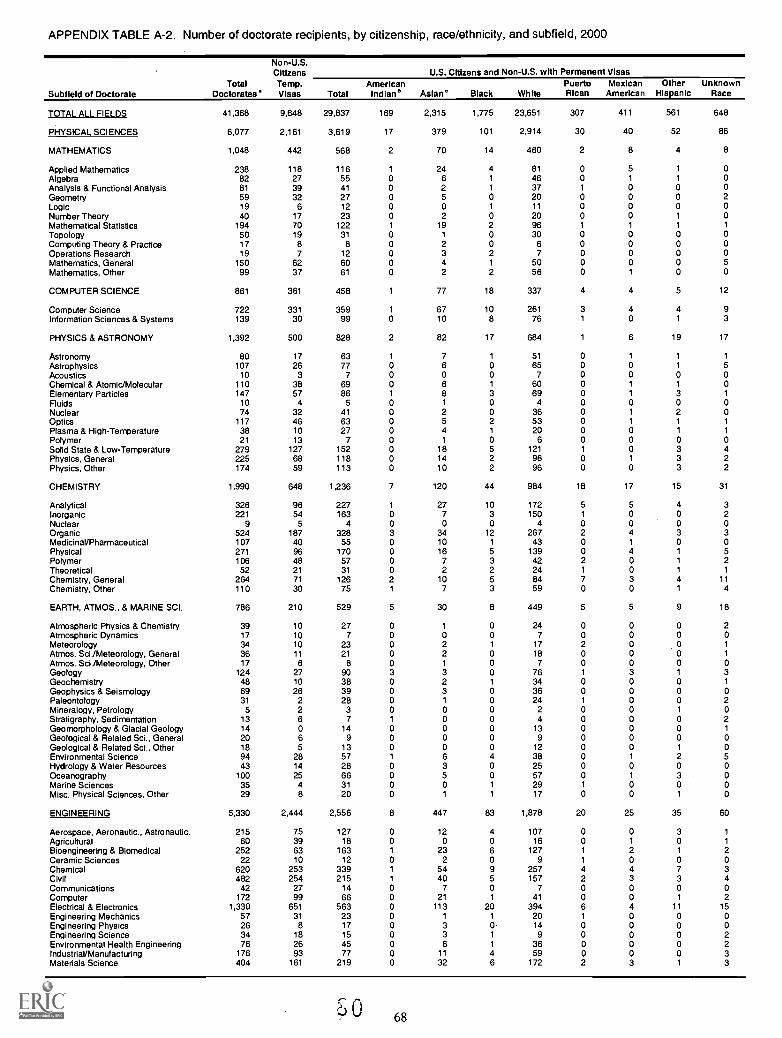
APPENDIX TABLE A-2. Number of doctorate recipients, by citizenship, race/ethnicity, and subfield, 2000
Subfield of DoctorateTotal
Doctorates
Non-U.S.CitizensTemp.Visas
U.S. Citizens and Non-U.S. with Permanent Visas
TotalAmericanIndian b Asian' Black White
Puerto MexicanRican American
OtherHispanic
UnknownRace
TOTAL ALL FIELDS 41,368 9,648 29,837 169 2,315 1,775 23,651 307 411 561 648
PHYSICAL SCIENCES 6,077 2,161 3,619 17 379 101 2,914 30 40 52 86
MATHEMATICS 1,048 442 568 2 70 14 460 2 8 4 8
Applied Mathematics 238 118 116 1 24 4 81 0 5 1 0Algebra 82 27 55 0 6 1 46 0 1 1 0Analysis & Functional Analysis 81 39 41 0 2 1 37 1 0 0 0Geometry 59 32 27 0 5 0 20 0 0 0 2Logic 19 6 12 0 0 1 11 0 0 0 0Number Theory 40 17 23 0 2 0 20 0 0 1 0Mathematical Statistics 194 70 122 1 19 2 96 1 1 1 1
Topology 50 19 31 0 1 0 30 0 0 0Computing Theory & Practice 17 8 8 0 2 0 6 0 0 0Operations Research 19 7 12 0 3 2 7 0 0 0Mathematics, General 150 62 60 0 4 1 50 0 0 5Mathematics, Other 99 37 61 0 2 2 56 1 0 0
COMPUTER SCIENCE 861 361 458 1 77 18 337 4 5 12
Computer Science 722 331 359 1 67 10 261 4 4 9Information Sciences & Systems 139 30 99 0 10 8 76 1 0 1 3
PHYSICS & ASTRONOMY 1,392 500 828 2 82 17 684 1 6 19 17
Astronomy 80 17 63 7 1 51 1 1 1
Astrophysics 107 26 77 6 0 65 0 1 5Acoustics 10 3 7 0 0 7 0 0 0Chemical & Atomic/Molecular 110 38 69 6 1 60 1 1 0Elementary Particles 147 57 86 8 3 69 1 3 1
Fluids 10 4 5 1 0 4 0 0 0Nuclear 74 32 41 2 0 36 1 2 0Optics 117 46 63 5 2 53 1 1 1
Plasma & High-Temperature 38 10 27 4 1 20 0 1 1
Polymer 21 13 7 1 0 6 0 0 0Solid State & Low-Temperature 279 127 152 18 5 121 0 3 4Physics, General 225 68 118 14 2 96 1 3 2Physics, Other 174 59 113 10 2 96 0 3 2
CHEMISTRY 1,990 648 1,236 120 44 984 18 17 15 31
Analytical 326 96 227 1 27 10 172 5 5 4 3Inorganic 221 54 163 0 7 3 150 1 0 0 2Nuclear 9 5 4 0 0 0 4 0 0 0 0Organic 524 187 328 3 34 12 267 2 4 3 3Medicinal/Pharmaceutical 107 40 55 0 10 1 43 0 1 0 0Physical 271 96 170 0 16 5 139 0 4 1 5Polymer 106 48 57 0 7 3 42 2 0 1 2Theoretical 52 21 31 0 2 2 24 1 0 1 1
Chemistry, General 264 71 126 2 10 5 84 7 3 4 11
Chemistry, Other 110 30 75 1 7 3 59 0 0 1 4
EARTH, ATMOS., & MARINE SU. 786 210 529 5 30 8 449 5 5 9 18
Atmospheric Physics & Chemistry 39 10 27 0 1 0 24 0 0 0 2Atmospheric Dynamics 17 10 7 0 0 0 7 0 0 0 0Meteorology 34 10 23 0 2 1 17 2 0 0 1
Atmos. Sci./Meteorology, General 36 11 21 0 2 0 18 0 0 0 1
Atmos. Sci./Meteorology, Other 17 6 8 0 1 0 7 0 0 0 0Geology 124 27 90 3 3 0 76 1 3 1 3Geochemistry 48 10 38 0 2 1 34 0 0 0 1
Geophysics & Seismology 69 26 39 0 3 36 0 0 0 0Paleontology 31 2 28 0 1 24 1 0 0 2Mineralogy, Petrology 5 2 3 0 0 2 0 1 0Stratigraphy, Sedimentation 13 6 7 1 0 4 0 0 2Geomorphology & Glacial Geology 14 0 14 0 0 13 0 0 1
Geological & Related Sci., General 20 6 9 0 0 9 0 0 0Geological & Related Sci., Other 18 5 13 0 0 12 0 1 0Environmental Science 94 28 57 1 6 38 1 2 5Hydrology & Water Resources 43 14 28 0 3 25 0 0 0Oceanography 100 25 66 0 5 57 1 3 0Marine Sciences 35 4 31 0 0 1 29 1 0 0 0Misc. Physical Sciences, Other 29 8 20 0 1 1 17 0 0 1 0
ENGINEERING 5,330 2,444 2,556 8 447 83 1,878 20 25 35 60
Aerospace, Aeronautic., Astronautic. 215 75 127 12 4 107 0 0 3 1
Agricultural 60 39 18 0 0 16 0 1 0 1
Bioengineering & Biomedical 252 63 163 23 6 127 1 2 1 2Ceramic Sciences 22 10 12 2 0 9 1 0 0 0Chemical 620 253 339 54 9 257 4 4 7 3Civil 482 254 215 40 5 157 2 3 3 4Communications 42 27 14 7 0 7 0 0 0 0Computer 172 99 66 21 1 41 0 0 1 2Electrical & Electronics 1,330 651 563 113 20 394 6 4 11 15Engineering Mechanics 57 31 23 1 1 20 1 0 0 0Engineering Physics 26 8 17 3 0 14 0 0 0 0Engineering Science 34 18 15 3 1 9 0 0 0 2Environmental Health Engineering 76 26 45 6 1 36 0 0 0 2Industrial/Manufacturing 176 93 77 11 4 59 0 0 0 3Materials Science 404 161 219 32 6 172 2 3 1 3
68

APPENDIX TABLE A-2. Number of doctorate recipients, by citizenship, race/ethnicity, and subfield, 2000 (continued)
Subfleld of DoctorateTotal
Doctorates
Non-U.S.CitizensTemp.Visas
U.S. Citizens and Non-U.S. with Permanent Visas
TotalAmericanIndian b Asian` Black White
Puerto Mexican Other UnknownRican American Hispanic Race
Mechanical 807 400 372 3 72 17 256 1 4 13Metallurgical 25 10 12 0 1 0 9 0 1 1
Mining & Mineral 10 8 2 0 0 0 2 0 0 0Nuclear 98 34 57 1 5 3 43 0 1 2Ocean 18 11 5 0 0 0 5 0 0 0Operations Research 51 18 32 0 10 1 16 1 1 3Petroleum 44 25 11 0 4 0 6 0 1 0Polymer/Plastics 62 30 30 0 13 0 15 1 0 1
Systems 34 16 14 1 2 0 11 0 0 0Engineering, General 43 17 19 0 2 1 16 0 0 0Engineering, Other 170 67 89 0 10 3 74 0 0 2
LIFE SCIENCES 8,529 2,189 6,011 26 686 222 4,716 49 64 125 123
BIOLOGICAL SCIENCES 5,855 1,390 4,260 17 550 123 3,306 33 46 94 91
Biochemistry 777 229 529 2 96 12 386 1 6 9 17Biomedical Sciences 155 44 98 1 18 1 74 1 2 1
Biophysics 164 48 113 0 13 2 90 1 3 4Biotechnology Research 14 6 8 0 2 1 5 0 0 0Bacteriology 15 4 11 1 0 0 10 0 0 0Plant Genetics 35 11 24 0 4 0 19 0 1 0Plant Pathology 25 14 11 0 1 0 9 0 0 1
Plant Physiology 39 14 25 0 1 0 22 2 0 0Botany, Other 92 20 70 1 2 1 62 1 1 2Anatomy 40 7 32 0 5 2 23 1 0 1 0Biometrics and Biostatistics 92 23 61 0 10 6 41 0 0 2 2Cell Biology 337 73 252 1 35 4 199 2 2 5 4Ecology 297 34 255 1 6 3 228 1 2 5 9Developmental Biology/Embryology 111 26 85 0 9 2 70 1 3 0 0Endocrinology 20 7 11 0 2 0 8 0 0 1 0Entomology 137 50 84 1 4 1 74 1 0 2 1
Biological Immunology 238 52 185 0 29 4 140 0 1 8 3Molecular Biology 705 201 485 3 94 11 348 4 5 9 11Microbiology 383 91 278 1 36 15 207 8 1 4 6Neuroscience 495 103 368 2 58 12 275 1 3 10 7Nutritional Sciences 150 36 109 0 15 11 74 2 3 2 2Parasitology 19 6 13 0 1 2 9 0 0 1 0Toxicology 123 24 97 0 5 5 78 1 1 2 5Human & Animal Genetics 225 41 170 0 21 2 138 4 2 1 2Human & Animal Pathology 105 28 75 1 8 1 62 0 1 1 1
Human & Animal Pharmacology 267 57 198 0 26 7 153 1 1 7 3Human & Animal Physiology 244 43 195 0 21 8 146 1 3 10 6Zoology, Other 133 18 115 1 6 1 100 0 2 4 1
Biological Sciences, General 200 39 142 0 10 6 117 3 2 2 2Biological Sciences, Other 218 41 161 1 12 3 139 1 3 1 1
HEALTH SCIENCES 1,589 306 1,188 4 99 75 954 9 11 14 22
Speech-Lang. Pathology & Audiology 106 17 89 0 2 3 78 1 0 2 3Environmental Health 52 13 35 1 6 3 23 1 0 0 1
Health Systems/Services Admin. 58 13 43 0 1 6 34 1 1 0 0Public Health 207 30 169 1 20 15 117 3 5 6 2Epidemiology 190 26 153 0 16 12 121 1 1 1 1
Exercise Physiology/Sci., Kinesiology 130 18 109 1 0 2 99 0 2 1 4Nursing 413 51 351 1 15 19 305 1 2 2 6Pharmacy 164 71 69 16 5 47 0 0 1 0Rehabilitation/Therapeutic Services 40 2 31 3 1 27 0 0 0 0Veterinary Medicine 50 24 23 1 0 22 0 0 0 0Health Sciences, General 50 10 26 1 4 20 0 0 1 0Health Sciences, Other 129 31 90 18 5 61 1 0 5
AGRICULTURAL SCIENCES 1,085 493 563 37 24 456 7 7 1 10
Agricultural Economics 137 75 59 1 6 5 42 1 1 0Agricultural Business & Management 5 2 3 0 1 2 0Animal Breeding & Genetics 22 10 12 0 1 11 0Animal Nutrition 46 22 23 0 1 22 0Dairy Science 9 6 3 1 0 2 0Poultry Science 9 3 6 0 0 6 0Animal Sciences, Other 73 20 47 1 1 41 2Agronomy & Crop Science 70 34 34 o 0 33 1 0Plant Breeding & Genetics 68 41 26 0 1 22 2 1
Plant Pathology 63 34 29 2 3 21 1 1 1 0Plant Sciences, Other 29 10 19 4 0 15 0 0 0 0Food Engineering 10 7 3 0 0 2 0 1 0 0Food Sciences, Other 142 80 59 1 11 5 37 1 0 1
Soil Chemistry/Microbiology 26 7 19 2 0 14 1 0 2Soil Sciences, Other 64 35 28 4 1 20 1 1 1
Horticulture Science 55 29 23 3 2 16 0 2Fisheries Science & Management 43 10 32 0 1 31 0 0Forest Biology 22 8 14 0 0 14 0 0Forest Engineering 3 1 2 1 0 1 0 0Forest Management 13 6 7 0 1 6 0 0Wood Sd. & Pulp/Paper Tech. 11 8 2 0 0 2 0 0Conservation/Renewable Nat. Res. 19 6 13 0 1 9 1 2Forestry & Related Sci., Other 54 19 34 1 1 0 30 0 1 1
Wildlife/Range Management 56 10 44 1 0 0 37 1 1 2 2Agricultural Sciences, General 10 2 5 1 0 0 4 0 0 0 0Agricultural Sciences, Other 26 8 17 0 1 0 16 0 0 0 0
SOCIAL SCIENCES & PSYCHOLOGY 7,115 1,039 5,688 40 307 368 4,551 76 87 121 138
691."..)0

APPENDIX TABLE A-2. Number of doctorate recipients, by citizenship, race/ethnicity, and subfield, 2000 (continued)
Subfield of DoctorateTotal
Doctorates
Non-U.S.Citizens U.S. Citizens and Non-U.S. with Permanent VisasTemp.Visas Total
AmericanIndian° Asian° Black White
PuertoRican
Mexican Other UnknownAmerican Hispanic Race
SOCIAL SCIENCES 3,492 875 2,467 18 158 175 1,950 16 27 47 76
Anthropology 446 55 382 5 19 21 309 2 2 8 16
Area Studies 14 4 9 0 0 1 7 0 0 0 1
Criminology 66 4 60 0 0 6 51 0 1 1 1
Demography/Population Studies 19 6 13 0 2 1 10 0 0 0 0
Economics 933 450 440 0 42 18 353 2 4 11 10
Econometrics 15 11 4 0 0 0 3 0 0 0 1
Geography 197 50 142 2 5 2 125 1 0 2 5International Relations/Affairs 77 23 51 0 6 2 36 0 1 4 2
Political Science and Government 670 84 557 2 28 38 448 6 5 7 23
Public Policy Analysis 137 20 102 2 7 9 81 1 0 1 1
Sociology 615 88 500 6 30 56 373 4 13 8 10
Statistics 60 33 25 0 4 2 16 0 0 0 3
Urban Affairs/Studies 78 17 60 0 5 5 45 0 0 3 2
Social Sciences, General 39 5 24 0 1 3 20 0 0 0 0
Social Sciences, Other 126 25 98 1 9 11 73 0 1 2 1
PSYCHOLOGY 3,623 164 3,221 22 149 193 2,601 60 60 74 62
Clinical 1,357 27 1,254 6 59 67 1,014 31 28 28 21
Cognitive & Psycholinguistics 141 17 119 0 13 0 96 0 1 3 6
Comparative 7 0 7 0 0 0 6 0 0 1 0
Counseling 475 19 442 7 19 47 339 5 13 8 4
Developmental and Child 203 16 184 1 6 12 152 0 3 4 6
Human/Individual & Family 148 10 117 3 5 6 98 1 0 3 1
Experimental 133 15 115 1 6 3 98 1 1 2 3
Educational 97 7 76 0 5 7 62 0 1 1 0
Family & Marriage Counseling 54 4 47 0 0 1 42 1 0 1 2
Industrial & Organizational 188 11 168 1 3 10 137 6 2 5 4
Personality 23 1 20 1 1 1 16 1 o o o
Physiological/Psychobiology 89 7 79 2 7 67 0 0 2 1
Psychometrics 13 4 7 0 0 5 0 0 2 0
Quantitative 8 2 6 1 0 5 0 0 0 0
School 98 1 96 1 4 87 0 2 1 1
Social 209 7 192 12 11 156 2 6 2 3
Psychology, General 239 6 163 9 10 118 11 0 7 8
Psychology, Other 141 10 129 7 7 103 1 3 4 2
HUMANITIES 5,634 740 4,673 21 201 173 3,942 45 66 108 117
GENERAL HUMANITIES 3,751 516 3,067 17 131 113 2,611 17 37 58 83
History, American 442 10 428 5 11 23 374 0 5 3 7
History, Asian 51 12 39 0 8 0 30 0 0 0 1
History, European 243 19 224 2 1 1 205 0 4 3 8
History/Philosophy of Sci. & Tech. 42 4 35 0 0 1 32 0 0 1 1
History, General 103 11 73 2 1 6 53 1 0 3 7
History, Other 179 31 145 1 5 10 102 4 6 10 7
Classics 63 8 54 0 2 0 50 0 0 0 2
Comparative Literature 188 41 137 0 11 6 110 2 2 4 2
Linguistics 229 101 117 0 11 1 97 1 0 3 4
Speech & Rhetorical Studies 143 11 128 1 2 7 112 0 2 3 1
Letters, General 55 5 38 0 0 2 33 0 1 0 2Letters, Other 92 2 90 0 3 6 78 0 1 1 1
American Studies 113 2 109 1 5 10 87 0 4 1 1
Archeology 36 7 29 0 0 0 28 0 1 0 0
Art History/Criticism/Conservation 228 20 201 1 8 4 172 1 1 3 11
Music 749 141 558 1 38 17 466 4 4 15 13
Philosophy 363 50 300 1 10 7 265 2 3 5 7
Religion 350 32 291 1 13 9 254 2 3 3 6
Drama/Theater Arts 82 9 71 1 2 3 63 0 0 0 2
LANGUAGE & LITERATURE 1,711 197 1,472 3 62 52 1,224 28 27 49 27
American Literature 460 29 417 2 11 32 345 3 9 8 7
English Literature 544 40 494 0 24 9 446 1 5 0 9
English Language 66 3 62 0 2 3 54 1 1 0 1
French 143 20 120 1 6 4 103 2 0 2 2
German 83 17 65 2 1 60 1 0 0 1
Italian 16 2 14 0 0 13 0 0 1
Spanish 218 52 162 4 1 91 17 11 3
Russian 29 1 28 0 1 27 0
Slavic 14 1 11 1 0 10 0
Chinese 21 7 14 7 0 7 0
Japanese 18 2 16 3 0 13 0
Hebrew 11 4 7 0 0 7 0
Arabic 15 2 11 0 0 11 0Other Language & Literature 73 17 51 2 1 37 3 1
OTHER HUMANITIES 172 27 134 1 8 8 107 0 2 1
Humanities, General 40 4 36 1 0 3 30 0 0 0
Humanities, Other 132 23 98 0 8 5 77 0 2 1
EDUCATION 6,420 541 5,656 51 174 699 4,357 71 116 94 9
RESEARCH & ADMINISTRATION 4,936 340 4,450 41 113 572 3,431 61 98 69 65
Curriculum & Instruction 968 94 850 8 23 78 684 21 12 11 13
Educational Admin. & Supervision 810 31 735 10 13 119 534 19 25 4 11
Educational Leadership 1,199 29 1,137 7 15 198 848 5 29 14 21
'17)70

APPENDIX TABLE A-2. Number of doctorate recipients, by citizenship, race/ethnicity, and subfield, 2000 (continued)
Subfield of DoctorateTotal
Doctorates '
Non-U.S.CitizensTemp.Visas
U.S. Citizens and Non-U.S. with Permanent Visas
TotalAmericanIndian b Asian' Black White
PuertoRican
Mexican OtherAmerican Hispanic
UnknownRace
EduclInstruct. Media Design 138 21 117 1 9 7 94 1 1 2 2Educ. Stat./Research Methods 55 14 41 0 3 2 34 0 0 1 1
Educ. Assess., Test., & Meas. 45 13 29 0 5 1 21 0 2 0 0Educational Psychology 278 31 242 1 11 13 200 3 4 7 3School Psychology 137 5 130 0 4 6 110 0 5 3 2Social/Phil. Found, Of Educ. 135 15 115 1 7 15 85 1 2 4 0Special Education 259 19 233 2 4 26 180 5 8 4 4Counseling Educ./Couns. & Guidance 214 13 195 4 2 23 156 4 1 5 0Higher Educ./Evaluation & Research 438 21 410 3 11 65 312 1 8 5 5Pre-elementary/Early Childhood 34 5 28 0 0 6 21 0 0 0 1
Elementary Education 53 6 46 1 1 2 39 0 1 2Secondary Education 23 2 20 0 1 1 16 0 0 2Adult & Continuing Education 150 21 122 3 4 10 97 1 0 5
TEACHING FIELDS 828 132 685 5 39 59 551 7 3 12
Agricultural Education 22 5 16 0 0 3 12 0 0 1
Art Education 31 11 20 1 2 3 14 0 0 0Business Education 37 2 34 2 2 29 0 0 1
English Education 44 9 35 2 3 26 1 0 3Foreign Languages Education 43 22 21 8 1 11 0 0 1
Health Education 71 7 62 1 7 52 1 1 0Home Economics Education 14 6 8 1 1 6 0 0 0Technical/Industrial Arts Education 21 3 16 1 0 15 0 0 0Mathematics Education 91 15 76 4 9 59 1 1 1 1
Music Education 78 16 61 4 4 50 1 1 1
Nursing Education 11 1 10 1 2 7 0 0 0Physical Education and Coaching 83 9 74 0 6 62 1 1 2Reading Education 89 4 82 2 3 76 0 0 1
Science Education 60 8 51 3 3 43 1 0 1
Social Science Education 40 3 37 1 5 4 25 0 1 1
Technical Education 20 4 16 0 1 1 12 0 1 1
Trade & Industrial Education 12 2 10 1 0 1 8 0 0 0Teacher Ed/Spec. Acad. & Voc., Other 61 5 56 0 2 6 44 1 1 1 1
OTHER EDUCATION 656 69 521 5 22 68 375 3 15 13 20
Education, General 255 28 181 1 8 36 113 3 3 5 12Education, Other 401 41 340 4 14 32 262 0 12 8 8
PROFESSIONAL/OTHER FIELDS d 2,263 534 1,634 6 121 129 1,293 16 13 26 30
BUSINESS AND MANAGEMENT 1,071 296 724 4 69 43 571 4 5 12 16
Accounting 111 26 83 1 10 7 63 1 0 1 0Banking/Financial Support Services 72 37 33 0 5 0 27 0 0 1 0Business Admin. & Management 325 73 229 1 26 12 176 1 3 2 8Business/Managerial Economics 52 23 28 0 3 1 23 0 0 1 0International Business 34 11 18 0 0 2 14 1 0 0 1
Mgmt. Info. Sys./Bus. Data Proc. 85 32 52 0 7 2 40 0 0 2 1
Marketing Management & Research 140 42 96 1 8 8 74 1 2 1 1
Operations Research 61 22 36 0 5 1 27 0 0 1 2Organizational Behavior 99 8 89 0 2 4 79 0 0 2 2Bus. Mgmt./Admin. Serv., General 36 7 19 1 1 2 15 0 0 0 0Bus, Mgmt./Admin. Serv., Other 56 15 41 0 2 4 33 0 0 1 1
COMMUNICATIONS 389 75 300 1 10 22 254 1 3 6 3
Communications Research 53 6 47 0 4 2 37 0 0 2 2Mass Communications 153 39 109 1 5 7 92 1 1 2 0Communications Theory 39 3 36 0 0 2 32 0 1 1 0Communications, General 78 13 58 0 0 6 51 0 0 1 0Communications, Other 66 14 50 0 1 5 42 0 1 0 1
OTHER PROFESSIONAL FIELDS 797 162 609 1 41 64 468 11 5 8 11
Architectural Environmental Design 60 24 35 0 2 2 28 0 0 2 1Home Economics 23 7 16 0 0 2 13 0 0 1 0Law 41 22 17 0 1 2 12 0 0 0 2Library Science 45 15 28 0 1 3 18 1 2 0 3Parks/Recreation/Leisure/Fitness 45 14 26 0 2 1 22 1 0 0 0Public Administration 102 9 91 0 0 18 68 1 0 2 2Social Work 259 20 226 1 16 27 169 8 2 1 2Theology/Religious Education 170 24 146 0 17 8 118 0 1 2 0Professional Fields, General 3 1 1 0 0 0 0 0 0 0 1
Professional Fields, Other 49 26 23 0 2 1 20 0 0 0 0
OTHER FIELDS 1 0 1 0 1
NOTE: Field groupings may differ from those in reports published by federal sponsors of the Survey of Earned Doctorates. See inside the back cover fora description of fields asreported in this table.Refer also to the explanatory note about this table in front of Appendix A.° Includes 1,883 individuals who did not report their citizenship at time of doctorate. See the "Important Notice" for discussion of item response rate issues.° Includes Alaskan Native.
Includes Pacific Islander.° Includes 5 persons for whom field was unknown.
Source: NSF/NIH/USED/NEH/USDNNASA, Survey of Earned Doctorates
71 S3
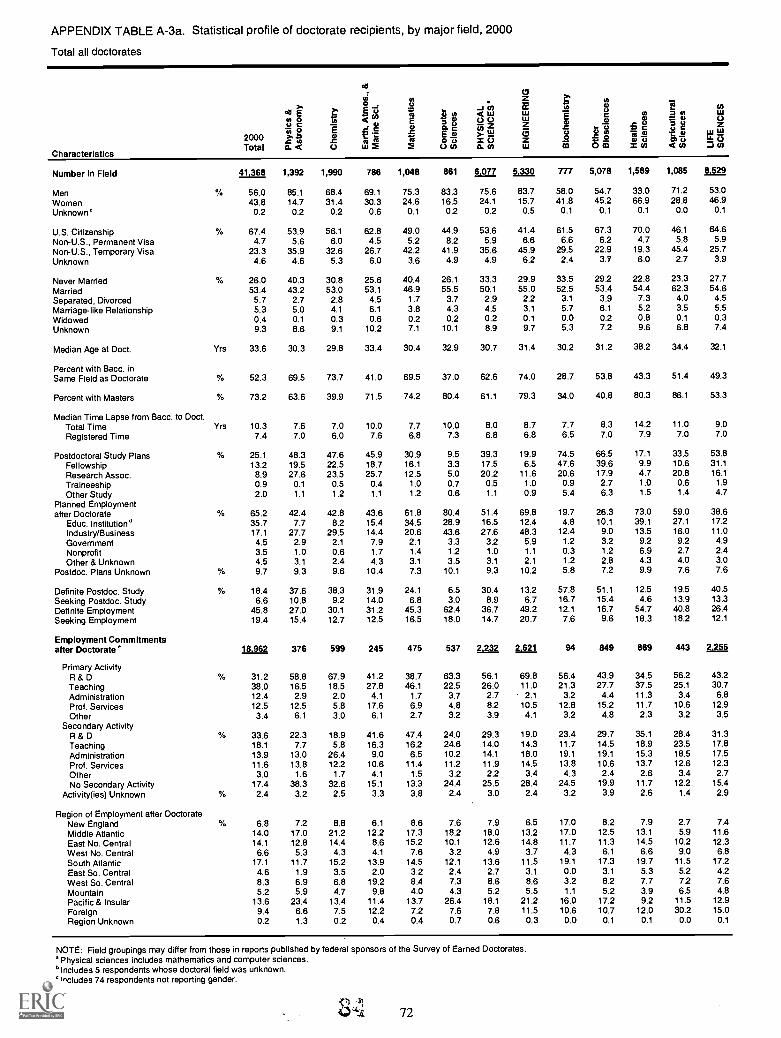
APPENDIX TABLE A-3a. Statistical profile of doctorate recipients, by major field, 2000
Total all doctorates
Characteristics
2000Total
oa g"0 00) 8>' .12.c 00. a
8 1
ic..)
oa
ig .
LB< Tu
.e. ct 'Eui 2
Number In Field 41 368 1,392 1,990 786
Men 56.0 85.1 68.4 69.1Women 43.8 14.7 31.4 30.3Unknown° 0.2 0.2 0.2 0.6
U.S. Citizenship 67.4 53.9 56.1 62.8Non-U.S., Permanent Visa 4.7 5.6 6.0 4.5Non-U.S., Temporary Visa 23.3 35.9 32.6 26.7Unknown 4.6 4.6 5.3 6.0
Never Married % 26.0 40.3 30.8 25.6Married 53.4 43.2 53.0 53.1Separated, Divorced 5.7 2.7 2.8 4.5Marriage-like Relationship 5.3 5.0 4.1 6.1Widowed 0.4 0.1 0.3 0.6Unknown 9.3 8.6 9.1 10.2
Median Age at Doct. Yrs 33.6 30.3 29.8 33.4
Percent with Bacc. inSame Field as Doctorate 52.3 69.5 73.7 41.0
Percent with Masters 73.2 63.6 39.9 71.5
Median Time Lapse from Bacc. to Doct.Total Time Yrs 10.3 7.6 7.0 10.0Registered Time 7.4 7.0 6.0 7.6
Postdoctoral Study Plans % 25.1 48.3 47.6 45.9Fellowship 13.2 19.5 22.5 18.7Research Assoc. 8.9 27.6 23.5 25.7Traineeship 0.9 0.1 0.5 0.4Other Study 2.0 1.1 1.2 1.1
Planned Employmentafter Doctorate % 65.2 42.4 42.8 43.6
Educ. Institution" 35.7 7.7 8.2 15.4Industry/Business 17.1 27.7 29.5 14.4Government 4.5 2.9 2.1 7.9Nonprofit 3.5 1.0 0.6 1.7Other & Unknown 4.5 3.1 2.4 4.3
Postdoc. Plans Unknown % 9.7 9.3 9.6 10.4
Definite Postdoc. Study % 18.4 37.6 38.3 31.9Seeking Postdoc. Study 6.6 10.8 9.2 14.0Definite Employment 45.8 27.0 30.1 31.2Seeking Employment 19.4 15.4 12.7 12.5
Employment Commitmentsafter Doctorate 18 962 376 599 245
Primary ActivityR & D 31.2 58.8 67.9 41.2Teaching 38.0 16.5 18.5 27.8Administration 12.4 2.9 2.0 4.1
Prof. Services 12.5 12.5 5.8 17.6Other 3.4 6.1 3.0 6.1
Secondary ActivityR & D 33.6 22.3 18.9 41.6Teaching 18.1 7.7 5.8 16.3Administration 13.9 13.0 26.4 9.0Prof. Services 11.6 13.8 12.2 10.6Other 3.0 1.6 1.7 4.1
No Secondary Activity 17.4 38.3 32.6 15.1
Activity(ies) Unknown 2.4 3.2 2.5 3.3
Region of Employment after DoctorateNew England 6.8 7.2 8.8 6.1
Middle Atlantic 14.0 17.0 21.2 12.2East No. Central 14.1 12.8 14.4 8.6West No. Central 6.6 5.3 4.3 4.1
South Atlantic 17.1 11.7 15.2 13.9East So. Central 4.6 1.9 3.5 2.0West So. Central 8.3 6.9 6.8 19.2Mountain 5.2 5.9 4.7 9.8Pacific & Insular 13.6 23.4 13.4 11.4Foreign 9.4 6.6 7.5 12.2Region Unknown 0.2 1.3 0.2 0.4
-1< LU
r.)Dr) z.x
u)
ow
Sce 2 I:
ia lau
0 CO I ti) <Vt 6/1
1,048 861 6 077 5 330
75.3 83.3 75.6 83.724.6 16.5 24.1 15.70.1 0.2 0.2 0.5
49.0 44.9 53.6 41.45.2 8.2 5.9 6.6
42.2 41.9 35.6 45.93.6 4.9 4.9 6.2
40.4 26.1 33.3 29.946.9 55.5 50.1 55.0
1.7 3.7 2.9 2.23.8 4.3 4.5 3.10.2 0.2 0.2 0.17.1 10.1 8.9 9.7
30.4 32.9 30.7 31.4
69.5 37.0 62.6 74.0
74.2 80.4 61.1 79.3
7.7 10.0 8.0 8.76.8 7.3 6.8 6.8
30.9 9.5 39.3 19.916.1 3.3 17.5 6.512.5 5.0 20.2 11.61.0 0.7 0.5 1.01.2 0.6 1.1 0.9
61.8 80.4 51.4 69.834.5 28.9 16.5 12.420.6 43.6 27.6 48.3
2.1 3.3 3.2 5.91.4 1.2 1.0 1.1
3.1 3.5 3.1 2.17.3 10.1 9.3 10.2
24.1 6.5 30.4 13.26.8 3.0 8.9 6.7
45.3 62.4 36.7 49.216.5 18.0 14.7 20.7
475 537 2 232 2 621
38.7 63.3 56.1 69.846.1 22.5 26.0 11.0
1.7 3.7 2.7 2.16.9 4.8 8.2 10.52.7 3.2 3.9 4.1
47.4 24.0 29.3 19.016.2 24.6 14.0 14.36.5 10.2 14.1 18.0
11.4 11.2 11.9 14.51.5 3.2 2.2 3.4
13.3 24.4 25.5 28.43.8 2.4 3.0 2.4
8.6 7.6 7.9 6.517.3 18.2 18.0 13.215.2 10.1 12.6 14.87.6 3.2 4.9 3.7
14.5 12.1 13.6 11.53.2 2.4 2.7 3.18.4 7.3 8.6 8.64.0 4.3 5.2 5.5
13.7 26.4 18.1 21.27.2 7.6 7.8 11.50.4 0.7 0.6 0.3
777 5,078 1,589 1,085 8 529
58.0 54.7 33.0 71.2 53.041.8 45.2 66.9 28.8 46.9
0.1 0.1 0.1 0.0 0.1
61.5 67.3 70.0 46.1 64.66.6 6.2 4.7 5.8 5.9
29.5 22.9 19.3 45.4 25.72.4 3.7 6.0 2.7 3.9
33.5 29.2 22.8 23.3 27.752.5 53.4 54.4 62.3 54.63.1 3.9 7.3 4.0 4.55.7 6.1 5.2 3.5 5.50.0 0.2 0.8 0.1 0.35.3 7.2 9.6 6.8 7.4
30.2 31.2 38.2 34.4 32.1
28.7 53.8 43.3 51.4 49.3
34.0 40.8 80.3 86.1 53.3
7.7 8.3 14.2 11.0 9.06.5 7.0 7.9 7.0 7.0
74.5 66.5 17.1 33.5 53.847.6 39.6 9.9 10.6 31.120.6 17.9 4.7 20.8 16.1
0.9 2.7 1.0 0.6 1.95.4 6.3 1.5 1.4 4.7
19.7 26.3 73.0 59.0 38.64.8 10.1 39.1 27.1 17.2
12.4 9.0 13.5 16.0 11.01.2 3.2 9.2 9.2 4.90.3 1.2 6.9 2.7 2.41.2 2.8 4.3 4.0 3.05.8 7.2 9.9 7.6 7.6
57.8 51.1 12.5 19.5 40.516.7 15.4 4.6 13.9 13.312.1 16.7 54.7 40.8 26.4
7.6 9.6 18.3 18.2 12.1
94 849 869 443 2 255
56.4 43.9 34.5 56.2 43.221.3 27.7 37.5 25.1 30.7
3.2 4.4 11.3 3.4 6.812.8 15.2 11.7 10.6 12.9
3.2 4.8 2.3 3.2 3.5
23.4 29.7 35.1 28.4 31.311.7 14.5 18.9 23.5 17.819.1 19.1 15.3 18.5 17.513.8 10.6 13.7 12.6 12.34.3 2.4 2.6 3.4 2.7
24,5 19.9 11.7 12.2 15.43.2 3.9 2.6 1.4 2.9
17.0 8.2 7.9 2.7 7.417.0 12.5 13.1 5.9 11.611.7 11.3 14.5 10.2 12.34.3 6.1 6.6 9.0 6.8
19.1 17.3 19.7 11.5 17.20.0 3.1 5.3 5.2 4.23.2 8.2 7.7 7.2 7.61.1 5.2 3.9 6.5 4.8
16.0 17.2 9.2 11.5 12.910.6 10.7 12.0 30.2 15.00.0 0.1 0.1 0.0 0.1
NOTE: Field groupings may differ from those in reports published by federal sponsors of the Survey of Earned Doctorates.a Physical sciences includes mathematics and computer sciences.°Includes 5 respondents whose doctoral field was unknown.° Includes 74 respondents not reporting gender.
c :4172

APPENDIX TABLE A-3a. Statistical profile of doctorate recipients, by major field, 2000 (continued)
Total all doctorates
.ca>a.
otl Tu a, IX a 0u X as Zo, --, To c_oo i r) :CO e t u) - la iu ei 112
- ) -1:12
0 -a r. 0 iug 1 TO -i
43:
c ob c et12 703, a2 g B ze C/a AI 1.... cZ 5 5 ii o 0 o o z 2a w o. 0 0 co co z 1- co tu X 2 -I tf, 3 0. 3 o x
ct (I) ufZ 0 tAi
<4 t To 0c -.1= w 0Z13 i o
*(7)
w T.O w
gwu. u., a 0c3 = 1- z
c3 g 6 2 z cc I- 0 oo a. Li o. 0 1- z
3,623
33.366.60.1
86.82.14.56.6
26.746.46.77.30.3
12.6
32.2
61.9
74.5
9.07.1
29.622.04.32.01.3
57.522.313.66.58.56.6
12.8
22.47.3
38.918.6
19.020.6
5.848.6
3.7
27.119.918.411.6
3.817.02.1
6.718.014.27.6
18.34.18.45.3
15.02.20.2
948 1,061 747 736 7 115 27 051 1,060
72.9 41.7 64.7 55.2 45.4 62.1 61.726.9 58.2 35.1 44.8 54.5 37.6 38.30.2 0.1 0.3 0.0 0.1 0.2 0.0
41.5 77.9 77.2 67.1 76.4 60.7 85.85.4 5.2 4.1 5.3 3.5 5.4 3.2
48.6 13.5 14.3 22.3 14.6 29.0 8.24.5 3.4 4.3 5.3 5.5 5.0 2.7
34.0 26.4 27.0 21.9 27.2 29.2 24.748.5 48.4 52.9 54.3 48.5 52.0 55.6
3.0 8.3 5.5 7.9 6.4 4.2 5.16.4 8.8 5.8 5.7 7.1 5.2 7.60.0 0.1 0.1 0.1 0.2 0.2 0.38.1 8.1 8.7 10.1 10.6 9.1 6.7
31.7 35.1 33.5 35.9 33.0 31.8 34.6
55.2 76.8 53.5 22.8 58.3 59.5 53.4
72.4 81.4 79.7 83.4 76.7 66.3 84.5
8.9 11.5 10.4 12.0 9.8 9.0 11.27.0 8.8 8.3 8.0 7.5 7.0 9.0
6.6 17.0 9.1 11.3 20.6 35.1 11.33.5 11.0 5.2 4.6 14.3 18.8 7.32.0 4.1 2.4 4.3 3.8 12.9 1.50.5 0.6 0.1 0.5 1.3 1.3 0.30.6 1.3 1.3 1.8 1.3 2.2 2.3
85.4 74.3 81.7 78.0 68.4 55.5 79.942.5 49.6 55.3 45.9 35.0 20.8 59.318.6 6.8 9.2 12.2 12.6 22.5 5.512.8 5.5 5.1 7.6 7.2 5.3 4.14.2 6.4 4.4 6.3 7.0 3.0 3.27.4 6.0 7.6 6.0 6.7 3.8 7.87.9 8.8 9.2 10.7 11.0 9.4 8.8
5.3 11.1 5.8 7.1 15.1 26.2 6.61.4 5.8 3.3 4.2 5.5 9.0 4.7
67.9 49.0 51.9 54.6 47.3 38.7 46.517.5 25.3 29.7 23.4 21.1 16.7 33.4
644 520 388 402 3 365 10 473 493
53.1 31.5 24.7 31.1 29.6 48.2 11.225.0 49.6 57.0 46.5 33.2 25.6 72.4
3.6 8.1 7.2 9.2 6.3 4.6 5.512.0 6.7 5.7 7.7 25.3 15.3 6.5
4.2 2.5 3.6 3.7 3.6 3.8 3.4
34.9 45.4 51.3 46.8 36.6 29.5 56.428.1 21.3 19.3 19.7 21.6 17.3 11.210.1 11.2 9.8 10.9 13.8 15.7 11.27.5 7.9 5.4 9.0 9.2 11.8 4.53.6 1.7 2.8 1.5 3.1 2.9 4.1
13.8 11.0 9.5 10.4 13.8 20.3 11.82.0 1.5 1.8 1.7 1.9 2.5 1.0
8.7 8.8 6.7 6.2 7.4 7.3 8.712.6 14.4 14.2 16.0 15.7 14.7 16.29.5 12.3 13.7 15.0 13.0 13.2 15.21.7 6.7 4.6 5.5 5.7 5.3 6.1
23.6 17.7 21.6 21.7 20.0 15.9 18.92.0 3.1 2.6 3.7 3.3 3.3 5.73.9 5.4 9.5 8.2 7.2 7.9 5.92.2 5.8 3.4 3.7 4.4 4.9 5.99.9 14.2 11.9 10.0 13.0 16.1 11.4
25.6 11.5 11.9 9.7 10.1 11.0 6.10.3 0.0 0.0 0.2 0.2 0.3 0.0
460
43.057.0
0.0
88.91.76.33.0
26.747.48.5
10.70.76.1
34.2
63.3
85.4
10.48.5
5.93.50.70.21.5
88.369.17.81.1
1.19.15.9
4.11.7
48.539.8
223
6.777.1
5.84.04.5
56.512.19.04.92.7
13.01.8
8.112.613.54.0
18.47.27.66.3
16.16.30.0
610 641 2,863 5 634 6 420 1,071 1,186 2 263 14 312
41.0 38.5 50.6 49.7 35.0 67.8 49.3 58.1 44.459.0 61.5 49.2 50.2 64.9 31.7 50.7 41.7 55.50.0 0.0 0.2 0.1 0.0 0.5 0.0 0.3 0.1
89.0 67.7 74.2 78.5 86.2 62.5 72.0 67.3 80.22.1 10.1 4.6 4.5 1.9 5.1 4.6 4.9 3.47.0 19.5 15.9 13.1 8.4 27.6 20.0 23.6 12.71.8 2.7 5.2 3.9 3.5 4.8 3.4 4.2 3.7
27.9 26.1 26.1 26.1 14.2 21.7 18.5 20.0 19.850.5 52.6 48.6 50.5 60.4 58.3 57.5 57.7 56.1
6.6 7.6 6.9 6.7 10.6 4.9 8.8 6.9 8.58.9 7.8 7.1 7.7 3.4 4.2 4.6 4.4 5.31.0 0.5 0.6 0.6 0.9 0.4 0.8 0.6 0.75.2 5.5 10.8 8.4 10.5 10.6 9.9 10.5 9.6
34.0 35.2 35.2 34.8 44.4 36.7 39.0 37.8 38.9
70.8 47.9 49.2 47.9 33.7 32.0 29.3 30.5 38.8
87.4 86.7 82.7 84.2 88.3 79.2 89.1 84.2 86.1
11.0 11.1 11.8 11.4 19.4 13.0 14.9 14.0 14.38.8 8.5 8.9 8.8 8.1 7.6 8.5 8.0 8.3
6.2 8.6 7.0 7.8 4.8 3.3 6.6 5.0 6.03.4 3.7 3.3 4.1 1.7 1.7 2.4 2.0 2.70.7 1.7 1.5 1.4 1.7 0.9 1.7 1.3 1.50.0 0.6 0.5 0.4 0.4 0.3 0.5 0.4 0.42.1 2.5 1.7 2.0 1.0 0.4 2.0 1.2 1.4
87.2 85.3 81.4 82.8 84.3 85.9 83.6 84.5 83.770.5 72.1 61.2 63.7 66.3 61.8 53.9 57.5 63.97.4 4.5 6.7 6.4 5.1 17.2 8.9 12.8 6.80.5 1.4 1.2 1.7 3.7 2.2 5.5 3.9 2.91.3 1.1 5.8 3.9 3.8 1.8 10.5 6.4 4.37.5 6.2 6.5 7.0 5.4 2.9 4.9 3.9 5.86.6 6.1 11.6 9.4 11.0 10.8 9.8 10.5 10.3
4.1 5.3 4.2 4.8 3.2 2.6 4.0 3.3 3.82.1 3.3 2.8 3.1 1.5 0.7 2.6 1.7 2.2
52.3 58.7 51.7 51.3 63.7 71.0 63.2 66.7 59.334.9 26.7 29.7 31.4 20.6 14.9 20.4 17.8 24.4
319 376 1,481 2 892 4 087 760 750 1 510 8 4N
6.0 9.0 8.7 8.7 7.0 32.6 11.3 22.1 10.379.0 82.4 71.7 74.4 39.4 44.3 55.9 50.1 53.25.6 4.0 5.1 5.1 38.0 7.8 13.9 10.8 22.02.8 1.3 7.3 5.6 11.1 8.9 12.8 10.9 9.24.1 1.1 5.1 4.1 2.1 3.3 3.5 3.4 3.0
58.3 66.5 46.3 52.7 26.4 43.6 46.3 44.9 38.710.0 9.8 12.8 11.8 21.4 35.5 18.8 27.2 19.110.3 7.7 12.6 11.2 12.8 5.9 11.9 8.9 11.64.7 4.3 7.2 5.9 16.8 4.2 10.5 7.4 11.43.1 1.3 6.2 4.6 2.8 1.2 1.3 1.3 3.1
11.3 8.2 12.9 11.9 17.5 6.6 8.5 7.5 13.82.2 2.1 2.1 1.9 2.3 3.0 2.7 2.8 2.3
6.3 10.6 7.1 7.8 5.2 7.1 5.5 6.3 6.316.3 16.0 12.8 14.2 11.9 13.7 14.0 13.9 13.016.0 18.1 16.7 16.3 15.1 14.1 13.4 13.7 15.27.8 10.1 10.0 8.6 8.6 4.9 7.7 6.3 8.2
16.9 14.6 14.3 15.7 20.9 16.3 19.4 17.8 18.66.6 3.5 4.6 5.0 6.9 5.5 6.7 6.1 6.17.5 6.9 8.2 7.5 9.6 9.1 8.8 8.9 8.83.4 3.2 4.6 4.6 6.3 5.5 6.1 5.8 5.6
14.7 9.6 10.7 11.5 10.4 10.5 7.5 9.0 10.53.8 7.2 10.8 8.4 5.0 12.8 10.4 11.6 7.30.6 0.3 0.1 0.2 0.1 0.5 0.5 0.5 0.2
d I nd tides 2-year, 4-year, foreign colleges/universities, medical schools, and elementary/secondary schools.Includes only doctorate recipients with definite employment plans.
Source: NSF/NIH/USED/NEH/USDAJNASA, Survey of Earned Doctorates
7 3

APPENDIX TABLE A-3b. Statistical profile of doctorate recipients, by major field, 2000
Total men
Characteristics
Total Men
oa g-. o2000 >. 13
Total c. a
r,st 5e,. 4).
;://
TO(7) Z
O. V)
a
1<s'o
Men as a Percentof Total Doctorates 56.0
U.S. Citizenship 60.9Non-U.S., Permanent Visa 4.9Non-U.S., Temporary Visa 29.5Unknown 4.7
Never Married % 26.8Married 56.2Separated, Divorced 3.5Marriage-like Relationship 4.5Widowed 0.1Unknown 8.9
Median Age at Doctorate Yrs 33.0
Percent with Bacc. inSame Field as Doctorate 54.5
Percent with Masters 72.1
Median Time Lapse from Bacc. to Doct.Total Time Yrs 9.9Registered Time 7.3
Postdoctoral Study Plans % 26.8Fellowship 13.1Research Assoc. 10.6Traineeship 1.0Other Study 2.1
Planned Employmentafter Doctorate % 63.8
Educ. Institution° 31.3Industry/Business 21,5Government 4.9Nonprofit 2.7Other & Unknown 3.4
Postdoc. Plans Unknown % 9.4
Definite Postdoc. Study % 19.9Seeking Postdoc. Study 6.9Definite Employment 45.7Seeking Employment 18.1
Employment Commitmentsafter Doctorate' 10 586
Primary ActivityR & DTeachingAdministrationProf. ServicesOther
Secondary ActivityR & DTeachingAdministrationProf. ServicesOtherNo Secondary Activity
Activity(ies) Unknown
38.933.5
9.911.43.7
32.118.415.311.12.7
17.82.5
Region of Employmentafter Doctorate
New England % 7.0Middle Atlantic 13.5East No. Central 13.9West No. Central 5.8South Atlantic 15.5East So. Central 4.2West So. Central 8.3Mountain 5.2Pacific & Insular 14.3Foreign 11.9Region Unknown 0.3
1,185 1,362 543 789 717 4 596 4 463 451 2,777 524 772 4 524
85.1 68.4 69.1 75.3 83.3 75.6 83.7 58.0 54.7 33.0 71.2 53.0
54.7 54.4 61.3 46.8 43.8 52.3 40.1 60.1 65.6 59.0 43.5 60.55.1 5.4 4.2 4.4 8.1 5.4 6.3 6.0 5.7 6.1 5.3 5.7
35.8 34.9 27.6 45.5 43.5 37.4 48.0 31.3 25.0 27.3 48.1 29.84.4 5.4 6.8 3.3 4.6 4.8 5.6 2.7 3.7 7.6 3.1 4.0
40.8 31.1 24.7 42.8 27.9 34.3 30.0 31.7 28.3 21.0 19.6 26.343.4 53.7 55.6 45.4 56.2 50.2 55.9 54.3 55.7 58.2 68.3 58.02.4 2.3 3.7 1.4 2.4 2.3 2.1 3.3 3.5 3.4 2.8 3.35.0 3.5 5.0 3.8 4.0 4.2 2.9 4.4 5.4 5.7 2.6 4.80.0 0.2 0.4 0.0 0.1 0.1 0.1 0.0 0.1 0.2 0.0 0.1
8.4 9.2 10.7 6.6 9.3 8.7 9.1 6.2 7.1 11.5 6.7 7.4
30.4 30.1 33.2 30.4 32.8 30.8 31.6 30.4 31.5 35.3 34.8 32.0
69.9 72.8 44.0 68.6 37.5 62.4 75.4 32.2 51.3 27.9 54.7 47.2
63.5 41.2 72.4 72.1 80.1 62.0 80.4 31.5 42.0 72.5 86.5 52.1
7.7 7.0 10.3 7.7 9.8 8.0 8.8 7.8 8.5 12.0 11.5 8.97.0. 6.1 7.6 6.7 7.3 6.8 6.8 6.5 6.9 7.2 7.0 6.9
48.4 50.1 44.2 33.5 9.6 39.8 19.8 74.3 68.3 17.2 30.8 56.620.3 23.9 18.2 17.6 3.5 18.0 6.4 46.6 38.3 8.6 9.8 30.826.9 24.5 24.5 13.1 5.0 20.1 11.5 21.1 18.9 5.9 18.9 17.6
0.1 0.4 0.4 1.3 0.7 0.5 1.0 1.1 3.3 1.7 0.5 2.41.1 1.2 1.1 1.5 0.4 1.1 0.9 5.5 7.8 1.0 1.6 5.7
42.4 40.0 45.1 59.6 81.0 51.0 70.6 19.5 24.6 71.2 61.5 35.87.7 7.8 16.0 31.4 27.8 15.9 12.1 3.5 9.8 34.2 28.1 15.1
27.8 28.4 15.8 21.3 45.9 28.3 49.6 13.5 8.9 20.0 17.1 12.03.2 1.5 8.1 2.5 3.1 3.2 6.1 1.6 3.2 10.1 9.6 4.90.8 0.5 1.5 1.0 1.3 0.9 1.0 0.2 0.8 4.6 2.8 1.52.9 1.8 3.7 3.3 3.1 2.7 1.9 0.7 2.1 2.3 3.9 2.39.2 9.8 10.7 7.0 9.3 9.2 9.6 6.2 7.1 11.6 7.6 7.6
38.1 40.3 30.6 26.1 6.4 30.9 13.2 57.2 53.2 12.8 18.5 43.010.2 9.8 13.6 7.4 3.2 8.9 6.5 17.1 15.1 4.4 12.3 13.627.6 29.1 33.3 43.7 62.3 36.9 50.2 12.4 16.3 54.8 43.7 25.114.9 10.9 11.8 15.8 18.7 14.1 20.5 7.1 8.3 16.4 17.9 10.7
,
327 397 181 345 447 1 697 2 240 56 454 287 337 1 134
60.2 68.3 42.0 42.0 64.9 57.7 70.4 62.5 46.9 43.9 58.5 50.415.3 18.4 26.5 41.4 22.1 24.3 10.7 16.1 23.1 31.0 22.8 24.73.1 2.3 3.3 2.3 3.1 2.8 2.1 3.6 4.0 9.8 3.6 5.3
12.8 5.5 18.8 7.2 4.5 8.4 10.5 10.7 16.3 11.1 11.0 13.1
5.2 2.3 6.1 2.9 3.1 3.6 4.0 3.6 5.3 2.4 3.6 4.0
21.7 19.9 42.5 43.5 24.8 28.8 19.1 17.9 30.4 34.1 27.6 29.97.0 6.3 16.0 17.7 23.0 14.2 13.8 16.1 16.1 18.8 24.0 19.1
13.5 29.7 9.9 7.5 10.3 14.8 19.4 21.4 21.8 19.5 19.9 20.614.4 12.1 10.5 12.2 11.4 12.2 15.0 12.5 7.7 11.8 12.2 10.31.8 1.5 2.8 12 3.1 2.1 3.4 5.4 1.8 2.4 3.6 2.6
38.2 27.5 14.9 13.9 25.1 24.8 27.1 23.2 17.8 11,5 12.2 14.83.4 3.0 3.3 4.1 2.2 3.1 2.3 3.6 4.4 1.7 0.6 2.6
6.4 8.1 6.6 9.0 8.3 7.8 6.7 16.1 9.7 8.7 2.7 7.716.8 18.6 13.3 17.4 18.1 17.3 12.6 12.5 11.0 13.6 5.6 10.113.8 16.1 9.9 13.3 9.6 12.7 15.1 14.3 10.6 13.2 10.1 11.34.9 4.8 3.3 7.0 3.8 4.8 3.5 5.4 6.6 5.2 7.4 6.4
12.5 14.1 12.2 13.6 11.6 12.8 10.6 16.1 17.8 19.2 11.6 16.21.8 3.8 1.7 2.3 1.8 2.4 3.2 0.0 3.1 4.2 5.9 4.16.4 6.5 19.9 9.6 6.0 8.4 8.8 1.8 7.9 6.3 7.1 7.06.1 5.0 8.8 4.3 4.5 5.4 5.8 1.8 4.4 5.2 6.2 5.0
23.2 13.4 11.6 14.8 27.5 19.1 21.4 19.6 14.8 9.1 11.0 12.46.7 9.3 12.7 8.1 8.1 8.6 12.1 12.5 14.1 15.0 32.3 19.71.2 0.3 0.0 0.6 0.7 0.6 0.3 0.0 0.0 0.3 0.0 0.1
NOTE: Field groupings may differ from those in reports published by federal sponsors of the Survey of Earned Doctorates.°Physical sciences includes mathematics and computer sciences.°Includes 2-year, 4-year, foreign colleges/universities, medical schools, and elementary/secondary schools.
kf3 74

APPENDIX TABLE A-3b. Statistical profile of doctorate recipients, by major field, 2000 (continued)
Total men
aa T; 0ccU .>. 0 .3 z0 --, - c2 >, T.; 2 2 0 (.) 0 Eao ,a 0 .0 0 CA - Ili Illl
? 2To %.
co4 --J z zo
c 0 Z 12 « 8 o c) 0 o zam a.= om mz 1-mm
cr_ ch im ... co
g 77c cc as
CP 12ea
.2x _1 m u. _1 6 x
0.3
S2
m 2
1,205 691 442 483 406 3 227 16 810 654 198 250 247 1,450 2 799 2 250 726 585 1 314 6 361
33.3 72.9 41.7 64.7 55.2 45.4 62.1 61.7 43.0 41.0 38.5 50.6 49.7 35.0 67.8 49.3 58.1 44.4
84.2 41.2 74.7 76.8 63.5 70.0 54.7 86.2 88.9 90.8 65.2 75.7 79.5 83.3 58.0 67.2 62.0 77.32.5 5.1 5.4 4.6 6.2 4.2 5.5 3.2 1.0 0.4 8.9 4.1 3.8 1.9 4.1 5.6 4.8 3.35.6 49.6 16.7 14.7 24.9 20.4 34.9 8.3 7.1 6.4 22.3 14.3 12.4 10.9 32.9 23.9 28.9 15.27.6 4.1 3.2 3.9 5.4 5.4 4.9 2.3 3.0 2.4 3.6 5.9 4.3 3.9 5.0 3.2 4.3 4.1
25.9 33.7 24.4 26.7 20.7 26.8 29.6 25.8 27.8 28.4 25.5 24.0 25.2 13.6 20.0 13.7 17.1 19.449.8 49.9 55.4 56.7 59.1 52.8 54.3 58.9 49.0 55.6 53.0 52.4 54.0 68.5 61.4 66.0 63.3 61.1
3.9 3.0 5.2 5.2 6.7 4.4 2.9 2.9 5.1 4.0 6.1 5.4 4.8 5.3 3.7 6.2 4.8 5.07.1 6.1 7.9 3.5 4.9 6.2 4.4 6.4 11.1 5.2 9.3 6.8 7.1 2.4 4.1 3.1 3.7 4.70.2 0.0 0.0 0.2 0.2 0.1 0.1 0.3 0.0 0.0 0.4 0.2 0.2 0.1 0.1 0.3 0.2 0.2
13.2 7.2 7.0 7.7 8.4 9.6 8.7 5.7 7.1 6.8 5.7 11.1 8.7 10.0 10.6 10.8 10.9 9.6
32.7 32.2 35.2 33.6 36.1 33.3 31.8 34.7 34.6 34.0 35.2 35.4 35.0 43.5 36.7 38.8 37.5 37.9
60.2 55.6 76.2 55.9 25.4 56.4 60.6 54.4 62.6 71.2 45.3 49.9 49.3 29.6 30.7 28.2 29.5 38.3
73.9 72.6 82.8 81.8 84.5 77.4 67.2 85.2 82.3 85.2 87.0 82.3 83.7 88.8 79.1 87.4 82.6 85.3
9.0 9.1 11.4 10.5 12.0 10.0 8.8 11.0 11.0 10.7 11.2 12.0 11.6 18.6 13.2 14.3 13.7 13.97.2 7.0 8.5 8.3 8.0 7.5 7.0 8.7 8.6 8.3 8.5 8.7 8.6 8.0 7.6 8.9 8.0 8.3
27.0 6.8 17.2 9.7 11.3 16.8 34.6 12.1 6.6 8.4 8.5 6.3 8.0 5.5 3.2 6.3 4.6 6.419.6 3.5 10.6 5.8 4.4 10.9 17.0 7.5 3.5 3.6 3.6 2.6 4.0 2.3 1.8 1.5 1.7 2.9
4.9 2.0 4.8 2.5 4.4 3.8 14.0 1.4 0.5 1.6 2.0 1.4 1.4 1.6 0.7 2.6 1.5 1.51.5 0.4 0.7 0.2 0.7 0.9 1.2 0.3 0.5 0.0 0.4 0.6 0.4 0.4 0.3 1.0 0.6 0.51.0 0.9 1.1 1.2 1.7 1.1 2.3 2.9 2.0 3.2 2.4 1.7 2.2 1.2 0.4 1.2 0.8 1.6
59.7 85.7 75.3 82.0 79.6 73.2 56.4 79.8 86.9 83.6 85.4 82.2 82.4 83.8 85.5 83.1 84.2 83.322.7 44.0 51.4 56.5 48.0 39.4 19.2 60.2 69.7 70.0 74.5 61.6 63.7 66.9 60.6 50.3 55.9 63.315.9 18.4 7.2 9.1 11.8 13.7 26.8 5.0 9.1 6.8 4.5 7.3 6.6 5.3 17.8 9.1 13.9 7.6
8.5 13.6 5.7 5.8 7.6 8.7 5.5 4.9 0.5 0.4 1.2 1.1 1.9 4.5 2.8 6.8 4.6 3.47.8 3.8 5.7 3.7 5.4 5.7 2.0 3.2 0.0 1.6 0.8 6.8 4.5 3.6 1.5 12.3 6.3 4.64.8 5.9 5.4 6.8 6.7 5.7 2.9 6.4 7.6 4.8 4.5 5.4 5.6 3.4 2.9 4.6 3.7 4.4
13.4 7.5 7.5 8.3 9.1 10.0 9.0 8.1 6.6 8.0 6.1 11.5 9.6 10.7 11.3 10.6 11.2 10.3
21.2 5.2 11.1 6.0 6.9 12.3 25.9 6.6 5.1 5.6 4.9 4.2 5.0 3.8 2.3 3.8 3.0 4.25.8 1.6 6.1 3.7 4.4 4.5 8.7 5.5 1.5 2.8 3.6 2.1 3.0 1.7 0.8 2.6 1.6 2.3
42.0 69.5 50.0 51.6 58.4 52.5 40.2 44.6 43.9 51.6 62.3 53.8 51.5 66.0 71.9 63.6 68.0 60.117.7 16.2 25.3 30.4 21.2 20.8 16.2 35.2 42.9 32.0 23.1 28.4 30.9 17.7 13.6 19.5 16.2 23.2
506 480 221 249 237 1 693 6 764 292 87 129 154 780 1 442 1 486 522 372 894 3 822
21.1 52.7 32.6 23.3 33.8 33.7 54.7 7.9 10.3 7.8 9.1 7.6 8.0 6.7 31.6 12.1 23.5 11.121.5 25.6 46.6 56.2 44.7 34.3 22.4 74.3 75.9 74.4 83.1 70.3 73.2 37.7 43.5 52.7 47.3 53.35.9 3.8 6.8 8.0 7.6 6.0 3.8 6.2 5.7 10.1 4.5 5.3 5.8 41.7 8.4 12.9 10.3 20.8
46.2 12.1 7.7 6.4 8.0 20.3 12.9 8.2 4.6 0.8 1.3 9.1 7.1 8.9 8.8 14.2 11.1 8.72.8 3.5 3.6 4.4 3.4 3.4 3.7 2.4 3.4 6.2 1.3 5.6 4.4 2.2 3.8 4.8 4.3 3.5
27.9 35.2 43.0 49.4 46.8 37.7 28.0 55.8 49.4 62.8 69.5 44.5 51.4 26.4 42.7 41.4 42.2 39.519.6 30.4 24.0 20.9 21.5 23.7 17.3 9.9 13.8 14.0 11.7 12.3 12.0 24.0 34.3 20.2 28.4 20.520.4 10.6 10.9 9.6 11.0 13.5 17.0 13.0 12.6 5.4 6.5 13.6 11.9 13.9 7.1 15.6 10.6 12.413.6 6.3 5.4 5.6 8.9 8.6 11.9 4.5 8.0 6.2 3.2 7.2 6.2 14.7 3.8 11.6 7.0 9.73.2 3.3 1.8 2.8 1.7 2.8 2.8 2.4 3.4 0.0 0.0 5.8 3.8 2.6 1.1 0.8 1.0 2.7
13.0 12.1 12.2 10.0 7.6 11.5 20.5 13.4 12.6 10.9 8.4 14.6 13.2 15.8 7.1 7.3 7.2 12.82.4 2.1 2.7 1.6 2.5 2.2 2.5 1.0 0.0 0.8 0.6 2.1 1.5 2.6 3.8 3.2 3.6 2.4
8.3 7.5 8.1 7.2 6.4 7.6 7.4 9.2 8.0 3.9 8.4 6.3 7.0 5.5 7.7 6.2 7.0 6.416.2 12.1 17.2 14.1 14.8 14.7 13.9 16.8 10.3 15.5 13.0 13.6 14.1 12.1 12.5 11.0 11.9 12.814.0 10.2 9.5 12.4 15.3 12.3 13.2 14.4 17.2 18.6 16.2 16.8 16.4 15.3 14.0 11.8 13.1 15.27.5 1.7 7.2 5.2 4.7 5.1 4.7 7.5 4.6 5.4 7.8 8.3 7.6 9.1 5.6 6.5 5.9 7.8
19.0 21.7 15.4 21.3 22.0 20.0 14.5 15.8 21.8 15.5 23.4 13.2 15.5 18.7 17.0 20.2 18.3 17.44.2 1.9 2.3 2.4 3.4 2.9 3.1 6.2 11.5 7.8 2.6 5.0 5.6 6.5 5.7 7.5 6.5 6.18.7 4.6 6.8 9.6 8.5 7.4 8.0 5.5 6.9 7.8 7.1 8.7 7.7 9.2 10.2 9.9 10.1 8.86.7 1.7 3.6 3.2 3.4 3.9 5.1 6.5 3.4 3.1 3.2 5.9 5.3 6.3 3.6 5.6 4.5 5.5
12.8 8.8 15.4 12.0 8.5 11.3 16.8 12.3 12.6 19.4 8.4 10.1 11.4 9.6 8.8 6.7 7.9 9.92.4 29.6 14.5 12.4 12.7 14.6 13.1 5.8 3.4 3.1 9.7 11.9 9.2 7.6 14.4 14.0 14.2 9.70.2 0.4 0.0 0.0 0.4 0.2 0.3 0.0 0.0 0.0 0.0 0.1 0.1 0.1 0.6 0.5 0.6 0.2
Includes only doctorate recipients with definite employment plans.° Includes 2 respondents whose doctoral field was unknown.Source: NSF/NII-I/USED/NEH/USDNNASA, Survey of Earned Doctorates
7511

APPENDIX TABLE A-3c. Statistical profile of doctorate recipients, by major field, 2000
Total women
Characteristics
S 13(0.
g2000 >. t.c
b .cTotal 0.
o.ECu
La0 0z).za. 0
aa)
7.ai (i)uc a a a Ill2 o c o 0
a ) g 1 cua,
3 'a' z11J la
E 2 'En 1 u. 5om X 0 4 0 -I <A
Total Women
Women as a Percentof Total Doctorates 43.8
U.S. Citizenship 76.0Non-U.S., Permanent Visa 4.5Non-U.S., Temporary Visa 15.5Unknown 4.0
Never Married % 25.0Married 50.2Separated, Divorced 8.5Marriage-like Relationship 6.3Widowed 0.7Unknown 9.3
Median Age at Doctorate Yrs 34.5
Percent with Bacc. inSame Field as Doctorate 49.8
Percent with Masters 74.7
Median Time Lapse from Bacc. to Doct.Total Time Yrs 11.0Registered Time 7.6
Postdoctoral Study Plans % 22.9Fellowship 13.4Research Assoc. 6.8Traineeship 0.9Other Study 1.8
Planned Employmentafter Doctorate % 67.4
Educ. Institution° 41.5Industry/Business 11.5Government 4.0Nonprofit 4.4Other & Unknown 6.0
Postdoc. Plans Unknown % 9.7
Definite Postdoc. Study % 16.6Seeking Postdoc. Study 6.3Definite Employment 46.2Seeking Employment 21.2
Employment Commitmentsafter Doctorate c 8 376
Primary ActivityR & D % 21.5Teaching 43.6Administration 15.5Prof. Services 14.0Other 3.1
Secondary ActivityR & D % 35.4Teaching 17.8Administration 12.0Prof. Services 12.2Other 3.3No Secondary Activity 17.0
Activity(ies) Unknown % 2.2
Region of Employmentafter Doctorate
New EnglandMiddle AtlanticEast No. CentralWest No. CentralSouth AtlanticEast So. CentralWest So. CentralMountainPacific & InsularForeignRegion Unknown
6.614.514.47.5
19.15.18.35.2
12.86.20.2
204 624 238 258 142 1 466 839 325 2,296 1,063 313 3 997
14.7 31.4 30.3 24.6 16.5 24.1 15.7 41.8 45.2 66.9 28.8 46.9
50.0 60.1 67.6 55.8 51.4 58.3 49.6 63.7 69.5 75.6 52.4 69.38.3 7.5 5.0 7.4 9.2 7.4 8.1 7.4 6.8 4.0 7.0 6.2
37.3 27.7 25.2 32.2 34.5 30.1 36.0 27.1 20.3 15.3 39.0 21.04.4 4.6 2.1 4.7 4.9 4.2 6.3 1.8 3.4 5.0 1.6 3.5
38.2 30.3 28.2 32.9 17.6 30.3 30.6 36.0 30.5 23.7 32.6 29.343.1 51.8 48.3 51.6 52.8 50.1 52.0 50.2 50.6 52.6 47.6 50.9
4.4 4.0 6.3 2.7 10.6 4.8 3.0 2.8 4.5 9.2 6.7 5.85.4 5.3 8.8 3.9 5.6 5.7 4.3 7.4 7.0 4.9 5.8 6.40.5 0.3 1.3 0.8 0.7 0.6 0.2 0.0 0.3 1.0 0.3 0.58.3 8.3 7.1 8.1 12.7 8.5 9.9 3.7 7.2 8.6 7.0 7.3
29.8 29.4 33.6 30.3 34.1 30.3 30.6 30.0 30.8 40.2 33.3 32.2
68.6 76.3 34.9 72.5 35.2 63.8 68.9 24.0 57.0 51.0 43.5 51.6
64.7 37.5 71.0 81.0 83.1 58.8 75.6 37.5 39.4 84.3 85.0 54.7
7.3 7.0 9.6 7.8 11.3 7.8 8.2 7.6 8.2 15.4 10.2 9.36.6 6.0 7.7 7.0 8.0 6.6 6.7 6.5 7.0 8.0 7.1 7.0
49.0 42.3 50.8 23.3 9.2 38.1 21.5 75.1 64.5 17.1 39.9 50.815.7 19.4 20.2 11.6 2.1 16.0 7.3 49.2 41.2 10.6 12.5 31.531.9 21.5 29.0 10.9 4.9 20.7 12.0 20.0 16.9 4.0 25.6 14.40.0 0.5 0.4 0.4 0.7 0.4 1.2 0.6 1.9 0.7 1.0 1.41.5 1.0 1.3 0.4 1.4 1.0 1.0 5.2 4.5 1.8 1.0 3.6
42.6 49.0 41.2 69.0 78.2 53.2 67.8 20.0 28.4 74.0 52.7 41.87.8 9.3 14.3 44.2 35.2 18.6 14.7 6.5 10.5 41.7 24.6 19.6
27.0 32.1 11.3 18.6 32.4 25.6 42.7 10.8 9.2 10.3 13.4 10.01.5 3.2 7.6 0.8 4.2 3.3 5.2 0.6 3.4 8.7 8.3 5.02.0 0.6 2.1 2.7 0.7 1.4 1.9 0.3 1.8 8.0 2.2 3.44.4 3.8 5.9 2.7 5.6 4.2 3.3 1.8 3.6 5.3 4.2 4.08.3 8.7 8.0 7.8 12.7 8.7 10.7 4.9 7.1 8.8 7.3 7.4
34.8 34.3 35.7 18.2 7.0 29.1 13.6 58.8 48.6 12.4 22.0 37.814.2 8.0 15.1 5.0 2.1 8.9 7.9 16.3 15.8 4.7 17.9 13.124.0 32.4 26.9 50.4 63.4 36.5 45.4 11.7 17.2 54.8 33.9 28.018.6 16.7 14.3 18.6 14.8 16.7 22.4 8.3 11.2 19.3 18.8 13.7
49 202 64 130 90 535 381 38 395 582 106 1 121
49.0 67.3 39.1 30.0 55.6 51.2 66.1 47.4 40.5 29.9 49.1 36.024.5 18.8 31.3 58.5 24.4 31.4 13.1 28.9 32.9 40.7 32.1 36.82.0 1.5 6.3 0.0 6.7 2.6 2.1 2.6 4.8 12.0 2.8 8.3
10.2 6.4 14.1 6.2 6.7 7.7 10.5 15.8 13.9 12.0 9.4 12.612.2 4.5 6.3 2.3 3.3 4.7 5.0 2.6 4.3 2.2 1.9 2.9
26.5 16.8 39.1 57.7 20.0 30.8 18.9 31.6 28.9 35.6 31.1 32.612.2 5.0 17.2 12.3 32.2 13.5 16.8 5.3 12.7 18.9 21.7 16.510.2 19.8 6.3 3.8 10.0 11.8 10.2 15.8 15.9 13.2 14.2 14.410.2 12.4 10.9 9.2 10.0 10.8 11.8 15.8 13.9 14.6 14.2 14.40.0 2.0 7.8 2.3 3.3 2.8 3.1 2.6 3.0 2.7 2.8 2.9
38.8 42.6 15.6 11.5 21.1 27.9 36.0 26.3 22.3 11.9 12.3 16.12.0 1.5 3.1 3.1 3.3 2.4 3.1 2.6 3.3 3.1 3.8 3.2
12.2 10.4 4.7 7.7 4.4 8.2 5.8 18.4 6.6 7.6 2.8 7.118.4 26.2 9.4 16.9 18.9 20.0 17.1 23.7 14.2 12.9 6.6 13.16.1 10.9 4.7 20.0 12.2 12.1 12.9 7.9 12.2 15.1 10.4 13.48.2 3.5 6.3 9.2 0.0 5.0 4.7 2.6 5.6 7.2 14.2 7.16.1 17.3 18.8 16.9 14.4 15.9 16.8 23.7 16.7 19.9 11.3 18.12.0 3.0 3.1 5.4 5.6 3.9 2.6 0.0 3.0 5.8 2.8 4.4
10.2 7.4 17.2 5.4 13.3 9.3 7.6 5.3 8.6 8.4 7.5 8.34.1 4.0 12.5 3.1 3.3 4.7 3.9 0.0 6.1 3.3 7.5 4.5
24.5 13.4 10.9 10.8 21.1 14.8 19.7 10.5 20.0 9.3 13.2 13.56.1 4.0 10.9 4.6 5.6 5.4 8.4 7.9 6.8 10.5 23.6 10.32.0 0.0 1.6 0.0 1.1 0.6 0.5 0.0 0.3 0.0 0.0 0.1
NOTE: Field groupings may differ from those in reports published by federal sponsors of the Survey of Earned Doctorates.°Physical sciences includes mathematics and computer sciences.b Includes 2-year, 4-year, foreign colleges/universities, medical schools, and elementary/secondary schools.
8 76

APPENDIX TABLE A-3c. Statistical profile of doctorate recipients, by major field, 2000 (continued)
Total women
2
0.
.c
2,414 255
66.6 26.9
88.2 42.41.9 6.34.0 46.35.9 5.1
27.2 34.944.7 45.1
8.1 2.77.5 7.50.4 0.0
12.1 9.8
32.0 30.8
62.8 54.5
74.9 72.2
9.0 8.07.1 7.0
31.0 6.323.3 3.54.0 2.02.3 0.81.4 0.0
56.6 85.522.2 38.812.4 19.25.6 10.68.9 5.57.5 11.4
12.4 8.2
23.0 5.58.0 0.8
37.5 64.319.1 21.2
905 164
17.8 54.320.1 23.25.7 3.0
49.9 11.64.2 6.1
26.6 34.120.1 21.317.3 8.510.5 11.04.2 4.3
19.2 18.92.0 1.8
5.9 12.219.0 14.014.3 7.37.6 1.8
17.9 29.34.1 2.48.2 1.84.5 3.7
16.2 13.42.1 14.00.2 0.0
Qs>.
2 ,o cO.
< .
7;cc
TJ 20 07,71 1.2 .
a. E
0o
.e,
7,
fw. TO0 co
8 ;.)co
a .
0 -10 °co z
0co Ew LIJo w-i z za -
8 lej (-21- (.0 la
25 eu.5 eE B.<
-J.0.e
CL1J -1
-Jc11 2)o
-J
618 262 330 3 879 10 181 406 262 360 394
58.2 35.1 44.8 54.5 37.6 38.3 57.0 59.0 61.5
80.4 78.6 71.5 81.9 70.9 85.2 88.9 87.8 69.35.0 3.4 4.2 3.0 5.3 3.2 2.3 3.3 10.9
11.2 13.7 19.1 9.8 19.3 8.1 5.7 7.5 17.83.4 4.2 5.2 5.3 4.5 3.4 3.1 1.4 2.0
27.8 27.9 23.3 27.5 28.9 22.9 26.0 27.5 26.443.4 46.2 48.5 45.0 48.6 50.2 46.2 46.9 52.310.5 6.1 9.4 8.1 6.3 8.6 11.1 8.3 8.69.4 9.9 6.7 7.9 6.7 9.6 10.3 11.4 6.90.2 0.0 0.0 0.3 0.4 0.2 1.1 1.7 0.58.7 9.9 12.1 11.3 9.2 8.4 5.3 4.2 5.3
35.1 33.3 34.7 32.7 31.9 34.5 34.0 34.1 35.1
77.2 49.6 19.7 60.0 58.0 51.7 63.7 70.6 49.5
80.6 76.3 82.1 76.3 65.3 83.5 87.8 88.9 86.5
11.6 10.3 11.5 9.6 9.0 11.5 10.3 11.3 11.19.0 8.2 8.0 7.6 7.1 9.0 8.5 9.0 8.6
16.8 8.0 11.2 23.9 36.3 10.1 5.3 4.7 8.611.3 4.2 4.8 17.2 21.8 6.9 3.4 3.3 3.83.6 2.3 4.2 3.7 11.0 1.7 0.8 0.0 1.50.5 0.0 0.3 1.6 1.3 0.2 0.0 0.0 0.81.5 1.5 1.8 1.4 2.2 1.2 1.1 1.4 2.5
73.6 81.7 76.1 64.6 54.2 80.0 89.3 89.7 85.348.4_, 53.4 43.3 31.4 23.5 57.9 68.7 70.8 70.6
6.5 --- 9.5 12.7 11.8 15.6 6.2 6.9 7.8 4.65.3 3.8 7.6 5.9 5.1 2.7 1.5 0.6 1.57.0 5.7 7.3 8.0 4.7 3.2 1.9 1.1 1.36.5 9.2 5.2 7.5 5.3 10.1 10.3 9.4 7.49.5 10.3 12.7 11.5 9.4 9.9 5.3 5.6 6.1
11.2 5.3 7.3 17.5 26.8 6.7 3.4 3.1 5.65.7 2.7 3.9 6.4 9.5 3.4 1.9 1.7 3.0
48.4 53.1 50.0 43.1 36.4 49.5 51.9 52.8 56.325.2 28.6 26.1 21.4 17.8 30.5 37.4 36.9 28.9
299 139 165 1 672 3 709 201 136 190 222
30.8 27.3 27.3 25.4 36.5 15.9 4.4 4.7 9.051.8 58.3 49.1 32.1 31.5 69.7 77.9 82.1 82.09.0 5.8 11.5 6.6 6.1 4.5 5.9 2.6 3.66.0 4.3 7.3 30.3 19.7 4.0 3.7 4.2 1.41.7 2.2 4.2 3.8 3.8 5.0 5.1 2.6 0.9
47.2 54.7 46.7 35.3 32.2 57.2 61.0 55.3 64.419.4 16.5 17.0 19.5 17.4 12.9 11.0 7.4 8.611.4 10.1 10.9 14.2 13.5 8.5 6.6 13.7 8.69.7 5.0 9.1 9.8 11.5 4.5 2.9 3.7 5.01.7 2.9 1.2 3.3 3.1 6.5 2.2 5.3 2.3
10.0 8.6 14.5 16.2 19.9 9.5 13.2 11.6 8.10.7 2.2 0.6 1.6 2.4 1.0 2.9 3.2 3.2
9.4 5.8 6.1 7.1 7.1 8.0 8.1 7.9 12.212.4 14.4 17.6 16.8 16.2 15.4 14.0 16.8 18.014.4 15.8 14.5 13.8 13.3 16.4 11.0 14.2 19.46.4 3.6 6.7 6.4 6.3 4.0 3.7 9.5 11.7
19.4 22.3 21.2 20.0 18.5 23.4 16.2 17.9 8.63.7 2.9 4.2 3.8 3.9 5.0 4.4 5.8 4.14.3 9.4 7.9 6.9 7.8 6.5 8.1 7.4 6.87.4 3.6 4.2 4.8 4.6 5.0 8.1 3.7 3.2
13.4 11.5 12.1 14.7 14.8 10.0 18.4 11.6 10.49.4 10.8 5.5 5.6 7.3 6.5 8.1 4.2 5.40.0 0.0 0.0 0.1 0.2 0.0 0.0 1.1 0.5
«-.
0 =
]°a u) usz 0 us
To 0 -' 001 t cc7) ILI
zes 5 *(94
crs u- su
us cc _J. r.)E F E .(Ei is' u. us .;( 0La 2 2 ru tc0 1--= oi- Ozco 2 0 a. Jr a. 0 1- z
1,408
49.2
72.95.0
17.74.3
28.444.98.47.30.9
10.1
35.0
48.8
83.4
11.58.9
7.84.01.60.41.8
80.960.96.21.34.87.7
11.3
4.23.6
49.831.1
701
10.073.3
4.95.34.4
48.213.311.47.36.7
11.02.1
8.012.016.511.815.54.17.73.1
11.49.60.1
2 830 4 167 340 601 943 7 938
50.2 64.9 31.7 50.7 41.7 55.5
77.6 87.7 72.6 76.7 75.1 82.65.1
13.91.97.1
7.416.8
3.716.1
30156.. 4130..6
3.4 3.2 3.2 3.5 3.6 3.3
27.0 14.6 25.6 23.3 24.1 20.147.1 56.1 52.4 49.3 50.3 52.2
8.7 13.4 7.4 11.3 9.9 11.38.4 4.0 4.4 6.0 5.4 5.70.9 1.3 0.9 1.2 1.1 1.18.0 10.6 9.4 9.0 9.3 9.5
34.7 44.9 36.5 39.1 38.3 39.9
46.6 35.9 35.3 30.3 32.0 39.3
84.9 88.0 80.3 90.8 86.9 86.8
11.3 20.0 12.5 15.2 14.4 15.08.9 8.2 7.5 8.1 8.0 8.4
7.6 4.3 3.5 6.8 5.6 5.74.3 1.4 1.5 3.2 2.5 2.61.3 1.7 1.5 0.8 1.1 1.50.3 0.3 0.3 0.0 0.1 0.31.7 0.9 0.3 2.8 1.9 1.3
83.3 84.6 87.9 84.2 85.4 84.363.8 66.0 65.3 57.4 60.1 64.5
6.2 5.1 16.2 8.7 11.3 6.21.4 3.2 1.2 4.2 3.1 2.63.4 3.9 2.4 8.8 6.5 4.08.4 6.4 2.9 5.2 4.3 6.99.1 11.0 8.5 9.0 9.0 10.1
4.5 2.9 3.2 4.2 3.8 3.63.1 1.5 0.3 2.7 1.8 2.1
51.2 62.4 70.0 62.9 65.3 58.832.0 22.2 17.9 21.3 20.0 25.5
14N 2 N1 238 378 616 4 667
9.4 7.2 34.9 10.6 20.0 9.675.7 40.4 46.2 59.0 54.1 53.2
4.4 35.9 6.3 14.8 11.5 22.94.2 12.3 9.2 11.4 10.6 9.63.8 2.0 2.1 2.1 2.1 2.6
54.1 26.4 45.4 51.1 48.9 37.911.5 19.8 38.2 17.5 25.5 18.010.4 12.3 3.4 8.2 6.3 10.95.7 18.0 5.0 9.5 7.8 12.85.4 2.9 1.3 1.9 1.6 3.5
10.6 18.5 5.5 9.8 8.1 14.72.3 2.1 1.3 2.1 1.8 2.1
8.6 5.1 5.9 4.8 5.2 6.214.2 11.8 16.4 17.0 16.7 13.216.1 15.0 14.3 14.9 14.6 15.39.7 8.3 3.4 9.0 6.8 8.5
15.9 22.2 14.7 18.6 17.1 19.64.5 7.2 5.0 5.8 5.5 6.17.4 9.9 6.7 7.7 7.3 8.83.9 6.2 9.7 6.6 7.8 5.7
11.7 10.9 14.3 8.2 10.6 11.17.7 3.5 9.2 6.9 7.8 5.40.3 0.1 0.4 0.5 0.5 0.2
'Includes only doctorate recipients with definite employment plans.° Includes 2 respondents whose doctoral field was unknown.
Source: NSF/NIHILISED/NEHIUSDNNASA, Survey of Earned Doctorates
77

APPENDIX TABLE A-4. Statistical profile of doctorate recipients, by race/ethnicity and citizenship, 2000
Characteristics
Total a AmericanIndian b
Total
Asian' Black
Total U.S.Non-U.S.
Total U.S.Non-U.S.
Total U.S.
Non-U.S.
Perm. Temp. Perm. Temp. Perm. Temp.
Total Number 41,368 27,888 1,949 9,648 169 8,110 1,407 908 5,770 2,123 1,656 119 335
Male % 56.0 50.6 58.3 70.9 45.0 66.3 54.1 55.5 70.9 41.9 34.3 68.9 69.6
Female 43.8 49.4 41.6 29.1 55.0 33.7 45.9 44.5 29.1 58.1 65.7 31.1 30.4
Doctoral FieldPhysical Sciences° % 14.7 11.7 18.4 22.4 10.1 20.2 14.2 19.7 21.7 6.4 5.2 12.6 10.4
Engineering 12.9 7.9 18.0 25.3 4.7 26.3 17.6 22.0 29.1 5.3 4.6 5.9 8.7
Life Sciences 20.6 19.8 25.8 22.7 15.4 25.8 28.6 31.3 24.3 15.3 11.7 23.5 30.4
Social Sciences 17.2 19.5 12.9 10.8 23.7 9.9 15.6 9.7 8.6 19.9 20.9 18.5 15.5
Humanities 13.6 15.9 12.9 7.7 12.4 6.2 10.0 6.6 5.2 9.8 9.7 10.9 9.9
Education 15.5 19.8 6.4 5.6 30.2 6.1 9.0 5.2 5.5 35.8 41.1 16.0 15.5
Professional/Other 5.5 5.5 5.6 5.5 3.6 5.6 5.0 5.5 5.8 7.6 6.9 12.6 9.6
Median Age at Doctorate Yrs 33.6 34.0 34.6 32.6 40.0 32.6 31.2 34.5 32.6 38.4 38.4 39.6 38.1
Median Time Lapse from Bacc. to Doct.
Total Time Yrs 10.3 10.6 11.0 9.8 12.0 10.0 8.5 12.1 10.0 13.3 13.5 12.5 13.0
Registered Time 7.4 7.5 7.9 7.1 8.0 7.3 7.1 8.4 7.3 7.7 7.8 8.1 7.4
Doctoral Program Support'Teaching Assistantships 17.4 16.3 19.8 20.0 10.6 17.9 14.3 19.9 18.5 11.0 7.8 16.2 24.9
Research Assistantships/Traineeships 24.9 18.9 33.6 40.7 10.6 43.6 31.3 40.2 47.2 11.5 8.7 18.9 22.6
Fellowships/Dissertation Grants 18.8 19.3 18.8 17.4 24.8 17.1 28.2 16.4 14.5 30.6 30.7 23.4 32.8
Own Resources 32.2 40.4 22.7 10.2 44.7 14.3 21.8 19.0 11.7 41.6 47.6 37.8 13.1
Foreign Government 2.7 0.1 2.8 10.4 1.2 5.4 0.5 1.9 7.1 0.9 0.1 1.8 4.9
Employer 3.6 4.6 2.1 1.0 6.2 1.5 3.5 2.2 0.8 3.9 4.6 1.8 1.3
Other 0.3 0.4 0.2 0.2 1.9 0.2 0.4 0.4 0.2 0.4 0.5 0.0 0.3
Postdoctoral PlansPostdoctoral study plans % 25.1 23.2 29.9 34.3 18.3 35.5 34.0 32.9 36.3 19.5 16.5 26.1 32.2
Postdoctoral employment plans % 65.2 71.6 63.9 59.5 74.6 59.2 60.6 61.9 58.6 72.7 76.1 69.7 59.7
Educational Institution° 35.7 41.9 28.8 26.2 51.5 22.2 23.2 20.6 22.3 47.5 51.3 39.5 33.4
Industry/Business 17.1 14.8 26.1 25.0 7.1 29.0 24.9 32.7 29.5 9.9 9.4 16.0 10.4
Government 4.5 5.3 2.3 3.5 7.1 3.2 3.8 3.0 3.1 6.5 6.8 5.0 6.0
Nonprofit 3.5 4.4 2.3 1.6 3.0 2.1 4.1 2.4 1.5 4.0 4.2 2.5 3.6
Other/Unknown 4.5 5.3 4.4 3.1 5.9 2.7 4.5 3.2 2.2 4.9 4.5 6.7 6.3
Postdoctoral plans unknown % 9.7 5.2 6.2 6.3 7.1 5.3 5.4 5.2 5.1 7.8 7.3 4.2 8.1
Definite Postdoctoral Study % 18.4 18.0 18.0 23.2 14.2 23.9 26.2 19.6 24.1 12.3 11.6 10.1 17.0
Seeking Postdoctoral Study 6.6 5.1 11.9 11.1 4.1 11.6 7.9 13.3 12.2 7.2 5.0 16.0 15.2
Definite Employment 45.8 51.3 39.8 40.0 54.4 38.0 39.0 38.0 37.8 48.4 51.9 40.3 36.1
Seeking Employment 19.4 20.3 24.1 19.5 20.1 21.2 21.5 23.9 20.7 24.3 24.3 29.4 23.6
Employment Locationafter Doctorate aU.S. % 90.4 98.2 90.6 61.5 94.6 77.0 96.4 94.2 69.4 92.6 99.4 89.6 45.5
Foreign 9.4 1.7 9.1 38.1 5.4 22.6 3.1 5.2 30.2 7.3 0.5 10.4 54.5
Unknown 0.2 0.2 0.3 0.5 0.0 0.4 0.5 0.6 0.4 0.1 0.1 0.0 0.0
78

APPENDIX TABLE A-4. Statistical profile of doctorate recipients, by race/ethnicity and citizenship, 2000 (continued)
White PuertoRicanTotal
Mexican American Other Hispanic Unknown Race
Total U.S.Non-U.S.
Total U.S.Non-U.S.
Total U.S.Non-U.S.
Total U.S.
Non-U.S.Perm. Temp. Perm. Temp. Perm. Temp. Perm. Temp.
26,328 22,911 740 2,605 307 464 396 15 52 1,158 454 107 592 2,709 588 60 294
53.8 51.6 61.2 71.1 40.4 54.3 49.0 86.7 84.6 58.8 48.9 43.0 69.6 59.7 58.0 65.0 69.746.2 48.4 38.8 28.9 59.6 45.7 51.0 13.3 15.4 41.2 51.1 57.0 30.4 37.7 41.5 31.7 29.9
13.8 12.1 19.9 27.4 9.8 10.8 9.6 13.3 19.2 11.7 9.9 6.5 13.9 16.0 13.1 15.0 23.59.2 7.7 16.8 20.4 6.5 8.0 6.3 0.0 23.1 13.7 5.1 11.2 20.9 16.6 9.0 11.7 23.8
19.6 19.9 20.7 17.0 16.0 17.7 15.4 20.0 34.6 25.5 21.6 25.2 28.5 18.2 19.6 13.3 18.418.7 19.4 14.5 13.4 24.8 20.5 21.2 20.0 13.5 19.1 22.0 19.6 16.6 19.4 21.8 16.7 13.316.2 16.6 17.8 11.8 14.7 14.9 15.4 33.3 5.8 15.5 17.8 25.2 12.0 13.2 17.3 25.0 9.517.1 18.8 6.1 4.8 23.1 25.2 28.8 13.3 1.9 10.7 18.9 7.5 4.9 11.6 15.5 5.0 6.85.4 5.5 4.3 5.2 5.2 3.0 3.3 0.0 1.9 3.9 4.6 4.7 3.2 5.0 3.7 13.3 4.8
33.6 33.9 33.8 31.6 35.1 35.0 34.5 35.5 37.0 34.9 34.5 35.2 35.0 33.6 34.7 35.2 33.0
10.3 10.6 9.9 8.2 11.3 10.2 10.0 11.8 12.3 10.4 10.3 10.5 10.5 10.0 10.2 13.0 9.87.4 7.5 7.3 6.7 8.2 7.3 7.3 8.3 6.9 7.2 7.6 7.0 6.9 7.5 7.7 9.1 7.0
18.0 17.3 19.3 23.6 12.9 10.5 10.7 26.7 4.1 18.6 17.2 26.0 18.3 14.0 10.1 16.7 21.121.0 19.3 30.7 33.3 12.5 11.4 10.2 20.0 18.4 19.9 13.3 17.0 25.5 25.2 20.9 29.2 29.717.7 17.3 20.9 20.5 31.9 30.2 32.1 20.0 18.4 22.9 24.5 22.0 21.8 22.7 24.6 4.2 22.737.2 41.0 23.4 8.0 36.6 39.1 44.1 20.0 6.1 21.7 41.0 28.0 5.9 27.8 39.2 45.8 4.9
1.4 0.1 3.4 13.1 0.0 6.7 0.8 6.7 53.1 14.3 0.0 6.0 26.6 7.0 0.3 4.2 21.14.4 4.8 2.2 1.4 5.7 1.6 1.6 6.7 0.0 2.3 3.3 1.0 1.8 2.9 4.8 0.0 0.00.3 0.3 0.1 0.1 0.4 0.4 0.5 0.0 0.0 0.4 0.7 0.0 0.2 0.5 0.3 0.0 0.5
24.2 23.1 29.6 32.9 18.9 27.4 27.8 20.0 26.9 27.6 27.8 23.4 28.4 6.5 16.3 10.0 21.8
71.3 72.7 66.9 61.5 72.0 69.0 69.4 66.7 67.3 67.4 67.2 72.0 67.4 16.1 47.4 30.0 42.241.2 42.7 35.5 31.0 4-4.0 42.2 41.7 46.7 46.2 40.2 40.3 45.8 39.4 8.5 25.9 15.0 22.415.7 14.9 22.6 21.4 13.7 11.0 10.9 20.0 9.6 13.4 12.8 16.8 13.3 4.1 11.1 6.7 11.25.0 5.3 1.4 3.4 7.5 5.6 5.3 0.0 9.6 5.3 5.1 0.9 6.3 1.2 3.2 1.7 4.44.2 4.6 2.0 1.5 2.6 3.7 4.3 0.0 0.0 3.5 4.4 3.7 2.7 0.4 1.5 1.7 0.75.2 5.3 5.4 4.2 4.2 6.5 7.3 0.0 1.9 5.2 4.6 4.7 5.7 1.8 5.8 5.0 3.4
4.6 4.2 3.5 5.6 9.1 3.7 2.8 13.3 5.8 4.9 5.1 4.7 4.2 77.4 36.2 60.0 36.1
18.6 18.1 19.1 23.6 13.7 21.3 21.2 13.3 25.0 20.4 22.7 15.0 19.6 4.5 12.1 3.3 15.65.5 5.0 10.5 9.3 5.2 6.0 6.6 6.7 1.9 7.3 5.1 8.4 8.8 2.0 4.3 6.7 6.1
51.4 52.7 42.8 44.1 51.5 47.8 46.5 53.3 57.7 48.6 47.4 48.6 50.0 10.2 31.5 10.0 26.219.8 20.0 24.1 17.4 20.5 21.1 23.0 13.3 9.6 18.8 19.8 23.4 17.4 5.9 16.0 20.0 16.0
94.4 98.3 87.7 56.1 99.4 89.6 98.9 100.0 30.0 64.3 94.4 84.6 38.9 79.7 95.1 83.3 41.65.4 1.6 12.3 43.2 0.6 10.4 1.1 0.0 70.0 35.5 5.1 15.4 61.1 18.1 3.2 16.7 55.80.2 0.1 0.0 0.7 0.0 0.0 0.0 0.0 0.0 0.2 0.5 0.0 0.0 2.2 1.6 0.0 2.6
NOTE: Field groupings may differ from those in reports published by federal sponsors of the Survey of Earned Doctorates.o Includes 74 individuals who did not report their gender and 1,883 individuals who did not report their citizenship at time of doctorate.°Includes Alaskan Native.°Includes Pacific Islander.°Includes mathematics and computer sciences.o Includes 5 persons for whom field was unknown.In this table, a recipient counts once in each source category from which he or she received support.Since students indicate multiple sources of support, the vertical percentages can sum to more than 100 percent.(Data on the °primary' source of support for doctorate recipients are presented in the Summary Report.)
9 Includes 2-year, 4-year, foreign colleges/universities, medical schools, and elementary/secondary schools." Includes only recipients with definite employment plans.
Source: NSF/NIH/USED/NEH/USDNNASA, Survey of Earned Doctorates
79. 3 1
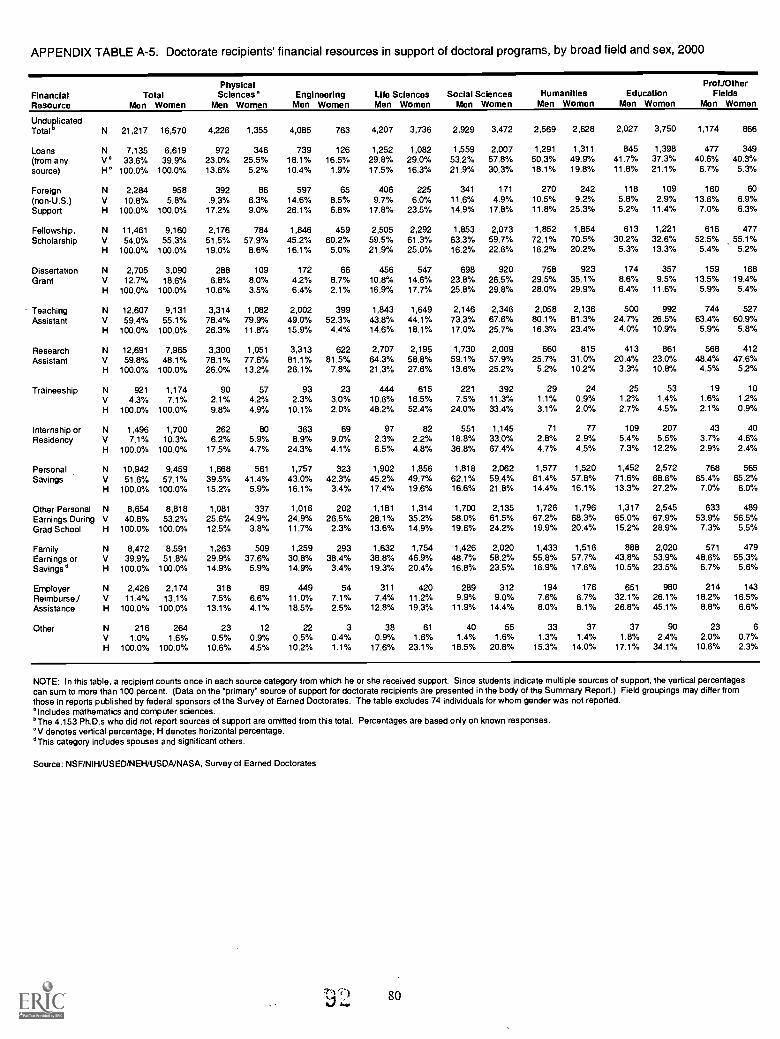
APPENDIX TABLE A-5. Doctorate recipients financial resources in support of doctoral programs, by broad field and sex, 2000
FinancialResource
TotalMen Women
PhysicalSciences °
Men WomenEngineeringMen Women
Life SciencesMen Women
Social SciencesMen Women
HumanitiesMen Women
EducationMen Women
ProfJOtherFields
Men Women
UnduplicatedTotal° N 21,217 16,570 4,226 1,355 4,085 763 4,207 3,736 2,929 3,472 2,569 2,628 2,027 3,750 1,174 866
Loans N 7,135 6,619 972 346 739 126 1,252 1,082 1,559 2,007 1,291 1,311 845 1,398 477 349(from any V° 33.6% 39.9% 23.0% 25.5% 18.1% 16.5% 29.8% 29.0% 53.2% 57.8% 50.3% 49.9% 41.7% 37.3% 40.6% 40.3%
source) H ° 100.0% 100.0% 13.6% 5.2% 10.4% 1.9% 17.5% 16.3% 21.9% 30.3% 18.1% 19.8% 11.8% 21.1% 6.7% 5.3%
Foreign N 2,284 958 392 86 597 65 406 225 341 171 270 242 118 109 160 60(non-U.S.) V 10.8% 5.8% 9.3% 6.3% 14.6% 8.5% 9.7% 6.0% 11.6% 4.9% 10.5% 9.2% 5.8% 2.9% 13.6% 6.9%Support H 100.0% 100.0% 17.2% 9.0% 26.1% 6.8% 17.8% 23.5% 14.9% 17.8% 11.8% 25.3% 5.2% 11.4% 7.0% 6.3%
Fellowship, N 11,461 9,160 2,176 784 1,846 459 2,505 2,292 1,853 2,073 1,852 1,854 613 1,221 616 477
Scholarship V 54.0% 55.3% 51.5% 57.9% 45.2% 60.2% 59.5% 61.3% 63.3% 59.7% 72.1% 70.5% 30.2% 32.6% 52.5% 55.1%H 100.0% 100.0% 19.0% 8.6% 16.1% 5.0% 21.9% 25.0% 16.2% 22.6% 16.2% 20.2% 5.3% 13.3% 5.4% 5.2%
Dissertation N 2,705 3,090 288 109 172 66 456 547 698 920 758 923 174 357 159 168
Grant V 12.7% 18.6% 6.8% 8.0% 4.2% 8.7% 10.8% 14.6% 23.8% 26.5% 29.5% 35.1% 8.6% 9.5% 13.5% 19.4%
H 100.0% 100.0% 10.6% 3.5% 6.4% 2.1% 16.9% 17.7% 25.8% 29.8% 28.0% 29.9% 6.4% 11.6% 5.9% 5.4%
Teaching N 12,607 9,131 3,314 1,082 2,002 399 1,843 1,649 2,146 2,346 2,058 2,136 500 992 744 527Assistant V 59.4% 55.1% 78.4% 79.9% 49.0% 52.3% 43.8% 44.1% 73.3% 67.6% 80.1% 81.3% 24.7% 26.5% 63.4% 60.9%
H 100.0% 100.0% 26.3% 11.8% 15.9% 4.4% 14.6% 18.1% 17.0% 25.7% 16.3% 23.4% 4.0% 10.9% 5.9% 5.8%
Research N 12,691 7,965 3,300 1,051 3,313 622 2,707 2,195 1,730 2,009 660 815 413 861 568 412
Assistant V 59.8% 48.1% 78.1% 77.6% 81.1% 81.5% 64.3% 58.8% 59.1% 57.9% 25.7% 31.0% 20.4% 23.0% 48.4% 47.6%H 100.0% 100.0% 26.0% 13.2% 26.1% 7.8% 21.3% 27.6% 13.6% 25.2% 5.2% 10.2% 3.3% 10.8% 4.5% 5.2%
Traineeship N 921 1,174 90 57 93 23 444 615 221 392 29 24 25 53 19 10
V 4.3% 7.1% 2.1% 4.2% 2.3% 3.0% 10.6% 16.5% 7.5% 11.3% 1.1% 0.9% 1.2% 1.4% 1.6% 1.2%
H 100.0% 100.0% 9.8% 4.9% 10.1% 2.0% 48.2% 52.4% 24.0% 33.4% 3.1% 2.0% 2.7% 4.5% 2.1% 0.9%
Internship or N 1,496 1,700 262 80 363 69 97 82 551 1,145 71 77 109 207 43 40Residency V 7.1% 10.3% 6.2% 5.9% 8.9% 9.0% 2.3% 2.2% 18.8% 33.0% 2.8% 2.9% 5.4% 5.5% 3.7% 4.6%
H 100.0% 100.0% 17.5% 4.7% 24.3% 4.1% 6.5% 4.8% 36.8% 67.4% 4.7% 4.5% 7.3% 12.2% 2.9% 2.4%
Personal N 10,942 9,459 1,668 561 1,757 323 1,902 1,856 1,818 2,062 1,577 1,520 1,452 2,572 768 565
Savings V 51.6% 57.1% 39.5% 41.4% 43.0% 42.3% 45.2% 49.7% 62.1% 59.4% 61.4% 57.8% 71.6% 68.6% 65.4% 65.2%H 100.0% 100.0% 15.2% 5.9% 16.1% 3.4% 17.4% 19.6% 16.6% 21.8% 14.4% 16.1% 13.3% 27.2% 7.0% 6.0%
Other Personal N 8,654 8,818 1,081 337 1,016 202 1,181 1,314 1,700 2,135 1,726 1,796 1,317 2,545 633 489Earnings During V 40.8% 53.2% 25.6% 24.9% 24.9% 26.5% 28.1% 35.2% 58.0% 61.5% 67.2% 68.3% 65.0% 67.9% 53.9% 56.5%Grad School H 100.0% 100.0% 12.5% 3.8% 11.7% 2.3% 13.6% 14.9% 19.6% 24.2% 19.9% 20.4% 15.2% 28.9% 7.3% 5.5%
Family N 8,472 8,591 1,263 509 1,259 293 1,632 1,754 1,426 2,020 1,433 1,516 888 2,020 571 479Earnings or V 39.9% 51.8% 29.9% 37.6% 30.8% 38.4% 38.8% 46.9% 48.7% 58.2% 55.8% 57.7% 43.8% 53.9% 48.6% 55.3%Savings ° H 100.0% 100.0% 14.9% 5.9% 14.9% 3.4% 19.3% 20.4% 16.8% 23.5% 16.9% 17.6% 10.5% 23.5% 6.7% 5.6%
Employer N 2,426 2,174 318 89 449 54 311 420 289 312 194 176 651 980 214 143
Reimburse./ V 11.4% 13.1% 7.5% 6.6% 11.0% 7.1% 7.4% 11.2% 9.9% 9.0% 7.6% 6.7% 32.1% 26.1% 18.2% 16.5%Assistance H 100.0% 100.0% 13.1% 4.1% 18.5% 2.5% 12.8% 19.3% 11.9% 14.4% 8.0% 8.1% 26.8% 45.1% 8.8% 6.6%
Other N 216 264 23 12 22 3 38 61 40 55 33 37 37 90 23 6
V 1.0% 1.6% 0.5% 0.9% 0.5% 0.4% 0.9% 1.6% 1.4% 1.6% 1.3% 1.4% 1.8% 2.4% 2.0% 0.7%H 100.0% 100.0% 10.6% 4.5% 10.2% 1.1% 17.6% 23.1% 18.5% 20.8% 15.3% 14.0% 17.1% 34.1% 10.6% 2.3%
NOTE: In this table, a recipient counts once in each source category from which he or she received support. Since students indicate multiple sources ofsupport, the vertical percentagescan sum to more than 100 percent. (Data on the °primary" source of support for doctorate recipients are presented in the body of the Summary Report.) Field groupings may differ fromthose in reports published by federal sponsors of the Survey of Earned Doctorates. The table excludes 74 individuals for whom gender was not reported.°Includes mathematics and computer sciences.°The 4,153 Ph.D.s who did not report sources of support are omitted from this total. Percentages are based only on known responses.°V denotes vertical percentage; H denotes horizontal percentage.'This category includes spouses and significant others.
Source: NSF/NIH/USEDINEH/USDNNASA, Survey of Earned Doctorates
80

APPENDIX TABLE A-6. State of doctoral institution of doctorate recipients, by broad field and sex, 2000
StateTotal °
Men Women
PhysicalSciences°
Men WomenEngineering
Men Women
LifeSciences
Men Women
SocialSciences
Men WomenHumanities
Men WomenEducation
Men Women
ProfJOtherFields °
Men Women
U.S. Total° 23,173 18,121 4,596 1,466 4,463 839 4,524 3,997 3,227 3,879 2,799 2,830 2,250 4,167 1,314 943
Alabama 294 222 52 12 55 11 79 67 26 37 16 12 45 69 21 14
Alaska 15 s 7 1 3 o 3 3 1 0 0 1 1 o o 0
Arizona 438 300 94 32 81 13 72 57 54 49 50 50 53 80 34 19
Arkansas 75 54 10 6 7 0 31 16 3 7 9 3 12 18 3 4
California 2,659 2,040 590 156 603 122 448 411 457 574 295 352 174 344 92 81
Colorado 430 313 116 42 96 23 71 73 45 58 39 31 38 67 25 19
Connecticut 330 287 58 25 40 9 79 82 63 60 68 71 11 35 11 5Delaware 113 71 28 5 34 2 9 4 15 16 15 15 11 28 1 1
Dist. of Columbia 265 270 31 8 36 6 31 57 60 96 61 45 20 42 26 16
Florida 936 949 139 48 145 22 122 92 105 171 60 67 265 483 100 66
Georgia 496 436 79 35 134 27 87 91 64 82 42 60 57 116 33 25Hawaii 84 68 16 4 6 2 13 20 21 16 24 17 3 8 1 1
Idaho 64 34 16 1 4 0 24 6 5 4 0 2 15 21 0Illinois 1,246 935 249 57 240 59 210 176 208 202 158 172 119 208 62 61
Indiana 706 463 155 35 132 17 119 96 85 89 118 107 64 99 33 20Iowa 367 199 60 22 68 6 114 49 33 28 48 38 30 46 14 10
Kansas 218 197 48 18 25 3 40 45 39 43 31 31 31 49 4 8
Kentucky 186 166 24 9 29 4 49 45 25 40 23 16 19 46 17 6
Louisiana 350 259 64 21 47 13 85 62 48 49 45 38 29 62 32 14
Maine 33 16 15 2 5 1 6 7 3 2 1 0 3 4 0 o
Maryland 515 438 101 47 118 21 139 168 68 79 54 72 20 36 15 15
Massachusetts 1,223 868 277 89 254 59 214 230 180 187 151 135 65 118 82 50
Michigan 869 611 163 52 224 40 165 132 116 148 93 92 64 102 44 45Minnesota 451 376 74 21 77 14 104 91 53 72 49 54 54 92 40 32
Mississippi 189 162 26 15 15 4 46 21 16 27 21 14 38 73 27 8
Missouri 427 294 67 16 75 10 98 58 60 76 64 43 49 77 14 14
Montana 37 28 8 2 2 0 14 10 3 3 0 0 10 13 0 0Nebraska 156 141 24 6 7 1 52 37 29 25 15 21 19 36 10 15
Nevada 68 47 18 6 5 3 18 7 13 11 3 7 8 13 3 0New Hampshire 41 46 17 14 2 2 13 17 3 5 3 3 3 5
New Jersey 513 370 128 42 104 29 84 81 63 73 81 76 23 42 30 27New Mexico 151 119 30 9 34 4 25 13 16 20 16 23 20 43 10 7
New York 1,910 1,612 421 110 279 43 349 305 332 424 330 363 117 270 82 97North Carolina 583 525 106 52 102 26 144 173 89 84 79 76 42 98 21 16
North Dakota 35 23 12 1 2 0 14 0 3 9 1 3 3 10 0Ohio 1,007 786 181 51 225 38 193 184 115 152 115 111 119 207 59 43
Oklahoma 209 172 44 18 28 5 43 25 41 36 20 18 23 62 10 8Oregon 220 161 58 21 24 5 67 60 20 21 23 16 18 31 10 7
Pennsylvania 1,137 962 192 78 255 61 198 202 152 194 129 163 122 214 89 50Puerto Rico 37 92 8 3 0 o 2 10 13 47 2 1 12 31 0 o
Rhode Island 145 97 50 20 21 2 15 15 26 19 30 36 0 3 3 2South Carolina 218 183 31 14 37 7 60 45 21 31 26 19 26 56 17 11
South Dakota 44 35 1 1 3 1 8 4 7 7 2 0 23 22 0 0Tennessee 340 338 62 16 55 8 67 76 40 73 26 34 58 122 32 9
Texas 1,487 1,052 269 93 343 52 287 256 167 179 167 145 130 276 124 51
Utah 234 111 49 10 52 .7 58 32 34 38 11 6 21 12 9 6
Vermont 33 32 7 1 3 o 9 7 3 9 s 3 6 12 o 0Virginia 589 449 121 43 138 25 96 82 75 102 46 39 81 130 32 28
Washington 355 277 76 32 67 14 81 87 40 31 53 61 23 42 15 10West Virginia 81 53 15 5 17 2 21 5 12 18 3 2 13 21 o o
Wisconsin 521 348 99 30 102 15 133 100 48 54 78 66 34 61 27 22Wyoming 43 29 10 9 3 1 15 5 9 2 0 0 6 12 0 0
NOTE: Field groupings may differ from those in reports published by federal sponsors of the Si Ney of Earned Doctorates.°Excludes 74 individuals for whom gender was not reported.°Includes mathematics and computer sciences.°Includes the 50 states, District of Columbia, and Puerto Rico.°Includes 4 persons for whom field was unknown.
Source: NSF/NIH/USED/NEH/USDNNASA, Survey of Earned Doctorates
81 93

APPENDIX TABLE A-7. Institutions granting research doctorates, by major field, 2000
State/Institution
0 0 i0j 2 a.0 a E
41 t P g (200 00 0 0 4g1 ..s 8
g E .4' =2000 )...t2 a t 7- 6 3%.0 0Total 0. < 5 al g3 (2
2 271 20) .< 0
03
-I,.c>.a
0.
To.
8 w2.E.
0 0b-:4=
c 0tv .-1: asg..._.< _,
.3I2 th0 .40, _,
TOTAL ALL INSTITUTIONS
ALABAMAAuburn University-Main CampusUnited States Sports AcademyUniv of Alabama-BirminghamUniv of Alabama-HuntsvilleUniv of AlabamaUniv of South Alabama
ALASKAUniv of Alaska-Fairbanks
ARIZONAArizona State Univ-Main CampusNorthern Arizona UnivUniv of Arizona
ARKANSASU of Arkansas-FayettevilleU of Arkansas-Little RockU of Arkansas for Med Sci
CALIFORNIAAzusa Pacific UniversityBiola UniversityCalif Sch Prof Psych-AlamedaCalif Sch Prof Psych-FresnoCalif Sch Prof Psych-LACalif Sch Prof Psych-San DiegoCalifornia Inst of Integral StudiesCalifomia Inst of TechnologyClaremont Graduate UnivThe Fielding InstituteFuller Theological Seminary in CaliforniaGraduate Theological UnionLa Sierra UnivLoma Linda UnivNaval Postgraduate SchoolPacific Grad School of PsychologyPepperdine UnivRand Grad Schl of Policy StudiesScripps Research InstituteSan Diego State UnivClaremont School of TheologyStanford UniversityUnited States Internatl UnivUniv of California-BerkeleyUniv of California-DavisUniv of California-IrvineUniv of California-Los AngelesUniv of California-RiversideUniv of California-San DiegoUniv of California-San FranciscoUniv of California-Santa BarbaraUniv of California-Santa CruzUniv of LaverneUniv of the PacificUniv of San DiegoUniv of San FranciscoSanta Clara UnivUniv of Southern CaliforniaWright Institute
COLORADOColorado School of MinesColorado State UnivColorado Technical UnivUniv of Colorado-BoulderUniv of Colorado-Colorado SpringsUniv of Colorado-DenverUntv of Colorado-Health Sci CenterUniv of DenverUniv of Northern Colorado
CONNECTICUTUniv of ConnecticutUniv of New HavenWesleyan UnivYale Univ
41,368 1,392 1,990 786 1909 5,330 5,855 1,589 1,085 3,623 3,492 1,060 460 61 3,504 6,420 2,263
518 21 19 3 21 67 80 42 24 45 18 11 4 6 115 35186 3 11 0 10 26 15 9 24 29 8 2 1 32 4
13 o o o o o o o o o 0 0 0 5 8125 6 1 o 4 8 50 29 0 8 2 0 0 17 029 9 1 3 16 0 0 o o 0 0 0 0 0
147 3 1 4 17 7 3 o 8 8 2 5 53 2318 o 1 o o 8 1 0 0 0 0 0 8 0
20 2 6 0 3 4 0 2 0 1 1 1
20 2 6 0 3 4 0 2 0 1 1 1
738 40 2 33 27 94 82 26 21 40 63 1 16 1 57 133 53283 10 3 9 55 22 5 0 24 25 11 16 47 35
52 0 0 0 0 5 0 3 0 3 2 35 0403 30 1 30 18 39 55 21 18 16 35 39 51 18
129 3 3 2 7 34 5 8 9 1 1 30 786 3 0 2 7 6 4 8 9 1 1 19 714 0 3 0 0 0 0 0 0 0 0 11 029 0 0 0 0 28 1 0 0 0 0 0 0
4,706 170 24 87 249 728 683 105 71 575 457 13 5 5 399 518 1744 0 0 0 0 0 0 0 0 0 4 0
20 0 0 0 0 0 0 9 0 2 6 355 0 0 0 0 0 0 54 0 0 0 1
37 0 0 0 0 0 0 37 0 0 041 0 0 0 0 0 0 40 0 0 1
62 0 0 0 0 0 0 62 0 01 o o o o 0 0 1
127 17 2 2 7 46 27 0 495 0 0 6 0 1 0 14 21 13 22 6
121 o o o o 0 1 68 3 0 32 1756 0 0 0 0 0 30 1 11 0 1421 0 0 0 0 0 0 1 1 0 3
2 0 0 0 0 0 0 0 2 039 0 0 0 0 19 1 9 0 1 0
9 1 0 5 3 0 0 0 0 036 0 0 0 0 0 36 0 0 034 0 0 0 0 0 0 0 34
6 0 0 0 0 0 615 0 0 0 0 7 030 0 0 0 0 7 0 4 7 0
5 0 0 0 0 0 0 0 3567 28 2 16 35 181 75 18 69 1 4 27 27
10 0 0 0 0 0 7 1 2751 31 51 13 51 139 83 31 26 102 3 1 84 38 29356 10 26 9 14 64 113 4 4 7 21 1 18 11
201 5 25 6 16 30 38 4 12 24 1 12 3 4604 26 21 7 46 75 100 23 1 28 59 2 69 82 24115 5 5 2 6 0 26 12 10 11 8 11 0278 23 18 18 19 44 65 0 9 42 21 2 5
81 0 8 0 0 2 51 17 0 0 3 0 0 0230 10 11 2 15 58 15 0 0 20 30 11 1 27 22 1
90 9 4 8 8 4 14 0 1 6 17 4 10 0 1
58 0 0 0 0 0 0 0 0 0 0 0 0 5820 0 2 0 0 0 0 1 0 0 0 0 0 17 013 0 0 0 0 0 0 3 0 0 0 0 0 10 076 0 0 0 0 0 0 0 0 5 0 0 0 71 0
3 0 0 0 0 3 0 0 0 0 0 0 0 0 0411 5 16 4 21 79 42 6 0 32 39 4 64 57 33
26 0 0 0 0 0 0 0 26 0 0 0 0
744 35 41 37 45 119 91 27 26 51 52 5 2 58 105 4443 3 4 10 0 25 0 0 0 0 1 0 0 0 o 0
180 4 13 9 10 25 42 6 25 14 9 1 0 0 16 617 0 0 0 8 0 0 o o o o 0 o o 0 9
267 28 21 16 18 61 16 1 1 8 31 3 1 35 13 11
5 o o o 1 4 0 0 0 0 0 0 0 0 0 025 0 0 1 5 1 0 1 0 0 1 0 0 0 10 644 o o o o 0 27 17 0 0 0 0 0 0 0 089 o 2 1 2 3 4 0 0 17 10 1 1 11 22 1274 0 1 0 1 o 2 2 0 12 0 0 0 12 44 0
618 22 29 9 24 49 130 24 7 51 72 31 3 15 90 46 16276 8 12 3 12 37 45 14 5 39 20 11 o 3 11 45 11
3 0 0 0 0 o o o o o o o o 0 o o 314 1 3 o o o 8 o o o 1 o o 0 1 o o
325 13 14 6 12 12 77 10 2 12 51 20 3 12 78 1 2
9 482
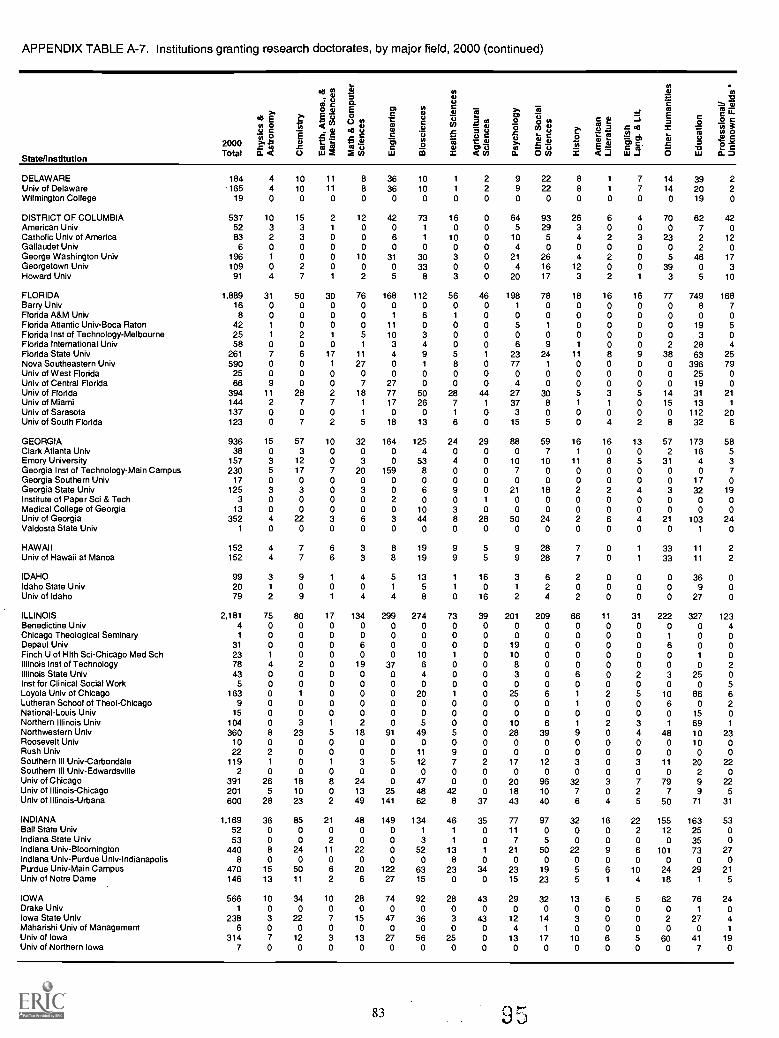
APPENDIX TABLE A-7. Institutions granting research doctorates, by major field, 2000 (continued)
State/1 ns tl tu tl o n
2000Total
g.CO 0
5.c>,
a. .5
ca
i.541 a
o.
'!6'0
2 co LU
DELAWARE 184 4 10 11 8 36Univ of Delaware 165 4 10 11 8 36Wilmington College 19 o o o o o
DISTRICT OF COLUMBIA 537 10 15 2 12 42American Univ 52 3 3 1 0 0Catholic Univ of America 83 2 3 0 0 6Gallaudet Univ 6 0 0 0 o oGeorge Washington Univ 196 1 0 0 10 31Georgetown Univ 109 o 2 0 o 0Howard Univ 91 4 7 1 2 5
FLORIDA 1,889 31 50 30 76 168Barry Univ 16 0 0 0 o oFlorida A&M Univ 8 o o o o 1
Florida Atlantic Univ-Boca Raton 42 1 0 0 0 11
Florida Inst of Technology-Melbourne 25 1 2 1 5 10Florida International Univ 58 0 0 0 1 3Florida State Univ 261 7 6 17 11 4Nova Southeastern Univ 590 0 0 1 27 oUniv of West Florida 25 o o o o oUniv of Central Florida 66 9 0 0 7 27Univ of Florida 394 11 28 2 18 77Univ of Miami 144 2 7 7 1 17Univ of Sarasota 137 0 0 0 1 0Univ of South Florida 123 0 7 2 5 18
GEORGIA 936 15 57 10 32 164Clark Atlanta Univ 38 0 3 0 0 0Emory University 157 3 12 0 3 0Georgia Inst of Technology-Main Campus 230 5 17 7 20 159Georgia Southern Univ 17 o o o o oGeorgia State Univ 125 3 3 0 3 0Institute of Paper Sci & Tech 3 o o o 0 2Medical College of Georgia 13 0 0 0 0 0Univ of Georgia 352 4 22 3 6 3Valdosta State Univ 1 0 0 0 0 0
HAWAII 152 4 7 6 3 8Univ of Hawaii at Manoa 152 4 7 6 3 8
IDAHO 99 3 9 1 4 5Idaho State Univ 20 1 0 0 0 1
Univ of Idaho 79 2 9 1 4
INDIANA 1,169 36 85 21 48 149Ball State Univ 52 0 0 0 0 0Indiana State Univ 53 0 0 2 0 0Indiana Univ-Bloomington 440 8 24 11 22 0Indiana Univ-Purdue Univ-Indianapolis 8 0 0 0 0 oPurdue Univ-Main Campus 470 15 50 6 20 122Univ of Notre Dame 146 13 11 2 6 27
83
4Maharishi Univ of Management 6 0 o o o o o o o 4 1 0 0 0 o o 1
Univ of Iowa 314 7 12 3 13 27 56 25 0 13 17 10 6 5 60 41 19Univ of Northern Iowa 7 o o o o o o o o o o o o o o 7 0
E 8 0 's .cT. te,' T.: El ,
1..7) 2E a
O. 0 V/ X
9 22 8 1 79 22 8 1 7o o o o o
64 93 26 6 45 29 3 o o
10 5 4 2 34 0 o o o
21 26 4 2 o4 16 12 0 0
20 17 3 2 1
4 198 78 18 16 161 o o o o0 0 0 0 05 1 0 0 00 0 o o o6 9 1 o 0
1 23 24 11 8 90 77 1 o o oo o o o o oo 4 o o o o
44 27 30 5 3 51 37 8 1 1 0o 3 o o o o0 15 5 0 4 2
29 88 59 16 16 13o 0 7 1 0 00 10 10 11 8 50 7 0 0 0 0
10 1
10 1
o o
73 161 o1 10o o
30 333 o
8 3
112 56o o6 1
0 03 04 09 51 8o o0 o
50 2826 7
0 1
13 6
125 244 o
53 48 0
4
99o
645
104
214
20
1981
2222
o
9329
50
261617
78o
88o
2634o4
123
18o
1
1
o
6o2o202
16o
77o
4o3oo01
16o
0 0 0 0 05 1 0 0 00 0 o o o6 9 1 o 0
1 23 24 11 8 90 77 1 o o oo o o o o oo 4 o o o o
44 27 30 5 3 51 37 8 1 1 0o 3 o o o o0 15 5 0 4 2
29 88 59 16 16 13o 0 7 1 0 00 10 10 11 8 50 7 0 0 0 0
14 39 214 20 2
0 19 o
70 62 420 7 o
23 2 120 2 05 46 17
39 0 33 5 10
77 749 1680 8 70 0 00 19 50 3 02 28 4
38 63 250 396 790 25 o0 19 0
14 31 2115 13 1
0 112 208 32 6
57 173 582 16 5
31 4 30 0 7
o o o o o o o o 0 17 06 90 0
10 344 8
0 0
19 919 9
13 1
5 1
8 0
01
o
210o
180o
20o
20o
4oo
28 50 24 2 6 40 0 0 0 0 0
5 9 28 7 0 1
5 9 28 7 0 1
16 3 6 2 0 00 1 2 0 0 0
16 2 4 2 0 0
134 461 1
3 1
52 130 8
63 2315 0
35 77 97 32 16 220 11 0 0 o 2o 7 5 0 0 01 21 50 22 9 60 0 0 0 0 0
34 23 19 5 6 100 15 23 5 1 4
9 22 8 1 79 22 8 1 7o o o o o
64 93 26 6 45 29 3 o o
10 5 4 2 34 0 o o o
21 26 4 2 o4 16 12 0 0
20 17 3 2 1
4 198 78 18 16 161 o o o o0 0 0 0 05 1 0 0 00 0 o o o6 9 1 o 0
1 23 24 11 8 90 77 1 o o oo o o o o oo 4 o o o o
44 27 30 5 3 51 37 8 1 1 0o 3 o o o o0 15 5 0 4 2
29 88 59 16 16 13o 0 7 1 0 00 10 10 11 8 50 7 0 0 0 0
3 32 19o o 0o o 0
21 103 240 1 0
33 11 233 11 2
0 36 00 9 00 27 0
155 163 5312 25 00 35 0
101 73 270 0 o
24 29 2118 1 5
83
A 566 10 34 10 28 74 92 28 43 29 32 13 6 5 62 76 24Drake Univ 1 o o o o o o o o o o o o o o 1 oIowa State Univ 238 3 22 7 15 47 36 3 43 12 14 3 0 0 2 27 4Maharishi Univ of Management 6 0 o o o o o o o 4 1 0 0 0 o o 1
Univ of Iowa 314 7 12 3 13 27 56 25 0 13 17 10 6 5 60 41 19Univ of Northern Iowa 7 o o o o o o o o o o o o o o 7 0
83

APPENDIX TABLE A-7. Institutions granting research doctorates, by major field, 2000 (continued)
State/Institution
2000Total
KANSAS 416Emporia State Univ 1
Kansas State Univ 132Univ of Kansas 257Wichita State Univ 26
KENTUCKY 352Asbury Theological Seminary 2Southern Bapt Theol Seminary 13Spalding Univ 11
Univ of Kentucky 249Univ of Louisville 77
LOUISIANA 609Grambling State Univ 15Louisiana State Univ & A&M College 275Louisiana State Univ-Health Sci Center 23Louisiana State Univ-Shreveport 10Louisiana Tech Univ 23New Orleans Bapt Theol Seminary 28Univ of Louisiana-Monroe 12Southern Univ and A&M College 2Tulane Univ of Louisiana 125Univ of New Orleans 63Univ of Louisiana-Lafayette 33
MAINE 49.Univ of Maine 49
MARYLAND 954Johns Hopkins Univ 332Loyola College 6Morgan State Univ 10Peabody Inst of Johns Hopkins Univ 9Uniformed Svcs. Univ of Hlth Sci 15Univ of Maryland-Baltimore County 47Univ of Maryland-College Park 460Univ of Maryland-Eastern Shore 2Univ of Maryland-Baltimore 73
MASSACHUSETTS 2,104American Internatl College 5Boston College 114Boston Univ 261Brandeis Univ 108Clark Univ 30Harvard Univ 547Mass Coll Pharm & Allied Health Sci 2Mass Inst of Technology 460New England Consery of Music 2Northeastern Univ 66Simmons College 5Smith College 7Springfield College 2Tufts Univ 98Univ of Massachusetts-Amherst 276Univ of Massachusetts-Boston 31Univ of Massachusetts-Lowell 52Univ of Massachusetts Med Sch-Worcester 21Worcester Polytechnic Inst 17
MICHIGAN 1,482Andrews Univ 21Calvin College 4Central Michigan Univ 8Eastern Michigan Univ 11
Michigan State Univ 429Michigan Tech Univ 43Oakland Univ 11
Univ of Detroit Mercy 16Univ of Michigan 653Wayne State Univ 232Western Michigan Univ 54
MINNESOTA 830Hamline Univ 3Luther Seminary 4Mayo Graduate School 19Univ of Minnesota-Twin Cities 684Univ of St Thomas 21Walden University 99
j (t: o.
i E r> .zcc) ca a 1it 5>. b i,c co .c co 63 2 co. 4 (..) w 2 z at w
11.,..0 3. ....3
2 ._.a : o 0 ei 12or'n .2 a3 'a' ..
i., it; 5 2r. a) 2 g 1- 12) mci: l g< co x a :3 Li, .]
1 2907
202
15000
105
3 31
2 1
1
2
11 1100
1 813 65 81 3
32 250 2
41 160 04 70 00 00 03 9
10 220 08 30 01 1
47 840 00 00 00 0
13 263 50 00 1
27 303 221 0
24 370 00 00 0
24 370 00 0
7 16 29 41 23 21 54 28 8 10 7 37 80 12o 0 o o o o o 0 0 0 o o 1 o1 10 9 16 3 21 10 11 2 0 0 0 31 4
6 10 24 16 38 17 6 10 7 37 45 80 10 1 4 6 0 0 0 0 0 3 0
13 33 63 17 1 31 34 11 4 1 23 65 230 0 0 0 0 0 0 0 0 0 20 0 0 0 0 0 0 0 6 1 40 0 0 0 0 0 0 0 0 11 0
13 21 46 16 1 26 27 4 0 14 27 170 12 17 1 5 7 0 1 3 26 0
33 60 79 36 3 45 52 1 10 6 55 91 460 0 0 0 0 0 0 0 0 15 0
12 28 18 5 3 23 26 5 3 28 43 160 0 13 10 0 0 0 0 0 0 00 0 10 0 0 0 0 0 0 0 01 9 0 0 1 1 0 0 0 6 50 0 0 0 6 0 0 0 9 1 120 0 2 6 1 0 0 o 0 3 00 0 0 0 0 0 0 0 0 2 09 12 31 15 7 13 1 2 10 0 8
1 0 7 0 0 7 12 0 o 0 21 50 11 4 5 0 0 0 4 1 8 0 0
4 2 6 9 0 3 2 1 0 0 0 7 04 2 6 9. 0 3 2 1 '0 0 0 7 0
22 54 139 184 119 56 91 27 7 12 81 56 306 18 45 92 78 2 34 12 4 2 17 0 1
0 0 0 0 0 5 0 0 0 0 0 0 1
0 0 0 0 0 0 1 1 0 0 0 8 00 0 0 0 0 0 0 0 0 0 9 0 00 0 0 9 3 3 0 0 0 0 0 0 00 5 13 6 0 10 5 0 o 0 1 0 1
15 31 81 39 10 36 51 14 3 10 54 48 221 0 0 0 0 0 0 0 0 0 0 0 00 0 0 38 28 0 0 0 0 0 0 0 5
38 101 318 347 84 1 96 272 68 17 21 181 183 1320 0 0 0 0 2 0 0 0 0 0 3 00 0 0 9 9 16 12 10 1 2 13 23 101 7 20 48 17 16 29 4 2 2 41 30 250 5 0 29 1 4 23 11 5 4 13 0 00 0 0 4 0 7 8 2 0 0 1 4 06 14 8 110 38 11 106 30 3 4 76 55 290 0 0 0 0 0 0 0 0 0 0 0 0
29 44 198 36 0 1 43 4 0 0 13 0 350 0 0 0 0 0 0 0 0 0 2 0 00 6 20 12 1 1 9 2 1 1 0 0 20 0 0 0 0 0 0 0 0 0 0 50 0 0 0 0 0 0 0 0 0 0 70 0 0 0 0 0 0 0 0 0 2 00 2 12 45 4 8 2 3 1 3 0 60 14 37 29 1 1 22 28 3 2 7 19 43 132 0 0 2 12 5 0 0 0 0 8 00 6 13 0 0 1 0 0 0 0 15 00 0 0 21 0 0 0 0 0 0 0 00 3 10 2 0 0 0 0 0 0 0 0
18 66 265 179 7 4 127 137 26 5 23 131 166 890 0 0 0 7 0 0 0 0 1 12 1
0 0 0 0 0 0 0 0 0 4 0 00 3 0 0 4 0 1 0 0 0 0 00 0 0 0 0 0 0 0 0 0 11 02 15 36 62 4 25 41 9 0 4 31 69 451 0 16 5 1 0 0 0 0 7 0 1
0 0 4 3 0 0 0 0 0 0 4 00 0 3 0 12 0 0 0 0 0 0 0
15 38 179 68 4 36 60 15 2 14 71 19 280 8 26 39 1 25 28 1 2 2 15 40 80 2 1 2 17 8 0 1 3 2 11 6
3 32 92 84 6 4 69 56 20 7 11 66 146 720 0 0 0 0 0 0 0 0 0 0 30 0 0 0 0 0 0 0 0 0 0 40 0 0 19 0 0 0 0 0 0 0 03 32 91 65 5 4 37 52 20 7 11 66 99 370 0 0 0 0 0 0 0 0 0 21 00 0 1 0 32 4 0 0 0 0 26 28
84

APPENDIX TABLE A-7. Institutions granting research doctorates, by major field, 2000 (continued)
CT: ag
f.E 5 5Li°,0 0 LU
State/InstItutIon
2000Total
g>.
:if.f0'1'5
MISSISSIPPI 351 1 22Delta State Univ 2 0 0Jackson State Univ 16 0 0Mississippi State Univ 128 0 4Reformed Theological Seminary 5 0 0Univ of Mississippi-Main Campus 80 1 5Univ of Mississippi-Med Ctr 12 0 0Univ of Southern Mississippi 108 0 13
MISSOURI 722 21 31Concordia Seminary 2 0 0St. Lout§ Univ-Main Campus 117 1 0Univ of Missouri-Columbia 258 3 6Univ of Missouri-Kansas City 63 3 3Univ of Missouri-Rolla 45 6 7Univ of Missouri-St Louis 37 0 7Washington Univ 200 8 8
MONTANA 65 2 7Montana State Univ 32 2 3Univ of Montana 33 0 4
NEBRASKA 297 3 11
Creighton Univ 5 0 0Univ of Nebraska-Lincoln 251 3 10Univ of Nebraska-Med Center 33 0 1
Univ of Nebraska-Omaha 8 0 0
NEVADA 115 4 9Univ of Nevada-Las Vegas 31 0 0Univ of Nevada-Reno 84 4 9
NEW HAMPSHIRE 87 5 9Dartmouth College 38 3 5Univ of New Hampshire-Main Campus 49 2 4
NEW JERSEY 883 44 44Drew Univ 25 0 0Fairleigh Dickinson Univ-All Campuses 10 0 0New Jersey Inst of Technology 45 2 2Princeton Theol Seminary 20 0 0Princeton University 281 26 15Rutgers Univ-New Brunswick 341 13 17Rutgers Univ-Newark 57 1 3Seton Hall Univ 49 0 5Stevens Inst of Technology 25 2 2Univ of Med & Dent of NJ 30 0 0
NEW MEXICO 272 20 8New Mexico lnst of Mining & Tech 11 2 0New Mexico State Univ-Main Campus 78 12 4Univ of New Mexico-Main Campus 183 6 4
NEW YORK 3,528 158 145Adelphi Univ 40 0 0Albany Medical College 3 0 0Alfred Univ 14 0 0CUNY Grad School & Univ Center 268 14 8Clarkson Univ 19 0 3Columbia Univ 457 24 27Columbia Univ-Teachers College 124 0 0Cornell Univ 449 31 19Cornell Univ Medical Campus 30 0 0Fordham University 95 0 0Hofstra Univ 44 0 0Jewish Theol Sem of America 6 0 0The Juilliard School 8 0 0Long Island Univ-Brooklyn Campus 16 0 0Mount Sinai School of Medicine 27 o 0New School University 52 o oNew York Medical College 14 0 0New York Univ 390 3 9Pace Univ-New York 5 0 0Polytechnic Univ 34 0 2Rensselaer Polytechnic Inst 92 7 7Rochester Institute of Technology 3 3 0Rockefeller Univ 19 1 0St Johns Univ-Queens 50 o 2SUNY-Albany 159 15 1
SUNY-Binghamton 100 0 5
al 3 4A cr; s a F -o'
8w 8 .;,..cl c . . . .., a .a g0)Z 5 TS 04 co o. 0 co x Gt Z 'a _t
4 14 19 31 4 32 36 7 9 8 4 14 111 350 0 0 0 0 0 0 0 0 0 0 0 2 03 0 0 0 0 0 0 0 0 0 0 0 12 1
0 8 13 16 0 32 3 3 2 0 0 0 40 70 0 0 0 0 0 0 0 0 0 0 2 0 30 1 3 0 1 0 11 4 3 5 3 2 24 170 0 0 11 1 0 0 0 0 0 0 0 0 01 5 3 4 2 0 22 0 4 3 1 10 33 7
10 22 85 121 15 20 86 50 14 4 13 76 126 280 0 0 0 0 0 0 0 0 0 0 1 o 1
3 1 0 13 7 0 25 3 2 1 2 16 38 51 11 33 29 3 20 29 20 5 2 5 15 61 150 2 1 5 0 0 6 2 2 0 0 18 21 04 1 2 2 0 0 0 0 0 0 0 0 0 00 0 5 4 0 11 4 0 0 0 0 6 02 7 2 67 1 0 15 21 5 1 6 26 0 7
0 1 17 0 7 4 2 0 0 0 0 23 00 1 7 0 3 0 2 0 0 0 0 12 00 0 10 o 4 4 0 0 0 0 0 11 0
4 12 46 9 34 26 28 2 10 7 17 55 250 0 5 0 0 0 0 0 0 0 0 0 04 12 15 3 34 26 24 2 10 7 17 54 220 0 26 6 0 0 0 0 0 0 0 0 00 0 0 0 0 0 4 0 0 0 0 1 3
11 0 21 4 0 15 9 0 6 0 4 21 30 0 2 0 0 0 6 0 0 0 1 15 3
11 0 19 4 0 15 3 0 6 0 3 6 0
6 11 28 1 1 5 3 2 1 2 1 8 03 5 16 1 0 2 0 0 0 0 0 0 03 6 1 12 0 1 3 3 2 1 2 1 8 0
13 69 133 132 16 17 38 98 40 7 20 90 65 570 0 0 0 0 0 1 2 5 1 3 9 1 30 0 0 0 0 0 10 0 0 0 0 0 0 01 12 28 0 0 0 0 0 0 0 0 0 0 00 0 0 0 0 0 0 0 1 0 0 11 0 85 16 47 41 0 0 6 51 22 2 10 37 1 27 28 47 52 8 17 13 35 12 4 7 32 29 200 5 0 9 3 0 1 10 0 0 0 1 1 230 0 0 0 5 0 6 0 0 0 0 0 33 00 8 11 0 0 0 1 0 0 0 0 0 0 1
0 0 0 30 o o 0 0 0 0 0 0 0 0
5 7 39 19 3 16 19 17 9 5 4 21 63 172 0 7 0 0 0 0 0 0 0 0 0 0 00 2 14 2 0 16 7 0 0 0 1 2 12 63 5 18 17 3 0 12 17 9 5 3 19 51 11
60 171 324 531 70 53 362 395 110 49 83 451 387 1790 2 0 0 1 0 34 0 0 0 0 0 0 30 0 0 3 0 0 0 0 0 0 0 0 0 00 0 5 0 0 0 6 0 0 0 0 0 3 04 18 12 29 8 0 39 29 10 7 12 59 6 130 0 16 0 0 0 0 0 0 0 0 0 0 0
16 20 32 57 19 0 29 69 35 4 14 61 15 350 0 0 0 0 0 0 0 0 0 0 0 124 09 21 78 75 8 45 7 56 15 3 5 54 7 160 0 0 30 o 0 0 0 0 0 0 0 0 00 0 0 1 0 0 22 15 3 0 6 12 31 50 0 0 o 0 0 33 0 0 0 0 0 11 00 0 0 0 0 0 0 0 0 0 0 4 0 20 0 0 0 0 0 0 0 0 0 0 8 0 00 0 0 0 0 0 16 0 0 0 0 0 0 00 0 0 27 0 0 0 0 0 0 0 0 0 00 0 0 0 0 0 18 30 0 0 0 4 0 00 0 0 14 0 0 0 0 0 0 0 0 0 01 35 2 50 11 0 27 41 16 13 13 91 42 360 1 0 0 0 0 o 0 0 0 0 0 0 40 7 25 0 o 0 0 0 0 0 0 0 o 02 2 57 3 o o 1 4 1 0 0 0 0 80 0 0 0 0 0 0 0 0 0 0 0 0 00 0 0 18 0 0 0 0 0 0 0 0 0 00 0 0 7 0 0 19 1 2 0 2 0 17 08 11 1 9 2 0 31 27 2 1 3 9 30 92 8 4 5 0 0 9 22 6 6 6 22 4 1
985 7

APPENDIX TABLE A-7. Institutions granting research doctorates, by major field, 2000 (continued)
State/Institution
2000Total
g
>tl.ca
E
0
NEW YORK (continued)SUNY-Buffalo 302 8 16SUNY-Stony Brook 241 19 23SUNY Coll-Environ Sci & Forestry 17 0 3SUNY-Hlth Sci Ctr-Brooklyn 13 0 0SUNY-Hlth Sci Ctr-Syracuse 12 0 0Syracuse Univ 142 6 7Union College 2 0 0Union Theol Seminary 10 0 0Univ of Rochester 211 27 13Yeshiva Univ 60 0 0
NORTH CAROLINA 1,109 28 55Appalachian State Univ 3 0 0Duke Univ 230 8 11
East Carolina Univ 10 0 0Fayetteville State Univ 1 0 0North Carolina A & T St Univ 1 0 0North Carolina St U-Raleigh 314 10 15Southeastern Baptist Theological Seminary 6 0 0U of N Carolina-Chapel Hill 424 6 23U of N Carolina-Charlotle 4 0 0U of N Carolina-Greensboro 88 0 0Wake Forest University 28 4 6
NORTH DAKOTA 58 4 6North Dakota State Univ-Main Campus 19 1 3Univ of North Dakota-Main Campus 39 3 3
OHIO 1,795 65 100Air Force Inst of Tech 10 1 0Bowling Green State Univ-Main Campus 93 1 2Case Western Reserve Univ 193 6 10Cleveland State Univ 39 0 5Hebrew Union College-Jewish Inst of Religion 5 0 0Kent State Univ-Main Campus 131 9 2Medical College of Ohio 24 0 0Miami Univ-Oxford 50 0 8Ohio State Univ-Main Campus 609 21 24Ohio Univ-Main Campus 120 5 2Univ of Akron-Main Campus 114 8 26Univ of Cincinnati-Main Campus 240 7 16Univ of Dayton 31 4 0Univ of Toledo 108 3 5Wright State Univ-Main Campus 22 0 0Youngstown State Univ 6 0 0
OKLAHOMA 382 11 15Oklahoma State Univ-Main Campus 186 4 8Univ of Oklahoma-Norman Campus 170 7 7Univ of Tulsa 26 0 0
OREGON 382 17 19Oregon Grad I nst of Sci & Tech 17 0 1
Oregon Health Sciences Univ 37 0 0Oregon State Univ 159 7 9Portland State Univ 31 1 1
Univ of Oregon 138 9 8
PENNSYLVANIA 2,101 55 88Bryn Mawr College 21 0 0Carnegie Mellon Univ 158 3 10Drexel Univ 35 0 1
Duquesne Univ 48 0 4Indiana Univ of Pennsylvania 77 0 0Lehigh Univ 100 7 3
Marywood Univ 4 0 0MCP Hahnemann University 29 0 0Pennsylvania State Univ-Main Campus 541 20 11
Univ of the Sciences in Philadelphia 7 0 4
Temple Univ 270 3 8Thomas Jefferson Univ 16 0 1
Univ of Pennsylvania 425 11 28Univ of Pittsburgh-Main Campus 317 11 16Villanova Univ 3 0 2
Westminster Theol Seminary 9 0 0Widener Univ-Main Campus 41 0 0
PUERTO RICO 130 0 7
Carlos Albizu University-San Juan Campus 43 0 0Inter Amer U PR-Metro 23 0 0
of 20
col
c
im
tg0
0C.) : iatl c a a
fl I'c'En
2 43C
ILI
0) 3A E,
2 8o
.n
T g t...8 ....s.
ci . ... ..u)"a t >. 2 .r, .52 E 11
a ca a. 0 0
0 8 35 50 14 0 23 2210 14 21 49 0 0 22 22
3 0 1 3 0 7 0 00 0 0 12 1 0 0 00 0 0 12 0 0 0 01 14 13 1 0 0 11 340 0 1 0 0 0 0 1
0 0 0 0 0 0 0 03 10 20 37 6 1 4 221 0 1 39 0 0 11 0
26 49 128 217 66 34 52 121
0 0 0 0 0 0 0 01 10 34 59 1 1 9 370 0 0 7 0 0 00 0 0 0 0 0 00 0 1 0 0 0 0
11 22 79 58 2 3 7 270 0 0 0 0 0 0
14 17 11 72 61 21 570 0 2 0 0 0 00 0 0 4 2 15 00 0 1 17 0 0 0
0 3 2 8 0 12 0
0 3 2 4 0 0 00 0 0 4 0 12 0
19 48 265 248 101 2 174 930 2 7 0 0 0 01 5 0 3 1 22 41 3 46 54 19 1 8 5
0 1 9 4 0 0 0 00 0 0 0 0 0 0 03 3 0 12 1 0 29 80 0 0 22 2 0 0 00 0 0 11 0 0 7 3
13 25 79 82 38 27 39 520 2 14 5 1 0 16 1
0 0 30 3 0 0 17 71 3 50 39 11 0 10 130 0 19 0 0 0 0 00 4 9 9 28 0 10 00 0 2 4 0 0 16 00 0 0 0 0 0 0 0
24 13 33 42 7 19 50 2710 4 14 19 2 19 20 11
12 8 13 23 5 0 17 162 1 6 0 0 0 13 0
22 21 29 75 23 30 17 240 1 14 1 0 0 0 0
0 0 0 30 7 0 0 0
15 11 12 28 16 30 3 51 1 3 3 0 0 3 4
6 8 0 13 0 0 11 15
24 103 316 265 116 19 198 1490 0 0 0 0 0 9 01 22 82 9 0 0 8 3
1 2 17 3 0 0 3 0
0 1 0 0 1 0 24 0
0 0 0 0 0 0 11 53 7 43 6 0 0 10 2
0 0 0 0 0 0 3 00 0 0 11 0 0 18 0
11 23 110 71 25 19 35 380 0 0 2 1 0 0 0
0 7 1 26 16 0 40 150 0 0 15 0 0 0 04 14 33 84 22 0 19 604 27 30 37 40 0 18 260 0 0 1 0 0 0 00 0 0 0 0 0 o 00 0 0 0 11 0 0 0
4 0 0 12 0 0 60 1
0 0 0 0 0 0 43 00 0 0 0 0 0 0 0
4800030050
360
120001
023
000
1
01
5302601
505
21621
0400
41
30
1
00001
410500000080
140
11
3000
200
11 8 37 53 134 9 37 3 00 0 0 0 00 0 0 0 00 0 0 0 00 0 10 27 150 0 0 0 00 0 0 0 100 5 43 11 40 0 0 3 5
16 18 85 141 370 0 0 3 06 3 31 1 60 0 0 3 00 0 0 1 00 0 0 0 00 0 0 48 1
0 0 6 0 09 14 31 35 300 0 0 2 01 1 17 48 00 0 0 0 0
0 1 2 13 00 0 0 0 00 1 2 13 0
21 28 124 326 1020 0 0 0 01 3 23 18 73 4 7 1 190 0 0 12 80 0 3 0 1
2 3 2 37 150 0 0 0 03 3 2 8 05 7 40 105 31
2 2 5 44 150 0 0 21 01 1 40 41 60 0 0 8 04 5 2 25 00 0 0 0 00 0 0 6 0
7 9 18 85 182 3 1 60 83 4 17 25 102 2 0 0 0
4 7 27 49 170 0 0 0 00 0 0 0 00 0 1 20 20 0 0 8 64 7 26 21 9
32 31 188 336 1400 1 8 o 30 0 4 0 11
0 0 0 0 81 2 13 0 29 9 17 26 01 2 1 13 20 0 0 1 00 0 0 0 05 7 32 97 290 0 0 0 05 2 35 78 200 0 0 0 0
10 7 46 37 391 1 25 54 240 0 0 0 00 0 7 0 2
0 o 0 30 0
0 0 1 43 00 0 0 0 00 0 0 23 0
86

APPENDIX TABLE A-7. Institutions granting research doctorates, by major field, 2000 (continued)
2000State/institution Total
PUERTO RICO (continued)Univ of Puerto Rico-Mayaguez 4Univ of Puerto Rico-Med Science Campus 8Univ of Puerto Rico-Rio Piedras 52
RHODE ISLAND 242Brown Univ 149Providence College 1
Salve Regina Univ 6Univ of Rhode Island 86
SOUTH CAROLINA 401Clemson University 109Medical Univ of South Carolina 27South Carolina State Univ 22Univ of South Carolina 243
SOUTH DAKOTA 79S Dakota Sch of Mines & Tech 4South Dakota State Univ 14Univ of South Dakota 61
TENNESSEE 681East Tennessee State Univ 28Meharry Medical College 13Mid-America Baptist Sem 4Middle Tennessee State Univ 7Tennessee State Univ 31Tennessee Technological Univ 4Univ of Memphis 109Univ of Tennessee-Knoxville 266Univ of Tennessee-Memphis 29Vanderbilt Univ 190
TEXAS 2,545Baylor College of Medicine 54Baylor Univ 46Dallas Theological Seminary 11Lamar Univ-Beaumont 1
Rice Univ 111St. Mary's Univ 3Sam Houston State Univ 3Southern Methodist Univ 37Southwestern Baptist Theol Sem 54Southwest Texas State Univ 2Stephen F Austin St Univ 2Texas A&M Univ-College Station 507Texas A&M Univ-Commerce 45Texas A&M Univ-Kingsville 14Texas Christian Univ 20Texas Southern Univ 20Texas Tech Univ 141Texas Tech Univ Health Sci Ctr 4Texas Woman's Univ 92Univ of Dallas 5Univ of Houston 175Univ of North Texas 160Univ of North Texas-Hlth Sci Ctr 6Univ of Texas-Arlington 78Univ of Texas-Austin 656Univ of Texas-Dallas 71Univ of Texas-El Paso 20Univ of Texas-Pan American 7Univ of Texas -Hlth Sci Ctr-Houston 87Univ of Texas -Hlth Sci Ctr-San Antonio 24Univ of Texas -Med Branch-Galveston 34Univ of Texas-Southwestern Med Ctr 55
UTAH 348Brigham Young Univ 71Univ of Utah 206Utah State Univ 71
VERMONT 65Middlebury College 7Univ of Vermont 58
VIRGINIA 1,039College of William & Mary 59George Mason Univ 133Hampton University 5
oo :L.
cl 2 0.
P0 0 E cr,
I .0 0c
a) 17,co o a)t g E .d
:c c
a..b a t r ...0
1 Zoco 0 2 c
0. 4 C.) to 2 2 CO IL
! c o'0Tu
1 c 2 u-
0 co 11.1co .-t. u 3 t ati x 2. .r.
.., x Ea. .E1 t a : g_t) g 2 -24 Fa13
.c 00 2 .01 214 (0 0. 0 (n x 4 _1 i0 - O' ILI 0. M
0 0 4 0 0o o o o o0 7 0 0 0
14 18 18 20 238 11 6 15 11
0 0 0 0 00 0 0 0 06 7 12 5 12
9 13 9 14 444 7 1 4 310 3 0 0 00 0 0 0 05 3 8 10 13
0 1 1 0 40 0 0 0 40 1 1 0 00 0 0 0 0
17 33 4 25 640 0 0 0 00 0 0 0 00 0 0 0 00 2 0 0 00 0 0 0 00 0 0 0 40 5 1 7 11
10 20 2 10 300 2 1 0 07 4 0 8 19
73 113 56 120 3970 0 0 0 00 2 1 2 00 0 0 0 00 0 0 0 06 11 5 17 300 0 0 0 00 0 0 0 01 0 2 8 80 0 0 0 00 0 0 0 00 0 0 0 0
10 28 18 29 1350 0 0 0 00 0 0 0 01 1 0 0 00 0 0 0 01 3 2 1 180 0 0 0 00 0 0 0 00 0 0 0 06 19 0 3 316 5 1 20 00 0 0 0 02 8 0 7 25
29 31 20 27 1317 5 3 4 90 0 3 1 90 0 0 0 01 0 1 1 1
3 0 0 0 00 0 0 0 00 0 0 0 0
9 31 3 18 592 6 0 4 86 22 2 13 431 3 1 1 8
0 6 0 2 30 0 0 0 00 6 0 2 3
29 39 28 68 1649 1 9 7 21 0 3 25 95 0 0 0 0
0 0 0 0 0 0 0 0 0 0 08 0 0 0 0 0 0 0 0 0 04 0 0 17 1 2 0 0 1 20 0
22 7 1 17 28 9 5 10 42 3 517 0 0 3 24 8 2 8 34 0 2
0 0 0 0 0 1 0 0 0 0 00 0 0 0 1 0 0 0 5 0 05 7 1 14 3 0 3 2 3 3 3
58 34 13 24 28 6 6 7 26 82 2817 0 13 2 5 0 0 0 0 16 920 3 0 0 0 0 0 0 0 1 00 0 0 0 0 0 0 0 0 22 0
21 31 0 22 23 6 6 7 26 43 19
10 0 2 8 6 0 0 2 0 45 00 0 0 0 0 0 0 0 0 0 04 0 2 0 6 0 0 0 0 0 06 0 0 8 0 0 0 2 0 45 0
112 24 7 73 40 2 7 12 39 180 423 0 0 0 0 0 0 0 0 24 1
13 0 0 0 0 0 0 0 0 0 00 0 0 0 0 0 0 0 0 0 40 0 0 0 0 1 1 1 0 2 00 0 0 2 0 0 0 0 0 29 00 0 0 0 0 0 0 0 0 0 03 3 0 27 0 0 0 0 7 34 11
29 15 7 30 26 1 3 4 5 53 2122 4 0 0 0 0 0 0 0 0 042 2 0 14 14 0 3 7 27 38 5
391 93 60 190 157 57 24 32 200 406 17653 1 0 0 0 0 0 0 0 0 0
3 0 0 1 0 2 1 11 23 00 0 0 0 0 0 4 0 70 0 0 0 0 0 0 1 0
12 0 5 4 1 4 8 0 00 0 2 0 0 0 0 1 00 0 0 0 0 0 0 0 00 0 5 1 0 0 5 0 00 0 4 1 0 0 20 0 290 0 0 0 0 0 0 0 00 2 0 0 0 0 0 0 0
72 44 21 2 6 4 3 5 69 270 0 4 0 0 0 1 39 1
0 0 0 0 0 0 0 14 00 0 6 8 2 0 2 0 00 0 0 0 0 0 0 20 0
13 12 21 4 4 2 13 24 174 0 0 0 0 0 0 0 06 3 1 13 0 0 0 6 19 40 0 0 0 0 1 0 0 0
13 1 0 20 1 4 3 3 7 43 76 0 0 22 1 6 4 8 17 44 114 2 0 0 0 0 0 0 0 03 0 0 0 2 1 1 12 1 12
38 16 1 45 5 20 2 9 82 103 469 0 0 12 1 1 0 5 0 80 0 0 2 0 0 0 0 5 00 0 0 0 0 0 0 0 0 7
59 22 0 1 1 0 0 0 0 0 018 3 0 0 0 0 0 0 0 0 030 2 0 0 0 0 0 0 2 0 048 0 0 7 0 0 0 0 0 0 0
66 14 10 46 27 5 3 0 9 33 154 3 0 24 8 3 0 0 1 7 1
41 11 0 12 15 2 3 0 8 16 1221 0 10 10 4 0 0 0 0 10 2
16 0 0 12 0 0 0 0 8 18 00 0 0 0 0 0 0 0 7 0 0
16 0 0 12 0 0 0 0 1 18 0
122 31 25 86 91 25 5 14 41 211 603 0 1 0 0 6 0 0 3 18 04 9 0 17 24 0 1 0 0 36 40 0 0 0 0 0 0 0 0 0 0
87 0

APPENDIX TABLE A-7. Institutions granting research doctorates, by major field, 2000 (continued)
State/Institution
oa 141)
iii 2
*5 g A.1-1 c to. o
2000 ),..b u.c u) .c ist l
Total o. < 0 ati 2 (I) 0. 0 x =1 to 1
VIRGINIA (continued)Norfolk State UnivOld Dominion UnivRegent UnivUnion Theol Seminary in VirginiaUniv of Virginia-Main CampusVirginia Commonwealth Univ and Med CollVirginia Polytech Inst & St Univ
WASHINGTONGonzaga UnivSeattle Pacific UnivSeattle UnivUniv of WashingtonWashington State Univ
WEST VIRGINIAMarshall UniversityWest Virginia Univ
WISCONSINMarquette UnivMedical College of WisconsinUniv of Wisconsin-MadisonUniv of Wisconsin-Milwaukee
WYOMINGUniv of Wyoming
262
710
341112308
63411
811
486118
1342
132
8695410
72877
7272
o4oo802
20000
164
707
3200
275
22
oooo
131015
3700o
343
707
4640
366
1010
o7oo5o4
26ooo
242
2o2
14o0
14o
55
o4oo
16o
16
25ooo
205
4o4
371
031
5
22
o14oo
512
86
83ooo
6815
190
19
11770
1046
44
o8oo
443726
1140oo
8628
132
11
1634
10143
6
1313
o1
oo6
123
363oo
321
1
01
1900
172
00
o0oo00
24
180oo
117
120
12
510o
510
77
o2oo
252220
181
oo
134
220
22
374o
276
66
1
4oo
371213
531
oo
457
808
650o
587
55
o0o1
1701
220oo
175
1
o1
402o
380
00
o0oo4oo
110oo
101
0o0
163o58
00
ooo0
14oo
120oo66
0o0
172o
11
4
00
o01
330
31
6900o
627
4o4
7115o
524
00
o12o1
685
71
6568
11
2317
34o
34
958o
7215
1818
1
66539
26
25000
196
00o
4940
423
NOTE: Field groupings may differ from those in reports published by federal sponsors of the Survey of Earned Doctorates.° Includes 5 persons for whom field was unknown.
Source: NSF/NIHHUSED/NEH/USDA/NASA, Survey of Earned Doctorates
0 0 88
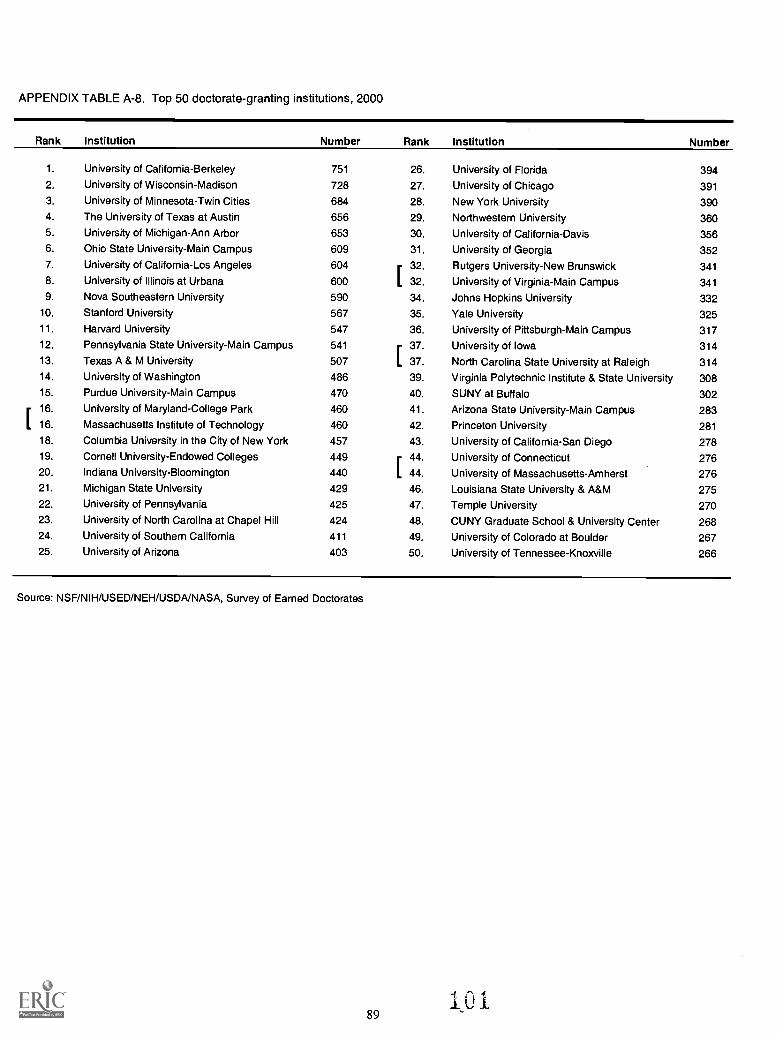
APPENDIX TABLE A-8. Top 50 doctorate-granting institutions, 2000
Rank Institution Number Rank Institution Number
1. University of California-Berkeley 751 26. University of Florida 3942. University of Wisconsin-Madison 728 27. University of Chicago 391
3. University of Minnesota-Twin Cities 684 28. New York University 3904. The University of Texas at Austin 656 29. Northwestern University 3605. University of Michigan-Ann Arbor 653 30. University of California-Davis 3566. Ohio State University-Main Campus 609 31. University of Georgia 3527. University of California-Los Angeles 604 32. Rutgers University-New Brunswick 341
8. University of Illinois at Urbana 600 32. University of Virginia-Main Campus 341
9. Nova Southeastern University 590 34. Johns Hopkins University 33210. Stanford University 567 35. Yale University 32511. Harvard University 547 36. University of Pittsburgh-Main Campus 31712. Pennsylvania State University-Main Campus 541 37. University of Iowa 31413. Texas A & M University 507 37. North Carolina State University at Raleigh 31414. University of Washington 486 39. Virginia Polytechnic Institute & State University 30815. Purdue University-Main Campus 470 40. SUNY at Buffalo 30216. University of Maryland-College Park 460 41. Arizona State University-Main Campus 28316. Massachusetts Institute of Technology 460 42. Princeton University 281
18. Columbia University in the City of New York 457 43. University of California-San Diego 27819. Cornell University-Endowed Colleges 449 44. University of Connecticut 27620. Indiana University-Bloomington 440 44. University of Massachusetts-Amherst 27621. Michigan State University 429 46. Louisiana State University & A&M 27522. University of Pennsylvania 425 47. Temple University 27023. University of North Carolina at Chapel Hill 424 48. CUNY Graduate School & University Center 26824. University of Southern California 411 49. University of Colorado at Boulder 26725. University of Arizona 403 50. University of Tennessee-Knoxville 266
Source: NSF/NIH/USED/NEH/USDNNASA, Survey of Earned Doctorates
89

APPENDIX B: Trend Tables, 1990-2000
Appendix B includes the following two tables:
B-1: Number of Doctorate Recipients, by Subfield, 1990-2000
B-2: Number of Doctorate Recipients, by Sex, Race/Ethnicity, and Citizenship,1990-2000
TABLE B-1: Table B-1 presents data for the most recent decade by subfield of doctorate. Ingeneral, the subfields correspond to the fields on the questionnaire's Specialties List located inthe questionnaire at the back of the Summary Report; some subfields, however, do not appear onthe current Specialties List because they are no longer included in the survey taxonomy. A dash() in a column indicates that the field was not on the Specialties List for that year.
Field groupings in this table may differ from those in reports published by Federalsponsors of the Survey of Earned Doctorates (SED); see inside the back cover of the SummaryReport for a description of field groupings as reported in these tables. The "general" fieldcategoriesfor example, "chemistry, general"include individuals who either received thedoctorate in the general subject area or did not indicate a particular specialty field. The "other"field categoriesfor example, "chemistry, other"include individuals whose specified doctoraldiscipline was not among the specialty fields.
The eight tables in Appendix A present additional information on the most recent cohortof research doctorate recipients by field of doctorate.
TABLE B-2: Table B-2 displays, by sex and citizenship, data on the race/ethnicity of doctoraterecipients for 1990-2000. Table B-2 contains three panels, each displayed on a separate page.The first panel includes all doctorates; the others disaggregate the data by sex.
Since 1982 respondents have been asked to first indicate whether or not they areHispanic, and then check one of four racial group categories (American Indian, Asian, black, orwhite). In Table B-2, doctorate recipients who reported Hispanic heritage, regardless of racialdesignation, are counted as Hispanic. The remaining survey respondents are then counted intheir respective racial groups. (Note: Doctorate recipients who checked the category "AmericanIndian or Alaskan Native" are identified as American Indian in this report.)
Tables A-2 and A-4 in Appendix A present additional information on the most recentcohort of doctorate recipients by race/ethnicity.
90

APPENDIX TABLE B-1. Number of doctorate recipients, by subfield, 1990-2000
1990 1991 1992 1993 1994 1995 1996 1997 1998 1999 2000
TOTAL ALL FIELDS 36,067 37,534 38,890 39,800 41,034 41,742 42,413 42,545 42,634 b 41,060 a 41,368
PHYSICAL SCIENCES 5,859 6,280 6,502 6,496 6,822 6,808 6,674 6,679 6,739 6,319 6,077
MATHEMATICS 892 1,039 1,058 1,146 1,118 1,190 1,122 1,123 1,177 1,083 1,048
Applied Mathematics 185 193 213 188 206 211 230 242 265 252 238Algebra 39 72 69 84 78 82 78 78 75 84 82Analysis & Functional Analysis 90 132 105 105 107 99 100 103 130 86 81Geometry 42 66 45 44 35 45 72 70 54 65 59Logic 19 23 28 19 29 35 16 23 16 23 19Number Theory 26 30 25 42 37 35 42 46 46 50 40Mathematical Statistics 157 206 217 228 205 205 178 181 204 174 194Topology 50 57 58 54 38 51 55 62 65 65 50Computing Theory & Practice 12 19 12 18 16 14 18 14 18 14 17Operations Research 29 16 22 37 26 36 21 20 17 21 19Mathematics, General 191 180 209 276 269 305 233 153 163 116 150Mathematics, Other 52 45 55 51 72 72 79 131 124 133 99
COMPUTER SCIENCE 705 800 869 880 903 997 921 910 925 853 861
Computer Science 612 720 791 825 833 913 837 829 819 738 722Information Sciences & Systems 93 80 78 55 70 84 84 81 106 115 139
PHYSICS AND ASTRONOMY 1,393 1,411 1,537 1,544 1,692 1,652 1,676 1,599 1,584 1,429 1,392
Astronomy 52 50 55 76 66 89 84 71 91 59 80Astrophysics 76 75 79 69 78 84 108 127 116 100 107Acoustics 21 13 18 27 20 18 19 19 18 16 10Chem. & Atomic/Molecular 87 76 85 95 140 110 129 106 100 99 110Electron 2 1 0 0 0 0 0 0 0 0 0Elementary Particles 163 182 153 170 176 183 175 170 173 169 147Fluids 17 14 17 19 12 18 21 24 26 23 10Nuclear 73 66 86 82 90 91 87 106 92 76 74Optics 76 85 94 96 104 98 129 123 104 97 117Plasma & High-Temperature 42 58 65 62 79 46 48 39 55 49 38Polymer 11 17 17 29 29 23 33 19 24 28 21Solid State & Low-Temperature 306 372 408 336 388 371 364 328 313 307 279Physics, General 323 247 297 340 343 355 323 255 191 205 225Physics, Other 144 155 163 143 167 166 156 212 281 201 174
CHEMISTRY 2,100 2,194 2,214 2,137 2,257 2,162 2,148 2,147 2,215 2,132 1,990
Analytical 293 304 304 286 334 317 346 350 383 333 326Inorganic 242 260 268 237 262 258 249 279 287 279 221Nuclear 13 14 7 8 10 5 5 8 6 10 9Organic 452 538 512 518 544 483 506 566 597 562 524Medicinal/Pharmaceutical 48 83 69 99 102 96 96 105 114 131 107Physical 325 364 398 336 334 338 300 334 279 310 271Polymer 81 111 83 107 117 116 121 110 122 96 106Theoretical 55 45 59 53 52 40 57 48 41 56 52Chemistry, General 524 400 449 431 447 458 396 261 285 196 264Chemistry, Other 67 75 65 62 55 51 72 86 101 159 110
EARTH, ATMOS., & MARINE SCI. 769 836 824 789 852 807 807 900 838 822 786
Atmospheric Physics & Chemistry 18 20 36 13 27 27 22 45 38 43 39Atmospheric Dynamics 20 21 23 23 27 16 21 25 24 16 17Meteorology 20 31 28 34 32 25 35 28 25 22 34Atmos. Sci./Meteorology, General 23 26 27 22 37 44 33 36 22 33 36Atmos. Sci./Meteorology, Other 2 10 6 7 6 18 14 15 16 10 17Geology 166 192 166 197 194 186 162 165 171 157 124Geochemistry 56 64 62 50 59 42 49 49 58 55 48Geophysics & Seismology 91 117 108 101 106 93 101 108 106 100 69Paleontology 21 24 25 21 17 20 14 23 23 15 31Mineralogy, Petrology 26 36 29 9 21 19 23 19 14 14 5Stratigraphy, Sedimentation 25 29 23 28 27 16 12 23 24 17 13Geomorphology & Glacial Geology 14 18 12 16 13 11 11 26 20 18 14Applied Geology 6 1 0 0 0 0 0 0 0 0 0Geological & Related Sci., General 31 30 18 15 18 21 27 16 13 9 20Geological & Related Sci., Other 28 33 31 17 24 22 22 17 40 35 18Environmental Science 50 35 57 68 61 81 83 96 73 99 94Hydrology & Water Resources 13 16 29 25 30 24 31 43 35 32 43Oceanography 89 85 82 98 91 83 107 114 94 100 100Marine Sciences 39 27 32 27 34 32 27 30 18 30 35Misc. Physical Sci., Other 31 21 30 18 28 27 13 22 24 17 29
ENGINEERING 4,894 5,214 5,438 5,698 5,822 6,008 6,305 6,114 5,927 5,328 5,330
Aerospace, Aeronautic. &Astronautic. 192 207 234 228 230 252 287 273 243 206 215Agricultural 101 83 84 86 89 73 104 79 74 59 60Bioeng. & Biomedical 129 149 147 171 173 189 220 210 207 245 252Ceramic Sciences 43 58 42 42 39 39 41 39 24 33 22Chemical 561 621 607 624 630 602 681 662 668 576 620Civil 505 509 540 563 602 572 599 593 587 505 482Communications 35 21 30 22 33 29 32 33 40 38 42Computer 131 178 175 167 202 189 208 227 210 205 172Electrical, Electronics 1,110 1,206 1,278 1,354 1,438 1,513 1,500 1,461 1,346 1,234 1,330Engineering Mechanics 111 113 132 128 132 108 105 93 86 68 57Engineering Physics 16 23 25 21 17 17 37 24 15 28 26Engineering Science 37 42 51 55 46 56 52 45 50 51 34Environmental Health Engineering 48 66 54 61 82 84 98 63 63 78 76Ind./Manufacturing 151 165 196 236 228 284 258 246 229 212 176
91 103
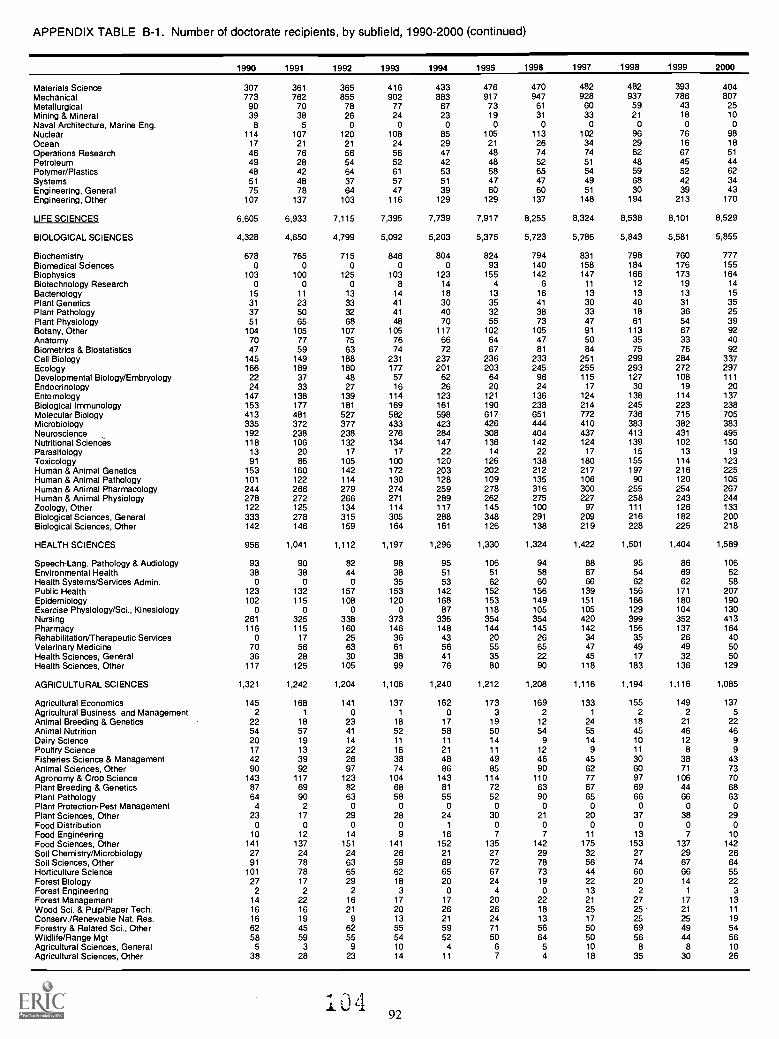
APPENDIX TABLE B-1. Number of doctorate recipients, by subfield, 1990-2000 (continued)
1990 1991 1992 1993 1994 1995 1996 1997 1998 1999 2000
Materials Science 307 361 365 416 433 476 470 482 482 393 404Mechanical 773 762 855 902 883 917 947 928 937 786 807Metallurgical 90 70 78 77 67 73 61 60 59 43 25Mining & Mineral 39 38 26 24 23 19 31 33 21 18 10Naval Architecture, Marine Eng. 8 5 0 o o o o o o o 0Nuclear 114 107 120 108 85 105 113 102 96 76 98Ocean 17 21 21 24 29 21 26 34 29 16 18Operations Research 46 76 56 56 47 48 74 74 62 67 51
Petroleum 49 28 54 52 42 48 52 51 48 45 44Polymer/Plastics 48 42 64 61 53 58 65 54 59 52 62Systems 51 48 37 57 51 47 47 49 68 42 34Engineering, General 75 78 64 47 39 60 60 51 30 39 43Engineering, Other 107 137 103 116 129 129 137 148 194 213 170
LIFE SCIENCES 6,605 6,933 7,115 7,395 7,739 7,917 8,255 8,324 8,538 8,101 8,529
BIOLOGICAL SCIENCES 4,328 4,650 4,799 5,092 5,203 5,375 5,723 5,786 5,843 5,581 5,855
Biochemistry 678 765 715 846 804 824 794 831 798 760 777Biomedical Sciences 0 0 o o 0 93 140 158 184 176 155Biophysics 103 100 125 103 123 155 142 147 166 173 164Biotechnology Research o o 0 8 14 4 6 11 12 19 14Bacteriology 15 11 13 14 18 13 16 13 13 13 15Plant Genetics 31 23 33 41 30 35 41 30 40 31 35Plant Pathology 37 50 32 41 40 32 38 33 18 36 25Plant Physiology 51 65 68 48 70 55 73 47 61 54 39Botany, Other 104 105 107 105 117 102 105 91 113 67 92Anatomy 70 77 75 76 66 64 47 50 35 33 40Biometrics & Biostatistics 47 59 63 74 72 67 81 84 75 76 92Cell Biology 145 149 188 231 237 236 233 251 299 284 337Ecology 166 189 180 177 201 203 245 255 293 272 297Developmental Biology/Embryology 22 37 48 57 62 64 96 115 127 108 111Endocrinology 24 33 27 16 26 20 24 17 30 19 20Entomology 147 138 139 114 123 121 136 124 138 114 137Biological Immunology 153 177 181 169 161 190 238 214 245 223 238Molecular Biology 413 481 527 582 598 617 651 772 736 715 705Microbiology 335 372 377 433 423 426 444 410 383 382 383Neuroscience 192 238 238 276 284 308 404 437 413 431 495Nutritional Sciences 118 106 132 134 147 136 142 124 139 102 150Parasitology 13 20 17 17 22 14 22 17 15 13 19Toxicology 91 86 105 100 120 126 138 180 155 114 123Human & Animal Genetics 153 160 142 172 203 202 212 217 197 216 225Human & Animal Pathology 101 122 114 130 128 109 135 106 90 120 105Human & Animal Pharmacology 244 266 279 274 259 278 316 300 255 254 267Human & Animal Physiology 278 272 266 271 289 262 275 227 258 243 244Zoology, Other 122 125 134 114 117 145 100 97 111 126 133Biological Sciences, General 333 278 315 305 288 348 291 209 216 182 200Biological Sciences, Other 142 146 159 164 161 126 138 219 228 225 218
HEALTH SCIENCES 956 1,041 1,112 1,197 1,296 1,330 1,324 1,422 1,501 1,404 1,589
Speech-Lang. Pathology & Audiology 93 90 82 98 95 106 94 88 95 86 106Environmental Health 38 38 44 38 51 51 58 67 54 69 52Health Systems/Services Admin. o o o 35 53 62 60 66 62 62 58Public Health 123 132 157 153 142 152 156 139 156 171 207Epidemiology 102 115 108 120 168 153 149 151 166 180 190Exercise Physiology/Sci., Kinesiology 0 o o o 87 118 105 105 129 104 130Nursing 261 325 338 373 336 354 354 420 399 352 413Pharmacy 116 115 160 146 148 144 145 142 156 137 164Rehabilitation/Therapeutic Services o 17 25 36 43 20 26 34 35 26 40Veterinary Medicine 70 56 63 61 56 55 65 47 49 49 50Health Sciences, General 36 28 30 38 41 35 22 45 17 32. 50Health Sciences, Other 117 125 105 99 76 80 90 118 183 136 129
AGRICULTURAL SCIENCES 1,321 1,242 1,204 1,106 1,240 1,212 1,208 1,116 1,194 1,116 1,085
Agricultural Economics 145 168 141 137 162 173 169 133 155 149 137Agricultural Business and Management 2 1 0 1 o 3 2 1 2 2 5Animal Breeding & Genetics 22 18 23 18 17 19 12 24 18 21 22Animal Nutrition 54 57 41 52 58 50 54 55 45 46 46Dairy Science 20 19 14 11 11 14 9 14 10 12 9Poultry Science 17 13 22 16 21 11 12 9 11 8 9Fisheries Science & Management 42 39 26 38 48 49 46 45 30 38 43Animal Sciences, Other 90 92 97 74 86 85 90 62 60 71 73Agronomy & Crop Science 143 117 123 104 143 114 110 77 97 106 70Plant Breeding & Genetics 87 69 82 68 81 72 63 67 69 44 68Plant Pathology 64 90 63 58 55 52 90 65 66 66 63Plant Protection-Pest Management 4 2 o o o o o o o o oPlant Sciences, Other 23 17 29 28 24 30 21 20 37 38 29Food Distribution 0 o o o 1 o o o o o oFood Engineering 10 12 14 9 16 7 7 11 13 7 10Food Sciences, Other 141 137 151 141 152 135 142 175 153 137 142Soil Chemistry/Microbiology 27 24 24 26 21 27 29 32 27 29 26Soil Sciences, Other 91 78 63 59 69 72 78 56 74 67 64Horticulture Science 101 78 65 62 65 67 73 44 60 66 55Forest Biology 27 17 29 18 20 24 19 22 20 14 22Forest Engineering 2 2 2 3 o 4 0 13 2 1 3Forest Management 14 22 16 17 17 20 22 21 27 17 13Wood Sci. & Pulp/Paper Tech. 16 16 21 20 26 26 18 25 25 21 11
ConserviRenewable Nat. Res. 16 19 9 13 21 24 13 17 25 25 19Forestry & Related Sci., Other 62 45 62 55 59 71 56 50 69 49 54Wildlife/Range Mgt 58 59 55 54 52 50 64 50 56 44 56Agricultural Sciences, General 5 3 9 10 4 6 5 10 8 8 10Agricultural Sciences, Other 38 28 23 14 11 7 4 18 35 30 26
' 492

APPENDIX TABLE B-1. Number of doctorate recipients, by subfield, 1990-2000 (continued)
1990 1991 1992 1993 1994 1995 1996 1997 1998 1999 2000
SOCIAL SCIENCES & PSYCHOLOGY 6,093
2,812
6,152
2,902
6,216
2,953
6,545
3,125
6,613
3,234
6,635
3,206
6,814
3,323
7,052
3,484
7,075
3,399
7,029
3,370
7,115
3,492SOCIAL SCIENCES
Anthropology 324 341 320 342 384 375 396 434 425 462 446Area Studies 22 24 33 36 34 27 28 10 14 11 14Criminology 42 35 37 39 41 44 60 49 55 51 66Demography/Population Studies 20 28 17 22 23 15 11 24 30 28 19Economics 836 861 885 906 913 952 979 999 975 911 933Econometrics 26 24 25 24 26 27 29 31 25 15 15Geography 131 108 111 137 146 150 165 149 154 144 197International Relations/Affairs 97 88 76 102 112 73 99 88 97 119 77Political Science & Government 462 434 513 507 589 600 621 665 663 655 670Public Policy Analysis 87 111 107 98 94 93 104 126 97 124 137Sociology 428 465 495 513 525 540 516 577 549 543 615Statistics 69 31 29 48 46 48 48 56 61 72 60Urban Affairs/Studies 67 90 86 123 132 103 106 93 77 57 78Social Sciences, General 23 36 33 32 21 35 26 26 30 25 39Social Sciences, Other 178 226 186 196 148 124 135 157 147 153 126
PSYCHOLOGY 3,281 3,250 3,263 3,420 3,379 3,429 3,491 3,568 3,676 3,659 3,623
Clinical 1,337 1,305 1,309 1,373 1,285 1,291 1,325 1,267 1,344 1,442 1,357Cognitive & Psycholinguistics 76 94 101 104 129 104 128 166 113 143 141Comparative 8 7 2 5 8 4 3 6 6 11 7Counseling 466 497 507 488 497 470 464 487 448 460 475Developmental and Child 159 155 170 202 179 152 188 215 267 193 203Human/Individual & Family Develop. 0 0 o 0 129 150 151 126 118 133 148Experimental 143 142 154 143 139 151 128 145 149 137 133Educational 98 110 91 91 69 74 92 61 61 66 97Family & Marriage Counseling 0 0 0 0 o 57 52 64 51 55 54Industrial & Organizational 126 142 138 159 137 155 162 187 189 158 188Personality 20 13 17 22 19 16 24 26 25 16 23Physiological/Psychobiology 46 45 55 85 93 92 80 77 92 86 89Psychometrics 8 9 5 9 5 10 11 11 9 15 13Quantitative 15 7 10 16 17 13 19 17 15 14 8School 82 82 88 95 84 91 82 84 106 121 98Social 145 147 139 125 153 155 170 181 186 176 209Psychology, General 371 324 295 306 280 306 279 319 301 229 239Psychology, Other 181 171 182 197 156 138 133 129 196 204 141
HUMANITIES 3,822 4,099 4,444 4,481 4,744 5,061 5,116 5,434 5,509 5,451 5,634
GENERAL HUMANITIES 2,412 2,642 2,879 2,852 3,103 3,208 3,367 3,563 3,608 3,648 3,751
History, American 211 251 277 269 310 344 355 372 408 417 442History, Asian 0 0 0 0 0 43 54 54 70 68 51History, European 151 127 176 162 180 185 187 245 230 234 243History/Philosophy of Sci. & Tech. 26 27 28 37 27 41 37 36 43 49 42History, General 111 121 102 116 140 148 101 82 86 76 103History, Other 113 137 141 142 144 128 123 176 152 164 179Classics 58 55 58 61 84 62 72 53 85 77 63Comparative Literature 97 150 163 153 163 191 164 181 163 166 188Linguistics 167 227 266 214 221 201 230 244 220 250 229Speech & Rhetoric al Studies 38 86 98 111 142 139 155 138 169 150 143Letters, General 19 17 18 18 22 43 28 23 22 19 55Letters, Other 52 44 38 37 25 34 61 60 82 82 92American Studies 72 92 81 101 88 94 115 84 100 98 113Archeology 22 33 33 38 34 35 21 35 34 26 36Art History/Criticism/Conservation 135 125 154 158 182 181 176 188 221 188 228Music 572 587 641 613 685 713 699 726 694 764 749Philosophy 243 285 279 274 302 298 369 447 410 387 363Religion 219 187 231 257 252 248 317 303 327 334 350Drama/Theater Arts 106 91 95 91 102 80 103 116 92 99 82
LANGUAGE AND LITERATURE 1,308 1,350 1,465 1,523 1,537 1,718 1,618 1,746 1,720 1,648 1,711
American Literature 229 253 291 293 296 327 314 408 389 371 460English Language & Literature 567 599 612 655 647 752 699 686 688 651 610French 123 100 124 137 129 151 142 150 137 148 143German 78 71 96 105 67 93 88 82 106 90 83Italian 25 32 20 19 32 35 24 23 33 20 16Spanish 173 173 179 178 212 209 196 249 207 201 218Russian 19 25 28 28 38 28 37 39 43 25 29Slavic 7 14 15 13 10 16 11 9 15 17 14Chinese 16 19 20 21 25 20 29 23 19 27 21Japanese 9 7 12 11 12 7 10 19 11 10 18Hebrew 14 11 20 15 10 11 12 7 8 4 11Arabic 7 4 12 10 4 8 6 4 9 12 15Other Language & Literature 41 42 36 38 55 61 50 47 55 72 73
OTHER HUMANITIES 102 107 100 106 104 135 131 125 181 155 172
Humanities, General 28 29 21 30 32 25 39 25 23 24 40Humanities, Other 74 78 79 76 72 110 92 100 158 131 132
EDUCATION 6,510 6,454 6,677 6,689 6,708 6,649 6,772 6,572 6,568 6,545 6,420
RESEARCH & ADMINISTRATION 4,522 4,675 4,894 4,997 4,927 4,941 5,225 5,030 4,989 5,063 4,936
Curriculum & Instruction 839 807 900 856 819 896 896 916 885 992 968Educational Admin. and Supervision 1,663 1,428 1,290 1,340 1,207 1,086 1,170 1,018 949 894 810Educational Leadership 1 485 694 783 792 889 989 1,033 1,113 1,150 1,199
n rs"
93
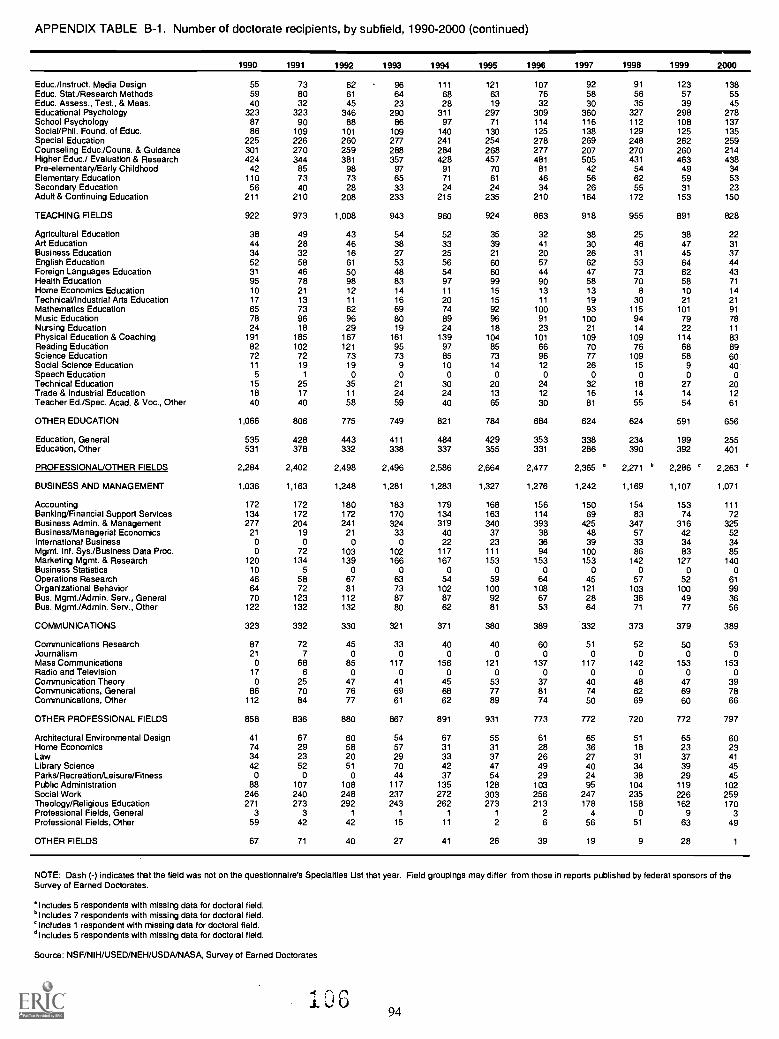
APPENDIX TABLE B-1. Number of doctorate recipients, by subfield, 1990-2000 (continued)
1990 1991 1992 1993 1994 1995 1996 1997 1998 1999 2000
Educ./Instruct. Media Design 55 73 62 96 111 121 107 92 91 123 138Educ. Stat./Research Methods 59 80 61 64 68 63 76 58 56 57 55Educ. Assess., Test., & Meas. 40 32 45 23 28 19 32 30 35 39 45Educational Psychology 323 323 346 290 311 297 309 360 327 298 278School Psychology 87 90 88 86 97 71 114 116 112 108 137Social/Phil. Found. of Educ. 86 109 101 109 140 130 125 138 129 125 135Special Education 225 226 260 277 241 254 278 269 248 262 259Counseling Educ./Couns. & Guidance 301 270 259 288 284 268 277 207 270 260 214Higher Educ./ Evaluation & Research 424 344 381 357 428 457 481 505 431 463 438Pre-elementary/Early Childhood 42 85 98 97 91 70 81 42 54 49 34Elementary Education 110 73 73 65 71 61 46 56 62 59 53Secondary Education 56 40 28 33 24 24 34 26 55 31 23Adult & Continuing Education 211 210 208 233 215 235 210 164 172 153 150
TEACHING FIELDS 922 973 1,008 943 960 924 863 918 955 891 828
Agricultural Education 38 49 43 54 52 35 32 38 25 38 22Art Education 44 28 46 38 33 39 41 30 46 47 31Business Education 34 32 16 27 25 21 20 26 31 45 37English Education 52 58 61 53 56 60 57 62 53 64 44Foreign Languages Education 31 46 50 48 54 60 44 47 73 62 43Health Education 95 78 98 83 97 99 90 58 70 58 71Home Economics Education 10 21 12 14 11 15 13 13 8 10 14TechnicaVIndustrial Arts Education 17 13 11 16 20 15 11 19 30 21 21Mathematics Education 65 73 62 69 74 92 100 93 115 101 91Music Education 78 96 96 80 89 96 91 100 94 79 78Nursing Education 24 18 29 19 24 18 23 21 14 22 11Physical Education & Coaching 191 185 167 161 139 104 101 109 109 114 83Reading Education 82 102 121 95 97 85 66 70 76 68 89Science Education 72 72 73 73 85 73 96 77 109 58 60Social Science Education 11 19 19 9 10 14 12 26 15 9 40Speech Education 5 1 0 0 0 0 0 0 0 0 0Technical Education 15 25 35 21 30 20 24 32 18 27 20Trade & Industrial Education 18 17 11 24 24 13 12 16 14 14 12Teacher Ed./Spec. Acad. & Voc., Other 40 40 58 59 40 65 30 81 55 54 61
OTHER EDUCATION 1,066 806 775 749 821 784 684 624 624 591 656
Education, General 535 428 443 411 484 429 353 338 234 199 255Education, Other 531 378 332 338 337 355 331 286 390 392 401
PROFESSIONAL/OTHER FIELDS 2,284 2,402 2,498 2,496 2,586 2,664 2,477 2,365 ° 2,271 ° 2,286 ° 2,263
BUSINESS AND MANAGEMENT 1,036 1,163 1,248 1,281 1,283 1,327 1,276 1,242 1,169 1,107 1,071
Accounting 172 172 180 183 179 168 156 150 154 153 111Banking/Financial Support Services 134 172 172 170 134 163 114 69 83 74 72Business Admin. & Management 277 204 241 324 31.9 340 393 425 347 316 325Business/Managerial Economics 21 19 21 33 40 37 38 48 57 42 52International Business 0 0 0 0 22 23 36 39 33 34 34Mgmt. Inf. Sys./Business Data Proc. 0 72 103 102 117 111 94 100 86 83 85Marketing Mgmt. & Research 120 134 139 166 167 153 153 153 142 127 140Business Statistics 10 5 0 0 0 0 0 0 0 0 0Operations Research 46 58 67 63 54 59 64 45 57 52 61Organizational Behavior 64 72 81 73 102 100 108 121 103 100 99Bus. Mgmt./Admin. Serv., General 70 123 112 87 87 92 67 28 36 49 36Bus. Mgmt./Admin. Serv., Other 122 132 132 80 62 81 53 64 71 77 56
COMMUNICATIONS 323 332 330 321 371 380 389 332 373 379 389
Communications Research 87 72 45 33 40 40 60 51 52 50 53Journalism 21 7 0 0 0 0 0 0 0 0 0Mass Communications 0 68 85 117 156 121 137 117 142 153 153Radio and Television 17 6 0 0 0 0 0 0 0 0 0Communication Theory 0 25 47 41 45 53 37 40 48 47 39Communications, General 86 70 76 69 68 77 81 74 62 69 78Communications, Other 112 84 77 61 62 89 74 50 69 60 66
OTHER PROFESSIONAL FIELDS 858 836 880 867 891 931 773 772 720 772 797
Architectural Environmental Design 41 67 60 54 67 55 61 65 51 65 60Home Economics 74 29 58 57 31 31 28 36 18 23 23Law 34 23 20 29 33 37 26 27 31 37 41Library Science 42 52 51 70 42 47 49 40 34 39 45Parks/Recreation/Leisure/Fitness 0 0 0 44 37 54 29 24 38 29 45Public Administration 88 107 108 117 135 128 103 95 104 119 102Social Work 246 240 248 237 272 303 256 247 235 226 259Theology/Religious Education 271 273 292 243 262 273 213 178 158 162 170Professional Fields, General 3 3 1 1 1 1 2 4 0 9 3Professional Fields, Other 59 42 42 15 11 2 6 56 51 63 49
OTHER FIELDS 67 71 40 27 41 26 39 19 9 28 1
d
NOTE: Dash (-) indicates that the field was not on the questionnaire's Specialties List that year. Field groupings may differ from those in reports published by federal sponsors of theSurvey of Earned Doctorates.
°Includes 5 respondents with missing data for doctoral field.°Includes 7 respondents with missing data for doctoral field.°Includes 1 respondent with missing data for doctoral field.d Includes 5 respondents with missing data for doctoral field.
Source: NSF/NIH/USED/NEH/USDA/NASA, Survey of Earned Doctorates
94
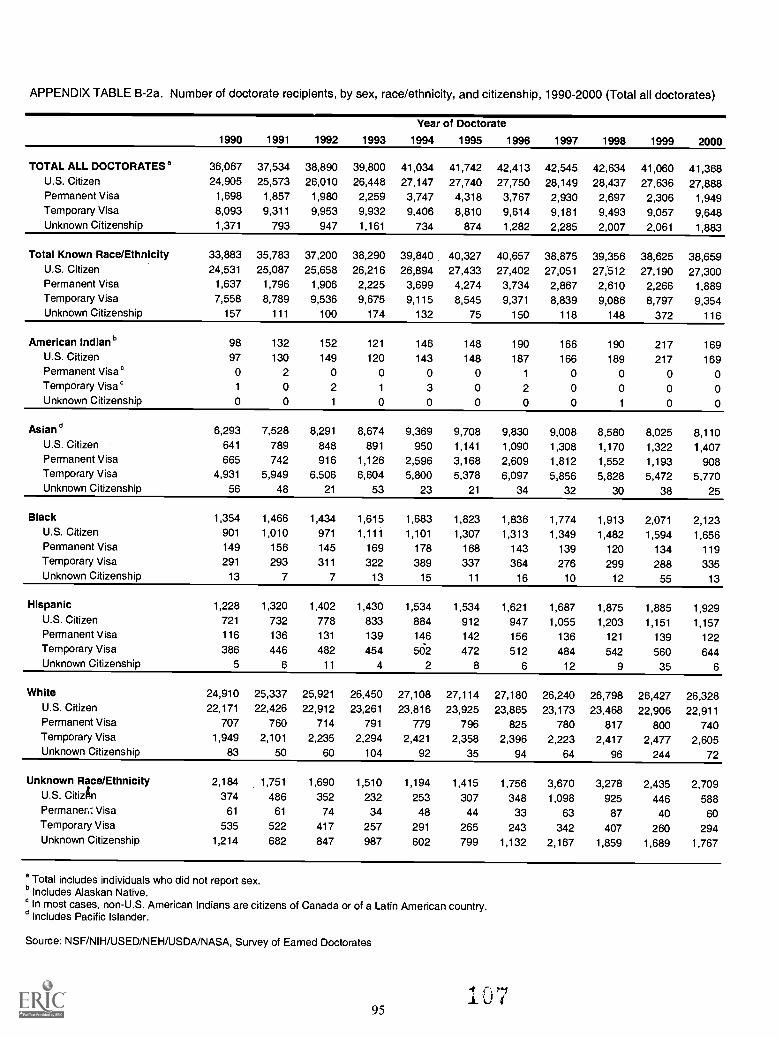
APPENDIX TABLE B-2a. Number of doctorate recipients, by sex, race/ethnicity, and citizenship, 1990-2000 (Total all doctorates)
Year of Doctorate1990 1991 1992 1993 1994 1995 1996 1997 1998 1999 2000
TOTAL ALL DOCTORATES a 36,067 37,534 38,890 39,800 41,034 41,742 42,413 42,545 42,634 41,060 41,368U.S. Citizen 24,905 25,573 26,010 26,448 27,147 27,740 27,750 28,149 28,437 27,636 27,888Permanent Visa 1,698 1,857 1,980 2,259 3,747 4,318 3,767 2,930 2,697 2,306 1,949Temporary Visa 8,093 9,311 9,953 9,932 9,406 8,810 9,614 9,181 9,493 9,057 9,648Unknown Citizenship 1,371 793 947 1,161 734 874 1,282 2,285 2,007 2,061 1,883
Total Known Race/Ethnicity 33,883 35,783 37,200 38,290 39,840 40,327 40,657 38,875 39,356 38,625 38,659U.S. Citizen 24,531 25,087 25,658 26,216 26,894 27,433 27,402 27,051 27;512 27,190 27,300Permanent Visa 1,637 1,796 1,906 2,225 3,699 4,274 3,734 2,867 2,610 2,266 1,889Temporary Visa 7,558 8,789 9,536 9,675 9,115 8,545 9,371 8,839 9,086 8,797 9,354Unknown Citizenship 157 111 100 174 132 75 150 118 148 372 116
American Indian b 98 132 152 121 146 148 190 166 190 217 169U.S. Citizen 97 130 149 120 143 148 187 166 189 217 169Permanent Visa c 0 2 0 0 0 0 1 0 0 0 0Temporary Visa c 1 0 2 1 3 0 2 0 0 0 0Unknown Citizenship 0 0 1 0 0 0 0 0 1 0 0
Asian d 6,293 7,528 8,291 8,674 9,369 9,708 9,830 9,008 8,580 8,025 8,110U.S. Citizen 641 789 848 891 950 1,141 1,090 1,308 1,170 1,322 1,407Permanent Visa 665 742 916 1,126 2,596 3,168 2,609 1,812 1,552 1,193 908Temporary Visa 4,931 5,949 6,506 6,604 5,800 5,378 6,097 5,856 5,828 5,472 5,770Unknown Citizenship 56 48 21 53 23 21 34 32 30 38 25
Black 1,354 1,466 1,434 1,615 1,683 1,823 1,836 1,774 1,913 2,071 2,123U.S. Citizen 901 1,010 971 1,111 1,101 1,307 1,313 1,349 1,482 1,594 1,656Permanent Visa 149 156 145 169 178 168 143 139 120 134 119Temporary Visa 291 293 311 322 389 337 364 276 299 288 335Unknown Citizenship 13 7 7 13 15 11 16 10 12 55 13
Hispanic 1,228 1,320 1,402 1,430 1,534 1,534 1,621 1,687 1,875 1,885 1,929U.S. Citizen 721 732 778 833 884 912 947 1,055 1,203 1,151 1,157Permanent Visa 116 136 131 139 146 142 156 136 121 139 122Temporary Visa 386 446 482 454 562 472 512 484 542 560 644Unknown Citizenship 5 6 11 4 2 8 6 12 9 35 6
White 24,910 25,337 25,921 26,450 27,108 27,114 27,180 26,240 26,798 26,427 26,328U.S. Citizen 22,171 22,426 22,912 23,261 23,816 23,925 23,865 23,173 23,468 22,906 22,911Permanent Visa 707 760 714 791 779 796 825 780 817 800 740Temporary Visa 1,949 2,101 2,235 2,294 2,421 2,358 2,396 2,223 2,417 2,477 2,605Unknown Citizenship 83 50 60 104 92 35 94 64 96 244 72
Unknown Race/Ethnicity 2,184 1,751 1,690 1,510 1,194 1,415 1,756 3,670 3,278 2,435 2,709U.S. CitizAn 374 486 352 232 253 307 348 1,098 925 446 588Permanery: Visa 61 61 74 34 48 44 33 63 87 40 60Temporary Visa 535 522 417 257 291 265 243 342 407 260 294Unknown Citizenship 1,214 682 847 987 602 799 1,132 2,167 1,859 1,689 1,767
a Total includes individuals who did not report sex.b Includes Alaskan Native.
In most cases, non-U.S. American Indians are citizens of Canada or of a Latin American country.d Includes Pacific Islander.
Source: NSF/NII-I/USED/NEH/USDA/NASA, Survey of Earned Doctorates
95I

APPENDIX TABLE B-2b. Number of doctorate recipients, by sex, race/ethnicity, and citizenship, 1990-2000 (Total men)
Year of Doctorate
1990 1991 1992 1993 1994 1995 1996 1997 1998 1999 2000
TOTAL MEN 22,960 23,525 24,235 24,384 25,059 25,158 25,273 24,939 24,634 23,418 23,173
U.S. Citizen 14,165 14,385 14,518 14,512 14,732 14,964 14,707 15,041 14,869 14,372 14,107
Permanent Visa 1,189 1,223 1,290 1,468 2,636 2,908 2,485 1,834 1,662 1,378 1,137
Temporary Visa 6,632 7,506 7,946 7,835 7,306 6,841 7,389 6,963 7,005 6,630 6,839
Unknown Citizenship 974 411 481 569 385 445 692 1,101 1,098 1,038 1,090
Total Known Race/Ethnicity 21,342 22,356 23,168 23,534 24,324 24,296 24,247 22,993 22,715 22,041 21,557
U.S. Citizen 13,899 14,032 14,262 14,343 14,564 14,749 14,476 14,426 14,323 14,088 13,766
Permanent Visa 1,149 1,177 1,236 1,444 2,602 2,882 2,463 1,795 1,603 1,350 1,098
Temporary Visa 6,175 7,073 7,606 7,641 7,093 6,629 7,208 6,706 6,712 6,444 6,634
Unknown Citizenship 119 74 64 106 65 36 100 66 77 159 59
American Indian a 52 74 82 61 74 80 104 78 104 97 76
U.S. Citizen 52 74 82 60 71 80 103 78 104 97 76
Permanent Visa b 0 0 0 0 0 0 0 0 0 0 0
Temporary Visa b 0 0 0 1 3 0 1 0 0 0 0
Unknown Citizenship 0 0 0 0 0 0 0 0 0 0 0
Asian` 5,030 5,872 6,418 6,605 7,061 7,102 7,209 6,421 6,032 5,542 5,375
U.S. Citizen 427 482 531 552 590 667 615 747 647 772 761
Permanent Visa 481 489 604 732 1,877 2,198 1,787 1,142 985 712 504
Temporary Visa 4,077 4,865 5,265 5,282 4,576 4,222 4,782 4,513 4,384 4,031 4,093
Unknown Citizenship 45 36 18 39 18 15 25 19 16 27 17
Black 733 788 771 840 889 881 933 863 824 920 889
U.S. Citizen 351 421 396 441 411 490 534 533 526 602 568
Permanent Visa 128 131 123 138 142 125 107 108 87 92 82
Temporary Visa 243 232 246 251 329 261 . 286 213 204 211 233
Unknown Citizenship 11 4 6 10 7 5 6 9 7 15 6
Hispanic 760 807 860 874 866 909 927 978 1,059 981 1,057
U.S. Citizen 380 371 410 423 438 458 473 540 610 499 540
Permanent Visa 69 88 72 94 80 79 87 82 71 68 59
Temporary Visa 309 344 371 356 346 369 363 350 375 404 456
Unknown Citizenship 2 4 7 1 2 3 4 6 3 10 2
White 14,767 14,815 15,037 15,154 15,434 15,324 15,074 14,653 14,696 14,501 14,160
U.S. Citizen 12,689 12,684 12,843 12,867 13,054 13,054 12,751 12,528 12,436 12,118 11,821
Permanent Visa 471 469 437 480 503 480 482 463 460 478 453
Temporary Visa 1,546 1,632 1,724 1,751 1,839 1,777 1,776 1,630 1,749 1,798 1,852
Unknown Citizenship 61 30 33 56 38 13 65 32 51 107 34
Unknown Race/Ethnicity 1,618 1,169 1,067 850 735 862 1,026 1,946 1,919 1,377 1,616
U.S. Citizen 266 353 256 169 168 215 231 615 546 284 341
Permanent Visa 40 46 54 24 34 26 22 39 59 28 39
Temporary Visa 457 433 340 194 213 212 181 257 293 186 205
Unknown Citizenship 855 337 417 463 320 409 592 1,035 1,021 879 1,031
a Includes Alaskan Native.b In most cases, non-U.S. American Indians are citizens of Canada or of a Latin American country.Includes Pacific Islander.
Source: NSF/NIH/USED/NEH/USDNNASA, Survey of Earned Doctorates
96

APPENDIX TABLE B-2c. Number of doctorate recipients, by sex, race/ethnicity, and citizenship, 1990-2000 (Total women)
1990 1991 1992 1993Year of Doctorate
1994 1995 1996 1997 1998 1999 2000
TOTAL WOMEN 13,106 13,873 14,436 15,121 15,820 16,414 16,944 17,246 17,834 17,464 18,121
U.S. Citizen 10,740 11,185 11,491 11,931 12,412 12,774 13,043 13,074 13,554 13,264 13,778
Permanent Visa 508 633 687 788 1,110 1,409 1,282 1,095 1,019 928 810
Temporary Visa 1,461 1,794 1,990 2,069 2,077 1,952 2,214 2,203 2,468 2,423 2,808Unknown Citizenship 397 261 268 333 221 279 405 874 793 849 725
Total Known Race/Ethnicity 12,540 13,417 14,019 14,737 15,501 16,023 16,405 15,869 16,616 16,583 17,101
U.S. Citizen 10,632 11,053 11,396 11,871 12,327 12,684 12,926 12,622 13,186 13,102 13,534
Permanent Visa 487 619 669 779 1,096 1,391 1,271 1,071 999 916 791
Temporary Visa 1,383 1,708 1,920 2,021 2,014 1,910 2,159 2,124 2,361 2,352 2,720Unknown Citizenship 38 37 34 66 64 38 49 52 70 213 56
American Indian a 46 58 70 60 72 68 86 88 86 120 93U.S. Citizen 45 56 67 60 72 68 84 88 85 120 93Permanent Visa b 0 2 0 0 0 0 1 0 0 0 0
Temporary Visa b 1 0 2 0 0 0 1 0 0 0 0
Unknown Citizenship 0 0 1 0 0 0 0 0 1 0 0
Asian` 1,262 1,648 1,862 2,055 2,298 2,599 2,616 2,580 2,532 2,482 2,735U.S. Citizen 214 306 317 338 359 474 475 560 522 550 646Permanent Visa 183 253 311 392 718 969 822 670 560 481 404Temporary Visa 854 1,077 1,231 1,312 1,218 1,150 1,311 1,337 1,437 1,440 1,677Unknown Citizenship 11 12 3 13 3 6 8 13 13 11 8
Black 621 678 663 773 792 942 903 911 1,087 1,151 1,234U.S. Citizen 550 589 575 670 690 817 779 816 956 992 1,088Permanent Visa 21 25 22 31 36 43 36 31 32 42 37Temporary Visa 48 61 65 70 59 76 78 63 94 77 102
Unknown Citizenship 2 3 1 2 7 6 10 1 5 40 7
Hispanic 468 513 542 555 668 625 694 709 814 904 872U.S. Citizen 341 361 368 410 446 454 474 515 592 652 617Permanent Visa 47 48 59 45 66 63 69 54 50 71 63Temporary Visa 77 102 111 97 156 103 149 134 166 156 188
Unknown Citizenship 3 2 4 3 0 5 2 6 6 25 4
White 10,143 10,520 10,882 11,294 11,671 11,789 12,106 11,581 12,097 11,926 12,167U.S. Citizen 9,482 9,741 10,069 10,393 10,760 10,871 11,114 10,643 11,031 10,788 11,090Permanent Visa 236 291 277 311 276 316 343 316 357 322 287Temporary Visa 403 468 511 542 581 581 620 590 664 679 753Unknown Citizenship 22 20 25 48 54 21 29 32 45 137 37
Unknown Race/Ethnicity 566 456 417 384 319 391 539 1,377 1,218 881 1,020U.S. Citizen 108 132 95 60 85 90 117 452 368 162 244Permanent Visa 21 14 18 9 14 18 11 24 20 12 19
Temporary Visa 78 86 70 48 63 42 55 79 107 71 88Unknown Citizenship 359 224 234 267 157 241 356 822 723 636 669
a Includes Alaskan Native.b In most cases, non-U.S. American Indians are citizens of Canada or of a Latin American country.
Includes Pacific Islander.
Source: NSF/NIH/USED/NEH/USDNNASA, Survey of Earned Doctorates
J 97

APPENDIX C: Technical Notes
I. Survey Response Rates
Appendix Table C-1. Survey Response Rates a
YearSelf-Report
Rate YearSelf-Report
Rate
1967 97.3 1984 95.1
1968 97.6 1985 94.8
1969 96.6 1986 93.5
1970 98.1 1987 93.1
1971 97.5 1988 92.9
1972 97.3 1989 92.3
1973 97.5 1990 93.6
1974 94.2 1991 94.6
1975 97.3 1992 95.1
1976 97.2 1993 94.7
1977 96.6 1994 94.6
1978 96.3 1995 94.1
1979 96.4 1996 92.9
1980 96.2 1997 91.4
1981 95.7 1998 91.9
1982 95.3 1999 91.9
1983 95.5 2000 91.9
a The rates for 1967-99 reflect late responses. The rate for 2000 may increase slightly inthe next year if additional questionnaires are received after survey closure. Self-reportrates for 1980-2000 were determined from the "source of response" indicator in thedoctorate records. Because this indicator was not coded prior to 1980, survey forms for1967-79 are assumed to be self-reported if "month signed" or "marital status" is present."Marital status" is not available from sources other than the doctorate recipient.
As shown in the table above, 91.9 percent of 2000 U.S. research doctorate recipientscompleted survey forms. This percentage is what has been referred to as the "self-report" rate.The remaining doctorate recipients have either "skeletal" records containing only PHDINST,PHDFY, PHDCY, SEX, PHDMONTH, (and in private identifier files, Name) or "institutionprovided" records including the skeletal information above as well as information provided bythe institution in "missing information rosters (MIRs)" where available.
It should be noted that the sex variable was not always available, even for surveyrespondents. Every effort was made to obtain this information for as many respondents aspossible, but for a small percentage, this could not be done with confidence. Thus, you willnotice that there are missing data for many of the tabulations involving sex in this year's report.Prior to 1997, whenever sex was missing, the data were assigned to "male." In 1997, it wasdecided to discontinue this practice. The tabulations involving sex for 1997 through 2000exclude missing cases except where noted otherwise.
0 98

Wherever possible this report includes data from all Ph.D. records whether complete orskeletal; thus the reported total number of Ph.D. recipients for 2000 (41,368) includes bothrespondents and non-respondents. It should also be noted that, in keeping with the practice ofearlier data collection cycles, counts for previous years were corrected by the addition of datafrom surveys received after the close of data collection for a given year.
A Comparison of Self-Reported and Institution-Supplied Data
So far, self-report rates have been discussed at the institution level. But is there asignificant difference between respondents who complete questionnaires and those who arenonrespondents to the survey? One way to check is to compare the profiles of critical item dataprovided on survey forms with similar data ascertained from institution-supplied data providedfor nonrespondents. Table C-2 compares these data on eight critical items. The table presents twotypes of data: the percentage of missing data for each critical item, by type of response; and thepercentage-response breakdown for non-missing data for each critical item.
99 i 1
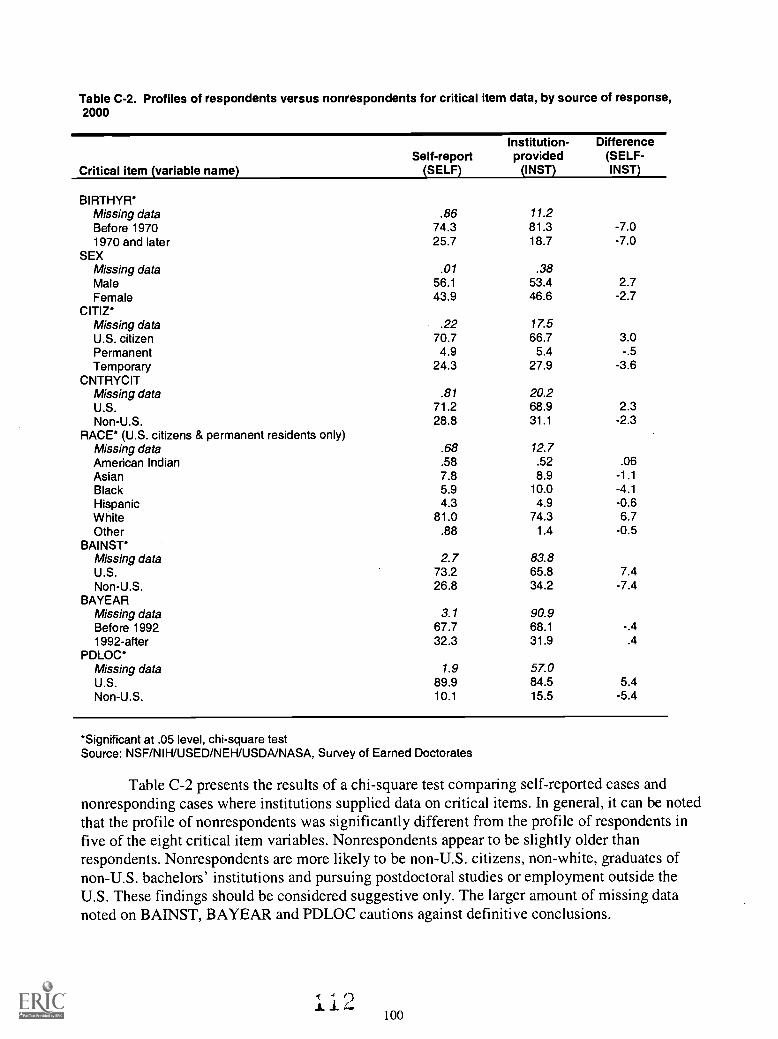
Table C-2. Profiles of respondents versus nonrespondents for critical item data, by source of response,2000
Critical item (variable name)Self-report
(SELF)
Institution-provided
(INST)
Difference(SELF-INST)
BIRTHYR*Missing data .86 11.2Before 1970 74.3 81.3 -7.01970 and later 25.7 18.7 -7.0
SEXMissing data .01 .38Male 56.1 53.4 2.7Female 43.9 46.6 -2.7
CITIZ*Missing data .22 17.5U.S. citizen 70.7 66.7 3.0Permanent 4.9 5.4 -.5Temporary 24.3 27.9 -3.6
CNTRYCITMissing data .81 20.2U.S. 71.2 68.9 2.3Non-U.S. 28.8 31.1 -2.3
RACE* (U.S. citizens & permanent residents only)Missing data .68 12.7American Indian .58 .52 .06Asian 7.8 8.9 -1.1Black 5.9 10.0 -4.1Hispanic 4.3 4.9 -0.6White 81.0 74.3 6.7Other .88 1.4 -0.5
BAINST*Missing data 2.7 83.8U.S. 73.2 65.8 7.4Non-U.S. 26.8 34.2 -7.4
BAYEARMissing data 3.1 90.9Before 1992 67.7 68.1 -.41992-after 32.3 31.9 .4
PDLOC*Missing data 1.9 57.0U.S. 89.9 84.5 5.4Non-U.S. 10.1 15.5 -5.4
*Significant at .05 level, chi-square testSource: NSF/NIH/USED/NEH/USDNNASA, Survey of Earned Doctorates
Table C-2 presents the results of a chi-square test comparing self-reported cases andnonresponding cases where institutions supplied data on critical items. In general, it can be notedthat the profile of nonrespondents was significantly different from the profile of respondents infive of the eight critical item variables. Nonrespondents appear to be slightly older thanrespondents. Nonrespondents are more likely to be non-U.S. citizens, non-white, graduates ofnon-U.S. bachelors' institutions and pursuing postdoctoral studies or employment outside theU.S. These findings should be considered suggestive only. The larger amount of missing datanoted on BAINST, BAYEAR and PDLOC cautions against definitive conclusions.
100
II. Item Response Rates
The table on the following pages shows the response rates for each item in the Survey ofEarned Doctorates for 1990 through 2000. The numbers and percentages shown in the tables andfigures in the body of the summary report are based only on the number of research doctoraterecipients who responded to the applicable survey items. For cross-tabulations, the response ratefor a given tabulation will be no greater than the lowest response rate for the items involved inthe tabulation.
For additional technical information on the Survey of Earned Doctorates, please contact
The Doctorate Data ProjectNational Opinion Research Center at the University of Chicago1155 East 60th StreetChicago, IL 60637
Phone: (312) 759-4031Email: [email protected]
101113

II. IT
EM
RE
SP
ON
SE
RA
TE
S, 1
990-
2000
App
endi
x T
able
C-3
. Ite
m r
espo
nse
rate
s, 1
990-
2000
Var
iabl
e
Nam
eF
ield
1990
1991
1992
1993
1994
1995
1996
1997
1998
1999
(Pre
lim)
1999
(Adj
uste
d)20
00(P
relim
)
PH
DF
ICE
Ph.
D. F
ICE
Cod
e10
0.0
100.
010
0.0
100.
010
0.0
100.
010
0.0
NA
NA
NA
NA
NA
RA
CE
aR
ace/
Eth
nic
Gro
up (
Rec
oded
)93
.995
.395
.696
.297
.697
.196
.493
.093
.694
.895
.094
.5
PH
DE
NT
RY
Firs
t Gra
d. Y
ear
in P
h.D
. lns
tn.
NA
NA
NA
86.9
86.7
86.5
85.5
79.0
83.6
85.7
85.9
84.8
SR
CE
1ED
bP
rimar
y S
ourc
e of
Sup
port
(E
dite
d)78
.177
.669
.766
.272
.474
.987
.987
.888
.589
.889
.990
.0
PD
WK
1ED
CP
rimar
y W
ork
Act
ivity
(E
dite
d)56
.255
.955
.754
.756
.356
.660
.860
.361
.160
.060
.162
.0
(83.
8)(8
3.8)
(83.
5)(8
3.3)
(86.
1)(8
6.8)
(93.
3)(9
2.8)
(93.
0)(9
4.9)
(94.
9)(9
5.0)
PD
WK
2ED
CS
econ
dary
Wor
k A
ctiv
ity (
Edi
ted)
39.5
39.5
37.4
36.7
38.2
38.4
48.5
51.7
52.2
49.8
49.9
51.5
(58.
9)(5
9.3)
(56.
0)(5
5.8)
(58.
4)(5
8.8)
(74.
4)(7
9.6)
(79.
7)(7
8.8)
(78.
8)(7
8.7)
ED
FA
TF
IER
Fat
her's
Edu
catio
n90
.892
.393
.192
.792
.792
.391
.489
.489
.890
.390
.490
.4
ED
MO
TH
ER
Mot
her's
Edu
catio
n90
.592
.293
.092
.692
.592
.191
.689
.689
.990
.590
.790
.7
BIR
TH
YR
Yea
r of
Birt
h96
.698
.297
.797
.398
.297
.596
.892
.892
.794
.995
.095
.0
BIR
TH
PL
Pla
ce o
f Birt
h92
.194
.195
.194
.994
.994
.593
.090
.590
.891
.091
.191
.0
SE
XS
ex10
0.0
99.6
99.4
99.2
99.6
99.6
99.5
99.2
99.6
99.5
99.6
99.8
MA
RIT
AL
Mar
ital S
tatu
s91
.791
.592
.091
.691
.591
.091
.789
.290
.290
.690
.790
.7
DE
PE
ND
SN
umbe
r of
Dep
ende
nts
90.0
89.5
89.8
89.8
89.7
89.4
89.5
88.2
88.7
88.9
89.1
89.0
CIT
IZC
itize
nshi
p96
.297
.997
.697
.198
.297
.997
.094
.695
.394
.895
.095
.4
CN
TR
YC
IT '
Cou
ntry
of C
itize
nshi
p26
.429
.230
.330
.231
.831
.331
.326
.526
.926
.626
.627
.4
(97.
2)(9
8.0)
(98.
5)(9
8.6)
(99.
3)(9
9.4)
(98.
5)(9
5.6)
(94.
2)(9
6.1)
(96.
1)(9
7.6)
NO
TE
: NA
= n
ot a
vaila
ble.
a T
he p
erce
ntag
e re
pres
ents
the
race
/eth
nic
grou
ps c
onve
ntio
nally
rep
orte
d by
the
Doc
tora
te D
ata
Pro
ject
; mul
tiple
and
"ot
her"
rac
es a
re e
xclu
ded.
b A
s of
FY
199
6, th
e pe
rcen
tage
incl
udes
rec
ipie
nts
who
sai
d th
ey h
ad n
o pr
imar
y so
urce
of s
uppo
rt.
The
per
cent
ages
on
the
first
line
are
bas
ed o
n th
e to
tal d
octo
ral c
ohor
t for
a fi
scal
yea
r. T
he p
erce
ntag
es o
n th
e se
cond
line
(en
clos
ed in
pare
nthe
ses)
are
bas
ed o
n th
e nu
mbe
r of
non
-U
.S. c
itize
ns in
that
yea
r.
102
aw,
1
A A
%)
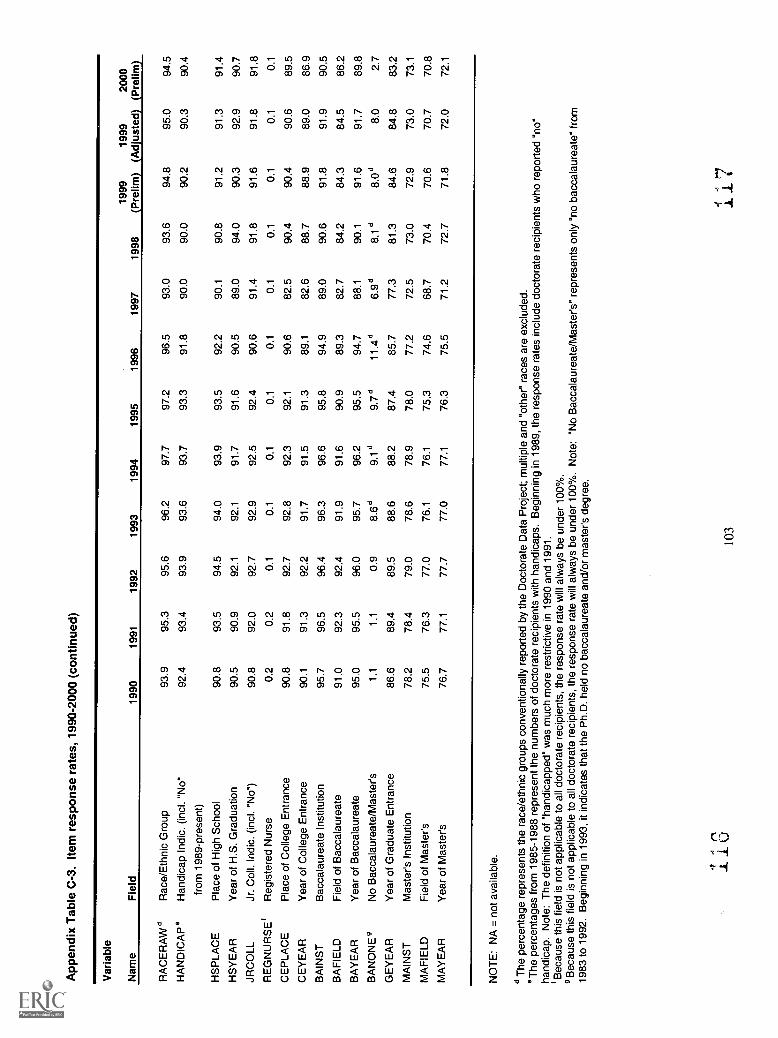
App
endi
x T
able
C-3
. Ite
m r
espo
nse
rate
s, 1
990-
2000
(co
ntin
ued)
Var
iabl
e
Nam
eF
ield
1990
1991
1992
1993
1994
1995
1996
1997
1998
1999
(Pre
lim)
1999
(Adj
uste
d)20
00(P
relim
)
RA
CE
RA
W °
Rac
e/E
thni
c G
roup
93.9
95.3
95.6
96.2
97.7
97.2
96.5
93.0
93.6
94.8
95.0
94.5
HA
ND
ICA
P°
Han
dica
p In
dic.
(in
cl. "
No"
from
198
9-pr
esen
t)
92.4
93.4
93.9
93.6
93.7
93.3
91.8
90.0
90.0
90.2
90.3
90.4
HS
PLA
CE
Pla
ce o
f Hig
h S
choo
l90
.893
.594
.594
.093
.993
.592
.290
.190
.891
.291
.391
.4H
SY
EA
RY
ear
of H
.S. G
radu
atio
n90
.590
.992
.192
.191
.791
.690
.589
.094
.090
.392
.990
.7JR
CO
LLJr
. Col
l. In
dic.
(in
cl. "
No"
)90
.892
.092
.792
.992
.592
.490
.691
.491
.891
.691
.891
.8R
EG
NU
RS
E'
Reg
iste
red
Nur
se0.
20.
20.
10.
10.
10.
10.
10.
10.
10.
10.
10.
1
CE
PLA
CE
Pla
ce o
f Col
lege
Ent
ranc
e90
.891
.892
.792
.892
.392
.190
.682
.590
.490
.490
.689
.5C
EY
EA
RY
ear
of C
olle
ge E
ntra
nce
90.1
91.3
92.2
91.7
91.5
91.3
89.1
82.6
88.7
88.9
89.0
86.9
BA
INS
TB
acca
laur
eate
Inst
itutio
n95
.796
.596
.496
.396
.695
.894
.989
.090
.691
.891
.990
.5B
AF
IELD
Fie
ld o
f Bac
cala
urea
te91
.092
.392
.491
.991
.690
.989
.382
.784
.284
.384
.586
.2B
AY
EA
RY
ear
of B
acca
laur
eate
95.0
95.5
96.0
95.7
96.2
95.5
94.7
88.1
90.1
91.6
91.7
89.8
BA
NO
NE
gN
o B
acca
laur
eate
/Mas
ter's
1.1
1.1
0.9
8.6
d9.
1 d
d11
.4 °
6.9
d8.
1 d
8.0
°8.
02.
7G
EY
EA
RY
ear
of G
radu
ate
Ent
ranc
e86
.689
.489
.588
.688
.287
.485
.777
.381
.384
.684
.883
.2M
AIN
ST
Mas
ter's
Inst
itutio
n78
.278
.479
.078
.678
.978
.077
.272
.573
.072
.973
.073
.1
MA
FIE
LDF
ield
of M
aste
r's75
.576
.377
.076
.176
.175
.374
.668
.770
.470
.670
.770
.8M
AY
EA
RY
ear
of M
aste
r's76
.777
.177
.777
.077
.176
.375
.571
.272
.771
.872
.072
.1
NO
TE
: NA
= n
ot a
vaila
ble.
° T
he p
erce
ntag
e re
pres
ents
the
race
/eth
nic
grou
ps c
onve
ntio
nally
rep
orte
d by
the
Doc
tora
te D
ata
Pro
ject
; mul
tiple
and
"oth
er"
race
s ar
e ex
clud
ed.
e T
he p
erce
ntag
es fr
om 1
985-
1988
rep
rese
nt th
e nu
mbe
rs o
f doc
tora
te r
ecip
ient
s w
ith h
andi
caps
. Beg
inni
ng in
198
9, th
ere
spon
se r
ates
incl
ude
doct
orat
e re
cipi
ents
who
rep
orte
d "n
o"ha
ndic
ap. N
ote:
The
def
initi
on o
f "ha
ndic
appe
d" w
as m
uch
mor
e re
stric
tive
in 1
990
and
1991
.B
ecau
se th
is fi
eld
is n
ot a
pplic
able
to a
ll do
ctor
ate
reci
pien
ts, t
he r
espo
nse
rate
will
alw
ays
be u
nder
100
%.
g B
ecau
se th
is fi
eld
is n
ot a
pplic
able
to a
ll do
ctor
ate
reci
pien
ts, t
he r
espo
nse
rate
will
alw
ays
be u
nder
100
%. N
ote:
"N
o B
acca
laur
eate
/Mas
ter's
" re
pres
ents
onl
y "n
oba
ccal
aure
ate"
from
1983
to 1
992.
Beg
inni
ng in
199
3, it
indi
cate
s th
at th
e P
h.D
. hel
d no
bac
cala
urea
te a
nd/o
r m
aste
r's d
egre
e.
4 4
fl.1
I 0
103
117
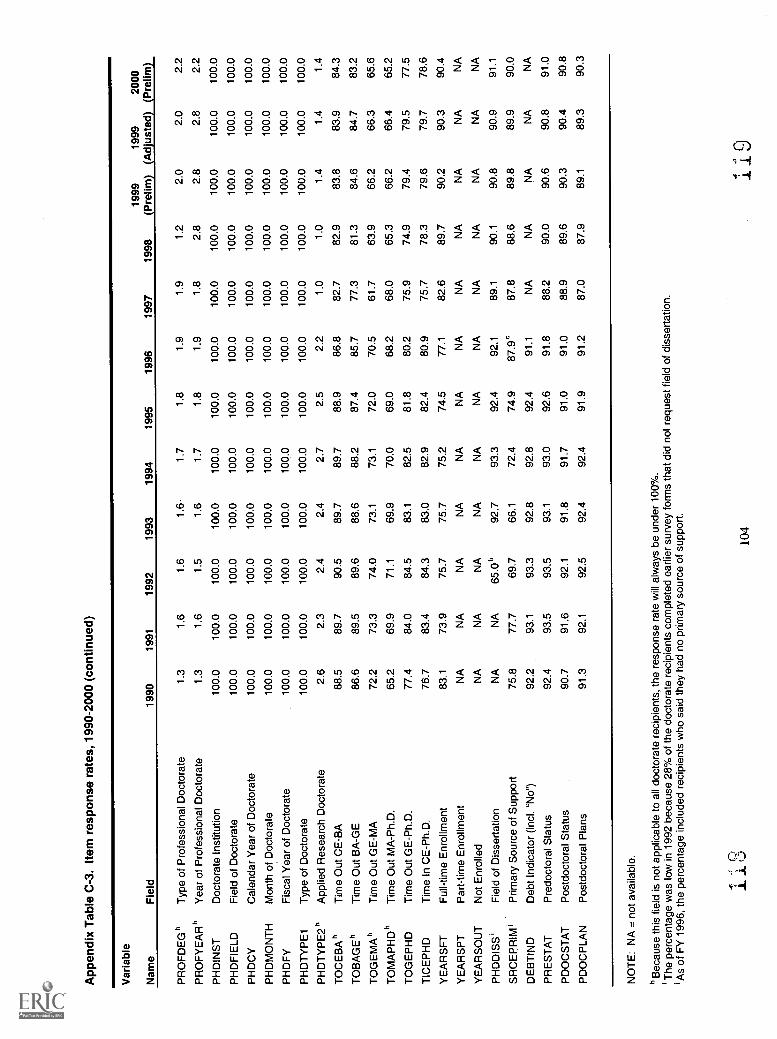
App
endi
x T
able
C-3
. Ite
m r
espo
nse
rate
s, 1
990-
2000
(co
ntin
ued)
Var
iabl
e
Nam
eF
ield
1990
1991
1992
1993
1994
1995
1996
1997
1998
1999
(Pre
lim)
1999
(Adj
uste
d)20
00(P
relim
)
PR
OF
DE
G h
PR
OF
YE
AR
h
Typ
e of
Pro
fess
iona
l Doc
tora
te
Yea
r of
Pro
fess
iona
l Doc
tora
te
1.3
1.3
1.6
1.6
1.6
1.5
1.6
1.6
1.7
1.7
1.8
1.8
1.9
1.9
1.9
1.8
1.2
2.8
2.0
2.8
2.0
2.8
2.2
2.2
PH
DIN
ST
Doc
tora
te In
stitu
tion
100.
010
0.0
100.
010
0.0
100.
010
0.0
100.
010
0.0
100.
010
0.0
100.
010
0.0
PH
DF
IELD
Fie
ld o
f Doc
tora
te10
0.0
100.
010
0.0
100.
010
0.0
100.
010
0.0
100.
010
0.0
100.
010
0.0
100.
0
PH
DC
YC
alen
dar
Yea
r of
Doc
tora
te10
0.0
100.
010
0.0
100.
010
0.0
100.
010
0.0
100.
010
0.0
100.
010
0.0
100.
0
PH
DM
ON
TH
Mon
th o
f Doc
tora
te10
0.0
100.
010
0.0
100.
010
0.0
100.
010
0.0
100.
010
0.0
100.
010
0.0
100.
0
PH
DF
YF
isca
l Yea
r of
Doc
tora
te10
0.0
100.
010
0.0
100.
010
0.0
100.
010
0.0
100.
010
0.0
100.
010
0.0
100.
0
PH
DT
YP
E1
Typ
e of
Doc
tora
te10
0.0
100.
010
0.0
100.
010
0.0
100.
010
0.0
100.
010
0.0
100.
010
0.0
100.
0
PH
DT
YP
E2
hA
pplie
d R
esea
rch
Doc
tora
te2.
62.
32.
42.
42.
72.
52.
21.
01.
01.
41.
41.
4
TO
CE
BA
hT
ime
Out
CE
-BA
88.5
89.7
90.5
89.7
89.7
88.9
86.8
82.7
82.9
83.8
83.9
84.3
TO
BA
GE
hT
ime
Out
BA
-GE
86.6
89.5
89.6
88.6
88.2
87.4
85.7
77.3
81.3
84.6
84.7
83.2
TO
GE
MA
hT
ime
Out
GE
-MA
72.2
73.3
74.0
73.1
73.1
72.0
70.5
61.7
63.9
66.2
66.3
65.6
TO
MA
PH
Dh
Tim
e O
ut M
A-P
h.D
.65
.269
.971
.169
.970
.069
.068
.268
.065
.366
.266
.465
.2
TO
GE
PH
DT
ime
Out
GE
-Ph.
D.
77.4
84.0
84.5
83.1
82.5
81.8
80.2
75.9
74.9
79.4
79.5
77.5
TIC
EP
HD
Tim
e In
CE
-Ph.
D.
76.7
83.4
84.3
83.0
82.9
82.4
80.9
75.7
78.3
79.6
79.7
78.6
YE
AR
SF
TF
ull-t
ime
Enr
ollm
ent
83.1
73.9
75.7
75.7
75.2
74.5
77.1
82.6
89.7
90.2
90.3
90.4
YE
AR
SP
TP
art-
time
Enr
ollm
ent
NA
NA
NA
NA
NA
NA
NA
NA
NA
NA
NA
NA
YE
AR
SO
UT
Not
Enr
olle
dN
AN
AN
AN
AN
AN
AN
AN
AN
AN
AN
AN
A
PH
DD
ISS
'F
ield
of D
isse
rtat
ion
NA
NA
65.0
"92
.793
.392
.492
.189
.190
.190
.890
.991
.1
SR
CE
PR
IM '
Prim
ary
Sou
rce
of S
uppo
rt75
.877
.769
.766
.172
.474
.987
.9°
87.8
88.6
89.8
89.9
90.0
DE
BT
IND
Deb
t Ind
icat
or (
incl
. "N
o")
92.2
93.1
93.3
92.8
92.8
92.4
91.1
NA
NA
NA
NA
NA
PR
ES
TA
TP
redo
ctor
al S
tatu
s92
.493
.593
.593
.193
.092
.691
.888
.290
.090
.690
.891
.0
PD
OC
ST
AT
Pos
tdoc
tora
l Sta
tus
90.7
91.6
92.1
91.8
91.7
91.0
91.0
88.9
89.6
90.3
90.4
90.8
PD
OC
PLA
NP
ostd
octo
ral P
lans
91.3
92.1
92.5
92.4
92.4
91.9
91.2
87.0
87.9
89.1
89.3
90.3
NO
TE
: NA
= n
ot a
vaila
ble.
h B
ecau
se th
is fi
eld
is n
otap
plic
able
to a
ll do
ctor
ate
reci
pien
ts, t
he r
espo
nse
rate
will
alw
ays
be u
nder
100
%.
iThe
per
cent
age
was
low
in 1
992
beca
use
28%
of t
he d
octo
rate
rec
ipie
nts
com
plet
ed e
arlie
r su
rvey
form
s th
at d
id n
ot r
eque
st fi
eld
of d
isse
rtat
ion.
lAs
of F
Y 1
996,
the
perc
enta
ge in
clud
ed r
ecip
ient
s w
ho s
aid
they
had
no
prim
ary
sour
ce o
f sup
port
.
A. c
.:110
44
1 9
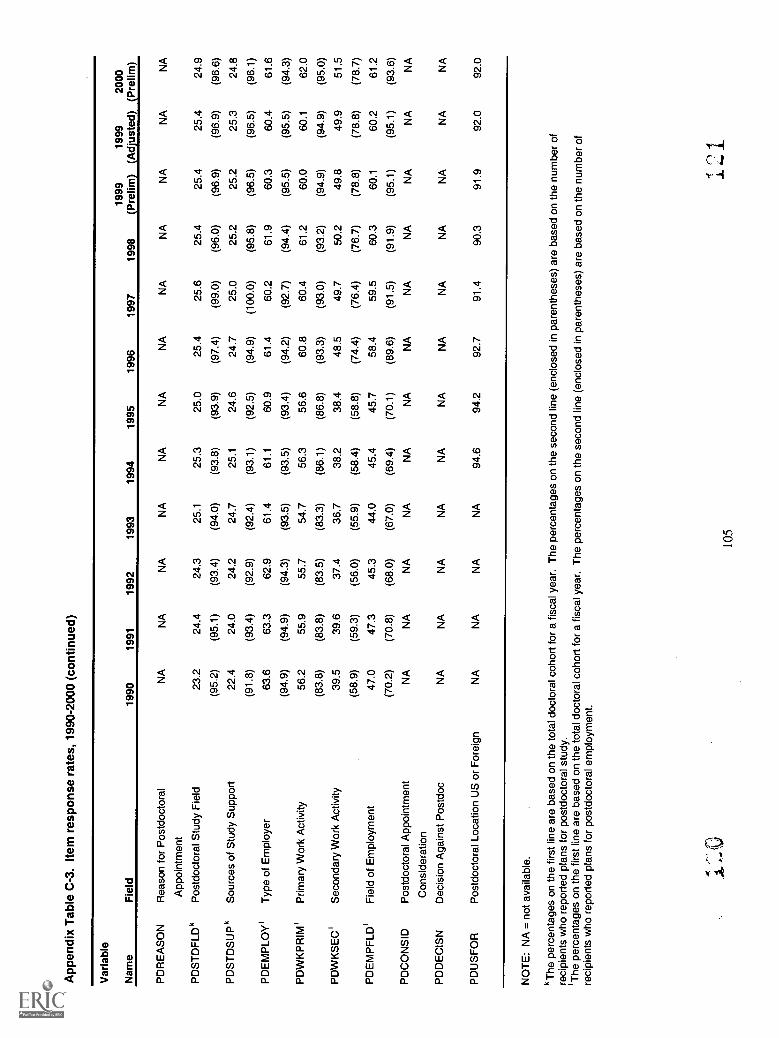
App
endi
x T
able
C-3
. Ite
m r
espo
nse
rate
s, 1
990-
2000
(co
ntin
ued)
Var
iabl
e
Nam
eF
ield
1990
1991
1992
1993
1994
1995
1996
1997
1998
1999
(Pre
lim)
1999
(Adj
uste
d)20
00(P
relim
)
PD
RE
AS
ON
Rea
son
for
Pos
tdoc
tora
lN
AN
AN
AN
AN
AN
AN
AN
AN
AN
AN
AN
A
App
oint
men
t
PD
ST
DF
LD k
Pos
tdoc
tora
l Stu
dy F
ield
23.2
24.4
24.3
25.1
25.3
25.0
25.4
25.6
25.4
25.4
25.4
24.9
(95.
2)(9
5.1)
(93.
4)(9
4.0)
(93.
8)(9
3.9)
(97.
4)(9
9.0)
(96.
0)(9
6.9)
(96.
9)(9
6.6)
PD
ST
DS
UP
kS
ourc
es o
f Stu
dy S
uppo
rt22
.424
.024
.224
.725
.124
.624
.725
.025
.225
.225
.324
.8
(91.
8)(9
3.4)
(92.
9)(9
2.4)
(93.
1)(9
2.5)
(94.
9)(1
00.0
)(9
5.8)
(96.
5)(9
6.5)
(96.
1)
PD
EM
PLO
Y 1
Typ
e of
Em
ploy
er63
.663
.362
.961
.461
.160
.961
.460
.261
.960
.360
.461
.6
(94.
9)(9
4.9)
(94.
3)(9
3.5)
(93.
5)(9
3.4)
(94.
2)(9
2.7)
(94.
4)(9
5.5)
(95.
5)(9
4.3)
PD
WK
PR
IM 1
Prim
ary
Wor
k A
ctiv
ity56
.255
.955
.754
.756
.356
.660
.860
.461
.260
.060
.162
.0
(83.
8)(8
3.8)
(83.
5)(8
3.3)
(86.
1)(8
6.8)
(93.
3)(9
3.0)
(93.
2)(9
4.9)
(94.
9)(9
5.0)
PD
WK
SE
C 1
Sec
onda
ry W
ork
Act
ivity
39.5
39.6
37.4
36.7
38.2
38.4
48.5
49.7
50.2
49.8
49.9
51.5
(58.
9)(5
9.3)
(56.
0)(5
5.9)
(58.
4)(5
8.8)
(74.
4)(7
6.4)
(76.
7)(7
8.8)
(78.
8)(7
8.7)
PD
EM
PF
LD1
Fie
ld o
f Em
ploy
men
t47
.047
.345
.344
.045
.445
.758
.459
.560
.360
.160
.261
.2
(70.
2)(7
0.8)
(68.
0)(6
7.0)
(69.
4)(7
0.1)
(89.
6)(9
1.5)
(91.
9)(9
5.1)
(95.
1)(9
3.6)
PD
CO
NS
IDP
ostd
octo
ral A
ppoi
ntm
ent
NA
NA
NA
NA
NA
NA
NA
NA
NA
NA
NA
NA
Con
side
ratio
n
PD
DE
CIS
ND
ecis
ion
Aga
inst
Pos
tdoc
NA
NA
NA
NA
NA
NA
NA
NA
NA
NA
NA
NA
PD
US
FO
RP
ostd
octo
ral L
ocat
ion
US
or
For
eign
NA
NA
NA
NA
94.6
94.2
92.7
91.4
90.3
91.9
92.0
92.0
NO
TE
: NA
= n
ot a
vaila
ble.
k T
he p
erce
ntag
es o
n th
e fir
st li
ne a
re b
ased
on
the
tota
l doc
tora
l coh
ort f
ora
fisca
l yea
r. T
he p
erce
ntag
es o
n th
e se
cond
line
(en
clos
ed in
par
enth
eses
) ar
e ba
sed
on th
e nu
mbe
r of
reci
pien
ts w
ho r
epor
ted
plan
s fo
r po
stdo
ctor
al s
tudy
.1T
he p
erce
ntag
es o
n th
e fir
st li
ne a
re b
ased
on
the
tota
l doc
tora
l coh
ort f
or a
fisc
al y
ear.
The
per
cent
ages
on th
e se
cond
line
(en
clos
ed in
par
enth
eses
) ar
e ba
sed
on th
e nu
mbe
r of
reci
pien
ts w
ho r
epor
ted
plan
s fo
r po
stdo
ctor
al e
mpl
oym
ent.
r) 1
105

Ill. Derived Variables
The following derived variables deserve further explanation.
Postdoctoral Plans to Stay in the United States
Starting in 1997, the planned postdoctoral location of doctorate recipients was coded in anew variable called PDLOC using FIPS codes for U.S. states and territories and countries.Values of PDLOC less than 100 indicate a postdoctoral location in the United States.
Also beginning in 1997, a dichotomous variable, PDUSFOR, was created to indexwhether the planned postdoctoral location reported by the respondent was in the United States orin a foreign location.
For years prior to 1997, this variable is based on PDAFFIL. The first character ofPDAFFIL flags whether the respondent's planned postdoctoral location is in the United States; anumeric character in this position indicates a United States location. Non-numeric values in thefirst position of PDAFFIL (except "R") indicate non-U.S. locations. A value of "R" forPDAFFIL signifies the respondent's refusal to provide information.
For the interested user, the following SAS code produces "USPLAN" as an index ofplans to stay in the United States following the doctorate using PDAFFIL1 (a variable createdusing the first character of PDAFFIL).
USPLAN=2; /* Outside the U.S. */
ifP1A11FIL1 in ("0","1","2","3","4","5","6","7","8","9")then USPLAN=1; /* U.S. */
if PDAFFIL1 eq "R" then USPLAN=.;
if PDAFFIL1 eq " " then USPLAN=.;
Firm Postdoctoral Plans
Postdoctoral plans are coded using the values of PDOCSTAT, which indicate that thedoctorate recipient's postdoctoral plans were definite at the time the survey was completed. Thatis, codes 0, 1, or A on PDOCSTAT indicate that the respondent had definite postdoctoral plans,whereas codes 2, 3, and 4 indicate that the respondent was still seeking to determine postdoctoralplacement.
The following is the SAS code used to derive FIRMPLAN from PDOCSTAT :
if PDOCSTAT in ("0","1","A") then FIRMPLAN=1; /* Definite */
if PDOCSTAT in ("27374") FIRMPLAN=2; /* Seeking */
if PDOCSTAT eq " " then FIRMPLAN=.;
0
106

Firm Plans to Stay in the United States
This variable is derived from USPLAN and FIRMPLAN. A respondent is coded ashaving firm plans to stay in the United States if the reported postdoctoral location was in theUnited States and the reported postdoctoral plans were coded "definite."
The following is the SAS code that creates the variable FIRIVIUS from USPLAN andFIRMPLAN as described above.
FIRMUS =2;
if (USPLAN eq 1 and FIRMPLAN eq 1) then FIRMUS=1;
if USPLAN eq . or FIRMPLAN eq . then FIRMUS=.;
Time to Doctorate
Total time to degree (TTD): TTD measures the total elapsed time between thebaccalaureate and the doctorate (including time not enrolled in school). TTD can be computedonly for individuals whose baccalaureate year is known. Baccalaureate year is often obtainedfrom commencement programs or doctorate institutions when not reported by the recipient.Months are now included in the computation (see note below).
Registered time to degree (RTD): RTD gauges the time in attendance at colleges anduniversities between receipt of the baccalaureate and the doctorate. Enrollment may includeyears of attendance not related to a recipient's doctoral program. RTD can only be computed forindividuals who provided all years of college attendance after the baccalaureate. Months are nowincluded in the computation (see note below).
Note about medians: The method of computing medians, beginning with SummaryReport 1994, is as follows. Months (of birth, baccalaureate, and doctorate) are included in thecalculations whenever available; if months are missing, only years are used in the calculations.(However, medians are not computed for years prior to 1969 because doctorate month isunavailable for all doctorate recipients.) Medians presented in previous summary reports werebased only on years. Some medians would be the same regardless of the method of computation,but the new method generally computes slightly different results. While differences are small(usually one- or two-tenths of a year), readers should consider these differences when comparingmedians presented in the report with those in earlier reports.
107

IV. Changes to the 2000 SED
Citizenship
In 2000, a new category was again used for the variable CITIZ to identify non-U.S.citizens for whom visa status was unknown. The new code frame for the data is as follows:
Code Citizenship Category
0 U.S. Native
1 U.S. Naturalized Citizen
2 Non-U.S. Immigrant (Permanent Resident)
3 Non-U.S. Non-immigrant (Temporary Resident)
4 Non-U.S., Visa Status Unknown
Blank Missing/Citizenship Unknown
In 2000, a logical assignment to code 4 was made if all follow-up attempts for missingcitizenship were unsuccessful. The assignment was made for 1997, 1998, 1999, and 2000records if three out of four variables BIRTHPL, HSPLACE, EDPLACE, PDUSFOR werenon-U.S. locations. For the purposes of the tabulations in this report, code 4 was combined withcode 3. This is consistent with what was done in previous rounds and seems well justified by anexamination of the data. However, the existence of this new code will allow the data user toexclude the cases for which visa status is unknown if desired. One should keep in mind that thenumber of cases in this group (code 4) is not sufficient to warrant analysis as a separate group(n=342).
To match the numbers in this report, use the following code before analyzing citizenship:
/*RECODE CITIZ 4 */IF (CITIZ eq '4') THEN CITIZ='3';
Birthplace, Country of Citizenship, and Postdoctoral Location
This year, recognizing the unification of Hong Kong and the People's Republic of China,data for respondents reporting values for Birthplace, Country of Citizenship, and PostdoctoralLocation separately for these two locations are combined and tabulated as the People's Republicof China.
.71
108

APPENDIX D
Survey of Earned Doctorates QuestionnaireAcademic Year 2000
qr *4
4,:,)
109

Please print your name
First Name Middle Name Last Name Suffix (e.g., Jr.)
Cross reference: Birth name or former name legally changed
Survey of Earned Doctorates
July 1, 1999 to June 30, 2000
Conducted byThe National Opinion Research Center at the University of ChicagoforThe National Science FoundationThe Nation'al Institutes of HealthThe National Endowment for the HumanitiesThe U.S. Department of EducationThe U.S. Department of Agriculture
infer ation aD solid ed of07010INFORMATION Z°Ge.0
WVoluciJ
purposes
purpose
cioDDER7
PROVIDE
doctoralanlayzing
definedamended.
Etia237
a horityg01
MEMfaaaM Effg EGZ039 Eag
Cgij eGGilatt kM Eel tg alizz wit
institution,
cln6 preparingfollow-up
Providing
studies.
albEkodatabases.
personallyinformation will
Viip (Oa)
Identthi9fy
IlEltaD
needed
estimated
Ma?
OD
caOloREATH)
ational MiaDBO PMENTIAL
sponsors GAF
Foundation 0(4101M a3EGLI cgs9 OT Clco:'4,a(i0) a? 4,11.01i>,-f!
Pap
NOT th)? &\g}
contractors,
voluntary.
information
any way
complete
number
publiclyresponse
adversely
released
aD
collaborselecti g
solicitedcontrol. p ogra
ea o
p es
ev thribiadiozecomamoJemmatoultitctiiito-Vaitr:ql;,:
EM OAIEG CO p ovide 9:1:E@ Cif? OC (03 TaD W4.1'voluntaryatfec you.
tffi3Zou wada3OD CD MELIIIIira OPp3OfF,92
/ENFoundation, WilsonBlvd.,
according
commentsArlington,
Individualregarding22230
ercaoRa1IIl o3, lk-,) mem 4(4'4 cif.EMMA? estimate oldD tGs_G
GINAttention: Reports Blear. ce Off ce .
111

NATIONAL SCIENCE FOUNDATION4201 WILSON BOULEVARD
ARLINGTON, VIRGINIA 22230
To the Doctorate Recipient:
Congratulations on earning a doctoral degree! This is an important accomplishment for you. Youraccomplishment is also significant for both this nation and others, as the new knowledge generated by researchdoctorates enhances the quality of life in this country and throughout the world. Because of the importance ofpersons earning research doctorates, several Federal agencieslisted on the coversponsor this Survey of EarnedDoctorates.
The basic purpose of this survey is to gather objective data about doctoral graduates. These data areimportant in improving graduate education both at your home institution and beyond. Often, decisions made bygovernmental and private agencies to develop new programs, or to support present ones, are based in part on the datadeveloped from this survey.
This form is distributed by the Graduate Deans and is filled out by all persons who have completed therequirements for a research doctoral degree. Please print your name on the cover if you have not already done so, andthen complete this questionnaire and return it to the Graduate Dean. The confidentiality of the information youprovide is carefully protected.
On behalf of the sponsoring Federal agencies, I thank you for your participation in this survey.
Best wishes,
Jeanne E. GriffithDirector, Division of Science Resources Studies
112

INSTRUCTIONS
Thank you for taking the time to complete this importantquestionnaire. Directions are provided for each question. Becausenot all questions will apply to everyone, you may be asked to skipcertain questions.
If you have not already done so, please print your name on thefront cover.
You may use either a pen or pencil.
When answering questions that require marking a box, please usean
If you need to change an answer, please make sure that your oldanswer is either completely erased or clearly crossed out.
On pages 8 and 9 (inside the back cover) is a Specialties List forclassifying your field(s) of specialization in Questions A2, A10,B5, and B9.
Thanks again for your help; we really appreciate it.
113

'FART' A - lEduncolficira
AL What as the title off your dissertation?
El Please mark PO this box if the title below refers to aperformance, project report or a musical or literarycomposition required instead of a dissertation
Title
A2. Using the Specialties List (pages 6-9), please write thename sand number of the ffielld off your dissertationresearch.
Name of field
Number of field
A3. After receiving your ifirst bachelor's degree (orequivalent), and including the period spent on yourdissertation, how many years were you a Tull-timestandent?
Years (whole numbers)
A41. ?lease check the category that most fully describesyour employment or study status during the yearimmediately before the award off the doctorate.
Mark (X) one
o 0 Full-time employed GO to AS0 Held fellowship
2 0 Held assistantship3 Li Part-time employed4 0 Not employed5 El Other - Specifr
R7
SKIPtoA6
AS. (IF FULL-TIME EMPLOYED) What type off positiondid you holld?
Mark PO one
0 0 College or university, faculty7 0 College or university, non-faculty8 0 Elementary or secondary school, teaching0 0 Elementary or secondary school, non-teaching
CD Industry or business12 0 Other - Specifr
M. Itn what state or country was the highschool/secondary school that you last attended?
State (if U.S.)
Country (if not U.S.)
A7. When did you graduate ffrom high school/secondary school?
Month Year
119
A. Please name the department (or interdisciplinarycommittee, center, institute, etc.) off the universitythat supervised your doctoral program.
0 Mark PO box if none
Department/Committee/Center/Institute/Program
A9. ?lease name the school or college within the universitythat supervised your doctoral [program.
ri Mark (X) box if not applicable
School or College within University
114

' t51111LY. 1r IlfalMe IIISM USVICLIMY, vourasumniugucamly, XIII VIDaturgirs, vamanuitinig
and each degree earned (fl any). 1E3e sure to give the yearsyour doctord institution(s) and degree at the end.
0 Mark (X) box if bachelor's degree (or equivalent) was never
0 Mark (X) box if master's degree (or equivalent) was never
A-ycitiry 521111t11 giralUttlIkallC IMILIILLIWILHPlill5
attended for ALL institutionsyam IIIIIDYCC ailllll.CMICUI
attended. ffncilude
received.
received.
EXAMPLEInstitution and Location
YearsAttended
Field of Study Degree (if any)
Use Specialties List, pages 8-9 GrantedInstitution
9w:tan. .9r.viiiiaie 4 7ecluieleftFrom
88
To
90
Field Name
Mechanical
Number
34,5
Title Mo. Yr.
Branch or City State or Province Country (if not U.S.)
Mauls 90xlict
Institution
voiiifeilakfr 4 ea/404pdaFrom
90
To
92
Field Name
Mechanicalenetigeming
Number
345
Title
B.S.
Mo.
6
Yr.
9.2Branch or City State or Province Country (if not U.S.)
Beiaziey. e4
Institution and LocationYears
Attended
Field of Study Degree (if any)
Use Specialties List, pages 8-9 GrantedInstitution From To Field Name Number Title Mo. Yr.
Branch or City State or Province Country (if not U.S.)
Institution From To Field Name Number Title Mo. Yr.
Branch or City State or Piovince Country (if not U.S.)
Institution From To Field Name Number Title Mo. Yr.
Branch or City State or Province Country (if not U.S.)
Institution From To Field Name Number Title Mo. Yr.
Branch or City State or Province Country (if not U.S.)
Institution From To Field Name Number Title Mo. Yr.
Branch or City State or Province Country (if not U.S.)
Institution From To Field Name Number Title Mo. Yr.
Branch or City State or Province Country (if not U.S.)
If you have attended more than vir inctitutinnc of Mahar pdurntinn nlancp anntinup thic lict nn tha hawk pnyare sure to include your doctoral institution.
115
130

All. Which of the following were sources of money tocover living and/or educational expenses during yourdoctoral programs?
Mark (X) Yes or No for each Yes No
a. Loans (from any source) 0 2 0b. Foreign (non-U.S.) support i 0 2 0c. Fellowship, scholarship I U 2 LJ
d. Dissertation grant I 0 2 0e. Teaching assistantship i 0 2 0f. Research assistantship i 0 2 Li
g. Traineeship 1 0 2 0h. Internship or residency Ll 2 0i. Personal savings i 0 2 0j. Other personal earnings during i 0 2 El
graduate school
k. Spouse's, significant other's, or 0 2 0 CI
family earnings or savings
EmploYer reimbursement/assistance 0 2 0 0m. Other - Specifr in 2o o
Don'tKnow
Li
0LI
0Li
0Li
11
Li
0
Al2. Which TWO sources listed in All gave you the mostsupport?
Enter letters of primary and secondary sources
1. Primary source of support
0 Mark a9 if no primary source
2. Secondary source of support
0 Mark () if no secondary source
A13. When you receive your doctoral degree, how muchmoney will you owe that is s 'redly related to yourundergraduate and/or graduate education (tuitionand fees, living expenses and supplies, transportationto and from school)?
0 0 None
I 0 $5,000 or less
2 0 $5,001 - $10,000
3 0 $10,001 - $15,000
4 Li $15,001 - $20,000
5 0 $20,001 - $25,000
60 $25,001 - $30,000
7 0 $30,001 or more
PART B - Postgraduation Plans
Bl. How definite are your immediate postgraduate plans?
Mark a9 one
OLi Am returning to, or continuing in,predoctoral employment
0 Have signed contract or made definitecommitment for other work or study
2 0 Am negotiating with one or morespecific organizations
0 Am seeking position but have no specificprospects
4 Li Other - Specifr
GO toB2,
page 5
SKIPto
B3,page 5
116
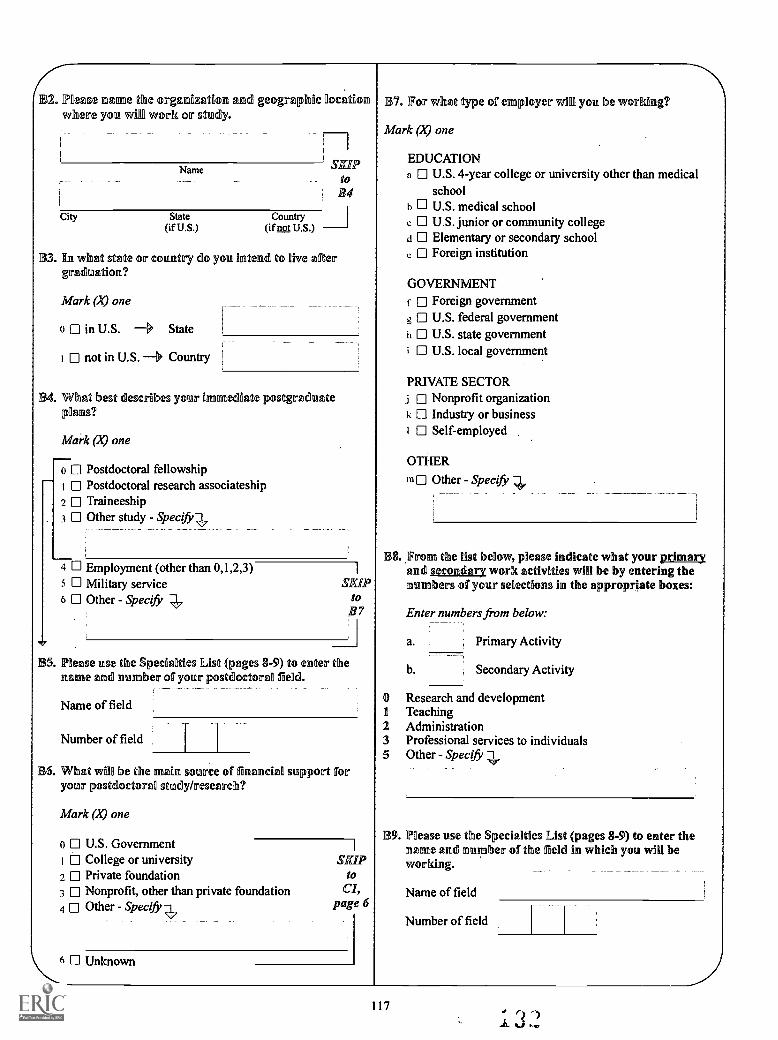
132. Please mune the organization and geographic locationwhere you will work Orr study.
City
Name SKIPto
4
State Country I
(if U.S.) (if nat U.S.)
3. In what state or country do you intend to live aftergraaluation?
Mark (X) one
a El in U.S. -4 State
El not in U.S. 4 Country
What best describes your imme ate postgraduatep1lans?
Mark po one
o El Postdoctoral fellowship0 Postdoctoral research associateship
2 0 Traineeship3 0 Other study - Specifr,
4 0 Employment (other than 0,1,2,3)5 0 Military service6 CI Other - Specifr
SKIPto
7
5. Please use tine Specialties List (pages 8-9) to enter themune and number off your postdoctoral
Name of field
Number of field
6. What will be the main source off flinancial support foryour p stdoctorall study/research?
Mark (X) one
o El U.S. Government0 College or universityEl Private foundation
; 0 Nonprofit, other than private foundation4 0 Other - Specifi,R7
SKIPto
Cl,page 6
Unknown
in7. For what type off employer will you be working?
Mark Pt9 one
EDUCATIONa CI U.S. 4-year college or university other than medical
schoolb 0 U.S. medical schoolc 0 U.S. junior or community colleged El Elementary or secondary schoole CI Foreign institution
GOVERNMENTf 0 Foreign governmentg 0 U.S. federal governmenth 0 U.S. state governmenti El U.S. local government
PRIVATE SECTORj 0 Nonprofit organizationk 0 Industry or businessI 0 Self-employed
OTHERm El Other - Speci&
8. From the list bellow, please indicate what your primaryand secondary work activities will be by entering thenumbers of your selections in the appropriate boxes:
Enter numbers from below:
a.
b.
Primary Activity
Secondary Activity
0 Research and development1 Teaching2 Administration3 Professional services to individuals5 Other - Speeifr
9. Please use the Specialties List (pages 8-9) to enter thename and number of the field in which you will beworking.
Name of field
Number of field
117
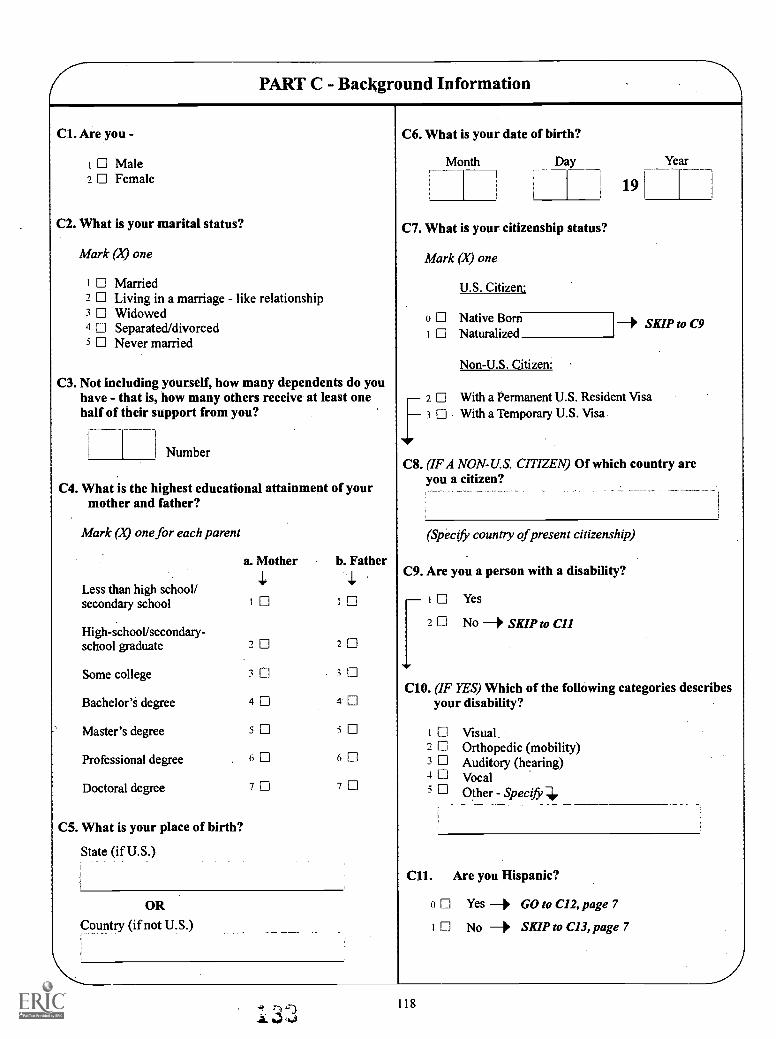
PART C - Background Information
Cl. Are you -
0 Male2 0 Female
C2. What is your marital status?
Mark (A9 one
I 0 Married2 0 Living in a marriage - like relationship3 CI Widowed4 El Separated/divorced5 0 Never married
C3. Not including yourself, how many dependents do youhave - that is, how many others receive at least onehalf of their support from you?
I Number
C4. What is the highest educational attainment of yourmother and father?
Mark (A9 one for each parent
a. Mother b. Father
Less than high school/secondary school t Ci 1 0
High-school/secondary-school graduate 2 0 2 0
Some college 1 0 3 0
Bachelor's degree 4 0 4 0
Master's degree s 0 5 El
Professional degree 6 n 6 Fl
Doctoral degree 7 0 7 0
C5. What is your place of birth?
State (if U.S.)
OR
Country (if not U.S.)
C6. What is your date of birth?
Month Day
1
C7. What is your citizenship status?
Mark (X) one
U.S. Citizen:
o 0 Native Bornt 0 Naturalized
Non-U.S, Citizen:
2 0 With a Permanent U.S. Resident Visaf3 0 With a Temporary U.S. Visa
19
Year
-4 SKIP to C9
C8. (IF A NON-U.S. CITIZEN) Of which country areyou a citizen?
(Specib, country of present citizenship)
C9. Are you a person with a disability?
0 Yes2 El No 1 SKIP to CI1
C10. (IF YES) Which of the following categories describesyour disability?
1 0 Visual2 El Orthopedic (mobility)3 El Auditory (hearing)4 0 Vocal5 0 Other - Specifr
Cll. Are you Hispanic?
0 Li Yes -3 GO to C12, page 7
I 0 No -4 SKIP to C13, page 7
118

C11
Cl
C11
Co
Cl
0
Pie
ThEn
,. (IF YES TO CM) Which of the following describesyour Hispanic origin or descent?
0 LI Mexican AmericanI E Puerto Rican2 0 Other Hispanic - Specifr R7
C114. Please
1
fill in your U.S. Social Security
1
i
I
_
Number.
1
C115. In caseyou haveand e-mailreached.
Daytime
Evening
E-maill
we needprovided,
address
telephone
telephone
addresq
to clarify some of the informationplease list a telephone number(if available) where you can be
1. What is your racial background?
Mark a9 one
o 0 American Indian or Alaskan Native) 0 Asian or Pacific Islander2 0 Black3 Li White
5. 1:Because we are interested in how education relates to employment and career development over time, wemay recontact you in the future. To assist us, please provide your current address below as well as the name,address, and telephone number off one person who is likely to know where you can always be reached. (Do notinclude someone who lives in your immediate household.) As with aRR other information in this questionnaire,complete confidentiality wall be provided. ,
rrent Address:_
Number Street
City State Country Ztpcode or Postal Code
intact Person:
Name
Number Street
City State Country Zipcode or Postal Code
Phone Number (including area or country code) E-mail Address
F. Please sign and date.
Signature Date
Mark (X) box if you would like a summary of the results off this survey (available as funding permits).
Results of the Survey of Earned Doctorates can be found on the National Science Foundation's World Wide Webpage at http://www.nsff.gov/sbe/srs/stats.hton
use use the back cover to make any additional comments you may have about this survey.
ink you for completing the questionnaire. Please return it to the GRADUATE DEAN Tor forwarding to Survey ofned Doctorates, National Opinion Research Center at the University of Chicano. 11525 East 55th Street. Chicano.
11E, 6060. Should you need to call us, our toll free number is 1-000-248-8649.
119
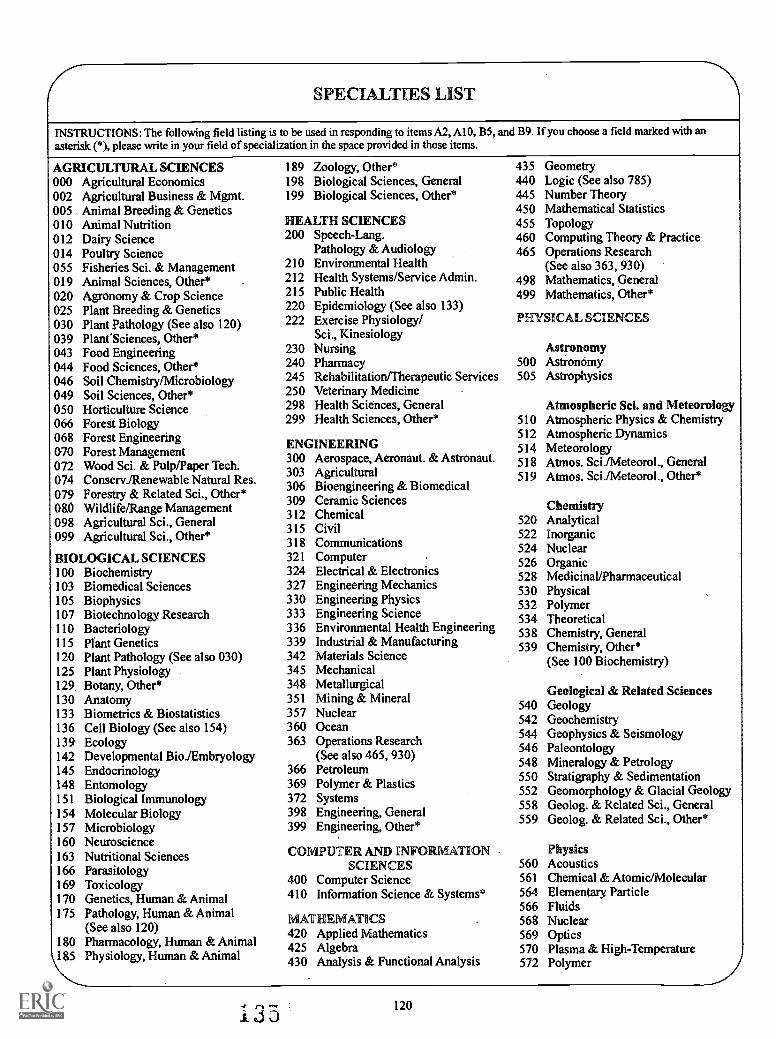
SPECIALTIES LIST
INSTRUCTIONS: The following field listing is to be used in responding to items A2, Al 0, BS, and B9. If you choose a field marked with anasterisk (5), please write in your field of specialization in the space provided in those items.
AGRICULTURAL SCIENCES000 Agricultural Economics002 Agricultural Business & Mgmt.005 Animal Breeding & Genetics010 Animal Nutrition012 Dairy Science014 Poultry Science055 Fisheries Sci. & Management019 Animal Sciences, Other*020 Agronomy & Crop Science025 Plant Breeding & Genetics030 Plant Pathology (See also 120)039 PlanfSciences, Other*043 Food Engineering044 Food Sciences, Other*046 Soil Chemistry/Microbiology049 Soil Sciences, Other*050 Horticulture Science066 Forest Biology068 Forest Engineering070 Forest Management072 Wood Sci. & Pulp/Paper Tech.074 Conserv./Renewable Natural Res.079 Forestly & Related Sci., Other*080 Wildlife/Range Management098 Agricultural Sci., General099 Agricultural Sci., Other*
BIOLOGICAL SCIENCES100103105107110115120125129130133136139142145148151154157160163166169170175
180
BiochemistryBiomedical SciencesBiophysicsBiotechnology ResearchBacteriologyPlant GeneticsPlant Pathology (See also 030)Plant PhysiologyBotany, Other*AnatomyBiometrics & BiostatisticsCell Biology (See also 154)EcologyDevelopmental Bio./EmbryologyEndocrinologyEntomologyBiological ImmunologyMolecular BiologyMicrobiologyNeuroscienceNutritional SciencesParasitologyToxicologyGenetics, Human & AnimalPathology, Human & Animal(See also 120)Pharmacology, Human & AnimalPhysiology, Human & Animal
189 Zoology, Other*198 Biological Sciences, General199 Biological Sciences, Other*
HEALTH SCIENCES200 Speech-Lang.
Pathology & Audiology210 Environmental Health212 Health Systems/Service Admin.215 Public Health220 Epidemiology (See also 133)222 Exercise Physiology/
Sci., Kinesiology230 Nursing240 Pharmacy245 Rehabilitation/Therapeutic Services250 Veterinary Medicine298 Health Sciences, General299 Health Sciences, Other*
ENGINEERING300 Aerospace, Aeronaut. & Astronaut.303 Agricultural306 Bioengineering & Biomedical309 Ceramic Sciences312 Chemical315 Civil318 Communications321 Computer324 Electrical & Electronics327 Engineering Mechanics330 Engineering Physics333 Engineering Science336 Environmental Health Engineering339 Industrial & Manufacturing342 Materials Science345 Mechanical348 Metallurgical351 Mining & Mineral357 Nuclear360 Ocean363 Operations Research
(See also 465, 930)366 Petroleum369 Polymer & Plastics372 Systems398 Engineering, General399 Engineering, Other*
CO UTER AND INFO TIONSCIENCES
400 Computer Science410 Information Science & Systems*
MATHEMATICS420 Applied Mathematics425 Algebra430 Analysis & Functional Analysis
435 Geometry440 Logic (See also 785)445 Number Theory450 Mathematical Statistics455 Topology460 Computing Theory & Practice465 Operations Research
(See also 363, 930)498 Mathematics, General499 Mathematics, Other*
PHYSICAL SCIENCES
Astronomy500 Astronomy505 Astrophysics
Atmospheric Sd. and Meteorology510 Atmospheric Physics & Chemistry512 Atmospheric Dynamics514 Meteorology518 Atmos. Sci./Meteorol., General519 Atmos. Sci./Meteorol., Other*
Chemistry520 Analytical522 Inorganic524 Nuclear526 Organic528 Medicinal/Pharmaceutical530 Physical532 Polymer.534 Theoretical538 Chemistry, General539 Chemistry, Others
(See 100 Biochemistry)
Geological & Related Sciences540 Geology542 Geochemistry544 Geophysics & Seismology546 Paleontology548 Mineralogy & Petrology550 Stratigraphy & Sedimentation552 Geomorphology & Glacial Geology558 Geolog. & Related Sci., General559 Geolog. & Related Sci., Other*
Physics560 Acoustics561 Chemical & Atomic/Molecular564 Elementary Particle566 Fluids568 Nuclear569 Optics570 Plasma & High-Temperature572 Polymer
120

SINECRALICIES LEST' (condlinued)
574 Solid State & Low-Temperature578 Physics, General579 Physics, Other*
Miscellaneous Physical Sciences580 Environmental Science585 Hydrology & Water Resources590 Oceanography595 Marine Sciences599 Misc. Physical Sciences, Other*
PSYCHOLOGY600 Clinical603 Cognitive & Psycho linguistics606 Comparative609 Counseling612 Developmental & Child613 Human/Indiv. & Family Devlpmt.615 Experimental618 Educational (See also 822)620 Family & Marriage Counseling621 Indust. Organiz. (See also 935)624 Personality627 Physiological/Psychobiology630 Psychometrics633 Quantitative636 School (See also 825)639 Social648 Psychology, General649 Psychology, Other*
SOCIAL SCIENCES650 Anthropology652 Area Studies658 Criminology662 Demography/Population Studies666 Economics668 Econometrics670 Geography674 International Relations/Affairs678 Political Sci. & Government682 Public Policy Analysis686 Sociology690 Statistics (See also 450)694 Urban Affairs/Studies698 Social Sciences, General699 Social Sciences, Other*
HUMANITIES
700703705710718719
HistoryHistory, AmericanHistory, AsianHistory, EuropeanHistory/Philosophy of Sci. & Tech.History, GeneralHistory, Other*
Letters720 Classics723 Comparative Literature729 Linguistics732 Literature, American733 Literature, English734 English Language736 Speech & Rhetorical Studies738 Letters, General739 Letters, Other*
Foreign Languages and Literature740 French743 German746 Italian749 Spanish752 Russian755 Slavic (other than Russian)758 Chinese762 Japanese765 Hebrew768 Arabic769 Other Languages & Literature*
Other Humanities770 American Studies773 Archeology776 Art History/Criticism/Conserv.780 Music785 Philosophy (See also 440)790 Religion (See also 984)795 Drama/Theater Arts798 Humanities, General799 Humanities, Other*
EDUCATION800 Curriculum & Instruction805 Educational Admin. & Supervision807 Educational Leadership810 Educ./Instruct. Media Design815 Educ. Stat./Research Methods820 Educ. Assessflest./Meas.822 Educ. Psychology (See also 618)825 School Psychology (See also 636)830 Social/Phil. Found. of Education835 Special Education840 Couns. Educ./Couns. & Guid. Serv.845 Higher Education/Eval. & Research
Teacher Education850 Pre-elementary/Early Childhood852 Elementary856 Secondary858 Adult & Continuing
Teaching Fields860 Agricultural Education861 Art Education862 Business Education
864 English Education866 Foreign Languages Education868 Health Education870 Home Economics Education872 Tech. & Indust. Arts Education874 Mathematics Education876 Music Education878 Nursing Education880 Physical Education & Coaching882 Reading Education884 Science Education885 Social Science Education887 Technical Education888 Trade & Industrial Education889 Teacher Educ., Specific Acad. &
Voc. Prog., Other*
Other Education898 Education, General899 Education, Other*
PROFESSIONAL FIELDS
usiness Management andAdmiunistrative Services
900 Accounting905 Banking/Financial Support Serv.910 Business Admin. & Management915 Business/Managerial Economics916 International Business917 Mgmt. Info. Sys./Bus. Data Proc.920 Marketing Management & Research930 Operations Research
(See also 363, 465)935 Organiz. Behavior (See also 621)938 Bus. Mgmt./Admin. Serv., Gen.939 Bus. Mgmt./Admin. Serv., Other*
Communications940 Communications Research947 Mass Communications957 Communication Theory958 Communications, General959 Communications, Other*
(See also 736)
Other Professional Fields960 Architec. Environ. Design964 Home Economics968 Law972 Library Science974 Parks/Rec./Leisure/Fitness976 Public Administration980 Social Work984 Theol./Religious Education
(See also 790)988 Professional Fields, General989 Professional Fields, Other*
OTHER FIELDS*999 Other
1214° IsJ

Commellato klimmt TiEs Surrve
Mean return ells questiormuaire to your GRADUATE DEAN for forwarding toSurvey of Earned Doctorates, Natione Opinion esearch Ce nter at the University of Chicago,2S25 1E11511 SSA St-eet, Chicago, EL 60615.Shoulld you need to call US, our toil free uaer is 11-806-248-8649.
OFFME USE ONLYCase ID: Instit. Code: Grad Date: Main Disp.:
Pilo EMSEiscorpt Eeiling CAGE
Initials Date Initials Date Initials Date
%N17. Miugt nafinIEVEP Upilstes
Iiilials Date Initials Date Initials Date
1224ij g
APPENDIX E
Field Classification and Research Degree Titles
-4 r",1
123
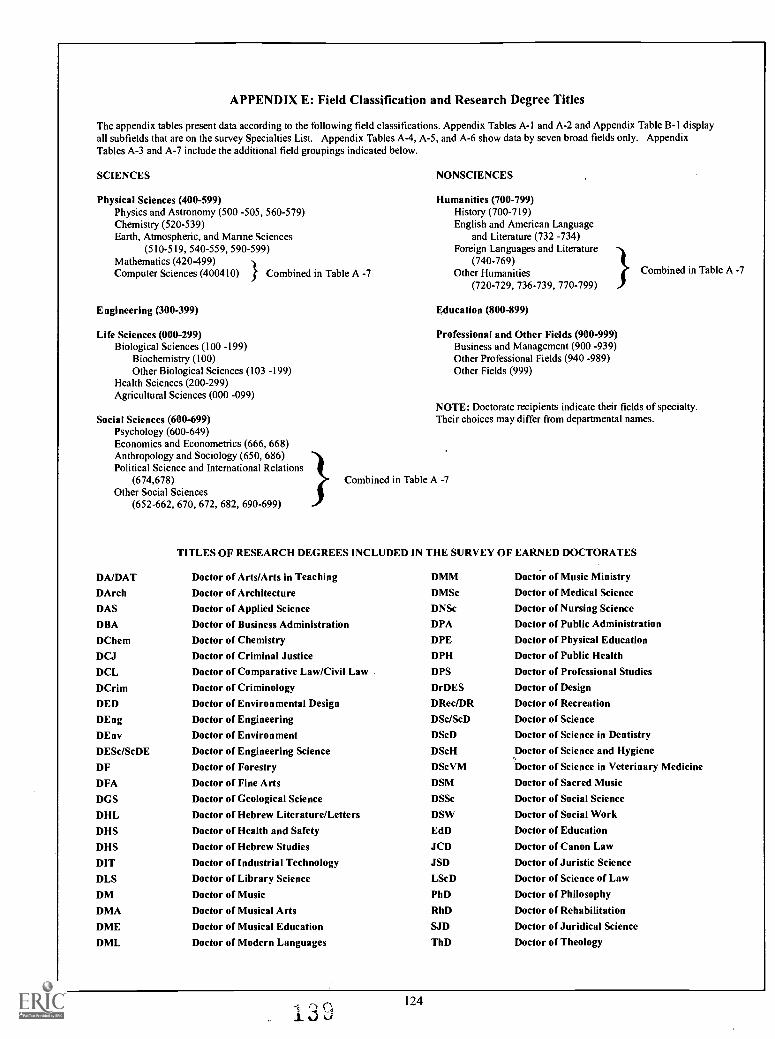
APPENDIX E: Field Classification and Research Degree Titles
The appendix tables present data according to the following field classifications. Appendix Tables A-I and A-2 and Appendix Table B-I displayall subfields that are on the survey Specialties List. Appendix Tables A-4, A-5, and A-6 show data by seven broad fields only. AppendixTables A-3 and A-7 include the additional field groupings indicated below.
SCIENCES
Physical Sciences (400-599)Physics and Astronomy (500 -505, 560-579)Chemistry (520-539)Earth, Atmospheric, and Marine Sciences
(510-519, 540-559, 590-599)Mathematics (420-499)Computer Sciences (400410) / Combined in Table A -7
Engineering (300-399)
Life Sciences (000-299)Biological Sciences (100 -199)
Biochemistry (100)Other Biological Sciences (103 -199)
Health Sciences (200-299)Agricultural Sciences (000 -099)
Social Sciences (600-699)Psychology (600-649)Economics and Econometrics (666, 668)Anthropology and Sociology (650, 686)Political Science and International Relations
(674,678)Other Social Sciences
NONSCIENCES
Humanities (700-799)History (700-719)English and American Language
and Literature (732 -734)Foreign Languages and Literature
(740-769)Other Humanities
(720-729, 736-739, 770-799)
Education (800-899)
Professional and Other Fields (900-999)Business and Management (900 -939)Other Professional Fields (940 -989)Other Fields (999)
Combined in Table A -7
NOTE: Doctorate recipients indicate their fields of specialty.Their choices may differ from departmental names.
Combined in Table A -7
(652-662, 670, 672, 682, 690-699)
TITLES OF RESEARCH DEGREES INCLUDED IN THE SURVEY OF EARNED DOCTORATES
DA/DAT Doctor of Arts/Arts in Teaching DMM DoctOr of Music Ministry
DArch Doctor of Architecture DMSc Doctor of Medical Science
DAS Doctor of Applied Science DNSc Doctor of Nursing Science
DBA Doctor of Business Administration DPA Doctor of Public Administration
DChem Doctor of Chemistry DPE Doctor of Physical Education
DCJ Doctor of Criminal Justice DPH Doctor of Public Health
DCL Doctor of Comparative Law/Civil Law DPS Doctor of Professional Studies
DCrim Doctor of Criminology DrDES Doctor of Design
DED Doctor of Environmental Design DRec/DR Doctor of Recreation
DEng Doctor of Engineering DSc/ScD Doctor of Science
DEnv Doctor of Environment DScD Doctor of Science in Dentistry
DESc/ScDE Doctor of Engineering Science DScH Doctor of Science and Hygiene
DF Doctor of Forestry DScVM Doctor of Science in Veterinary Medicine
DFA Doctor of Fine Arts DSM Doctor of Sacred Music
DGS Doctor of Geological Science DSSc Doctor of Social Science
DHL Doctor of Hebrew Literature/Letters DSW Doctor of Social Work
DHS Doctor of Health and Safety EdD Doctor of Education
DHS Doctor of Hebrew Studies JCD Doctor of Canon Law
DIT Doctor of Industrial Technology JSD Doctor of Juristic Science
DLS Doctor of Library Science LScD Doctor of Science of Law
DM Doctor of Music PhD Doctor of Philosophy
DMA Doctor of Musical Arts RhD Doctor of Rehabilitation
DME Doctor of Musical Education SJD Doctor of Juridical Science
DML Doctor of Modern Languages ThD Doctor of Theology
124

NSF Publications from the Doctorate Data Project
DATA BRIEFS ISSUE BRIEFS REPORTSHealthy Economy Yields EvenLower Unemployment Rate forDoctoral Scientists and Engineers
-
Academic Employment of RecentScience and Engineering DoctorateHolders
Science and Engineering DoctorateAwards: 2000
Doctorate Awards Declining inSome Science and EngineeringFields
What's Happening in the LaborMarket for Recent Science andEngineering Ph.D. Recipients?
Science and EngineeringDoctorates: 1960-91
Despite Increases, Women andMinorities Still Underrepresented inUndergraduate Science andEngineering Education
Is the Gender Gap in UnemploymentDisappearing?
Characteristics of DoctoralScientists and Engineers in theU.S.: 1997
Doctoral Awards Increase in S&EOverall, But Computer ScienceDeclines for First Time
Employment Preferences andOutcomes of Recent Science andEngineering Doctorate Holders in theLabor Market
Trend Tables on Doctoral Scientistsand Engineers in the U.S.: 1993-97(Web only)
Employment of Scientists andEngineers Reaches 3.2 Million in1995
International Mobility of Scientistsand Engineers to the United StatesBrain Drain or Brain Circulation
Who is Unemployed? FactorsAffecting Unemployment AmongIndividuals with Doctoral Degrees inScience and Engineering
Number of Doctoral Scientists andEngineers Grows by 6% Between1993 &1995
What is the Debt Burden of NewScience and Engineering Ph.D.'s?
Science and Engineering StateProfiles: 1999
Data sources andpublications sources:
These publications contain data from1) the annual Survey of EarnedDoctorates(a universe survey on theeducation of research doctorates) or
2) the biennial Survey of DoctorateRecipients (a longitudinal samplesurvey of workforce characteristics).
Complete electronic information onthese surveys and publications may beobtained on the web at:www.nsf.gov/sbe/stats.htm.
Written reports may be ordered online(www.nsf.gov/home/orderpub.htm)or by calling 301-947-2722.
For further information pleasecontact Susan T. Hill, Director,Doctorate Data Project,
Are Forms of Financial Support andEmployment Choices of RecentScience and Engineering Ph.D.'sRelated?
Doctoral Scientists and Engineers inthe U.S.: 1997 Profile Tables(on request)
Does the Educational Debt Burden ofScience and Engineering DoctoratesDiffer by Race/Ethnicity and Sex?
Modes of Financial Support in theGraduate Education of S&EDoctorate Recipients
Degrees and Occupations inEngineering: How Do They Diverge?
Statistical Profiles of ForeignDoctoral Recipients in Science andEngineering: Plans to Stay in theUnited States
Has the Use of Postdocs Changed? Women, Minorities, and Personswith Disabilities in Science andEngineering: 2000
How Much Does the U.S. Rely onImmigrant Engineers?
Science and Engineering Degrees:1966-98
What Follows PostdoctorateExperience? Employment Patterns of1993 Postdocs in 1995
Science and Engineering Degrees,by Race/Ethnicity of Recipients:1990-98
How Large is the Gap in Salaries ofMale and Female Engineers?
SESTAT: A Tool for StudyingScientists and Engineers in theUnited States
1 10

IA ,
NORC1=1111=11111UNIVERSITY OF CHICAGO

U.S. Department of EducationOffice of Educational Research and Improvement (OERI)
National Library of Education (NLE)
Educational Resources Information Center (ERIC)
NOTICE
Reproduction Basis
ERIC
This document is covered by a signed "Reproduction Release(Blanket)" form (on file within the ERIC system), encompassing allor classes of documents from its source organization and, therefore,does not require a "Specific Document" Release form.
This document is Federally-funded, or carries its own permission toreproduce, or is otherwise in the public domain and, therefore, maybe reproduced by ERIC without a signed Reproduction Release form(either "Specific Document" or "Blanket").
EFF-089 (3/2000)