Report on Post-Distribution Monitoring (PDM) of the Child ...
37
Report on Post-Distribution Monitoring (PDM) of the Child-focused Climate-Shock-Responsive Social Protection Pilot in Mongolia Prepared by UNICEF Mongolia for the Ministry of Labour and Social Protection (MLSP) July 2020
Transcript of Report on Post-Distribution Monitoring (PDM) of the Child ...

Report on Post-Distribution Monitoring (PDM) of the
Child-focused Climate-Shock-Responsive Social
Protection Pilot in Mongolia
Prepared by UNICEF Mongolia for the Ministry of Labour and Social Protection (MLSP)
July 2020

1 BACKGROUND & INTRODUCTION 1
1.1 CHILD-FOCUSED SHOCK-RESPONSIVE PILOT 2
1.2 2 YEAR PILOT AND MONITORING STRATEGY 3
1.3 PDM OBJECTIVES 4
1.4 PDM ACTIVITIES 4
1.5 METHODOLOGY 4
2 HOUSEHOLD PROFILES 6
2.1 GENDER, AGE AND RELATIONSHIP TO THE ELIGIBLE CHILD 6
2.2 ELIGIBLE CHILDREN IN THE HOUSEHOLD 7
2.3 HOUSEHOLD RESIDENCE AND MAIN INCOME SOURCE 7
3 FINDINGS & LESSONS LEARNED 9
3.1 PILOT-RELATED COMMUNICATIONS AND AWARENESS 10
3.2 BENEFICIARY UTILIZATION OF CASH 18
3.3 BENEFICIARY PREFERENCE: PAYMENT TIMING AND FREQUENCY 29
3.4 PILOT COVERAGE 31
3.5 EFFECTS OF COVID-19 PANDEMIC 32
4 CONCLUSIONS 33
TABLE OF FIGURES
FIGURE 1: AGE AND GENDER OF THE RESPONDENT, BY COMPONENT ............................................................................................ 6 FIGURE 2: RESPONDENT RELATIONSHIP TO ELIGIBLE CHILD ......................................................................................................... 7 FIGURE 3: NUMBER OF ELIGIBLE CHILDREN IN HOUSEHOLD ........................................................................................................ 7 FIGURE 4: HOUSEHOLD RESIDENCE: SOUM CENTER VS RURAL AREAS ........................................................................................... 8 FIGURE 5: HERDER VS NON-HERDER HOUSEHOLDS ................................................................................................................... 8 FIGURE 6: RESIDENCE VS. HERDER/NON-HERDER ..................................................................................................................... 9 FIGURE 7: SOURCES OF INFORMATION FOR EARLY ACTION COMPONENT ..................................................................................... 11 FIGURE 8: SOURCES OF INFORMATION FOR EARLY RESPONSE COMPONENT ................................................................................. 11 FIGURE 9: FIRST SOURCE OF INFORMATION FOR EARLY ACTION COMPONENT, BY SOUM ................................................................ 12 FIGURE 10: INFORMATION SOURCE EARLY ACTION COMPONENT, RURAL OR SOUM CENTER ........................................................... 12 FIGURE 11: INFORMATION SOURCE EARLY RESPONSE COMPONENT, RURAL OR SOUM CENTER ....................................................... 13 FIGURE 12: FIRST SOURCE OF INFORMATION ABOUT PILOT: HERDER VS NON-HERDER IN EARLY ACTION AND EARLY RESPONSE
COMPONENTS ......................................................................................................................................................... 14 FIGURE 13: TIMING OF PILOT-RELATED COMMUNICATIONS WITH BENEFICIARIES: EARLY ACTION COMPONENT .................................. 15 FIGURE 14: TIMING OF PILOT-RELATED COMMUNICATIONS WITH BENEFICIARIES: EARLY RESPONSE COMPONENT............................... 16 FIGURE 15: UNDERSTANDING OF INTENDED PURPOSE OF THE CASH TOP-UP, BY COMPONENT ........................................................ 16 FIGURE 16: UNDERSTANDING OF THE PURPOSE OF THE CASH: EARLY RESPONSE COMPONENT, BY SOUM .......................................... 17 FIGURE 17: BENEFIT DISTRIBUTION WITHIN HOUSEHOLD: EARLY ACTION COMPONENT ................................................................. 19

FIGURE 18: BENEFIT DISTRIBUTION WITHIN HOUSEHOLD: EARLY RESPONSE COMPONENT .............................................................. 19 FIGURE 19: CATEGORY OF LARGEST EXPENDITURE .................................................................................................................. 21 FIGURE 20: CATEGORY OF SECOND LARGEST EXPENDITURE ...................................................................................................... 21 FIGURE 21: HOUSEHOLDS MISSED BY COMMUNICATIONS: SPENDING BY MONTH ......................................................................... 23 FIGURE 22: SPENDING BY RURAL /SOUM CENTER ................................................................................................................... 25 FIGURE 23: SPENDING BY SOURCE OF PILOT-RELATED COMMUNICATIONS .................................................................................. 27 FIGURE 24: BENEFICIARY PAYMENT PREFERENCES .................................................................................................................. 29 FIGURE 25: RURAL VS SOUM CENTER COMPONENT PREFERENCE ............................................................................................... 30 FIGURE 26: RURAL VS SOUM CENTER PAYMENT PREFERENCE ................................................................................................... 30 FIGURE 27: COMPONENT PREFERENCE BY SOUM .................................................................................................................... 30 FIGURE 28: PAYMENT PREFERENCE BY SOUM ........................................................................................................................ 30

1
1 Background & Introduction
This report presents the findings of the Post-Distribution Monitoring (PDM) of the Child-focused Shock-
Responsive Social Protection (SRSP) Pilot implemented by the Ministry of Labor and Social Protection
(MSLP) and Zavkhan Provincial Government, with the support of UNICEF Mongolia during the winter of
2019/2020.
The Child-focused SRSP Pilot was a vertical expansion (top-up) of the Child Money Program (CMP) for
children aged 5 years and under1 living in areas at high risk of climate change related shocks, particularly
dzud (severe winters).
Impact of the Covid-19 Crisis on the SRSP Pilot The main of objective of the pilot was to help MLSP to explore SRSP with the longer-term aim of mainstreaming shock responsiveness into existing welfare programs through the provision of technical and financial support. However, the rapid onset of the global Covid-19 pandemic in 2020 has required MLSP and its development partners, including UNICEF, to reorient their SRSP thinking from largely focused on climate-driven shocks which primarily affect those engaged in herding and agriculture, to include a new type of shock that affects larger and different segments of the population. The SRSP pilot was originally intended to last 3 years, with the first year focused on establishing administrative mechanisms for rapid horizontal expansion of the CMP, the second year focused on expanding the pilot to more beneficiaries and conducting a rigorous impact evaluation to measure the effects on child well-being attributable to the pilot, and the third year focused on scaling-up the pilot to national coverage and the mainstreaming of SRSP into the national social welfare system. However, in April 2020, in response to the global Covid-19 pandemic, the MLSP implemented an additional top-up of the CMP by redirecting funds allocated for the school lunch program (10 000 MNT/child) for all beneficiaries aged 0 to 18. Soon after, the Government made a decision to increase the benefit size of the CMP to 100 000 MNT/child between April and October, as well as to top-up additional programs including those serving persons with disabilities, single parent households and those on the food stamp program. This top-up has since been extended to December 2020. Given that the MLSP has already started implementing SRSP at a national and massive scale to respond to the Covid-19 crisis, the decision was made to stop the pilot after the Year 1 and reorient support towards documenting and assessing the new government-led SRSP top-ups and developing a comprehensive national SRSP policy.
In Mongolia, the increased frequency and severity of climate-driven shocks have been particularly
pronounced, with average temperatures rising 2.1 degrees Celsius since 19402, much higher than the
global average, a marked decrease in precipitation and increasing desertification, and increasing scale and
1 The CMP covers children aged 0 to 18. 2 United Nations Environment Program (UNEP).

2
decreasing predictability of climate-driven shocks such as droughts, dzuds, floods, as well as wildfires and
dust storms.
Nomadic herder households, who account for approximately a third of the population, are particularly
vulnerable to these climate shocks, given their reliance on livestock for their livelihoods. Loss of livestock
due to climate shocks is an important driver of massive rural to urban migration which has resulted in high
urban unemployment and contributed significantly to dangerous levels of air pollution.
While the national system for disaster management, implemented through the National Emergency
Management Agency (NEMA), has a number of measures in place to reduce the risk of livestock death as
a result of droughts and dzuds, there are currently no explicit provisions within the social protection
system to reduce risks to the welfare of vulnerable households or children arising from the growing
problem of climate-driven shocks.
UNICEF Mongolia is supporting the MLSP to implement a 2-year pilot aimed at generating lessons and
establishing operational and coordination mechanisms to help the GoM to decide whether and how to
mainstream climate shock responsiveness within the social welfare system.
Research from the National Statistics Office of Mongolia (NSO) found lasting negative impacts of cyclical,
climate-driven shocks on children's education and health; preparedness and early action seek to buffer
children against such effects on children's welfare before they occur by scaling-up existing national social
protection programs before they take their toll.
For more information, please refer to the Feasibility Study Document, which is available from UNICEF
Mongolia.
1.1 Child-focused Shock-Responsive Pilot
The pilot consisted of two top-ups of the existing Child Money Program (CMP) for children aged 0 to 5:
▪ Early Action in Soums at high risk of dzud (1 payment in November/December);
▪ Early Response in Soums hardest hit by dzud (3 payments in February/March/April).
All children aged 0 to 5 living in these Soums were eligible for the transfer, which was paid into their
existing CMP accounts.
The first payment was provided to 2730 children aged 0 to 5 on December 9th in 4 Soums:
▪ Tes
▪ Bayantes
▪ Tosontsengel
▪ Ikh-Uul
The second, third and fourth payments were provided to 6747, 6792, 6838 children in all 22 Soums of
Zhavkhan Aimag. These payments were carried out on February 17, March 30 and April 20.
1.1.1 Soum Selection
Soums were selected based on a combination of:
3
▪ Official dzud risk mapping regularly carried out by relevant government authorities;
▪ Consultations with a range of local officials knowledgeable of the situation on the ground.
Efforts were made to include ongoing work of partners in the area of shock-responsive targeting, however,
none of these work streams were ready in time for pilot Soum selection to be based on them.
In the Early Response component, the decision was made to cover all Soums in the Aimag, given that
sufficient funds were available to cover all eligible children.
1.1.2 Benefit Amount and Payment Frequency
Children in the Early Action component received one top-up of 40 000 MNT paid in December, while
children in the Early Response component received three payments of 20 000 MNT each paid in February,
March and April.
1.2 2 Year Pilot and Monitoring Strategy
The pilot was initially intended to run for two years. In Year 1, the focus on establishing, testing and
refining the administrative and operational processes to enable the rapid, temporary expansion of social
welfare programs in response to dzud, in order to optimize these for pilot expansion in Year 2. Due to the
onset of Covid-19 and the government’s decision to scale-up the CMP top-ups nationally and to all CMP
beneficiaries aged 0 to 17, Year 2 of the pilot was cancelled and the focus was shifted to supporting the
government top-up and wider SRSP efforts.
Monitoring in Year 1 focused on quantitative and qualitative Post-Distribution Monitoring (PDM) and
lessons learned workshops, and was intended to provide inputs to the design of the impact evaluation
that was planned for Year 2, as the evaluation of shock-responsive programs is relatively new territory in
social protection.
In Year 2 the focus was to be on evaluating both the program impact and the program delivery (i.e.
systems), as well as continued monitoring. Before Year 3, a review of the M&E System was to be carried
out as part of the activities to mainstream the program into the regular social protection system, if the
GoM decided to do so.
For more information, please refer to the M&E Strategy Document available from UNICEF Mongolia.
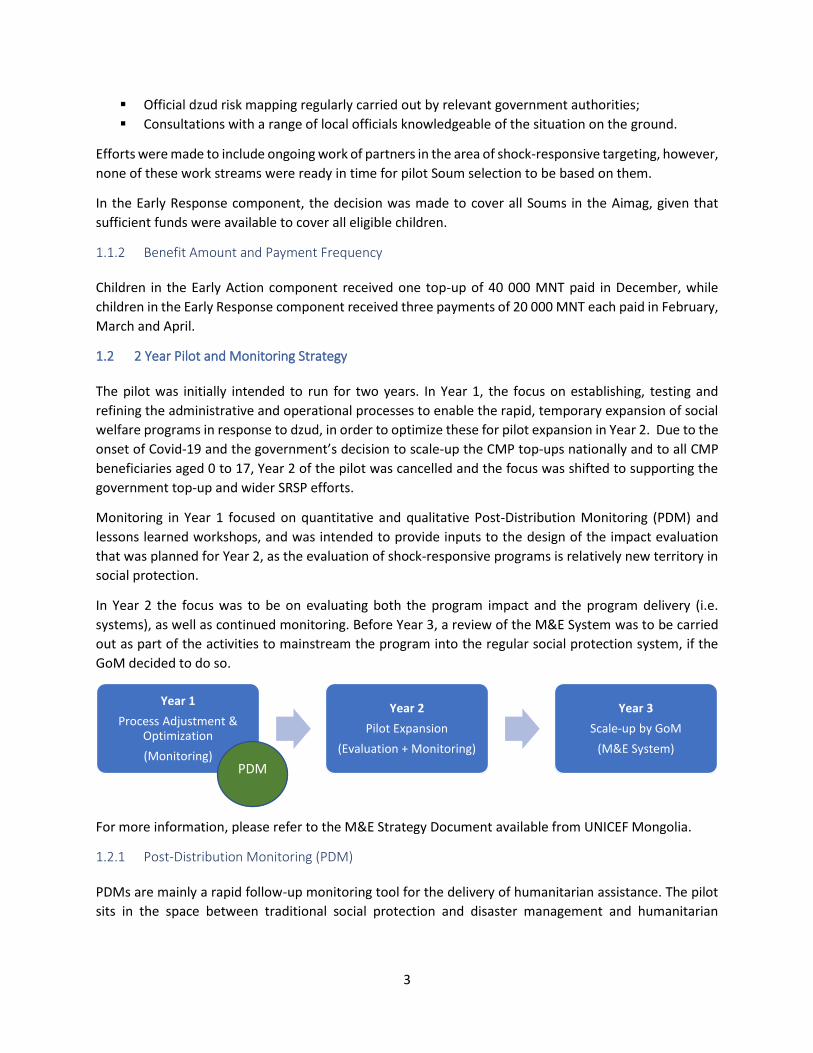
1.2.1 Post-Distribution Monitoring (PDM)
PDMs are mainly a rapid follow-up monitoring tool for the delivery of humanitarian assistance. The pilot
sits in the space between traditional social protection and disaster management and humanitarian
Year 1
Process Adjustment & Optimization
(Monitoring)
Year 2
Pilot Expansion
(Evaluation + Monitoring)
Year 3
Scale-up by GoM
(M&E System)
PDM
4
response; therefore, the 3-year M&E strategy included a mix of M&E tools found in both humanitarian
cash transfers and social protection, with a PDM in Year 1.
1.3 PDM Objectives
The PDM objectives are to:
▪ Monitor the effectiveness of the operational and administrative processes involved in planning
and implementation;
▪ Identify strengths, risks, weaknesses and opportunities to improve;
▪ Monitor how households used the cash top-ups;
▪ Understand satisfaction levels of beneficiaries, communities, and stakeholders as regards the
pilot.
1.4 PDM Activities
The PDM is comprised of:
▪ Early Action Component:
o Quantitative: Household Questionnaire
o Qualitative: Focused Group Discussions (FGDs) and Key Informant Interviews (KIIs)
▪ Early Response Component
o Quantitative: Household Questionnaire
o Qualitative: Focused Group Discussions (FGDs) and Key Informant Interviews (KIIs)
The household questionnaires, a list of interviewees/participants in the qualitative component can be
found in Annex A.
1.5 Methodology
A total of 4 rounds of data collection took place (1 round after each payment); 1 round for the Early Action
Component and 3 rounds for the Early Response Component. To enable comparison of results across the
total sample pool as well as changes in a single household unit, a panel study was undertaken (i.e. the
same households underwent data collection in the different rounds). The households included in round 1
data collection were included in the sample for rounds 2 to 4, as they benefitted from both pilot
components.
1.5.1 Sampling
A total of 2 730 children living in 4 Soums received the Early Action top-ups under the pilot. The survey
sample consisted of 400 households. Probability sampling and simple random sampling techniques were
used. At 95% confidence level, standard error at 2.6%, upper limit at 15%, and key indicator at 0.35 the
sample size for 4 Soums stood at 330 households; and at the sample depreciation level of 15% it was 388
households.
The sample size was rounded up to 400 households and, in order to ensure comparability, an equal
distribution method was used. In total, questionnaires for 366 household were fully completed.

5
A total of 6747 children were covered by the Early Response component. The sample size was 706
households at the confidence level of 95%, error limit of 10%, key indicator at 0.40, and sample size
depreciation level at 15% when probability sampling method was used. The sample size was determined
at close to 700 households, and the work scope was set to include the survey reports to be issued every
month, data collection to be conducted by phone calls in a short period of time, and to cover 10 Soums in
the survey. In addition to 4 Soums involved in the previous phase, 6 Soums were randomly selected, and
sample distribution was allocated evenly. When selecting households to be included in the survey, simple
random selection method was used to ensure balanced representation of different groups.
The information of 2022 households (687 in February, 679 in March, and 656 households in April) was
used to compare the survey results with the total sample, and the information of 656 households was
used for household level (panel) comparison.
1.5.2 Process
UNICEF team developed the survey sample design and questionnaire, and incorporated comments and
proposals submitted from the MLSP. In preparing the sample scope, it was planned to get a list of
beneficiary children (households) from the General Authority of Labour and Social Welfare Service
(GALSWS) through the MLSP, however, no response to the formal requests to the Central Intelligence
Agency (CIA) was received. A list of the household head’s name and household contact number for 4
Soums was obtained instead from the Aimag in January 2020, and another list for 10 soums in March
2020. From these lists, households to be engaged in the survey were randomly selected in each Soum.
While the same questionnaire was administered for every survey, some small updates were made every
month to keep questions relevant. The survey data collection, data processing, and reporting was
conducted by Lords of Success. Data collection was carried out 4 weeks after the payment of top-ups in
order to allow time for herders to access the cash, taking into consideration that rural households make
fewer trips to the Soum centre, where banks are located, in winter. All enumerators involved in the survey
data collection and processing were trained to ensure the confidentiality of personal and household data,
in accordance with the service provision agreement established between the contracting party (UNICEF)
and the contractor (Lords of Success).
The responsibilities of the survey contractor included preparation for data collection work, preparation of
the equipment and software used for data entry and data processing of the monthly survey
questionnaires, organisation of trainings for data collectors, collection of household information through
contracting households, creation and verification of the information database, processing of results,
preparation of the reports and submission of those to the contracting party.
1.5.3 Limitations
The main limitations faced were related to data collection under the lockdown measures and bans on
public gatherings imposed by the government following the onset of the Covid-19 pandemic. In addition,
in accordance with the Law on Election there was a 30 day ban on public gatherings which limited the
qualitative data collection. Data was therefore collected via telephone.
6
The following challenges and limitations were faced:
▪ Need for a shorter questionnaire;
▪ High turnover of phone numbers and lack of availability of battery charge;
▪ Start of breeding season, meaning many herders were too busy for survey;
▪ The survey population was too small, which restricted the options available for sample design (for
Early action component);
▪ Data privacy and sharing restrictions presented challenges to the preparation of the survey scope
and household lists.
2 Household Profiles
The pilot was targeted to households living in Zhavkhan Aimag (4 Soums at highest risk of dzud for the
Early Action component, and all 22 Soums affected by dzud for the Early Response component).
Survey enumerators were instructed to carry out the survey interview with the person in the household
who withdrew and spent the top-up paid by the pilot into the eligible child’s CMP account. Many
households engaged in herding as their main source of income opt for the mother and children to live in
the Soum center while fathers remain in the countryside to tend to the herds. While the CMP and therefor
the pilot top-up are both paid into a dedicated bank account for the child, caregivers must identify to the
bank an adult that can access the cash for the child.
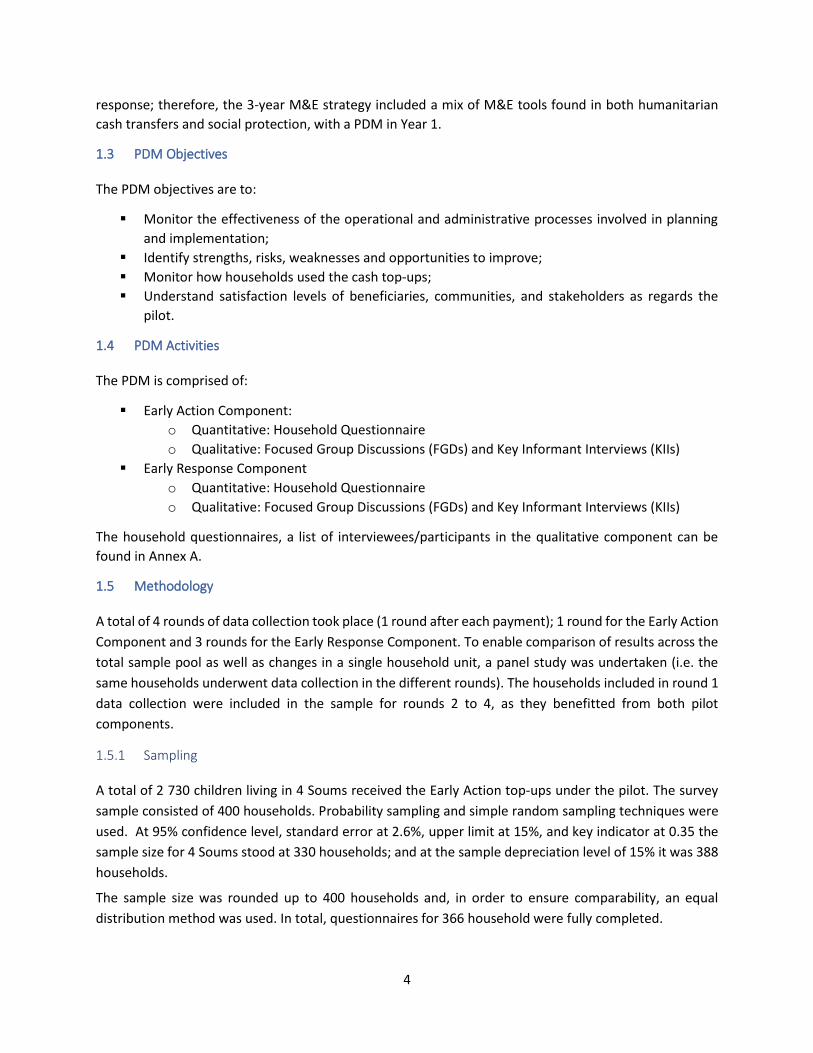
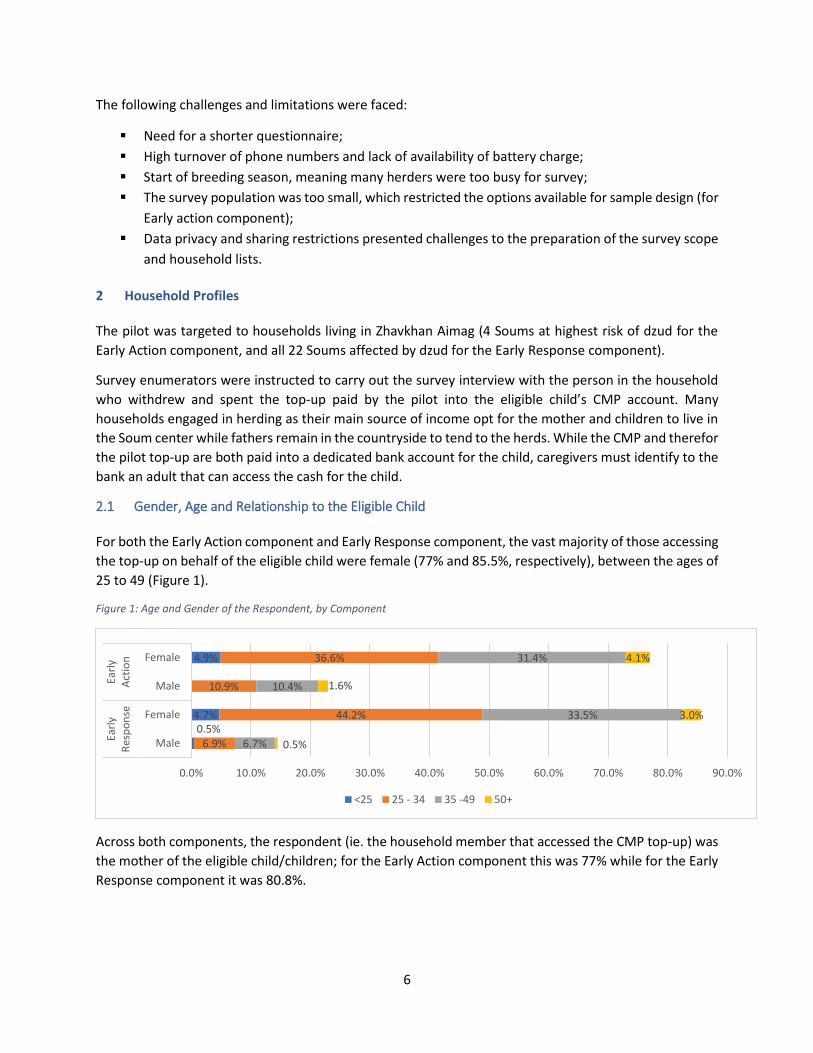
2.1 Gender, Age and Relationship to the Eligible Child
For both the Early Action component and Early Response component, the vast majority of those accessing
the top-up on behalf of the eligible child were female (77% and 85.5%, respectively), between the ages of
25 to 49 (Figure 1).
Figure 1: Age and Gender of the Respondent, by Component
Across both components, the respondent (ie. the household member that accessed the CMP top-up) was
the mother of the eligible child/children; for the Early Action component this was 77% while for the Early
Response component it was 80.8%.
0.5%4.7%
4.9%
6.9%
44.2%
10.9%
36.6%
6.7%
33.5%
10.4%
31.4%
0.5%
3.0%
1.6%
4.1%
0.0% 10.0% 20.0% 30.0% 40.0% 50.0% 60.0% 70.0% 80.0% 90.0%
Male
Female
Male
Female
Earl
yR
esp
on
seEa
rly
Act
ion
<25 25 - 34 35 -49 50+

7
Figure 2: Respondent Relationship to Eligible Child
2.2 Eligible Children in the Household
While all children aged 0 to 18 are eligible for the regular CMP, only children aged 0 to 5 were eligible for
the CMP top-up. There was no limit on the number of children that could receive the grant in a single
household, so long as the child met this age-based eligibility criteria. Most beneficiary households had
only 1 eligible child. For the Early Action component covering 4 Soums those with only one eligible child
was 65.7%, while for the Early Response component which covered 22 Soums this was 73% (Figure 3).
Figure 3: Number of Eligible Children in Household
While only 3.6% of children in the Early Response component were not living with their parents, in
Bayantes Soum the qualitative component found that a common question raised by respondents was
whether children from other staying with them were eligible for the top-up.
2.3 Household Residence and Main Income Source
During dzud, particularly those characterized by extreme snowfall, storms or temperatures, these
households can be especially difficult to reach with information/key messages, and it may also be more
difficult for them to reach bank branches in Soum centers to access their social welfare benefits.
2.3.1 Soum Center vs Rural Residence
While the majority (57.9%) of respondents lived in the Soum center compared to only 42.1% of
respondents in the rural areas for the Early Action component which was implemented in 4 Soums, for
77
13.4
6.3 3.3
Early Action
Mother Father
Grandparent Other
80.8
14
4.11.1
Early Response
Mother Father
Grandparent Other
65.7
30.5
3.8
Early Action
1 2 3 or more
73
25.4
1.6
Early Response
1 2 3 or more

8
the Early Response component, which included all 22 Soums in Zhavkhan Aimag, this pattern reversed
with 54.7% living in the rural areas compared to 45.3% in the Soum center.
The qualitative component of the Early Action survey also noted that this may be due to many mothers
and children living in the Soum center in order that older children can attend mandatory schooling, while
fathers engaged in herding remain in the countryside to take care of the livestock, particularly during
winter when they move around in search of pasture. Therefore, these household are split between the
Soum center and the rural area but respondents (mainly mothers) were living in the Soum center.
Figure 4: Household Residence: Soum Center vs Rural Areas
2.3.2 Herder vs Non-Herder
Approximately a forth of all households in Mongolia are engaged in herding as their primary income
source. In the pilot in Zhavkhan Aimag this figure was over two thirds (73.8% Early Action component,
78.8% Early Response component (Figure 5).
Figure 5: Herder vs Non-Herder Households
Herder households move frequently and over large distances, often in areas without telephone or internet
connection. This has implications for the efficient delivery of SRSP, particularly in interventions responding
to climate-driven shocks. One objective of this monitoring exercise is to generate lessons specific to herder
community needs in terms of SRSP pilot/program design and policy recommendations. These are
discussed in the sections below.
57.9%
42.1%
Early Action
Soum Center Rural Areas
45.3%
54.7%
Early Response
Soum Center Rural Areas
73.8%
26.2%
Early Action
Herder Non-Herder
78.8%
21.2%
Early Response
Herder Non-Herder

9
Even for households residing in the Soum center, the majority of are engaged in herding as their primary
income source (Figure 6)3.
Figure 6: Residence vs. Herder/Non-Herder
3 Findings & Lessons Learned
The findings of the 4 surveys (Early Action component in December, and Early Response component in
each of February, March and April) are presented in this section. It is important to recall that while the
Early Action component covered 2 583 children in 4 Soums, the Early Response component covered 6 747
children in all 22 Soums in Zhavkhan Aimag, and that the pilot covered only children aged 0 to 5. Data
tables can be found in Annex B. Lessons learned are presented throughout this section alongside the
relevant findings.
Findings: Highlights ▪ Households who received messaging about the pilot were more likely to spend the cash in line with
pilot objectives. Banks, bagh governors and social workers proved important actors in message dissemination;
▪ Spending across components and months are focused on four categories, including winter clothes/shoes for children, child healthcare/medicine, food, and savings;
▪ Many households had existing contracts with the Banks where regular CMP payments were automatically deposited into a long-term, higher interest child savings account, which resulted in some top-ups being also automatically deposited to savings. This decreased after pilot top-up messaging was delivered, where some households were able to communicate their preference to withdraw the top-up, and also where one of the commercial banks stopped automatically depositing the pilot-top up into savings alongside the CMP base amount;
▪ Women were far more likely to withdraw and control the spending of the benefit than men; ▪ There were some spending differences between rural households and those in the Soum centers
as well as households with more eligible children, but few differences between herders/non-herders, households that lost many versus few livestock, and whether a female or male adult withdrew the top-up on behalf of the eligible child;
3 The difference in the proportion of herders in the two components is due to the inclusion of more urban soums of Tosontsengel and Ikh-Uul.
33.1
40.7
26.3
52.5
24.9
1.4
18.9
2.2
0 10 20 30 40 50 60 70
Soum Center
Rural Area
Soum Center
Rural Area
Earl
yA
ctio
nEa
rly
Res
po
nse
Rural/Soum Center vs Herder/Non-Herder
Herder Non-Herder
10
▪ Internet and mobile banking tools were particularly useful for herders, who face greater challenges during dzud to access banks in soum centers to access CMP and top-up benefits.
3.1 Pilot-related Communications and Awareness
Pilot-related communications were carried out through workshops with relevant local authorities and
distribution of key messages for beneficiary communities through additional local authorities (e.g.
livestock census workers), local media and social media. Communications with beneficiary households
living in rural areas (i.e. outside of Soum centers) were particularly challenging in areas that were affected
by regular snowfall or white dzud (i.e. heavy snow), national lockdown or movement restrictions,
preparations for Lunar New Year, and the fact that many herders had gone on otor (moving with herds in
search of grazing pasture).
The first level of pilot-related communications, the distribution of information and key messages to the
Aimag authorities and MLSP Implementation Agency staff, was carried out in the form of a workshop at
the Aimag. During this workshop, the best strategies for the dissemination of key messages to the other
stakeholders (e.g. Soum authorities, bank staff, etc.) and beneficiary communities were identified by local
staff and frontline workers. This took place for each of the pilot components.
3.1.1 Information Source and Accuracy
Accurate and timely provision of information about cash transfer programs is important as it allows
beneficiaries to avoid negative coping strategies they would otherwise be forced to adopt, as well as to
understand the objectives of the program/pilot.
The first source of information for the Early Action Component (i.e. the December payment) was through
mainly word of mouth (26.1%), followed by the Soum Governor (13.6%), and the commercial bank
through which benefits were collected (12.5%) (Figure 7). However, only 17.2% rated the information
received through word of mouth as accurate.
Those whose first source of information was official sources including the Soum Governor, the Bagh
Governor and other government officials in the Soum, as well as official messaging through TV and Radio,
tended to rate it as more accurate compared to other first information sources. Respondents rated the
bank as the most reliable source of information (19.4%) even though only 12.5% first received the
information this way. Banks were provided with written key messages, question and answer (Q&A)
documents and leaflets about the pilot.
The qualitative component of the Early Action component found that the strategy of having each civil
servant in the pilot area contacting 3 to 5 citizens with information dissemination was not effective for
this pilot, and the fact that fewer channels for information dissemination in rural areas led to fewer
households there receiving messages.

11
Figure 7: Sources of Information for Early Action Component
For the Early Response Component, interaction with others remained the main means through which
respondents first heard about the pilot (20.2%), as did the proportion of respondents who found the
information accurate (13.4%) (Figure 8). Thepercentage of respondents identifying the Bagh Governor as
the first source of information increased to 17.8% for this component compared to 9.2% in the earlier
component, with the information provided by him/her as highly accurate. The Bank remained the most
accurate source of information (20.1%) according to respondents.
Figure 8: Sources of Information for Early Response Component
Bank
20.1 8.4
Bagh Governor 16.7 17.8
Interaction with others 13.4 20.2
Social welfare specialist 12.1 10.3
TV,Radio 9.0 10.9
Soum Governor 8.2 10.3
Other civil servants in soum 6.1 6.4
Others 4.1 2.6 Accurate
Soum Facebook group 2.2
First source 5.2
Kindergarten teachers 1.2 1.0
People, who delivered fodder 0.1 0.1
No information received 6.8 6.8
There were important differences in information dissemination and awareness between respondents
living in different Soums, living in the Soum center or rural areas, and based on whether their primary
income generating activity is herding or non-herding activities.
2.7
2.2
1.9
4.6
4.1
3.0
9.2
10.1
10.1
13.6
26.1
12.5
1.9
2.5
2.5
3.6
4.1
4.9
10.4
10.4
10.4
12.8
17.2
19.4
Other
Livestock census commission/People who delivered…
Kindergarten teacher
Soum Facebook group
Did not receive any information
Social welfare specialist
Bagh governor
Other government officials in soum
TV, radio
Soum governor
Through interaction with others
Bank
Accurate First heard

12
Figure 9 presents the first source of information by Soum for the Early Action Component. While
interaction with others is still the main source of information where respondents first learned of the pilot
across all 4 Soums, the results vary quite substantially across Soums, like due to the significant differences
between them in terms of remoteness/accessibility for messaging.
Figure 9: First Source of Information for Early Action Component, by Soum
Figure 10: Information Source Early Action Component, Rural or Soum Center
0
5
10
15
20
25
30
Bayantes Ikh-Uul Tosontsengel Tes
19.4% 17.1%7.3% 8.9%
11.4% 18.6%
15.2%20.5%
7.0%6.0%
5.3%6.2%
8.0%11.1%
11.9%11.0%
2.5%
5.5%
4.0%4.8%
10.0%
9.5%
11.3%
13.0%
27.9%19.1%
26.5%17.1%
9.5% 8.5%11.3% 13.7%
First heard Accurate First heard Accurate
Soum center Rural area
Soum governor Bank Soum Facebook group
Livestock census commission Bagh governor Social welfare specialist
Kindergarten teacher Other government officials in soum Through interaction with others
TV, radio Other

13
Figure 11: Information Source Early Response Component, Rural or Soum Center
There was a notable difference between those living in the Soum center (18.3%) and those living in rural
areas (7%) in terms of the percentage of respondents first leaning about the pilot from the Social Welfare
Specialist.
Bagh governors became a more significant actor in information dissemination between the first and
second components, with their role as the first information source increasing in both rural areas and Soum
centers from around 11% to around 16%.
Rural households were more likely to hear about the pilot first via radio or tv (around 11% in both
components) than their Soum center counterparts (6% -7%), while SMS was not particularly effective
given low network coverage and difficulties reading the messages. Bagh governors also noted that rural
households generally change telephone numbers frequently, therefore this is not an ideal way to reach
them. In the Early Action component, television was identified in the FGDs as an important means of
communication in the countryside.
“Television is probably the best way to disseminate information to rural people. My family and our
neighbors usually watch the Herder's Channel. The most viewed TV program is “Herder's
Platform”. Almost everyone in the countryside watches this program.” – Herder Participant in
FGD, Early Action Component
Aimag and Soum officials also delivered messages in person to rural areas while delivering emergency
fodder, and highlighted that the financial assistance for fuel costs was instrumental to this effort.
In the Soum center, the Soum Facebook page and phone calls / SMS was also seen as very effective by key
informants interviewed.
Interestingly, while for the Early Action Component 8.3% of non-herder households received no
information about the pilot compared to just 2.2% of herders, in the Early Response Component this
pattern reversed with 3.4% of non-herders receiving no information compared to 7.8% of herder
households. This seems to contradict the finding that while 8.6% of rural households received no
information, only 4.2% of Soum center households received no information
3.9 % % 1.0
4.6 % 6.5 %
% 18.3 % 8.2
% 6.5 % 12.4
16.0 % 18.3 %
% 4.2
0.3 % 0.5 %
% 1.4 3.8 %
5.9 % 7.0 %
% 8.1 % 11.1
13.8 % % 17.6
% 21.9
% 8.6
People who delivered fodder Soum Facebook group
Kindergarten teachers Others
Other civil servants in soum Social welfare specialist
Soum Governor ТV, Radio
Interaction with others Bagh Governor
Bank
No information received
Rural Soum center

14
Figure 12: First Source of Information about Pilot: Herder vs Non-Herder in Early Action and Early Response Components
9.5
13.5
10
24
8.3
8.8
12.6
12.5
3.5
11.5
3.3
8.3
0
0
3
0
18.4
15.5
10.7
5.2
9.6
12.8
3
3.1
0.7
0.2
1.9
2.1
5.9
8.1
11.1
7.3
21.1
17.6
27.4
22.9
12.8
4.1
11.9
4.2
7.8
3.4
2.2
8.3
2.4
2
3
2.1
Herder
Non-herder
Herder
Non-herder
Earl
y R
esp
on
seEa
rly
Act
ion
Other /Specify/
Did not receive any information
TV, radio
Through interaction with others
Other government officials
Kindergarten teacher
Social welfare specialist
Bagh governor
Livestock census commission
Soum Facebook group
Bank
Soum governor
15
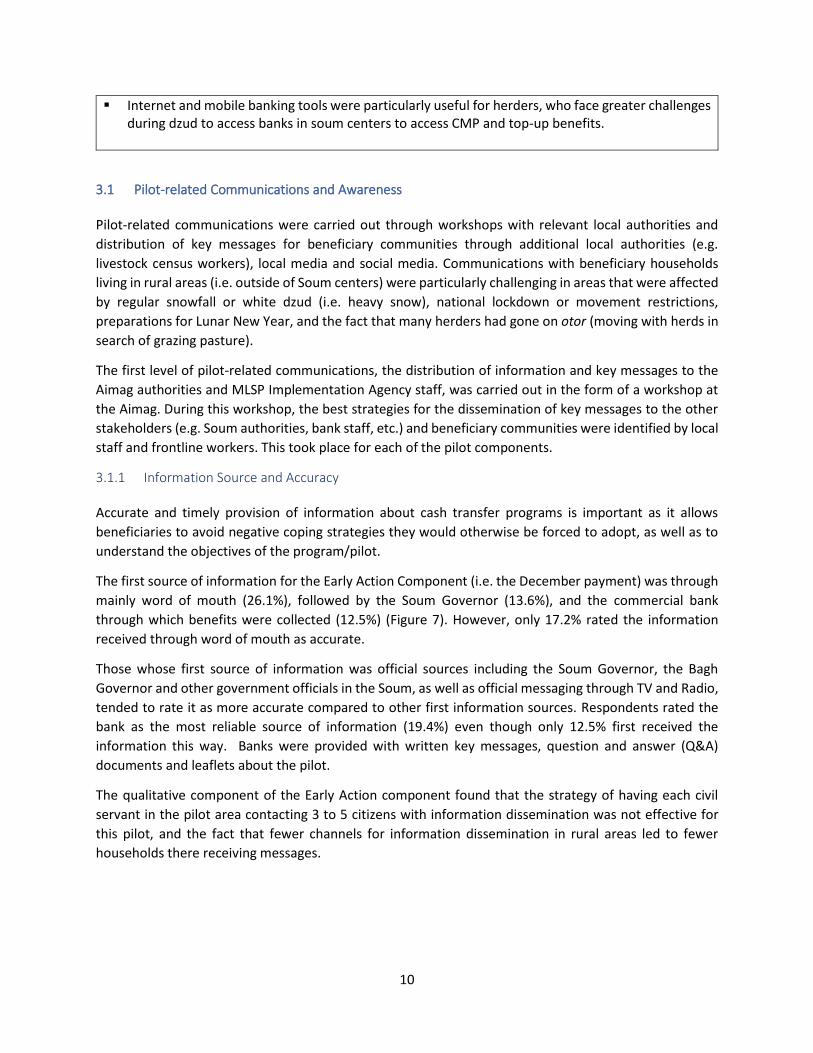
3.1.2 Timing of Communications
Timely communications are important to ensuring that beneficiary households and their communities
understand the objectives of the cash transfer, as well as the eligibility criteria, payment amount, transfer
mechanism and date, etc. in advance of payment. Timely communications also help beneficiaries to plan
financially, which in turn helps them to avoid negative coping strategies they might otherwise be forced
to adopt, in the absence of the cash transfers.
The first cash transfer (the only payment made for the Early Action Component, and paid to beneficiaries
in only the 4 Soums targeted as highest risk of dzud) took place on December 9th, 2019. Only 44.1% of
beneficiary households received information about the pilot before payment, while 53.9% received it
afterwards. Even among those living in the Soum center where information dissemination is easier than
in the rural areas, more than half of the beneficiary households received pilot-related communications
after the payment. 95.9 percent of all respondents were informed of the assistance programme within 4
weeks after the cash assistance had been transferred into the bank accounts.
The second cash transfer (the first of three payments for the Early Response Component and paid in all
22 Soums in Zhavkhan, as all were affected by dzud) was paid on February 17th 2020. As shown below in
Figure 14, an even smaller proportion of beneficiary households (only 22.6%) received information on this
Component before payment. This was 30.7% for those in the Soum centers compared to 23.2% living
outside the Soum center in rural areas.
Therefore, between the first payment and the second payment, pilot performance on timeliness of pilot-
related communications (i.e. before payment) declined significantly from 44.1% to only 23.2%. This may
have been due in part to the onset of the Covid-19 pandemic, as well as challenges arising from dzud
conditions.
Figure 13: Timing of Pilot-related Communications with Beneficiaries: Early Action Component
44.1%
53.9%
2.0%
Total
Before After Don’t remember
46.7%
51.3%
2.0%
Soum center
40.5%
57.4%
2.0%
Rural area

16
Figure 14: Timing of Pilot-related Communications with Beneficiaries: Early Response Component
Total
Households Rural households
3.0% 23.2%
2.2% 26.2%
73.8%
Soum center households
71.6% 1.0%
30.7%
Before After Don’t remember 68.3%
3.1.3 Beneficiary Understanding of Intended Purpose of the Cash Transfer
Key messages including the purpose of the pilot top-up cash transfer were delivered to beneficiary
communities in December 2019, before the Early Action component payment, while for the Early
Response component it was delivered late, after the first payment had already taken place. Another key
difference is that while the Early Action component covered 2 729 children in 4 Soums, the Early Response
component covered 6 747 children in 22 Soums and took place after the dzud had already begun, which
may have affected the ability of Aimag and Soum officials to disseminate messages.
Figure 15: Understanding of Intended Purpose of the Cash Top-up, by Component
Across both components, the majority of the households understood that the cash top-up was intended
for children. However, while half of households understood this for the Early Action component, this
dropped to 39.5% in the Early Response component (Figure 15). Overall, the vast majority of households
understood that the cash top-up was intended for children, however, this is not necessarily due to pilot-
related communications as the top-up was paid into existing CMP accounts of children, which in itself
sends a message.
Despite the pilot-related communications activities, fully 17.2% of households were not aware of the
purpose of the cash top-up in the Early Action component, and 12.5% in the Early Response component.
This is particularly high considering that only 6.8% did not receive any information for the Early Response
50.1
28.7
3.917.2
39.5 42.4
5.512.5
0
20
40
60
Intended for children in soums,facing dzud/harsh winter
For Children in General To Help the Entire Householdwith Winter
Don't know/Other
Early Action Component Early Response Component

17
component in February 2020. Unfortunately, the percentage of households that received no information
was not collected during the Early Action survey in December.
It is also worth noting that the understanding of the purpose of the cash varied significantly across Soums
(Figure 16). As local information dissemination relied upon messages being shared from the center to the
Aimag to Soum and Bagh officials, there are clear lessons for strengthening the communications aspect
of the pilot. These are covered below.
Figure 16: Understanding of the Purpose of the Cash: Early Response Component, by Soum
3.1.4 Lessons Learned: Information Dissemination and Messaging
Information dissemination strategies should take into account differences of rural/Soum center areas,
and the relatively shorter window available for information dissemination in shock-responsive versus
regular/standing social protection interventions, particularly when dzud conditions and movement of
herders in rural areas exacerbate communications challenges.
There is a need for more tailored information dissemination strategies identifying specific mechanisms
more appropriate to the Soum center, where people are more easily reached, and to the rural areas
(particularly during dzud when herders are likely to be on otor).
While official sources (i.e. government officers) and the Banks were rated by beneficiaries as the most
accurate sources of information, it was neither feasible nor time- or cost-efficient for these people to
spread messages through one-on-one interactions. The official strategy of having each civil servant
contacting 3 to 5 citizens with information dissemination should be reconsidered for future interventions.
While rural households were better reached by the Herder Channel (TV) and radio than by phone/SMS or
one-on-one interactions with government officials, Soum center households were better reached by
Facebook, phone/SMS, and direct contact with officials. Banks were also an important information source
for all households, where distribution of information leaflets and key messages took place. Wider
48%
27% 25% 23%
59%52%
3%
51% 53%
38%
38%
56%55%
28%
10% 23%
95%
41% 41%
40%
3%11%
5%
5%
0%
18%
0%4% 3%
2%
13%5%
16%
44%32%
7% 2% 3% 2%
21%
Other
I don’t know
For the household for winter/dzud
For children (only)
For children’s need during winter/dzud

18
distribution of written materials to boost the accuracy of word-of-mouth information dissemination
should also be considered as part of information dissemination strategies for SRSP.
A finding of the qualitative component was that the period of communications should be made longer.
However, generally, shock-responsive cash transfers programs have a shorter window of opportunity for
communications than regular cash-based social protection programs given that target areas are those
affected by shocks rather than those that can be identified further in advance. In addition, outside of
Ulaanbaatar, the effects of dzud exacerbate already challenging conditions for information dissemination
(i.e. sparse populations, moving/mobile herder population, challenging terrain, limited
telecommunications outside Soum centers, etc.).
The variation between Soums in the understanding of the purpose of the top-up points to a need for
greater standardization of messaging, and perhaps supporting the information dissemination process with
written materials (leaflets, Q&A and Key Message sheets) tailored to users.
3.2 Beneficiary Utilization of Cash
This section looks at how beneficiary households utilized the cash transfers provided under the pilot.
As mentioned above, the objective of the pilot was to help households with children aged 0 to 5 who were
affected by dzud to avoid negative coping strategies harmful to children (e.g. reducing nutritious food
intake, reducing health expenditure, foregoing healthcare or winter necessities, etc.). Dzud entails both
increased expenditure and decreased income due to livestock deaths afterwards. The cash transfer was
unconditional (i.e. the beneficiaries did not have to fulfill any conditions or undertake any actions in order
to receive the cash).
The main benefit of cash transfers compared to in-kind or voucher assistance is that it is flexible to the
different needs of different households, and allows the household to decide its own spending priorities.
Therefore, expenditures that benefit the entire household (e.g. winter household necessities like fuel or
ger insulation) are equally in line with the pilot objectives as expenditures directly on children (e.g. winter
boots/warm clothing). These key messages were disseminated during pilot implementation.
Payments were made into existing CMP bank accounts of children; CMP is a near-universal program that
covers approximately 97% of children outside of Ulaanbaatar. The payment of the pilot top-up was
deliberately paid on a different date than the regular CMP in order to help households differentiate
between the regular CMP and the pilot top-up payments.
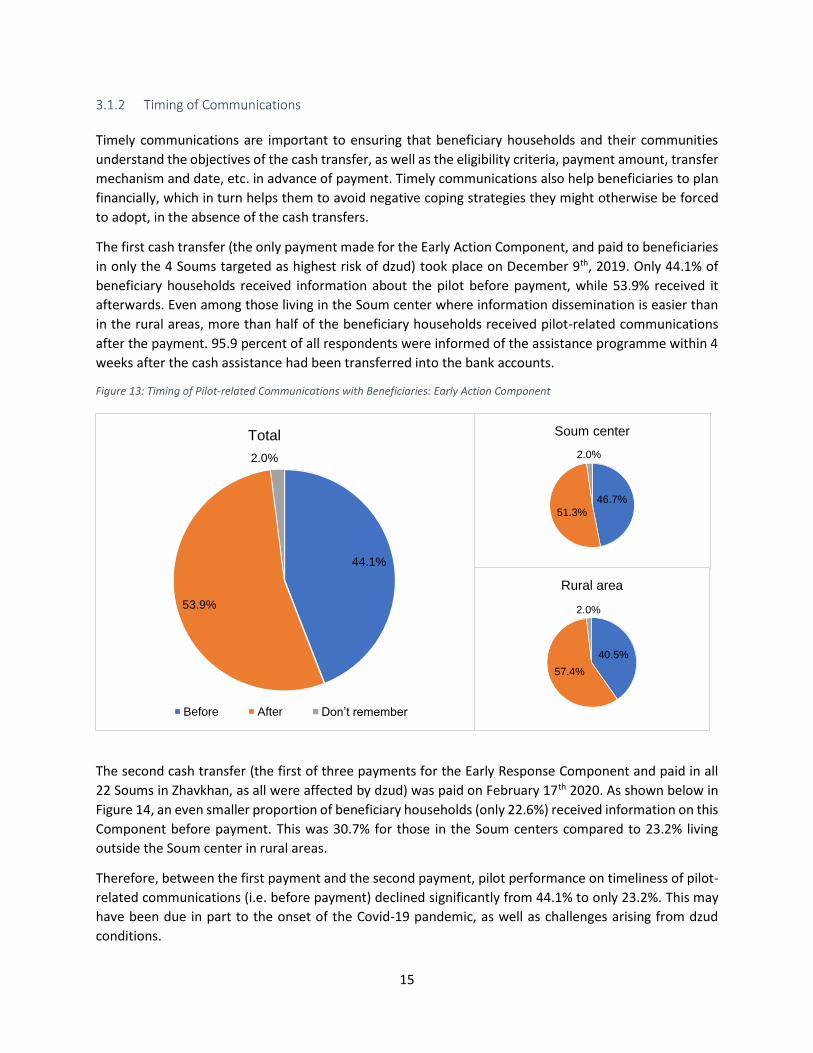
3.2.1 Benefit Distribution within Household
In the Early Action Component, the majority of beneficiary households responded that they spent the
cash only on the child into whose account the benefit was paid (69.1%), while the remainder spent it on
all children or the entire household (Figure 17).
19
Figure 17: Benefit Distribution within Household: Early Action Component
However, an interesting finding after the first payment was that many households had standing
arrangements with the Bank to automatically deposit the regular monthly CMP amount into a higher
interest long-term child savings account, and that for many the top-up amount paid through the pilot was
also automatically deposited without consulting beneficiary households. Savings are discussed below.
The qualitative and quantitative questionnaires were therefore amended in subsequent surveys to
capture more information around this.
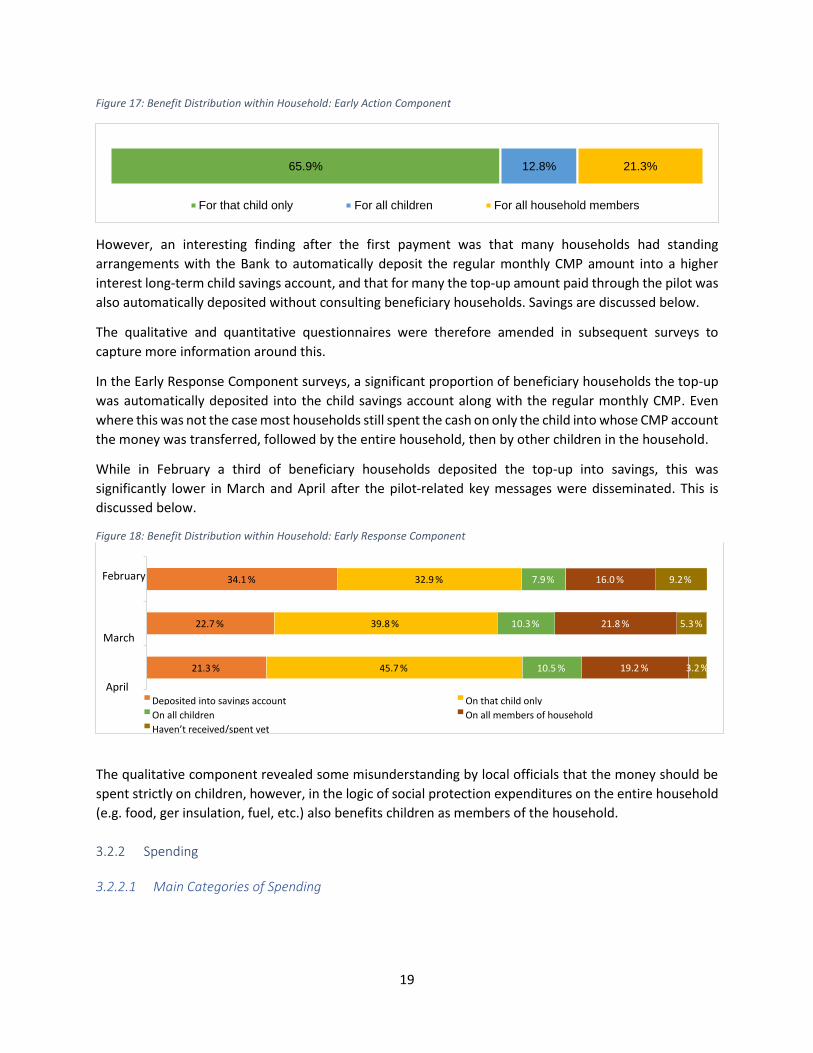
In the Early Response Component surveys, a significant proportion of beneficiary households the top-up
was automatically deposited into the child savings account along with the regular monthly CMP. Even
where this was not the case most households still spent the cash on only the child into whose CMP account
the money was transferred, followed by the entire household, then by other children in the household.
While in February a third of beneficiary households deposited the top-up into savings, this was
significantly lower in March and April after the pilot-related key messages were disseminated. This is
discussed below.
Figure 18: Benefit Distribution within Household: Early Response Component
The qualitative component revealed some misunderstanding by local officials that the money should be
spent strictly on children, however, in the logic of social protection expenditures on the entire household
(e.g. food, ger insulation, fuel, etc.) also benefits children as members of the household.
3.2.2 Spending
3.2.2.1 Main Categories of Spending
65.9% 12.8% 21.3%
For that child only For all children For all household members
% 21.3
22.7 %
% 34.1
% 45.7
39.8 %
32.9 %
% 10.5
% 1 0.3
% 7.9
19.2 %
% 21.8
% 16.0
3.2 %
% 5.3
9.2 % February
Deposited into savings account On that child only On all children On all members of household Haven’t received/spent yet
March
April
20
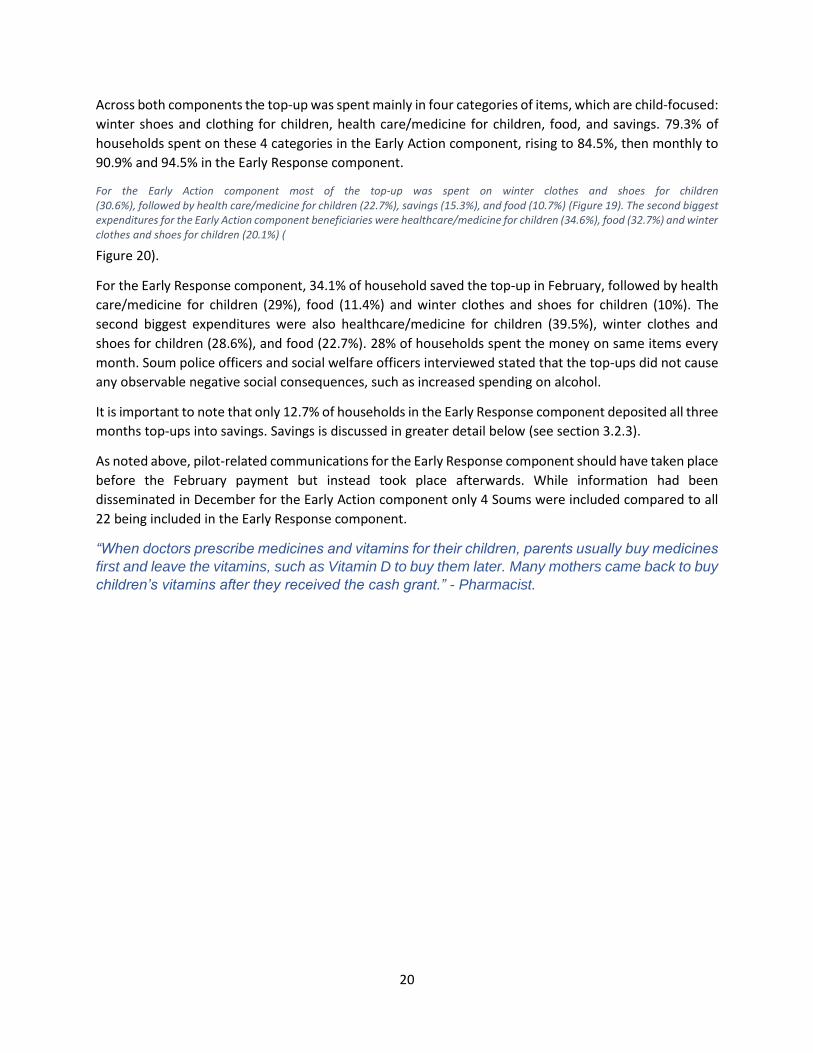
Across both components the top-up was spent mainly in four categories of items, which are child-focused:
winter shoes and clothing for children, health care/medicine for children, food, and savings. 79.3% of
households spent on these 4 categories in the Early Action component, rising to 84.5%, then monthly to
90.9% and 94.5% in the Early Response component.
For the Early Action component most of the top-up was spent on winter clothes and shoes for children (30.6%), followed by health care/medicine for children (22.7%), savings (15.3%), and food (10.7%) (Figure 19). The second biggest expenditures for the Early Action component beneficiaries were healthcare/medicine for children (34.6%), food (32.7%) and winter clothes and shoes for children (20.1%) (
Figure 20).
For the Early Response component, 34.1% of household saved the top-up in February, followed by health
care/medicine for children (29%), food (11.4%) and winter clothes and shoes for children (10%). The
second biggest expenditures were also healthcare/medicine for children (39.5%), winter clothes and
shoes for children (28.6%), and food (22.7%). 28% of households spent the money on same items every
month. Soum police officers and social welfare officers interviewed stated that the top-ups did not cause
any observable negative social consequences, such as increased spending on alcohol.
It is important to note that only 12.7% of households in the Early Response component deposited all three
months top-ups into savings. Savings is discussed in greater detail below (see section 3.2.3).
As noted above, pilot-related communications for the Early Response component should have taken place
before the February payment but instead took place afterwards. While information had been
disseminated in December for the Early Action component only 4 Soums were included compared to all
22 being included in the Early Response component.
“When doctors prescribe medicines and vitamins for their children, parents usually buy medicines
first and leave the vitamins, such as Vitamin D to buy them later. Many mothers came back to buy
children’s vitamins after they received the cash grant.” - Pharmacist.

21
Figure 19: Category of Largest Expenditure
Figure 20: Category of Second Largest Expenditure
3.2.3 Saving of Top-up
As noted above, some households opt to have the regularly monthly CMP benefit for children
automatically deposited into a high-interest, long-terms child savings account. Some households also use
this savings as ‘collateral’ to obtain additional short-term loans. No specific instructions were given to the
17.4%
16.8%
11.4%
10.7%
19.1%
14.5%
10.0%
30.6%
36.7%
36.8%
29.0%
22.7%
21.3%
22.7%
34.1%
15.3%
3.2%
5.3%
9.2%
9.8%
0.8%
2.1%
3.5%
3.6%
1.4%
1.5%
1.7%
5.2%
0.0% 5.0% 10.0% 15.0% 20.0% 25.0% 30.0% 35.0% 40.0%
apr
mar
feb
dec
Earl
y R
esp
on
seEa
rly
Act
ion
Other Animal Fodder Have not yet withdrawn/spent Intend to keep as savings
Health/medicine for children Children’s clothes/shoes Food for household/children
17
25
22.7
32.7
28.6
23.4
28.6
20.1
42
38
39.5
34.6
3.6
3.1
1.7
1.9
0
1
0
1.3
5.4
3.1
1.3
1.3
0
1
1.3
1.9
3.6
2.6
2.5
5.7
0 5 10 15 20 25 30 35 40 45
apr
mar
feb
dec
Earl
y R
esp
on
seEa
rly
Act
ion
Other Fuel to warm ger Animal Fodder Have not yet withdrawn/spent
Intend to keep as savings Health/medicine for children Children’s clothes/shoes Food for household/children

22
Banks handling the CMP bank accounts about whether to deal with the pilot top-up differently than the
regular CMP, and therefore during the first payment where there was an arrangement for automatic
deposit of the regular CMP amount, the top-up was also automatically deposited into the child savings
account without first consulting the household about whether this should take place. Households were
also not permitted to withdraw the cash, once deposited into savings, without incurring penalties.
The qualitative component found that while State Bank continued to transfer top-ups to the term deposits
even after they became aware of the issue, Khan Bank stopped doing this in February with the start of the
Early Response Component but did not inform beneficiaries or wider stakeholders. Therefore, some
beneficiaries benefitted from neither accessing the top-ups in a timely fashion nor benefitting from
automatic deposit into child savings.
In Durvuljin Soum, some parents stated in the FGDs that they were told by their State Bank branch that
the contract could not be terminated until the child reached 18 years of age; even where parents tried to
withdraw only the top-up amount which was intended to help them to cope with the shock, they were
not successful with the banks in doing so.
Given that the snowfall and Covid-19 movement restrictions made it challenging to disseminate
information, particularly to households in the countryside, it is possible that households were not aware
of the top-up in time to advise the bank to not treat the top-up the same as the CMP under the savings
contract. Most households with child savings accounts were with the State bank, and this bank
automatically transferred money placed in child money accounts to savings accounts under the existing
contract.
12.7% of households saved all three payments of the Early Action component.
As noted above (Figure 14), most households benefitting from the Early Response component received
pilot-related messages after the first payment had been made. Among households that did not receive
the key messages before the February payment, there are major changes to spending of the top-up in
subsequent months, after information had been disseminated (Figure 21).
While the top-up was deposited into savings for 34.1% of households in February, this fell to 22.7% and
21.3% in March and April (Figure 19). For those who had not yet received pilot-related messages during
the February household survey, 41.3% had the top-up deposited into savings in February, but this dropped
to 25.6% by April (Figure 21). More than half (54.3%) of households whose top-up was deposited into
savings in February had stopped depositing it into savings by the April payment. It is likely that this can be
at least partially attributed to both messaging and the change in policy to automatically deposit the top-
up into child savings for those with this existing arrangement for the CMP base amount.
Among those who did not receive pilot messages in February, their spending in children’s medication and
food rose significantly in March and April. The proportion that had not yet spent it by the time of the post-
payment survey dropped from 30.4% to 4.7%.

23
Figure 21: Households Missed by Communications: Spending by Month
There was also a notable difference in savings across months in Soum centers versus rural areas. While
36.3% of Soum center households deposited the cash grant into savings account in February, this
decreased to 27.4% by April. Meanwhile, in rural areas the rate of savings declined faster, from 32.6% in
February to almost half or 16.2% in April.
3.2.3.1 Spending by Component
Although spending across components was focused on the same four categories, there were some
interesting differences (Figure 19). Winter clothes and shoes for children accounts for the largest share
expenditure of pilot top-ups in December (30.6%), while this falls significantly to 10% (February) and 20%
(April).
The opposite happens for savings, however, with an increase from only 15.3% in December to more than
double (34.1%) in February, before falling again to 21% - 22% by March and April. While this can be
partially explained by the issue of late messaging and automatic deposit into child savings (see section
3.2.3), and the change in the automatic savings policy of Khan Bank, households might have also been
saving the top-up for upcoming challenges expected to arise due to the dzud. Spending of the top-up on
food increased (from 10% in the Early Action component, to 17.4% by April), as did spending on child
health (from 22.7% in the Early Action component to 42% by April). The latter may be partially explained
by messaging from some Soum authorities encouraging spending on vitamins for children, and by changes
in household behaviour due to the onset of the Covid-19 pandemic.
In February and March, households that received key messages about the top-ups from the Bagh
Governor, Social Workers or Bank staff were more likely to spend the cash on health/medicines for
children.
3.2.3.2 Spending by Rural/Soum Center
There were some differences between spending in rural households versus Soum center households.
Households in countryside soums (13.3%) were more like than those in Soum centers (4.9%) to report
that they had not used the top-up yet, likely due to the lower coverage of messaging and relatively
more limited access to the Banks in the Soum centers.
4.7
0.0
20.9
23.3
25.6
25.6
7.0
2.3
7.0
20.9
30.2
32.6
30.4
4.4
10.9
8.7
4.4
41.3
Have not received or spent yet
Other
Children’s clothing, footwear
Food
Children’s healthcare, medication
Deposited in savings
2- February 3- March 4- April

24
The percentage of households that saved the top-up declined by 9% Soum centers and 16% in countryside
Soums between February and April. Soum center households began to spend the top-up on children’s
health, clothes and shoes while rural households increasingly used it for food as well. Changes in spending
categories over the months was faster for rural than Soum center households; rural households spent the
cash on a greater variety of categories.

25
0
0.0%
0.0%
3.3%
1.3%
1.7%
2.3%
1.3%
0.3%
4.9%
3.2%
1.0%
9.5%
14.3%
14.9%
10.1%
14.9%
12.2%
36.3%
26.0%
27.4%
33.7%
39.0%
41.9%
1.1%
0.3%
0.3%
1.7%
1.7%
0.3%
4.7%
2.9%
1.1%
13.3%
7.3%
5.1%
10.5%
14.9%
22.5%
11.6%
18.4%
21.7%
32.6%
19.8%
16.2%
24.6%
34.7%
32.5%
February
March
April
February
March
April
February
March
April
February
March
April
February
March
April
February
March
April
February
March
April
February
March
April
Fuel
to
war
m g
erO
the
rA
nim
al f
od
de
rH
ave
no
t ye
tw
ith
dra
wn
/sp
ent
Ch
ildre
n’s
cl
oth
es/s
ho
esFo
od
fo
rh
ou
seh
old
/ch
ildre
nIn
ten
d t
o k
eep
as
savi
ngs
Hea
lth
/med
icin
efo
r ch
ildre
n
Soum center Countryside
Figure 22: Spending by Rural /Soum Center

26
There were also differences between rural and Soum center households in savings, which is discussed
in section 3.2.3.
3.2.3.3 Number of Children
Households with more children tended to spend more on food than other households. Households with
1-2 children aged 0-5 years old spent up to 18% of the assistance money on food, while households with
3 children spent 36%-39% percent of the money on food during the last 2 months. Households with fewer
children spent more on children’s health and immunity products Table 1.
Table 1: Spending by number of children aged 0-5 years old, by share in households with the same number of children aged 0 to 5
Number of children aged 0-5 years old
1 2 3
Food April 16% 18% 36%
March 16% 16% 39%
February 11% 13% 8%*
December 2019 10% 11% 17%
Health April 37% 39% 24%
March 37% 37% 29%
February 28% 29% 50%
December 2019 24% 19% 17%
Saving April 22% 20% 20%
March 24% 21% 14%
February 36% 32% 21%
December 2019 13% 22% 0%
*Lunar New Year
3.2.3.4 Other Household Characteristics
Surprisingly, there were no major observable differences in spending, apart from savings of the top-up,
when comparing households based on:
▪ Herder/non-herder (as main income-generating activity);
▪ Female or male withdrawing the top-up on behalf of the child;
▪ Number of livestock that were lost due to dzud (<50 head, 50 -100 head, 100+ head).
A core objective of the pilot is to help households prepare for dzud and to avoid negative coping strategies
harmful to children (e.g. reducing nutritious food intake, reducing expenditure on healthcare or
education). Herders earn an important part of their annual income in the spring from cashmere/wool
sales. Dzud often results in high rates of livestock deaths, which in turn leads to a reduction in this income
and an increased risk that the household will be forced to negative coping strategies.
Interestingly, households that lost a higher number of livestock did not spend the top-up differently than
households that lost fewer livestock.

27
Among participating households, especially customers of the Khan Bank, use of payment cards, mobile
banking, internet banking was quite widespread and popular. These bank services allowed rural herders
to access and use their funds quickly during dzud.
3.2.4 Source of Key Messages and Spending
Households that received the pilot-related key messages from the Bagh Governor, Social Worker or Bank
staff were strongly encouraged by these actors to spend the cash on vitamins and healthcare for children
in some Soums, although this was not part of the official key messages shared with them. In Soums where
this was done by officials, responses indicated that households that received pilot-related key messages
from these 3 sources did spend more on children’s health, while for other households the same was not
true. As shown in the figure below, spending also differed based on whether the household received direct
(face-to-face) or indirect messaging from officials, unofficial (word of mouth) information, or did not
receive any information at all.
Figure 23: Spending by Source of Pilot-Related Communications
3.2.4.1 Fodder
One concern raised by government agencies and development partners was that households would
spend cash intended for the needs of children on fodder for animals. Few households spent the largest
share of the top-up on fodder for animals, declining from 5.1% in December to only 1.1% in April even
though of the 54.1% of rural households that had purchased fodder on credit the previous winter,
21.1% (38.9% of total households that purchased fodder on credit) had not repaid their loans at the
time of the survey.
0.0%
4.3%
0.0%
30.4%
10.9%
8.7%
41.3%
4.3%
0.0%
6.5%
2.2%
4.3%
9.8%
15.2%
44.6%
17.4%
1.1%
1.7%
2.9%
12.0%
9.1%
7.4%
42.3%
23.4%
0.6%
1.4%
3.5%
6.4%
10.1%
12.1%
27.7%
38.2%
0.0% 5.0% 10.0% 15.0% 20.0% 25.0% 30.0% 35.0% 40.0% 45.0% 50.0%
Fuel to warm ger
Other
Animal Fodder
Have not yet withdrawn/spent
Children’s clothes/shoes
Food for household/children
Intend to keep as savings
Health/medicine for children
direct indirect unofficial Didn't receive any info

28
72.7% of all households and 81.3% of rural households purchased subsidized animal fodder from the
government, while 29.9% (35% of rural households) received livestock fodder from other various
assistance programs.
3.2.4.2 Debt
Another concern at the time of the pilot design was that households, a large proportion of which had
taken on informal debt with local shopkeepers, would feel pressured to repay those debts instead of
using the cash to avoid negative coping strategies harmful to children. This question was included in
the Early Action survey, but was mistakenly omitted by the firm from the Early Response survey. 76.2%
households had borrowed from local shops, among which 24.4% responded that they felt some
pressure to use the top-ups to repay that debt. A negligible percentage of households responded that
they actually used the top-up to repay informal or formal debts.
3.2.5 Lessons Learned: Spending
The top-up was intended to help beneficiary households to deal with a shock; timely awareness of and
access to the cash top-up was therefore important.
An important lesson learned from the pilot was that many households have existing contracts with Banks
whereby regular CMP payments are automatically deposited in longer-term savings accounts for children.
While both national-level Bank officials and local bank staff at the Aimag and remote Soums were
consulted during the pilot design, as well as potential beneficiary households and local Social Workers,
this was not flagged as a potential issue.
As the GoM moves forward with the approach of vertical expansion of regular social protection programs
in response to shocks it is important to thoroughly assess such potential challenges as this one, and to
mainstream policies that require private sector partners to report and rectify such issues in a timely
manner.
Another key lesson was the importance of messaging to inform households of the purpose of the cash
transfers, as this appears to influence how they spend the cash. Equally important is the local
contextualization of messaging while not deviating from the original messaging and objective of the
transfer. It is encouraging that despite perceived risks that households would spend the top-ups on
repaying debts or fodder for animals, in fact the vast majority spent on children.
While overall households spent the cash on child-centered categories, a significant proportion of
households spent the top-ups on the needs of the entire household, which in the logic of social protection,
in turn benefits the children who are part of that household.
The finding that households with more eligible children were more likely to spend the top-ups on food is
interesting and warrants further investigation, in a more robust exercise than this PDM.
There is a need to strengthen messaging for local officials, Banks, shopkeepers, and community leaders
(e.g. teachers, health workers, etc.) that spending the top-up on expenses that benefit the entire
household also benefit children as members of that household, and that the cash is not intended strictly

29
to be earmarked for children’s clothing or vitamins, but as a means of reducing the need for households
to resort to negative coping strategies harmful to children (e.g. reducing nutritious food intake).
3.3 Beneficiary Preference: Payment Timing and Frequency
314 households included in the survey sample benefitted from both the Early Action and Early Response
components. The majority of these households:
▪ preferred to receive the payments during the dzud, rather than before dzud (57.6% compared to
26.4%), while 15.9% had no preference;
▪ preferred to receive payments in monthly installments (61.5%) rather than as a lump sum (34.1)
(Figure 24).
Figure 24: Beneficiary Payment Preferences
Responses were similar when comparing rural areas to the Soum center, with a slightly greater preference
for early preparedness among rural households but still a majority across both groups preferring the Early
Response (i.e. payments during the dzud rather than before) (Figure 25), and very little difference in
preference for monthly or lump sum payments (Figure 26).
“Rural herders do not have fixed income, but consumption is constantly there. It was very
helpful to get assistance during this time. I really wanted to spend it on my children. We herders
prepare for winter in autumn and it is true that we often put priority on our livestock and our
children are left behind.” – Herder in Tes Soum
The qualitative component found that in some remote areas that had experienced heavy snowfall as part
of the dzud, some beneficiaries gave their bank cards to other traveling to the Soum center in order for
them to withdraw the cash and purchase goods on their behalf.
% 57.6
% 26.4
15.9 %
Preferred Timing
During Dzud Before Dzud No
Preference
61.5 % 34.1 %
% 4.5
Preferred Payment Frequency
Lump Sum No
Preference
Monthly
Payments

30
Figure 25: Rural vs Soum Center Component Preference
Figure 26: Rural vs Soum Center Payment Preference
There were more notable differences when comparing preferences by Soum, with much greater variation
in preference for both the timing of the payment (i.e. component/before or during dzud) (Figure 27), and
whether payments should take place monthly or be received in a lump sum (Figure 28).
The qualitative component found that the main reason for the preference for lump sum payment was due
to households living in remote areas tending to visit Soum centres less frequently in winter and wishing
to make bulk purchases during those trips. The main reason for the preference for monthly instalments
was that it would allow spending on important necessities as needs occur, while a lump sum would
increase the risk of spending it all soon after withdrawal.
“In times of dzud, it is better to give the cash grant in a lump sum so that we could buy the things
we need at once when we visit soum center. If we get a lump sum, we will be able to buy flour,
rice and fodder.” – Mother from a Herder Household, Soum unknown.
Figure 27: Component Preference by Soum
Figure 28: Payment Preference by Soum

31
“I live about 30 km from the Soum center. In winter, it is not reasonable to travel to the soum
center in order to get MNT 20,000. I would have to pay the same amount for fuel."
3.3.1 Lessons Learned: Beneficiary Preferences
Similar to the findings around communications, the findings around beneficiary preferences point to a
common lesson; namely, that the needs and preferences of households can vary greatly from Soum to
Soum and between those living in rural areas versus the Soum center.
The main lesson is that the program should be made flexible to these varying needs wherever possible,
for example by allowing beneficiary households to opt for either a lump sum or monthly payments.
In areas of heavy snowfall where households were unable to reach the Soum center and sent their bank
cards with others traveling to the Soum center, alternatives that provide households with more reliable
access to goods should be assessed. Cash may not be the most appropriate option for households in
remote areas affected by heavy snowfall that impedes their ability to access banks.
3.4 Pilot Coverage
Targeting of the top-ups was based on the existing CMP database, therefore findings related to the
coverage of the top-up are also relevant to the regular CMP. The qualitative component found that while
most eligible children in the targeted Soums received the top-ups, there were a number of children who
did not due to the following reasons:
▪ Child had not yet been registered in the CMP database, and was therefore not receiving regular
CMP benefits;
▪ Data related to the current residence/location of children was not updated with sufficient
frequency. As a result, children living in the Soums covered by the pilot but registered in the CMP
database as living elsewhere did not receive the top-up:
o Children living with grandparents or relatives;
o Children whose households had moved since their registration in the CMP database, and
whose CMP accounts were still in the previous Soum.
FGDs with beneficiary communities also noted that it would be important to include children aged 6 and
7 as well, as this is the age at which children enter mandatory schooling and parents noted that they
require more attention and are more prone to illness at this age, particularly where they must leave the
family home to stay in dormitories or with relatives in order to attend school.
3.4.1 Lessons Learned: Pilot Coverage
The CMP database is not updated frequently enough for SRSP interventions. This might be addressed
through more frequent regular updates to the CMP database and the provision of additional resources
for Social Workers to carry out these updates, the introduction of a rapid updates campaign in Soums
where SRSP interventions are likely to take place or immediately before they take place, or the
introduction of a special rapid updates mechanism before the implementation of new SRSP interventions.

32
3.5 Effects of Covid-19 Pandemic
Mongolia took steps early to contain the spread of the Covid-19 virus, as well as to provide a package of
social protection interventions to households whose livelihoods were affected by the policies of closures
and movement restrictions, border closures, reduction of remittance, collapse of the price of cashmere,
etc. While the majority of these interventions were implemented after the pilot had ended, an additional
top-up of 10 000 MNT was paid into the CMP accounts of all children, nationally.
Some additional questions related to the effects of Covid on beneficiary households were added to the
April survey.
81.2% of households surveyed saw their expected incomes decline due to the fall of cashmere prices,
while 12% saw a reduction in their working hours or salary, and 9.2% were affected by the closure of
private businesses (Table 2).
Table 2: Covid-19 Effects on Household Income
Frequency % of responses
% of households
The price of cashmere has dropped, so have to wait for it to rise 457 74.2 81.2
Due to travel restrictions imposed by Government, can’t travel to my workplace (formal or informal) or engage in cross border trades
7 1.1 1.2
Private business closed due to COVID19 52 8.4 9.2
My employer has reduced working hours and my salary has been reduced
67 10.9 11.9
Workplace is closed or I have been made redundant
28 4.6 5.0
Other 5 0.8 0.9
TOTAL 616 100 109.4
The vast majority of households were also affected by rising product prices, increased cost of food for
children due to them being home rather than in school where they used to receive lunch, and increased
spending on healthcare services and products (Table 3).
Table 3: Increased Expenses due to Covid-19
Frequency % of response % of
households
Product prices gone up 591 36.3 90.2
Spending more on healthcare services and products 571 35.1 87.2
Increased expenses for the cost of food related to children
staying home due to school closure
447 27.5 68.2
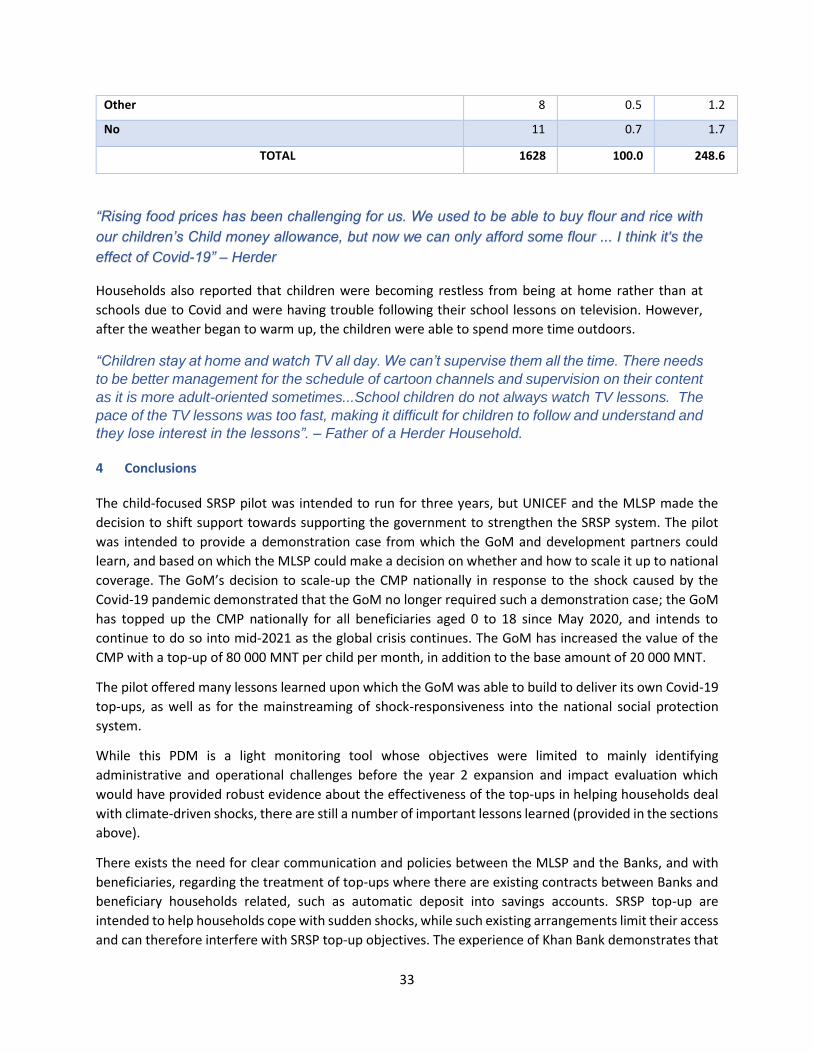
33
Other 8 0.5 1.2
No 11 0.7 1.7
TOTAL 1628 100.0 248.6
“Rising food prices has been challenging for us. We used to be able to buy flour and rice with
our children’s Child money allowance, but now we can only afford some flour ... I think it's the
effect of Covid-19” – Herder
Households also reported that children were becoming restless from being at home rather than at
schools due to Covid and were having trouble following their school lessons on television. However,
after the weather began to warm up, the children were able to spend more time outdoors.
“Children stay at home and watch TV all day. We can’t supervise them all the time. There needs
to be better management for the schedule of cartoon channels and supervision on their content
as it is more adult-oriented sometimes...School children do not always watch TV lessons. The
pace of the TV lessons was too fast, making it difficult for children to follow and understand and
they lose interest in the lessons”. – Father of a Herder Household.
4 Conclusions
The child-focused SRSP pilot was intended to run for three years, but UNICEF and the MLSP made the
decision to shift support towards supporting the government to strengthen the SRSP system. The pilot
was intended to provide a demonstration case from which the GoM and development partners could
learn, and based on which the MLSP could make a decision on whether and how to scale it up to national
coverage. The GoM’s decision to scale-up the CMP nationally in response to the shock caused by the
Covid-19 pandemic demonstrated that the GoM no longer required such a demonstration case; the GoM
has topped up the CMP nationally for all beneficiaries aged 0 to 18 since May 2020, and intends to
continue to do so into mid-2021 as the global crisis continues. The GoM has increased the value of the
CMP with a top-up of 80 000 MNT per child per month, in addition to the base amount of 20 000 MNT.
The pilot offered many lessons learned upon which the GoM was able to build to deliver its own Covid-19
top-ups, as well as for the mainstreaming of shock-responsiveness into the national social protection
system.
While this PDM is a light monitoring tool whose objectives were limited to mainly identifying
administrative and operational challenges before the year 2 expansion and impact evaluation which
would have provided robust evidence about the effectiveness of the top-ups in helping households deal
with climate-driven shocks, there are still a number of important lessons learned (provided in the sections
above).
There exists the need for clear communication and policies between the MLSP and the Banks, and with
beneficiaries, regarding the treatment of top-ups where there are existing contracts between Banks and
beneficiary households related, such as automatic deposit into savings accounts. SRSP top-up are
intended to help households cope with sudden shocks, while such existing arrangements limit their access
and can therefore interfere with SRSP top-up objectives. The experience of Khan Bank demonstrates that

34
the policy of not automatically depositing top-ups into savings is only effective from an SRSP standpoint
if this is communicated to beneficiaries in a timely manner.
Communications and messaging with beneficiaries and other stakeholders involved either directly or
indirectly in implementation, as well as with the wider community proved to be an important issue. There
is the need for the development of local information dissemination strategies which identify appropriate
mechanisms targeting the different needs and realities of Soum center versus rural households, and which
assigns clear responsibility to specific actors for dissemination to these different groups. This would likely
result in more timely accessing of SRSP cash by beneficiaries, as well as spending in line with program
objectives (see section 3.2.2, which discusses the effects messaging had on spending patterns).
Spending appears to have been influenced by messaging (see section 3.2.2), and timely provision of both
information about payment and payment itself are critical to helping households plan their spending in
order to avoid harmful coping strategies, therefore the need to improve and institutionalize information
dissemination strategy and mechanisms specifically for shock-responsive social protection interventions
is clear.
The lessons learned contained in this report will contribute towards UNICEF’s ongoing support for the
MLSP in the development of shock-responsive sections of the national social protection strategy and law,
database improvements, strengthening of M&E systems, etc.