Report on California Community Colleges Student...
42
Ohlone College RAZA Day Financial Aid Table. Photo Courtesy of Ohlone College. Report on California Community Colleges Student Financial Aid Programs California Community Colleges Chancellor’s Office Brice W. Harris, Chancellor 2011–12 2012–13
Transcript of Report on California Community Colleges Student...

Ohlone College RAZA Day Financial Aid Table. Photo Courtesy of Ohlone College.
Report on California Community Colleges Student Financial Aid Programs
California Community Colleges Chancellor’s OfficeBrice W. Harris, Chancellor
2011–122012–13


STATE OF CALIFORNIA
BRICE W. HARRIS, CHANCELLOR
CALIFORNIA COMMUNITY COLLEGES CHANCELLOR’S OFFICE 1102 Q STREET SACRAMENTO, CA 95811 (916) 322-4005 http://www.cccco.edu
March31,2016TheHonorableEdmundG.Brown,Jr.GovernorofCaliforniaStateCapitolSacramento,CA95814RE: ReportonCaliforniaCommunityCollegeStudentFinancialAidProgramsfor2011-12and2012-13DearGovernorBrown:IampleasedtopresenttoyoutheCaliforniaCommunityCollegesChancellor'sOfficereportonStudentFinancialAidProgramsfor2011-12and2012-13.Thenumberofcommunitycollegestudentswhoapplyforfinancialaidhassteadilyincreasedduringthepastdecade.Ourfinancialaidofficersthroughoutthestatearedoingaheroicjobastheystrivetomeetrecord-breakingdemandsforservicesontheircampuses.ThisreportdocumentstheexpendituresoftheBoardFinancialAssistanceProgram-StudentFinancialAidAdministrationfundsprovidedtoincreasestudentfinancialaidparticipationinallofourcolleges.Italsoincludesextensivedataonthenumbersandcharacteristicsofnewfinancialaidrecipientsandacomparisonofyears2011-12and2012-13withthebaselineyear2002-03performancemeasures.Wehaveincludedasasupplementtothisreporthighlightsofthestate’s“ICanAffordCollege”initiative,anongoingcampaignaimedtoraiseawarenessamongcurrentandprospectivestudentsabouttheavailabilityoffinancialaidopportunitiesatCalifornia’s113communitycolleges.Ifyouoryourstaffhavequestionsorcommentsregardingthisreport,pleasecontactDeputyChancellorErikSkinnerat(916)323-7007oreskinner@cccco.edu.Thankyouforyourinterestintheseprogramsandthestudentstheyserve.Sincerely,
BriceW.HarrisChancellor

CONNECT WITH US
WEBSITES
California Community Colleges CaliforniaCommunityColleges.cccco.edu
Student Success Scorecard scorecard.cccco.edu
Salarysurfer salarysurfer.cccco.edu
Associate Degree for Transfer adegreewithaguarantee.com
Priority Registration stepforward.cccco.edu
Workforce & Economic Development doingwhatmatters.cccco.edu
Financial Aid icanaffordcollege.com
SOCIAL MEDIA
California Community Colleges’ Facebook Page
facebook.com/CACommColleges
California Community Colleges’ I Can Afford College Page
facebook.com/icanaffordcollege
California Community Colleges’ Twitter Feed twitter.com/CalCommColleges
Workforce and Economic Development Twitter Feed twitter.com/WorkforceVan
I Can Afford College Twitter Feed twitter.com/ICanAfrdCollege
California Community Colleges’ You Tube Page youtube.com/CACommunityColleges
California Community Colleges’ Instagram Page instagram.com/CaliforniaCommunityColleges
I Can Afford College Instagram Pageinstagram.com/icanaffordcollege

5Report on California Community College Student Financial Aid Programs for
2011–12 and 2012–13California Community Colleges Chancellor’s Office
Table of ContentsEXECUTIVE SUMMARY
Introduction . . . . . . . . . . . . . . . . . . . . . . . . . . . .6
Methodology . . . . . . . . . . . . . . . . . . . . . . . . . . .7
Background . . . . . . . . . . . . . . . . . . . . . . . . . . . .8
Financial Aid Administrative Funding Sources . . . . . . . . . . . . . . . . . . . . . . . 11
Accurately Comparing Financial Aid Participation Rates . . . . . . . . . . . . . . . . . . 12
Allocation Formula for BFAP SFAA . . . . . . . . . . 12
How Colleges have Invested Funds to Increase Participation . . . . . . . . . . . . . . . . . . . 13
College Performance Indicators . . . . . . . . . . . . 18
In-Reach and Outreach Services . . . . . . . . . . . .22
Key Findings . . . . . . . . . . . . . . . . . . . . . . . . . . 34
Conclusions . . . . . . . . . . . . . . . . . . . . . . . . . . 34
SUPPLEMENTAL REPORT
“I Can Afford College” . . . . . . . . . . . . . . . . . . . 35
Report on California Community Colleges Student Financial Aid Programs for 2011–12 and 2012–13STUDENT FINANCIAL AID EXECUTIVE SUMMARY
The California Community Colleges is the nation’s largest system of higher education and serves more than 2.1 million students annually. The state’s 113 community colleges provide workforce training, teach basic math and English, and prepare students for transfer to four-year universities and colleges.
The Chancellor’s Office provides leadership, advocacy, and support under the direction of the California Com-munity Colleges Board of Governors. With the support of the Chancellor’s Office and the state legislature, com- munity colleges have greatly expanded financial aid services and successfully increased student financial aid funding.
Due to the Great Recession, community college en-rollments dropped dramatically between 2009–10 and 2012–13, eventually falling below 2002-03 levels. The data analyzed in this report are from that period of enrollment decline. The primary cause of these drops was a dramatic decrease in state funding, which forced colleges to reduce course offerings and as a result left hundreds of thousands of students without access to higher education. More recent data, beginning in 2014-15, show systemwide enrollment levels that are begin-ning to recover, though which are still far below pre-re-cession highs.
Despite declining enrollments, community colleges have continued to make tremendous strides in providing increased financial aid to students. In the 10 years since 2002–03, community college financial aid recipients have nearly doubled, from 600,000 to 1.1 million stu-dents, and financial aid dollars have more than tripled, from $895 million to more than $2.8 billion.
These increases are the direct result of the expanded financial aid services made possible by the introduction of added Board Financial Assistance Program-Student Financial Aid Administration (BFAP-SFAA) capaci-ty funds in 2003–04. The capacity funds have clearly served their intended purpose: to promote public awareness of financial aid and provide additional staff resources to increase financial aid and student access, particularly for low-income and disadvantaged students.

6Report on California Community College Student Financial Aid Programs for 2011–12 and 2012–13California Community Colleges Chancellor’s Office
Included in the 2012–13 Budget Act are two funding components for California community colleges: $34.2 million for students’ financial aid administration and $2.8 million for the statewide “I Can Afford College” financial aid awareness campaign. The funds were first provided in the 2003–04 Budget Act to support services and activities to help financially needy students manage the 2003–04 community college enrollment fee increase from $11 dollars to $18 per unit of enrollment.
The purpose of the funds is to enhance the capacity of community colleges to provide financial aid and sup-port services; thereby ensuring that potential students, particularly low-income and disadvantaged students, are not discouraged from attending college. To measure the effectiveness of the funding augmentation, the budget includes language that directs the Chancellor’s Office to submit an annual report to the governor and legisla-ture that compares the two most recent years with the 2002–03 base year regarding:
• Distribution and use of funds.• Types and frequency of outreach contacts.• Strategies employed to reach low-income and disad-
vantaged students.• Enrollment changes since the 2002–03 baseline year.• Changes in the number of financial aid applications,
Board of Governors (BOG) Fee Waivers, and federal Pell Grants.
The report also includes:
• A description of the method used to allocate funds.• A comparison of the 2011–12 and 2012–13 Student
Financial Assistance Programs performance data with that of 2002–03, the designated base-year for data comparisons.
• Program participation and funding levels, including demographic tables and exhibits.
• A summary of the challenges faced by financial aid offices for 2013–14.
• A summary of the “I Can Afford College” campaign efforts.
• Other external factors.
This document was delayed due to the transition of assigned staff and the implementation of new programs which require redirection of staff.
Introduction
In 2003–04, the California Legislature increased com-munity college fees from $11 to $18 per unit of en-rollment. This raised concerns that some students, especially those with limited financial means, might be discouraged from attending college. State legislators were particularly concerned that low-income and disad-vantaged students might be adversely affected by the fee increase.
In response to this concern, the Legislature redirect-ed $38 million in the California Community Colleges Chancellor’s Office budget to increase financial aid administrative capacity and outreach. The funds were intended to ensure that community colleges would have the capability to provide additional financial aid services and awards to students. The budget language designated $34.2 million of the $38 million to expand community colleges financial aid administrative capacity.
The $34.2 million portion was added to the com-munity colleges’ annual Board Financial Assistance Program-Student Financial Aid Administration (BFAP-SFAA) allocations. The other $3.8 million was designated for the statewide “I Can Afford College” financial aid awareness media campaign to promote public awareness and increase participation in financial aid programs. The $3.8 million designation was subse-quently reduced to $2.8 million in 2004–05, which low-ered the combined budget allocation from $38 million to $37 million.
The $37 million BFAP-SFAA budget augmentation has remained unchanged since 2004–05; however, student fees have since increased to $46 per unit of enrollment, a figure four times that of 2002–03.
The 2012–13 Budget Act combines the $34.2 capacity funding with the base funding for student financial aid administration, for a total of $50.8 million in funding for student financial aid administration. As noted earlier in this report, the funds have been designated for two primary purposes:
• To increase awareness and participation in student financial aid programs through direct contact with potential students, current students and their families.
7Report on California Community College Student Financial Aid Programs for
2011–12 and 2012–13California Community Colleges Chancellor’s Office
• To increase low-income and disadvantaged student participation in postsecondary education by provid-ing information access and application assistance, thereby expanding the number of funded financial aid awards.
During the 2012–13 academic year, California’s com-munity colleges conducted nearly 11,000 in-reach and outreach events, including more than 1,500 multilin-gual events. As a result of these events, more than 1.1 million community college students received financial aid awards. Nearly 600,000 of these students were new financial aid recipients. New award recipients affect not only the current year’s financial aid figures but also fu-ture growth figures by adding to the base of continuing financial aid recipients.
Outreach activities promote financial aid awareness, which, in turn, promotes the growth of financial aid applicants and program recipients. Without the addition of the BFAP-SFAA capacity funds, community colleges would not have been able to provide the current level of outreach activities nor the support services necessary to process the applications and awards that these activities generate.
The Budget Act of January 2014 continued the require-ment that the California Community Colleges Chan-cellor’s Office submit an annual report to the legislature that includes data that measures and compares the impact of outreach efforts on financial aid access and compares data from the two most recent years (2011–12 and 2012–13) with base-year data from 2002–03. As demonstrated by the information provided in this re-port, the increased administrative capacity of financial aid offices has yielded enormous benefits for community college students:
• Unduplicated financial aid recipients have increased by 86 percent.
• BOG Fee Waiver awards have increased by 86 percent.
• Pell Grant awards have increased by 105 percent.• Financial aid program funds have increased by
215 percent.
Pell Grant increases are particularly noteworthy, because Pell Grants are, by far, the largest source of financial aid dollars for community college students. Measured
against the 2002–03 base year, Pell Grant recipients have more than doubled, and Pell Grant award funds have nearly tripled. The funds derived from the federal Pell Grant program and other federal programs in 2012–13 added nearly $2 billion to California’s economy.
BFAP-SFAA funding has greatly reduced the impact of increased fees on low-income and disadvantaged students and families. The funds have made it possible for community colleges to make more students aware of financial aid programs and provide the supportive ser-vices necessary to effectively administer these programs.
Methodology
The Chancellor’s Office Management Information Sys-tem (COMIS) is the primary source of information for this report, which includes information on:
• student enrollments• student demographics• financial aid program awards• financial aid funds• matriculation
Annual BFAP-SFAA campus reporting forms and sur-veys serve as a supplemental source of data for each of the community colleges. Campus data are compiled and analyzed by the Chancellor’s Office to provide informa-tion on various community college financial aid func-tions and activities, including:
• BFAP-SFAA funding allocations• administrative expenditures• staffing• outreach• student support services• program participation
Another important source of data is the “I Can Afford College” campaign, which provides additional informa-tion and data regarding the use of funds for statewide financial aid awareness advertising, marketing, media relations and outreach activities.

8Report on California Community College Student Financial Aid Programs for 2011–12 and 2012–13California Community Colleges Chancellor’s Office
Background
Financial Aid Programs in California Community Colleges
The budget language for 2003–04 established the 2002–03 year as the base year for future-year financial aid data comparisons. In 2002–03, community colleges had provided 610,000 students with $895 million to cov-er students’ educational expenses. Financial aid funds derived from as many as 30 different programs.
During the drafting of the 2003–04 Budget Act, the legislature acknowledged that more community college students should be receiving more financial aid. The legislature also acknowledged that, without additional ad-ministrative funds, community colleges would be unable to provide the outreach and support services necessary to increase financial aid participation. With the introduction of the BFAP-SFAA administrative capacity funding, in 2003–04, financial aid program participation and finan-cial aid funding levels began a steady annual increase.
Table A shows an 86 percent increase in the number of unduplicated financial aid recipients, from 610,000 in 2002–03 to more than 1.1 million, in 2012–13. Table B
TABLE A : YEARLY COMPARISON OF UNDUPLICATED FINANCIAL AID RECIPIENTS
shows an even larger, 215 percent, increase in financial aid award disbursements, from $895 million in 2002–03 to more than $2.8 billion in 2013.
Annual budget reductions have led many community colleges to reduce course offerings for students. This, in turn, has led to a reduction in enrollments, which have dropped for each of the past four years.
TABLE B: DISTRIBUTION OF FINANCIAL AID DOLLARS BY PROGRAM FOR 2012–13
Enrollments and class offerings play a pivotal role in the effort to increase financial aid program participa-tion, especially the Pell Grant program. Enrollments

9Report on California Community College Student Financial Aid Programs for
2011–12 and 2012–13California Community Colleges Chancellor’s Office
TABLE C: COMPARISON OF BOG FEE WAIVERS AND PELL GRANTS
determine the pool of potential program participants; and class offerings determine the ability of students to establish Pell Grant eligibility. To qualify for participa-tion in the Pell Grant program, students must enroll in Pell-eligible programs and courses of study. Students who are unable to enroll in approved courses of study cannot qualify for Pell Grants or other federal finan-cial aid programs.
Table C provides a side-by-side comparison of the an-nual growth in BOG Fee Waiver and Pell Grant recip-ients. The funds awarded through these two programs comprise 83 percent of all community college finan-cial aid funds. BOG Fee Waivers continue to serve the greatest number of financial aid recipients, while Pell Grants continue to provide the greatest amount of financial aid funds. Both programs have increased dramatically over the past ten years.
In the years since 2002–03, BOG Fee Waiver recip-ients have grown by 514,000, and BOG Fee Waiver
funds have grown by $650 million. So there are now more than 1.1 million students receiving more than $752 million in BOG Fee Waivers. As the program has grown, BOG Fee Waivers have accounted for an increas-ing share of financial aid dollars. In 2002–03, BOG Fee Waivers provided only 11.5 percent of all financial aid dollars for California community college students. That figure has since grown to 27 percent.
BOG Fee Waiver growth is attributable to multiple factors:
• Expanded outreach efforts, which have heightened awareness of the availability of financial aid and have led to increased financial aid program participation.
• Fee costs for community college students have qua-drupled since 2002–03, from $11 per unit in 2002–03 to the current level of $46 per unit, which have boost-ed the annual demand for fee waivers.

10Report on California Community College Student Financial Aid Programs for 2011–12 and 2012–13California Community Colleges Chancellor’s Office
• The economic recession and resulting unemploy-ment, which have heightened the level of need for financial aid recipients and created greater eligibility for applicants with lower income and assets.
• Continual policy revisions by the federal govern-ment. One such policy revision, income and asset protection allowances, has resulted in both upward and downward variations in financial need for many students.
• Enhanced technology, which has streamlined the application and award process.
Despite the decline in community college enrollments, BOG Fee Waiver participation has held remarkably well. While enrollments have dropped by nearly 11 percent over the past two years, BOG Fee Waiver recipients have dropped by less than 2 percent. So, while the potential applicant pool has declined, the number of financial aid applicants has increased and the relative proportion of BOG fee waiver recipients has increased, allowing more students to be considered for financial aid.
Pell Grants provide 56 percent of all community college financial aid dollars, which is more than double that of the next largest financial aid program (BOG Fee Waiver Program). Pell Grant program participation has risen
have more than doubled, and Pell Grant award dollars have nearly tripled. With the exception of communi-ty college fee increases, the factors attributable to Pell Grant growth are the same as those for BOG Fee Waiver growth.
The introduction of the BFAP-SFAA capacity funds has produced amazing gains in the number of BOG Fee Waiver and Pell Grant participants, which exemplifies the community colleges’ successful use of the BFAP-SFAA funds.
Decrease in Federal Family Education Loans (FFEL)
After several years of rapid growth, Federal Family Ed-ucation Loan (FFEL) borrowing has begun to decrease. In just the last year, federal loan borrowing has dropped by nearly $49 million dollars (14 percent). Nevertheless, federal loans still serve as an important financial aid resource and remain the third largest source of financial aid funds for community college students. The $290 million loan total for 2012–13 comprises 10 percent of all community college financial aid dollars.
The drop in student borrowing may appear to be a positive trend; however, it is actually a cause for
TABLE D: COMPARISON OF FEDERAL EDUCATIONAL LOANS
from 240,000 students receiving $534 million in 2002–03, to 491,000 students receiving $1.6 billion dollars in 2012–13. In summary, Pell Grant program participants
concern. The borrowing drop is not the result of less student interest in borrowing, but rather the result of many campuses withdrawing from FFEL Program

11Report on California Community College Student Financial Aid Programs for
2011–12 and 2012–13California Community Colleges Chancellor’s Office
participation. Nearly 18 percent of the 113 commu-nity colleges have withdrawn from participation in the FFEL Program, many within the past two years.
Most community colleges have withdrawn from the program out of concern that they might be unable to meet the federal cohort default rate standards and thereby become ineligible for other federal aid funds. To avoid this risk and maintain eligibility for other federal programs, particularly Pell Grants, colleges have chosen to withdraw from participation in the FFEL Program.
Absent alternative sources of aid, many of the students attending colleges that do not participate in the FFEL Program may be left with little or no ability to success-fully continue their studies.
Until recently, the federal government had administered two loan programs for higher education students: the Federal Family Education Loan (FFEL) Program funded through private lenders, and the Direct Loan Program, funded through the U.S. Department of Education. Beginning in 2010–11, the federal government required that all student loans be funded through the Depart-ment of Education. This transition accounts for the dra-matic shifts seen in Table D. The name, Direct Loans, is no longer used by the Department of Education. All federal loans are now part of the FFEL Program. The term “Direct Loans” in the above table is used only to better illustrate the effect of the rapid transition to a single program.
Cal Grants
Cal Grants comprise a relatively small portion of financial aid funds for community college students (3 percent). Table B, shown earlier in this report, vivid-ly illustrates the disparity in the relative proportion of program funds awarded to community college students. The majority of community college financial aid funds come from Pell Grants (56 percent), BOG Fee Waivers (27 percent), and federal educational loans (10 percent). These three programs provide more than 90 percent of financial aid funds for community college students.
Community colleges are open-enrollment institutions, which allow students to apply to a variety of programs and courses of study throughout the academic year. This is an essential part of encouraging low-income and disadvantaged students to attend college. Under the
open-enrollment structure, community college students are better served by programs like the Pell Grant, BOG Fee Waiver and federal loan programs, which allow students to apply for and receive awards throughout the academic year.
Because the Cal Grant program has limited funding and a relatively restrictive application process, Cal Grants reach only a small portion of potentially eligible stu-dents. If the Cal Grant program were to allow a more flexible application process that would allow students to apply for aid throughout the year, far more community college students would benefit from the program.
Financial Aid Administrative Funding Sources
The two primary funding sources for administering community college financial aid programs are BFAP-SFAA funds and local discretionary funds. The BFAP-SFAA funds are categorical funds, which are budgeted directly by the state to administer the BOG Fee Waiver program and promote student participation in financial aid programs. Local discretionary funds are budgeted by individual community colleges and community college districts from their general funds apportionments.
In 2003–04, the California Legislature augmented the BFAP-SFAA funding to enhance community colleges’ ability to provide financial aid outreach and support services. The additional funds were meant to offset any negative impact the 2003–04 fee increase might have on community college students. The legislature did not want the increase to discourage or prevent students from attending community colleges. Subsequent fee increases have made these funds even more critical to providing financial aid outreach and services.
Community college administrative expenditures for fi-nancial aid programs and services have risen from $97.7 million in 2003–04 to $115.8 million (19 percent) in 2012–13. Financial aid expenditures for 2003–04 includ-ed $42.4 million in BFAP-SFAA funds and $55.3 mil-lion in local discretionary funds. BFAP-SFAA funding expenditures have grown by $8.4 million since 2003–04 and now total $50.8 million. Local expenditures have grown by $9.7 million and now total $65 million.
The Pell Grant and Federal Campus-Based programs (Supplemental Educational Opportunity Grant, Federal Work Study and Perkins Loans) provide an adminis-
12Report on California Community College Student Financial Aid Programs for 2011–12 and 2012–13California Community Colleges Chancellor’s Office
trative allowance for participating financial aid offices. These allowances are considered part of community colleges’ local discretionary funds.
The Pell Grant administrative allowance for 2012–13 was $2.5 million, and the Federal Campus-Based Programs allowance was $1.7 million. It should be noted, however, that these allowances provide relatively little compensation to community colleges, since they cover only 3.6 percent of student financial aid adminis-trative costs.
Cal Grant programs do not provide program adminis-trative funds.
Accurately Comparing Financial Aid Participation Rates
To evaluate the effectiveness of the BFAP-SFAA funding augmentation, the Chancellor’s Office has developed a set of benchmark performance measures that measure and compare program participation rates. The measures include the annual credit-enrollment head count as the denominator of potentially eligible populations attend-ing community colleges who might apply for and receive one or more types of financial aid in a given year.
There are two reasons for this decision:
• Enrollment fees are only assessed on credit course-work, and students participating in the BOG Fee Waiver program can only have their fees waived for credit coursework
• In nearly all cases, students must be enrolled in an eligible credit-enrollment program to qualify for not only the Pell Grant program and other federal pro-grams but also the Cal Grant program.
Ideally the California Community Colleges system might also compare its performance data with performance data of other systems. However, unlike other segments of higher education, community colleges serve as open enrollment institutions, rendering comparisons of their defined service populations to other segments incongruous.
The structure and reporting cycle of the Chancellor’s Office data system do not lend themselves well to direct comparisons. Internal measures for both enrollment and financial aid program participation include aggregated
annual data for all terms in an academic year, which may include any of the following:
• Summer as a “leading” term in an academic year.*• Fall term (all semester and quarter schools).• Winter term (for quarters and semester
inter-sessions)• Spring term (all semester and quarter schools).• Summer as a “trailing” term in an academic year.*
*for most financial aid programs, colleges have the option of using the summer term as a leading term or trailing term.
Allocation Formula for BFAP-SFAA
The Budget Act establishe the BFAP-SFAA funding level as part of the annual state budget. The $34.2 million BFAP-SFAA capacity funding level that was established in 2003–04 has remained part of California Commu-nity Colleges annual budget. As noted earlier in this report, the primary purpose of the funds is to expand the capacity of local community colleges to provide the required outreach and financial aid services to ensure the continued enrollment and program participation of low-income and disadvantaged students.
The Chancellor’s Office distributes the $34.2 million BFAP-SFAA funds in accordance with budget guide-lines. To ensure that small or newly established colleges are fairly funded, each college is given a minimum allo-cation of $50,000. The 113 colleges (in the 2011–12 and 2012–13 academic years) and one college district were initially allotted a minimum of $50,000, for a total $5.65 million. The remaining $28.55 million was distributed among the colleges on the basis of a “fair share” formula using two equally-weighted factors:
• The number of the college’s full-time equivalent stu-dents (FTES) as a percentage of total system FTES.
• The college’s BOG Fee Waiver recipients as a percent-age of total system BOG Fee Waiver recipients.
All of the funds are intended for local expenditure at designated local colleges and are subject to the categor-ical restrictions identified in the Budget Act provisional language.
13Report on California Community College Student Financial Aid Programs for
2011–12 and 2012–13California Community Colleges Chancellor’s Office
As part of the same effort to expand financial aid ad-ministrative capacity and ensure access and participa-tion by underserved low-income and disadvantaged students, the Budget Act also distributes an additional $2.8 million to fund the “I Can Afford College” financial aid awareness campaign.
Local Maintenance of Effort Requirements
One of the provisions of the 2012–13 Budget Act states: “Funds allocated to a community college district for financial aid personnel, outreach, determination of financial need, and delivery of student financial aid services shall supplement, and shall not supplant, the level of funds allocated for the administration of student financial aid programs during the 2001–02 or 2006–07 fiscal year, whichever is greater.”
To comply with this provision, the Chancellor’s Office has established a maintenance-of-effort (MOE) require-ment for each college. Any college reporting non-com-pliance with the MOE requirements is subject to a fiscal penalty. Colleges wishing to appeal these penalties must provide a detailed explanation of the circumstances and a corrective action plan to rectify the local funding MOE shortfall.
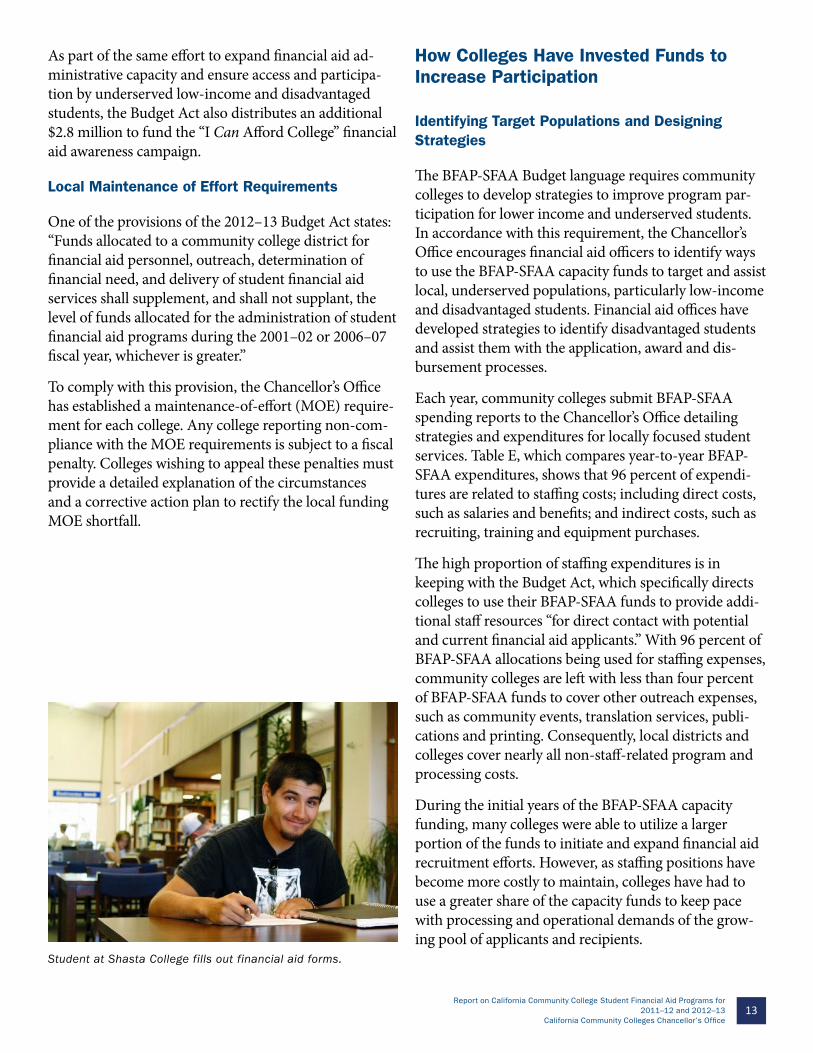
Student at Shasta College fills out financial aid forms.
How Colleges Have Invested Funds to Increase Participation
Identifying Target Populations and Designing Strategies
The BFAP-SFAA Budget language requires community colleges to develop strategies to improve program par-ticipation for lower income and underserved students. In accordance with this requirement, the Chancellor’s Office encourages financial aid officers to identify ways to use the BFAP-SFAA capacity funds to target and assist local, underserved populations, particularly low-income and disadvantaged students. Financial aid offices have developed strategies to identify disadvantaged students and assist them with the application, award and dis-bursement processes.
Each year, community colleges submit BFAP-SFAA spending reports to the Chancellor’s Office detailing strategies and expenditures for locally focused student services. Table E, which compares year-to-year BFAP-SFAA expenditures, shows that 96 percent of expendi-tures are related to staffing costs; including direct costs, such as salaries and benefits; and indirect costs, such as recruiting, training and equipment purchases.
The high proportion of staffing expenditures is in keeping with the Budget Act, which specifically directs colleges to use their BFAP-SFAA funds to provide addi-tional staff resources “for direct contact with potential and current financial aid applicants.” With 96 percent of BFAP-SFAA allocations being used for staffing expenses, community colleges are left with less than four percent of BFAP-SFAA funds to cover other outreach expenses, such as community events, translation services, publi-cations and printing. Consequently, local districts and colleges cover nearly all non-staff-related program and processing costs.
During the initial years of the BFAP-SFAA capacity funding, many colleges were able to utilize a larger portion of the funds to initiate and expand financial aid recruitment efforts. However, as staffing positions have become more costly to maintain, colleges have had to use a greater share of the capacity funds to keep pace with processing and operational demands of the grow-ing pool of applicants and recipients.

14Report on California Community College Student Financial Aid Programs for 2011–12 and 2012–13California Community Colleges Chancellor’s Office
TABLE E: COMPARISON OF BFAP-SFAA EXPENDITURES
Year Expenses Relat-ed to Staff
% Expenses Related to Outreach
% Other Expenses
% Total BFAP-SFAA Expenses
%
2003-04 $34,986,604 82.6% $6,946,493 16.4% $423,567 1.0% $42,356,664 100.0%
2004-05 $36,016,358 80.8% $8,246,319 18.5% $312,023 0.7% $44,574,700 100.0%
2005-06 $38,465,011 88.5% $4,770,079 11.0% $247,853 0.6% $43,482,943 100.0%
2006-07 $39,360,936 89.2% $4,640,559 10.5% $110,279 0.2% $44,111,774 100.0%
2007-08 $40,996,842 92.4% $3,233,791 7.3% $128,642 0.3% $44,359,275 100.0%
2008-09 $41,486,256 94.2% $2,480,803 5.6% $96,941 0.2% $44,064,000 100.0%
2009-10 $43,403,606 96.0% $1,736,868 3.8% $90,462 0.2% $45,230,936 100.0%
2010-11 $43,732,496 95.8% $1,853,187 4.1% $59,339 0.1% $45,645,022 100.0%
2011-12 $44,970,637 96.4% $1,492,685 3.2% $204,204 0.4% $46,667,526 100.0%
2012-13 $48,689,288 95.8% $1,850,288 3.6% $307,951 0.6% $50,847,527 100.0%
Table E provides a comparison of BFAP-SFAA expenditures beginning in 2003–04.
Staffing
The BFAP-SFAA spending reports show that staffing ex-penditures initially grew from 82.6 percent in 2003–04 (the first year of the added BFAP-SFAA capacity funds), to 96.0 percent in 2009–10. Thereafter, staff expendi-tures have remained at or about the 96 percent level. As a result of these expenditures, financial aid applicants and recipients have increased, while staffing expendi-tures have reached a plateau, beyond which there have been no additional funds to match the growth in pro-gram applications and participants.
Multi-Language Materials and Events Reach Hard to Serve Populations
Students from bilingual families represent a large portion of students entering California’s community colleges. California’s Department of Education reports that approximately 43.1 percent of students attending California’s K-12 public schools speak a language other than English in their homes. Because bilingual students and parents are among the most difficult populations to reach, community colleges have made multi-language financial aid information and services a critical part of
their outreach efforts. In 2012–13, college staff presented more than 1,500 multi-lingual events, serving more than 82,000 students and parents.
Many colleges use translators and translation services to create multi-language materials and publications and deliver presentations to limited English-speak-ing students and parents. Bilingual staff and student workers organize group and one-on-one activities and events targeted at limited-English-speaking populations including:
• American Sign Language
• Arabic• Armenian• Assyrian• Cambodian• Chinese
• Farsi• Hindi• Hmong• Indonesian• Korean• Mandarin• Mongolian
• Punjabi• Russian• Spanish• Tagalog• Ukrainian• Vietnamese
The “I Can Afford College” campaign develops and maintains translated materials, including a fully bilin-gual (English/Spanish) website, for reference and subse-quent access by community colleges.

15Report on California Community College Student Financial Aid Programs for
2011–12 and 2012–13California Community Colleges Chancellor’s Office
Targeted Outreach Aimed at Low-income and Disadvantaged Students
Community colleges use the BFAP-SFAA capacity funding to execute a number of strategies to identify and better serve low-income and disadvantaged student populations in their local communities. Some of these strategies are discussed later in this report. To supple-ment local community college efforts in identifying and serving students, the “I Can Afford College” campaign engages specifically targeted populations through strategic advertising, marketing, media relations and outreach efforts.
Financial aid outreach is critical to promoting financial aid program participation, which, in turn, is critical to promoting college access and success. Without financial aid, many students, particularly low-income and disad-vantaged students, would be unable to attend college; and those who do attend would be less likely to persist and succeed in their academic studies.
Because financial aid plays such a vital role in student access, it serves as an important partner in the Califor-nia Community Colleges’ Student Success and Support Program. Outreach may initially help students apply for and receive financial aid, but academic success ensures that students continue to receive that aid.
Most financial aid programs require students to main-tain satisfactory academic progress (SAP) to contin-ue receiving program funds. Consequently, students receiving financial aid need all the support they can get to maintain their academic progress. The Student Success and Support Program offers core services such as assessment, college orientation, academic counseling, follow-up services and career goal guidance, and thereby enhances students’ ability to meet their SAP requirements.
Mentoring Relationships with High Schools to Increase Awareness of Financial Aid
Local high schools play a critical role in educating stu-dents and parents about college financial aid programs and services. To support and enhance the high schools’ outreach efforts, most community college financial aid offices maintain regular contact with local high school teachers, counselors and advisers. As part of their annu-
al outreach preparations, colleges also provide in-service training and workshops for high school staff to improve their understanding of campus financial aid programs and update staff on program changes. These interactions have created longstanding, collaborative partnerships with high school communities.
Expanded Outreach Targets Underserved High School Students and Parents
Community college financial aid staff and outreach staff regularly participate in college, high school and commu-nity financial aid outreach training events throughout California. The California Community Colleges partici-pates in the California Student Aid Commission’s “California Cash for College” program to increase awareness of the March 2 Cal Grant Entitlement dead-line. Outreach events also include workshops and related activities that target alternative/continuation high school students and parents.
Like many other state and local financial aid programs, the Cal Grant program has adopted the Free Applica-tion for Federal Student Aid (FAFSA) for its program applicants. The free application simplifies the financial aid process for students by allowing them to file a single application for not only federal financial aid programs but also other state and local programs, like the Cal Grant program. This is helpful to underserved students; however, it does create some confusion for those stu-dents who choose to file a single application for multiple programs.
Community college students can actually apply for the BOG Fee Waiver and federal financial aid programs throughout the academic year. Cal Grants, however, have an earlier deadline of March 2. Even though the March 2 deadline is well-publicized, many potential community college students lack the foresight and guidance to decide whether they even want to attend a community college by March 2. Worse yet, many stu-dents who are aware of the March 2 deadline mistakenly assume that if they have missed this deadline, they have also missed the opportunity to apply for any other finan-cial aid.
To help those who miss the March 2 deadline, commu-nity college students are given a second opportunity to apply for a Cal Grant by September 2. To ensure that
16Report on California Community College Student Financial Aid Programs for 2011–12 and 2012–13California Community Colleges Chancellor’s Office
these students understand they can still apply for finan-cial aid after March 2, community colleges participate in a spring outreach effort known as Financial Aid Aware-ness Month. The event is publicized through BFAP-SFAA’s “I Can Afford College” spring media campaign.
Community Outreach Connects to Young Adult and Adult Populations
As noted previously, the annual budget act directs col-leges to use their capacity funds to target low-income and disadvantaged students by providing additional staff resources to increase financial aid participation and access to postsecondary education. Included in colleges’ outreach plans are special outreach efforts to target spe-cific populations, such as veterans, foster youth, trans-fer students and students who may encounter unique educational access needs.
These efforts complement local student equity plans and bolster the California Community Colleges’ Student Success and Support Program (SSSP), which is designed to close gaps in access and success for disadvantaged, underrepresented students. To reach hard-to-serve pop-ulations, community colleges partner with local com-munity and faith-based organizations and offer FAFSA applicant workshops to these organizations. Colleges also post multi-media ads and host information stations at shopping centers and community events. They also offer pre-developed presentations and collateral mate-rials for local groups and organizations to distribute or use for their own presentations to their constituents.
The “I Can Afford College” campaign undertakes mar-keting and outreach activities throughout the year to encourage both high school and adult populations to attend college and apply for financial aid. Financial aid offices provide additional activities and support services, including one-on-one application assistance and special guidance and assistance to limited English speaking populations in more than 19 different languages.
To reach foster youth, each college has identified a Fos-ter Youth Success Initiative liaison to serve as a point of contact for issues of unique concern and to help them access financial aid and other student and academic support services.
Integration of Student Organizations in Outreach and In-Reach Efforts
A sometimes overlooked outreach partnership is that with the students themselves. Student organizations and governmental bodies play an active role in community college outreach and in-reach initiatives. They co-host financial aid events, assist in creating campus/student awareness and actively encourage students to participate in financial aid programs.
Individual students also play an important role in fi-nancial aid in-reach and outreach. Students frequently serve as the first financial aid information source for other students or acquaintances by informing them about their own financial aid and referring them to the campus financial aid offices for additional information and service.
Student workers play an even greater role in outreach and in-reach activities and offer many benefits to both the colleges and the students. Student workers enhance financial aid outreach efforts in many unique ways:
• Providing supplemental staff resources through on-campus work-study programs to better serve the needs of prospective financial aid applicants and recipients.
• Serving as bilingual interpreters for financial aid of-fices and assisting limited-English-speaking students and families with the completion of financial aid application forms.
• Attending on-campus classes and creating awareness and encouragement to other classmates.
• Serving as peer advisers, who offer prospective stu-dents a valuable student-based perspective on campus life and campus support systems.
College In-Reach and Service Improvements
For students already attending community colleges, campuses provide in-reach activities as part of financial aid awareness for on-campus students. In-reach activi-ties target students who may be eligible for financial aid but are either unaware of its availability or are intimidat-ed by the application and verification processes.

17Report on California Community College Student Financial Aid Programs for
2011–12 and 2012–13California Community Colleges Chancellor’s Office
With the help of BFAP-SFAA capacity funds, colleges have been able to develop and initiate many in-reach activities. These activities include:
• Distributing posters, announcements, and flyers.• Setting up screens, banners, and kiosks on campuses.• Placing ads in college and community newspapers,
handbooks, class schedules and catalogs.• Offering open-house events dedicated to financial aid
information and application materials.• Going directly into classrooms to inform students of
financial programs and services.
Disadvantaged and low-income students require a great deal of focus, since many of these students lack the pa-rental and community support to help them understand and meet financial aid program requirements. To better serve these students, community colleges have devel-oped and shared numerous in-reach strategies with their colleagues. Some of these strategies include:
• Developing time-sensitive, campaign calendars to reach out to students at critical phases of the finan-cial aid application process, such as application filing dates and deadline dates.
• Creating well-publicized, on-campus events that cov-er topics such as financial aid awareness, application completion requirements and maintaining satisfacto-ry academic progress.
• Setting up dedicated computer labs with trained staff to allow students to check e-mail, enroll in classes, ac-cess program information and apply for financial aid.
• Posting flyers at on- and off-campus locations to inform students of upcoming FAFSA workshops and financial aid opportunities and deadlines.
• Assigning free campus e-mail addresses for all stu-dents, which allows them to send and receive infor-mation regarding programs and services.
• Setting up specially targeted workshops for veterans, foster youth, disabled students and other specific student groups.
• Posting financial aid ads on campus websites and in campus publications, such as student handbooks and class schedules.
• Utilizing media that are especially popular with stu-dents, such as Facebook, Instagram and Twitter.
• Publishing brochures and materials (some in multiple languages) to help students and parents better under-stand program benefits and requirements.
• Maintaining telephone banks or other electronic communications systems to quickly communicate with students regarding various financial aid matters.
• Providing campus-based websites that allow students to check their application status and learn about cam-pus financial aid programs and financial aid training opportunities.
Some campuses have developed very unique networks with community organizations that work with specifi-cally targeted populations. For example, one Bay Area campus built a network of organizations and associa-tions to reach Native American students. Among these groups were United Indian Nations, the American Indian Child Resource Center and the Intertribal Friendship House.
In-Reach to Other On-Campus Support Programs
Financial aid staff frequently partner with other on-campus student services programs to reach stu-dents who have already been shown to require spe-cialized services. This brings financial staff into direct contact with more students, many of whom face very unique challenges. On-campus programs, such as CalWORKs, DSPS, EOPS/CARE, and the Foster Youth Success Initiative, share common goals with financial aid programs. Transfer centers, and veterans’ centers also share common goals. Collaborative relationships provide a more efficient way of accessing targeted special-needs, low-income, disadvantaged and under-served students.
Many financial aid administrators work with instruc-tors and counselors to arrange group presentations or in-class presentations along with helpful information and materials. This is especially beneficial for students who are uncomfortable with asking for assistance, but when given an opportunity to hear directly from financial aid staff, will take the next step and visit the financial aid office.

18Report on California Community College Student Financial Aid Programs for 2011–12 and 2012–13California Community Colleges Chancellor’s Office
College Performance Indicators
Established Benchmark Performance Indicators
Under the provisions of the State Budget Act, the Chancellor’s Office is required to report the extent to which community colleges and districts are successful in increasing the number of students accessing finan-cial aid, particularly Pell Grant awards. To meet this requirement, the Chancellor’s Office has established several primary performance indicators to monitor and measure annual performance resulting from the BFAP-SFAA capacity and participation funding. These include both Pell Grants and BOG Fee Waivers.
The Pell Grant program, which is the largest single source of community college financial aid funds, is a federally funded program that provides financial aid funds directly to students. To qualify for Pell Grants, students must be enrolled in an eligible program leading to a degree, certificate or transfer.
Performance indicators for the Pell Grant program include:
• The number of annual unduplicated headcount credit enrollment receiving Pell Grants.
• The percent of annual unduplicated headcount credit enrollment receiving Pell Grants.
• The dollar value of annual award payments for Pell Grants.
The BOG Fee Waiver program, which serves the largest number of community college students, is the largest state-funded financial aid program for community college students. The program waives enrollment fees for students who demonstrate financial need and are enrolled in credit coursework. Performance indicators include:
• The number of unduplicated headcount credit enroll-ment receiving a BOG Fee Waiver.
• The percent of unduplicated headcount credit enroll-ment receiving a BOG Fee Waiver.
• The dollar value of annual award payments for BOG Fee Waivers.
The Chancellor’s Office encourages colleges to establish local performance goals and objectives in support of these statewide performance measures.
TABLE F: COMPARISON OF BOG FEE WAIVERS AND PELL GRANTS
Year Credit Enrollment
Number of BOG Fee Waivers
Number of Pell Grants
Dollar Value of Pell Grants
Dollar Value of All Aid Programs1
2002-03 2,690,594 597,286 239,925 $533,720,693 $895,275,669 2003-04 2,453,486 639,105 246,093 $566,248,344 $1,018,060,333 2004-05 2,439,443 699,015 259,958 $605,956,126 $1,170,057,941 2005-06 2,471,501 716,796 254,603 $589,892,151 $1,170,094,754 2006-07 2,529,893 715,516 247,143 $573,914,323 $1,132,521,342 2007-08 2,687,314 761,968 270,098 $668,170,200 $1,242,937,640 2008-09 2,816,261 870,318 321,066 $881,680,875 $1,553,328,885 2009-10 2,675,379 1,023,645 418,775 $1,356,231,619 $2,228,378,885 2010-11 2,551,209 1,130,845 491,577 $1,623,367,005 $2,546,557,910 2011-12 2,363,332 1,095,064 517,391 $1,649,977,650 $2,753,827,216 2012-13 2,273,284 1,111,679 491,487 $1,591,237,016 $2,823,435,938
10 year +/- -417,310 514,393 251,562 $1,057,516,323 $1,928,160,26910 year % +/- -15.5% 86.1% 104.9% 198.1% 215.4%
1 All aid programs include BOGFW, Pell and all other aid programs

19Report on California Community College Student Financial Aid Programs for
2011–12 and 2012–13California Community Colleges Chancellor’s Office
A screen image from the I Can Afford College website.
California Community Colleges Performance Relative to Benchmarks
Tables F and G compare systemwide performance based on established indicators.
Table F compares credit enrollment headcounts; the number and dollar value of BOG Fee Waivers and Pell Grants; and the combined dollar value of all financial aid awards for the years 2002–03 through 2012–13.
Comparisons to the 2002–03 base year data in Table F show:
• Credit enrollments have declined for the fourth consecutive year, for an overall decline of more than a half million students.
• BOG Fee Waivers have increased by more than 500,000 (86 percent), and BOG Fee Waiver funding has increased by more than $650 million (633 percent).
• Pell Grants have increased by more than 251,000 (105 percent), and Pell award dollars have increased by more than $1 billion (198 percent).
• Overall, financial aid funding has increased by nearly $2 billion (215 percent).
Table G compares the percentage of credit-enrolled stu-dents receiving BOG Fee Waivers and Pell Grants from 2002–03 through 2012–13. BOG Fee Waiver recipients have increased from 22.2 percent of credit enrollments to 48.9 percent, and Pell Grant recipients have increased from 8.9 percent of credit enrollments to 21.6 percent.
TABLE G: COMPARISON OF BOG FEE WAIVERS AND PELL GRANTS AS A PERCENTAGE OF CREDIT ENROLLMENT
Year Credit Enrollment
Number of BOG Fee Waivers
Number of Pell Grants
Credit Enroll-ment (+/-) %
BOG Fee Waivers as
Percentage of Credit
Enrollment
Pell Grants as Percentage of
Credit Enrollment
2002-03 2,690,594 597,286 239,925 22.2% 8.9%2003-04 2,453,486 639,105 246,093 -8.8% 26.0% 10.0%2004-05 2,439,443 699,015 259,958 -0.6% 28.7% 10.7%
2005-06 2,471,501 716,796 254,603 1.3% 29.0% 10.3%2006-07 2,529,893 715,516 247,143 2.4% 28.3% 9.8%2007-08 2,687,314 761,968 270,098 6.2% 28.4% 10.1%2008-09 2,816,261 870,318 321,066 4.8% 30.9% 11.4%2009-10 2,675,379 1,023,645 418,775 -5.0% 38.3% 15.7%2010-11 2,551,209 1,130,845 491,577 -4.6% 44.3% 19.3%2011-12 2,363,332 1,095,064 517,391 -7.4% 46.3% 21.9%2012-13 2,273,284 1,111,679 491,487 -3.8% 48.9% 21.6%
10 year +/- -15,215 514,393 251,562

20Report on California Community College Student Financial Aid Programs for 2011–12 and 2012–13California Community Colleges Chancellor’s Office
Pell Grant and BOG Fee Waivers as a Percentage of Full-Time Credit-Enrolled Students
The comparison of BOG Fee Waivers and Pell Grants as a percentage of full-time enrollment is a critical perfor-mance indicator. Studies show that full-time enrollment and financial aid greatly assist students with both per-sistence and transfer.
Table H compares full-time enrollment and financial aid participation for full-time students in the BOG Fee Waiver and Pell Grant programs. The table shows that the percentage of full-time students receiving Pell Grant is more than double that of part-time students. (See Table G for comparison.)
TABLE H: COMPARISON OF BOG FEE WAIVERS AND PELL GRANTS AS A PERCENTAGE OF FULL-TIME CREDIT ENROLLMENT
Year Total Full-Time Students
Number of Full-Time BOG Fee
Waiver Recipients
% of Full-Time BOG Fee Waiver
Recipients
Number of Full-Time Pell Grant
Recipients
% of Full-Time Pell Grant Recipients
2002-03 343,711 159,964 46.5% 108,521 31.6%2003-04 338,364 164,803 48.7% 109,353 32.3%2004-05 345,684 178,263 51.6% 114,466 33.1%2005-06 348,803 180,477 51.7% 113,514 32.5%2006-07 352,575 176,796 50.1% 109,951 31.2%2007-08 353,007 176,929 50.1% 110,017 31.2%2008-09 409,600 212,323 51.8% 136,771 33.4%2009-10 424,142 241,691 57.0% 168,813 39.8%2010-11 414,818 259,026 62.4% 191,634 46.2%2011-12 389,021 258,374 66.4% 190,382 48.9%2012-13 370,053 253,574 68.5% 179,256 48.4%
10 year +/- 26,342 93,610 70,73510 year % +/- 7.7% 58.5% 65.2%
The percentage of full-time BOG Fee Waiver recipients has increased from 46.5 percent to 68.5 percent since the 2002-03.
Full-time Pell Grant recipients have risen from 31.6 percent to 48.4 percent. This is a reflection of both in-creased outreach efforts and the growing financial need of community college students.
The increased number of full-time Pell Grants has brought the participation rate of California’s full-time
community college students into closer alignment with the national participation rate. The National Center for Educational Statistics reports a national participation rate of 47 percent for all colleges and a 51 percent partic-ipation rate for two-year public colleges.
Unduplicated Student Financial Aid Program Participation
In addition to Pell Grants and BOG Fee Waivers, the unduplicated count for community college financial aid recipients serves as a key component in measuring the impact of the BFAP-SFAA capacity increase. Com-munity college financial aid recipients have risen from 610,000 to 1.13 million since 2002–03. The 86 percent
rise in financial aid recipients and 215 percent rise in financial aid dollars demonstrate the enormous bene-fit the state derives from its investment in community colleges.
Table I.1 compares the total number of unduplicated students served by financial aid programs for the years 2002–03 through 2012–13.

21Report on California Community College Student Financial Aid Programs for
2011–12 and 2012–13California Community Colleges Chancellor’s Office
TABLE I.1: COMPARISON OF UNDUPLICATED FINANCIAL AID RECIPIENTS
Year Unduplicated Financial Aid Recipients
Yearly Change in Number of Recipients
Percent Change
2002-03 610,112 n/a n/a2003-04 652,641 42,529 7.0%2004-05 714,004 61,363 9.4%2005-06 732,362 18,358 2.6%2006-07 732,321 -41 0.0%2007-08 781,819 49,498 6.8%2008-09 891,984 110,165 14.1%2009-10 1,045,112 153,128 14.7%2010-11 1,152,037 106,925 9.3%2011-12 1,119,881 -32,156 -2.9%2012-13 1,134,796 14,915 1.3%
Cumulative Change 524,684 86.0%
A comparison of the data in Table I.1 shows that, de-spite the decline in enrollments, there are more than a half million additional students receiving financial aid in 2012–13 than there were in 2002–03.
Table I.2 compares the number of unduplicated finan-cial aid recipients by selected age groups for 2002–03
with those of 2011–12, and 2012–13. Although both age groups show significant growth, the lower growth of recipients in the 30-and-over age group stems from lower enrollment levels and lower calculated need for students in this age group.
TABLE I.2: COMPARISON OF AGE FOR UNDUPLICATED FINANCIAL AID RECIPIENTS FOR 2011–12 AND 2012–13 WITH THE BASE YEAR
Year 18 through 29 30 and Over2002-03 432,954 169,7902011-12 837,109 278,0682012-13 857,780 272,518
Change from Base Year 424,826 102,778Percent Change 98.1% 60.6%
Table I.3 compares the ethnic distribution figures for 2002–03 financial aid recipients for 2002–03 with those of 2011–12 and 2012–13.
TABLE I.3: COMPARISON OF ETHNICITY FOR UNDUPLICATED 2011–12 AND 2012–13 FINANCIAL AID RECIPIENTS TO THE BASE YEAR
Year Hispanic African American Asian, Filipino Pacific Islanders
White
2002-03 209,936 90,430 98,374 163,6412009-10 378,959 141,529 143,080 247,1332012-13 499,372 126,611 150,419 286,256
Change from Base Year 289,436 36,181 52,045 122,615Percent Change 137.9% 40.0% 52.9% 74.9%

22Report on California Community College Student Financial Aid Programs for 2011–12 and 2012–13California Community Colleges Chancellor’s Office
Table I.3 shows that, compared to the 2002–03 base year, all ethnicities saw gains in the number of financial aid awards received. Hispanic students, however, have made the most significant gains in both the number and percentage of financial aid awards. Hispanic students, as well as African American students, are specifically tar-geted for enhanced financial aid outreach and support, because both are identified as low-income, disadvan-taged ethnicities.
What cannot be seen from this table are the consider-able gains in the percentage of financial aid awards for both Hispanic and African American students. In 2002–03, 28 percent of Hispanic students attending community colleges received financial aid awards, and 43 percent of African American students received financial aid awards. The 2012–13 data show that the percentage of Hispanic students receiving financial aid awards has risen from 28 percent to 57 percent, and the percentage of African American students receiving financial aid awards has risen from 43 percent to 76 percent.
2012–13 College Performance Relative to 2002–03 Benchmarks
College level performance is summarized using both credit enrollment and financial aid participation rates for 2002–03 through 2012–13. Note: the following figures are reported from the time period before the California Community Colleges expanded to 113 colleges.
Participation Rates:
• Of the 112 community colleges, 110 reported growth in the number of BOG Fee Waiver recipients from 2002–03 through 2012–13.
• Of the 112 community colleges, 110 colleges report-ed growth in the number of Pell Grants from 2002–03 through 2012–13.
Two colleges reported a reduction in the number of BOG Fee Waivers, and two colleges reported a reduc-tion in the number of Pell Grants. This is partly due to student population shifts caused by the addition of new community college campuses. It should be noted, however, that all 112 colleges reported growth in the percentage of students receiving BOG Fee Waivers and Pell Grants.
Participation as a Percentage of Credit Enrollments:
• All 112 colleges reported growth in the percentage of credit enrollment served with Pell Grant awards from 2002–03 through 2012–13.*
• All 112 colleges reported growth in the percentage of credit enrollment served with BOG Fee Waivers from 2002–03 through 2012–13.*
* For newer colleges that began reporting first-time figures after the 2002–03 base year, growth is measured by comparing the latest enrollment and financial aid figures with the colleges’ first-year figures
In-Reach and Outreach Services
To assess the number of community college students reached annually through activities directed towards current and prospective students, the Chancellor’s Office defines in-reach and outreach activities, and the popula-tions served, as follows:
In-reach: “In-reach” measures the performance of the community colleges in targeting financial aid informa-tion to on-campus students who are not being served by the financial aid programs. Current-year financial aid recipients who were enrolled in a community college during a prior enrollment period but did not receive fi-nancial aid for that period are defined as new “in-reach” recipients.
Outreach: “Outreach” measures the performance of the community colleges in targeting financial aid informa-tion to potential and prospective students in the high schools and their communities. New students who were not enrolled in the immediate prior year but enrolled and received aid as new recipients in the current year are defined as “outreach” recipients.
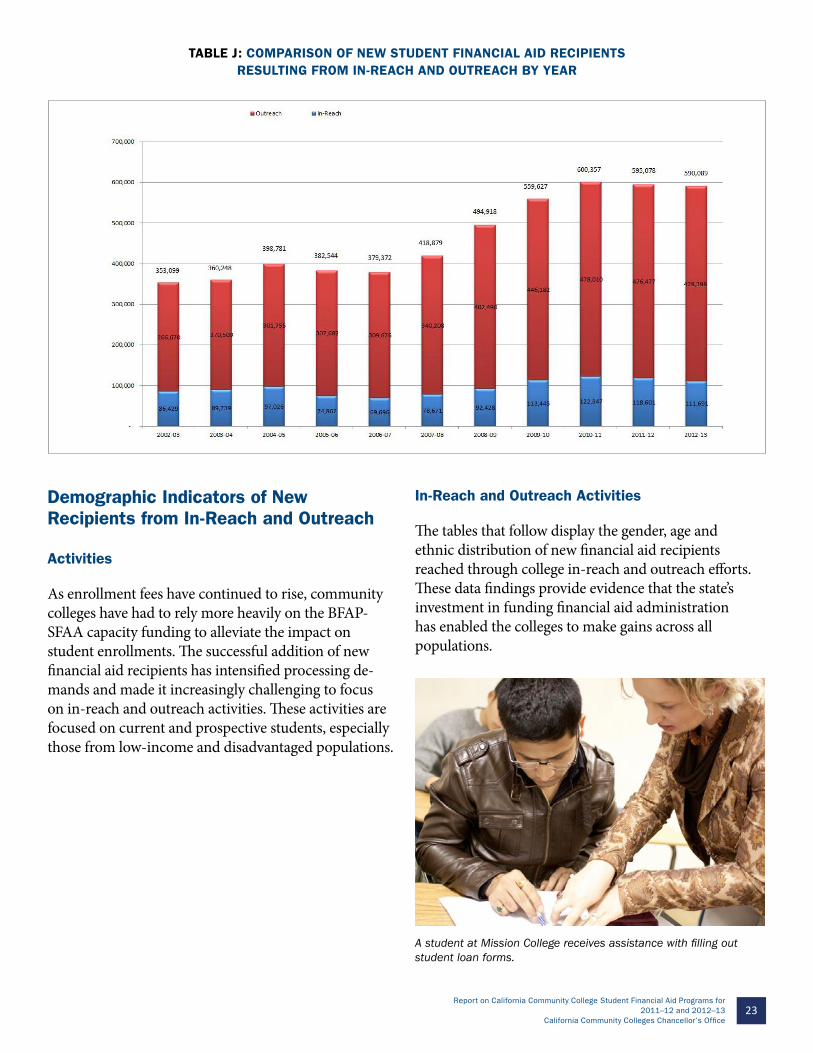
Table J shows that, although enrollments have dropped since 2002–03, new in-reach and outreach recipients have grown by 67 percent, from 353,000 to 590,000. Combined totals for both in-reach and outreach are displayed above each column. Systemwide, community colleges’ outreach efforts have served nearly 4.8 million new financial aid recipients since 2002–03.
23Report on California Community College Student Financial Aid Programs for
2011–12 and 2012–13California Community Colleges Chancellor’s Office
TABLE J: COMPARISON OF NEW STUDENT FINANCIAL AID RECIPIENTS RESULTING FROM IN-REACH AND OUTREACH BY YEAR
Demographic Indicators of New Recipients from In-Reach and Outreach
Activities
As enrollment fees have continued to rise, community colleges have had to rely more heavily on the BFAP-SFAA capacity funding to alleviate the impact on student enrollments. The successful addition of new financial aid recipients has intensified processing de-mands and made it increasingly challenging to focus on in-reach and outreach activities. These activities are focused on current and prospective students, especially those from low-income and disadvantaged populations.
In-Reach and Outreach Activities
The tables that follow display the gender, age and ethnic distribution of new financial aid recipients reached through college in-reach and outreach efforts. These data findings provide evidence that the state’s investment in funding financial aid administration has enabled the colleges to make gains across all populations.
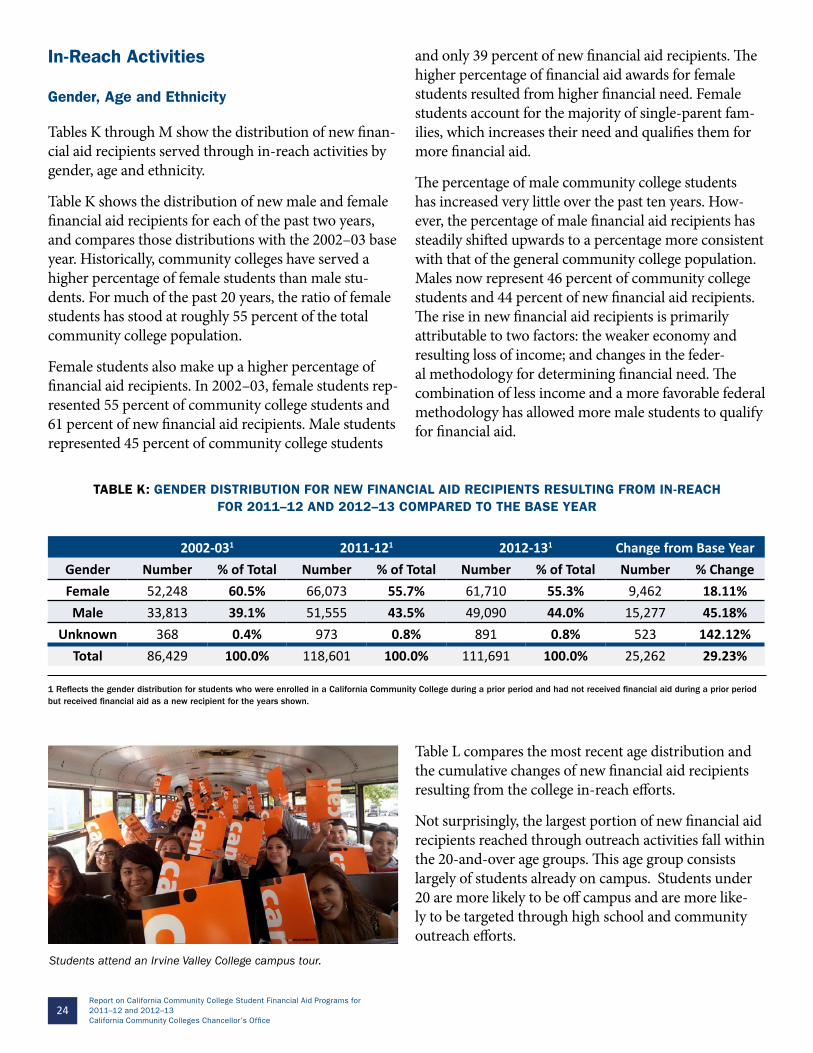
A student at Mission College receives assistance with filling out student loan forms.
24Report on California Community College Student Financial Aid Programs for 2011–12 and 2012–13California Community Colleges Chancellor’s Office
In-Reach Activities
Gender, Age and Ethnicity
Tables K through M show the distribution of new finan-cial aid recipients served through in-reach activities by gender, age and ethnicity.
Table K shows the distribution of new male and female financial aid recipients for each of the past two years, and compares those distributions with the 2002–03 base year. Historically, community colleges have served a higher percentage of female students than male stu-dents. For much of the past 20 years, the ratio of female students has stood at roughly 55 percent of the total community college population.
Female students also make up a higher percentage of financial aid recipients. In 2002–03, female students rep-resented 55 percent of community college students and 61 percent of new financial aid recipients. Male students represented 45 percent of community college students
and only 39 percent of new financial aid recipients. The higher percentage of financial aid awards for female students resulted from higher financial need. Female students account for the majority of single-parent fam-ilies, which increases their need and qualifies them for more financial aid.
The percentage of male community college students has increased very little over the past ten years. How-ever, the percentage of male financial aid recipients has steadily shifted upwards to a percentage more consistent with that of the general community college population. Males now represent 46 percent of community college students and 44 percent of new financial aid recipients. The rise in new financial aid recipients is primarily attributable to two factors: the weaker economy and resulting loss of income; and changes in the feder-al methodology for determining financial need. The combination of less income and a more favorable federal methodology has allowed more male students to qualify for financial aid.
TABLE K: GENDER DISTRIBUTION FOR NEW FINANCIAL AID RECIPIENTS RESULTING FROM IN-REACH FOR 2011–12 AND 2012–13 COMPARED TO THE BASE YEAR
2002-031 2011-121 2012-131 Change from Base YearGender Number % of Total Number % of Total Number % of Total Number % ChangeFemale 52,248 60.5% 66,073 55.7% 61,710 55.3% 9,462 18.11%Male 33,813 39.1% 51,555 43.5% 49,090 44.0% 15,277 45.18%
Unknown 368 0.4% 973 0.8% 891 0.8% 523 142.12%Total 86,429 100.0% 118,601 100.0% 111,691 100.0% 25,262 29.23%
1 Reflects the gender distribution for students who were enrolled in a California Community College during a prior period and had not received financial aid during a prior period but received financial aid as a new recipient for the years shown.
Students attend an Irvine Valley College campus tour.
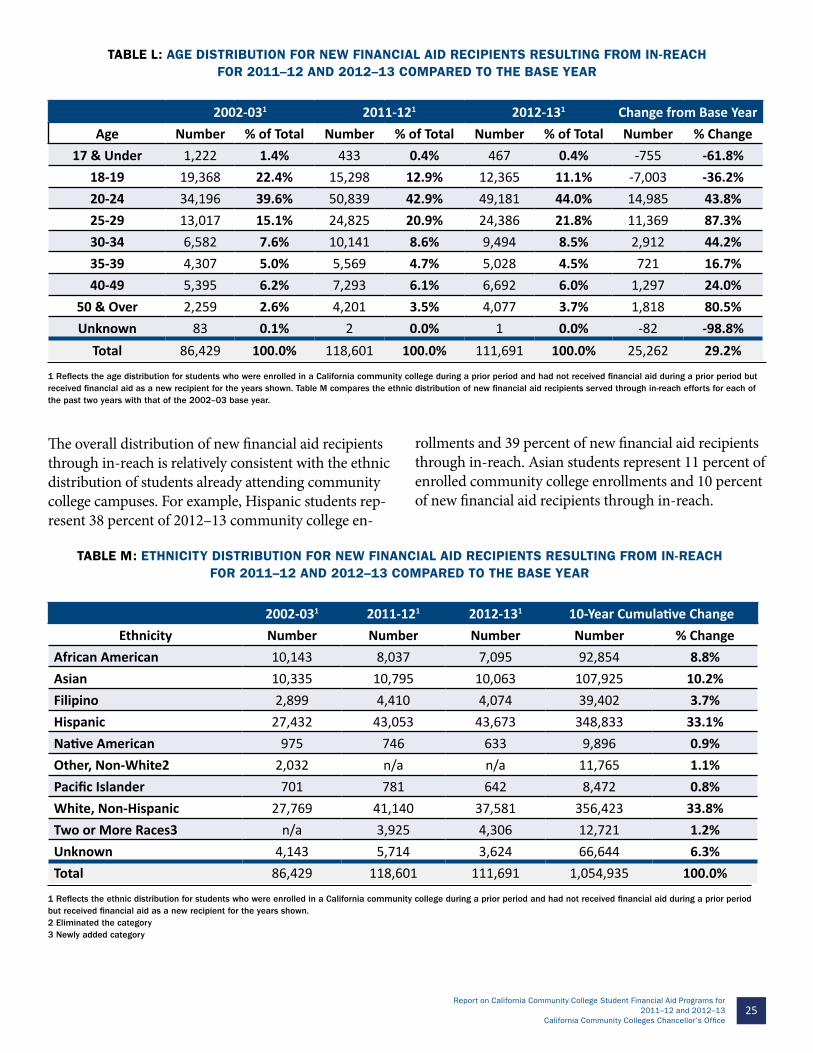
Table L compares the most recent age distribution and the cumulative changes of new financial aid recipients resulting from the college in-reach efforts.
Not surprisingly, the largest portion of new financial aid recipients reached through outreach activities fall within the 20-and-over age groups. This age group consists largely of students already on campus. Students under 20 are more likely to be off campus and are more like-ly to be targeted through high school and community outreach efforts.
25Report on California Community College Student Financial Aid Programs for
2011–12 and 2012–13California Community Colleges Chancellor’s Office
2002-031 2011-121 2012-131 Change from Base YearAge Number % of Total Number % of Total Number % of Total Number % Change
17 & Under 1,222 1.4% 433 0.4% 467 0.4% -755 -61.8%18-19 19,368 22.4% 15,298 12.9% 12,365 11.1% -7,003 -36.2%20-24 34,196 39.6% 50,839 42.9% 49,181 44.0% 14,985 43.8%25-29 13,017 15.1% 24,825 20.9% 24,386 21.8% 11,369 87.3%30-34 6,582 7.6% 10,141 8.6% 9,494 8.5% 2,912 44.2%35-39 4,307 5.0% 5,569 4.7% 5,028 4.5% 721 16.7%40-49 5,395 6.2% 7,293 6.1% 6,692 6.0% 1,297 24.0%
50 & Over 2,259 2.6% 4,201 3.5% 4,077 3.7% 1,818 80.5%Unknown 83 0.1% 2 0.0% 1 0.0% -82 -98.8%
Total 86,429 100.0% 118,601 100.0% 111,691 100.0% 25,262 29.2%
1 Reflects the age distribution for students who were enrolled in a California community college during a prior period and had not received financial aid during a prior period but received financial aid as a new recipient for the years shown. Table M compares the ethnic distribution of new financial aid recipients served through in-reach efforts for each of the past two years with that of the 2002–03 base year.
TABLE L: AGE DISTRIBUTION FOR NEW FINANCIAL AID RECIPIENTS RESULTING FROM IN-REACH FOR 2011–12 AND 2012–13 COMPARED TO THE BASE YEAR
The overall distribution of new financial aid recipients through in-reach is relatively consistent with the ethnic distribution of students already attending community college campuses. For example, Hispanic students rep-resent 38 percent of 2012–13 community college en-
rollments and 39 percent of new financial aid recipients through in-reach. Asian students represent 11 percent of enrolled community college enrollments and 10 percent of new financial aid recipients through in-reach.
TABLE M: ETHNICITY DISTRIBUTION FOR NEW FINANCIAL AID RECIPIENTS RESULTING FROM IN-REACH FOR 2011–12 AND 2012–13 COMPARED TO THE BASE YEAR
2002-031 2011-121 2012-131 10-Year Cumulative ChangeEthnicity Number Number Number Number % Change
African American 10,143 8,037 7,095 92,854 8.8%Asian 10,335 10,795 10,063 107,925 10.2%Filipino 2,899 4,410 4,074 39,402 3.7%Hispanic 27,432 43,053 43,673 348,833 33.1%Native American 975 746 633 9,896 0.9%Other, Non-White2 2,032 n/a n/a 11,765 1.1%Pacific Islander 701 781 642 8,472 0.8%White, Non-Hispanic 27,769 41,140 37,581 356,423 33.8%Two or More Races3 n/a 3,925 4,306 12,721 1.2%Unknown 4,143 5,714 3,624 66,644 6.3%Total 86,429 118,601 111,691 1,054,935 100.0%
1 Reflects the ethnic distribution for students who were enrolled in a California community college during a prior period and had not received financial aid during a prior period but received financial aid as a new recipient for the years shown. 2 Eliminated the category 3 Newly added category

26Report on California Community College Student Financial Aid Programs for 2011–12 and 2012–13California Community Colleges Chancellor’s Office
Outreach Activities
Gender, Age and Ethnicity
Tables N through P show new financial aid recipients served through outreach activities by gender, age and ethnicity. The figures that follow demonstrate the suc-cessful expansion of outreach efforts to target potential and prospective students in the high schools and their communities.
Students attend a financial aid event at El Camino College.
Table N compares the gender distribution of new finan-cial aid recipients resulting from outreach efforts for each of the past two years with that of the 2002–03 base year. These figures show that the gender distribution of finan-cial aid recipients through outreach activities has shifted and has become more consistent with the general student population. This indicates the rise of a higher-need male population, primarily due to the weaker economy and changes in the federal financial eligibility standards for calculating students’ expected family contribution (EFC).
TABLE N: GENDER DISTRIBUTION FOR NEW FINANCIAL AID RECIPIENTS RESULTING FROM OUTREACH FOR 2011–12 AND 2012–13 COMPARED TO THE BASE YEAR
2002-031 2011-121 2012-131 Change from Base YearGender Number % of Total Number % of Total Number % of Total Number % Change Female 161,529 60.6% 264,632 55.5% 264,286 55.2% 102,757 63.6%Male 103,079 38.7% 207,500 43.5% 210,311 44.0% 107,232 104.0%Unknown 2,062 0.8% 4,345 0.9% 3,801 0.8% 1,739 84.3%Total 266,670 100.0% 476,477 100.0% 478,398 100.0% 211,728 79.4%
1 Reflects the gender distribution for students who were not enrolled in a California community college in the immediate prior year but enrolled and received financial aid as a new recipient for the years shown.
As noted in the In-Reach Activities section of this re-port, the percentage of male financial aid recipients has steadily shifted upwards to a percentage more consistent with that of the general community college population. The percentage of males attending community colleges has grown from 44.3 percent to 45.9 percent in 2012–13, an increase of 1.6 percent since 2002–03. However, the percentage of male students receiving new financial aid awards has grown from 38.7 percent to 44 percent, an increase of 5.3 percent. The rise in new financial aid recipients is primarily attributable the weaker economy and resulting loss of income, and changes in the federal methodology.
Students attend an “I Can Afford College” event.
Table O compares the age distribution of new financial aid recipients in recent years and the overall change in distribution since the 2002–03 base year. The age distribution for new financial aid recipients has changed only slightly since 2002–03, with 77 percent of today’s students falling within the 29-and-under age groups, as opposed to 74 percent in 2002–03.

27Report on California Community College Student Financial Aid Programs for
2011–12 and 2012–13California Community Colleges Chancellor’s Office
TABLE O: AGE DISTRIBUTION FOR NEW FINANCIAL AID RECIPIENTSRESULTING FROM OUTREACH FOR 2011–12 AND 2012–13 COMPARED TO THE BASE YEAR
2002-031 2011-121 2012-131 Change from Base YearAge Number % of Total Number % of Total Number % of Total Number % Change
17 & Under 5,141 1.9% 5,102 1.1% 5,144 1.1% 3 0.1%18-19 74,593 28.0% 153,165 32.0% 150,904 31.7% 76,311 102.3%20-24 77,364 29.0% 139,723 29.2% 136,940 28.7% 59,576 77.0%25-29 39,593 14.8% 75,695 15.8% 74,741 15.7% 35,148 88.8%30-34 22,994 8.6% 38,088 8.0% 39,123 8.2% 16,129 70.1%35-39 16,084 6.0% 21,409 4.5% 22,623 4.7% 6,539 40.7%40-49 21,062 7.9% 27,274 5.7% 29,669 6.2% 8,607 40.9%
50 & Over 9,282 3.5% 17,929 3.7% 17,312 3.6% 8,030 86.5%Unknown 557 0.2% 13 0.0% 21 0.0% -536 -96.2%
Total 266,670 100.0% 478,398 100.0% 476,477 100.0% 209,807 78.7%
1 Reflects the gender distribution for students who were not enrolled in a California community college in the immediate prior year but enrolled and received financial aid as a new recipient for the years shown.
TABLE P: ETHNICITY DISTRIBUTION FOR NEW FINANCIAL AID RECIPIENTS RESULTING FROM OUTREACH FOR 2011–12 AND 2012–13 COMPARED TO THE BASE YEAR
2002-031 2011-121 2012-131 Change from Base YearEthnicity Number Number Number Number Percent
African American 46,135 64,271 60,535 14,400 31.2%Asian 30,940 43,061 42,694 11,754 38.0%
Filipino 6,565 11,699 12,116 5,551 84.6%Hispanic 89,141 199,058 211,910 122,769 137.7%
Native American 3,291 2,827 2,703 -588 -17.9%Other, Non-White2 5,812 N/A N/A N/A N/A
Pacific Islander 2,104 2,972 2,915 811 38.5%White, Non-Hispanic 69,709 116,776 114,025 44,316 63.6%Two or More Races3 0 19,066 20,175 20,175 N/A
Unknown 12,973 16,747 11,325 -1,648 N/ATotal 266,670 476,477 478,398 211,728 N/A
1 Reflects the gender distribution for students who were not enrolled in a college in the immediate year, but enrolled and received financial aid as a new recipient for the years shown. 2 Deleted the category. 3 Newly added category.
While there have been increases in numbers for almost all ethnic categories, Hispanic students have shown the most significant growth, from 89,000 new financial aid recipients in 2002–03 to 212,000 in 2012–13. That
equates to a 138 percent increase of nearly 123,000 new financial aid recipients through outreach.

28Report on California Community College Student Financial Aid Programs for 2011–12 and 2012–13California Community Colleges Chancellor’s Office
Change in Application Volume
One of the primary performance indicators adopted by the Chancellor’s Office to gauge the effectiveness of colleges’ outreach and in-reach efforts is the volume of
unduplicated Free Application for Federal Student Aid (FAFSA) records, known as Institutional Student Infor-mation Reports. The Chancellor’s Office added undu-plicated FAFSA applicant counts to its statewide bench-mark performance indicators in 2005–06.
TABLE Q: COMPARISON OF UNDUPLICATED FAFSA APPLICANTS AND PELL RECIPIENTS
Year UnduplicatedFAFSA
Applicants (ISIR)
ISIR Change in Number
Percent Change in
ISIR Records
Pell Grant Recipients
Percent Change in
Pell Recipients
Precent of Pell Recipient ISIRs
2002-03 706,594 239,925 34.0%2003-04 760,319 53,725 7.6% 246,093 6,168 32.4%2004-05 819,894 59,575 7.8% 259,958 13,865 31.7%2005-06 859,496 39,602 4.8% 254,603 -5,355 29.6%2006-07 851,901 -7,595 -0.9% 247,143 -7,460 29.0%2007-08 881,555 29,654 3.5% 270,098 22,955 30.6%2008-09 1,031,157 149,602 17.0% 321,066 50,968 31.1%2009-10 1,298,732 267,575 25.9% 418,775 97,709 32.2%2010-11 1,542,256 243,524 18.8% 491,577 72,802 31.9%2011-12 1,751,490 209,234 13.6% 517,391 25,814 29.5%2012-13 1,836,134 84,644 4.8% 491,487 -25,904 26.8%
10-year change 159.9% 251,562 104.9% * Pell recipient decreases in 2005–06 and 2006–07 resulted from a federal Tax Table Formula Change in 2005–06 and a federally imposed “tuition sensitivity” measure that was triggered by the California Community College fee increases of 2003–04 and 2004–05.
The steady growth of FAFSA applications can be at-tributed to a number of factors:
• The increased financial pressures and demands for job training and retraining created by the weakened economy.
• The successful implementation of financial aid ad-ministrative outreach and capacity funding by the colleges, which has provided increased outreach and in-reach support to applicants.
• The statewide “I Can Afford College” campaign, which, through various marketing, media and out-reach activities, has effectively communicated the message that financial aid is available year-round and that one-on-one assistance is available for those who need help with the application process.
• The successful collaboration with the California Student Aid Commission’s Cal Grant Campaign and
“California Cash for College” and other statewide and local outreach efforts, which create awareness of fi-nancial aid programs and provide application support for low-income and disadvantaged students.
As a result of these factors, there has been a huge in-crease in the number of financial aid applicants. This is good news for students seeking an education at commu-nity colleges, but it comes at a cost: increased financial aid workload and administrative costs.
New Pell Grant applicants and recipients impose a greater administrative workload on colleges than renew-al Pell Grant applicants and recipients. More stringent federal requirements have made the Pell Grant applica-tion review and verification process increasingly more onerous for financial aid staff, particularly for new, first-time applicants. The increased workload for new applicants has made it necessary for financial aid offices

29Report on California Community College Student Financial Aid Programs for
2011–12 and 2012–13California Community Colleges Chancellor’s Office
to commit a larger share of their staffing resources for processing, resulting in increased processing backlogs and diminished staffing resources for outreach. Table R,
which provides an annual comparison of new Pell Grant Recipients, shows an 85 percent increase new Pell Grant awards.
TABLE R: TEN-YEAR COMPARISON OF “NEW” COMMUNITY COLLEGE PELL GRANT RECIPIENTS
Year First Time Pell Recipients Percent Change2002-03 125,420 2003-04 126,110 0.6%2004-05 132,645 5.2%2005-06 127,041 -4.2%2006-07 123,518 -2.8%2007-08 141,046 14.2%2008-09 176,142 24.9%2009-10 233,516 32.6%2010-11 259,860 11.3%2011-12 256,443 -1.3%2012-13 231,727 -9.6%
10-Year Change 106,307 84.8%
It should be noted that new Pell Grant recipients represent more than half of the community college Pell Grant recipient population.
Enrollment Status – Term and Annual Unit Load Approach
This analysis attempts to identify students most likely to be enrolled in eligible certificate and degree programs and therefore more likely to be eligible for student finan-cial aid program participation.
The Chancellor’s Office compares community college Pell Grant data with the data provided by the Institute of Educational Sciences (IES) National Center for Edu-cation Statistics in its most recent IES report, titled the “2011-12 National Postsecondary Student Aid Study.”
Federal programs, such as the Pell Grant program, fund only students enrolled for the purpose of obtaining an eligible degree, certificate, or other recognized creden-tial. The BOG Fee Waiver program, which is a commu-nity college program, is less restrictive and allows fees to be waived for any credit coursework without requiring the student to specify an educational goal. Consequent-ly, many students receiving fee waivers do not qualify for federal aid.
Table S compares the number and percentage of stu-dents participating in the Pell Grant and BOG Fee Waiver programs by term and annual unit load levels. The analysis compares participation rates in:
• BOG Fee Waivers and Pell Grants for all students in all terms of the award year.
• BOG Fee Waivers and Pell Grants for students at-tending at least half time (12 or more units) within an award year and those attending less than full time (less than 12 units) within an award year.
• BOG Fee Waivers and Pell Grants for students attend-ing at least half time (6 or more units) in any term(s) within an award year and those attending less than half-time (less than 6 units in each term) in any term within an award year.

30Report on California Community College Student Financial Aid Programs for 2011–12 and 2012–13California Community Colleges Chancellor’s Office
Table S also provides an estimate of participation rates by identifying and excluding enrollment status for students whose course patterns would likely indicate non-vocational or recreational based studies and would be ineligible for federal aid.
Table S findings compare 2012–13 findings with those of 2002–03.
• Since 2003–04, the percentage of Pell Grant recipi-ents with “6 or more” attempted units has increased from 18.4 percent to 34.1 percent and the percentage of Pell Grant recipients with “12 or more” attempted units has increased from 23.8 percent to 40.4 per-cent. Students in the above two categories are those most likely to be enrolled in Pell eligible programs such as certificate, degree, or transfer programs, all of which meet the requirements for Pell Grant pro-gram participation.
• The percentage of Pell Grant recipients with “less than 6” attempted units has increased from 1.0 percent to 4.3 percent; and the percentage of Pell Grant recipients with “less than 12” attempted units has increased slightly from 2.6 percent to 9.1 per-cent. Students in these two categories are much less likely to be enrolled in Pell eligible programs. They are more likely to be enrolled in non-degree/certif-icate programs or recreational programs and are, therefore, ineligible for Pell Grants.
• The percentage of BOG Fee Waiver recipients with “6 or more” attempted units has increased from 36.6 percent to 63.2 percent; and the percentage of BOG Fee Waiver recipients with “12 or more” attempt-ed units has increased from 41.5 percent to 66.6 percent. Students in these two categories are more likely to be enrolled in certificate, degree, or transfer programs and are therefore more likely to qualify for both Bog Fee Waivers and Pell Grants.
• The percentage of BOG Fee Waiver recipients with “less than 6” attempted units has increased con-siderably (from 12.0 percent to 33.8 percent); and the percentage of BOG Fee Waiver recipients with “less than 12” attempted units has increased (from 15.9 percent to 41.0 percent). Students in these two categories are less likely to be enrolled in certificate, degree, or transfer programs, and are more likely to be in non-degree/certificate programs or recreation-al programs.
The growth of Pell Grants and BOG Fee Waivers is directly related to the rise in campus in-reach and outreach activities, which have led to more students applying for and qualifying for these programs. The less restrictive BOG Fee Waiver eligibility requirements have allowed a greater number of students to qualify for BOG Fee Waiver benefits.
TABLE S: COMPARISON OF ENROLLMENTS FOR 2011–12 AND 2012–03 TO THE 2002–03 BASE YEAR.
Students Most Likely to be in an Eligible ProgramAttempted 12+ units during award year
Academic Year Total Students Received BOG FW % Received Pell %2012-13 934,221 621,968 66.6% 377,765 40.4%2011-12 962,141 615,183 63.9% 395,360 41.1%2002-03 831,144 345,180 41.5% 197,568 23.8%
Attempted 6+ units in one or more terms during award yearAcademic Year Total Students Received BOG FW % Received Pell %
2012-13 1,314,564 830,693 63.2% 447,813 34.1%2011-12 1,354,361 816,601 60.3% 470,204 34.7%2002-03 1,224,732 448,505 36.6% 224,921 18.4%

31Report on California Community College Student Financial Aid Programs for
2011–12 and 2012–13California Community Colleges Chancellor’s Office
Students Least Likely to be in Eligible ProgramsAttempted < 12 units during award year
Academic Year Total Students Received BOG FW % Received Pell %2012-13 1,113,546 456,405 41.0% 101,551 9.1%2011-12 1,198,598 442,747 36.9% 109,746 9.2%2002-03 1,430,338 227,494 15.9% 37,512 2.6%
Attempted < 6 units in each term during award yearAcademic Year Total Students Received BOG FW % Received Pell %
2012-13 733,203 247,680 33.8% 31,503 4.3%2011-12 806,378 241,329 29.9% 34,902 4.3%2002-03 1,036,750 124,169 12.0% 10,159 1.0%
All Students Attempting Any Number of Units Attempted Any Units in One or More Terms During Award Year
Academic Year Total Students Received BOG FW % Received Pell %2012-13 2,038,610 1,111,680 54.5% 486,622 23.9%2011-12 2,150,115 1,095,073 50.9% 514,018 23.9%2002-03 262,170 596,714 26.4% 234,473 10.4%
Challenges Facing California Community College Financial Aid Offices in 2012–13 and Beyond
Over the past ten years, the growth of financial aid out-reach and support services has provided immense ben-efits to California’s community college students. In the time since the legislature enacted the 2003–04 financial aid administrative capacity funding, student applicants and recipients have doubled and financial aid award dol-lars have tripled. This success, however, comes at a cost: increased service demands, increased workloads, and a diminished ability to increase program participation. Given these circumstances, and the likelihood of greater future enrollments, community colleges are likely to face more difficult challenges in the years ahead.
As has always been true of financial aid, state and federal entities continually alter and expand their policies. Many of these changes impose additional administra-tive burdens on community college financial aid offices, whose resources are already thinly stretched. These changes must be considered in assessing the ability of community colleges to maintain the success of their financial aid programs and services.
Federal Considerations
• Most of the financial aid issues relating to federal changes remain the same as those covered in the last financial aid report to the legislature. One that is beginning to have a more serious impact on Cali-fornia’s community colleges is the cohort default rate policy change. The U.S. Department of Education’s decision to extend the cohort default rate formula from two years to three years has increased default rates for many community colleges and has caused a growing number of community colleges to withdraw from participation in the federal educational loans program.
Increased default rates can lead to the loss of federal program eligibility, including the enormously benefi-cial Pell Grant program. Because federal financial aid is so vital to community college students, colleges are understandably concerned about the risks the new cohort default formula poses. To minimize this risk, 20 of the 112 community colleges (in the 2011–12 and 2012–13 academic years) have chosen to with-draw from participation in the federal loan program, with the hope that this will ensure their continued

32Report on California Community College Student Financial Aid Programs for 2011–12 and 2012–13California Community Colleges Chancellor’s Office
eligibility for the more beneficial Pell Grant program. Even though this decision may help some colleges avoid the potential loss of Pell eligibility, it negates the students’ option of accessing this important source of financial aid.
In July of 2014, the Institute for College Access and Success (TICAS) published a report titled “How Community Colleges That Do Not Offer Federal Loans Put Students at Risk.”
The report states:
“Without access to affordable student loans, students who cannot afford school after available grants and scholar-ships are left between a rock and a hard place. They might borrow through other channels, such as private education loans or credit cards, which are more expensive, riskier, and lack the repayment options and protections of federal student loans. Alternatively, they might work longer hours to pay the bills or cut back on the number of classes they take each term – choices that research has consistently found to reduce students’ chances of completing a degree or certificate.”
To help students avoid loan defaults and help commu-nity colleges avoid loan default sanctions, the California Community Colleges Chancellor’s Office commenced a systemwide Default Prevention Initiative in the summer of 2013. The services, which are available to all commu-nity colleges, include:
� Full analysis of colleges’ current and projected default rates.
� Assistance with Incorrect Data Challenge (IDC) and Participation Rate Index (PRI).
� Institutional consulting. � Third party services selection and monitoring. � Financial literacy and in-house prevention product selection.
� System level consulting.
The Chancellor’s Office’s Default Prevention Initiative is intended to provide colleges with the services and tools necessary to avoid cohort default rate sanctions. Schools at risk of exceeding the cohort default rate threshold are given immediate, direct support. With the help of this initiative, there are currently no community colleges at risk of cohort default rate sanctions.
In spite of the success of the Default Prevention Initiative, additional community colleges continue to weigh the option of withdrawing from the federal loan program.
Members of Congress continue to press for budgetary changes that would reduce or limit Pell Grant funding. The program budget has grown from $14 billion a year to an estimated $41 billion. For most financially quali-fied students, this grant is the most essential component of their financial aid packaging.
While the new Congress has not yet taken any action to reduce or limit Pell Grants, recent discussions have not ruled that out as a possibility. Pell Grants provide the bulk of financial aid funds for community college stu-dents. Any future reductions in Pell Grant funding will have an immediate adverse effect on community college students’ ability to successfully access college and meet their education and career goals.
A student graduates from San Diego Mesa College.
One of the most significant federal cost saving mea-sures affecting California community college Pell Grant recipients is the reduction of the 18 semester (full-time equivalent) limit for new Pell recipients to a 12 semester (full-time equivalent) limit. The new limitation is applied to all Pell recipients, regardless of when they first re-ceived a Pell Grant. As a result, some community college students have exhausted their Pell eligibility at an earlier time than expected. To ensure funding after transfer to a four-year college, many students have been forced to defer or ration their Pell Grants while attending commu-nity college. This decision may jeopardize a successful transfer for some community college students.
In 2012–13, federal legislation eliminated financial aid for students who do not have a high school diploma or

33Report on California Community College Student Financial Aid Programs for
2011–12 and 2012–13California Community Colleges Chancellor’s Office
its equivalent. Prior to this, students who hadn’t grad-uated from high school were able to establish eligi-bility for federal financial aid by taking and passing a federally approved test to demonstrate their “Abil-ity to Benefit” (ATB) from a college education. The elimination of this option has had a direct impact on California’s community college students, many of whom enter college without a high school diplo-ma. Because of this policy change, many of the most disadvantaged students entering community colleges will be left without the benefit of any federal financial aid funds.
A recent proposal to restore the federal ATB allow-ance offers new hope for those community college students who do not have a high school diploma.
The federal government introduced another cost-sav-ing change by reducing the income and asset protec-tion allowances for 2012–13 financial aid applicants. The government also reduced the income threshold for automatically eligible applicants (auto-zero EFC). These changes, and the changes identified above, resulted in decreased eligibility for financial aid applicants. This can be seen in the 2012–13 program participation data. Federal aid applications rose, while the number of Pell Grant recipients declined.
Federal changes have required financial aid offices to revise their grant and loan policy guidelines, policies and processes, and have underscored the need to provide more detailed consumer information when advising financial aid applicants and borrowers. An even greater challenge will come in trying to find creative ways to serve students who have lost their eligibility or have been subjected to reduced eligibility to ensure they will have the resources to successfully complete their education.
State and Local Considerations
• The implementation of the Student Success Support Program (SSSP) recommendations will impose additional workload on financial aid offices. The implementation process will require financial aid program software and processing changes to corre-spond with the implementation of the legislative and program policy changes to support student success in community college access, retention and four-year college transfers.
• The California Student Aid Commission’s newly drafted Institutional Program Agreements (IPA) will place more unfunded responsibility and workload on colleges. Over the last decade, the Commission, which provides no administrative allowance funds to colleges, has shifted a larger portion of adminis-trative responsibility onto participating colleges. As part of SB 70 (2011 Education Budget trailer bill) the new IPA would require colleges, as a result of their “voluntary participation in the Cal Grant Program,” to provide data above and beyond that already re-quired by the newly enacted federal changes under Gainful Employment program requirements.
A student fills out financial aid forms at Southwestern College.
Of greatest concern for community colleges is the requirement to report wage and job placement data, which is not currently collected or maintained by community colleges. As a result of community colleges’ inability to comply with parts of the SB 70 data reporting requirements and the Commission’s proposed implementation regulations (which, in their current form, extend beyond the scope of the CSAC’s responsibility and authority under the law), community colleges’ participation in the Cal Grant programs may be jeopardized.
• Community college students, who represent nearly 70 percent of California’s college students and in-clude the vast majority of low-income and disadvan-taged students, receive only 6 percent of Cal Grant dollars. By contrast, UC students receive more than 40 percent of Cal Grant funds and CSU students receive more than 20 percent of Cal Grant funds. What little Cal Grant funds community college students do receive, come mainly from Cal Grant B access awards.

34Report on California Community College Student Financial Aid Programs for 2011–12 and 2012–13California Community Colleges Chancellor’s Office
The Cal Grant B program was created to help low-in-come students with college access, by providing funds to help meet their college living expenses. Notwithstanding the fact that relatively few commu-nity college students receive Cal Grant B awards, the proposed $1,648 award maximum covers only a small fraction of actual college costs.
Tuition and fees for UC and CSU Cal Grant recipients may increase, but these students have received ad-ditional Cal Grant funds to offset mandatory state-wide tuition and fee increases. As a result, UC and CSU Cal Grant recipients have been less affected by the overall rise in college costs than other Cal Grant recipients. Cal Grant B access awards have remained at a low level for a very long period of time and have provided little relief to offset the overall rise in college costs.
The bulk of college costs for community college students comes not from tuition costs but from living expense costs. Unless serious thought is given to pro-viding a more equitable share of Cal Grant funds to community college students, the Cal B access award will continue to provide relatively little help to low-in-come community college students.
Reynna Romero, student in the San Diego Community College District.
Key Findings
Because of the BFAP-SFAA funding allowance, com-munity colleges have made great strides in promoting student awareness and student participation in the financial aid programs. Although enrollment levels are still suffering the effects of the recent economic crisis, increased student financial aid has helped to offset these effects by offering college access and support to hun-dreds of thousands of community college students.
During the period from 2002–03 to 2012–13 enroll-ments have dropped significantly, yet during this same period:
• Financial aid applications have increased from 706,000 to 1.8 million
• Financial aid awards have increased by 86 percent.• Pell Grants have increased by 105 percent.• BOG Fee Waivers have increased by 86 percent.• Financial aid funds disbursed have increased by
215 percent.
The findings of this report illustrate the many benefits this funding has provided for community col-lege students.
The BFAP-SFAA capacity funding has resulted in an an-nual increase of 525,000 additional financial aid awards and close to $2 billion in additional funds. Most of this increase comes from federal financial aid. The funding goes beyond benefitting California’s students; it also pro-vides California’s economy with out-of-state funds that go directly into the local economies each time students use their award dollars to pay for books, rent, gas, food and other education-related expenses.
What is even more remarkable than the ten-year growth figures is the fact that they have been attained with rela-tively little increase beyond the initial capacity funding augmentation of 2003–04. In the years since the addi-tion of the BFAP-SFAA capacity funds, administrative costs have risen by an average of less than 2 percent a year.
Conclusions
California community colleges continue to provide a remarkably high level of financial aid services for com-
35Report on California Community College Student Financial Aid Programs for
2011–12 and 2012–13California Community Colleges Chancellor’s Office
munity college students. The unprecedented growth in financial aid awards and financial aid funds attests to this achievement.
The 2012–13 data show that the percentage of students applying for financial aid has grown substantially since 2002–03. Even with declining enrollments, more com-munity college students are applying for financial aid. As a result:
• Financial aid recipients have grown from 610,000 to 1.13 million.
• BOG Fee Waivers have grown from 597,000 to 1.11 million.
• Pell Grant recipients have more than doubled, from 240,000 to 491,000.
• Pell Grant dollars have more than tripled, from $668 million to $1.6 billion.
The added administrative burdens, created by growing processing demands and continual federal and state policy changes, make it difficult to predict whether community colleges can sustain the level and quality of future financial aid services. Although the percentage of financial aid applicants has steadily improved, the num-ber of financial aid recipients and the number of Pell Grant recipients have declined slightly over the past two years. It is not clear what the cause(s) may be. It could be related to various factors:
• Drops in enrollment.• Drops in outreach activities or more specialized
outreach activities.• Less staff for guidance and follow-up support.• Improved economy.• Federal policy changes in financial need.
The number of community college financial aid recipi-ents in future years will depend on the support provided to ensure that community colleges have the capacity to meet future demands. As the number of financial aid applicants increases, related servicing demands also increase.
Given the demand for state funds, it is understandable that the state cannot always offer all the funds needed to meet the additional responsibilities required of commu-nity college financial aid administrators. Nevertheless, it is imperative that community college financial admin-
istrators be given sufficient support to ensure that as many students possible receive the financial aid benefits they need to sustain them in their academic pursuits.
How the “I Can Afford College” Campaign Has Increased Awareness
Overview
For the past 10 years, the California Community Col-leges has conducted the successful “I Can Afford Col-lege” statewide outreach and awareness campaign to inform students of the availability of financial aid to pay for enrollment fees and help with other costs, such as books, supplies and sometimes even living expens-es. The Legislature and Governor Jerry Brown directed the California Community Colleges Chancellor’s Of-fice to conduct the campaign at a time when fees were increased from $11 to $18 per unit, due to concerns that many disadvantaged students would perceive that community college is beyond their reach. While the California community colleges continue to remain the most affordable system of higher education in our state, tuition has now risen to $46 a unit, making a communi-ty college course now cost as much as $138.
The funding for the “I Can Afford College” campaign has remained at $2.8 million per year since 2004-05. As a result, the purchasing power for awareness and outreach efforts has eroded significantly at a time when student fees continued to increase and the Governor has placed a high priority on expanding access to college and increasing transfers to the other higher education segments. The campaign has had to significantly reduce or eliminate some campaign outreach activities in recent years because of cost, including Spanish-language adver-tising and the development of informational materials in multiple languages.
Nevertheless, “I Can Afford College” continues to pro-vide valuable information to millions of students across the state, letting them know that cost shouldn’t be a bar-rier to pursuing their higher education goals, and that financial aid is available to attend community college.
In both the 2011–12 and 2012–13 fiscal budgets, $2.8 million was appropriated (each fiscal year) by the Legislature for the “I Can Afford College” campaign to promote the following messages:

36Report on California Community College Student Financial Aid Programs for 2011–12 and 2012–13California Community Colleges Chancellor’s Office
• California Community Colleges remain affordable.
• Financial aid is available to cover enrollment fees and help with other costs such as books, supplies and even living expenses.
• Financial aid experts are on all campuses and are available to provide free one-on-one assistance and much of the information is available on the icanaf-fordcollege.com website.
Target Audiences
The campaign has been charged with effectively reach-ing low-income and disadvantaged students who must overcome barriers in accessing postsecondary educa-tion. The target audiences for the “I Can Afford Col-lege” campaign are as follows:
• Teens and young adults age 16-24 with an annual combined household income at or below $40,000.
• Adults age 25-54 with an annual combined household income at or below $40,000, with an emphasis on the unemployed and underemployed.
• Influencers of primary and secondary audiences, in-cluding parents, teachers, counselors and community leaders.
Students on the City College of San Francisco campus.
Strategy
As in prior years, the campaign worked closely with the Chancellor’s Office and the California Community Colleges Student Financial Aid Advisors Association (CCCSFAAA) to develop the strategy and tactics for
reaching the target audiences. Various advertising, mar-keting, media relations and outreach tactics drove traffic to icanaffordcollege.com and the toll-free phone line, 1-800-987-ICAN (4226). Students visiting the website or calling the phone line were provided with valuable information about financial aid and were connected directly with financial aid professionals at community college campuses to receive one-on-one assistance with the application process.
Summary of Results
More than 1.1 million California community college students received some type of financial aid during the 2012–2013 academic year.
The following is a summary of results achieved by the campaign during the 2011–12 and 2012–2013 fiscal years combined:
• icanaffordcollege.com received nearly 665,000 unique visitors viewing more than 1.42 million pages.
• More than 268 million impressions were delivered through radio advertising and added value elements.
• More than 442 million impressions were delivered through online advertising and added value elements.
• More than 400,000 current students, potential stu-dents and their influencers were reached through statewide media relations efforts.
• Roughly 36,600 current and potential students were directly connected with their local community college financial aid office for assistance through icanafford-college.com and 1-800-987-ICAN (4226).
• Community college campuses promoted 1,840 finan-cial aid workshops on icanaffordcollege.com. Students attending the events received one-on-one assistance completing financial aid applications.
• More than 640,000 pieces of collateral and promo-tional material were provided statewide to communi-ty colleges, high schools, state agencies and commu-nity and faith-based organizations free of charge.
Website
At the heart of the campaign is the bilingual English and Spanish website, icanaffordcollege.com. During the 2011–12 and 2012–13 fiscal years combined, icanafford-

37Report on California Community College Student Financial Aid Programs for
2011–12 and 2012–13California Community Colleges Chancellor’s Office
An image from the icanaffordcollege.com website.
college.com received more than 665,000 unique visitors viewing more than 1.42 million pages. The website pro-vides students with valuable information about financial aid, online access to the financial aid applications, and connects them with financial aid professionals at their local college to receive free one-on-one assistance.
The key features of the website include:
• Online access to all of the necessary financial aid forms and answers to the most frequently asked financial aid questions.
• Zip code locator that offers students direct contact information for their nearest community college campuses, including physical and website addresses and financial aid office phone numbers and e-mail addresses.
• A financial aid event and workshop locator that helps students find a nearby event where they can receive free professional assistance to identify the types of aid that are right for them and to complete appropriate financial aid forms.
Students who do not have Internet access can call 1-800-987-ICAN (4226) to get connected with a community college financial aid office in their area.
Advertising
The “I Can Afford College” campaign used advertis-ing – mainly radio and online properties – to reach our target audiences throughout the state and drive them to icanaffordcollege.com and the toll-free phone line.
Funds were maximized by leveraging relationships with media partners to broaden the reach and frequency of paid advertising.
Radio Advertising
Historically, radio has proven to be very successful in reaching our target audiences. Through a longstanding relationship with Clear Channel, the campaign’s radio partner, target audiences were reached through tradi-tional radio stations throughout the state.
During the 2011–12 and 2012–13 fiscal years, radio advertising ran during multiple key timeframes, in-cluding the fall back-to school period, leading up to the March 2nd Cal Grant deadline, Financial Aid Awareness Month in April, and the high school graduation period in May/June.
In partnership with Clear Channel, the campaign also hosted multiple sweepstakes, including the “Big Money, Bright Future Sweepstakes” and the “Fund Your Future Sweepstakes”, which each provided a grand prize of a $10,000 scholarship for college; and the “$5,000 Free Money for Community College” sweepstakes, which had the grand prize of a $5,000 cash scholarship for college. All cash scholarships were donated by Clear Channel.
A screen image from the I Can Afford College online advertising campaign.

38Report on California Community College Student Financial Aid Programs for 2011–12 and 2012–13California Community Colleges Chancellor’s Office
Radio advertising efforts in 2011–12 and 2012–13 combined resulted in:
• An estimated 90,020 visitors to icanaffordcollege.com.
• A total of 268 million impressions were delivered through radio advertising and added value elements.
• A total of 39,905 spots aired on radio stations throughout California – 23,289 paid and 16,616 bonus spots (added value).
Online Advertising
In 2011–12 and 2012–13, the “I Can Afford College” campaign continued to broaden our reach to target audiences through online advertising. The online ads were placed to provide maximum reach and exposure to low-income audiences ages 16-24 and 25-54. Ads
for ages 25-54 were targeted to reach the unemployed/re-entry audiences with a tertiary target of influencers. Online creative was redesigned in 2011–12 to build a cohesive campaign look and feel, bringing video, audio and online assets together in a single look and strategy.
During the 2011–12 and 2012–13 fiscal years, online advertising also ran during multiple key timeframes, in-cluding the fall back-to school period, leading up to the March 2nd Cal Grant deadline, Financial Aid Aware-ness Month in April, and the high school graduation period in May/June.
A screen image from the I Can Afford College online advertising campaign.
Online advertising efforts in 2011–12 and 2012–13 combined resulted in:
• An estimated 366,260 visitors to icanaffordcollege.com.
• 442 million impressions delivered through paid on-line placements and added value elements.
• More than 159 million bonus impressions were de-livered by web banners, video pre-roll, streaming and Pandora.
• More than 18,600 radio spots streamed on the Internet.
A screen image from the I Can Afford College online advertising campaign.
Donated Radio/Online
The campaign was able to substantially increase the value of its advertising budget as a result of cooperative efforts with Clear Channel. Both the paid radio and paid online efforts were leveraged for added value exposure. During the 2011–12 and 2012–13 fiscal years com-bined, Clear Channel increased the campaign’s exposure by providing the following added value to media buys, with an estimated total value of more than $3.75 million:
• Free talent and production for radio and online spots.• Production of promotional web banners and artwork.• 6,688 total bonus on-air campaign spots.• 11,684 on-air spots ran in support of promotions/
sweepstakes. • 6,824 streaming spots ran in support of promotions/
sweepstakes. • 49.6 million bonus impressions delivered by web ban-
ners, video pre-roll, and streaming on Clear Channel stations (over-delivery).
• 5.9 million bonus impressions delivered by Pandora (over-delivery).

39Report on California Community College Student Financial Aid Programs for
2011–12 and 2012–13California Community Colleges Chancellor’s Office
• Promotional prizes: � 2011–12: $10,000 scholarship for college in the “Big Money, Bright Future Sweepstakes”; all ex-penses paid trip for two to the iHeart Radio Music Festival; $10,000 scholarship for college in the “Fund Your Future Sweepstakes”, along with instant win prizes including more than 160 iTunes gift cards.
� 2012–13: $5,000 scholarship for college, as well as a customized college-loaded Microsoft Surface, for the “$5,000 Free Money for Community College” sweepstakes.
• Provided all sweepstakes elements including website operations, legal conformance, prize distribution and promotion.
• On-site promotion of the “$5,000 Free Money for Community College” sweepstakes at the Wango Tan-go event in Los Angeles in May 2013.
• Production of a jumbotron advertisement that aired three times at the Wango Tango event in Los Angeles in May 2013.
• Organized the participation of Clear Channel radio stations at the following High School events:
� KIIS-FM on April 4, 2013 at Student Empower-ment Academy/New Technology High School, Los Angeles.
� KMEL-FM on May 22, 2013 at Broadway High School, San Jose.
Also during the 2011–12 and 2012–13 fiscal years, additional non-Clear Channel online partners provided bonus exposure with a total estimated value of more than $108,000. This added value combined with that provided by Clear Channel brings the total added value for the campaign in 2011–12 and 2012–13 combined to more than $3.85 million.
Media Relations
In addition to paid advertising, the campaign sought further exposure through media relations and garnered media attention through television, Internet and print mediums. During the 2011–12 fiscal year, the cam-paign was featured on various formats of ethnic media including Spanish, Asian and African American outlets. Interviews about the availability of financial aid aired
on radio and television stations in Sacramento and Los Angeles, including Univision and MundoFox. Stories ap-peared in newspapers such as La Opinion, China Press, Epoch Times, World Journal, Latino LA and other ethnic publications throughout the state. These stories and interviews reached more than 400,000 viewers, readers, and/or listeners. (Note: These numbers are based on cir-culation numbers for newspapers and Nielsen numbers for broadcast outlets; many broadcast outlets were not counted in this figure as Nielsen viewer/listener num-bers are not published for these outlets).
During the 2012–13 fiscal year, the campaign’s media relations efforts focused on reaching high school stu-dents and current California community college stu-dents by providing ready-to-print template financial aid articles to school publications. The articles were created to accompany activities in the three key time frames for the campaign: the March 2nd Cal Grant Deadline; April’s Financial Aid Awareness Month; and high school graduation.
Outreach
Grassroots outreach has helped launch the “I Can Af-ford College” campaign directly into the heart of under-served communities and established the campaign as a valuable resource on financial aid. With its proven track record, the campaign has experienced great success where it matters: in the community.
Efforts to build partnerships with community and faith-based organizations continued in 2011–12 and 2012–13. Since the campaign’s inception, relationships have been built with more than 200 community and faith-based organizations across the state, including the Community Youth Center, L.A. Alliance, Junior Achievement of SoCal, College Track, Puente Program and many others. Through these relationships, target audiences are hearing our messages from community members and organizations they trust. In addition to distributing “I Can Afford College” collateral materials, the campaign has engaged community organizations to utilize their social media channels to help promote the campaign and the availability of free one-on-one assistance with the financial aid process.
Additionally, during 2011–12 and 2012–13, the cam-paign participated in more than 30 community events

40Report on California Community College Student Financial Aid Programs for 2011–12 and 2012–13California Community Colleges Chancellor’s Office
across the state, from youth-targeted events to confer-ences for educational advocates. Events included the Asian Pacific Youth Leadership Project Conference, Festival de La Familia, CareerGPS, Los Angeles Cash For College “College and Career Convention,” Black College Expo and Student Athlete Symposium, Nation-al Hispanic College Fair, Tet Festival, and the Mexican Consulate’s “Steps to College.”
Community events have been a successful tool for raising awareness among parents, current and potential students and education advocates that cost should never be a barrier to higher education and that financial aid is available year-round at the California Community Colleges.
A screen image from the I Can Afford College online advertising campaign in Spanish.
The campaign continued to engage with target audi-ences through social media outreach in 2011–12 and 2012–13, as well, with regular postings on our Facebook and Twitter pages. Posts on both sites included re-minders about upcoming financial aid deadlines, details about the different types of financial aid available for California community college students, and information about upcoming financial aid workshops and events. At the end of the 2012–13 fiscal year, the “I Can Afford College” Facebook page had more than 3,900 ‘likes’ and the “I Can Afford College” Twitter page had more than 1,200 ‘followers.’
California Community Colleges Financial Aid Awareness Month in April (2012 & 2013)
As a result of the highly publicized Cal Grant deadline, many students falsely believe they cannot apply for college financial aid beyond March 2. The California Community Colleges Financial Aid Awareness Month takes place in April to inform students that it’s not too late to apply for financial aid for the upcoming academic year.
The ninth annual California Community Colleges Financial Aid Awareness Month (FAAM) took place in April 2013, marking yet another collaborative effort between the campaign and local campus financial aid offices. During FAAM in 2013, 80 colleges promoted more than 220 free financial aid workshops on icanaf-fordcollege.com to help students identify and apply for the financial aid programs that are available year-round. During the eighth annual FAAM the previous year (April 2012), 79 colleges promoted more than 200 free financial aid workshops on icanaffordcollege.com, for a combined total of more than 420 workshops offered during FAAM in 2012 and 2013.
In addition to these events, our paid radio and online advertising campaigns that ran during FAAM each year (see Advertising section above for more details), as well as other outreach efforts, drove interested parties to icanaffordcollege.com where they received valuable financial aid information and up-to-date information on financial aid workshops taking place in their community.

AC K N OW L E D G M E N T S
Chancellor Brice W. Harris would like to acknowledge and thank those individuals who have made significant
contributions to this report.
C H A N C E L L O R ’S O F F I C E CA L I F O R N I A C O M M U N IT Y C O L L E G E S
Erik Skinner, deputy chancellor
S T U D E N T S E RV I C E S D I V I S I O N
Rhonda Mohr, deanTim Bonnel, student financial assistance specialist
Ruby Nieto, program assistantSteve Arena, retired annuitant
I N S T I T U T I O N A L E F F E C T I V E N E S S A N D T E C H N O L O GY, R E S E A R C H , A N D I N F O R M AT I O N SYS T E M S
Theresa D. Tena, vice chancellorDebra Connick, vice chancellor
Alice van Ommeren, deanMyrna Huffman, administrator
Debbie Gutierrez, retired annuitant
C O M M U N I CAT I O N S D I V I S I O N
Paul Feist, vice chancellorPaige Marlatt Dorr, director of communications

California Community Colleges Chancellor’s Office1102 Q Street
Sacramento, CA 95811www.cccco.edu