OHLONE COMMUNITY COLLEGE DISTRICT - Californiatrackprop30.ca.gov/AuditReport/CCD/2015/Ohlone...
81
OHLONE COMMUNITY COLLEGE DISTRICT AUDIT REPORT JUNE 30, 2015
Transcript of OHLONE COMMUNITY COLLEGE DISTRICT - Californiatrackprop30.ca.gov/AuditReport/CCD/2015/Ohlone...
OHLONE COMMUNITY COLLEGE
DISTRICT
AUDIT REPORT
JUNE 30, 2015

OHLONE COMMUNITY COLLEGE DISTRICT
TABLE OF CONTENTS
FOR THE YEAR ENDED JUNE 30, 2015
FINANCIAL SECTION
Independent Auditors’ Report ............................................................................................................................................. 1 Basic Financial Statements
Management’s Discussion and Analysis ................................................................................................................... 4 Statement of Net Position .......................................................................................................................................... 13 Statement of Revenues, Expenses and Changes in Net Position .......................................................................... 14 Statement of Cash Flows ............................................................................................................................................ 15 Statement of Fiduciary Net Position ......................................................................................................................... 17 Statement of Changes in Fiduciary Net Position .................................................................................................... 18 Discretely Presented Component Units – Statement of Financial Position ........................................................ 19 Discretely Presented Component Units – Statement of Activities ....................................................................... 20 Discretely Presented Component Units – Statement of Cash Flows.................................................................... 21
Notes to Financial Statements ............................................................................................................................................ 22
REQUIRED SUPPLEMENTARY INFORMATION
Schedule of Postemployment Healthcare Benefit Funding Progress ............................................................................ 50 Schedule of the District’s Proportionate Share of the Net Pension Liability ‐ STRS ................................................... 51 Schedule of the District’s Proportionate Share of the Net Pension Liability ‐ PERS ................................................... 52 Schedule of District Contributions ‐ STRS ........................................................................................................................ 53 Schedule of District Contributions ‐ PERS ........................................................................................................................ 54 Notes to Required Supplementary Information............................................................................................................... 55
SUPPLEMENTARY INFORMATION
Schedule of Expenditures of Federal Awards .................................................................................................................. 56 Schedule of State Financial Assistance .............................................................................................................................. 57 Schedule of Workload Measure for State General Apportionment Annual (Actual) Attendance ............................ 58 Reconciliation of Annual Financial and Budget Report (CCFS‐311) with District Accounting Records ................. 59 Reconciliation of the ECS 84362 (50 Percent Law) Calculation ...................................................................................... 60 Details of Education Protection Account .......................................................................................................................... 61 Schedule of General Fund Financial Trends and Analysis ............................................................................................. 62

OHLONE COMMUNITY COLLEGE DISTRICT
TABLE OF CONTENTS
FOR THE YEAR ENDED JUNE 30, 2015
OTHER INDEPENDENT AUDITORS’ REPORTS
Report on Internal Control Over Financial Reporting and on Compliance and Other Matters Based on an Audit
of Financial Statements Performed in Accordance with Government Auditing Standards .......................................... 63 Report on Compliance For Each Major Federal Program; and Report on Internal Control Over Compliance
Required by OMB Circular A‐133...................................................................................................................................... 65 Report on State Compliance ................................................................................................................................................ 67
SCHEDULE OF FINDINGS AND QUESTIONED COSTS
Summary of Auditors’ Results ........................................................................................................................................... 69 Schedule of Findings and Questioned Costs Related to the Financial Statements ...................................................... 70 Schedule of Findings and Questioned Costs Related to Federal Awards .................................................................... 71 Schedule of Findings and Questioned Costs Related to State Awards ......................................................................... 72 Summary Schedule of Prior Audit Findings .................................................................................................................... 73

FINANCIAL SECTION

Corporate O�ce:348 Olive Street
San Diego, CA 92103
toll-free: 877.220.7229tel: 619.270.8222fax: 619.260.9085
www.christywhite.com
Christy White, CPA
Michael Ash, CPA
Heather Rubio
SAN DIEGO
LOS ANGELES
SAN FRANCISCO/BAY AREA
1
INDEPENDENT AUDITORS’ REPORT
The Board of Trustees
Ohlone Community College District
Fremont, California
Report on the Financial Statements
We have audited the accompanying basic financial statements of the business‐type activity,
and the aggregate discretely presented component units of the Ohlone Community College
District, as of and for the year ended June 30, 2015, and the related notes to the financial
statements, which collectively comprise the Ohlone Community College District’s basic
financial statements as listed in the table of contents.
Management’s Responsibility for the Financial Statements
Management is responsible for the preparation and fair presentation of these financial
statements in accordance with accounting principles generally accepted in the United States
of America; this includes the design, implementation, and maintenance of internal control
relevant to the preparation and fair presentation of financial statements that are free from
material misstatement, whether due to fraud or error.
Auditor’s Responsibility
Our responsibility is to express opinions on these financial statements based on our audit.
We conducted our audit in accordance with auditing standards generally accepted in the
United States of America and the standards applicable to financial audits contained in
Government Auditing Standards, issued by the Comptroller General of the United States.
Those standards require that we plan and perform the audit to obtain reasonable assurance
about whether the financial statements are free from material misstatement.
An audit involves performing procedures to obtain audit evidence about the amounts and
disclosures in the financial statements. The procedures selected depend on the auditorʹs
judgment, including the assessment of the risks of material misstatement of the financial
statements, whether due to fraud or error. In making those risk assessments, the auditor
considers internal control relevant to the entityʹs preparation and fair presentation of the
financial statements in order to design audit procedures that are appropriate in the
circumstances, but not for the purpose of expressing an opinion on the effectiveness of the
entityʹs internal control. Accordingly, we express no such opinion. An audit also includes
evaluating the appropriateness of accounting policies used and the reasonableness of
significant accounting estimates made by management, as well as evaluating the overall
presentation of the financial statements.

2
We believe that the audit evidence we have obtained is sufficient and appropriate to provide a basis for our audit
opinions.
Opinions
In our opinion, the financial statements referred to above present fairly, in all material respects, the respective
financial position of the business‐type activity, the aggregate discretely presented component units and the
fiduciary funds of Ohlone Community College District, as of June 30, 2015, and the respective changes in financial
position and, where applicable, cash flows thereof for the year then ended in accordance with accounting principles
generally accepted in the United States of America.
Other Matters
Required Supplementary Information
Accounting principles generally accepted in the United States of America require that the required supplementary
information, such as management’s discussion and analysis on pages 4 through 12 and the schedule of
postemployment healthcare benefit funding progress on page 49 be presented to supplement the basic financial
statements. Such information, although not part of the basic financial statements, is required by the Governmental
Accounting Standards Board who considers it to be an essential part of financial reporting for placing the basic
financial statements in appropriate operational, economic, or historical context. We have applied certain limited
procedures to the required supplementary information in accordance with auditing standards generally accepted
in the United States of America, which consisted of inquiries of management about the methods of preparing the
information and comparing the information for consistency with management’s responses to our inquiries, the
basic financial statements, and other knowledge we obtained during our audit of the basic financial statements. We
do not express an opinion or provide any assurance on the information because the limited procedures do not
provide us with sufficient evidence to express an opinion or provide any assurance.
Supplementary Information
Our audit was conducted for the purpose of forming opinions on the financial statements that collectively comprise
the Ohlone Community College District’s basic financial statements. The supplementary information listed in the
table of contents, including the schedule of expenditures of Federal awards, which is required by the U.S. Office of
Management and Budget Circular A‐133, Audits of State, Local Governments, and Non‐Profit Organizations, is
presented for purposes of additional analysis and is not a required part of the basic financial statements.
The supplementary information listed in the table of contents is the responsibility of management and was derived
from and relates directly to the underlying accounting and other records used to prepare the basic financial
statements. Such information has been subjected to the auditing procedures applied in the audit of the basic
financial statements and certain additional procedures, including comparing and reconciling such information
directly to the underlying accounting and other records used to prepare the basic financial statements or to the
basic financial statements themselves, and other additional procedures in accordance with auditing standards
generally accepted in the United States of America. In our opinion, the supplementary information is fairly stated,
in all material respects, in relation to the basic financial statements as a whole.
3
Other Reporting Required by Government Auditing Standards
In accordance with Government Auditing Standards, we have also issued our report dated November 16, 2015 on our
consideration of Ohlone Community College District’s internal control over financial reporting and on our tests of
its compliance with certain provisions of laws, regulations, contracts, and grant agreements and other matters. The
purpose of that report is to describe the scope of our testing of internal control over financial reporting and
compliance and the results of that testing, and not to provide an opinion on internal control over financial
reporting or on compliance. That report is an integral part of an audit performed in accordance with Government
Auditing Standards in considering Ohlone Community College District’s internal control over financial reporting
and compliance.
San Diego, California
November 16, 2015

OHOLONE COMMUNITY COLLEGE DISTRICT
4
MANAGEMENT’S DISCUSSION AND ANALYSIS
FOR THE YEAR ENDED JUNE 30, 2015
ORGANIZATION
Ohlone Community College District (the “District”) was established on July 1, 1966, and is comprised of an area
approximately 534 acres in Fremont and 80 acres in Newark. There was no change in the boundaries of the District
during the current year.
The Board of Trustees and District Administration for the fiscal year ended June 30, 2015, were comprised of the
following members:
Member Office Term Expires
Mr. Greg Bonaccorsi Chair December 2016
Mr. Richard Watters Vice Chair December 2018
Ms. Teresa Cox Member December 2016
Ms. Jan Giovannini‐Hill Member December 2018
Ms. Vivien Larsen Member December 2018
Mr. Ishan Shah Member December 2016
Mr. Garrett S. Yee Member December 2018
Mr. Rahul Patel Member May 2016
Name
Gari Browning, Ph.D.
Leta Stagnaro, Ed D.
Ron Travenick, Ed D
Chris De La Rosa
Shairon Zingsheim
Ronald D. Little Vice President of Administrative Services
Associate Vice President of IT
District Executive Team
Board of Trustees
Title
President/ Superintendent
Vice President of Academic Affairs/ Deputy Superintendent
Vice President of Student Services
Associate Vice President of HR & Training

OHLONE COMMUNITY COLLEGE DISTRICT
MANAGEMENT’S DISCUSSION AND ANALYSIS, continued
FOR THE YEAR ENDED JUNE 30, 2015
5
OVERVIEW AND ANALYSIS OF THE FINANCIAL STATEMENTS
Net Position
The following management’s discussion and analysis provides an overview of the financial position and activities
of the District’s Financial Report for the fiscal year that ended June 30, 2015. As required, the annual report consists
of three basic financial statements that provide information on the District as a whole; the Statement of Net
Position; the Statement of Revenues, Expenses and Changes in Net Position; and the Statement of Cash Flows. The
information provided on the statements that follow includes all funds, with the exception of the Associated
Students of Ohlone College (ASOC) funds shown on page 17 of the audit and the Ohlone College Foundation,
which is a separate entity. Each statement will be reviewed and discussed separately.
ACCOUNTING STANDARDS
In June 1999, the Governmental Accounting Standards’ Board (GASB) released Statement No. 34, “Basic Financial
Statement and Management’s Discussion and Analysis for State and Local Governments,” which changed the
reporting format for annual financial statements. In November 1999, GASB released Statement No. 35, “Basic
Financial Statement and Management’s Discussion and Analysis for Public Colleges and Universities,” which
applies these reporting standards to public colleges and universities. The Ohlone Community College District
continues to present its financial statements in this reporting format.
The following management’s discussion and analysis provides an overview of the financial position and activities
of the Ohlone Community College District’s Financial Report for the year ended June 30, 2015. The previous year’s financial statements that provide information on the District as a whole:
The Statement of Net Position
The Statement of Revenues, Expenses and Changes in Net Position
The Statement of Cash Flows
Each of these statements will be reviewed and significant events discussed.
BUDGET HIGHLIGHTS
Passage of Proposition 30, slow, but positive growth in the economy, and resultant tax revenues allowed for the
highest funding increase in history. The increase in funding was used by the state to buy down the “wall of debt”
and continue implementation of Local Control Funding Formula (LCFF) at the level proposed in the Governor’s
proposal in January of 2014. Not included in the state budget was funding to address the increased employer costs
to deal with the unfunded liability in the CalSTRS fund or payments on prior years state mandates.

OHLONE COMMUNITY COLLEGE DISTRICT
MANAGEMENT’S DISCUSSION AND ANALYSIS, continued
FOR THE YEAR ENDED JUNE 30, 2015
6
FINANCIAL HIGHLIGHTS
The state budget included a .85% COLA. A plan to fully fund CalSTRS by 2045‐46 began July 1, 2014. Employer
contribution rates to increase from 8.25% to 19.1% over seven years. The rate for 2014/15 increased to 9.5%. GASB
68 became effective June 15, 2014. This standard calls for employers (Local Education Authorities) to recognize
their proportionate share of the following in their financial statements: total net pension liability, pension expense
and deferred inflows and outflows.
The employer CalPERS contribution rate changed from 11.442% in 2013/14 to 11.771% in 2014/15. The rate is
projected to increase each year to 20.4% in 2020/21.
Measure A, the District’s $150 Million General Obligation Bond, approved by voters in 2002, came to a close in
2013‐14. Since the bond was passed, multiple projects have been completed on the Fremont Campus with bond
proceeds including the construction of the Student Services Center Building. Measure A funds also supported the
construction of Ohlone’s Newark Center, which opened for classes in January of 2008. The Chemistry classroom
modular on the Fremont campus was the final Measure‐A project to be completed in 2013‐14. The fund was closed
as of June 30, 2014.
Measure G, the District’s $349 Million General Obligation Bond, was approved by voters in late 2010. In November
2011 the District issued Series A Measure G bonds for a total of $80 million. $10 millions of these proceeds were
slated as a Technology Endowment, invested in tax exempt bonds, and place in a trust fund. The District
subsequently issued Series B Measure G bonds in the amount of $75 million in August, 2014. Construction began
on the award winning South Parking Structure in January of 2014 and was completed in August, 2015. This
parking structure, which provides over 900 parking spaces, was officially opened in September, 2015 and is
currently utilized by our students. In addition to the parking structure, the renovation of the Athletic Fields is
currently underway and is expected to be completed in the summer of 2016. Since the construction of the Academic
Core building is expected to be launched in early 2016, it is anticipated that Measure G, Series C will also be issued
in the Spring of 2016.

OHLONE COMMUNITY COLLEGE DISTRICT
MANAGEMENT’S DISCUSSION AND ANALYSIS, continued
FOR THE YEAR ENDED JUNE 30, 2015
7
ENROLLMENT HIGHLIGHTS
Full Time Equivalent Students (FTES) at the District increased by 3.1% in fiscal year 2014‐15 compared to fiscal year
2013‐14. This increase was due to course sections added as a result of California State workload restoration/Prop 30
approvals. Still, the 2014‐15 FTES levels are well below (‐3%) the District’s peak enrollment of 2008‐09.
A brief history of the District’s FTES is provided below.
Resident Credit Total FTES
2008‐09 8401 8839
2009‐10 8130 8579
2010‐11 8363 8851
2011‐12 7698 8240
2012‐13 7765 8336
2013‐14 7888 8466
2014‐15 8133
8,401
8,130
8,363
7,698
7,765
7,888
8,133
‐ 1,000 2,000 3,000 4,000 5,000 6,000 7,000 8,000 9,000
08‐09
09‐10
10‐11
11‐12
12‐13
13‐14
14‐15
Annual Resident Credit FTES by Year

OHLONE COMMUNITY COLLEGE DISTRICT
MANAGEMENT’S DISCUSSION AND ANALYSIS, continued
FOR THE YEAR ENDED JUNE 30, 2015
8
STATEMENT OF NET POSITION
The Statement of Net Position presents information on the District’s assets, deferred outflows of resources,
liabilities, deferred inflows of resources and net position. Over time, increases or decreases in net position may
serve as a useful indicator of whether the financial position of the District is improving or deteriorating.
2015 2014 Net Change
ASSETS
Current assets 35,153,787$ 33,927,184$ 1,226,603$
Non‐current assets 367,101,211 288,716,175 78,385,036
Total Assets 402,254,998 322,643,359 79,611,639
DEFERRED OUTFLOWS OF RESOURCES
Deferred outflows related to pensions 6,497,261 ‐ 6,497,261
Total Deferred Outflows of Resources 6,497,261 ‐ 6,497,261
LIABILITIES
Current liabilities 27,272,193 22,186,486 5,085,707
Non‐current liabilities 307,350,647 209,290,459 98,060,188
Total Liabilities 334,622,840 231,476,945 103,145,895
DEFERRED INFLOWS OF RESOURCES
Deferred inflows related to pensions 10,299,141 ‐ 10,299,141
Total Deferred Inflows of Resources 10,299,141 ‐ 10,299,141
NET POSITION
Net investment in capital assets (16,136,786) 33,332,816 (49,469,602)
Restricted 28,078,017 44,740,832 (16,662,815)
Unrestricted 51,889,047 13,092,766 38,796,281
Total Net Position 63,830,278$ 91,166,414$ (27,336,136)$
Assets
Total Assets have increased by $79.6 million year over year, an increase of 24.67%.
Current Assets
Current Assets consist of cash and cash equivalents held in the County Treasury, accounts receivable due from
State, Federal and local grants, contracts and general apportionment earned, but not received by year‐end, and
prepaid expenditures that are paid prior to year‐end, but that relate to the next fiscal year. Current Assets
increased by $1.2 million primarily due to higher state apportionment and no deferrals.
Non‐Current Assets
Non‐Current Assets consist of restricted cash and cash equivalents related to capital projects, investments related to
Technology Endowment, cost of bond issuances, and net capital assets reported at the historical cost of land,
buildings and equipment less accumulated depreciation, where applicable. Non‐current assets increased by $78.4
million primarily due to the issuance of Measure G bond, series B in 2014‐15.
OHLONE COMMUNITY COLLEGE DISTRICT
MANAGEMENT’S DISCUSSION AND ANALYSIS, continued
FOR THE YEAR ENDED JUNE 30, 2015
9
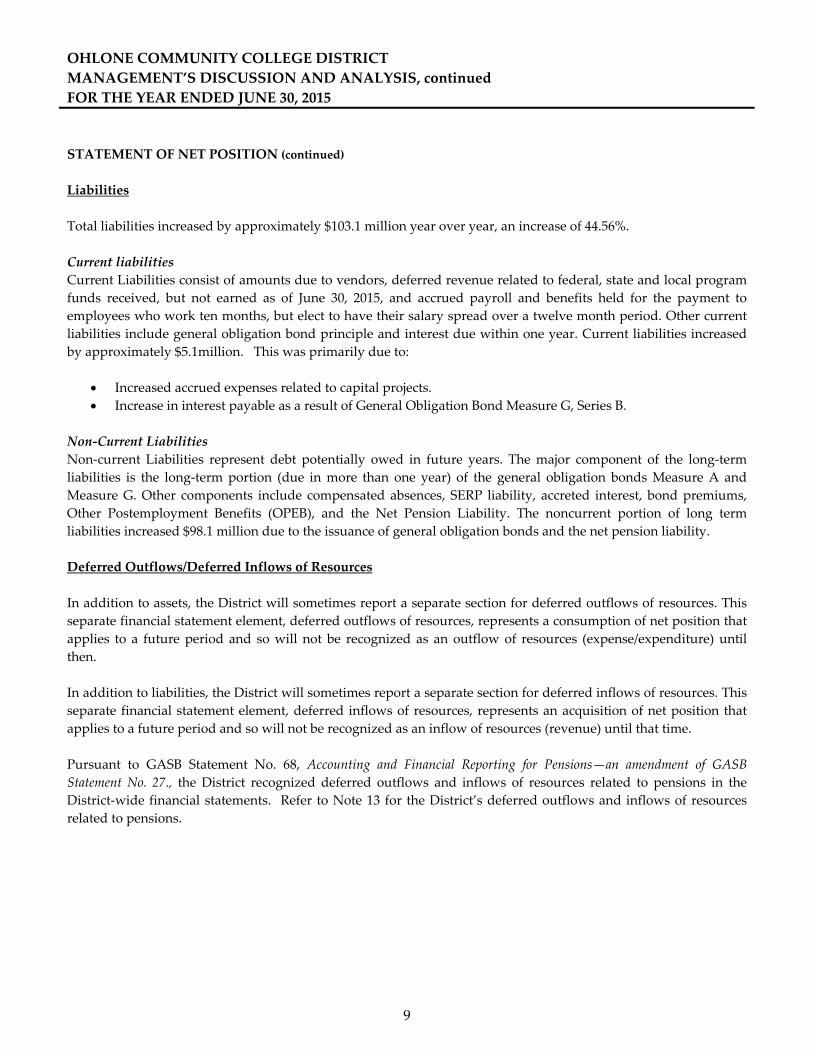
STATEMENT OF NET POSITION (continued)
Liabilities
Total liabilities increased by approximately $103.1 million year over year, an increase of 44.56%.
Current liabilities
Current Liabilities consist of amounts due to vendors, deferred revenue related to federal, state and local program
funds received, but not earned as of June 30, 2015, and accrued payroll and benefits held for the payment to
employees who work ten months, but elect to have their salary spread over a twelve month period. Other current
liabilities include general obligation bond principle and interest due within one year. Current liabilities increased
by approximately $5.1million. This was primarily due to:
Increased accrued expenses related to capital projects.
Increase in interest payable as a result of General Obligation Bond Measure G, Series B.
Non‐Current Liabilities
Non‐current Liabilities represent debt potentially owed in future years. The major component of the long‐term
liabilities is the long‐term portion (due in more than one year) of the general obligation bonds Measure A and
Measure G. Other components include compensated absences, SERP liability, accreted interest, bond premiums,
Other Postemployment Benefits (OPEB), and the Net Pension Liability. The noncurrent portion of long term
liabilities increased $98.1 million due to the issuance of general obligation bonds and the net pension liability.
Deferred Outflows/Deferred Inflows of Resources
In addition to assets, the District will sometimes report a separate section for deferred outflows of resources. This
separate financial statement element, deferred outflows of resources, represents a consumption of net position that
applies to a future period and so will not be recognized as an outflow of resources (expense/expenditure) until
then.
In addition to liabilities, the District will sometimes report a separate section for deferred inflows of resources. This
separate financial statement element, deferred inflows of resources, represents an acquisition of net position that
applies to a future period and so will not be recognized as an inflow of resources (revenue) until that time.
Pursuant to GASB Statement No. 68, Accounting and Financial Reporting for Pensions—an amendment of GASB
Statement No. 27., the District recognized deferred outflows and inflows of resources related to pensions in the
District‐wide financial statements. Refer to Note 13 for the District’s deferred outflows and inflows of resources
related to pensions.

OHLONE COMMUNITY COLLEGE DISTRICT
MANAGEMENT’S DISCUSSION AND ANALYSIS, continued
FOR THE YEAR ENDED JUNE 30, 2015
10
STATEMENT OF REVENUES, EXPENSES, AND CHANGES IN NET POSITION
The Statement of Revenues, Expenses and Changes in Net Position present information showing how the District’s
net position changed during the most recent fiscal year. All changes in net position are reported when the
underlying event giving rise to the change occurs, regardless of the timing of related cash flows. Thus, revenues
and expenses are reported in this statement for some items that will result in cash flows in future fiscal periods,
such as revenues pertaining to receivables and expenses pertaining to earned, but unused, compensated balances.
2015 2014 $ Change
Total operating revenue 25,860,698$ 22,211,728$ 3,648,970$
Total operating expenses 70,739,343 68,144,106 2,595,237
Operating loss (44,878,645) (45,932,378) 1,053,733
Net non‐operating revenue (expenses) 42,666,869 37,970,485 4,696,384
Loss before capital revenue (2,211,776) (7,961,893) 5,750,117
Capital revenues 17,663,723 17,584,271 79,452
Increase (decrease) in net position 15,451,947 9,622,378 5,829,569
Net position ‐ beginning of the year 91,166,414 83,438,821 7,727,593
Adjustment for restatement (See Note 13) (42,788,083) 5,280,677 (48,068,760)
Net position ‐ as restated 48,378,331 81,544,036 (33,165,705)
Net position ‐ end of the year 63,830,278$ 91,166,414$ (27,336,136)$
Operating Revenues
Total Operating Revenues increased roughly $3.6 million, an increase of 15.07% due to an increase in student
tuition and Categorical and grant programs funding compared to FY 2013‐14.
Operating Expenses
Total Operating Expenses increased by 3.81%, almost $2.6 million. Items of significance affecting the changes
include:
Increase in salary and benefit costs due to one time off schedule pay and steps and columns as well as
filling vacant positions.
Increased depreciation cost due to an increase in Fixed Assets related to capital projects.
Net Non‐Operating Revenues (Expenses)
Net Non‐Operating Revenues increased by $4.7 million, a 15.07% increase, mainly due to higher state
apportionment
Capital contributions
Capital contributions increased by 0.45%, approximately $79 thousand due primarily to higher local property tax
apportionment.
OHLONE COMMUNITY COLLEGE DISTRICT
MANAGEMENT’S DISCUSSION AND ANALYSIS, continued
FOR THE YEAR ENDED JUNE 30, 2015
11
District’s Fiduciary Responsibility
The District is the trustee, or fiduciary, for certain amounts held on behalf of students, clubs, and donors for
student loans and scholarships. The District’s fiduciary activities are reported in a separate statement of fiduciary
net position. These activities are excluded from the District’s other financial statements because these assets cannot
be used to finance operations. The District is responsible for ensuring that the assets reported in these funds are
used for their intended purposes.
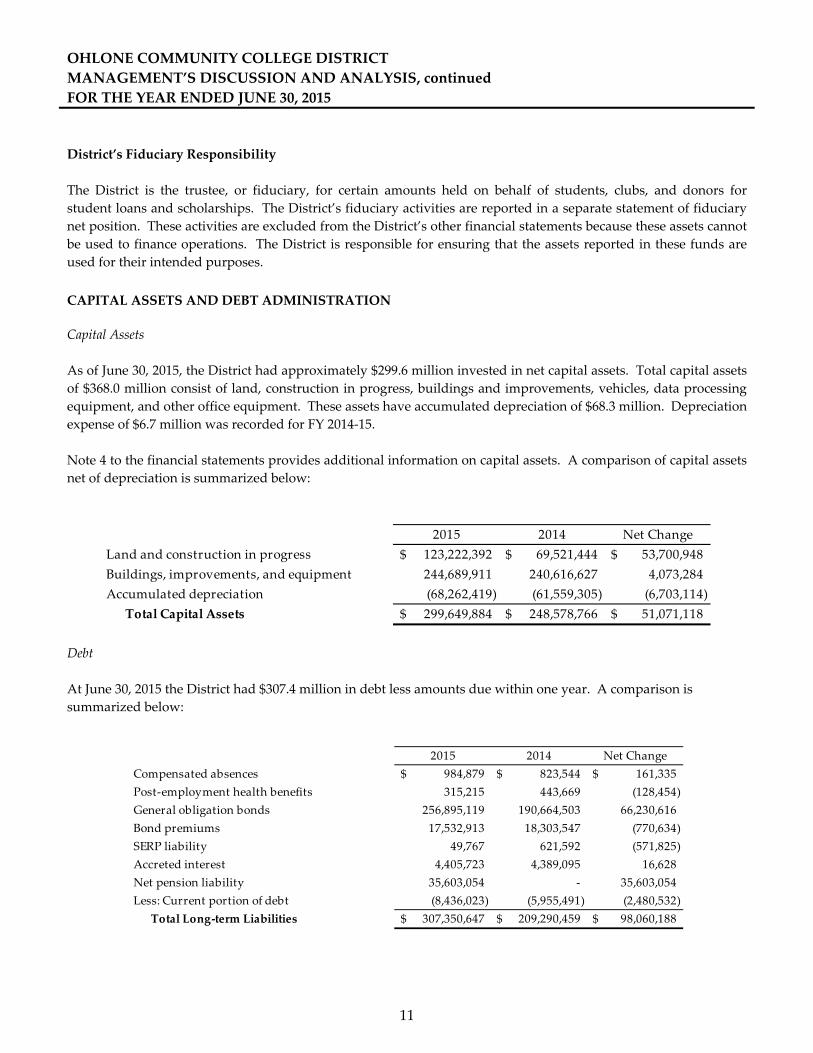
CAPITAL ASSETS AND DEBT ADMINISTRATION
Capital Assets
As of June 30, 2015, the District had approximately $299.6 million invested in net capital assets. Total capital assets
of $368.0 million consist of land, construction in progress, buildings and improvements, vehicles, data processing
equipment, and other office equipment. These assets have accumulated depreciation of $68.3 million. Depreciation
expense of $6.7 million was recorded for FY 2014‐15.
Note 4 to the financial statements provides additional information on capital assets. A comparison of capital assets
net of depreciation is summarized below:
2015 2014 Net Change
Land and construction in progress 123,222,392$ 69,521,444$ 53,700,948$
Buildings, improvements, and equipment 244,689,911 240,616,627 4,073,284
Accumulated depreciation (68,262,419) (61,559,305) (6,703,114)
Total Capital Assets 299,649,884$ 248,578,766$ 51,071,118$
Debt
At June 30, 2015 the District had $307.4 million in debt less amounts due within one year. A comparison is
summarized below:
2015 2014 Net Change
Compensated absences 984,879$ 823,544$ 161,335$
Post‐employment health benefits 315,215 443,669 (128,454)
General obligation bonds 256,895,119 190,664,503 66,230,616
Bond premiums 17,532,913 18,303,547 (770,634)
SERP liability 49,767 621,592 (571,825)
Accreted interest 4,405,723 4,389,095 16,628
Net pension liability 35,603,054 ‐ 35,603,054
Less: Current portion of debt (8,436,023) (5,955,491) (2,480,532)
Total Long‐term Liabilities 307,350,647$ 209,290,459$ 98,060,188$

OHLONE COMMUNITY COLLEGE DISTRICT
MANAGEMENT’S DISCUSSION AND ANALYSIS, continued
FOR THE YEAR ENDED JUNE 30, 2015
12
ECONOMIC OUTLOOK AND FACTORS AFFECTING NEXT YEAR’S BUDGET
The 2015‐16 California State budget for community colleges includes a cost of living adjustment (COLA) of 1.02%
on the general purpose apportionment and 3% of growth/restoration funding statewide. Additional State funds
provide for deferred maintenance, instructional equipment, full‐time faculty hiring, Student Equity and Student
Success and Support Programs. Funding is also provided to help offset the additional obligation to fund
employees’ retirement benefits including STRS, PERS and OPEB. The trend for State General Fund revenues to
exceed estimates continues and has led to large amounts of one‐time funding for community colleges. Enrollment
at the college for fiscal year 2015‐16 is expected to remain flat at the 2014‐15 level. No growth is assumed in the
2015‐16 college budget.
REQUEST FOR INFORMATION
The financial report is designed to provide a general overview of the District’s finances. Questions concerning this
report or requests for additional financial information should be addressed to the Ohlone Community College
District, Fiscal Services Department, 43600 Mission Blvd, Fremont, CA 94539.

OHLONE COMMUNITY COLLEGE DISTRICT
See accompanying notes to the financial statements.
13
STATEMENT OF NET POSITION – PRIMARY GOVERNMENT
JUNE 30, 2015
Business‐Type Activity
ASSETS Primary Government
CURRENT ASSETS
Cash and cash equivalents 32,707,684$
Accounts receivable 2,031,713
Prepaid expenses 414,390
Total Current Assets 35,153,787
NONCURRENT ASSETS
Restricted cash and cash equivalents 57,451,327
Investment held in trust 10,000,000
Capital assets, net of accumulated depreciation 299,649,884
Total Noncurrent Assets 367,101,211
TOTAL ASSETS 402,254,998
DEFERRED OUTFLOWS OF RESOURCES
Deferred outflows related to pensions 6,497,261
TOTAL DEFERRED OUTFLOWS OF RESOURCES 6,497,261
LIABILITIES
CURRENT LIABILITIES
Accounts payable and accrued liabilities 8,756,906
Unmatured interest 4,979,661
Deferred revenue 5,099,603
Current Portion ‐ long‐term liabilities 8,436,023
Total Current Liabilities 27,272,193
NONCURRENT LIABILITIES
Noncurrent portion ‐ long‐term liabilities 307,350,647
TOTAL LIABILITIES 334,622,840
DEFERRED INFLOWS OF RESOURCES
Deferred inflows related to pensions 10,299,141
TOTAL DEFERRED INFLOWS OF RESOURCES 10,299,141
NET POSITION
Net investment in capital assets (16,136,786)
Restricted for:
Capital projects 17,069,153
Financial aid 95,085
Debt service 9,313,427
Educational programs 1,600,352
Unrestricted 51,889,047
TOTAL NET POSITION 63,830,278$

OHLONE COMMUNITY COLLEGE DISTRICT
See accompanying notes to the financial statements.
14
STATEMENT OF REVENUES, EXPENSES
AND CHANGES IN NET POSITION ‐ PRIMARY GOVERNMENT
FOR THE YEAR ENDED JUNE 30, 2015
Business‐Type Activity
Primary Government
OPERATING REVENUES
Student Tuition and Fees 13,845,986$
Less: Scholarship discount & allowance (3,634,690)
Net tuition & fees 10,211,296
Grants and Contracts, noncapital:
Federal 2,698,240
State 12,773,336
Local 177,826
Subtotal 15,649,402
TOTAL OPERATING REVENUES 25,860,698
OPERATING EXPENSES
Salaries 39,834,752
Benefits 7,177,389
Financial aid 7,638,615
Supplies, materials, & other operating expenses 8,796,107
Depreciation 7,292,480
TOTAL OPERATING EXPENSES 70,739,343
OPERATING LOSS (44,878,645)
NONOPERATING REVENUES/(EXPENSES)
State apportionments, non‐capital 13,374,794
Local property taxes 17,439,194
Financial aid 6,266,817
State taxes & other revenues 3,107,312
Investment income ‐ Non‐capital 43,300
Investment income ‐ Capital 257,729
Interest expense (26,231)
Other non‐operating revenues 2,203,954
TOTAL NONOPERATING REVENUES (EXPENSES) 42,666,869
LOSS BEFORE OTHER REVENUES AND GAINS (2,211,776)
OTHER REVENUES AND GAINS/(LOSSES)
State apportionments, capital 663,353
Local property tax and revenues ‐ Capital 17,003,287
Loss on disposal of equipment (2,917)
TOTAL OTHER REVENUES AND GAINS 17,663,723
CHANGE IN NET POSITION 15,451,947
BEGINNING NET POSITION 91,166,414
ADJUSTMENT FOR RESTATEMENT (see Note 14) (42,788,083)
NET POSITION, AS RESTATED 48,378,331
ENDING NET POSITION 63,830,278$
OHLONE COMMUNITY COLLEGE DISTRICT
See accompanying notes to the financial statements.
15
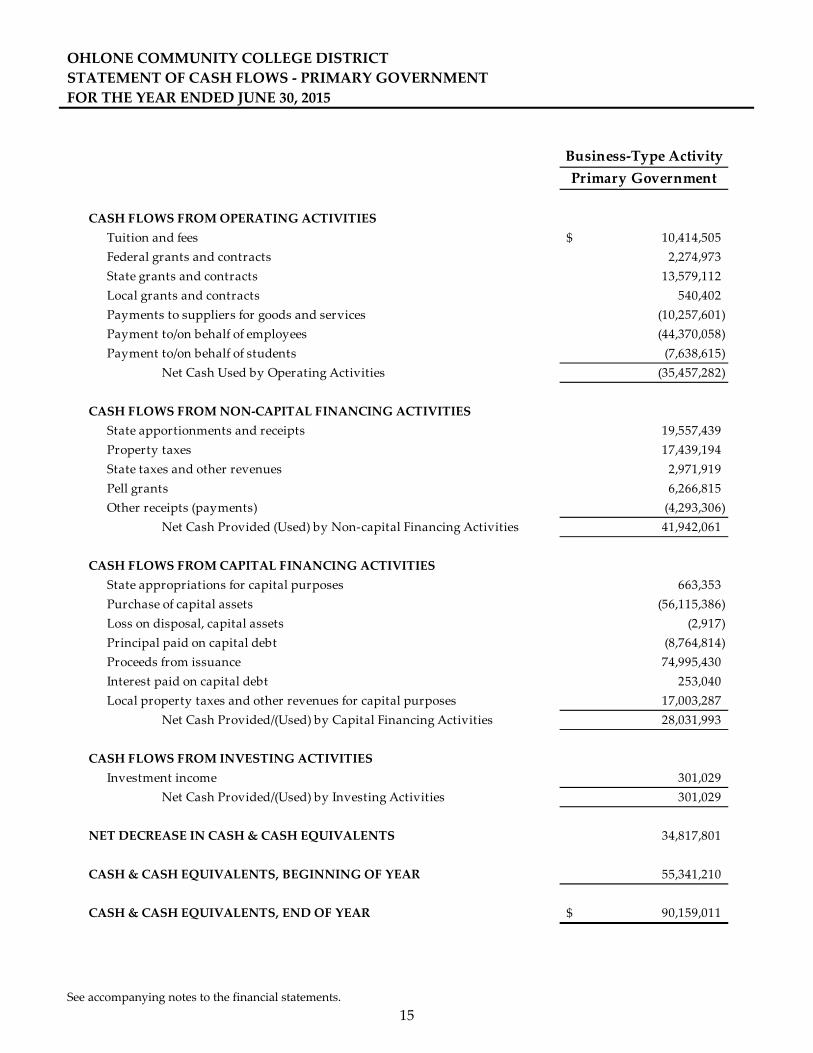
STATEMENT OF CASH FLOWS ‐ PRIMARY GOVERNMENT
FOR THE YEAR ENDED JUNE 30, 2015
Business‐Type Activity
Primary Government
CASH FLOWS FROM OPERATING ACTIVITIES
Tuition and fees 10,414,505$
Federal grants and contracts 2,274,973
State grants and contracts 13,579,112
Local grants and contracts 540,402
Payments to suppliers for goods and services (10,257,601)
Payment to/on behalf of employees (44,370,058)
Payment to/on behalf of students (7,638,615)
Net Cash Used by Operating Activities (35,457,282)
CASH FLOWS FROM NON‐CAPITAL FINANCING ACTIVITIES
State apportionments and receipts 19,557,439
Property taxes 17,439,194
State taxes and other revenues 2,971,919
Pell grants 6,266,815
Other receipts (payments) (4,293,306)
Net Cash Provided (Used) by Non‐capital Financing Activities 41,942,061
CASH FLOWS FROM CAPITAL FINANCING ACTIVITIES
State appropriations for capital purposes 663,353
Purchase of capital assets (56,115,386)
Loss on disposal, capital assets (2,917)
Principal paid on capital debt (8,764,814)
Proceeds from issuance 74,995,430
Interest paid on capital debt 253,040
Local property taxes and other revenues for capital purposes 17,003,287
Net Cash Provided/(Used) by Capital Financing Activities 28,031,993
CASH FLOWS FROM INVESTING ACTIVITIES
Investment income 301,029
Net Cash Provided/(Used) by Investing Activities 301,029
NET DECREASE IN CASH & CASH EQUIVALENTS 34,817,801
CASH & CASH EQUIVALENTS, BEGINNING OF YEAR 55,341,210
CASH & CASH EQUIVALENTS, END OF YEAR 90,159,011$

OHLONE COMMUNITY COLLEGE DISTRICT
STATEMENT OF CASH FLOWS ‐ PRIMARY GOVERNMENT, continued
FOR THE YEAR ENDED JUNE 30, 2015
See accompanying notes to the financial statements.
16
Business‐Type Activity
Primary Government
RECONCILIATION OF OPERATING LOSS TO NET CASH
USED BY OPERATING ACTIVITIES
Operating loss (44,878,645)$
Adjustments to Reconcile Operating Loss to Net Cash Used by
Operating Activities:
Depreciation expense 7,292,480
Changes in Assets and Liabilities:
Accounts receivable, net 193,820
Inventory and prepaids 391,456
Accounts payable (1,786,046)
Unearned revenue 754,475
Compensated absences (7,023,685)
Retiree health benefits (128,454)
SERP liability (571,825)
Net pension liability 10,299,142
Net Cash Flows From Operating Activities (35,457,282)$
OHLONE COMMUNITY COLLEGE DISTRICT
See accompanying notes to the financial statements.
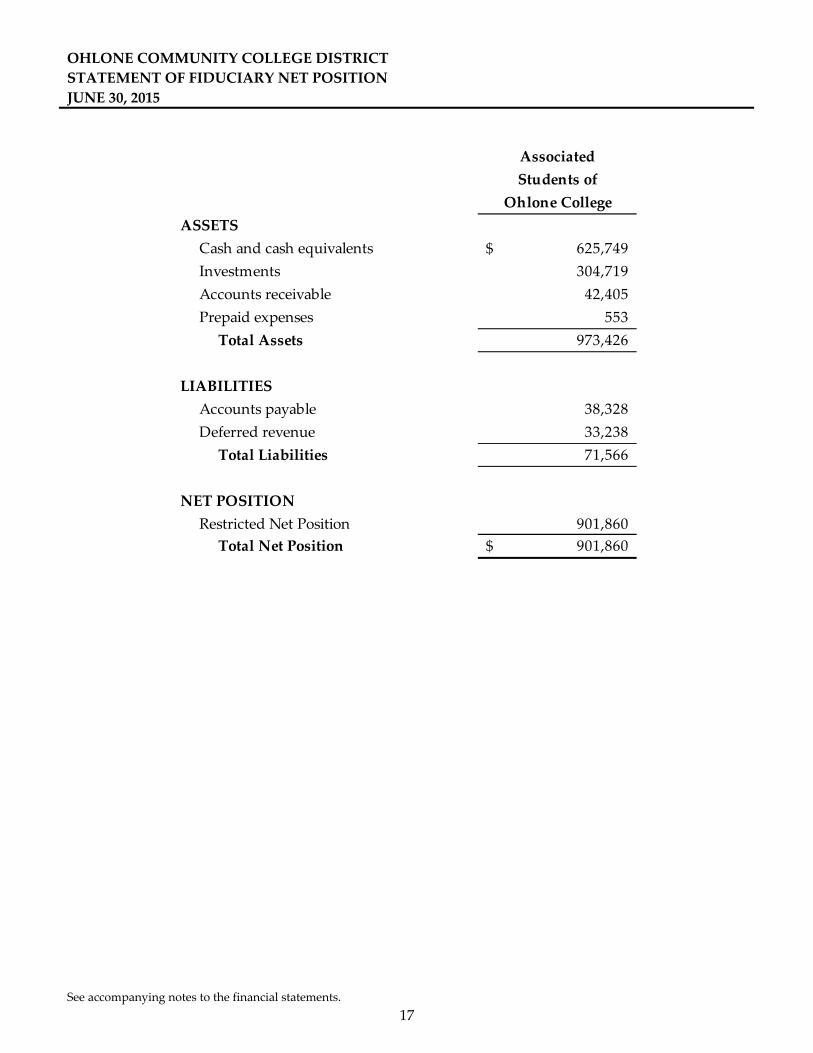
17
STATEMENT OF FIDUCIARY NET POSITION
JUNE 30, 2015
Associated
Students of
Ohlone College
ASSETS
Cash and cash equivalents 625,749$
Investments 304,719
Accounts receivable 42,405
Prepaid expenses 553
Total Assets 973,426
LIABILITIES
Accounts payable 38,328
Deferred revenue 33,238
Total Liabilities 71,566
NET POSITION
Restricted Net Position 901,860
Total Net Position 901,860$

OHLONE COMMUNITY COLLEGE DISTRICT
See accompanying notes to the financial statements.
18
STATEMENT OF CHANGES IN FIDUCIARY NET POSITION
FOR THE YEAR ENDED JUNE 30, 2015
Additions
Interest and investment income 1,471$
Sales and other local revenues 537,550
Total Additions 539,021
Deductions
Salaries 48,940
Benefits 1,893
Supplies and materials 255,586
Other operating expenses and services 63,620
Capital outlay 3,872
Scholarships 3,750
Other payments to students 154,401
Total Deductions 532,062
CHANGE IN NET POSITION 6,959
NET POSITION, BEGINNING OF YEAR 894,901
NET POSITION, END OF YEAR 901,860$
Associated Students
of Ohlone College
OHLONE COMMUNITY COLLEGE DISTRICT
See accompanying notes to the financial statements.
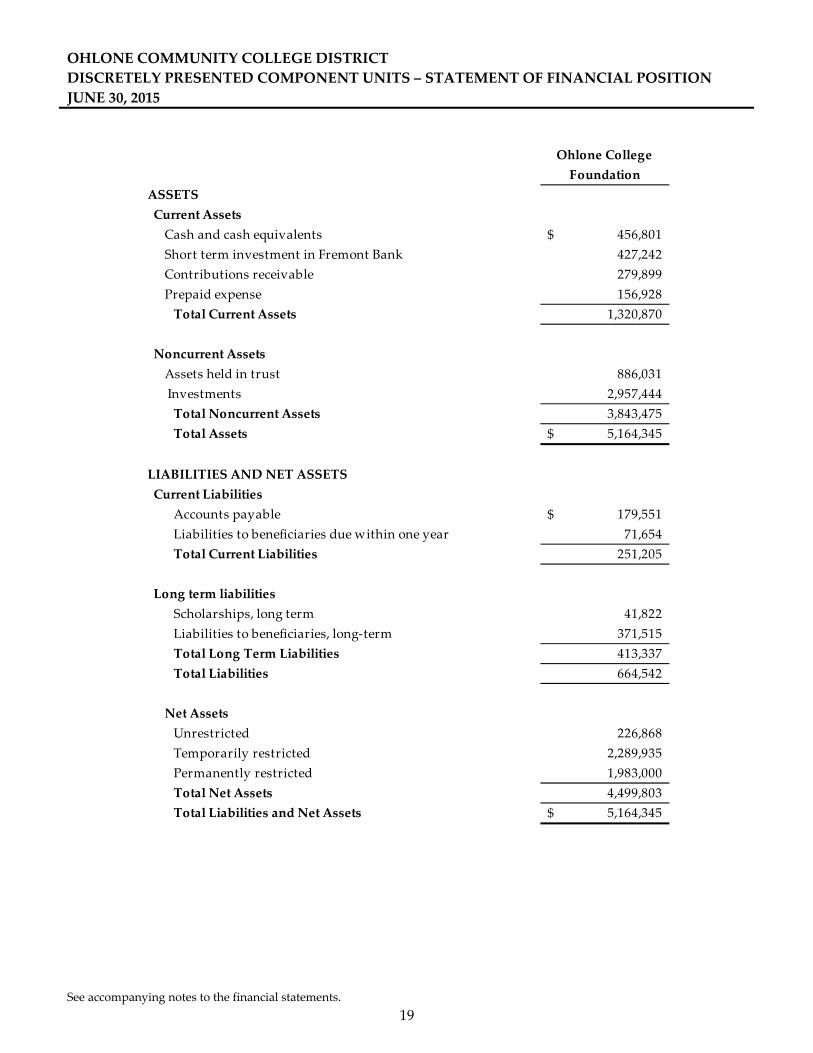
19
DISCRETELY PRESENTED COMPONENT UNITS – STATEMENT OF FINANCIAL POSITION
JUNE 30, 2015
Ohlone College
Foundation
ASSETS
Current Assets
Cash and cash equivalents 456,801$
Short term investment in Fremont Bank 427,242
Contributions receivable 279,899
Prepaid expense 156,928
Total Current Assets 1,320,870
Noncurrent Assets
Assets held in trust 886,031
Investments 2,957,444
Total Noncurrent Assets 3,843,475
Total Assets 5,164,345$
LIABILITIES AND NET ASSETS
Current Liabilities
Accounts payable 179,551$
Liabilities to beneficiaries due within one year 71,654
Total Current Liabilities 251,205
Long term liabilities
Scholarships, long term 41,822
Liabilities to beneficiaries, long‐term 371,515
Total Long Term Liabilities 413,337
Total Liabilities 664,542
Net Assets
Unrestricted 226,868
Temporarily restricted 2,289,935
Permanently restricted 1,983,000
Total Net Assets 4,499,803
Total Liabilities and Net Assets 5,164,345$

OHLONE COMMUNITY COLLEGE DISTRICT
See accompanying notes to the financial statements.
20
DISCRETELY PRESENTED COMPONENT UNITS – STATEMENT OF ACTIVITIES
FOR THE YEAR ENDED JUNE 30, 2015
Temporarily Permanently
Unrestricted Restricted Restricted Total
SUPPORT AND REVENUES
Contributions 575,533$ 862,606$ 15,000$ 1,453,139$
Donated materials and services 20,862 ‐ ‐ 20,862
Investment income, net 1,718 25,054 ‐ 26,772
Change in value split interest agreements ‐ (7,334) (7,334)
Transfers ‐ (3,500) 3,500 ‐
Net assets released from restriction
Purpose restriction satisfied 320,655 (320,655) ‐ ‐
Total Support and Revenues 918,768 556,171 18,500 1,493,439
EXPENSES
Program services 451,023 ‐ ‐ 451,023
General and administrative 201,315 ‐ ‐ 201,315
Fundraising 369,109 ‐ ‐ 369,109
Total Expenses 1,021,447 ‐ ‐ 1,021,447
CHANGE IN NET ASSETS (102,679) 556,171 18,500 471,992
Net Assets ‐ Beginning 329,547 1,733,764 1,964,500 4,027,811
Net Assets ‐ Ending 226,868$ 2,289,935$ 1,983,000$ 4,499,803$
Ohlone College Foundation

OHLONE COMMUNITY COLLEGE DISTRICT
See accompanying notes to the financial statements.
21
DISCRETELY PRESENTED COMPONENT UNITS – STATEMENT OF CASH FLOWS
FOR THE YEAR ENDED JUNE 30, 2015
Ohlone College
Foundation
CASH FLOWS FROM OPERATING ACTIVITIES
Change in net assets 471,992$
Adjustments to reconcile change in net assets to net cash
provided by operating activities
Increase in operating assets
Accounts receivable (275,337)
Decrease in prepaid expense (151,224)
Other assets 1,217
Increase in operating liabilities
Accounts payable 8,697
Liabilities to beneficiaries due within one year 4,950
Net cash provided by operating activities 60,295
CASH FLOWS FROM INVESTING ACTIVITIES
Proceeds from sales and maturities of investments 3,623
Net cash provided by investing activities 3,623
NET DECREASE IN CASH AND CASH EQUIVALENTS 63,918
Cash and cash equivalents ‐ Beginning 392,883
Cash and cash equivalents ‐ Ending 456,801$

OHLONE COMMUNITY COLLEGE DISTRICT
22
NOTES TO FINANCIAL STATEMENTS
JUNE 30, 2015
NOTE 1 – SUMMARY OF SIGNIFICANT ACCOUNTING POLICIES
A. Reporting Entity
The Ohlone County Community College District (District) is the level of government primarily accountable for
activities related to public education. The governing authority consists of elected officials who, together,
constitute the Board of Trustees.
Component units are legally separate organizations for which the District is financially accountable.
Component units may also include organizations that are fiscally dependent on the District, in that the District
approves their budget, the issuance of their debt or the levying of their taxes. In addition, component units are
other legally separate organizations for which the District is not financially accountable but the nature and
significance of the organizationʹs relationship with the District is such that exclusion would cause the Districtʹs
financial statements to be misleading or incomplete. For financial reporting purposes, the component units
have a financial and operational relationship which meets the reporting entity definition criteria of the
Governmental Accounting Standards Board (GASB) Statement No. 14, as amended by GASBS No. 39,
Determining Whether Certain Organizations Are Component Units and GASBS No. 61, The Financial Reporting
Entity: Omnibus, and thus are included in the financial statements of the District.
Based upon the application of the criteria listed above, the following component units have been included
through discrete presentation:
The Foundation for the Ohlone Community College District is a separate not‐for‐profit corporation. The
Foundation Board of Governors are appointed independent of any District Board of Trustee’s elections. The
Board is responsible for approving their own budgets and accounting and finance related activities, however,
the District’s governing board has fiscal responsibility over the Foundation.
Separate audited financial reports for the Foundation may be obtained through the District.
In addition, the District maintains a fiduciary fund which is composed of a trust fund as follows:
Associated Student Government Funds – These funds are held on behalf of students of the District under a
formal trust agreement between the associated student government and the District.
Separate financial statements are not prepared for trust and agency funds.

OHLONE COMMUNITY COLLEGE DISTRICT
NOTES TO FINANCIAL STATEMENTS, continued
JUNE 30, 2015
23
NOTE 1 – SUMMARY OF SIGNIFICANT ACCOUNTING POLICIES (continued)
B. Measurement Focus
For financial reporting purposes, the District is considered a special‐purpose government engaged only in
business‐type activities as defined by GASB Statements No. 34 and No. 35 as amended by GASB Statements
No. 37 and No. 38. This presentation provides a comprehensive entity‐wide perspective of the Districtʹs assets,
liabilities, activities, and cash flows and replaces the fund group perspective previously required. Accordingly
the Districtʹs financial statements have been presented using the economic resources measurement focus and
the accrual basis of accounting. The significant accounting policies followed by the District in preparing these
financial statements are in accordance with accounting principles generally accepted in the United States of
America as prescribed by GASB. Additionally, the Districtʹs policies comply with the California Community
Colleges Chancellorʹs Office Budget and Accounting Manual. Under the accrual basis, revenues are recognized
when earned, and expenses are recorded when an obligation has been incurred. All material intra‐agency and
intra‐fund transactions have been eliminated.
C. Basis of Accounting
Revenues resulting from exchange transactions, in which each party gives and receives essentially equal value,
are classified as operating revenues. These transactions are recorded on the accrual basis when the exchange
takes place. Available means that the resources will be collected within the current fiscal year or are expected to
be collected soon enough thereafter to be used to pay liabilities of the current fiscal year. For the District,
operating revenues consist primarily of student fees.
Non‐exchange transactions, in which the District receives value without directly giving equal value in return,
include State apportionments, property taxes, certain Federal and State grants, entitlements, and donations
Property tax revenue is recognized in the fiscal year received. State apportionment revenue is earned based
upon criteria set forth from the Community Colleges Chancellorʹs Office and includes reporting of full‐time
equivalent students (FTES) attendance. The corresponding apportionment revenue is recognized in the period
the FTES are generated. Revenue from Federal and State grants and entitlements are recognized in the fiscal
year in which all eligibility requirements have been satisfied. Eligibility requirements may include time and/or
purpose requirements.
Operating expenses are costs incurred to provide instructional services including support costs, auxiliary
services, and depreciation of capital assets. All other expenses not meeting this definition are reported as
nonoperating. Expenses are recorded on the accrual basis as they are incurred, when goods are received, or
services are rendered.
The District reports are based on all applicable GASB pronouncements, as well as applicable Financial
Accounting Standards Board (FASB) pronouncements issued on or before November 30, 1989, unless those
pronouncements conflict or contradict

OHLONE COMMUNITY COLLEGE DISTRICT
NOTES TO FINANCIAL STATEMENTS, continued
JUNE 30, 2015
24
NOTE 1 – SUMMARY OF SIGNIFICANT ACCOUNTING POLICIES (continued)
D. Financial Statement Presentation
The financial statements are presented in accordance with the reporting model as prescribed in GASB
Statement No. 34, Basic Financial Statements and Managementʹs Discussion and Analysis for State and Local
Governments, and GASB Statement No. 35, Basic Financial Statements and Managementʹs Discussion and Analysis
for Public Colleges and Universities, as amended by GASB Statements No. 37 and No. 38. The business‐type
activities model followed by the District requires the following components of the Districtʹs financial
statements:
Managementʹs Discussion and Analysis
Basic Financial Statements for the District as a whole including:
o Statements of Net Position ‐ Primary Government
o Statements of Revenues, Expenses, and Changes in Net Position ‐ Primary Government
o Statements of Cash Flows ‐ Primary Government
o Financial Statements for the Fiduciary Funds including:
o Statements of Fiduciary Net Position
o Statements of Changes in Fiduciary Net Position
Notes to the Financial Statements
E. Cash and Cash Equivalents
The District’s cash and cash equivalents are considered to be cash on hand, demand deposits and short‐term
investments with original maturities of three months or less from the date of acquisition. Cash in the Alameda
County Treasury is recorded at fair value in accordance with the requirements of GASB Statement No. 31,
Accounting and Financial Reporting for Certain Investments and for External Investments Pools.
F. Accounts Receivable
Accounts receivable consists primarily of amounts due from the federal government, state, and local
governments, or private sources, in connection with reimbursement of allowable expenses made pursuant to
the District’s grant and contracts.
G. Inventory
Inventories are presented at the lower of cost or market using the average cost method and are expensed when
used. Inventory consists of expandable instructional, custodial, health and other supplies held for
consumption.
H. Prepaid Expenses
Payments made to vendors for goods or services that will benefit periods beyond June 30, 2015, are recorded as
prepaid items using the consumption method. A current asset for the prepaid amount is recorded at the time
of the purchase and an expense is reported in the year in which goods or services are consumed.
OHLONE COMMUNITY COLLEGE DISTRICT
NOTES TO FINANCIAL STATEMENTS, continued
JUNE 30, 2015
25
NOTE 1 – SUMMARY OF SIGNIFICANT ACCOUNTING POLICIES (continued)
I. Restricted Cash and Cash Equivalents
Restricted cash and cash equivalents are those amounts externally restricted as to use pursuant to the
requirements of the District’s grants, contracts, and debt service requirements.
J. Capital Assets
Capital assets are recorded at cost at the date of acquisition. Donated capital assets are recorded at their
estimated fair value at the date of donation. For equipment, the District’s capitalization policy includes all
items with a unit cost of $5,000 or more and an estimated useful life of greater than one year. Buildings as well
as renovations to buildings, infrastructure, and land improvements that significantly increase the value or
extend the useful life of the structure are capitalized.
The cost of normal maintenance and repairs that does not add to the value of the asset or materially extend the
asset’s life is recorded in operating expense in the year in which the expense was incurred. Depreciation is
computed using the straight‐line method over the estimated useful lives of the assets, generally 50 years for
buildings, 10 years for site improvements, 8 years for equipment and vehicle, and 3 years for technology.
K. Accounts Payable
Accounts payable consists of amounts due to vendors.
L. Accrued Liabilities
Accrued liabilities consist of salaries and benefits payable, deferred summer pay and load banking. Load
banking hours consist of hours worked by instructors in excess of a full‐time load which they may carryover
for future paid time off.
M. Unearned Revenue
Tuition and fees received prior to June 30 for classes and programs offered in the subsequent fiscal year are
reported as unearned revenue.
Cash received for federal and state special projects and programs is recognized as revenue to the extent that
qualified expenses have been incurred. Unearned revenue is recorded to the extent cash received on specific
projects and programs exceed qualified expenses.

OHLONE COMMUNITY COLLEGE DISTRICT
NOTES TO FINANCIAL STATEMENTS, continued
JUNE 30, 2015
26
NOTE 1 – SUMMARY OF SIGNIFICANT ACCOUNTING POLICIES (continued)
N. Deferred Outflows/Deferred Inflows of Resources
In addition to assets, the District will sometimes report a separate section for deferred outflows of resources.
This separate financial statement element, deferred outflows of resources, represents a consumption of net
position that applies to a future period and so will not be recognized as an outflow of resources
(expense/expenditure) until then.
In addition to liabilities, the District will sometimes report a separate section for deferred inflows of resources.
This separate financial statement element, deferred inflows of resources, represents an acquisition of net
position that applies to a future period and so will not be recognized as an inflow of resources (revenue) until
that time.
O. Compensated Absences In accordance with GASB Statement No. 16, Accounting for Compensated Absences; accumulated unpaid
employee vacation benefits are recognized as a liability of the District as compensated absences in the
Statement of Net Position.
Sick leave benefits are accumulated without limit for each employee. Accumulated employee sick leave
benefits are not recognized as a liability of the District. The District’s policy is to record sick leave as an
operating expense in the period taken; however, unused sick leave is added to the creditable service period for
calculation of retirement benefits when the employee retires and within the constraints of the appropriate
retirement systems.
P. Net Position
GASB Statements No. 34 and No. 35 report equity as ʺNet Positionʺ and represent the difference between assets
and liabilities. The net position is classified according to imposed restrictions or availability of assets for
satisfaction of District obligations according to the following net asset categories:
Net Investment in Capital Assets: Consists of capital assets, net of accumulated depreciation and outstanding
principal balances of debt attributable to the acquisition, construction, or improvement of those assets. To the
extent debt has been incurred, but not yet expended for capital assets, such accounts are not included as a
component net invested in capital assets.
Restricted: Net position is reported as restricted when there are limitations imposed on their use, either
through enabling legislation adopted by the District, or through external restrictions imposed by creditors,
grantors, or laws or regulations of other governments. The District first applies restricted resources when an
expense is incurred for purposes for which both restricted and unrestricted resources are available.
Unrestricted: Net position that is not subject to externally imposed constraints. Unrestricted net position may
be designated for specific purposes by action of the Board of Trustees or may otherwise be limited by
contractual agreements with outside parties.

OHLONE COMMUNITY COLLEGE DISTRICT
NOTES TO FINANCIAL STATEMENTS, continued
JUNE 30, 2015
27
NOTE 1 – SUMMARY OF SIGNIFICANT ACCOUNTING POLICIES (continued)
Q. Pensions
For purposes of measuring the net pension liability, deferred outflows of resources and deferred inflows of
resources related to pensions, and pension expense, information about the fiduciary net position of the defined
benefit pension plans (the Plans) of the California State Teachers’ Retirement System (CalSTRS) and the
California Public Employees’ Retirement System (CalPERS) and additions to/deductions from the Plans’
fiduciary net position have been determined on the same basis as they are reported by the Plans. For this
purpose, benefit payments (including refunds of employee contributions) are recognized when due and
payable in accordance with the benefit terms. Investments are reported at fair value.
R. State Apportionments
The District does not receive state apportionments for the base calculation because it receives more than
sufficient revenues from enrollment fees and property taxes. The excess property taxes above the base revenue
calculations, is referred to as basic aid funds.
The District does receive state apportionments for categorical programs. These allocations are based upon
various financial and statistical information from the current and previous years.
S. Property Taxes
Property taxes are assessed and levied by the County of Alameda. Secured property taxes attach as an
enforceable lien on property as of January 1. These taxes are payable in two installments on November 1 and
February 1. Secured property taxes are considered delinquent after December 10 for the 1st installment and
April 10 for the 2nd installment. Unsecured property taxes are payable in one installment on or before August
31 and are delinquent after August 31.
The District reports real and personal property tax on an accrual basis. A receivable has been accrued in these
financial statements to reflect the amount of property taxes receivable as of June 30, 2015.
T. On‐Behalf Payments
GASB Statement No. 24, Accounting and Financial Reporting for Certain Grants and Other Financial
Assistance, requires that direct on‐behalf payments for fringe benefits and salaries made by one entity to a
third party recipient for the employees of another, legally separate entity be recognized as revenue and
expenditure by the employer government. The State of California makes direct on‐behalf payments for
retirement benefits to the State Teachers Retirement Systems (STRS) on behalf of all Community Colleges in
California. The amount of on‐behalf payments made for the District is estimated at $903,660 for STRS for the
year ended June 30, 2015. This amount has been reflected in the basic financial statements as a component of
non‐operating revenue and employee benefit expense.
OHLONE COMMUNITY COLLEGE DISTRICT
NOTES TO FINANCIAL STATEMENTS, continued
JUNE 30, 2015
28
NOTE 1 – SUMMARY OF SIGNIFICANT ACCOUNTING POLICIES (continued)
U. Classification of Revenues
The District has classified its revenues as either operating or nonoperating revenues according to the following
criteria:
Operating revenues: Operating revenues include activities that have the characteristics of exchange
transactions, such as student fees, net of scholarship discounts and allowances, and most federal, state and
local grants and contracts.
Nonoperating revenues: Nonoperating revenues include activities that have the characteristics of nonexchange
transactions, such as state apportionment, property taxes, state taxes, non‐capital federal grants and contracts
investment income, and other revenue sources.
V. Scholarship Discount and Allowances
Student tuition and fee revenues, and certain other revenues from students, are reported net of scholarship
discounts and allowances in the statement of revenues, expenses, and changes in net position. Scholarship
discounts and allowances are the difference between the stated charge for goods and services provided by the
District, and the amount that is paid by students and/or third parties making payments on the students’ behalf.
Certain governmental grants and other federal, state or nongovernmental programs are recorded as operating
revenues in the District’s financial statements. To the extent that revenues from such programs are used to
satisfy tuition and fees and other student charges, the District has recorded a scholarship discount and
allowance, included in the Board of Governors Grants (BOGG) waivers.
W. Estimates
The preparation of the financial statements in conformity with accounting principles generally accepted in the
United States of America requires management to make estimates and assumptions that affect the amounts
reported in the financial statements and accompanying notes. Actual results may differ from those estimates.
X. Foundation Financial Statement Presentation
The Ohlone County Community College District and the Foundation for Ohlone College present their financial
statements in accordance with Statement of Financial Accounting Codifications. Under these reporting
requirements, the Foundation is required to report information regarding their financial position and activities
according to three classes of net assets: unrestricted net assets, temporarily restricted net assets, and
permanently restricted net assets. As permitted by the codification, the Foundations do not use fund
accounting.
Permanently Restricted Net Assets: Net assets subject to donor‐imposed stipulations that they be maintained
permanently by the Foundation. Generally, the donors of these assets permit the Foundation to use all or part
of the income earned on related investments for general or specific purposes.
Temporarily Restricted Net Assets: Net assets subject to donor‐imposed stipulations that will be met by actions
of the Foundation and/or the passage of time.
OHLONE COMMUNITY COLLEGE DISTRICT
NOTES TO FINANCIAL STATEMENTS, continued
JUNE 30, 2015
29
NOTE 1 – SUMMARY OF SIGNIFICANT ACCOUNTING POLICIES (continued)
X. Foundation Financial Statement Presentation (continued)
Unrestricted Net Assets: Net assets not subject to donor‐imposed restrictions.
Revenues and expenses are recorded when incurred in accordance with the accrual basis of accounting.
Revenues are reported as increases in the unrestricted net assets classification unless use of the related assets is
limited by donor‐imposed restrictions. Contributions, including unconditional promises to give, are recognized
as revenue in the period received. Conditional promises to give are not recognized as revenue until the
conditions on which they depend are substantially met. Contributions for in‐kind gifts from outside sources are
recorded at their fair market value on the date of the donation.
Expenses are reported as decreases in unrestricted net assets. Gains and losses on investments and other assets
or liabilities are reported as increases or decreases in unrestricted net assets unless their use is restricted by
explicit donor stipulation or by law.
Investments are reported at fair value in accordance with FASB Accounting Standards Codification (ASC) 820,
Fair Value Measurements and Disclosures.
Y. New Accounting Pronouncements
GASB Statement No. 68 – In June 2012, GASB issued Statement No. 68, Accounting and Financial Reporting for
Pensions—an amendment of GASB Statement No. 27. The primary objective of this Statement is to improve
accounting and financial reporting by state and local governments for pensions. It also improves information
provided by state and local governmental employers about financial support for pensions that is provided by
other entities. This Statement results from a comprehensive review of the effectiveness of existing standards of
accounting and financial reporting for pensions with regard to providing decision‐useful information,
supporting assessments of accountability and interperiod equity, and creating additional transparency. The
Statement is effective for periods beginning after June 15, 2014. The District has implemented GASB Statement
No. 68 for the year ended June 30, 2015.
GASB Statement No. 71 – In November 2013, GASB issued Statement No. 71, Pension Transition for
Contributions Made Subsequent to the Measurement Date – an amendment of GASB Statement No. 68. This standard
seeks to clarify certain implementation issues related to amounts that are deferred and amortized at the time
GASB 68 is first adopted. It applies to situations in which the measurement date of an actuarial valuation
differs from the governmentʹs fiscal year. The Statement is effective for periods beginning after June 15, 2014.
The District has implemented GASB Statement No. 71 for the year ended June 30, 2015.
GASB Statement No. 72 – In February 2015, GASB issued Statement No. 72, Fair Value Measurement and
Application. This standard addresses accounting and financial reporting issues related to fair value
measurements. The Statement is effective for periods beginning after June 15, 2015. The District has not yet
determined the impact on the financial statements.

OHLONE COMMUNITY COLLEGE DISTRICT
NOTES TO FINANCIAL STATEMENTS, continued
JUNE 30, 2015
30
NOTE 1 – SUMMARY OF SIGNIFICANT ACCOUNTING POLICIES (continued)
Y. New Accounting Pronouncements (continued)
GASB Statement No. 73 – In June 2015, GASB issued Statement No. 73, Accounting and Financial Reporting for
Pensions and Related Assets That are Not within the Scope of GASB Statement 68, and Amendments to Certain
Provisions of GASB Statements 67 and 68. This standard establishes requirements for defined benefit pensions
that are not within the scope of GASB Statement 68 and amends certain provisions of GASB Statements 67 and
68. The Statement is effective for periods beginning after June 15, 2016. The District has not yet determined the
impact on the financial statements.
GASB Statement No. 75 – In June 2015, GASB issued Statement No. 75, Accounting and Financial Reporting for
Postemployment Benefits Other Than Pensions. This standard’s primary objective is to improve accounting and
financial reporting by state and local governments for postemployment benefits other than pensions. The
Statement is effective for periods beginning after June 15, 2017. The District has not yet determined the impact
on the financial statements.
NOTE 2 – CASH AND INVESTMENTS
A. Summary of Cash and Investments
Cash and investments as of June 30, 2015, consist of the following:
Primary
Government Foundation Fiduciary
Pooled Funds
Cash in County Treasury 88,333,390$ ‐$ ‐$
Deposits
Cash on hand and in banks 1,825,621 456,801 625,749
Total Cash and Cash Equivalents 90,159,011 456,801 625,749
Investments 10,000,000$ 3,384,686$ 304,719$
The District is authorized under California Government Code to make direct investments in local agency
bonds, notes, or warrants within the State; U.S. Treasury instruments; registered State warrants or treasury
notes; securities of the U.S. Government, or its agencies; bankers acceptances; commercial paper; certificates of
deposit placed with commercial banks and/or savings and loan companies; repurchase or reverse repurchase
agreements; medium term corporate notes; shares of beneficial interest issued by diversified management
companies, certificates of participation, obligations with first priority security; and collateralized mortgage
obligations

OHLONE COMMUNITY COLLEGE DISTRICT
NOTES TO FINANCIAL STATEMENTS, continued
JUNE 30, 2015
31
NOTE 2 – CASH AND INVESTMENTS (continued)
B. Investments
Investment in County Treasury
The District is considered to be an involuntary participant in an external investment pool as the District is
required to deposit all receipts and collections of monies with their County Treasurer (Education Code Section
(ECS) 41001). The fair value of the Districtʹs investment in the pool is reported in the accompanying financial
statements at amounts based upon the Districtʹs pro‐rata share of the fair value provided by the County
Treasurer for the entire portfolio (in relation to the amortized cost of that portfolio). The balance available for
withdrawal is based on the accounting records maintained by the County Treasurer, which is recorded on the
amortized cost basis.
The District’s Board Policy 3102 authorizes the District and the Associated Student Government to invest funds
in accordance with California Government Code Section 53600, et seq., which includes U.S Treasury
Obligations, federal agency securities, municipalities securities, asset‐backed securities, mortgage‐backed
securities, banker’s acceptances, commercial paper rated A‐1 by Standard and Poor’s Corporation (S&P) or P‐1
by Moody’s, negotiable certificates of deposit, medium‐term notes, repurchase agreements, time deposits,
shares of beneficial interest of a Joint Powers Authority that invests in authorized securities, shares of beneficial
interest issued by diversified management companies known as money market mutual funds (MMF),
registered with SEC, and the State’s Local Agency Investment Fund (LAIF).
The District and the Associated Student Government did not violate any provisions of the California
Government Code during the year June 30, 2015.
Interest Rate Risk
Interest rate risk is the risk that changes in interest rates will adversely affect the fair value of an investment.
Equity mutual funds are not subject to interest rate risk. The trust does not have a formal investment policy
that limits investments maturities as a means of managing its exposure to fair value losses arising from
increasing interest rates.
Credit Risk
Credit risk is the risk that an issuer or other counterparty to an investment will not fulfill its obligations.
Equity mutual funds are not subject to credit risk. The Trust investment policy establishes minimum
acceptable credit ratings for investments from any Nationally Recognized Statistical Rating Organization
(NRSROs).

OHLONE COMMUNITY COLLEGE DISTRICT
NOTES TO FINANCIAL STATEMENTS, continued
JUNE 30, 2015
32
NOTE 2 – CASH AND INVESTMENTS (continued)
Custodial Credit Risk
This is the risk that in the event of a bank failure, the Districtʹs deposits may not be returned to it. The District
does not have a policy for custodial credit risk. However, the California Government Code requires that a
financial institution secure deposits made by State or local governmental units by pledging securities in an
undivided collateral pool held by a depository regulated under State law (unless so waived by the
governmental unit). The market value of the pledged securities in the collateral pool must equal at least 110
percent of the total amount deposited by the public agency. As of June 30, 2015, a portion of the Districtʹs bank
balance was exposed to custodial credit risk because it was uninsured and collateralized with securities held by
the pledging financial institution, but not in the name of the District.
Concentration of Credit Risk
Concentration of credit risk is the risk of loss attributed to the magnitude of an investment in a single user. The
Trust and component unit’s investment policies limit investments to no more than 5% of assets invested in any
single equity security, any single debt security or investment in any mutual fund that holds more than 5% of its
portfolio in any single issue or issuer. The foregoing limitation is not intended to apply to the percentage of
assets invested in a single diversified mutual fund, obligations of the U.S Government and its agencies, U.S.
agency mortgage‐backed pass‐through securities, or to a mutual fund that invests in such obligations or
securities. The Trust accounts did not violate any provisions of the California Government Code or its
investment policy during the year ended June 30, 2015.
NOTE 3 – INTERFUND TRANSACTIONS
Interfund receivables and payables result when the interfund transfer is transacted after the close of the fiscal year.
Inferfund activity within the funds has been eliminated in the basic financial statements, except for balances that
are reflected between the business‐type activity and fiduciary funds.
NOTE 4 – ACCOUNTS RECEIVABLE
Accounts receivable as of June 30, 2015 are as follows:
Primary
Government Foundation Fiduciary
Federal 902,002$ ‐$ ‐$
State 1,093,148 ‐ ‐
Local 36,563 279,899 42,405
Total 2,031,713$ 279,899$ 42,405$
OHLONE COMMUNITY COLLEGE DISTRICT
NOTES TO FINANCIAL STATEMENTS, continued
JUNE 30, 2015
33
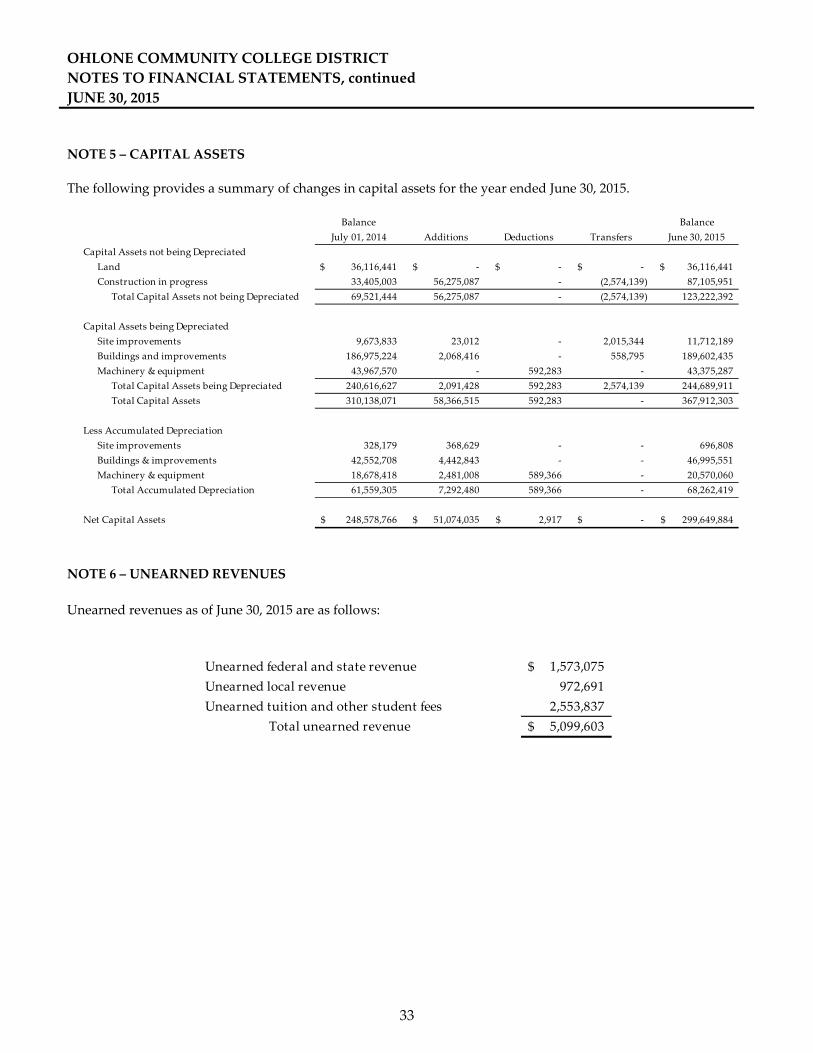
NOTE 5 – CAPITAL ASSETS
The following provides a summary of changes in capital assets for the year ended June 30, 2015.
Balance Balance
July 01, 2014 Additions Deductions Transfers June 30, 2015
Capital Assets not being Depreciated
Land 36,116,441$ ‐$ ‐$ ‐$ 36,116,441$
Construction in progress 33,405,003 56,275,087 ‐ (2,574,139) 87,105,951
Total Capital Assets not being Depreciated 69,521,444 56,275,087 ‐ (2,574,139) 123,222,392
Capital Assets being Depreciated
Site improvements 9,673,833 23,012 ‐ 2,015,344 11,712,189
Buildings and improvements 186,975,224 2,068,416 ‐ 558,795 189,602,435
Machinery & equipment 43,967,570 ‐ 592,283 ‐ 43,375,287
Total Capital Assets being Depreciated 240,616,627 2,091,428 592,283 2,574,139 244,689,911
Total Capital Assets 310,138,071 58,366,515 592,283 ‐ 367,912,303
Less Accumulated Depreciation
Site improvements 328,179 368,629 ‐ ‐ 696,808
Buildings & improvements 42,552,708 4,442,843 ‐ ‐ 46,995,551
Machinery & equipment 18,678,418 2,481,008 589,366 ‐ 20,570,060
Total Accumulated Depreciation 61,559,305 7,292,480 589,366 ‐ 68,262,419
Net Capital Assets 248,578,766$ 51,074,035$ 2,917$ ‐$ 299,649,884$
NOTE 6 – UNEARNED REVENUES
Unearned revenues as of June 30, 2015 are as follows:
Unearned federal and state revenue 1,573,075$
Unearned local revenue 972,691
Unearned tuition and other student fees 2,553,837
Total unearned revenue 5,099,603$

OHLONE COMMUNITY COLLEGE DISTRICT
NOTES TO FINANCIAL STATEMENTS, continued
JUNE 30, 2015
34
NOTE 7 – LONG TERM OBLIGATIONS
A schedule of changes in long‐term obligations for the year ended June 30, 2015 is shown below:
Restated
Balance Balance Balance Due Within
July 01, 2014 Restatement July 01, 2014 Additions Deductions June 30, 2015 One Year
Long‐Term Obligations
Compensated absences 823,544$ ‐$ 823,544 242,173$ 80,838$ 984,879$ 237,960$
Post‐employment health benefits 443,669 ‐ 443,669 ‐ 128,454 315,215 ‐
General obligation bonds 190,664,503 ‐ 190,664,503 74,995,430 8,764,814 256,895,119 6,728,262
Bond premiums 18,303,547 ‐ 18,303,547 649,400 1,420,034 17,532,913 1,420,034
SERP liability 621,592 ‐ 621,592 ‐ 571,825 49,767 49,767
Accreted interest 4,389,095 ‐ 4,389,095 596,814 580,186 4,405,723 ‐
Net pension liability ‐ 45,698,579 45,698,579 ‐ 10,095,525 35,603,054 ‐
Total 215,245,950$ 45,698,579$ 260,944,529$ 76,483,817$ 21,641,676$ 315,786,670$ 8,436,023$
Net Pension Liability
The District follows GASB Statement No. 68, Accounting and Financial Reporting for Pensions—an amendment of
GASB Statement No. 27. The District’s restated beginning net pension liability was $45,698,579, and was increased
by current year pension expense of $3,343,148, which was more than offset by current year decreases of $10,095,525
the ending net pension liability at June 30, 2015 was $35,603,054. See Note 8 for additional information regarding
the net pension liability
General Obligation Bonds
In June 2002 and August 2005, the District issued General Obligation Bonds totaling $150,000,000. These bonds
were issued to finance the acquisition, construction and modernization of property and facilities. The Current
Interest and Capital Appreciation Bonds interest and yield vary, ranging from 3.00% to 5.00% and are scheduled to
mature through August 2012 and August 2030 for the 2002 and 2005 issuances, respectively.
In 2010, the District issued General Obligation Refunding Bonds totaling $23,680,000. These bonds were issued to
advance refund a portion of the Districtʹs outstanding Election of 2002 General Obligation Bonds, Series A, and to
pay the costs of issuing the bonds. The bonds mature through August 2026 and bear interest at rates ranging from
2.00% to 4.50%. This refinancing saved District taxpayers approximately $3.5 million.
In November 2011, the District issued $70,000,000 and $10,000,000 in 2010 General Obligation Bonds, Series A and
Series A‐1, respectively. The Series A Bonds are being issued to finance the repair, upgrading, acquisition,
construction and equipping of certain District property and facilities approved by the Districtʹs registered voters
and to pay the cost of issuance associated with the Bonds. The Series A‐1 Bonds are being issued to fund a
technology endowment. Interest earnings from the endowment shall remain in the Building Fund and used for the
purposes of that fund. The Series A and Series A‐1 bonds will both mature through August 2041 and have interest
rates ranging between 2.00% and 5.25%.
In August 2012, the District issued General Obligation Refunding Bonds totaling $94,070,000. These bonds were
issued to advance refund a portion of the Districtʹs outstanding Election of 2002 General Obligation Bonds, Series B,
and to pay the costs of issuing the bonds. The bonds mature through August 2030 and bear interest at rates ranging
from 1.50% to 5.00%. This refinancing saved District taxpayers approximately $8.3 million.

OHLONE COMMUNITY COLLEGE DISTRICT
NOTES TO FINANCIAL STATEMENTS, continued
JUNE 30, 2015
35
NOTE 7 – LONG TERM OBLIGATIONS (continued)
General Obligation Bonds (continued)
In August 2014, the District issued $74,995,430 in 2010 General Obligation Bonds, Series B. The Series Bonds are
being issued to finance the repair, upgrading, acquisition, construction and equipping of certain District property
and facilities approved by the Districtʹs registered voters and to pay the cost of issuance associated with the Bonds.
Interest earnings from the endowment shall remain in the Building Fund and used for the purposes of that fund.
The Series B bonds will mature through August 2039 and have interest rates ranging between 1.00% and 4.00%.
The annual requirements to amortize General Obligation Bonds outstanding as of June 30, 2015 are as follows:
Year Ended
June 30, Principal Interest Total
2016 6,728,262$ 11,196,100$ 17,924,362$
2017 6,358,456 11,297,506 17,655,962
2018 6,901,993 11,351,070 18,253,063
2019 3,383,007 11,487,880 14,870,887
2020 3,597,970 11,712,818 15,310,788
2021‐2025 37,600,000 45,912,563 83,512,563
2026‐2030 65,046,640 34,671,048 99,717,688
2031‐2035 34,168,242 27,571,133 61,739,375
2036‐2040 30,650,549 26,503,427 57,153,976
2041‐2045 62,460,000 6,856,755 69,316,755
Total 256,895,119$ 198,560,300$ 455,455,419$
SERP Liability
During 2010, the District provided the option of a Supplemental Employee Retirement Plan (ʺSERPʺ) to the District
employees. As of June 30, 2015, there were 56 employees in the Plan. Employees under the SERP receive monthly
annuity benefits. The District is obligated to pay annual installments for the calculated benefits for employees
under the SERP and for the administration of the plan. The SERP liability outstanding as of June 30, 2015 is
$49,767.

OHLONE COMMUNITY COLLEGE DISTRICT
NOTES TO FINANCIAL STATEMENTS, continued
JUNE 30, 2015
36
NOTE 8 – EMPLOYEE PENSION PLANS
Qualified employees are covered under multiple‐employer defined benefit pension plans maintained by agencies
of the State of California. Academic employees are members of the State Teachers’ Retirement System (STRS) and
classified employees are members of the Public Employees’ Retirement System (PERS).
State Teachers’ Retirement System (STRS)
Plan Description
The District contributes to the State Teacher’s Retirement System (STRS), a cost‐sharing multiple‐employer public
employee retirement system defined benefit pension plan administered by STRS. The plan provides retirement,
disability and survivor benefits to beneficiaries. Benefit provisions are established by State statutes, as legislatively
amended, within the State Teachers’ Retirement Law. STRS issues a separate comprehensive annual financial
report that includes financial statements and required supplementary information. Copies of the STRS annual
financial report may be obtained from STRS, CalSTRS, 7919 Folsom Blvd., Sacramento, CA 95826.
Funding Policy
Active plan members are required to contribute 8.0% of their salary and the District is required to contribute a
statutorily determined rate. The actuarial methods and assumptions used for determining the rate are those
adopted by the STRS Teachers’ Retirement Board. The required employer contribution rate for fiscal year 2014‐2015 was 8.88% of annual payroll. The contribution requirements of the plan members are established and may be
amended by State statute.
Pension Liabilities, Pension Expense, and Deferred Outflows of Resources and Deferred Inflows of Resources Related to
Pensions
At June 30, 2015, the District reported a liability of $19,865,580 for its proportionate share of the net pension
liability. The net pension liability was measured as of June 30, 2014, and the total pension liability used to calculate
the net pension liability was determined by applying update procedures to an actuarial valuation as of June 30,
2013, and rolling forward the total pension liability to June 30, 2014. The District’s proportion of the net pension
liability was based on a projection of the District’s long‐term share of contributions to the pension plan relative to
the projected contributions of all participating school districts, actuarially determined. At June 30, 2014, the
District’s proportion was .112 percent, which did not change from its proportion measured as of June 30, 2013.
For the year ended June 30, 2015, the District recognized pension expense of $1,715,640. At June 30, 2015, the
District reported deferred outflows of resources and deferred inflows of resources related to pensions from the
following sources. Deferred Outflows Deferred Inflows
of Resources of Resources
Differences between projected and
actual earnings on plan investments ‐$ 4,892,600$
District contributions subsequent
to the measurement date 3,619,867 ‐
3,619,867$ 4,892,600$

OHLONE COMMUNITY COLLEGE DISTRICT
NOTES TO FINANCIAL STATEMENTS, continued
JUNE 30, 2015
37
NOTE 8 – EMPLOYEE PENSION PLANS (continued)
State Teachers’ Retirement System (STRS) (continued)
$3,619,867 reported as deferred outflows of resources related to pensions resulting from District contributions
subsequent to the measurement date will be recognized as a reduction of the net pension liability in the year ended
June 30, 2016. Other amounts reported as deferred outflows of resources and deferred inflows of resources related
to pensions will be recognized in pension expense as follows:
Deferred Inflows
Year Ended June 30, of Resources
2016 1,223,150$
2017 1,223,150
2018 1,223,150
2019 1,223,150
Total 4,892,600$
Actuarial assumptions
The total pension liability was determined by applying update procedures to an actuarial valuation as of June 30,
2013, and rolling forward the total pension liability to June 30, 2014 using the following actuarial assumptions,
applied to all periods included in the measurement:
Consumer Price Inflation 3.00%
Investment Yield (Net of Expenses) 7.50%
Wage Inflation 3.75%
Interest on Member Accounts 4.50%
CalSTRS uses custom mortality tables to best fit the patterns of mortality among its members. These custom tables
are based on RP2000 series tables adjusted to fit CalSTRS experience.
The actuarial assumptions used in the June 30, 2013 valuation were based on the results of an actuarial experience
study for the period July 1, 2006−June 30, 2010.

OHLONE COMMUNITY COLLEGE DISTRICT
NOTES TO FINANCIAL STATEMENTS, continued
JUNE 30, 2015
38
NOTE 8 – EMPLOYEE PENSION PLANS (continued)
State Teachers’ Retirement System (STRS) (continued)
The long‐term expected rate of return on pension plan investments was determined using a building‐block method
in which best‐estimate ranges of expected future real rates of return (expected returns, net of pension plan
investment expense and inflation) are developed for each major asset class. The best‐estimate ranges were
developed using capital market assumptions from CalSTRS general investment consultant (Pension Consulting
Alliance ‐ PCA) as an input to the process. Based on the model from CalSTRS consulting actuary’s (Milliman)
investment practice, a best estimate range was determined by assuming the portfolio is re‐balanced annually and
that annual returns are lognormally distributed and independent from year to year to develop expected percentiles
for the long‐term distribution of annualized returns. The assumed asset allocation by PCA is based on board policy
for target asset allocation in effect on February 2, 2012, the date the current experience study was approved by the
board. Best estimates of 10‐year geometric real rates of return and the assumed asset allocation for each major asset
class used as input to develop the actuarial investment rate of return are summarized in the following table:
Long‐Term*
Assumed Asset Expected Real
Asset Class Allocation Rate of Return
Global Equity 47% 4.50%
Private Equity 12% 6.20%
Real Estate 15% 4.35%
Inflation Sensitive 5% 3.20%
Fixed Income 20% 0.20%
Cash/Liquidity 1% 0.00%
100%
* 10‐year geometric average
Discount rate
The discount rate used to measure the total pension liability was 7.60 percent. The projection of cash flows used to
determine the discount rate assumed that contributions from plan members and employers will be made at
statutory contribution rates in accordance with the rate increases per AB 1469. Projected inflows from investment
earnings were calculated using the long‐term assumed investment rate of return (7.60 percent) and assuming that
contributions, benefit payments, and administrative expense occur midyear. Based on those assumptions, the
Plan’s fiduciary net position was projected to be available to make all projected future benefit payments to current
plan members. Therefore, the long‐term assumed investment rate of return was applied to all periods of projected
benefit payments to determine the total pension liability.

OHLONE COMMUNITY COLLEGE DISTRICT
NOTES TO FINANCIAL STATEMENTS, continued
JUNE 30, 2015
39
NOTE 8 – EMPLOYEE PENSION PLANS (continued)
State Teachers’ Retirement System (STRS) (continued)
Sensitivity of the District’s proportionate share of the net pension liability to changes in the discount rate
The following presents the District’s proportionate share of the net pension liability calculated using the discount
rate of 7.60 percent, as well as what the District’s proportionate share of the net pension liability would be if it were
calculated using a discount rate that is 1‐percentage‐point lower (6.60 percent) or 1‐percentage‐point higher (8.60
percent) than the current rate:
1% Current 1%
Decrease Discount Rate Increase
(6.60%) (7.60%) (8.60%)
Districtʹs proportionate share of
the net pension liability 30,969,920$ 19,868,580$ 10,612,080$
Pension plan fiduciary net position
Detailed information about the pension plan’s fiduciary net position is available in the separately issued CalSTRS
financial report.
Public Employees’ Retirement Systems (PERS)
Plan Description
The District contributes to the School Employer Pool under the California Public Employees’ Retirement System
(CalPERS), a cost‐sharing multiple‐employer public employee retirement system defined benefit pension plan
administered by CalPERS. The plan provides retirement and disability benefits, annual cost‐of‐living adjustments,
and death benefits to plan members and beneficiaries. Benefit provisions are established by State statutes, as
legislatively amended, within the Public Employees’ Retirement Law.
CalPERS issues a separate comprehensive annual financial report that includes required supplementary
information. Copies of the CalPERS’ annual financial report maybe obtained from the CalPERS Executive Office,
400 P Street, Sacramento, CA 95814.

OHLONE COMMUNITY COLLEGE DISTRICT
NOTES TO FINANCIAL STATEMENTS, continued
JUNE 30, 2015
40
NOTE 8 – EMPLOYEE PENSION PLANS (continued)
Public Employees’ Retirement Systems (PERS) (continued)
Funding Policy
Active plan members hired prior to January 1, 2013, are required to contribute 7% of their salary. The California
Public Employees’ Pension Reform Act (PEPRA), specifies that new members entering into the plan on or after
January 1, 2013, shall pay the higher of fifty percent of normal costs or 6.0% of their salary. Additionally, for new
members entering the plan on or after January 1, 2013, the employer is prohibited from paying any of the employee
contribution to CalPERS unless the employer payment of the member’s contribution is specified in an employment
agreement or collective bargaining agreement that expires after January 1, 2013.
The District is required to contribute an actuarially determined rate. The actuarial methods and assumptions used
for determining the rate are those adopted by the CalPERS Board of Administration. The required employer
contribution for fiscal year 2014‐2015 was 11.771% of annual payroll. The contribution requirements of the plan
members are established and may be amended by the State statute.
Pension Liabilities, Pension Expense, and Deferred Outflows of Resources and Deferred Inflows of Resources Related to
Pensions
At June 30, 2015, the District reported a liability of $15,734,475 for its proportionate share of the net pension
liability. The net pension liability was measured as of June 30, 2014, and the total pension liability used to calculate
the net pension liability was determined by applying update procedures to an actuarial valuation as of June 30,
2013, and rolling forward the total pension liability to June 30, 2014. The District’s proportion of the net pension
liability was based on a projection of the District’s long‐term share of contributions to the pension plan relative to
the projected contributions of all participating school districts, actuarially determined. At June 30, 2014, the
District’s proportion was .378 percent, which did not change from its proportion measured as of June 30, 2013.
For the year ended June 30, 2015, the District recognized pension expense of $1,398,473. At June 30, 2015, the
District reported deferred outflows of resources and deferred inflows of resources related to pensions from the
following sources:
Deferred Outflows Deferred Inflows
of Resources of Resources
Differences between projected and
actual earnings on plan investments ‐$ 5,406,542$
District contributions subsequent
to the measurement date 2,877,394 ‐
2,877,394$ 5,406,542$

OHLONE COMMUNITY COLLEGE DISTRICT
NOTES TO FINANCIAL STATEMENTS, continued
JUNE 30, 2015
41
NOTE 8 – EMPLOYEE PENSION PLANS (continued)
Public Employees’ Retirement Systems (PERS) (continued)
$2,877,394 reported as deferred outflows of resources related to pensions resulting from District contributions
subsequent to the measurement date will be recognized as a reduction of the net pension liability in the year ended
June 30, 2016. Other amounts reported as deferred outflows of resources and deferred inflows of resources related
to pensions will be recognized in pension expense as follows:
Deferred Inflows
Year Ended June 30, of Resources
2016 1,351,636$
2017 1,351,636
2018 1,351,636
2019 1,351,636
5,406,544$
Actuarial assumptions
The total pension liability was determined by applying update procedures to an actuarial valuation as of June 30,
2013, and rolling forward the total pension liability to June 30, 2014 using the following actuarial assumptions,
applied to all periods included in the measurement:
Consumer Price Inflation 2.75%
Investment Yield (Net of Expenses) 7.50%
Wage Inflation Varies by Entry Age and Service
CalPERS uses custom mortality tables to best fit the patterns of mortality among its members. These custom tables
are derived using CalPERS’ membership data for all funds. The table includes 20 years of mortality improvements
using Society of Actuaries Scale BB.
The actuarial assumptions used in the June 30, 2013 valuation were based on the results of an actuarial experience
study for the period from 1997 to 2011.
The long‐term expected rate of return on pension plan investments was determined using a building‐block method
in which best‐estimate ranges of expected future real rates of return (expected returns, net of pension plan
investment expense and inflation) are developed for each major asset class. In determining the long‐term expected
rate of return, both short‐term and long‐term market return expectations as well as the expected pension fund cash
flows were taken into account. Such cash flows were developed assuming that both members and employers will
make their required contributions on time and as scheduled in all future years. Using historical returns of all the
funds’ asset classes, expected compound (geometric) returns were calculated over the short‐term (first 10 years)
and the long‐term (11‐60 years) using a building‐block approach. Using the expected nominal returns for both
short‐term and long‐term, the present value of benefits was calculated for each fund. The expected rate of return
was set by calculating the single equivalent expected return that arrived at the same present value of benefits for
cash flows as the one calculated using both short‐term and long‐term returns. The expected rate of return was then
set equivalent to the single equivalent rate calculated above and rounded down to the nearest one quarter of one
percent.
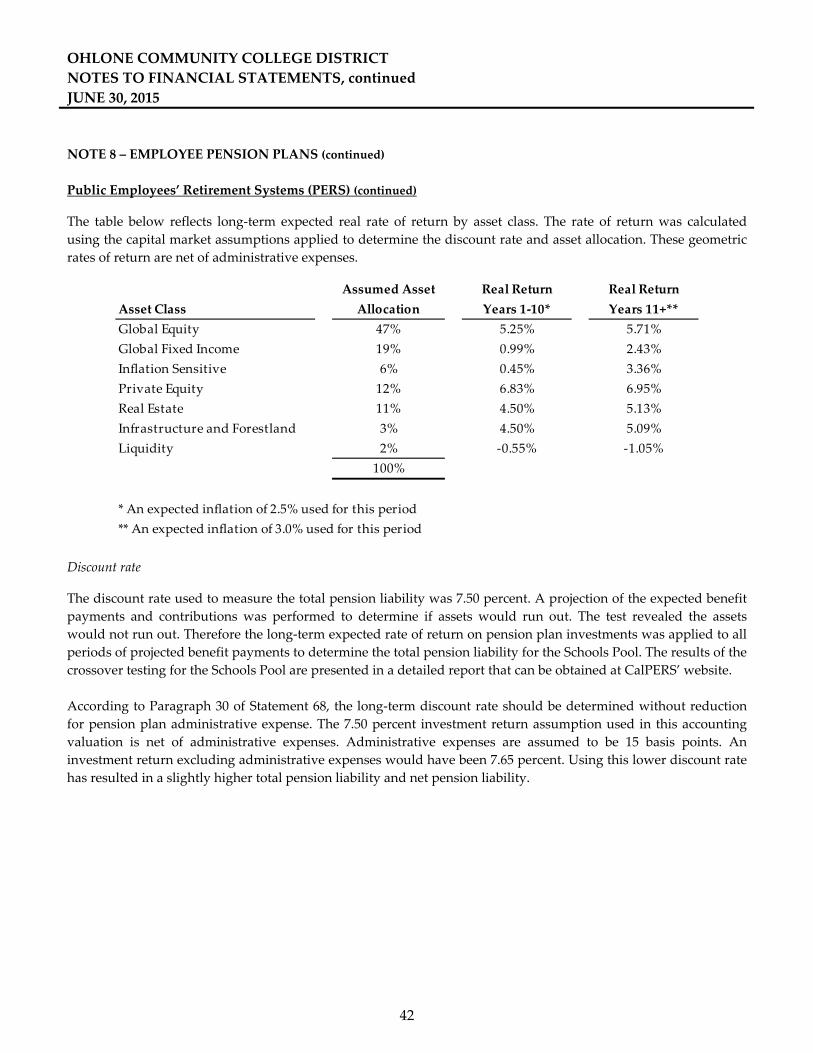
OHLONE COMMUNITY COLLEGE DISTRICT
NOTES TO FINANCIAL STATEMENTS, continued
JUNE 30, 2015
42
NOTE 8 – EMPLOYEE PENSION PLANS (continued)
Public Employees’ Retirement Systems (PERS) (continued)
The table below reflects long‐term expected real rate of return by asset class. The rate of return was calculated
using the capital market assumptions applied to determine the discount rate and asset allocation. These geometric
rates of return are net of administrative expenses.
Assumed Asset Real Return Real Return
Asset Class Allocation Years 1‐10* Years 11+**
Global Equity 47% 5.25% 5.71%
Global Fixed Income 19% 0.99% 2.43%
Inflation Sensitive 6% 0.45% 3.36%
Private Equity 12% 6.83% 6.95%
Real Estate 11% 4.50% 5.13%
Infrastructure and Forestland 3% 4.50% 5.09%
Liquidity 2% ‐0.55% ‐1.05%
100%
* An expected inflation of 2.5% used for this period
** An expected inflation of 3.0% used for this period
Discount rate
The discount rate used to measure the total pension liability was 7.50 percent. A projection of the expected benefit
payments and contributions was performed to determine if assets would run out. The test revealed the assets
would not run out. Therefore the long‐term expected rate of return on pension plan investments was applied to all
periods of projected benefit payments to determine the total pension liability for the Schools Pool. The results of the
crossover testing for the Schools Pool are presented in a detailed report that can be obtained at CalPERS’ website.
According to Paragraph 30 of Statement 68, the long‐term discount rate should be determined without reduction
for pension plan administrative expense. The 7.50 percent investment return assumption used in this accounting
valuation is net of administrative expenses. Administrative expenses are assumed to be 15 basis points. An
investment return excluding administrative expenses would have been 7.65 percent. Using this lower discount rate
has resulted in a slightly higher total pension liability and net pension liability.
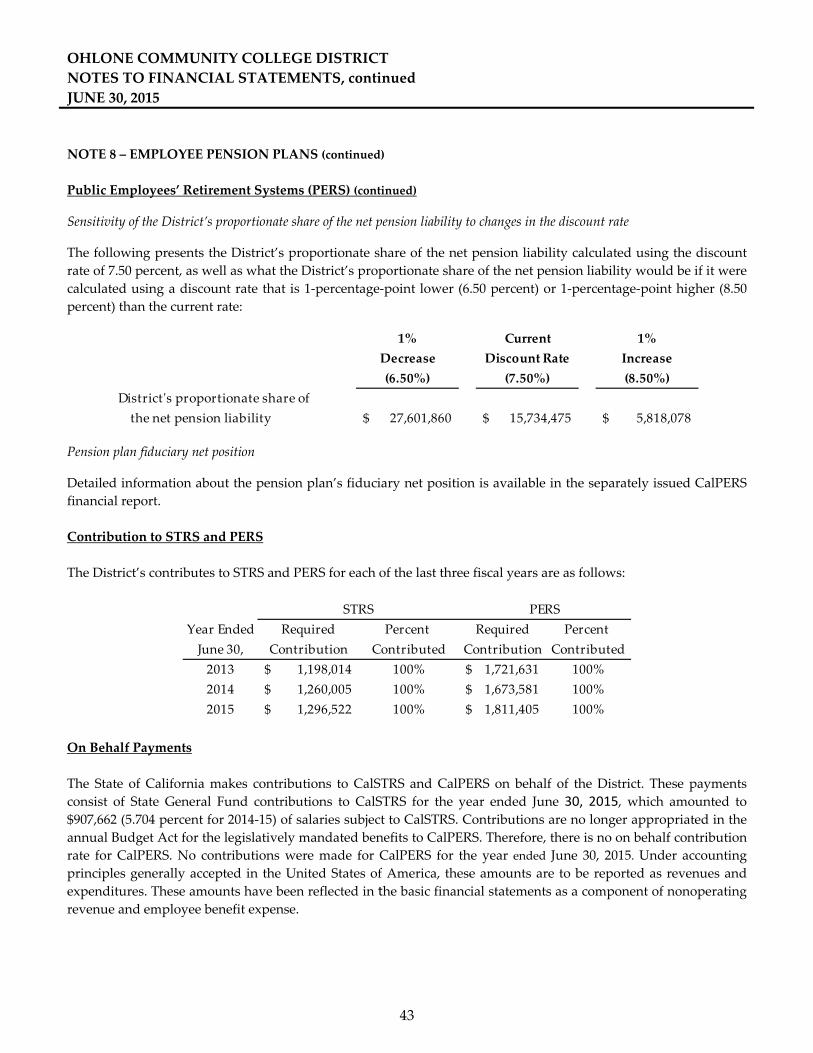
OHLONE COMMUNITY COLLEGE DISTRICT
NOTES TO FINANCIAL STATEMENTS, continued
JUNE 30, 2015
43
NOTE 8 – EMPLOYEE PENSION PLANS (continued)
Public Employees’ Retirement Systems (PERS) (continued)
Sensitivity of the District’s proportionate share of the net pension liability to changes in the discount rate
The following presents the District’s proportionate share of the net pension liability calculated using the discount
rate of 7.50 percent, as well as what the District’s proportionate share of the net pension liability would be if it were
calculated using a discount rate that is 1‐percentage‐point lower (6.50 percent) or 1‐percentage‐point higher (8.50
percent) than the current rate:
1% Current 1%
Decrease Discount Rate Increase
(6.50%) (7.50%) (8.50%)
Districtʹs proportionate share of
the net pension liability 27,601,860$ 15,734,475$ 5,818,078$
Pension plan fiduciary net position
Detailed information about the pension plan’s fiduciary net position is available in the separately issued CalPERS
financial report.
Contribution to STRS and PERS
The District’s contributes to STRS and PERS for each of the last three fiscal years are as follows:
Year Ended Required Percent Required Percent
June 30, Contribution Contributed Contribution Contributed
2013 1,198,014$ 100% 1,721,631$ 100%
2014 1,260,005$ 100% 1,673,581$ 100%
2015 1,296,522$ 100% 1,811,405$ 100%
STRS PERS
On Behalf Payments
The State of California makes contributions to CalSTRS and CalPERS on behalf of the District. These payments
consist of State General Fund contributions to CalSTRS for the year ended June 30, 2015, which amounted to
$907,662 (5.704 percent for 2014‐15) of salaries subject to CalSTRS. Contributions are no longer appropriated in the
annual Budget Act for the legislatively mandated benefits to CalPERS. Therefore, there is no on behalf contribution
rate for CalPERS. No contributions were made for CalPERS for the year ended June 30, 2015. Under accounting
principles generally accepted in the United States of America, these amounts are to be reported as revenues and
expenditures. These amounts have been reflected in the basic financial statements as a component of nonoperating
revenue and employee benefit expense.

OHLONE COMMUNITY COLLEGE DISTRICT
NOTES TO FINANCIAL STATEMENTS, continued
JUNE 30, 2015
44
NOTE 9 – POSTEMPLOYMENT HEALTHCARE BENEFITS
Plan Description
The District administers a single‐employer defined benefit healthcare plan (the Retiree Health Plan). The plan
provides health, dental, and vision benefits to eligible retirees and their dependents in accordance with provisions
established through negotiations between the District and the bargaining unions representing employees. Plan
provisions are renegotiated each three‐year bargaining period. The District reports the financial activity of the plan
as a trust fund in these financial statements and no separate financial report is prepared.
Eligibility
The District currently provides retiree and dependent health benefits to eligible academic, classified, classified
leadership and administrators until retirees reach age 65. Eligibility requirements vary by employee classification.
All participants must have a minimum service of 10 years and minimum required hours of 75% FTE. In addition,
classified employees must be at least 60 years of age; and classified leadership, administrators and academic
employees must retire under PERS or STRS. The District also pays for retiree only Medicare supplemental
coverage for academic, classified leadership and administrative retirees beyond age 65. The following table shows
the current plan participants:
Retirees and beneficiaries receiving benefits 132
Active plan members 337
Total 469
Funding Policy
The contribution requirements are established and may be amended by the District. The required contribution is
based on projected pay‐as‐you‐go financing requirements, with an annual adjustment to fully fund the actuarially
determined annual required contribution. For fiscal year 2014‐2015, the District contributed $755,739 to the plan for
current year premiums. The District pays for 100% of coverage.

OHLONE COMMUNITY COLLEGE DISTRICT
NOTES TO FINANCIAL STATEMENTS, continued
JUNE 30, 2015
45
NOTE 9 – POSTEMPLOYMENT HEALTHCARE BENEFITS (continued)
Annual OPEB Cost and Net OPEB Obligation
The District’s annual other postemployment benefit (OPEB) cost (expense) is calculated based on the annual
required contribution of the employer (ARC), an amount actuarially determined in accordance with the parameters
of GASB Statement 45, Accounting and Financial Reporting by Employers for Postemployment Benefits Other Than
Pensions. The ARC represents a level of funding that, if paid on an ongoing basis, is projected to cover the normal
cost each year and amortize an unfunded actuarial liabilities (or funding excess) over a period not to exceed thirty
years. The following table shows the components of the District’s annual OPEB cost for the year, the amount
actually contributed, and changes in the District’s net OPEB obligation:
Annual required contribution (ARC) 630,510$
Interest on net OPEB obligation 27,730
Adjustment to annual required contribution (30,955)
Annual OPEB cost 627,285
Contributions made 755,739
Changes in net OPEB obligation (128,454)
Net OPEB obligation, beginning of year 443,669
Net OPEB obligation, end of year 315,215$
Funding Status and Funding Progress
The District’s annual OPEB cost, the percentage of annual OPEB cost contributed, and the net OPEB obligation was
as follows:
Actuarial
Valuation
Date
Actuarial
Value of Assets
(AVA)
Actuarial Accrued Liability
(Entry Age Normal Cost
Method) (AAL)
Unfunded Actuarial
Accrued Liability
(UAAL)
Funding
Ratio Covered Payroll
UAAL as a
Percentage of
Covered Payroll
2/1/2015 3,311,595$ 7,381,848$ 4,070,253$ 45.0% 26,952,040$ 15%
The above noted actuarial accrued liability was based on the February 1, 2015, actuarial valuation. Actuarial
valuations of an ongoing benefit plan involve estimates of the value of reported amounts and assumptions about
the probability of occurrence of events far into the future. Examples include assumptions about future
employment, mortality, and the healthcare cost trend. Amounts determined regarding the funded status of the
plan and the annual required contributions of the employer are subject to continual revision as actual results are
compared with past expectations and new estimates are made about the future. The schedule of funding progress,
presented as required supplementary information following the notes to the financial statements, presents
multiyear trend information about whether the actuarial value of plan assets, if any, is increasing or decreasing
over time relative to the actuarial accrued liabilities for benefits. The schedule of employer contribution also
presented as required supplementary information, presents trend information about the amounts contributed to
the plan by employers in comparison to the annual required contribution (ARC).

OHLONE COMMUNITY COLLEGE DISTRICT
NOTES TO FINANCIAL STATEMENTS, continued
JUNE 30, 2015
46
NOTE 9 – POSTEMPLOYMENT HEALTHCARE BENEFITS (continued)
Actuarial Methods and Assumptions
Projections of benefits for financial reporting purposes are based on the substantive plan (the plan as understood
by the employer and the plan members) and include the types of benefits provided at the time of each valuation
and the historical pattern of sharing of benefits costs between the employer and plan members to that point. The
actuarial methods and assumptions used include techniques that are designed to reduce the effects of short‐term
volatility in actuarial accrued liabilities and the actuarial value of assets, if any, consistent with the long‐term
perspective of the calculations.
The actuarial cost method used in determining the benefit obligations is the Entry Age Normal Cost method. The
actuarial assumptions included a 7.0 percent investment rate of return (net of administrative expenses) which is a
blended rate of the expected long‐term investment returns on plan assets and on the employers own investments
calculated based on the funded level of the plan at the valuation date, and an annual healthcare cost trend rate of
4.0 percent which included a 3.0 percent inflation assumption.
NOTE 10 – JOINT POWERS AGREEMENT
The District participates in two joint ventures under joint powers agreements (JPAs) with the Bay Area Community
College Districts Joint Powers Agency (BACCDJPA) and the South Bay Regional Public Safety Training
Consortium (SBRPSTC). The relationships between the District and the JPAs are such that the JPAs are not
component units of the District for financial reporting purposes. District representatives serve on both boards.
BACCDJPA arranges for and provides property and liability insurance for its members. BACCDJPA is governed by
a board consisting of a representative from each member district. The board controls the operations of BACCDJPA,
including selection of management and approval of operating budgets, independent of any influence by the
member districts beyond their representation on the board. Each member district pays a premium commensurate
with the level of coverage requested, and shares surpluses and deficits proportionate to their participation in
BACCDJPA.
The following is a summary of financial information for BACCDJPA at June 30, 2015 (the most recent financial
statements available).
Total assets $ 8,473,681
Total liabilities $ 2,795,957
Net position $ 5,677,724
Total revenues $ 4,471,587
Total expenses $ 2,843,129
Change in net asset $ 1,628,458

OHLONE COMMUNITY COLLEGE DISTRICT
NOTES TO FINANCIAL STATEMENTS, continued
JUNE 30, 2015
47
NOTE 10 – JOINT POWERS AGREEMENT (continued)
South Bay Regional Public Safety Training Consortium
SBRPSTC provides for the educational and training needs of public safety students in the areas represented by the
participating community college districts. SBRPSTC is governed by a board consisting of a representative from
each member district. The board controls the operations of SBRPSTC, including selection of management and
approval of operating budgets, independent of any influence by the member boards beyond their representation on
the board.
The following is a summary of financial information for SBRPSTC at June 30, 2015:
Total assets $ 4,056,596
Total liabilities $ 2,555,581
Net assets $ 1,501,015
Total revenues $ 10,563,863
Total expenses $ 10,483,500
Change in net asset $ 80,363
NOTE 11 – FUNCTIONAL EXPENSES
The functional expenses for the year ended June 30, 2015 were as follows:
Function Salaries Benefits Services Depreciation Aid Total
Instructional Activities 19,712,458$ 3,340,580$ 1,295,959$ ‐$ ‐$ 24,348,997$
Instructional Support 2,779,597 663,793 334,039 ‐ ‐ 3,777,429
Student Services 5,686,784 1,402,749 538,680 ‐ ‐ 7,628,213
Plant Operation & Main 1,850,144 818,564 962,887 ‐ ‐ 3,631,595
Institutional Support 6,125,337 (24,689) 1,190,906 ‐ ‐ 7,291,554
Community Services 2,068,528 510,354 1,223,028 ‐ ‐ 3,801,910
Ancillary & Auxiliary 1,186,064 375,280 270,277 ‐ ‐ 1,831,621
Student Aid 126,752 1,972 ‐ ‐ 7,638,615 7,767,339
Physical Property & Related 299,088 88,786 2,980,331 ‐ ‐ 3,368,205
Depreciation Expense ‐ ‐ ‐ 7,292,480 ‐ 7,292,480
Total 39,834,752$ 7,177,389$ 8,796,107$ 7,292,480$ 7,638,615$ 70,739,343$

OHLONE COMMUNITY COLLEGE DISTRICT
NOTES TO FINANCIAL STATEMENTS, continued
JUNE 30, 2015
48
NOTE 12 ‐ COMMITMENTS AND CONTINGENCIES
A. State and Federal Allowances, Awards, and Grants
The District has received state and federal funds for specific purposes that are subject to review and audit by
the grantor agencies. Although such audits could generate expenditure disallowances under terms of the
grants, it is believed that any required reimbursement will not be material.
B. Purchase Commitments
As of June 30, 2015, the District was committed under various capital expenditure purchase agreements for
construction and modernization projects totaling approximately $49,064,375. Projects will be funded by State
funds and Basic Aid funds.
C. Litigation
The District is a defendant in various pending liability lawsuits arising in the ordinary course of business. The
outcome of the litigation is unknown at the present time, however, in the opinion of management, the ultimate
disposition of these matters will not have a material adverse effect on the District’s financial statements.
NOTE 13 – DEFERRED OUTFLOWS/INFLOWS OF RESOURCES
Pension Plans
Pursuant to GASB Statement No. 68, Accounting and Financial Reporting for Pensions—an amendment of GASB
Statement No. 27., the District recognized deferred outflows and inflows of resources related to pensions in the
District‐wide financial statements. The District’s deferred outflows and inflows of resources related to pensions
were as follows at June 30, 2015:
Deferred
outflows related
to pensions
Deferred inflows
related to
pensions
STRS Pension 3,619,867$ 4,892,600$
PERS Pension 2,877,394 5,406,541
Total 6,497,261$ 10,299,141$

OHLONE COMMUNITY COLLEGE DISTRICT
NOTES TO FINANCIAL STATEMENTS, continued
JUNE 30, 2015
49
NOTE 14 – RESTATEMENT OF NET POSITION
The beginning net position of the Primary Government has been restated due to the implementation of GASB 68
Net Pension Liability.
Primary Government
Net Position ‐ Beginning, as Previously Reported 91,166,414$
Restatement for net pension liability (42,788,083)
Net Position ‐ Beginning, as Restated 48,378,331$

REQUIRED SUPPLEMENTARY
INFORMATION

OHLONE COMMUNITY COLLEGE DISTRICT
See accompanying note to required supplementary information.
50
SCHEDULE OF POSTEMPLOYMENT HEALTHCARE BENEFITS FUNDING PROGRESS
FOR THE YEAR ENDED JUNE 30, 2015
Actuarial
Valuation
Date
Actuarial
Value of Assets
(AVA)
Actuarial Accrued Liability
(Entry Age Normal Cost
Method) (AAL)
Unfunded Actuarial
Accrued Liability
(UAAL)
Funding
Ratio Covered Payroll
UAAL as a
Percentage of
Covered Payroll
2/1/2011 774,529$ 5,818,135$ 5,043,606$ 13.3% 27,235,761$ 19%
2/1/2013 2,099,142$ 7,250,590$ 5,151,448$ 29.0% 26,671,869$ 19%
2/1/2015 3,311,595$ 7,381,848$ 4,070,253$ 45.0% 26,952,040$ 15%

OHLONE COMMUNITY COLLEGE DISTRICT
See accompanying note to required supplementary information.
51
SCHEDULE OF THE DISTRICT’S PROPORTIONATE SHARE OF THE NET PENSION LIABILITY ‐
STRS
FOR THE YEAR ENDED JUNE 30, 2015
June 30, 2015
Districtʹs proportion of the net pension liability 0.03%
Districtʹs proportionate share of the net
pension liability 19,868,580$
Districtʹs covered‐employee payroll 15,912,728$
Districtʹs proportionate share of the net
pension liability as a percentage
of its covered‐employee payroll 1.25
Plan fiduciary net position as a
percentage of the total pension liability. 76.50%

OHLONE COMMUNITY COLLEGE DISTRICT
See accompanying note to required supplementary information.
52
SCHEDULE OF THE DISTRICT’S PROPORTIONATE SHARE OF THE NET PENSION LIABILITY ‐
PERS
FOR THE YEAR ENDED JUNE 30, 2015
June 30, 2015
Districtʹs proportion of the net pension liability 0.14%
Districtʹs proportionate share of the net
pension liability 15,734,475$
Districtʹs covered‐employee payroll 15,388,833$
Districtʹs proportionate share of the net
pension liability as a percentage
of its covered‐employee payroll 1.02
Plan fiduciary net position as a
percentage of the total pension liability. 83.38%

OHLONE COMMUNITY COLLEGE DISTRICT
See accompanying note to required supplementary information.
53
SCHEDULE OF DISTRICT CONTRIBUTIONS – STRS
FOR THE YEAR ENDED JUNE 30, 2015
June 30, 2015
Contractually required contribution 2,712,205$
Contributions in relation to the
contractually required contribution ‐
Contribution deficiency (excess) 2,712,205$
Districtʹs covered‐employee payroll 15,912,728$
Contributions as a percentage of
covered‐employee payroll 17.04%

OHLONE COMMUNITY COLLEGE DISTRICT
See accompanying note to required supplementary information.
54
SCHEDULE OF DISTRICT CONTRIBUTIONS – PERS FOR THE YEAR ENDED JUNE 30, 2015
June 30, 2015
Contractually required contribution 2,877,394$
Contributions in relation to the
contractually required contribution ‐
Contribution deficiency (excess) 2,877,394$
Districtʹs covered‐employee payroll 15,388,833$
Contributions as a percentage of
covered‐employee payroll 18.70%
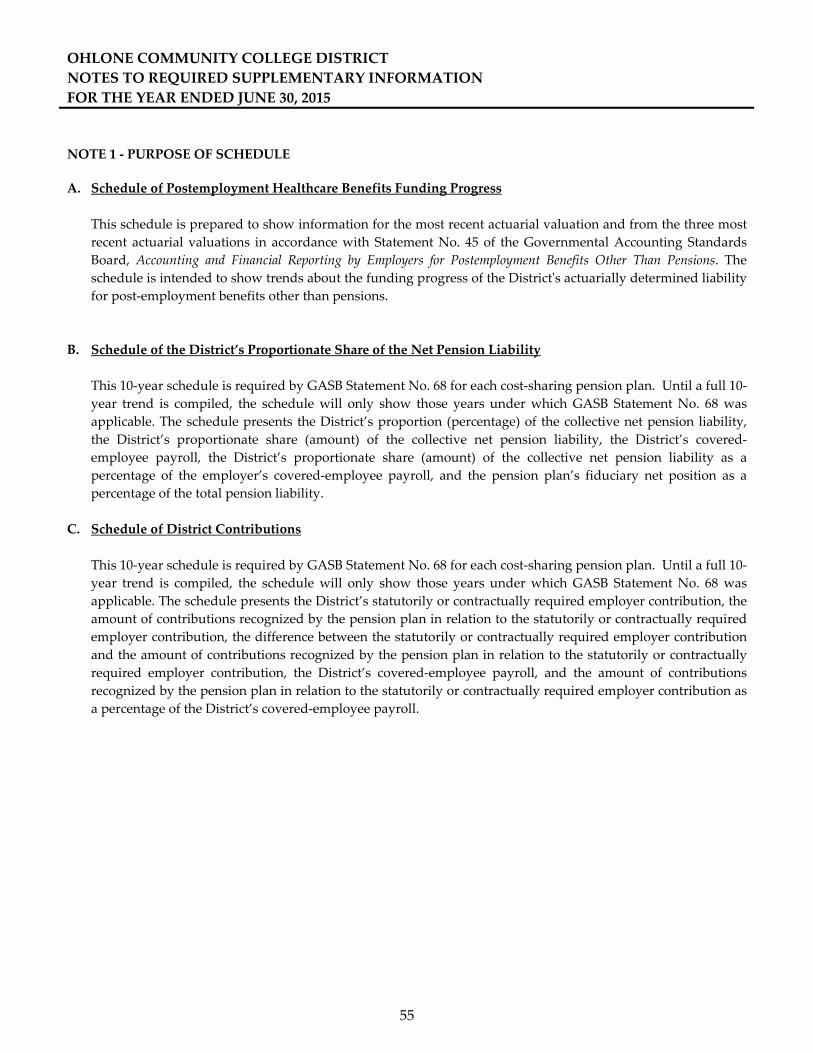
OHLONE COMMUNITY COLLEGE DISTRICT
55
NOTES TO REQUIRED SUPPLEMENTARY INFORMATION
FOR THE YEAR ENDED JUNE 30, 2015
NOTE 1 ‐ PURPOSE OF SCHEDULE
A. Schedule of Postemployment Healthcare Benefits Funding Progress
This schedule is prepared to show information for the most recent actuarial valuation and from the three most
recent actuarial valuations in accordance with Statement No. 45 of the Governmental Accounting Standards
Board, Accounting and Financial Reporting by Employers for Postemployment Benefits Other Than Pensions. The
schedule is intended to show trends about the funding progress of the Districtʹs actuarially determined liability
for post‐employment benefits other than pensions.
B. Schedule of the District’s Proportionate Share of the Net Pension Liability
This 10‐year schedule is required by GASB Statement No. 68 for each cost‐sharing pension plan. Until a full 10‐
year trend is compiled, the schedule will only show those years under which GASB Statement No. 68 was
applicable. The schedule presents the District’s proportion (percentage) of the collective net pension liability,
the District’s proportionate share (amount) of the collective net pension liability, the District’s covered‐
employee payroll, the District’s proportionate share (amount) of the collective net pension liability as a
percentage of the employer’s covered‐employee payroll, and the pension plan’s fiduciary net position as a
percentage of the total pension liability.
C. Schedule of District Contributions
This 10‐year schedule is required by GASB Statement No. 68 for each cost‐sharing pension plan. Until a full 10‐
year trend is compiled, the schedule will only show those years under which GASB Statement No. 68 was
applicable. The schedule presents the District’s statutorily or contractually required employer contribution, the
amount of contributions recognized by the pension plan in relation to the statutorily or contractually required
employer contribution, the difference between the statutorily or contractually required employer contribution
and the amount of contributions recognized by the pension plan in relation to the statutorily or contractually
required employer contribution, the District’s covered‐employee payroll, and the amount of contributions
recognized by the pension plan in relation to the statutorily or contractually required employer contribution as
a percentage of the District’s covered‐employee payroll.

SUPPLEMENTARY
INFORMATION

See accompanying note to supplementary information.
56
OHLONE COUNTY COMMUNITY COLLEGE DISTRICT
SCHEDULE OF EXPENDITURES OF FEDERAL AWARDS
FOR THE YEAR ENDED JUNE 30, 2015
Federal Pass‐Through Total
Catalog Entity Identifying Program
Number Number Expenditures
U.S. Department of Education
Direct Program
Federal Supplemental Educational Opportunity Grant 84.007 * 103,400$
Federal Work Study Program 84.033 * 126,752
Federal Pell Grant 84.063 * 6,266,816
Federal Direct Student Loans 84.268 * 760,678
Subtotal Student Financial Assistance Cluster 7,257,646
Passed through the California Community College Chancellor s Office:
Rehabilitation Training ‐ Continuing Education 84.264 22572 275,279
Career and Technical Education ‐ Title II‐C 84.048 03‐C01‐061 148,164
Career and Technical Education ‐ Title II‐E 84.048 00‐021‐23 43,269
Subtotal 84.243 191,433
Total U.S. Department of Education 7,724,358
National Science Foundation
Direct Program
DeafTEC 47.076 31182‐07 107,205
Total National Science Foundation 107,205
U.S. Department of Health and Human Services
Direct Program
Campus Suicide Prevention Grant 93.243 * 61,413
Passed through the California Community College Chancellor s Office
Temporary Assistance for Needy Families 93.558 * 28,671
Total U.S. Department of Health and Human Services 90,084
U.S. Department of Labor
Passed through the Alameda County Workforce Investment Board:
WIA ‐ Adults Formula Grants 17.258 C95‐0263‐0931 845,500
Passed through the Contra Costa Community College District:
Design it, Build it, Ship it (DBS) N/A TC‐23770‐12‐60‐A‐6 309,012
Total U.S. Department of Labor 1,154,512
Total Federal Programs 9,076,159$
Reconciliation to Federal Revenues
Total Federal Expenditures (9,076,159)$
Total Federal Revenues 8,965,057
Revenues in excess of expenditures (111,102)
Total Federal Grants (9,076,159)$
*Pass‐Through number is either not available or not applicable
FEDERAL GRANTOR/PASS‐THROUGH
GRANTOR/PROGRAM TITLE

See accompanying note to supplementary information.
57
OHLONE COUNTY COMMUNITY COLLEGE DISTRICT
SCHEDULE OF STATE FINANCIAL ASSISTANCE
FOR THE YEAR ENDED JUNE 30, 2015
Total
Cash Accounts Deferred Program
Received Receivable Income Total Expenditures
State Categorical Aid Programs
AB86 -$ 219,423$ 219,423$ 197,480$ (95,339)$ ‐$ 102,141$ 102,141$
Basic Skills 169,198 145,255 314,453 145,255 (142,015) ‐ 172,438 172,438
BARTPC - - - ‐ ‐ 5,959 5,959 ‐
CalWORKs - 160,493 160,493 160,490 8,724 ‐ 169,214 169,214
CTE Pathways Collaborative 12 177,727 - 177,727 ‐ ‐ ‐ 177,727 177,726
Child Development Consortium - 3,212 3,212 3,213 (2,387) 462 1,288 1,288
Cooperative Agency Resource Education - 32,029 32,029 32,029 ‐ ‐ 32,029 32,377
Deputy Sector Navigator - 93,860 93,860 93,860 94,484 ‐ 188,344 188,344
SB1070 in‐Region Investment - 100,000 100,000 46,925 20,365 ‐ 67,291 67,291
Disabled Student Program and Services - 1,895,258 1,895,258 1,895,258 (54,017) ‐ 1,841,241 1,841,241
Enroll Fee Admin (2%) - 75,977 75,977 75,977 ‐ ‐ 75,977 75,987
Extended Opportunity Program and Services - 300,454 300,454 300,454 (4,544) ‐ 295,910 295,910
Faculty and Staff Diversity - 5,139 5,139 5,139 (12) ‐ 5,127 5,127
Instructional Equipment (On‐going) - 600,567 600,567 600,567 (29,729) 25,800 596,638 596,638
Lottery ‐ Prop 20 - 304,322 304,322 304,323 - 541,769 846,092 133,894
SS&SP 31,591 1,384,747 1,416,338 1,384,747 (616,094) ‐ 800,244 800,243
Student Success (Equity) - 324,719 324,719 324,719 (263,575) ‐ 61,144 61,144
Student Financial Aid Administration - 278,148 278,148 278,145 ‐ ‐ 278,145 278,145
Transfer & Articulation - - - ‐ ‐ 6,008 6,008 298
Total State Programs 378,516$ 5,923,603$ 6,302,119$ 5,848,581$ (1,084,139)$ 579,998$ 5,722,956$ 4,999,446$
Program Revenues
Program Name
Prior Year
Carry‐forward
Current
Entitlement
Total
Entitlement
Program Entitlements
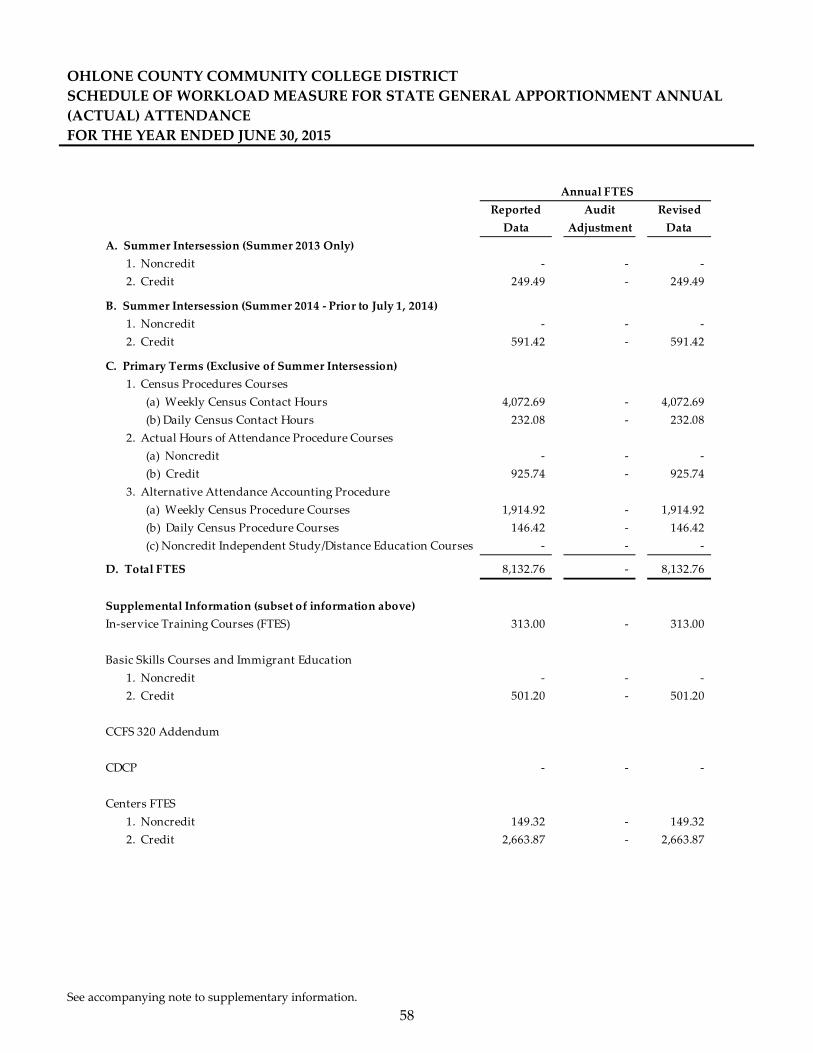
See accompanying note to supplementary information.
58
OHLONE COUNTY COMMUNITY COLLEGE DISTRICT
SCHEDULE OF WORKLOAD MEASURE FOR STATE GENERAL APPORTIONMENT ANNUAL
(ACTUAL) ATTENDANCE
FOR THE YEAR ENDED JUNE 30, 2015
Reported Audit Revised
Data Adjustment Data
A. Summer Intersession (Summer 2013 Only)
1. Noncredit ‐ ‐ ‐
2. Credit 249.49 ‐ 249.49
B. Summer Intersession (Summer 2014 ‐ Prior to July 1, 2014)
1. Noncredit ‐ ‐ ‐
2. Credit 591.42 ‐ 591.42
C. Primary Terms (Exclusive of Summer Intersession)
1. Census Procedures Courses
(a) Weekly Census Contact Hours 4,072.69 ‐ 4,072.69
(b) Daily Census Contact Hours 232.08 ‐ 232.08
2. Actual Hours of Attendance Procedure Courses
(a) Noncredit ‐ ‐ ‐
(b) Credit 925.74 ‐ 925.74
3. Alternative Attendance Accounting Procedure
(a) Weekly Census Procedure Courses 1,914.92 ‐ 1,914.92
(b) Daily Census Procedure Courses 146.42 ‐ 146.42
(c) Noncredit Independent Study/Distance Education Courses ‐ ‐ ‐
D. Total FTES 8,132.76 ‐ 8,132.76
Supplemental Information (subset of information above)
In‐service Training Courses (FTES) 313.00 ‐ 313.00
Basic Skills Courses and Immigrant Education
1. Noncredit ‐ ‐ ‐
2. Credit 501.20 ‐ 501.20
CCFS 320 Addendum
CDCP ‐ ‐ ‐
Centers FTES
1. Noncredit 149.32 ‐ 149.32
2. Credit 2,663.87 ‐ 2,663.87
Annual FTES

See accompanying note to supplementary information.
59
OHLONE COUNTY COMMUNITY COLLEGE DISTRICT
RECONCILIATION OF ANNUAL FINANCIAL AND BUDGET REPORT (CCFS‐311) WITH
DISTRICT ACCOUNTING RECORDS
FOR THE YEAR ENDED JUNE 30, 2015
There were no adjustments necessary to reconcile the annual CCFS‐311 report with the District accounting records
for the fiscal year June 30, 2015.

See accompanying note to supplementary information.
60
OHLONE COUNTY COMMUNITY COLLEGE DISTRICT
RECONCILIATION OF THE ECS 84362 (50 PERCENT LAW) CALCULATION
FOR THE YEAR ENDED JUNE 30, 2015
Object/
TOP
Codes Reported Data
Audit
Adjustments Revised Data Reported Data
Audit
Adjustments Revised Data
Instructional Salaries
Contract or Regular 1100 9,138,818 ‐ 9,138,818 9,138,818 ‐ 9,138,818
Other 1300 8,022,495 ‐ 8,022,495 8,022,495 ‐ 8,022,495
Total Instructional Salaries 17,161,313 ‐ 17,161,313 17,161,313 ‐ 17,161,313
Non‐Instructional Salaries
Contract or Regular 1200 ‐ ‐ ‐ 3,949,629 ‐ 3,949,629
Other 1400 ‐ ‐ ‐ 433,453 ‐ 433,453
Total Non‐Instructional Salaries ‐ ‐ ‐ 4,383,082 ‐ 4,383,082
Total Academic Salaries 17,161,313 ‐ 17,161,313 21,544,395 ‐ 21,544,395
Non‐Instructional Salaries
Regular Status 2100 ‐ ‐ ‐ 8,016,451 ‐ 8,016,451
Other 2300 ‐ ‐ ‐ 1,190,577 ‐ 1,190,577
Total Non‐Instructional Salaries ‐ ‐ ‐ 9,207,028 ‐ 9,207,028
Instructional Aides
Regular Status 2200 1,698,856 ‐ 1,698,856 1,698,856 ‐ 1,698,856
Other 2400 374,030 ‐ 374,030 374,030 ‐ 374,030
Total Instructional Aides 2,072,886 ‐ 2,072,886 2,072,886 ‐ 2,072,886
Total Classified Salaries 2,072,886 ‐ 2,072,886 11,279,914 ‐ 11,279,914
Employee Benefits 3000 3,260,719 ‐ 3,260,719 7,800,063 ‐ 7,800,063
Supplies and Materials 4000 ‐ ‐ ‐ 561,353 ‐ 561,353
Other Operating Expenses 5000 940,809 ‐ 940,809 5,008,346 ‐ 5,008,346
Equipment Replacement 6420 ‐ ‐ ‐ ‐ ‐ ‐
Total Expenditures Prior to Exclusions 23,435,727 ‐ 23,435,727 46,194,071 ‐ 46,194,071
Activities to Exclude
Instructional Staff‐Retireesʹ Benefits and Retirement Incentives 5900 372,897 ‐ 372,897 372,897 ‐ 372,897
Student Health Services Above Amount Collected 6441 ‐ ‐ ‐ ‐ ‐ ‐
Student Transportation 6491 ‐ ‐ ‐ 69,489 ‐ 69,489
Non‐instructional Staff‐Retireesʹ Benefits and Retirement Incentiv 6740 ‐ ‐ ‐ 289,412 ‐ 289,412
Object to Exclude
Rents and Leases 5060 ‐ ‐ ‐ ‐ ‐ ‐
Lottery Expenditures
Academic Salaries 1000 ‐ ‐ ‐ ‐ ‐ ‐
Classified Salaries 2000 ‐ ‐ ‐ ‐ ‐ ‐
Employee Benefits 3000 ‐ ‐ ‐ ‐ ‐ ‐
Supplies and Materials 4000
Software 4100 ‐ ‐ ‐ ‐ ‐ ‐
Books, Magazines & Periodicals 4200 ‐ ‐ ‐ ‐ ‐ ‐
Instructional Supplies & Materials 4300 ‐ ‐ ‐ 112,757 ‐ 112,757
Non‐instructional Supplies & Materials 4400 ‐ ‐ ‐ 255,954 ‐ 255,954
Total Supplies and Materials ‐ ‐ ‐ 368,711 ‐ 368,711
Other Operating Expenses and Services 5000 ‐ ‐ ‐ 706,413 ‐ 706,413
Capital Outlay 6000 ‐ ‐ ‐ ‐ ‐ ‐
Library Books 6300 ‐ ‐ ‐ 62,307 ‐ 62,307
Equipment 6400 ‐ ‐ ‐ ‐ ‐ ‐
Equipment ‐ Additional 6410 ‐ ‐ ‐ ‐ ‐ ‐
Equipment ‐ Replacement 6420 ‐ ‐ ‐ ‐ ‐ ‐
Total Equipment 6420 ‐ ‐ ‐ ‐ ‐ ‐
Total Capital Outlay ‐ ‐ ‐ 62,307 ‐ 62,307
Other Outgo 7000 ‐ ‐ ‐ ‐ ‐ ‐
372,897$ ‐$ 372,897$ 1,869,229$ ‐$ 1,869,229$
23,062,830$ ‐$ 23,062,830$ 44,324,842$ ‐$ 44,324,842$
52.03% 0.00% 52.03% 100.00% 0.00% 100.00%
‐$ ‐$ ‐$ 22,162,421$ ‐$ 22,162,421$
Activity (ESCB) ECS 84362 B Total CEE
AC 0100‐6799
Academic Salaries
Classified Salaries
Exclusions
Total Exclusions
Total for ECS 84362, 50% Law
Percent of CEE (Instructional Salary Cost/Total CEE)
50% of Current Expense of Education
Activity (ESCA) ECS 84362 A
Instructional Salary Cost AC 0100‐5900 &
AC 6100

See accompanying note to supplementary information.
61
OHLONE COUNTY COMMUNITY COLLEGE DISTRICT
DETAILS OF EDUCATION PROTECTION ACCOUNT
FOR THE YEAR ENDED JUNE 30, 2015
7,320,673$
Activity
Code
Salaries and
Benefits
Operating
Expenses
Capital
Outlay
(Obj 1000‐3000) (Obj 4000‐5000) (Obj 6000) Total
Instructional Activities 0100‐5900 7,320,673$ ‐ ‐ 7,320,673$
Total 7,320,673$ ‐ ‐ 7,320,673$
EPA Revenue
Activity Classification

62
OHLONE COUNTY COMMUNITY COLLEGE DISTRICT
SCHEDULE OF GENERAL FUND FINANCIAL TRENDS AND ANALYSIS
FOR THE YEAR ENDED JUNE 30, 2015
NOTE 1‐ PURPOSE OF SCHEDULES
A. Schedules of Expenditures of Federal Awards and State Financial Assistance
The audit of the Ohlone County Community College District for the year ended June 30, 2015 was conducted in
accordance with OMB Circular A‐133, which requires a disclosure of the financial activities of all federally
funded programs. The Schedule of Federal Awards and the Schedule of State Financial Assistance is prepared
on the modified accrual basis of accounting.
B. Schedule of Workload Measures for State General Apportionment
The Schedule of Workload Measures for State General Apportionment represents the basis of apportionment of
the Ohlone County Community College Districtʹs annual calculation of funding.
C. Reconciliation of Annual Financial and Budget Report with Audited Fund Balances
This schedule reports any audit adjustments made to the fund balances of all funds as reported on the Form
CCFS‐311.
D. Reconciliation of the ECS 84362 (50 percent law) Calculation
This schedule reports any audit adjustments made to the reported data to ensure that a minimum of 50 percent
of the District’s current expense of education is expended for salaries of classroom instructors.
E. Details of the Education Protection Account
This schedule reports the revenue and expenditures of the District Proposition 30 Education Protection
Account.
OTHER INDEPENDENT
AUDITORS’ REPORTS

Corporate O�ce:348 Olive Street
San Diego, CA 92103
toll-free: 877.220.7229tel: 619.270.8222fax: 619.260.9085
www.christywhite.com
Christy White, CPA
Michael Ash, CPA
Heather Rubio
SAN DIEGO
LOS ANGELES
SAN FRANCISCO/BAY AREA
63
REPORT ON INTERNAL CONTROL OVER FINANCIAL REPORTING AND ON
COMPLIANCE AND OTHER MATTERS BASED ON AN AUDIT OF FINANCIAL
STATEMENTS PERFORMED IN ACCORDANCE WITH GOVERNMENT
AUDITING STANDARDS
Independent Auditors’ Report
Governing Board
Ohlone Community College District
Fremont, California
We have audited, in accordance with the auditing standards generally accepted in the
United States of America and the standards applicable to financial audits contained in
Government Auditing Standards issued by the Comptroller General of the United States, the
financial statements of the business‐type activity, aggregate discretely presented component
units and fiduciary funds of Ohlone Community College District, as of and for the year
ended June 30, 2015, and the related notes to the financial statements, which collectively
comprise the Ohlone Community College District’s basic financial statements, and have
issued our report thereon dated November 16, 2015.
Internal Control over Financial Reporting
In planning and performing our audit of the financial statements, we considered Ohlone
Community College District’s internal control over financial reporting (internal control) to
determine the audit procedures that are appropriate in the circumstances for the purpose of
expressing our opinions on the financial statements, but not for the purpose of expressing an
opinion on the effectiveness of Ohlone Community College District’s internal control.
Accordingly, we do not express an opinion on the effectiveness of Ohlone Community
College District’s internal control.
A deficiency in internal control exists when the design or operation of a control does not allow
management or employees, in the normal course of performing their assigned functions, to
prevent, or detect and correct, misstatements on a timely basis. A material weakness is a
deficiency, or a combination of deficiencies, in internal control, such that there is a
reasonable possibility that a material misstatement of the entityʹs financial statements will
not be prevented, or detected and corrected on a timely basis. A significant deficiency is a
deficiency, or a combination of deficiencies, in internal control that is less severe than a
material weakness, yet important enough to merit attention by those charged with
governance.

64
Our consideration of internal control was for the limited purpose described in the first paragraph of this section
and was not designed to identify all deficiencies in internal control that might be material weaknesses or significant
deficiencies. Given these limitations, during our audit we did not identify any deficiencies in internal control that
we consider to be material weaknesses. However, material weaknesses may exist that have not been identified.
Compliance and Other Matters
As part of obtaining reasonable assurance about whether Ohlone Community College District’s financial
statements are free of material misstatement, we performed tests of its compliance with certain provisions of laws,
regulations, contracts, and grant agreements, noncompliance with which could have a direct and material effect on
the determination of financial statement amounts. However, providing an opinion on compliance with those
provisions was not an objective of our audit, and accordingly, we do not express such an opinion. The results of
our tests disclosed no instances of noncompliance or other matters that are required to be reported under
Government Auditing Standards.
Purpose of this Report
The purpose of this report is solely to describe the scope of our testing of internal control and compliance and the
results of that testing, and not to provide an opinion on the effectiveness of the entityʹs internal control or on
compliance. This report is an integral part of an audit performed in accordance with Government Auditing Standards
in considering the entityʹs internal control and compliance. Accordingly, this communication is not suitable for any
other purpose.
San Diego, California
November 16, 2015

Corporate O�ce:348 Olive Street
San Diego, CA 92103
toll-free: 877.220.7229tel: 619.270.8222fax: 619.260.9085
www.christywhite.com
Christy White, CPA
Michael Ash, CPA
Heather Rubio
SAN DIEGO
LOS ANGELES
SAN FRANCISCO/BAY AREA
65
REPORT ON COMPLIANCE FOR EACH MAJOR FEDERAL PROGRAM; AND REPORT
ON INTERNAL CONTROL OVER COMPLIANCE REQUIRED BY OMB
CIRCULAR A‐133
Independent Auditors’ Report
Governing Board
Ohlone Community College District
Fremont, California
Report on Compliance for Each Major Federal Program
We have audited Ohlone Community College Districtʹs compliance with the types of
compliance requirements described in the OMB Circular A‐133 Compliance Supplement that
could have a direct and material effect on each of Ohlone Community College Districtʹs
major federal programs for the year June 30, 2015. Ohlone Community College Districtʹs
major federal programs are identified in the summary of auditorʹs results section of the
accompanying schedule of findings and questioned costs.
Management’s Responsibility
Management is responsible for compliance with the requirements of laws, regulations,
contracts, and grants applicable to its federal programs.
Auditor’s Responsibility
Our responsibility is to express an opinion on compliance for each Ohlone Community
College District’s major federal programs based on our audit of the types of compliance
requirements referred to above. We conducted our audit of compliance in accordance with
auditing standards generally accepted in the United States of America; the standards
applicable to financial audits contained in Government Auditing Standards, issued by the
Comptroller General of the United States; and OMB Circular A‐133, Audits of States, Local
Governments, and Non‐Profit Organizations. Those standards and OMB Circular A‐133 require
that we plan and perform the audit to obtain reasonable assurance about whether
noncompliance with the types of compliance requirements referred to above that could have
a direct and material effect on a major federal program occurred. An audit includes
examining, on a test basis, evidence about Ohlone Community College Ohlone Community
College District’s compliance with those requirements and performing such other
procedures as we considered necessary in the circumstances.

66
We believe that our audit provides a reasonable basis for our opinion on compliance for each major federal
program. However, our audit does not provide a legal determination of Ohlone Community College District’s
compliance.
Opinion on Each Major Federal Program
In our opinion Ohlone Community College District complied, in all material respects, with the types of compliance
requirements referred to above that could have a direct and material effect on each of its major federal programs
for the year ended June 30, 2015.
Report on Internal Control Over Compliance
Management of Ohlone Community College Districtis responsible for establishing and maintaining effective
internal control over compliance with the types of compliance requirements referred to above. In planning and
performing our audit of compliance, we considered Ohlone Community College District’s internal control over
compliance with the types of requirements that could have a direct and material effect on each major federal
program to determine the auditing procedures that are appropriate in the circumstances for the purpose of
expressing an opinion on compliance for each major federal program and to test and report on internal control over
compliance in accordance with OMB Circular A‐133, but not for the purpose of expressing an opinion on the
effectiveness of internal control over compliance. Accordingly, we do not express an opinion on the effectiveness of
Ohlone Community College District’s internal control over compliance.
A deficiency in internal control over compliance exists when the design or operation of a control over compliance does
not allow management or employees, in the normal course of performing their assigned functions, to prevent, or
detect and correct, noncompliance with a type of compliance requirement of a federal program on a timely basis. A
material weakness in internal control over compliance is a deficiency, or combination of deficiencies, in internal control
over compliance, such that there is a reasonable possibility that material noncompliance with a type of compliance
requirement of a federal program will not be prevented, or detected and corrected, on a timely basis. A significant
deficiency in internal control over compliance is a deficiency, or a combination of deficiencies, in internal control over
compliance with a type of compliance requirement of a federal program that is less severe than a material
weakness in internal control over compliance, yet important enough to merit attention by those charged with
governance.
Our consideration of internal control over compliance was for the limited purpose described in the first paragraph
of this section and was not designed to identify all deficiencies in internal control over compliance that might be
material weaknesses or significant deficiencies. We did not identify any deficiencies in internal control over
compliance that we consider to be material weaknesses. However, material weaknesses may exist that have not
been identified.
The purpose of this report on internal control over compliance is solely to describe the scope of our testing of
internal control over compliance and the results of that testing based on the requirements of OMB Circular A‐133.
Accordingly, this report is not suitable for any other purpose.
San Diego, California
November 16, 2015

Corporate O�ce:348 Olive Street
San Diego, CA 92103
toll-free: 877.220.7229tel: 619.270.8222fax: 619.260.9085
www.christywhite.com
Christy White, CPA
Michael Ash, CPA
Heather Rubio
SAN DIEGO
LOS ANGELES
SAN FRANCISCO/BAY AREA
67
REPORT ON STATE COMPLIANCE
Independent Auditors’ Report
Governing Board
Ohlone Community College District
Fremont, California
Report on State Compliance
We have audited Ohlone Community College District’s compliance with the types of
compliance requirements described in the California Community Colleges Contracted District
Audit Manual (CDAM) 2014‐15, issued by the California Community Colleges Chancellor’s
Office for the year ended June 30, 2015.
Management’s Responsibility
Management is responsible for compliance with the requirements of laws, regulations,
contracts, and grants applicable to its state programs.
Auditor’s Responsibility
Our responsibility is to express an opinion Ohlone Community College District’s compliance
with the requirements referred to above. We conducted our audit of compliance in
accordance with auditing standards generally accepted in the United States of America; the
standards applicable to financial audits contained in Government Auditing Standards, issued
by the Comptroller General of the United States; and the California Community Colleges
Contracted District Audit Manual (CDAM) 2014‐15 issued by the California Community
Colleges Chancellor’s Office. Those standards require that we plan and perform the audit to
obtain reasonable assurance about whether noncompliance with the types of compliance
requirements referred to above that could have a direct and material effect on the state
programs noted below. An audit includes examining, on a test basis, evidence about Ohlone
Community College District’s compliance with those requirements and performing such
other procedures as we considered necessary in the circumstances.
We believe that our audit provides a reasonable basis for our opinion on compliance with
the requirements referred to above. However, our audit does not provide a legal
determination of Ohlone Community College District’s compliance with those requirements.
68
Opinion on State Compliance
In our opinion, Ohlone Community College District complied, in all material respects, with the types of compliance
requirements referred to above that are applicable to the state programs noted in the table below for the year ended
June 30, 2015.
Procedures Performed
In connection with the audit referred to above, we selected and tested transactions and records to determine
Ohlone Community College District’s compliance with the state laws and regulations applicable to the following
items:
Section 421 – Salaries of Classroom Instructors (50 Percent Law)
Section 423 ‐ Apportionment for Instructional Service Agreements/Contracts
Section 424 ‐ State General Apportionment Funding System
Section 425 ‐ Residency Determination for Credit Courses
Section 426 ‐ Students Actively Enrolled
Section 427 ‐ Concurrent Enrollment of K‐12 Students in Community College Credit Courses
Section 430 – Scheduled Maintenance Program
Section 431 ‐ Gann Limit Calculation
Section 435 ‐ Open Enrollment
Section 438 ‐ Student Fees – Health Fees and Use of Health Fee Funds
Section 439 – Proposition 39 Clean Energy
Section 440 – Intercession Extension Program
Section 474 ‐ Extended Opportunity Programs and Services (EOPS) and Cooperative Agencies Resources for
Education (CARE)
Section 475 ‐ Disabled Student Programs and Services (DSPS)
Section 479 ‐ To Be Arranged Hours (TBA)
Section 490 ‐ Proposition 1D State Bond Funded Projects
Section 491‐ Proposition 30 Education Protection Account Funds
Purpose of this Report
The purpose of this report is solely to describe the scope of our testing over state laws and regulations based on the
requirements described in the California Community Colleges Contracted District Audit Manual (CDAM) 2014‐15. Accordingly, this report is not suitable for any other purpose.
San Diego, California
November 16, 2015

SCHEDULE OF FINDINGS
AND QUESTIONED COSTS

OHLONE COMMUNITY COLLEGE DISTRICT
69
SUMMARY OF AUDITORS’ RESULTS
FOR THE YEAR ENDED JUNE 30, 2015
FINANCIAL STATEMENTS
Type of auditorsʹ report issued: Unmodified
Internal control over financial reporting:
Material weaknesses identified? No
Significant deficiencies identified not considered
to be material weaknesses? None Reported
Non‐compliance material to financial statements noted? No
FEDERAL AWARDS
Internal control over major programs:
Material weaknesses identified? No
Significant deficiencies identified not considered
to be material weaknesses? None Reported
Type of auditorsʹ report issued on compliance for major programs: Unmodified
Any audit findings disclosed that are required to be reported in accordance with
Circular A‐133, Section .510(a) No
Identification of major programs:
CFDA Numbers Name of Federal Program of Cluster
84.007, 84.033, 84.063, 84.268 Student Financial Aid Cluster
Dollar threshold used to distinguish between Type A and Type B programs: 300,000$
Auditee qualified as low‐risk auditee? Yes
STATE AWARDS
Internal control over State programs:
Material weaknesses identified? No
Significant deficiencies identified not considered
to be material weaknesses? None Reported
Type of auditorsʹ report issued on compliance for State programs: Unmodified

OHLONE COMMUNITY COLLEGE DISTRICT
70
SCHEDULE OF FINDINGS AND QUESTIONED COSTS RELATED TO THE FINANCIAL
STATEMENTS
FOR THE YEAR ENDED JUNE 30, 2015
There were no findings or questioned costs related to the financial statements for the year ended June 30, 2015.

OHLONE COMMUNITY COLLEGE DISTRICT
71
SCHEDULE OF FINDINGS AND QUESTIONED COSTS RELATED TO FEDERAL AWARDS
FOR THE YEAR ENDED JUNE 30, 2015
There were no findings or questioned costs related to the federal awards for the year ended June 30, 2015.

OHLONE COMMUNITY COLLEGE DISTRICT
72
SCHEDULE OF FINDINGS AND QUESTIONED COSTS RELATED TO STATE AWARDS
FOR THE YEAR ENDED JUNE 30, 2015
There were no findings or questioned costs related to the state awards for the year ended June 30, 2015.

OHLONE COMMUNITY COLLEGE DISTRICT
73
SUMMARY SCHEDULE OF PRIOR AUDIT FINDINGS
FOR THE YEAR ENDED JUNE 30, 2015
There were no audit findings in 2013‐14.