
Report on Asset Encumbrance
24
1 EBA REPORT ON ASSET ENCUMBRANCE JULY 2021
Transcript of Report on Asset Encumbrance

1
EBA REPORT ON ASSET ENCUMBRANCE
JULY 2021

2
Contents
List of figures 3
Executive summary 4
Introduction 5
1. Total assets and collateral received 6
2. Total encumbrance 8
3. Encumbrance by country 10
4. Encumbrance by asset class and maturity 12
5. Sources of encumbrance 16
Conclusion 18
Annex I: The asset encumbrance ratio 19
Annex II: References to FINREP and COREP tables 20

3
List of figures
Figure 1: Total asset composition (encumbered and unencumbered at December 2020) and evolution by type of instrument 7
Figure 2: Total collateral (encumbered and unencumbered) volumes (EUR tn) and breakdown by type of instrument (%) 7
Figure 3: YoY (left) and QoQ (right) Evolution of the asset encumbrance ratio of total assets and collateral received (%), numerator and denominator 8
Figure 4: Distribution of the asset encumbrance ratios of banks in the EU (weighted average, median, interquartile range and the 5th and 95th percentiles) 9
Figure 5: Weighted average asset encumbrance by country 10
Figure 6: Capital management buffer and asset encumbrance ratios 11
Figure 7: Distribution of volumes of encumbered assets and collateral by type 12
Figure 8: Percentage of encumbrance of total assets and collateral by type 13
Figure 9: Distribution of volumes of unencumbered assets and collateral by type 14
Figure 10: Encumbrance ratio of total central bank eligible assets and collateral (left) and distribution of volumes of central bank eligible unencumbered assets and collateral as of December 2020 (right) 15
Figure 11: Distribution of encumbered assets and collateral by maturity 15
Figure 12: Distribution of the sources of encumbrance 16
Figure 13: Encumbered assets and collateral relative to matching liabilities 17

4
Executive summary
The outbreak of the COVID-19 pandemic led to a substantial increase in encumbrance. The encumbrance ratio of total assets and collateral received rose from 25% in December 2019 to 27.8% in December 2020. Even though banks registered a substantial increase in total assets, this was outpaced by the rise in encumbered assets and collateral.
The highest asset encumbrance ratios continued to be observed in countries with specific funding market characteristics. In particular, countries with large and established covered bond markets, such as the Nordic countries and Germany, those where there has been more use of central bank funding (e.g. Greece and Italy) and those with a high share of repo financing (e.g. France) exhibit the highest ratios.
Central bank funding has become the main source of asset encumbrance. The extensive use of central bank liquidity facilities in 2020 has driven up the share of central bank funding over total sources of encumbrance. The attractive conditions of these facilities along with banks’ focus on the issuance of minimum requirement for own funds and eligible liabilities (MREL) eligible instruments have led banks to reduce their reliance on covered bonds.
More than half of central bank eligible assets are already encumbered. As of December 2020, 50.3% of central bank eligible assets and collateral were encumbered (44.1% as of December 2019). Nonetheless, EU banks also register a 2.4% increase in unencumbered central bank eligible assets, which might be partially explained by the ECB easing of collateral requirements.

5
Introduction
Following the publication of the implementing technical standards (ITS) in October 2013, in 2015, the EBA began receiving quarterly data on asset encumbrance. This report monitors the evolution of asset encumbrance and contributes to the ongoing assessment of the composition of funding sources across EU banks. The report is based on data from December 2019 to December 2020.
This report is based on the full sample of banks for which the EBA receives data on asset encumbrance as part of the harmonised EU-wide supervisory reporting framework. The data are based on the EBA’s implementing technical standards (ITS) on supervisory reporting (EU Regulation No 680/2014 and its subsequent amendments). Since 2015, the EBA has received supervisory data with regard to the largest credit institutions from the competent authorities. More details on the criteria for inclusion in the sample can be found in the Decision on supervisory reporting by competent authorities to the EBA1.
As of December 2020, this report comprises 161 banks (unconsolidated number of banks, including subsidiaries) covering more than 80% of the EU banking sector by total assets. The sample of banks is reviewed annually by the competent authorities and adjusted accordingly. Banks are included in the data for each period in this report if they were in the reporting sample for that period. This means that this report is not based on a balanced sample, and that the sample may change over time.
Subsidiaries are included separately in the relevant country aggregates, but consolidated at the group level when computing the EU aggregates. In contrast to previous years’ reports, EU aggregates no longer include figures for UK banks but include subsidiaries of UK banks in EU countries, for the entire time series.
Ratios provided in the text are the weighted average if not otherwise stated.
1 EBA DC 334.

6
1. Total assets and collateral received
The evolution of the volume of total assets and collateral received in 2020 was marked by the COVID-19 outbreak and the subsequent containment measures. In the early stages of the pandemic, non-financial corporations (NFCs), especially small and medium-sized enterprises (SMEs), made use of available loan commitments to secure liquidity and operational continuity. Later on, credit supply was mostly driven by government guaranteed loans. In order to maintain their support to the real economy and to build liquidity buffers to weather an uncertain crisis, banks made extensive use of central bank extraordinary liquidity allotments. As a result, total assets increased substantially2.
As of December 2020, European banks accounted for EUR 26.1 tn in total assets and EUR 2.8 tn in collateral received (EUR 23.9 tn and 2.8 tn in Q4 2019). While the volume of collateral was roughly stable compared to the previous year, the volume of total assets rose by 9.1% (+EUR 2.2 tn). Nonetheless, most of the increase took part in the first quarter of 2020, when total assets grew by 8.2% quarter on quarter (QoQ). Indeed, after peaking at EUR 26.4 tn in June 2020, total assets started to fall slightly.
The overall increase in total assets was mainly driven by loans on demand, which rose by almost 80% (+EUR 1.4 tn) in 2020 propped up by increasing deposits at central banks. Also noteworthy is the rise in debt securities (+8.1%, +EUR 249 bn) and loans and advances other than loans on demand (+0.6%, +EUR 101 bn). Only equity instruments registered a slight decrease (-0.4%, -EUR 1.5 bn).
Against this backdrop, loans and advances other than loans on demand accounted for the largest share of total assets 60.7% (65.8% in December 2019), followed by debt securities (12.7% in December 2020 vs 12.9% in December 2019). Nonetheless, the largest increase was observed in loans on demand, whose share over total assets grew to 12.5% in December 2020 from 7.6% in December 2019.
2 For further detail, please, see the EBA 2020 Risk Assessment Report.

7
Figure 1: Total asset composition (encumbered and unencumbered at December 2020) and evolution by type of instrument
As of December 2020, EU banks had EUR 2.8 tn of collateral, roughly the same amount as December 2019 (+0.6% year on year (YoY)). However, in the first quarter of 2020, the volume of collateral increased sharply and reached EUR 3.2 tn (+15.9% QoQ), driven mainly by the increase in debt securities. As market volatility receded, collateral volumes returned to their pre-COVID levels. By the end of 2020, debt securities represented the largest share of collateral (81.7%), followed by equity instruments (14.1%).
Figure 2: Total collateral (encumbered and unencumbered) volumes (EUR tn) and breakdown by type of instrument (%)

8
2. Total encumbrance
In the first quarter of 2020, banks found themselves at a crossroad. On the one hand, primary wholesale funding markets came to a virtual halt. On the other, NFC demand for credit increased substantially as they were preparing for a lockdown. Banks made extensive use of secured funding to build liquidity buffers that allowed them to continue to support the real economy. This resulted in a substantial increase in encumbrance.
Although after an unprecedented response from fiscal, monetary and regulatory authorities, the market tensions receded, EU banks continued to pledge assets and collateral to obtain secured funding and by December 2020 the encumbrance ratio of total assets and collateral received rose to 27.8% from 25% a year earlier.
The increase in encumbered assets and collateral was mainly concentrated in the first quarter of 2020 when market tensions were more acute and the fiscal, monetary and regulatory responses were not fully defined yet. In the second and the third quarter of the year, the increases were less pronounced and even in the fourth quarter a slight decrease was observed. YoY, the numerator (encumbered assets and encumbered collateral) rose 20.6% (+EUR 1.4 tn) while the growth of the denominator (total assets and collateral encumbered and non-encumbered) attained 8.2% (+EUR 2.2tn).
Figure 3: YoY (left) and QoQ (right) evolution of the asset encumbrance ratio of total assets and collateral received (%), numerator and denominator
As in previous years, in 2020 the encumbrance ratio of total assets was substantially below that of total collateral (23.6% vs 67.9% as of December 2020). In absolute terms, the growth of encumbered assets (+25.4% YoY) outpaced that of total assets (+9.1% YoY), with most of the increase concentrated in the first half of the year. Against this backdrop, the encumbrance ratio of total assets rose 3 pp YoY to 23.6% and encumbered assets reached EUR 6.2 tn.
9
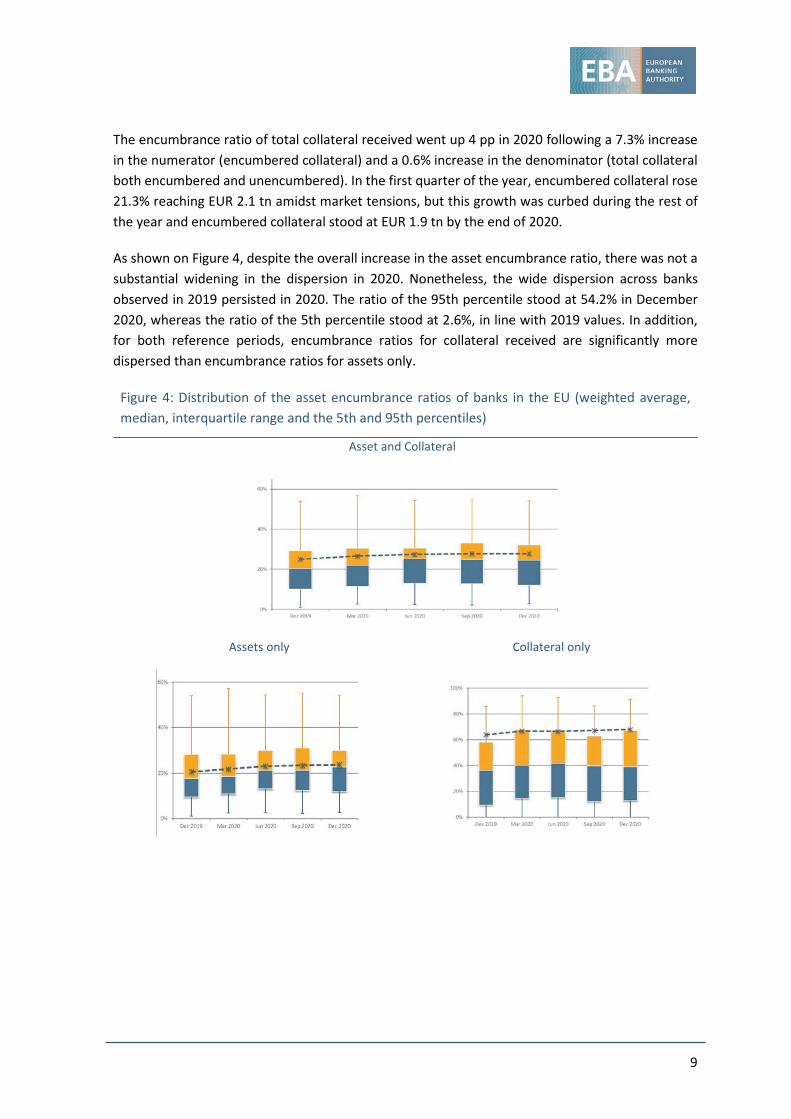
The encumbrance ratio of total collateral received went up 4 pp in 2020 following a 7.3% increase in the numerator (encumbered collateral) and a 0.6% increase in the denominator (total collateral both encumbered and unencumbered). In the first quarter of the year, encumbered collateral rose 21.3% reaching EUR 2.1 tn amidst market tensions, but this growth was curbed during the rest of the year and encumbered collateral stood at EUR 1.9 tn by the end of 2020.
As shown on Figure 4, despite the overall increase in the asset encumbrance ratio, there was not a substantial widening in the dispersion in 2020. Nonetheless, the wide dispersion across banks observed in 2019 persisted in 2020. The ratio of the 95th percentile stood at 54.2% in December 2020, whereas the ratio of the 5th percentile stood at 2.6%, in line with 2019 values. In addition, for both reference periods, encumbrance ratios for collateral received are significantly more dispersed than encumbrance ratios for assets only.
Figure 4: Distribution of the asset encumbrance ratios of banks in the EU (weighted average, median, interquartile range and the 5th and 95th percentiles)
Asset and Collateral
Assets only Collateral only

10
3. Encumbrance by country
Although the overall asset encumbrance ratio rose materially in 2020, some differences can be observed across counties. The largest increase was observed in Latvian banks (+8 pp), albeit from very low levels. Greek banks also registered a substantial rise (+7.3 pp). This was favoured by the ECB decision to apply a waiver on marketable assets issued by the Greek government, hence, allowing banks to use Greek sovereign debt in central bank repo operations3. Material increases were also observed in Belgium (+6.9 pp) and Ireland (+6.2 pp).
On the contrary, the largest decreases in the ratio were observed mainly in non-Eurozone countries. For instance, the asset encumbrance ratios for Bulgaria, Czech Republic and Denmark fell by 2.1 pp, 1.6 pp and 1.5 pp respectively.
Figure 5: Weighted average asset encumbrance by country
In spite of these variations, as in previous years, the asset encumbrance ratio appears to be relatively high in countries with specific funding market characteristics. In particular, the ratio is higher in countries with large and established covered bond markets, such as the Nordic countries and Germany. Countries where there has been more use of central bank funding (e.g. Greece and Italy) also have higher ratios, as well as countries with a high share of repurchase agreement (repo) financing (e.g. France).
3 ECB announces package of temporary collateral easing measures, 7 April 2020.

11
It is also important to look at the links between asset encumbrance and capital ratios. Different banks’ business models might justify the differences in the former while the latter has recently been influenced by supervisors’ and regulators’ calls for banks to make use of their capital buffers to maintain the flow of lending to the real economy. Nonetheless, it is noteworthy that, as encumbrance subordinates unsecured creditors and increases the losses for them in case of default, banks with thinner capital buffers might be more vulnerable to a deterioration in market perception arising from increasing asset encumbrance. In this regard, an analysis of 140 EU/EEA banks reveals that in December 2020, 42 of them were both below the median management buffer over overall capital requirements (OCR) (6.2%) and had an asset encumbrance ratio above the median (20.5%). In December 2019, 46 banks out of a sample of 158 were simultaneously below the median management buffer (4.1%) and above the median asset encumbrance ratio (17.0%).
Figure 6: Capital management buffer and asset encumbrance ratios

12
4. Encumbrance by asset class and maturity
The distribution of encumbrance by asset class did not change materially in 2020. Debt securities and loans and advances other than loans on demand accounted for almost 90% of total encumbered assets and collateral (54.0% and 35.0%, respectively, as of December 2020).
When only encumbered assets are considered, the weight of loans and advances other than loans on demand rises to 70.5% while the share of debt securities falls to 19.6%. On the contrary, loans and advances other than loans on demand accounted for a negligible share of encumbered collateral (0.4%) while debt securities were responsible for 85.1% of it. Equity instruments were the second most relevant asset class of encumbered collateral with a weight of 14.3% in December 2020.
Figure 7: Distribution of volumes of encumbered assets and collateral by type
Assets and collateral Assets only Collateral only
Following the overall increase in asset encumbrance ratios in 2020 (see Chapter 2), all the asset classes with the exception of loans on demand registered an increase in their encumbrance ratios. Equity instruments continue to exhibit the highest level of encumbrance (54.9% as of December 2020 vs 51.6% as of December 2019) followed by debt securities (50.1% as of December 2020 vs 45.2% as of December 2019).
The largest increase was observed in the category of loans and advances other than loans on demand, which rose 5.1 pp to 27.3% in 2020. Usually, the main sources of encumbrance of these assets are covered bonds and asset-backed securities (ABS) issued. Although the share over total sources of encumbrance of these two types of securities fell in 2020 (see Chapter 5), anecdotal evidence suggests banks increasingly used retained covered bonds and ABS to tap central bank

13
facilities. This results in an increasing encumbrance of the underlying loans via central bank funding — whose share over total sources of encumbrance increased substantially in 2020 (see Chapter 5) — instead of via covered bonds and ABS. Moreover, the easing of the conditions for the use of credit claims as collateral in ECB facilities 4 has also favoured the encumbrance of loans and advances other than loans on demand.
Figure 8: Percentage of encumbrance of total assets and collateral by type
The volume of unencumbered assets and collateral provides some insights into banks’ capacity to generate future funding. Although from December 2019 to December 2020 banks increased the volume of unencumbered assets and collateral by EUR 813 bn (see Chapter 2), the increase was almost exclusively driven by the rise in loans on demand (+EUR 1.4 tn or +79.6% YoY) as banks were depositing at central banks a material part of the liquidity obtained from them. On the contrary, unencumbered loans and advances other than loans on demand and debt securities fell by EUR 736 bn (-6.0%) and EUR 139 bn (-4.7%), respectively. As a result of these trends, in 2020 the weight of the unencumbered volumes of these two asset classes over total unencumbered assets and collateral fell 5.9 pp and 1.2 pp to 55.4% and 13.4%, respectively, while the share of loans on demand jumped 6.4 pp to 15.1%.
4 ECB announces package of temporary collateral easing measures, 7 April 2020.

14
Figure 9: Distribution of volumes of unencumbered assets and collateral by type
Assets and collateral Assets only Collateral only
The volume of central bank eligible assets and collateral can complement the analysis of the capacity of banks to generate future funding since it offers an insight into the marketability of banks’ assets and collateral. As of December 2020, EU banks had EUR 7.6 tn (+15.2% compared to December 2019) of central bank eligible assets and collateral, of which 50.3% was encumbered. This implies a material increase from the level observed in December 2019 (44.1%). This rise is explained by the sharp rise in the numerator of the ratio (encumbered central bank eligible assets and collateral) (+31.4% YoY).
By asset class, the increase in the encumbrance ratio of central bank eligible loans and advances other than loans on demand (+15.6 pp YoY to 67.7%) and, to a lesser extent, debt securities (+6.2 pp YoY to 52.7%) is noteworthy. On the contrary, the encumbrance ratio of eligible equity instruments fell 14.6 pp to 72.1%.
Despite the increase in the encumbrance ratio of central bank eligible assets and collateral, EU banks also register a 2.4% increase in unencumbered central bank eligible assets and collateral due, to a large extent, to the ECB easing of collateral requirements5. Thus, as of December 2020, banks had EUR 3.8 tn of assets and collateral to tap central bank liquidity facilities, of which more than half were in the form of debt securities. As a percentage of total assets, unencumbered central bank eligible assets fell from 15.4% in December 2019 to 14.5% one year later.
5 ECB announces package of temporary collateral easing measures, 7 April 2020, and ECB takes steps to mitigate impact of possible rating downgrades on collateral availability, 22 April 2020.

15
Figure 10: Encumbrance ratio of total central bank eligible assets and collateral (left) and distribution of volumes of central bank eligible unencumbered assets and collateral as of December 2020 (right)
As regards the maturity of encumbered assets and collateral, in December 2020, almost 50% of these had an open maturity or a maturity of less than 1 year. It is noteworthy that the extensive use of central bank facilities in 2020, in particular the ECB TLTRO III, caused a jump in the volume of encumbered assets and collateral with a maturity between 2 and 3 years. While the weight of this cohort was just 6.5% as of December 2019, it surged to 19.8% in December 2020 (Figure 11).
Figure 11: Distribution of encumbered assets and collateral by maturity
16
5. Sources of encumbrance
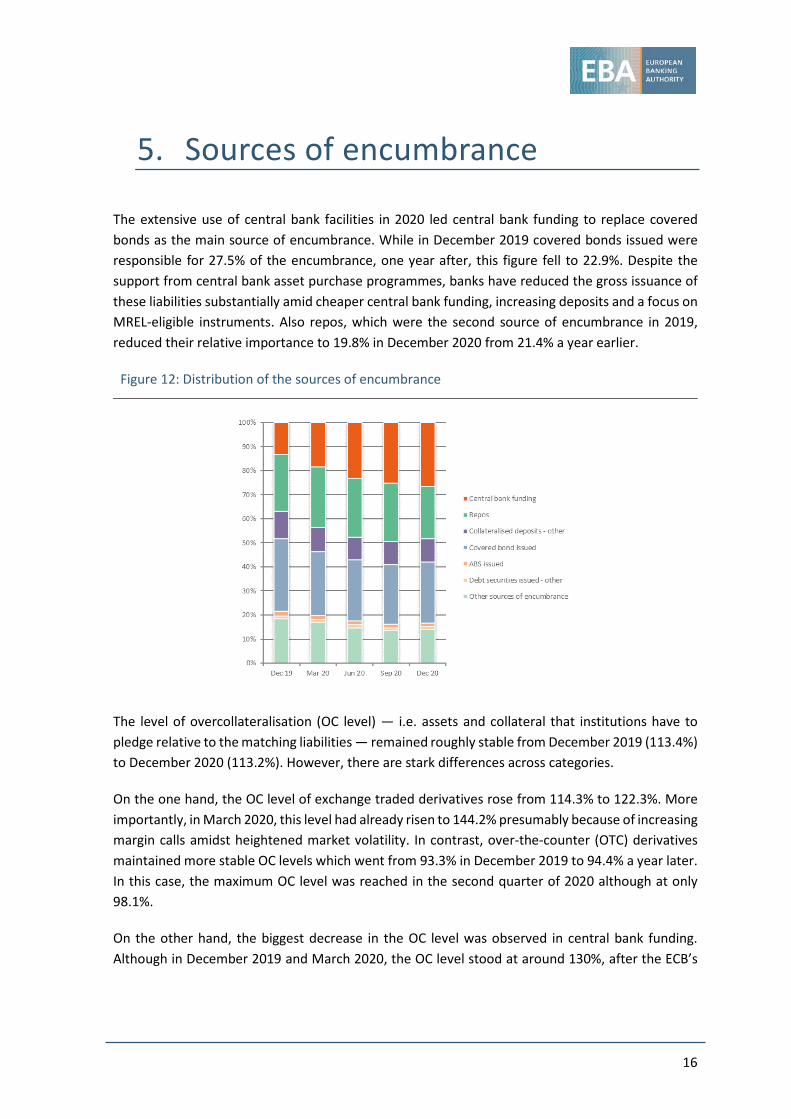
The extensive use of central bank facilities in 2020 led central bank funding to replace covered bonds as the main source of encumbrance. While in December 2019 covered bonds issued were responsible for 27.5% of the encumbrance, one year after, this figure fell to 22.9%. Despite the support from central bank asset purchase programmes, banks have reduced the gross issuance of these liabilities substantially amid cheaper central bank funding, increasing deposits and a focus on MREL-eligible instruments. Also repos, which were the second source of encumbrance in 2019, reduced their relative importance to 19.8% in December 2020 from 21.4% a year earlier.
Figure 12: Distribution of the sources of encumbrance
The level of overcollateralisation (OC level) — i.e. assets and collateral that institutions have to pledge relative to the matching liabilities — remained roughly stable from December 2019 (113.4%) to December 2020 (113.2%). However, there are stark differences across categories.
On the one hand, the OC level of exchange traded derivatives rose from 114.3% to 122.3%. More importantly, in March 2020, this level had already risen to 144.2% presumably because of increasing margin calls amidst heightened market volatility. In contrast, over-the-counter (OTC) derivatives maintained more stable OC levels which went from 93.3% in December 2019 to 94.4% a year later. In this case, the maximum OC level was reached in the second quarter of 2020 although at only 98.1%.
On the other hand, the biggest decrease in the OC level was observed in central bank funding. Although in December 2019 and March 2020, the OC level stood at around 130%, after the ECB’s

17
easing of collateral requirements in April 20206, this level fell 11.3 pp only in the second quarter and ended 2020 at 118.7%.
Figure 13: Encumbered assets and collateral relative to matching liabilities7
6 ECB announces package of temporary collateral easing measures, 7 April 2020, and ECB takes steps to mitigate impact of possible rating downgrades on collateral availability, 22 April 2020. 7 For derivatives, it should be taken into account that derivatives are reported on a gross basis under International Financial Reporting Standards (IFRS), while collateral might be netted.

18
Conclusion
Different banks’ business models might explain the differences in encumbrance. These differences are observed in the proportion of encumbered assets and collateral, the types of assets which are encumbered or the sources of encumbrance.
Banks responded to the funding challenges posed by COVID-19 by making more use of secured financing. In the first quarter of 2020, wholesale funding came to a virtual halt while loan demand from NFCs was increasing. In order to maintain their support to the real economy, banks made extensive use of secured funding, mainly central bank facilities.
The average OC level of banks’ secured funding receded following the easing of the ECB collateral requirements in April 2020. After a sharp increase in the first quarter amidst market tensions, the OC level decreased in the following quarters and ended the year at roughly the same level as the previous year. Nonetheless, higher OC levels can still be observed for certain funding categories, in particular, derivatives.
Increasing encumbrance ratios might pose prudential risks. As encumbrance subordinates unsecured creditors, they might demand higher spreads in stress situations and lead banks to prioritise secured funding. Increasing encumbrance ratios might also raise concerns among secured creditors that may demand higher OC levels, apply larger haircuts on collateral or make margin calls. This could lead to an adverse feedback loop of higher encumbrance, higher funding costs and diminishing liquidity.

19
Annex I: The asset encumbrance ratio
The core metric applied in this report is the asset encumbrance ratio. The metric used as a basis for all analyses (unless stated otherwise) is the asset encumbrance ratio as defined in Commission Implementing Regulation (EU) No 2015/79 8 . The asset encumbrance ratio is defined as an institution’s stock of encumbered assets and collateral received and reused, over total assets and collateral received:
𝐴𝐴𝐴𝐴% =𝑇𝑇𝑇𝑇𝑇𝑇𝑇𝑇𝑇𝑇 𝑒𝑒𝑒𝑒𝑒𝑒𝑒𝑒𝑒𝑒𝑒𝑒𝑒𝑒𝑒𝑒𝑒𝑒𝑒𝑒 𝑇𝑇𝑎𝑎𝑎𝑎𝑒𝑒𝑇𝑇𝑎𝑎 + 𝑇𝑇𝑇𝑇𝑇𝑇𝑇𝑇𝑇𝑇 𝑒𝑒𝑇𝑇𝑇𝑇𝑇𝑇𝑇𝑇𝑇𝑇𝑒𝑒𝑒𝑒𝑇𝑇𝑇𝑇 𝑒𝑒𝑒𝑒𝑒𝑒𝑒𝑒𝑟𝑟𝑟𝑟𝑒𝑒𝑒𝑒 𝑇𝑇𝑒𝑒𝑒𝑒 𝑒𝑒𝑒𝑒𝑒𝑒𝑎𝑎𝑒𝑒𝑒𝑒
𝑇𝑇𝑇𝑇𝑇𝑇𝑇𝑇𝑇𝑇 𝑇𝑇𝑎𝑎𝑎𝑎𝑒𝑒𝑇𝑇𝑎𝑎 + 𝑇𝑇𝑇𝑇𝑇𝑇𝑇𝑇𝑇𝑇 𝑒𝑒𝑇𝑇𝑇𝑇𝑇𝑇𝑇𝑇𝑇𝑇𝑒𝑒𝑒𝑒𝑇𝑇𝑇𝑇 𝑒𝑒𝑒𝑒𝑒𝑒𝑒𝑒𝑟𝑟𝑟𝑟𝑒𝑒𝑒𝑒 𝑇𝑇𝑟𝑟𝑇𝑇𝑟𝑟𝑇𝑇𝑇𝑇𝑒𝑒𝑇𝑇𝑒𝑒 𝑓𝑓𝑇𝑇𝑒𝑒 𝑒𝑒𝑒𝑒𝑒𝑒𝑒𝑒𝑒𝑒𝑒𝑒𝑒𝑒𝑇𝑇𝑒𝑒𝑒𝑒𝑒𝑒
Collateral received is part of the definition, as it can be assumed that this is usually available to be reused for refinancing transactions. Here, assets are measured at their carrying amount, while collateral is measured at fair value. Additional selected analyses apply the same calculation for assets or collateral only. An asset is treated as encumbered if it has been pledged or if it is subject to any form of arrangement to secure, collateralise or credit enhance any transaction from which it cannot be freely withdrawn. This definition covers, but is not limited to:
secured financing transactions, including repurchase contracts and agreements, securities lending and other forms of secured lending;
various collateral agreements, for instance collateral placed for the market value of derivative transactions;
financial guarantees that are collateralised;
collateral placed at clearing systems, central counterparties (CCPs) and other infrastructure institutions as a condition of access to service;
central bank facilities;
underlying assets from securitisation structures, where the financial assets have not been derecognised from the institution’s financial assets;
assets in cover pools used for covered bond issuance.
Further details on the definitions of various metrics and the data reported can also be found in Annex III of Commission Implementing Regulation (EU) No 2015/79.
8 Paragraphs 9-11 of Annex III.

20
Annex II: References to FINREP and COREP tables
This annex gives details of the calculations underlying the figures presented in the report. Reference is made to ITS data points identified with the following convention: ITS Table name_row number_column number. For example, F 32.01_020_010 refers to FINREP Table 32.01, row 020, Column 010 – Asset encumbrance: Encumbrance overview – Assets, Assets of the reporting institution, Carrying amount of encumbered assets.
Figure Chart name Series Formula
Fig.1
Total asset composition (encumbered and unencumbered at December 2020) and evolution by type of instrument
Loans and advances other than loans on demand
(F 32.01_100_010 + F 32.01_100_060)/(F 32.01_010_010 + F 32.01_010_060)
Debt securities (F 32.01_040_010 + F 32.01_040_060)/(F 32.01_010_010 + F 32.01_010_060)
Other assets (F 32.01_120_010 + F 32.01_120_060)/(F 32.01_010_010 + F 32.01_010_060)
Loans on demand (F 32.01_020_010 + F 32.01_020_060)/(F 32.01_010_010 + F 32.01_010_060)
Equity instruments (F 32.01_030_010 + F 32.01_030_060)/(F 32.01_010_010 + F 32.01_010_060)
Total assets (F 32.01_010_010 + F 32.01_010_060)
Fig.2
Total collateral (encumbered and unencumbered) volumes (EUR tn) and breakdown by type of instrument (%)
Debt securities (F 32.02.a_160_010 + F 32.02.a_160_040)/(F 32.02.a_130_010 + F 32.02.a_130_040)
Equity instruments (F 32.02.a_150_010 + F 32.02.a_150_040)/(F 32.02.a_130_010 + F 32.02.a_130_040)
Loans and advances other than loans on demand
(F 32.02.a_220_010 + F 32.02.a_220_040)/(F 32.02.a_130_010 + F 32.02.a_130_040)
Loans on demand (F 32.02.a_140_010 + F 32.02.a_140_040)/(F 32.02.a_130_010 + F 32.02.a_130_040)
Other collateral received (F 32.02.a_230_010 + F 32.02.a_230_040)/(F 32.02.a_130_010 + F 32.02.a_130_040)
Total collateral (F 32.02.a_130_010 + F 32.02.a_130_040)
Fig.3
YoY (left) and QoQ (right) evolution of the asset encumbrance ratio of total assets and collateral received (%), numerator and denominator
Encumbered assets and collateral (numerator) (F 32.01_010_010 + F 32.02.a_130_010)
Total assets and collateral (denominator)
(F 32.01_010_010 + F 32.02.a_130_010 + F 32.01_010_060 + F 32.02.a_130_040)
Asset encumbrance ratio (F 32.01_010_010 + F 32.02.a_130_010)/(F 32.01_010_010 + F 32.02.a_130_010 + F 32.01_010_060 + F 32.02.a_130_040)
Fig.4
Distribution of the asset encumbrance ratios of the banks in the EU (weighted average, median, interquartile range and the 5th and 95th percentiles)
Assets and collateral (F 32.01_010_010 + F 32.02.a_130_010)/(F 32.01_010_010 + F 32.02.a_130_010 + F 32.01_010_060 + F 32.02.a_130_040)
Assets (F 32.01_010_010)/(F 32.01_010_010+F 32.01_010_060)
Collateral (F 32.02.a_130_010)/(F 32.02.a_130_010+F 32.02.a_130_040)
Fig.5 Weighted average asset encumbrance by country (F 32.01_010_010 + F 32.02.a_130_010)/(F 32.01_010_010 + F
32.02.a_130_010 + F 32.01_010_060 + F 32.02.a_130_040)
Fig.6 Capital management buffer and asset encumbrance ratios
Management buffer ((C 01.00_020_010 [adjusted for AT1/Tier2 shortfall] / C 02.00_010_010) - C 03.00_200_010))
Asset encumbrance ratio (F 32.01_010_010 + F 32.02.a_130_010)/(F 32.01_010_010 + F 32.02.a_130_010 + F 32.01_010_060 + F 32.02.a_130_040)
Fig.7
Distribution of volumes of encumbered assets and collateral by type – ASSETS AND COLLATERAL
Loans on demand (F 32.01_020_010 + F 32.02.a_140_010) Equity instruments (F 32.01_030_010 + F 32.02.a_150_010) Debt securities (F 32.01_040_010 + F 32.02.a_160_010) Loans and advances other than loans on demand
(F 32.01_100_010 + F 32.02.a_220_010)

21
Other assets (F 32.01_120_010 + F 32.02.a_230_010)
Distribution of volumes of encumbered assets and collateral by type – ASSETS ONLY
Loans on demand (F 32.01_020_010) Equity instruments (F 32.01_030_010) Debt securities (F 32.01_040_010) Loans and advances other than loans on demand
(F 32.01_100_010)
Other assets (F 32.01_120_010)
Distribution of volumes of encumbered assets and collateral by type – COLLATERAL ONLY
Loans on demand (F 32.02.a_140_010) Equity instruments (F 32.02.a_150_010) Debt securities (F 32.02.a_160_010) Loans and advances other than loans on demand
(F 32.02.a_220_010)
Other assets (F 32.02.a_230_010)
Fig.8
Percentage of encumbrance of total assets and collateral by type
Loans on demand (F 32.01_020_010 + F 32.02.a_140_010)/(F 32.01_020_060 + F 32.01_020_010 + F 32.02.a_140_040 + F 32.02.a_140_010)
Equity instruments (F 32.01_030_010 + F 32.02.a_150_010)/(F 32.01_030_060 + F 32.01_030_010 + F 32.02.a_150_040 + F 32.02.a_150_010)
Debt securities (F 32.01_040_010 + F 32.02.a_160_010)/(F 32.01_040_060 + F 32.01_040_010 + F 32.02.a_160_040 + F 32.02.a_160_010)
Loans and advances other than loans on demand
(F 32.01_100_010 + F 32.02.a_220_010)/(F 32.01_100_060 + F 32.01_100_010 + F 32.02.a_220_040 + F 32.02.a_220_010)
Other assets (F 32.01_120_010 + F 32.02.a_230_010)/(F 32.01_120_060 + F 32.01_120_010 + F 32.02.a_230_040 + F 32.02.a_230_010)
Total (F 32.01_010_010 + F 32.02.a_130_010)/(F 32.01_010_060 + F 32.01_010_010 + F 32.02.a_130_040 + F 32.02.a_130_010)
Fig.9
Distribution of volumes of unencumbered assets and collateral by type - ASSETS AND COLLATERAL
Loans on demand (F 32.01_020_060 + F 32.02.a_140_040) Equity instruments (F 32.01_030_060 + F 32.02.a_150_040) Debt securities (F 32.01_040_060 + F 32.02.a_160_040) Loans and advances other than loans on demand
(F 32.01_100_060 + F 32.02.a_220_040)
Other assets (F 32.01_120_060 + F 32.02.a_230_040)
Distribution of volumes of unencumbered assets and collateral by type – ASSETS ONLY
Loans on demand (F 32.01_020_060) Equity instruments (F 32.01_030_060) Debt securities (F 32.01_040_060) Loans and advances other than loans on demand
(F 32.01_100_060)
Other assets (F 32.01_120_060)
Distribution of volumes of unencumbered assets and collateral by type – COLLATERAL ONLY
Loans on demand ( F 32.02.a_140_040) Equity instruments (F 32.02.a_150_040) Debt securities ( F 32.02.a_160_040) Loans and advances other than loans on demand
( F 32.02.a_220_040)
Other assets (F 32.02.a_230_040)
Fig.10
Encumbrance ratio of total central bank eligible assets and collateral
Total (F 32.01_010_030 + F 32.02.a_130_030)/(F 32.01_010_030 + F 32.01_010_080 + F 32.02.a_130_030 + F 32.02.a_130_060)
Loans on demand (F 32.01_020_030 + F 32.02.a_140_030)/(F 32.01_020_030 + F 32.01_020_080 + F 32.02.a_140_030 + F 32.02.a_140_060)
Equity instruments (F 32.01_030_030 + F 32.02.a_150_030)/(F 32.01_030_030 + F 32.01_030_080 + F 32.02.a_150_030 + F 32.02.a_150_060)
Debt securities (F 32.01_040_030 + F 32.02.a_160_030)/(F 32.01_040_030 + F 32.01_040_080 + F 32.02.a_160_030 + F 32.02.a_160_060)
Loans and advances other than loans on demand
(F 32.01_100_030 + F 32.02.a_220_030)/(F 32.01_100_030 + F 32.01_100_080 + F 32.02.a_220_030 + F 32.02.a_220_060)
Other assets (F 32.01_120_030 + F 32.02.a_230_030)/(F 32.01_120_030 + F 32.01_120_080 + F 32.02.a_230_030 + F 32.02.a_230_060)
Distribution of volumes of central bank eligible unencumbered assets and collateral
Total (F 32.01_010_080 + F 32.02.a_130_060)/(F 32.01_010_030 + F 32.01_010_080 + F 32.02.a_130_030 + F 32.02.a_130_060)
Loans on demand (F 32.01_020_080 + F 32.02.a_140_060)/(F 32.01_020_030 + F 32.01_020_080 + F 32.02.a_140_030 + F 32.02.a_140_060)

22
Equity instruments (F 32.01_030_080 + F 32.02.a_150_060)/(F 32.01_030_030 + F 32.01_030_080 + F 32.02.a_150_030 + F 32.02.a_150_060)
Debt securities (F 32.01_040_080 + F 32.02.a_160_060)/(F 32.01_040_030 + F 32.01_040_080 + F 32.02.a_160_030 + F 32.02.a_160_060)
Loans and advances other than loans on demand
(F 32.01_100_080 + F 32.02.a_220_060)/(F 32.01_100_030 + F 32.01_100_080 + F 32.02.a_220_030 + F 32.02.a_220_060)
Other assets (F 32.01_120_080 + F 32.02.a_230_060)/(F 32.01_120_030 + F 32.01_120_080 + F 32.02.a_230_030 + F 32.02.a_230_060)
Fig.11 Distribution of encumbered assets and collateral by maturity
Open maturity (F 33.00.a_010_010 + F 33.00.a_030_010)/(F 33.00.a_010_SUM(all columns) + F 33.00.a_030_SUM(all columns))
Overnight (F 33.00.a_010_020 + F 33.00.a_030_020)/(F 33.00.a_010_SUM(all columns) + F 33.00.a_030_SUM(all columns))
>1day <=1wk (F 33.00.a_010_030 + F 33.00.a_030_030)/(F 33.00.a_010_SUM(all columns) + F 33.00.a_030_SUM(all columns))
>1wk <=2wks (F 33.00.a_010_040 + F 33.00.a_030_040)/(F 33.00.a_010_SUM(all columns) + F 33.00.a_030_SUM(all columns))
>2wks <=1mth (F 33.00.a_010_050 + F 33.00.a_030_050)/(F 33.00.a_010_SUM(all columns) + F 33.00.a_030_SUM(all columns))
>1mth <=3mths (F 33.00.a_010_060 + F 33.00.a_030_060)/(F 33.00.a_010_SUM(all columns) + F 33.00.a_030_SUM(all columns))
>3mths <=6mths (F 33.00.a_010_070 + F 33.00.a_030_070)/(F 33.00.a_010_SUM(all columns) + F 33.00.a_030_SUM(all columns))
>6mths <=1yr (F 33.00.a_010_080 + F 33.00.a_030_080)/(F 33.00.a_010_SUM(all columns) + F 33.00.a_030_SUM(all columns))
>1yr <=2yrs (F 33.00.a_010_090 + F 33.00.a_030_090)/(F 33.00.a_010_SUM(all columns) + F 33.00.a_030_SUM(all columns))
>2yrs <=3yrs (F 33.00.a_010_100 + F 33.00.a_030_100)/(F 33.00.a_010_SUM(all columns) + F 33.00.a_030_SUM(all columns))
3yrs <=5yrs (F 33.00.a_010_110 + F 33.00.a_030_110)/(F 33.00.a_010_SUM(all columns) + F 33.00.a_030_SUM(all columns))
5yrs <=10yrs (F 33.00.a_010_120 + F 33.00.a_030_120)/(F 33.00.a_010_SUM(all columns) + F 33.00.a_030_SUM(all columns))
>10yrs (F 33.00.a_010_130 + F 33.00.a_030_130)/(F 33.00.a_010_SUM(all columns) + F 33.00.a_030_SUM(all columns))
Total (F 32.01_010_030 + F 32.02.a_130_030)/(F 32.01_010_030 + F 32.01_010_080 + F 32.02.a_130_030 + F 32.02.a_130_060)
Fig.12 Distribution of the sources of encumbrance
Central bank funding (F 32.04.b_060_030 + F 32.04.b_080_030)/(F 32.04.b_170_030) Over-the-counter derivatives (F 32.04.b_030_030)/(F 32.04.b_170_030)
Exchange-traded derivatives (F 32.04.b_020_030 - F 32.04.b_030_030)/(F 32.04.b_170_030)
Repos (F 32.04.b_050_030 - F 32.04.b_060_030)/(F 32.04.b_170_030) Collateralised deposits – Other (F 32.04.b_070_030 - F 32.04.b_080_030)/(F 32.04.b_170_030)
Covered bond issued (F 32.04.b_100_030)/(F 32.04.b_170_030) ABS issued (F 32.04.b_110_030)/(F 32.04.b_170_030) Debt securities issued – Other
(F 32.04.b_090_030 - F 32.04.b_100_030 - F 32.04.b_110_030)/(F 32.04.b_170_030)
Other sources of encumbrance (F 32.04.b_120_030)/(F 32.04.b_170_030)
Fig.13 Encumbered assets and collateral relative to matching liabilities
Central bank funding (F 32.04.b_060_030 + F 32.04.b_080_030)/(F 32.04.a_060_010 + F 32.04.a_080_010)
Over-the-counter derivatives (F 32.04.b_030_030)/(F 32.04.a_030_010)

23
Exchange-traded derivatives
(F 32.04.b_020_030 - F 32.04.b_030_030)/(F 32.04.a_020_010,-F 32.04.a_030_010)
Repos (F 32.04.b_050_030 - F 32.04.b_060_030)/(F 32.04.a_050_010,-F 32.04.a_060_010)
Collateralised deposits – Other
(F 32.04.b_070_030 - F 32.04.b_080_030)/(F 32.04.a_070_010,-F 32.04.a_080_010)
Covered bond issued (F 32.04.b_100_030)/(F 32.04.a_100_010) ABS issued (F 32.04.b_110_030)/(F 32.04.a_110_010)
Debt securities issued – Other
(F 32.04.b_090_030 - F 32.04.b_100_030 - F 32.04.b_110_030)/(F 32.04.a_090_010,-F 32.04.a_100_010,-F 32.04.a_110_010)
Other sources of encumbrance (F 32.04.b_120_030)/(F 32.04.a_120_010)
Total (F 32.04.b_170_030)/(F 32.04.a_170_010)

24
EUROPEAN BANKING AUTHORITY EUROPLAZA 20 Avenue André Prothin 92927 Paris La Défense France Tel. + 33 1 86 52 70 00 E-mail: [email protected]
http://www.eba.europa.eu