Report 3, Candidate discourse in the Speaking Test - IELTS
19
© IELTS Research Reports Volume 6 1 3. Candidate discourse in the revised IELTS Speaking Test Author: Annie Brown Ministry of Higher Education and Scientific Research, United Arab Emirates Grant awarded Round 8, 2002 This study aims to verify the IELTS Speaking Test scale descriptors by providing empirical validity evidence derived from a linguistic analysis of candidate discourse. ABSTRACT In 2001 the IELTS interview format and criteria were revised. A major change was the shift from a single global scale to a set of four analytic scales focusing on different aspects of oral proficiency. This study is concerned with the validity of the analytic rating scales. It aims to verify the descriptors used to define the score points on the scales by providing empirical evidence for the criteria in terms of their overall focus, and their ability to distinguish levels of performance. The Speaking Test band descriptors and criteria key indicators were analysed in order to identify relevant analytic categories for each of the four band scales: fluency, grammatical range and accuracy, lexical resource and pronunciation. Twenty interviews drawn from operational IELTS administrations in a range of countries, and representing a range of proficiency levels, were analysed with respect to these categories. The analysis found that most of the measures displayed increases in the expected direction over the levels, which appears to confirm the validity of the criteria. However, for all measures the standard deviations tended to be large, relative to the differences between levels. This indicates a high level of variation amongst candidates assessed at the same level, and a high degree of overlap between levels, even for those measures which produced significant findings. In addition, for most measures the differences between levels were greater at some boundaries between two bands than at others. Overall, the findings indicate that while all the measures relating to one scale contribute in some way to the assessment on that scale, no one measure drives the rating; rather a range of performance features contribute to the overall impression of the candidate’s proficiency. IELTS RESEARCH REPORTS, VOLUME 6, 2006 Published by: IELTS Australia and British Council © British Council 2006 © IELTS Australia Pty Limited 2006 This publication is copyright. Apart from any fair dealing for the purposes of: private study, research, criticism or review, as permitted under Division 4 of the Copyright Act 1968 and equivalent provisions in the UK Copyright Designs and Patents Act 1988, no part may be reproduced or copied in any form or by any means (graphic, electronic or mechanical, including recording or information retrieval systems) by any process without the written permission of the publishers. Enquiries should be made to the publisher. The research and opinions expressed in this volume are of individual researchers and do not represent the views of IELTS Australia Pty Limited or British Council. The publishers do not accept responsibility for any of the claims made in the research. National Library of Australia, cataloguing-in-publication data, 2006 edition, IELTS Research Reports 2006 Volume 6 ISBN 0-9775875-0-9
Transcript of Report 3, Candidate discourse in the Speaking Test - IELTS
© IELTS Research Reports Volume 6 1
3. Candidate discourse in the revised IELTS Speaking Test Author: Annie Brown Ministry of Higher Education and Scientific Research, United Arab Emirates
Grant awarded Round 8, 2002
This study aims to verify the IELTS Speaking Test scale descriptors by providing empirical validity evidence derived from a linguistic analysis of candidate discourse.
ABSTRACT
In 2001 the IELTS interview format and criteria were revised. A major change was the shift from a single global scale to a set of four analytic scales focusing on different aspects of oral proficiency. This study is concerned with the validity of the analytic rating scales. It aims to verify the descriptors used to define the score points on the scales by providing empirical evidence for the criteria in terms of their overall focus, and their ability to distinguish levels of performance.
The Speaking Test band descriptors and criteria key indicators were analysed in order to identify relevant analytic categories for each of the four band scales: fluency, grammatical range and accuracy, lexical resource and pronunciation. Twenty interviews drawn from operational IELTS administrations in a range of countries, and representing a range of proficiency levels, were analysed with respect to these categories.
The analysis found that most of the measures displayed increases in the expected direction over the levels, which appears to confirm the validity of the criteria. However, for all measures the standard deviations tended to be large, relative to the differences between levels. This indicates a high level of variation amongst candidates assessed at the same level, and a high degree of overlap between levels, even for those measures which produced significant findings. In addition, for most measures the differences between levels were greater at some boundaries between two bands than at others.
Overall, the findings indicate that while all the measures relating to one scale contribute in some way to the assessment on that scale, no one measure drives the rating; rather a range of performance features contribute to the overall impression of the candidate’s proficiency.
IELTS RESEARCH REPORTS, VOLUME 6, 2006 Published by: IELTS Australia and British Council © British Council 2006 © IELTS Australia Pty Limited 2006 This publication is copyright. Apart from any fair dealing for the purposes of: private study, research, criticism or review, as permitted under Division 4 of the Copyright Act 1968 and equivalent provisions in the UK Copyright Designs and Patents Act 1988, no part may be reproduced or copied in any form or by any means (graphic, electronic or mechanical, including recording or information retrieval systems) by any process without the written permission of the publishers. Enquiries should be made to the publisher. The research and opinions expressed in this volume are of individual researchers and do not represent the views of IELTS Australia Pty Limited or British Council. The publishers do not accept responsibility for any of the claims made in the research. National Library of Australia, cataloguing-in-publication data, 2006 edition, IELTS Research Reports 2006 Volume 6 ISBN 0-9775875-0-9
3. Candidate discourse in the revised IELTS Speaking Test – Annie Brown
© IELTS Research Reports Volume 6 2
CONTENTS
1 Aim of the study ........................................................................................ 3 2 Discourse studies of L2 speaking task performance ............................ 3 3 Methodology ........................................................................................... 4 3.1 Data ........................................................................................... 4 3.2 The IELTS Speaking Test ................................................................... 5 3.3 Analytic categories.............................................................................. 5 3.3.1 Fluency and coherence ..................................................... 6 3.3.2 Lexical resources............................................................... 7 3.3.3 Grammatical range and accuracy...................................... 8 4 Results ........................................................................................... 10 4.1 Fluency and coherence....................................................................... 10 4.1.1 Repair ................................................................................ 10 4.1.2 Hesitation........................................................................... 10 4.1.3 Speech rate ....................................................................... 10 4.1.4 Response length................................................................ 10 4.1.5 Amount of speech.............................................................. 11 4.2 Lexical resources ................................................................................ 11 4.3 Grammatical range and accuracy ....................................................... 12 5 Summary of findings ................................................................................ 13 References ........................................................................................... 16 Appendix 1: ANOVAs (Analysis of variance) ............................................. 18
AUTHOR BIODATA:
ANNIE BROWN
Annie Brown is Head of Educational Assessment in the National Admissions and Placement Office (NAPO) of the Ministry of Higher Education and Scientific Research, United Arab Emirates. Previously, and while undertaking this study, she was Senior Research Fellow and Deputy Director of the Language Testing Research Centre at The University of Melbourne. There, she was involved in research and development for a wide range of language tests and assessment procedures, and in language program evaluation. Annie's research interests focus on the assessment of speaking and writing, and the use of Rasch analysis, discourse analysis and verbal protocol analysis. Her books include Interviewer Variability in Oral Proficiency Interviews (Peter Lang, 2005) and the Language Testing Dictionary (CUP, 1999, co-authored with colleagues at the Language Testing Research Centre). She was winner of the 2004 Jacqueline A Ross award for the best PhD in language testing, and winner of the 2003 ILTA (International Language Testing Association) award for the best article on language testing.
3. Candidate discourse in the revised IELTS Speaking Test – Annie Brown
© IELTS Research Reports Volume 6 3
1 AIM OF THE STUDY
This study comprises an analysis of candidate discourse on the revised IELTS Speaking Test as part of the program of validation research funded by IELTS Australia. The overall aim of the study is to try to verify the descriptors used to define the score points on the scales by providing empirical validity evidence for the criteria, in terms of:
! their overall focus and ! their ability to distinguish levels of performance.
The aim will be addressed through an analysis of samples of performance at each of several levels of proficiency using a variety of quantitative and qualitative measures selected to reflect the features of performance relevant to the test construct and defined within the band scales.
2 DISCOURSE STUDIES OF L2 SPEAKING TASK PERFORMANCE
One of the first studies to examine learner discourse in relation to levels of proficiency was that of Mangan (1988). Mangan examined the occurrence of specific grammatical errors in French Oral Proficiency Interviews. He found that while there was a decrease as the proficiency level increased, it was not linear. Douglas (1994) found similar results on a semi-direct speaking test for a variety of measures, including grammatical errors, fluency, vocabulary, and rhetorical organisation. He speculates that this could be because raters were attending to features not included in the scales, which raises the question of the validity of the scales used in this context. It may also be, as Douglas and Selinker (1992, 1993) and Brown et al (2005) argue, that holistic ratings do not adequately capture jagged profiles, that is, different levels of performance by a candidate across different criteria.
Brown, Iwashita and McNamara (2005) undertook an analysis of candidate performance on speaking tasks to be included in New TOEFL. The tasks had an English for Academic Purposes (EAP) focus and included both independent and integrated tasks (see Lewkowicz, 1997 for a discussion of integrated tasks). As the overall aim of the study was to examine the feasibility of drawing on verbal report data to develop scales, the measures used to examine the actual discourse were selected to reflect the criteria applied by EAP specialists when not provided with specific guidance, rather than those contained within existing scales. The criteria applied by the specialists and used to determine the discourse measures reflected four major categories: linguistic resources (which included grammar and vocabulary), fluency (which included repair phenomena, pausing and speech rate), phonology (which included pronunciation, intonation and rhythm), and content.
Brown et al found that for each category only one or two of the measures they used revealed significant differences between levels. In addition, the effect sizes were generally marginal or small, indicating relatively large variability within each score level. This, they surmise, may have been because the score data which formed the basis of the selection of samples was rated holistically rather than analytically. They argue that it may well have been that samples assessed at the same level would reveal very different profiles across the different ‘criteria’ (the major categories identified by the raters). A similar study carried out by Iwashita and McNamara (2003) using data from the Examination for the Certificate of Competency in English (English Language Institute, 2001) produced similar findings.
Discourse analysis of candidate data has also been used in the empirical development of rating scales. The work of Fulcher (1993, 1996, 2003) on the development of scales for fluency is perhaps the most original and detailed. He drew on data taken from a range of language tests to examine what constituted increasing levels of proficiency in terms of a range of fluency measures. He found strong evidence of progression through the levels on a number of these measures, which led to the
3. Candidate discourse in the revised IELTS Speaking Test – Annie Brown
© IELTS Research Reports Volume 6 4
development of descriptors reflecting this progression, that, he argued, would not only be more user-friendly but, because of their basis in actual performance, would lead to more valid and reliable ratings.
Other studies that have used various discourse measures to examine differences in candidate performance on speaking tasks include those by Skehan and Foster (1999), Foster and Skehan (1996) and Wigglesworth (1997, 2001), which used measures designed to capture differences in grammatical accuracy and fluency. In these studies the measures were applied not to performances assessed as being at different levels of proficiency, but to performances on different tasks (where the cognitive complexity of the task differed) or on the same task completed under varying conditions.
Iwashita, McNamara and Elder (2001) drew on Skehan’s (1998) model of cognitive complexity to examine the feasibility of defining levels of ability according to cognitive demand. They manipulated task conditions on a set of narrative tasks and measured performance using measures of accuracy and fluency. However, they found the differences in performance under the different conditions did not support the development of a continuum of ability based on cognitive demand.
As Brown et al (2005) point out in discussing the difficulty of applying some measures, particularly those pertaining to grammatical analysis, most of the studies cited above do not provide measures of inter-coder agreement; Brown et al’s study is exemplary in this respect. Like Foster, Tonkyn and Wigglesworth (2000), they discuss the difficulty of analysing the syntactic quality of spoken second language data using measures developed originally for the analysis of first language written texts. Foster et al consider the usefulness for the analysis of spoken data of several units of analysis commonly used in the analysis of written data. They conclude by proposing a new unit which they term the AS-unit. However, the article itself contains very little guidance on how to apply the analysis. (The AS-unit was considered for this study but an attempt at its use created too many ambiguities and unexplained issues.)
3 METHODOLOGY
3.1 Data A set of 30 taped operational IELTS interviews, drawn from testing centres in a range of countries, was rated analytically using the IELTS band descriptors. Ratings were provided for each of the categories:
! fluency and coherence ! lexical resource ! grammatical range and accuracy ! pronunciation.
To select interviews for the study which could be assumed to be soundly at a particular level, each was rated three times. Then, for each criterion, five interviews were selected at each of four levels, 5 to 8, on that specific criterion (totalling 20 interview samples).
(The IELTS scale ranges from 0 to 9, with 6, 6.5 and 7 typically being the required levels for entry to tertiary study. This study had intended to include level 4 but the quality of the production of candidates at this level and the poor quality of the operational test recordings was such that their interviews proved impossible to transcribe accurately or adequately.)
For example, interviews to be included in the analysis of grammatical accuracy were selected on the basis of the scores awarded in the category grammatical range and accuracy. Similarly, interviews to be included in the analysis of hesitation were selected on the basis of the scores awarded in the category fluency and coherence.
3. Candidate discourse in the revised IELTS Speaking Test – Annie Brown
© IELTS Research Reports Volume 6 5
For interviews to be selected to reflect a specific level on a specific criterion, the following types of agreement on scores were required:
! all three scores were the specified level (eg 7 – 7 – 7), or ! two scores were at the specified level and one a level above or below
(eg 7 – 7 – 8), or ! the three scores reflected different levels but averaged to the level
(eg 6 – 7 – 8).
Prior to analysis the selected tapes were transcribed in full by a research assistant and checked by the researcher.
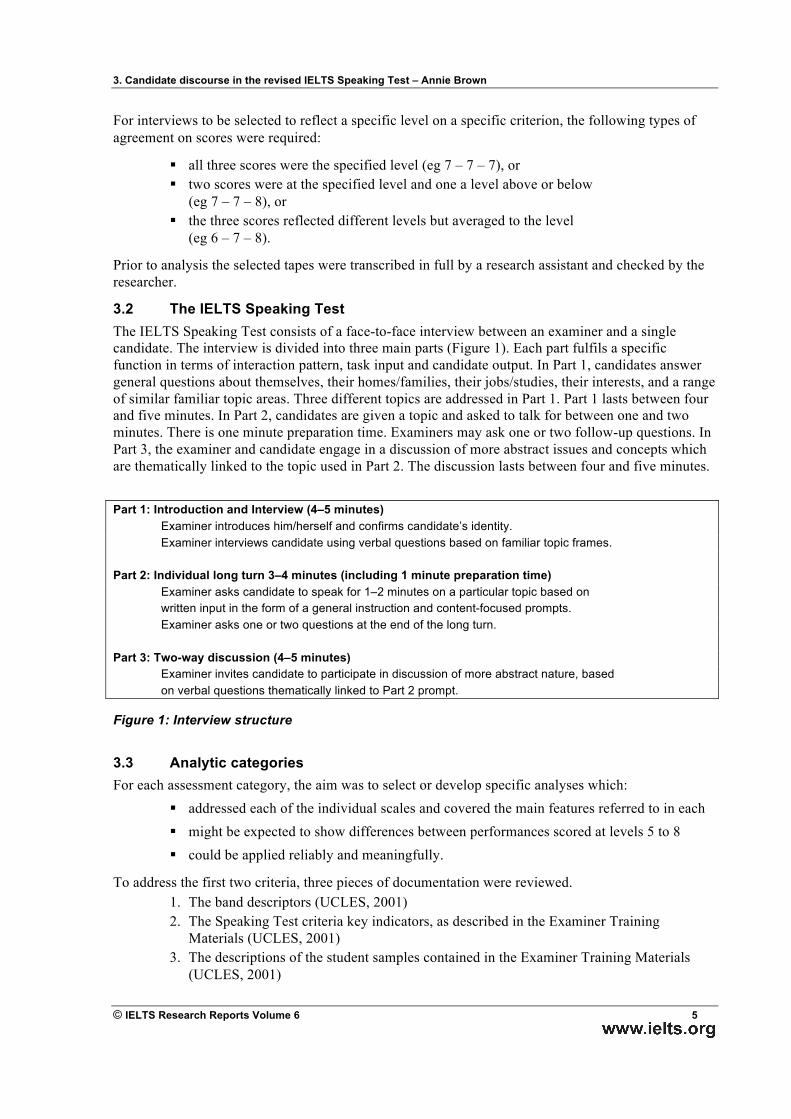
3.2 The IELTS Speaking Test The IELTS Speaking Test consists of a face-to-face interview between an examiner and a single candidate. The interview is divided into three main parts (Figure 1). Each part fulfils a specific function in terms of interaction pattern, task input and candidate output. In Part 1, candidates answer general questions about themselves, their homes/families, their jobs/studies, their interests, and a range of similar familiar topic areas. Three different topics are addressed in Part 1. Part 1 lasts between four and five minutes. In Part 2, candidates are given a topic and asked to talk for between one and two minutes. There is one minute preparation time. Examiners may ask one or two follow-up questions. In Part 3, the examiner and candidate engage in a discussion of more abstract issues and concepts which are thematically linked to the topic used in Part 2. The discussion lasts between four and five minutes.
Part 1: Introduction and Interview (4–5 minutes) Examiner introduces him/herself and confirms candidate’s identity. Examiner interviews candidate using verbal questions based on familiar topic frames.
Part 2: Individual long turn 3–4 minutes (including 1 minute preparation time)
Examiner asks candidate to speak for 1–2 minutes on a particular topic based on written input in the form of a general instruction and content-focused prompts. Examiner asks one or two questions at the end of the long turn.
Part 3: Two-way discussion (4–5 minutes) Examiner invites candidate to participate in discussion of more abstract nature, based on verbal questions thematically linked to Part 2 prompt.
Figure 1: Interview structure
3.3 Analytic categories For each assessment category, the aim was to select or develop specific analyses which:
! addressed each of the individual scales and covered the main features referred to in each ! might be expected to show differences between performances scored at levels 5 to 8 ! could be applied reliably and meaningfully.
To address the first two criteria, three pieces of documentation were reviewed. 1. The band descriptors (UCLES, 2001) 2. The Speaking Test criteria key indicators, as described in the Examiner Training
Materials (UCLES, 2001) 3. The descriptions of the student samples contained in the Examiner Training Materials
(UCLES, 2001)
3. Candidate discourse in the revised IELTS Speaking Test – Annie Brown
© IELTS Research Reports Volume 6 6
In order to address the last criterion, the literature on the analysis of learner discourse was reviewed to see what it indicated about the usefulness of particular measures, particularly whether they had sound operational definitions, could be applied reliably, and had sound theoretical justifications. While the measures typically used to measure fluency and vocabulary seemed relatively straightforward, there appeared to be a wide range of measures used for the analysis of syntactic quality but little detailed guidance on how to segment the data or what levels of reliability might realistically be achieved. Phonology proved to be the most problematic; the only reference was that of Brown et al (2005) who analysed the phonological quality of candidate performance in tape-based monologic tasks. However, not only did the phonological analyses used in that study consist of subjective evaluative judgements rather than (relatively) objective measures, but they required the use of specific phonetic software and the involvement of trained phoneticians. Ultimately, it was decided that such analyses were beyond the scope of the present study.
Sections 3.3.1 to 3.3.3 describe the analyses selected for the present study.
3.3.1 Fluency and coherence Key Fluency and coherence features as described within the IELTS documentation include:
! repetition and self-correction ! hesitation / speech rate ! the use of discourse markers, connectives and cohesive features ! the coherence of topic development ! response length.
Following a review of the literature to ascertain how these aspects of fluency and coherence might be operationalised as measures, the following analyses were adopted.
Firstly, repair was measured in terms of the frequency of self-corrections (restarts and repeats) per 100 words. It was calculated over the Part 2 and Part 3 long responses (not including single word answers or repair turns). Secondly, hesitation was measured in terms of the ratio of pausing (filled and unfilled pauses) to speech (measures in terms of milliseconds). For this analysis the data were entered into the Cool Edit Pro program (Version 2.1, 2001). Hesitation was also measured in terms of the number of pauses (filled, unfilled and filled/unfilled). Both of these measures were carried out using speech produced in response to Part Two, the monologue turn. Thirdly, speech rate was calculated in terms of the number of words per minute. This was also calculated over Part 2, and the analysis was carried out after the data were cleaned (pruned of repairs, repeats, false starts and filled pauses).
Because the interview is divided into three parts, each of which takes a distinct form, response length was measured in a number of ways, as follows.
1. Average length of response in Part 1. Single word answers and repair turns were excluded. The analysis was carried out after the data were cleaned (pruned of repairs, repeats, false starts and filled pauses).
2. Number of words in Part 2. The analysis was also carried out after the data were cleaned.
3. Average length of response in Part 2 follow-up questions (if presented) and Part 3. Single word answers and repair turns were excluded. Again, the analysis was carried out after the data were cleaned.
4. Average length of response in Part 1, Part 2 (follow-up question only) and Part 3 combined (all the question-answer sections).
3. Candidate discourse in the revised IELTS Speaking Test – Annie Brown
© IELTS Research Reports Volume 6 7
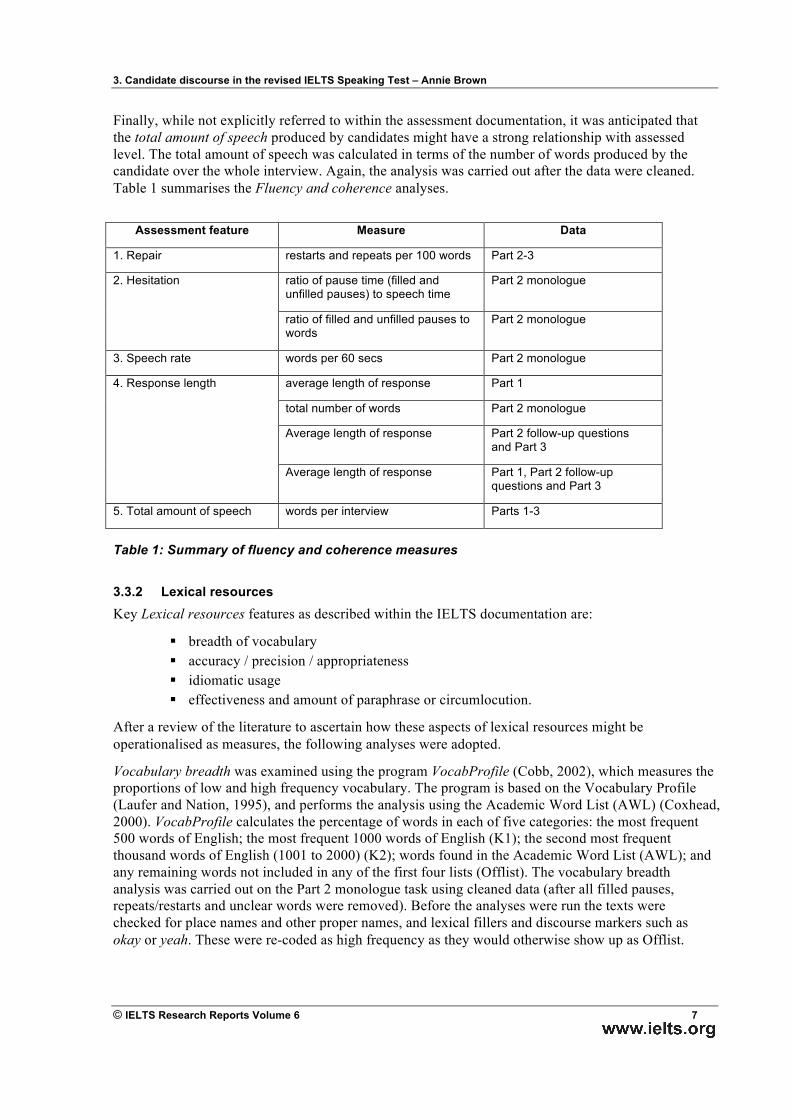
Finally, while not explicitly referred to within the assessment documentation, it was anticipated that the total amount of speech produced by candidates might have a strong relationship with assessed level. The total amount of speech was calculated in terms of the number of words produced by the candidate over the whole interview. Again, the analysis was carried out after the data were cleaned. Table 1 summarises the Fluency and coherence analyses.
Assessment feature Measure Data
1. Repair restarts and repeats per 100 words Part 2-3
2. Hesitation ratio of pause time (filled and unfilled pauses) to speech time
Part 2 monologue
ratio of filled and unfilled pauses to words
Part 2 monologue
3. Speech rate words per 60 secs Part 2 monologue
4. Response length average length of response Part 1
total number of words Part 2 monologue
Average length of response Part 2 follow-up questions and Part 3
Average length of response Part 1, Part 2 follow-up questions and Part 3
5. Total amount of speech words per interview Parts 1-3
Table 1: Summary of fluency and coherence measures
3.3.2 Lexical resources Key Lexical resources features as described within the IELTS documentation are:
! breadth of vocabulary ! accuracy / precision / appropriateness ! idiomatic usage ! effectiveness and amount of paraphrase or circumlocution.
After a review of the literature to ascertain how these aspects of lexical resources might be operationalised as measures, the following analyses were adopted.
Vocabulary breadth was examined using the program VocabProfile (Cobb, 2002), which measures the proportions of low and high frequency vocabulary. The program is based on the Vocabulary Profile (Laufer and Nation, 1995), and performs the analysis using the Academic Word List (AWL) (Coxhead, 2000). VocabProfile calculates the percentage of words in each of five categories: the most frequent 500 words of English; the most frequent 1000 words of English (K1); the second most frequent thousand words of English (1001 to 2000) (K2); words found in the Academic Word List (AWL); and any remaining words not included in any of the first four lists (Offlist). The vocabulary breadth analysis was carried out on the Part 2 monologue task using cleaned data (after all filled pauses, repeats/restarts and unclear words were removed). Before the analyses were run the texts were checked for place names and other proper names, and lexical fillers and discourse markers such as okay or yeah. These were re-coded as high frequency as they would otherwise show up as Offlist.
3. Candidate discourse in the revised IELTS Speaking Test – Annie Brown
© IELTS Research Reports Volume 6 8
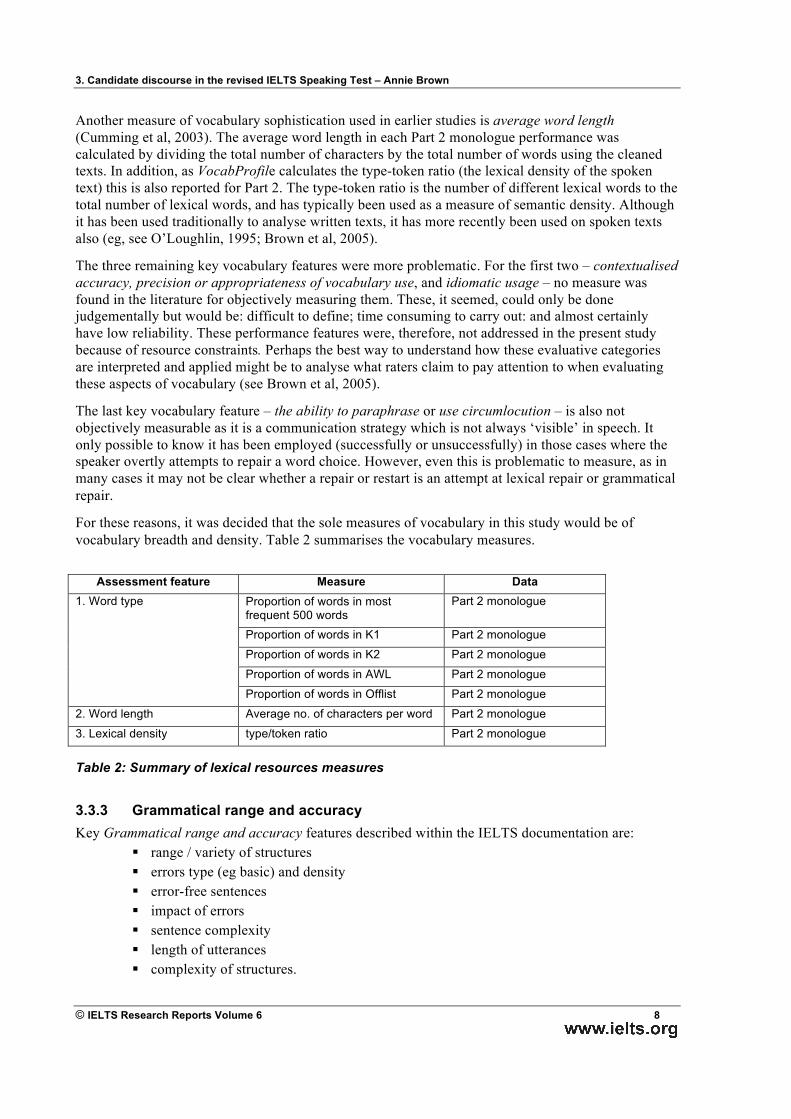
Another measure of vocabulary sophistication used in earlier studies is average word length (Cumming et al, 2003). The average word length in each Part 2 monologue performance was calculated by dividing the total number of characters by the total number of words using the cleaned texts. In addition, as VocabProfile calculates the type-token ratio (the lexical density of the spoken text) this is also reported for Part 2. The type-token ratio is the number of different lexical words to the total number of lexical words, and has typically been used as a measure of semantic density. Although it has been used traditionally to analyse written texts, it has more recently been used on spoken texts also (eg, see O’Loughlin, 1995; Brown et al, 2005).
The three remaining key vocabulary features were more problematic. For the first two – contextualised accuracy, precision or appropriateness of vocabulary use, and idiomatic usage – no measure was found in the literature for objectively measuring them. These, it seemed, could only be done judgementally but would be: difficult to define; time consuming to carry out: and almost certainly have low reliability. These performance features were, therefore, not addressed in the present study because of resource constraints. Perhaps the best way to understand how these evaluative categories are interpreted and applied might be to analyse what raters claim to pay attention to when evaluating these aspects of vocabulary (see Brown et al, 2005).
The last key vocabulary feature – the ability to paraphrase or use circumlocution – is also not objectively measurable as it is a communication strategy which is not always ‘visible’ in speech. It only possible to know it has been employed (successfully or unsuccessfully) in those cases where the speaker overtly attempts to repair a word choice. However, even this is problematic to measure, as in many cases it may not be clear whether a repair or restart is an attempt at lexical repair or grammatical repair.
For these reasons, it was decided that the sole measures of vocabulary in this study would be of vocabulary breadth and density. Table 2 summarises the vocabulary measures.
Assessment feature Measure Data 1. Word type Proportion of words in most
frequent 500 words Part 2 monologue
Proportion of words in K1 Part 2 monologue
Proportion of words in K2 Part 2 monologue
Proportion of words in AWL Part 2 monologue
Proportion of words in Offlist Part 2 monologue
2. Word length Average no. of characters per word Part 2 monologue
3. Lexical density type/token ratio Part 2 monologue
Table 2: Summary of lexical resources measures
3.3.3 Grammatical range and accuracy Key Grammatical range and accuracy features described within the IELTS documentation are:
! range / variety of structures ! errors type (eg basic) and density ! error-free sentences ! impact of errors ! sentence complexity ! length of utterances ! complexity of structures.
3. Candidate discourse in the revised IELTS Speaking Test – Annie Brown
© IELTS Research Reports Volume 6 9
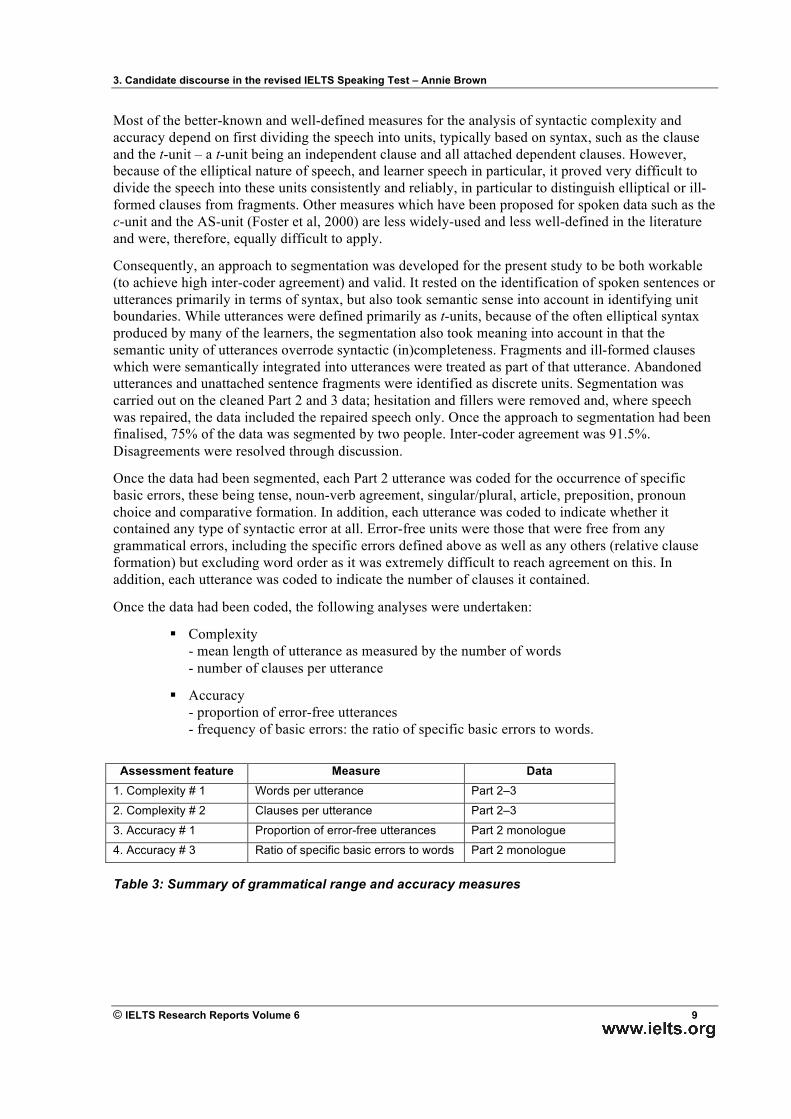
Most of the better-known and well-defined measures for the analysis of syntactic complexity and accuracy depend on first dividing the speech into units, typically based on syntax, such as the clause and the t-unit – a t-unit being an independent clause and all attached dependent clauses. However, because of the elliptical nature of speech, and learner speech in particular, it proved very difficult to divide the speech into these units consistently and reliably, in particular to distinguish elliptical or ill-formed clauses from fragments. Other measures which have been proposed for spoken data such as the c-unit and the AS-unit (Foster et al, 2000) are less widely-used and less well-defined in the literature and were, therefore, equally difficult to apply.
Consequently, an approach to segmentation was developed for the present study to be both workable (to achieve high inter-coder agreement) and valid. It rested on the identification of spoken sentences or utterances primarily in terms of syntax, but also took semantic sense into account in identifying unit boundaries. While utterances were defined primarily as t-units, because of the often elliptical syntax produced by many of the learners, the segmentation also took meaning into account in that the semantic unity of utterances overrode syntactic (in)completeness. Fragments and ill-formed clauses which were semantically integrated into utterances were treated as part of that utterance. Abandoned utterances and unattached sentence fragments were identified as discrete units. Segmentation was carried out on the cleaned Part 2 and 3 data; hesitation and fillers were removed and, where speech was repaired, the data included the repaired speech only. Once the approach to segmentation had been finalised, 75% of the data was segmented by two people. Inter-coder agreement was 91.5%. Disagreements were resolved through discussion.
Once the data had been segmented, each Part 2 utterance was coded for the occurrence of specific basic errors, these being tense, noun-verb agreement, singular/plural, article, preposition, pronoun choice and comparative formation. In addition, each utterance was coded to indicate whether it contained any type of syntactic error at all. Error-free units were those that were free from any grammatical errors, including the specific errors defined above as well as any others (relative clause formation) but excluding word order as it was extremely difficult to reach agreement on this. In addition, each utterance was coded to indicate the number of clauses it contained.
Once the data had been coded, the following analyses were undertaken:
! Complexity - mean length of utterance as measured by the number of words - number of clauses per utterance
! Accuracy - proportion of error-free utterances - frequency of basic errors: the ratio of specific basic errors to words.
Assessment feature Measure Data 1. Complexity # 1 Words per utterance Part 2–3
2. Complexity # 2 Clauses per utterance Part 2–3
3. Accuracy # 1 Proportion of error-free utterances Part 2 monologue
4. Accuracy # 3 Ratio of specific basic errors to words Part 2 monologue
Table 3: Summary of grammatical range and accuracy measures
3. Candidate discourse in the revised IELTS Speaking Test – Annie Brown
© IELTS Research Reports Volume 6 10
4 RESULTS
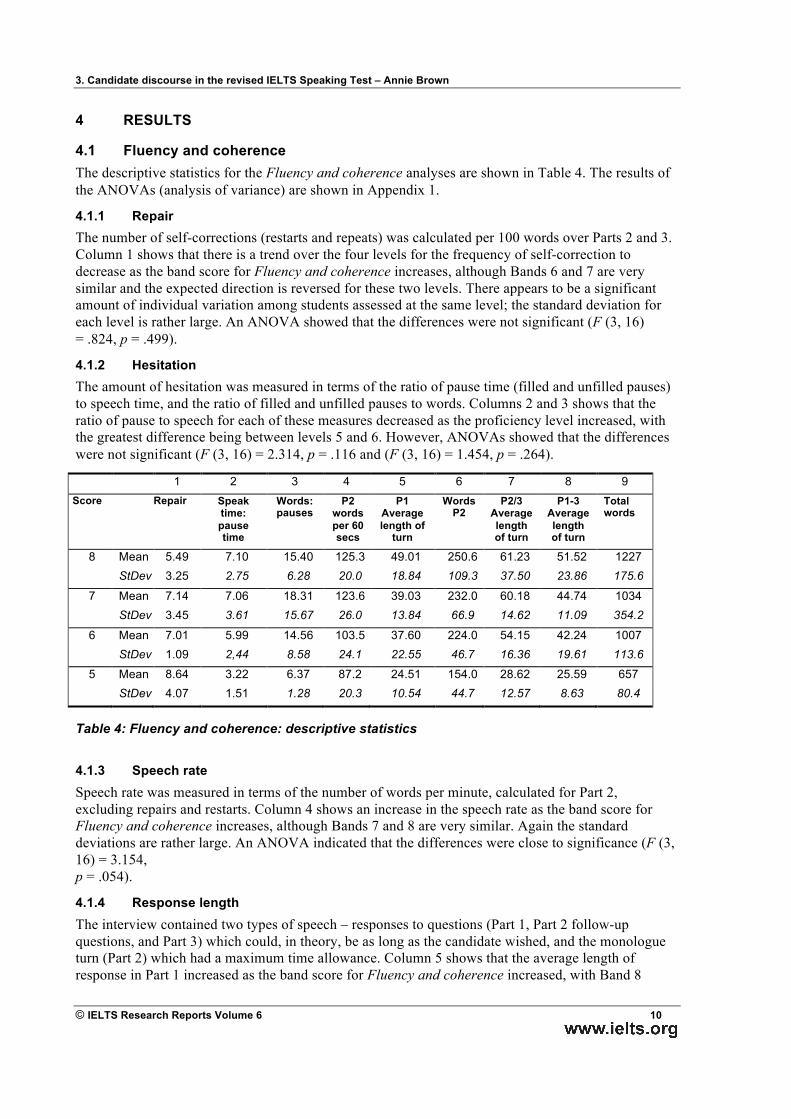
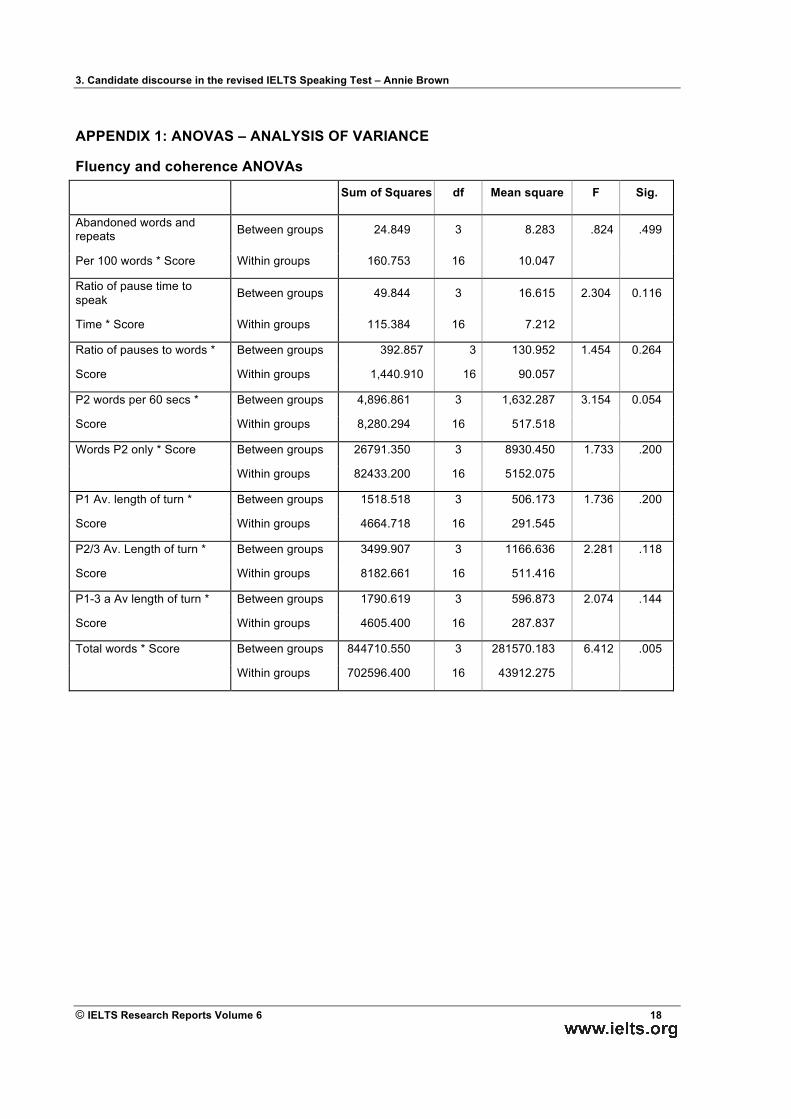
4.1 Fluency and coherence The descriptive statistics for the Fluency and coherence analyses are shown in Table 4. The results of the ANOVAs (analysis of variance) are shown in Appendix 1.
4.1.1 Repair The number of self-corrections (restarts and repeats) was calculated per 100 words over Parts 2 and 3. Column 1 shows that there is a trend over the four levels for the frequency of self-correction to decrease as the band score for Fluency and coherence increases, although Bands 6 and 7 are very similar and the expected direction is reversed for these two levels. There appears to be a significant amount of individual variation among students assessed at the same level; the standard deviation for each level is rather large. An ANOVA showed that the differences were not significant (F (3, 16) = .824, p = .499).
4.1.2 Hesitation The amount of hesitation was measured in terms of the ratio of pause time (filled and unfilled pauses) to speech time, and the ratio of filled and unfilled pauses to words. Columns 2 and 3 shows that the ratio of pause to speech for each of these measures decreased as the proficiency level increased, with the greatest difference being between levels 5 and 6. However, ANOVAs showed that the differences were not significant (F (3, 16) = 2.314, p = .116 and (F (3, 16) = 1.454, p = .264).
1 2 3 4 5 6 7 8 9 Score Repair Speak
time: pause time
Words: pauses
P2 words per 60 secs
P1 Average length of
turn
Words P2
P2/3 Average length of turn
P1-3 Average length of turn
Total words
8 Mean 5.49 7.10 15.40 125.3 49.01 250.6 61.23 51.52 1227 StDev 3.25 2.75 6.28 20.0 18.84 109.3 37.50 23.86 175.6
7 Mean 7.14 7.06 18.31 123.6 39.03 232.0 60.18 44.74 1034 StDev 3.45 3.61 15.67 26.0 13.84 66.9 14.62 11.09 354.2
6 Mean 7.01 5.99 14.56 103.5 37.60 224.0 54.15 42.24 1007 StDev 1.09 2,44 8.58 24.1 22.55 46.7 16.36 19.61 113.6
5 Mean 8.64 3.22 6.37 87.2 24.51 154.0 28.62 25.59 657 StDev 4.07 1.51 1.28 20.3 10.54 44.7 12.57 8.63 80.4
Table 4: Fluency and coherence: descriptive statistics
4.1.3 Speech rate Speech rate was measured in terms of the number of words per minute, calculated for Part 2, excluding repairs and restarts. Column 4 shows an increase in the speech rate as the band score for Fluency and coherence increases, although Bands 7 and 8 are very similar. Again the standard deviations are rather large. An ANOVA indicated that the differences were close to significance (F (3, 16) = 3.154, p = .054).
4.1.4 Response length The interview contained two types of speech – responses to questions (Part 1, Part 2 follow-up questions, and Part 3) which could, in theory, be as long as the candidate wished, and the monologue turn (Part 2) which had a maximum time allowance. Column 5 shows that the average length of response in Part 1 increased as the band score for Fluency and coherence increased, with Band 8
3. Candidate discourse in the revised IELTS Speaking Test – Annie Brown
© IELTS Research Reports Volume 6 11
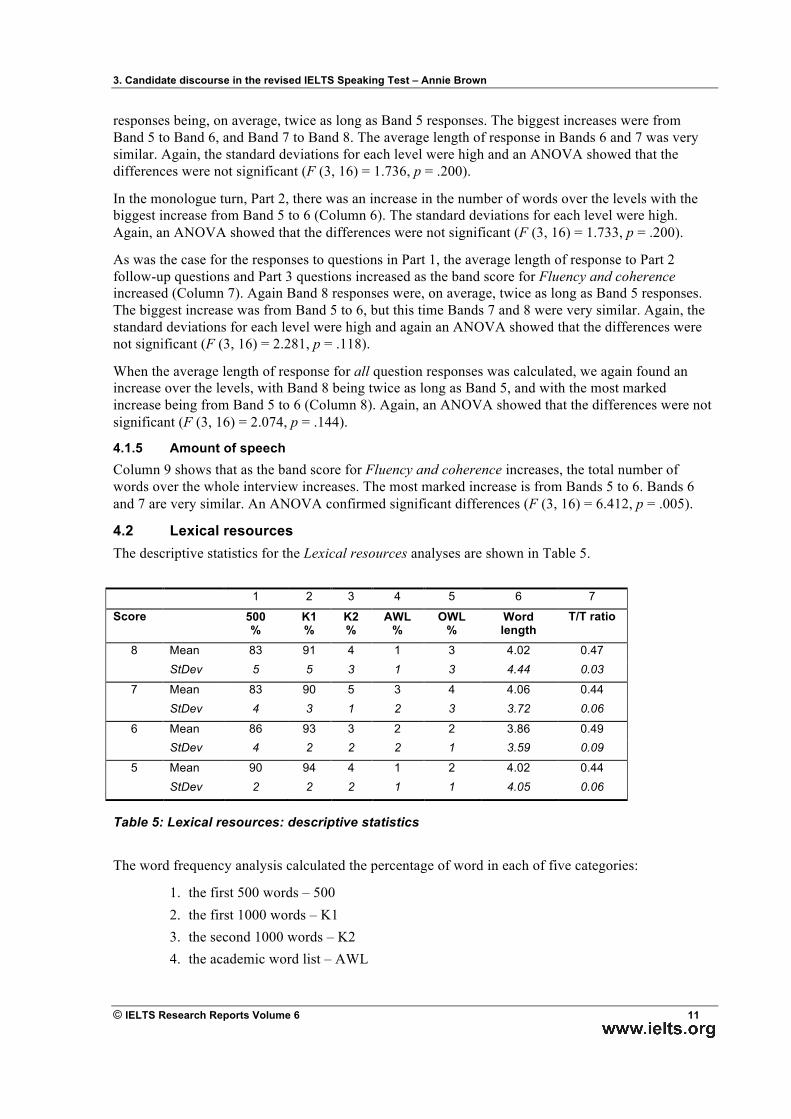
responses being, on average, twice as long as Band 5 responses. The biggest increases were from Band 5 to Band 6, and Band 7 to Band 8. The average length of response in Bands 6 and 7 was very similar. Again, the standard deviations for each level were high and an ANOVA showed that the differences were not significant (F (3, 16) = 1.736, p = .200).
In the monologue turn, Part 2, there was an increase in the number of words over the levels with the biggest increase from Band 5 to 6 (Column 6). The standard deviations for each level were high. Again, an ANOVA showed that the differences were not significant (F (3, 16) = 1.733, p = .200).
As was the case for the responses to questions in Part 1, the average length of response to Part 2 follow-up questions and Part 3 questions increased as the band score for Fluency and coherence increased (Column 7). Again Band 8 responses were, on average, twice as long as Band 5 responses. The biggest increase was from Band 5 to 6, but this time Bands 7 and 8 were very similar. Again, the standard deviations for each level were high and again an ANOVA showed that the differences were not significant (F (3, 16) = 2.281, p = .118).
When the average length of response for all question responses was calculated, we again found an increase over the levels, with Band 8 being twice as long as Band 5, and with the most marked increase being from Band 5 to 6 (Column 8). Again, an ANOVA showed that the differences were not significant (F (3, 16) = 2.074, p = .144).
4.1.5 Amount of speech Column 9 shows that as the band score for Fluency and coherence increases, the total number of words over the whole interview increases. The most marked increase is from Bands 5 to 6. Bands 6 and 7 are very similar. An ANOVA confirmed significant differences (F (3, 16) = 6.412, p = .005).
4.2 Lexical resources The descriptive statistics for the Lexical resources analyses are shown in Table 5.
1 2 3 4 5 6 7
Score 500 %
K1 %
K2 %
AWL %
OWL %
Word length
T/T ratio
8 Mean 83 91 4 1 3 4.02 0.47 StDev 5 5 3 1 3 4.44 0.03
7 Mean 83 90 5 3 4 4.06 0.44 StDev 4 3 1 2 3 3.72 0.06
6 Mean 86 93 3 2 2 3.86 0.49 StDev 4 2 2 2 1 3.59 0.09
5 Mean 90 94 4 1 2 4.02 0.44 StDev 2 2 2 1 1 4.05 0.06
Table 5: Lexical resources: descriptive statistics
The word frequency analysis calculated the percentage of word in each of five categories:
1. the first 500 words – 500 2. the first 1000 words – K1 3. the second 1000 words – K2 4. the academic word list – AWL
3. Candidate discourse in the revised IELTS Speaking Test – Annie Brown
© IELTS Research Reports Volume 6 12
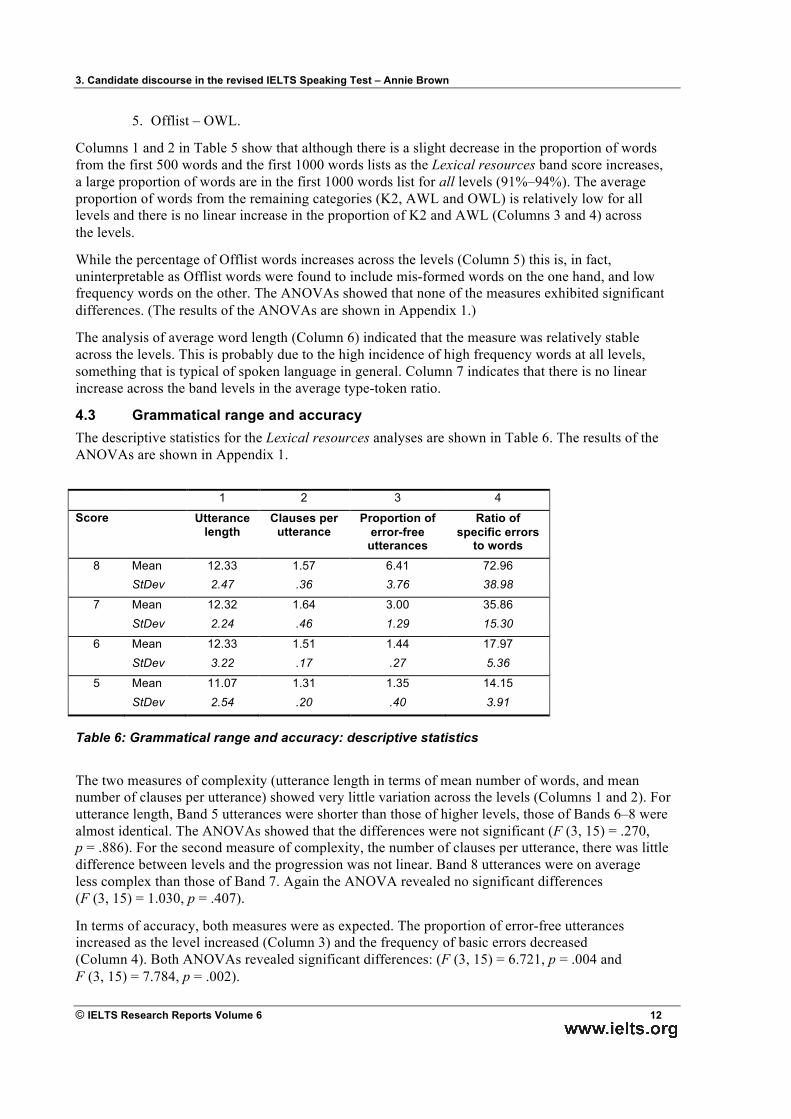
5. Offlist – OWL.
Columns 1 and 2 in Table 5 show that although there is a slight decrease in the proportion of words from the first 500 words and the first 1000 words lists as the Lexical resources band score increases, a large proportion of words are in the first 1000 words list for all levels (91%–94%). The average proportion of words from the remaining categories (K2, AWL and OWL) is relatively low for all levels and there is no linear increase in the proportion of K2 and AWL (Columns 3 and 4) across the levels.
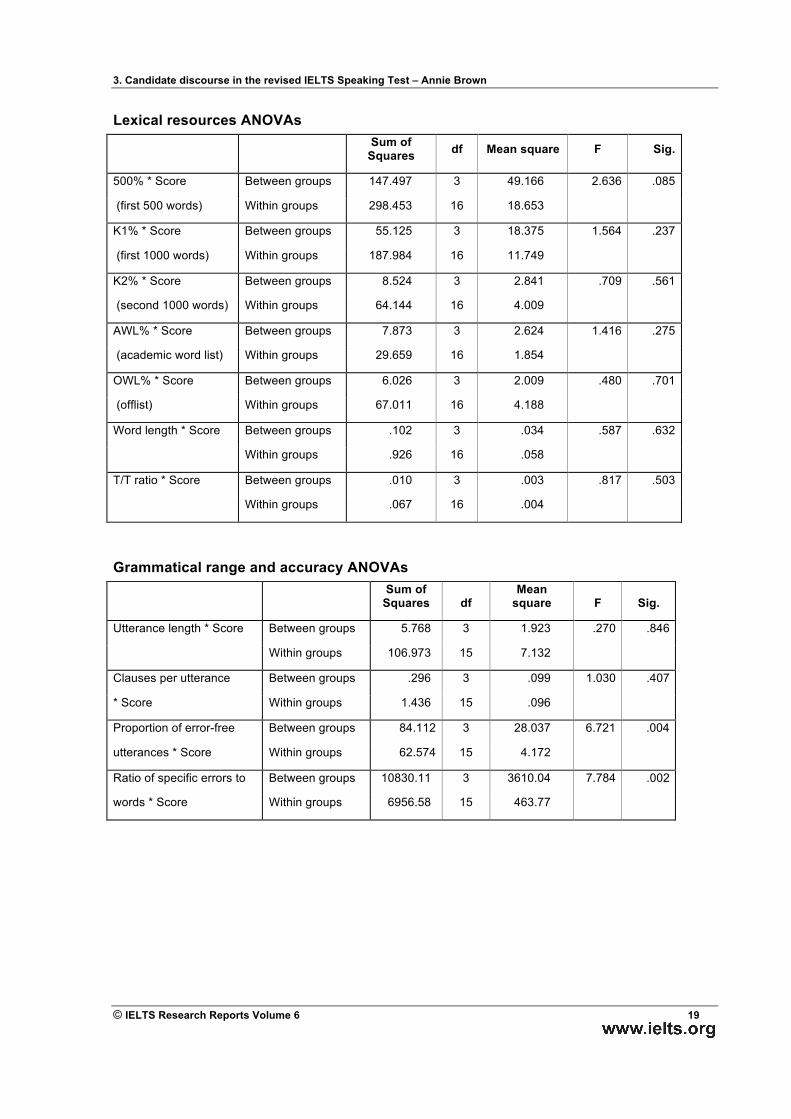
While the percentage of Offlist words increases across the levels (Column 5) this is, in fact, uninterpretable as Offlist words were found to include mis-formed words on the one hand, and low frequency words on the other. The ANOVAs showed that none of the measures exhibited significant differences. (The results of the ANOVAs are shown in Appendix 1.)
The analysis of average word length (Column 6) indicated that the measure was relatively stable across the levels. This is probably due to the high incidence of high frequency words at all levels, something that is typical of spoken language in general. Column 7 indicates that there is no linear increase across the band levels in the average type-token ratio.
4.3 Grammatical range and accuracy The descriptive statistics for the Lexical resources analyses are shown in Table 6. The results of the ANOVAs are shown in Appendix 1.
1 2 3 4
Score Utterance length
Clauses per utterance
Proportion of error-free
utterances
Ratio of specific errors
to words 8 Mean 12.33 1.57 6.41 72.96 StDev 2.47 .36 3.76 38.98
7 Mean 12.32 1.64 3.00 35.86 StDev 2.24 .46 1.29 15.30
6 Mean 12.33 1.51 1.44 17.97 StDev 3.22 .17 .27 5.36
5 Mean 11.07 1.31 1.35 14.15 StDev 2.54 .20 .40 3.91
Table 6: Grammatical range and accuracy: descriptive statistics
The two measures of complexity (utterance length in terms of mean number of words, and mean number of clauses per utterance) showed very little variation across the levels (Columns 1 and 2). For utterance length, Band 5 utterances were shorter than those of higher levels, those of Bands 6–8 were almost identical. The ANOVAs showed that the differences were not significant (F (3, 15) = .270, p = .886). For the second measure of complexity, the number of clauses per utterance, there was little difference between levels and the progression was not linear. Band 8 utterances were on average less complex than those of Band 7. Again the ANOVA revealed no significant differences (F (3, 15) = 1.030, p = .407).
In terms of accuracy, both measures were as expected. The proportion of error-free utterances increased as the level increased (Column 3) and the frequency of basic errors decreased (Column 4). Both ANOVAs revealed significant differences: (F (3, 15) = 6.721, p = .004 and F (3, 15) = 7.784, p = .002).
3. Candidate discourse in the revised IELTS Speaking Test – Annie Brown
© IELTS Research Reports Volume 6 13
5 SUMMARY OF FINDINGS
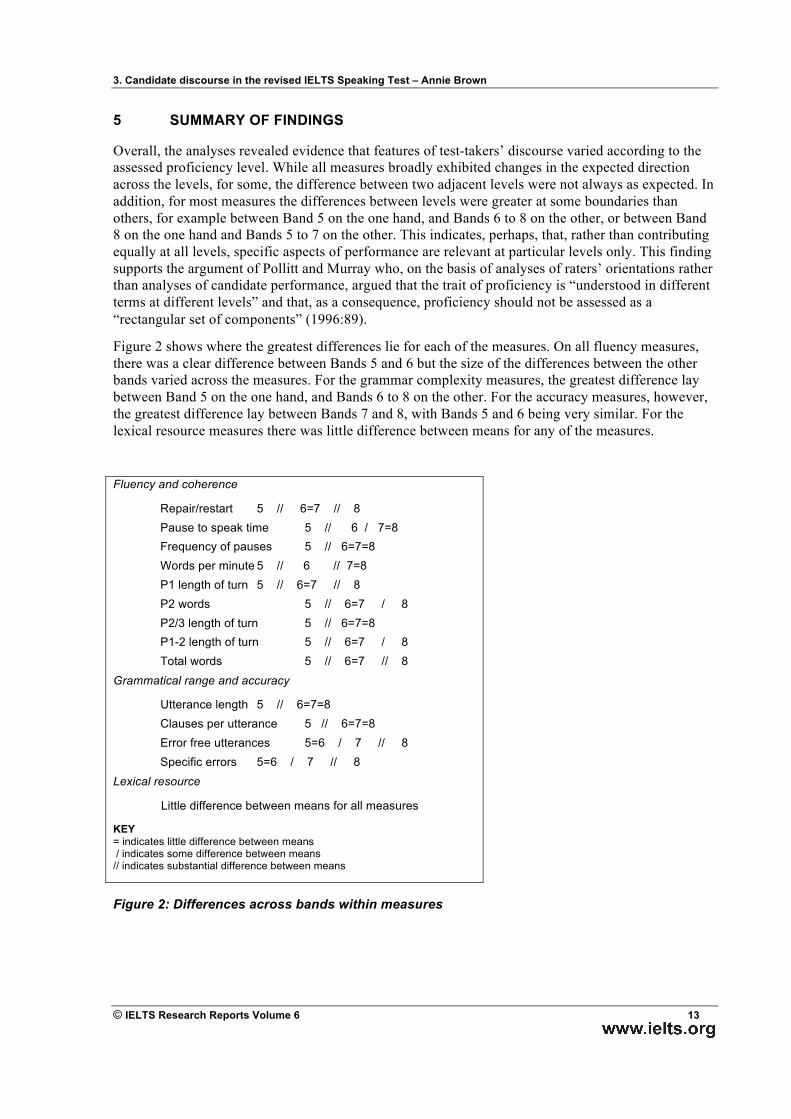
Overall, the analyses revealed evidence that features of test-takers’ discourse varied according to the assessed proficiency level. While all measures broadly exhibited changes in the expected direction across the levels, for some, the difference between two adjacent levels were not always as expected. In addition, for most measures the differences between levels were greater at some boundaries than others, for example between Band 5 on the one hand, and Bands 6 to 8 on the other, or between Band 8 on the one hand and Bands 5 to 7 on the other. This indicates, perhaps, that, rather than contributing equally at all levels, specific aspects of performance are relevant at particular levels only. This finding supports the argument of Pollitt and Murray who, on the basis of analyses of raters’ orientations rather than analyses of candidate performance, argued that the trait of proficiency is “understood in different terms at different levels” and that, as a consequence, proficiency should not be assessed as a “rectangular set of components” (1996:89).
Figure 2 shows where the greatest differences lie for each of the measures. On all fluency measures, there was a clear difference between Bands 5 and 6 but the size of the differences between the other bands varied across the measures. For the grammar complexity measures, the greatest difference lay between Band 5 on the one hand, and Bands 6 to 8 on the other. For the accuracy measures, however, the greatest difference lay between Bands 7 and 8, with Bands 5 and 6 being very similar. For the lexical resource measures there was little difference between means for any of the measures.
Fluency and coherence
Repair/restart 5 // 6=7 // 8 Pause to speak time 5 // 6 / 7=8 Frequency of pauses 5 // 6=7=8 Words per minute 5 // 6 // 7=8 P1 length of turn 5 // 6=7 // 8 P2 words 5 // 6=7 / 8 P2/3 length of turn 5 // 6=7=8 P1-2 length of turn 5 // 6=7 / 8 Total words 5 // 6=7 // 8
Grammatical range and accuracy
Utterance length 5 // 6=7=8 Clauses per utterance 5 // 6=7=8 Error free utterances 5=6 / 7 // 8 Specific errors 5=6 / 7 // 8
Lexical resource
Little difference between means for all measures
KEY = indicates little difference between means / indicates some difference between means // indicates substantial difference between means
Figure 2: Differences across bands within measures
3. Candidate discourse in the revised IELTS Speaking Test – Annie Brown
© IELTS Research Reports Volume 6 14
For all measures the standard deviations tended to be large, relative to the differences between levels, indicating a high level of variation amongst candidates assessed at the same level and a high degree of overlap between levels, even for those measures which produced significant findings. This would appear to indicate that while all the measures contribute in some way, none is an overriding driver of the rating awarded; candidates assessed at one particular level on one scale display subtle differences in performance on the different dimensions of that trait. This is perhaps inevitable where different and potentially conflicting features (such as accuracy and complexity) are combined into the one scale. Brown et al (2005) acknowledge this possibility when they discuss the tension, referred to by raters, between dimensions on all traits – grammar, vocabulary, fluency and pronunciation – such as accuracy (or nativeness), complexity (or sophistication) and impact. This tension is also acknowledged in the IELTS band scales themselves, with the following statement about grammar: “Complex structures are attempted but these are limited in range, nearly always contain errors and may lead to the need for reformulation”. Impact, of course, is listener-related and is therefore not something that can be measured objectively, unlike the other measures addressed in this study.
The findings are very interesting for a number of reasons. First, they reveal that, for each assessment category, a range of performance features appear to contribute to the overall impression of the candidate. In terms of the relatively low number of measures which revealed significant differences amongst the levels, this may be attributed to the relatively few samples at each level which resulted in large measurement error.
While a number of the measures approached significance, the only one to exhibit significant differences across levels was the total amount of speech. This is in many ways surprising, because amount of speech is not specifically referred to in the scales. In addition, it is not closely related to the length of response measures, which showed trends in the expected direction but were not significant. It may be, then, that interviewers close down or otherwise cut short the phases of the interview if they feel that candidates are struggling, which would explain the significance of this finding. It may also be that while the extended responses produced by weaker candidates were not substantially shorter than those of stronger candidates, weaker candidates produced many more single-word responses and clarification requests which resulted in the interviewer dominating the talk more.
Second, the conduct of the analysis and review of the results allow us to draw conclusions about the methodology used in the study. Not all of the measures proved to be useful. For example, the relatively high proportion of high frequency vocabulary in all performances meant that the lexical frequency measures proved to be unhelpful in distinguishing the levels. It would appear that a more fine-grained analysis is required here, something that lay outside the scope of the present study. In addition, for some aspects of performance it was not possible to find previously-used valid and reliable measures – for example, to measure syntactic sophistication. Brown et al (2005), who tried to address this dimension through the identification of specific structures such as passives and conditionals, found so few examples in the spoken texts that the measure failed to reveal differences amongst levels. It may be that raters’ impressions about sophistication are driven by one or two particularly salient syntactic (or lexical) features in any one candidate’s performance, but that these differ for different candidates. In short, it may prove to be impossible to get at some of the key drivers of assessments through quantification of discourse features.
Other measures appear to be somewhat ambiguous. For example, self-repair might, on the one hand, be taken as evidence of monitoring strategies and therefore a positive feature of performance. On the other, it might draw attention to the fact that errors had been made or be viewed as affecting the fluency of the candidate’s speech, both of which might lead it to be evaluated negatively. Given this, this feature on its own is unlikely to have a strong relationship with assessed levels of proficiency.
3. Candidate discourse in the revised IELTS Speaking Test – Annie Brown
© IELTS Research Reports Volume 6 15
Despite the problems outlined above and while there were some limitations to the study in terms of size, scope, and choice of analyses, in general the results of this study are encouraging for the validity of the IELTS band descriptors. The overall tendency for most of the measures to display increases in the expected direction over the levels appears to confirm the relevance of the criteria they address to the assessment of proficiency in the IELTS interview.
3. Candidate discourse in the revised IELTS Speaking Test – Annie Brown
© IELTS Research Reports Volume 6 16
REFERENCES
Brown, A, Iwashita, N and McNamara, T, 2005, An Examination of Rater Orientations and Test-Taker Performance on English-for-Academic-Purposes Speaking Tasks, TOEFL Monograph series, MS-29, Educational Testing Service, Princeton, NJ
Cobb, T, 2002, The Web Vocabulary Profiler, ver 1.0, computer program, University of Québec, Montréal, retrieved from <http://www.er.uqam.ca/nobel/r21270/textools/web_vp.html>
Coxhead, A, 2000, ‘A new academic word list’, TESOL Quarterly, vol 34, no 2, pp 213-238
Cumming, A, Kantor, R, Baba, K, Eouanzaoui, E, Erdosy, U and James, M, 2003, ‘Analysis of discourse features and verification of scoring levels for independent and integrated prototype written tasks for New TOEFL’, draft project report, Educational Testing Service, Princeton, New Jersey
Douglas, D, 1994, ‘Quantity and quality in speaking test performance’, Language Testing, vol 11, no 2, pp 125-144
Douglas, D, and Selinker, L, 1992, ‘Analysing oral proficiency test performance in general and specific-purpose contexts’, System, vol 20, no 3, pp 17-328
Douglas, D, and Selinker, L, 1993, ‘Performance on a general versus a field-specific test of speaking proficiency by international teaching assistants’ in A new decade of language testing research, eds D Douglas and C Chapelle, TESOL Publications, Alexandria, VA, pp 235-256
English Language Institute, 2001, Examination for the Certificate of Competency in English, Ann Arbour, English Language Institute, University of Michigan
Foster and Skehan, 1996, ‘The influence of planning on performance in task-based learning’, Studies in Second Language Acquisition, vol 18, no 3, pp 299-324
Foster, P, Tonkyn, A and Wigglesworth G, 2000, ‘A unit for all measures: Analysing spoken discourse’, Applied Linguistics, vol 21, no 3, pp 354-375
Fulcher, G, 1993, ‘The construction and validation of rating scales for oral tests in English as a foreign language’, unpublished doctoral dissertation, University of Lancaster, UK
Fulcher, G, 1996, ‘Does thick description lead to smart tests? A data-based approach to rating scale construction’, Language Testing, vol 13, no 2, pp 208-238
Fulcher, G, 2003, Testing second language speaking, Pearson Education Limited, London
Iwashita, N and McNamara, T, 2003, ‘Task and interviewer factors in assessments of spoken interaction in a second language’, unpublished report, Language Testing Research Centre, The University of Melbourne
Iwashita, N, McNamara, T and Elder, C, 2001, ‘Can we predict task difficulty in an oral proficiency test? Exploring the potential of an information processing approach to task design’, Language Learning, vol 21, no 3, pp 401-436
Laufer, B, and Nation, P, 1995, ‘Vocabulary size and use: Lexical richness in L2 written production’, Applied Linguistics, vol 16, no 3, pp 307-322
Lewkowicz, J, 1997, ‘The integrated testing of a second language’ in Encyclopedia of Language and Education, Vol 7: Language Testing and Assessment, eds C Clapham and D Corson, Kluwer, Dortrecht, The Netherlands, pp 121-130
3. Candidate discourse in the revised IELTS Speaking Test – Annie Brown
© IELTS Research Reports Volume 6 17
Mangan, SS, 1988, ‘Grammar and the ACTFL oral proficiency interview: discussion and data’, Modern Language Journal vol 72, pp 266-76
O’Loughlin, K, 1995, ‘Lexical density in candidate output on direct and semi-direct versions of an oral proficiency test’, Language Testing, vol 12, no 2, pp 217-237
Paltridge, B, 2000, Making sense of discourse analysis, Antipodean Educational Enterprises, Gold Coast, Queensland
Pollitt and Murray, 1996, ‘What raters really pay attention to’ in Performance testing, cognition and assessment, (Studies in language testing 3), eds M. Milanovic and N. Saville, Cambridge University Press, Cambridge, pp 74-91
Schiffrin, D, 1987, Discourse markers, Cambridge University Press, Cambridge
Skehan, P, and Foster, P, 1999, ‘The influence of task structure and processing conditions on narrative retellings’, Language Learning, vol 49, pp 93-120
Skehan, P, 1998, A cognitive approach to language learning, Oxford University Press, Oxford
Syntrillium Software Corporation, 2001, Cool Edit Pro, ver 2.1, computer program, Phoenix, Arizona
UCLES, 2001, IELTS Examiner Training Materials, University of Cambridge Local Examinations Syndicate, Cambridge
Wigglesworth, G, 1997, ‘An investigation of planning time and proficiency level on oral test discourse’, Language Testing, vol 14, pp 85-106
Wigglesworth, G, 2001, ‘Influences on performance in task-based oral assessments’ in Task based learning, eds M Bygate, P Skehan, and M Swain, Addison Wesley Longman, pp 186-209
3. Candidate discourse in the revised IELTS Speaking Test – Annie Brown
© IELTS Research Reports Volume 6 18
APPENDIX 1: ANOVAS – ANALYSIS OF VARIANCE
Fluency and coherence ANOVAs Sum of Squares df Mean square F Sig.
Abandoned words and repeats Between groups 24.849 3 8.283 .824 .499
Per 100 words * Score Within groups 160.753 16 10.047
Ratio of pause time to speak Between groups 49.844 3 16.615 2.304 0.116
Time * Score Within groups 115.384 16 7.212
Ratio of pauses to words * Between groups 392.857 3 130.952 1.454 0.264
Score Within groups 1,440.910 16 90.057
P2 words per 60 secs * Between groups 4,896.861 3 1,632.287 3.154 0.054
Score Within groups 8,280.294 16 517.518
Words P2 only * Score Between groups 26791.350 3 8930.450 1.733 .200
Within groups 82433.200 16 5152.075
P1 Av. length of turn * Between groups 1518.518 3 506.173 1.736 .200
Score Within groups 4664.718 16 291.545
P2/3 Av. Length of turn * Between groups 3499.907 3 1166.636 2.281 .118
Score Within groups 8182.661 16 511.416
P1-3 a Av length of turn * Between groups 1790.619 3 596.873 2.074 .144
Score Within groups 4605.400 16 287.837
Total words * Score Between groups 844710.550 3 281570.183 6.412 .005
Within groups 702596.400 16 43912.275
3. Candidate discourse in the revised IELTS Speaking Test – Annie Brown
© IELTS Research Reports Volume 6 19
Lexical resources ANOVAs
Sum of
Squares df Mean square F Sig.
500% * Score Between groups 147.497 3 49.166 2.636 .085
(first 500 words) Within groups 298.453 16 18.653
K1% * Score Between groups 55.125 3 18.375 1.564 .237
(first 1000 words) Within groups 187.984 16 11.749
K2% * Score Between groups 8.524 3 2.841 .709 .561
(second 1000 words) Within groups 64.144 16 4.009
AWL% * Score Between groups 7.873 3 2.624 1.416 .275
(academic word list) Within groups 29.659 16 1.854
OWL% * Score Between groups 6.026 3 2.009 .480 .701
(offlist) Within groups 67.011 16 4.188
Word length * Score Between groups .102 3 .034 .587 .632
Within groups .926 16 .058
T/T ratio * Score Between groups .010 3 .003 .817 .503
Within groups .067 16 .004
Grammatical range and accuracy ANOVAs
Sum of
Squares df Mean
square F Sig.
Utterance length * Score Between groups 5.768 3 1.923 .270 .846
Within groups 106.973 15 7.132
Clauses per utterance Between groups .296 3 .099 1.030 .407
* Score Within groups 1.436 15 .096
Proportion of error-free Between groups 84.112 3 28.037 6.721 .004
utterances * Score Within groups 62.574 15 4.172
Ratio of specific errors to Between groups 10830.11 3 3610.04 7.784 .002
words * Score Within groups 6956.58 15 463.77