Renewables Portfolio Standards: A Focus on Western States · 2019-12-19 · Environmental Energy...
28
Environmental Energy Technologies Division • Energy Analysis Department Renewables Portfolio Standards: A Focus on Western States Ryan H. Wiser Lawrence Berkeley National Laboratory [email protected] (510.486.5474) AWEA Wind Power Finance & Investment Workshop March 27, 2007 San Francisco, California
Transcript of Renewables Portfolio Standards: A Focus on Western States · 2019-12-19 · Environmental Energy...

Environmental Energy Technologies Division • Energy Analysis Department
Renewables Portfolio Standards: A Focus on Western States
Ryan H. WiserLawrence Berkeley National Laboratory
[email protected] (510.486.5474)
AWEA Wind Power Finance & Investment WorkshopMarch 27, 2007
San Francisco, California

Environmental Energy Technologies Division • Energy Analysis Department
Presentation Overview
1. Overview of State RPS
2. RPS Impact on Project Development
3. RPS Design and Design Pitfalls
4. Impact on Renewable Energy Contracting
5. Federal RPS Implications
6. Conclusions

Environmental Energy Technologies Division • Energy Analysis Department
What Is a Renewables Portfolio Standard?
Renewables Portfolio Standard (RPS):• A requirement on retail electric suppliers…• to supply a minimum percentage or amount
of their retail load…• with eligible sources of renewable energy.
Typically backed with penalties of some form
Often accompanied by a tradable renewable energy credit (REC) program, to facilitate compliance
Never designed the same in any two states

Environmental Energy Technologies Division • Energy Analysis Department
State RPS Activity Significant in Recent Years
CO(2007)
1983 •• • • • ••••••••1991 1994 1997 1998 1999 2000 2001 2002 2003 2004 2005 2006IA
IA MN(2002)
AZ NV(2001)
ME(2000)
MA(2003)
WI(2001)
PA (2001)
CT(2000)
TX(2002)
NJ(2001)
MN
AZ(2001)
NM(2002)
NV(2003)
NM(2006)
CA(2003)
CT(2004)
MN(2005)
RI(2007)
NY(2006)
MD(2006)
HI(2005)
NJ(2004)
NM(2006)PA
(2007)
MT(2008)
DE(2007)
DC(2007)
NV(2005)TX
(2007)
•1996NJ
(2006)WI
(2010)
AZ(2007)
CA(2007)
WA(2012)
2007•
HI(2010)
MN (2010)
Enactment (above timeline)
Major Revisions (below timeline)
( ) Year of First Requirement
WI(2000)
CT(2005)
CT(2006)
NM (2015)
Source: UCS; revised by Berkeley Lab

Environmental Energy Technologies Division • Energy Analysis Department
State RPS Policies: 21 States and D.C.
Additional renewable energy “goals” established in IL, IA, VT, and ME
WI: 10% by 2015
NV: 20% by 2015
TX: 5880 MW by 2015
PA: 8% by 2020NJ: 22.5% by 2021
CT: 10% by 2010
MA: 4% by 2009
ME: 30% by 2000
NM: 20% by 2020
CA: 20% by 2010
MN: 25-30% by 2020-25
IA: 105 aMWMD: 7.5% by 2019
RI: 16% by 2019
HI: 20% by 2020
AZ: 15% by 2025
NY: 24% by 2013
CO: 10% by 2015
MT: 15% by 2015
DE: 10% by 2019DC: 11% by 2022
WA: 15% by 2020
WI: 10% by 2015
NV: 20% by 2015
TX: 5880 MW by 2015
PA: 8% by 2020NJ: 22.5% by 2021
CT: 10% by 2010
MA: 4% by 2009
ME: 30% by 2000
NM: 20% by 2020
CA: 20% by 2010
MN: 25-30% by 2020-25
IA: 105 aMWMD: 7.5% by 2019
RI: 16% by 2019
HI: 20% by 2020
AZ: 15% by 2025
NY: 24% by 2013
CO: 20% by 2020
MT: 15% by 2015
DE: 10% by 2019DC: 11% by 2022
WA: 15% by 2020
Environmental Energy Technologies Division • Energy Analysis Department
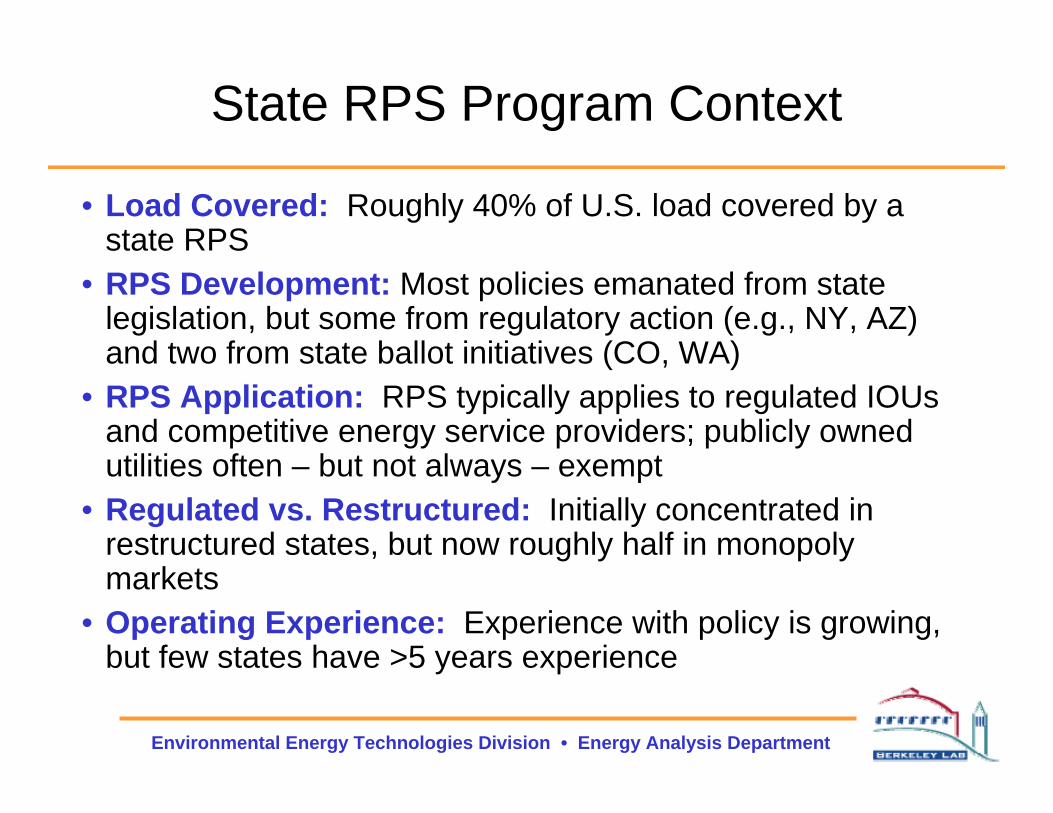
State RPS Program Context
• Load Covered: Roughly 40% of U.S. load covered by a state RPS
• RPS Development: Most policies emanated from state legislation, but some from regulatory action (e.g., NY, AZ) and two from state ballot initiatives (CO, WA)
• RPS Application: RPS typically applies to regulated IOUs and competitive energy service providers; publicly owned utilities often – but not always – exempt
• Regulated vs. Restructured: Initially concentrated in restructured states, but now roughly half in monopoly markets
• Operating Experience: Experience with policy is growing, but few states have >5 years experience

Environmental Energy Technologies Division • Energy Analysis Department
A Focus on Western States• Most Western states already covered
by an RPS
• Arizona, New Mexico, California and Hawaii recently increased the stringency of their standards
• Colorado and California considering further increasing their RPS standards
• Oregon considering RPS this legislative session
• Montana trying to “fix” inadequate cost cap language under their RPS
• WREGIS REC-tracking program expected to be operational in 2007
NV: 20% by 2015NV: 20% by 2015
NM: 20% by 2020
CA: 20% by 2010
HI: 20% by 2020
AZ: 15% by 2025
CO: 10% by 2015
MT: 15% by 2015
WA: 15% by 2020

Environmental Energy Technologies Division • Energy Analysis Department
Presentation Overview
1. Overview of State RPS
2. RPS Impact on Project Development
3. RPS Design and Design Pitfalls
4. Impact on Renewable Energy Contracting
5. Federal RPS Implications
6. Conclusions

Environmental Energy Technologies Division • Energy Analysis Department
Half of All Wind Project Development in the U.S. from 2001-2006 Was RPS-Related
0
1,000
2,000
3,000
4,000
5,000
6,000
7,000
8,000
9,000
10,000
2001 2002 2003 2004 2005 2006 2001-2006
Ann
ual U
S W
ind
Dev
elop
men
t (M
W)
Other (economical, green power, IRP, etc.) RPS-related Renewable Energy Fund-related
Half of all US wind power
capacity built from 2001-2006
was RPS-related

Environmental Energy Technologies Division • Energy Analysis Department
Recent Examples of Impact of RPS Policies on Wind Power Development in the West
• Wind contracting activity beginning• 90 MW NM project in 2006 contracted with APS
Arizona
• 41 MW installed in 2006, more on the wayHawaii
• 428 MW installed in 2006, in advance of RPSWashington
• 90 MW installed in 2006 (for AZ) • 140 MW installed in 2005
New Mexico
• 60 MW installed in 2006 • ~775 MW in pipeline/negotiations
Colorado
• 211 MW installed in 2006 • ~3,000 MW new wind under contract
California
• 135 MW installed in 2005, in advance of RPSMontana

Environmental Energy Technologies Division • Energy Analysis Department
Looking Ahead, Existing State RPS Policies Could be a Major Driver of New Renewables Capacity
Source: UCS
-
1,000
2,000
3,000
4,000
5,000
6,000
7,000
Californ
iaNew Je
rsey
Minneso
taTexa
sNew
Yor
k
Pennsy
lvania
Massac
huse
ttsW
ashingto
nW
iscons
inAriz
ona
Nevad
aNew
Mex
icoColo
rado
Montana
Rhode I
sland
Wash
ington
, D.C
.Dela
ware
Iowa
Conne
cticu
tHaw
aiiMaryl
andMaine
2020
New
Ren
ewab
les
Cap
acity
(MW
) UCS estimates ~45,000 MW of new RE capacity required by 2020 under existing state RPS policies, if all goes well14,200 MW of this capacity expected in Western region

Environmental Energy Technologies Division • Energy Analysis Department
New/Revised RPS Policies in the West May Add to These Totals
• California (33% by 2020)~ 7,500 MW above current RPS by 2020
• Colorado (20% by 2015)~ 900 MW above current RPS by 2015
• Oregon (25% by 2025)~ 2,600 MW by 2025
Source: Union of Concerned Scientists

Environmental Energy Technologies Division • Energy Analysis Department
Wind Expected to Fare Very Well, But May Not Always Be the Hands-Down Winner
Most RPS requirements have been met with wind so far, but increased competition in some states from geothermal (Nevada,
California), and solar thermal (California, Southwest) in particular
California’s RPSprocurements aregoverned by“Least Cost,Best Fit” criteria
...and...
Wind may not always provide the “Best Fit”(even if “Least Cost”)
New, Repowered, or Re-Started Capacity, by Technology (minimum MW, IOUs only)
solar thermal
899 MW
wind782 MW
PVc0 MW
geothermal266 MW
small hydro6 MW
biogas35 MW
biomass134 MW

Environmental Energy Technologies Division • Energy Analysis Department
Presentation Overview
1. Overview of State RPS
2. RPS Impact on Project Development
3. RPS Design and Design Pitfalls
4. Impact on Renewable Energy Contracting
5. Federal RPS Implications
6. Conclusions

Environmental Energy Technologies Division • Energy Analysis Department
The Most Important (and obvious) Lesson Learned to Date
Elegant, cost effective, flexible policy to meet RE
targets
Poorly designed, ineffective, or costly
way to meet RE targets
?
The legislative and regulatory design details matter!!!
An RPS Can Be A…

Environmental Energy Technologies Division • Energy Analysis Department
RPS Design Varies Substantially From One State to the Next
Product- or company-based applicationApplication to LSEs - Who must meet targets?Resource diversity requirements or incentives
Duration of purchase obligationStart date
Percentage purchase obligation targetsStructure (e.g., single tier or multiple tiers)
Basis (energy vs. capacity obligation)Structure, Size and Application
Treatment of off-grid and customer-sited facilitiesTreatment of multi-fuel facilities
Definition of new/incremental generationEligibility of existing renewable generation
Resource type eligibilityGeographic eligibility
Eligibility
Cost recovery for regulated LSEs
Contracting standards for regulated LSEs
Implementing future changes to the RPS
Flexibility mechanisms (banking, borrowing, etc.)Cost caps
Enforcement mechanisms
Compliance filing requirements
Certification of eligible generators
Compliance verification (TRCs or contract-path)
Regulatory oversight body(ies)
Administration

Environmental Energy Technologies Division • Energy Analysis Department
Variations in Design Are Driven By Different Goals, Market Circumstances, Political Influences
• Unfortunate result is uneven historical and expected market impacts of state RPS policies
• Some RPS policies seemingly working well… – Texas, Minnesota, New Mexico, others
• Other policies are under-performing so far…– Under-compliance in Arizona, Nevada, Massachusetts, and
California so far
– Other policies have largely supported or will support existing (not new) renewable generation (ME, MD, etc.)
• Many others are just getting underway, but there are reasons to be concerned

Environmental Energy Technologies Division • Energy Analysis Department
Design Pitfalls in the West
Lenient Geographic Boundaries/Eligibility Restrictions• Can enlarge the market for RECs, but may also moderate need for
new wind and reduce local benefits
Force Majeure Clauses and Cost Caps• Compliance flexibility should be encouraged, but new RPS policies
increasingly including a lot of “wiggle room” to possibly allow escape from full compliance (e.g., MT, HI)
Funding Caps• Where funding caps are in place, they may be insufficient to allow the
RPS to be achieved (AZ, CA)
Application to Publicly Owned Electric Utilities• Publicly owned utilities often exempt or provided more lenient
requirements (CA, NM, NV, CO, MT, etc.)

Environmental Energy Technologies Division • Energy Analysis Department
Design Pitfalls in the West (cont.)
Inadequate Enforcement• Where full compliance is apparently not being achieved (NV,
CA)...will penalties be used to enforce compliance?
Policy Instability• Uncertainty in RPS duration, target, or eligible technologies can
impede development (e.g., CA, others)
Transmission Bottlenecks• CA, NM, CO trying to be more proactive with transmission planning/
construction, but transmission remains a key barrier in many states
Design Complexity• Is the complexity inherent in the California RPS worth it?

Environmental Energy Technologies Division • Energy Analysis Department
Presentation Overview
1. Overview of State RPS
2. RPS Impact on Project Development
3. RPS Design and Design Pitfalls
4. Impact on Renewable Energy Contracting
5. Federal RPS Implications
6. Conclusions

Environmental Energy Technologies Division • Energy Analysis Department
RPS-Driven REC Markets Are Not Particularly Relevant in the West, Because...
$0
$10
$20
$30
$40
$50
$60
Aug-02
Oct-02
Dec-02
Feb-03
Apr-03
Jun-0
3Aug
-03Oct-
03Dec
-03Feb
-04Apr-
04Ju
n-04
Aug-04
Oct-04
Dec-04
Feb-05
Apr-05
Jun-0
5Aug
-05Oct-
05Dec
-05Feb
-06Apr-
06Ju
n-06
Aug-06
Oct-06
Dec-06
Ave
rage
Mon
thly
RE
C P
rices
($/M
Wh)
CT Class I MassachusettsNJ Class I TexasMD Class I DC Class I

Environmental Energy Technologies Division • Energy Analysis Department
Two Types of RPS Markets Exist, and Western States Are Predominantly Regulated
Regulated Markets
Dominated by long-term bundled contracts for electricity and RECs
Utility RFP solicitations or bilateral negotiations, with PUC oversight
Restructured Markets
More often dominated by short-term trade in RECsto multiple parties, without PUC oversight
Developers often sell electricity and RECsseparately
WREGIS will provide increased REC-tracking functionality starting in 2007, but is unlikely to alone be sufficient to jump start
the RECs market in the West

Environmental Energy Technologies Division • Energy Analysis Department
Regulated Markets: RPS Helps Create Buyers for Renewable Energy
• RPS’ can yield profitable/financeable long-term deals, but…
• Often an RFP-driven environment, with fierce competition among developers for contracts
• Emerging concern that utilities are selecting low-priced contracts that may fail to yield operating projects– CA: Of 2,121 MW of new RE under contract – 7% cancelled; 55%
delayed; 38% on track
– NV: As of early 2006, of 414 MW of new RE under contract since RPS began; 57% cancelled; 37% delayed; 6% online or on track
• In other cases, PPAs impose contractual requirements (construction milestones, performance, credit) that some view as unduly severe likely to favor the larger developers

Environmental Energy Technologies Division • Energy Analysis Department
Presentation Overview
1. Overview of State RPS
2. RPS Impact on Project Development
3. RPS Design and Design Pitfalls
4. Impact on Renewable Energy Contracting
5. Federal RPS Implications
6. Conclusions
Environmental Energy Technologies Division • Energy Analysis Department
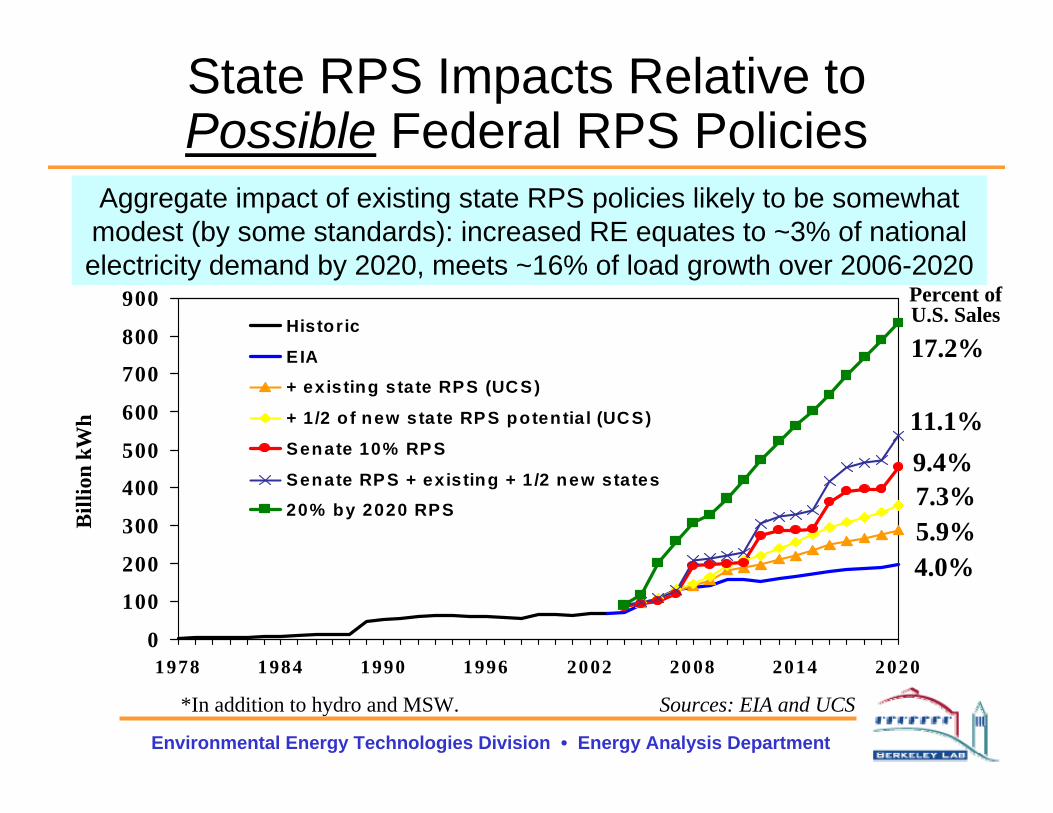
State RPS Impacts Relative to Possible Federal RPS Policies
Aggregate impact of existing state RPS policies likely to be somewhat modest (by some standards): increased RE equates to ~3% of national electricity demand by 2020, meets ~16% of load growth over 2006-2020
0
100
200
300
400
500
600
700
800
900
1978 1984 1990 1996 2002 2008 2014 2020
Bill
ion
kWh
Historic
EIA
+ existing state RPS (UCS)
+ 1 /2 o f new state RPS potentia l (UCS)
Senate 10% RPS
Senate RPS + existing + 1 /2 new states
20% by 2020 RPS
*In addition to hydro and MSW. Sources: EIA and UCS
Percent of U.S. Sales
4.0%
11.1%9.4%
5.9%7.3%
17.2%

Environmental Energy Technologies Division • Energy Analysis Department
Federal and State RPS Policies• Multiple RPS policies proposed at Federal level, and
Federal RPS has passed Senate in the past– Standard levels of 10-20% are in play, but with numerous
exceptions/exemptions• No unique insight into likely fate of RPS this legislative
session, or in any future session• But... If a Federal RPS is passed, then interactions
between state and federal RPS policies become key• Federal pre-emption seemingly unlikely, but also
somewhat unclear whether states would require that in-state utilities purchase at levels above the Federal RPS... issue not addressed in most state RPS policies

Environmental Energy Technologies Division • Energy Analysis Department
Presentation Overview
1. Overview of State RPS
2. RPS Impact on Project Development
3. RPS Design and Design Pitfalls
4. Impact on Renewable Energy Contracting
5. Federal RPS Implications
6. Conclusions
Environmental Energy Technologies Division • Energy Analysis Department
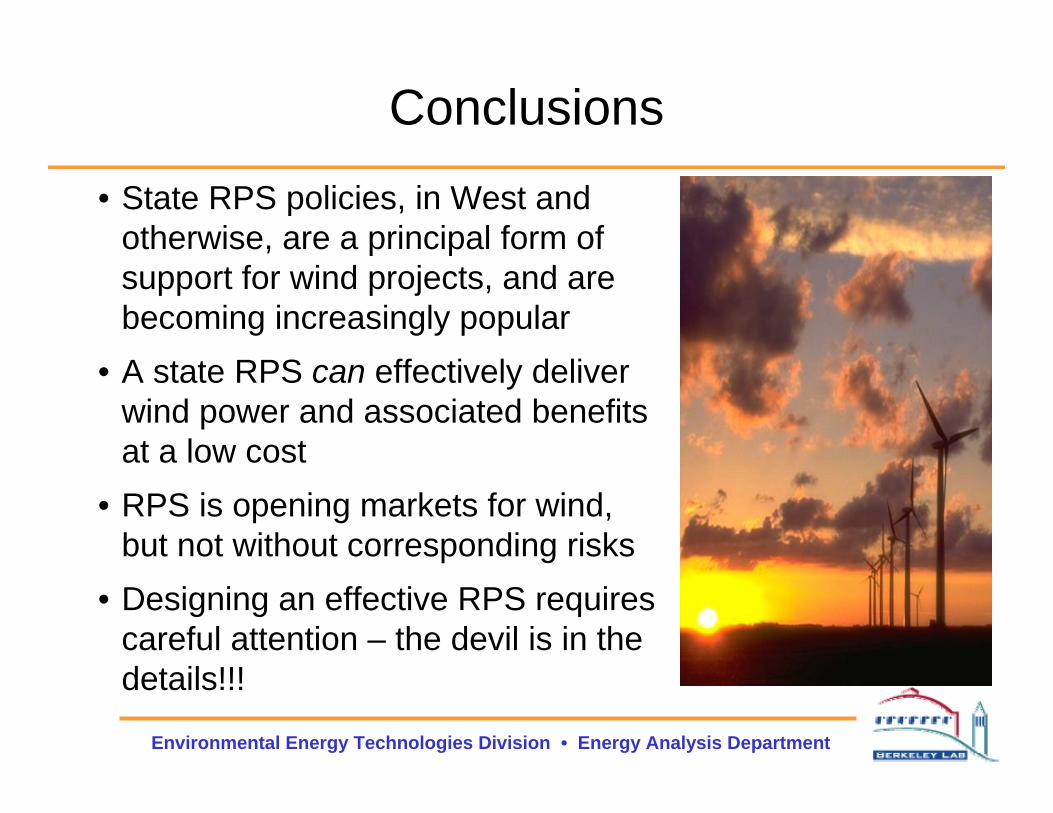
Conclusions
• State RPS policies, in West and otherwise, are a principal form of support for wind projects, and are becoming increasingly popular
• A state RPS can effectively deliver wind power and associated benefits at a low cost
• RPS is opening markets for wind, but not without corresponding risks
• Designing an effective RPS requires careful attention – the devil is in the details!!!