Renewables Portfolio Standards in the United States: A Status ...
36
Environmental Energy Technologies Division • Energy Analysis Department Renewables Portfolio Standards in the United States: A Status Report with Data Through 2007 Ryan H. Wiser and Galen Barbose Lawrence Berkeley National Laboratory - Report Summary - April 2008
Transcript of Renewables Portfolio Standards in the United States: A Status ...
Environmental Energy Technologies Division • Energy Analysis Department
Renewables Portfolio Standards in the United States:
A Status Report with Data Through 2007
Ryan H. Wiser and Galen BarboseLawrence Berkeley National Laboratory
- Report Summary -
April 2008
Environmental Energy Technologies Division • Energy Analysis Department
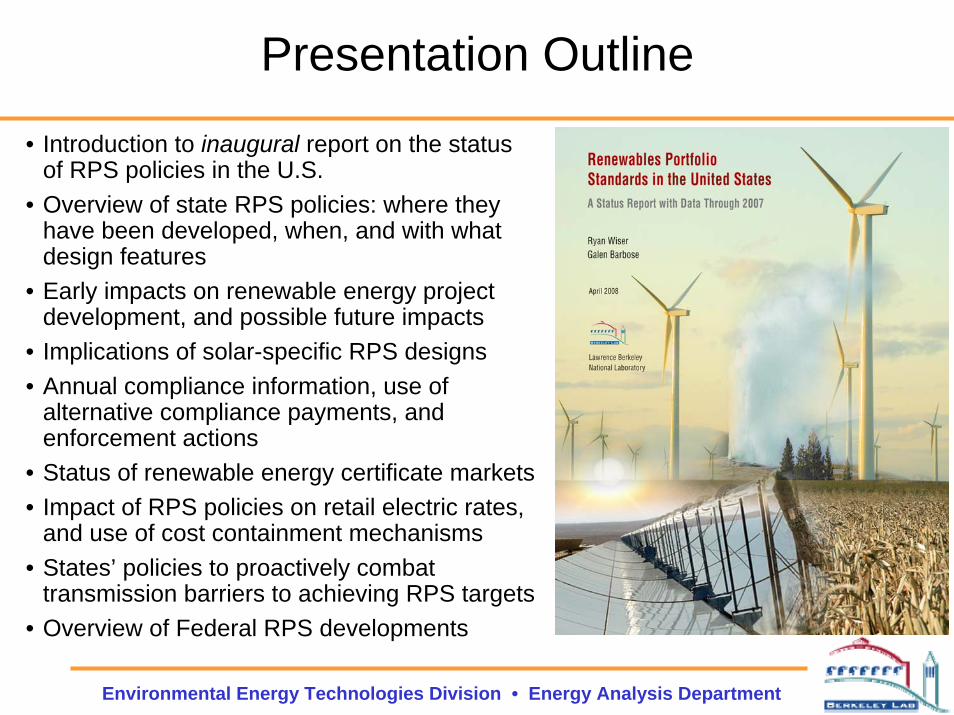
Presentation Outline
• Introduction to inaugural report on the status of RPS policies in the U.S.
• Overview of state RPS policies: where they have been developed, when, and with what design features
• Early impacts on renewable energy project development, and possible future impacts
• Implications of solar-specific RPS designs• Annual compliance information, use of
alternative compliance payments, and enforcement actions
• Status of renewable energy certificate markets• Impact of RPS policies on retail electric rates,
and use of cost containment mechanisms• States’ policies to proactively combat
transmission barriers to achieving RPS targets• Overview of Federal RPS developments
Environmental Energy Technologies Division • Energy Analysis Department
Renewables Portfolio Standards in the US: A Status Report with Data Through 2007
Report Purpose:• Provides an overview of the design, early experience, and impacts of
renewables portfolio standards (RPS) in the United States
• Emphasizes factual information on state-level mandatory RPS policies, with little focus on “lessons learned”; briefly discusses Federal RPS developments, and state-level non-binding renewable energy goals
Report Authors:• Primary Authors: R. Wiser and G. Barbose, Berkeley Lab
• Contributing Authors: Mark Bolinger and Susannah Churchill (Berkeley Lab), Lori Bird and Karlynn Cory (NREL), Kevin Porter and Sari Fink (Exeter Associates), Ed Holt (Ed Holt & Associates), Jeff Deyette (UCS)
Available at: http://eetd.lbl.gov/ea/ems/re-pubs.html
Environmental Energy Technologies Division • Energy Analysis Department
What Is a Renewables Portfolio Standard?
Renewables Portfolio Standard (RPS):• A requirement on retail electric suppliers…• to supply a minimum percentage or amount
of their retail load…• with eligible sources of renewable energy.
Typically backed with penalties of some form
Often accompanied by a tradable renewable energy certificate (REC) program, to facilitate compliance
Never designed the same in any two states

Environmental Energy Technologies Division • Energy Analysis Department
State RPS Policies Exist in 25 States and D.C.; Four States Have Non-Binding Goals
Most policies established through state legislation, but some through regulatory action (NY, AZ) or voter-approved initiatives (CO, WA)

Environmental Energy Technologies Division • Energy Analysis Department
Four New RPS Policies Established in ‘07; 11 States Revised Existing RPS Programs
• Popularity of mandatory RPS policies has grown in recent years
• Half of the RPS policies have been created since the beginning of 2004
TXPANMNJMNMEWIMDNJDEHITXCTCTNVPANVCOCACONMMNNVWICAAZCTNJCTNMMNAZMNIA
200720062005200420032002200120001999199819971996199419911983
OR(2011)
WA(2012)
MT(2008)
RI (2007)
CA(2003)
NM(2002)
TX(2002)
WI (2000)
NV(2001)
AZ(1999)
MN(2002)IA
NC(2010)
DE(2007)
NY (2006)
NJ(2001)
PA (2001)
ME (2000)
NH(2008)
DC(2007)
MD(2006)
CT(2000)
MA (2003)
IL(2008)
HI(2005)
CO (2007)
Enactment (above timeline)
( ) Year of First Requirement
Enactment (above timeline)
Major Revisions (below timeline)
( ) Year of First Requirement
Enactment (above timeline)
( ) Year of First Requirement
Enactment (above timeline)
Major Revisions (below timeline)
( ) Year of First Requirement
Environmental Energy Technologies Division • Energy Analysis Department
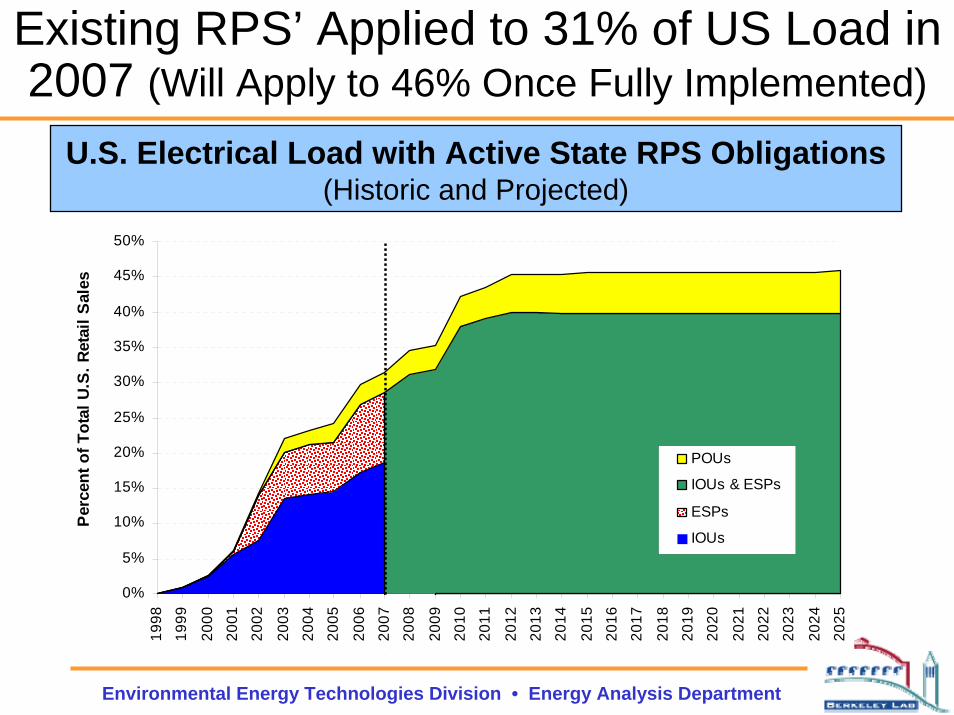
Existing RPS’ Applied to 31% of US Load in 2007 (Will Apply to 46% Once Fully Implemented)
U.S. Electrical Load with Active State RPS Obligations(Historic and Projected)
0%
5%
10%
15%
20%
25%
30%
35%
40%
45%
50%
1998
1999
2000
2001
2002
2003
2004
2005
2006
2007
2008
2009
2010
2011
2012
2013
2014
2015
2016
2017
2018
2019
2020
2021
2022
2023
2024
2025
Per
cent
of T
otal
U.S
. Ret
ail S
ales
POUs
IOUs & ESPs
ESPs
IOUs
Environmental Energy Technologies Division • Energy Analysis Department
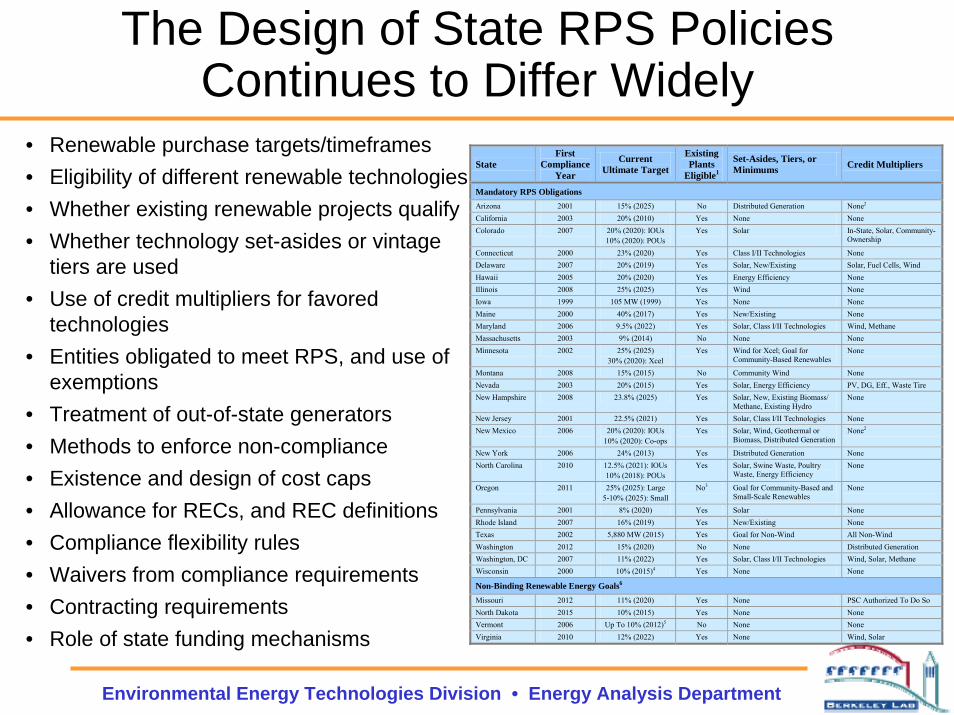
The Design of State RPS Policies Continues to Differ Widely
• Renewable purchase targets/timeframes• Eligibility of different renewable technologies• Whether existing renewable projects qualify• Whether technology set-asides or vintage
tiers are used• Use of credit multipliers for favored
technologies • Entities obligated to meet RPS, and use of
exemptions• Treatment of out-of-state generators• Methods to enforce non-compliance• Existence and design of cost caps• Allowance for RECs, and REC definitions• Compliance flexibility rules• Waivers from compliance requirements• Contracting requirements• Role of state funding mechanisms
State First
Compliance Year
Current Ultimate Target
Existing Plants
Eligible1
Set-Asides, Tiers, or Minimums Credit Multipliers
Mandatory RPS Obligations Arizona 2001 15% (2025) No Distributed Generation None2 California 2003 20% (2010) Yes None None Colorado 2007 20% (2020): IOUs
10% (2020): POUs Yes Solar In-State, Solar, Community-
Ownership
Connecticut 2000 23% (2020) Yes Class I/II Technologies None Delaware 2007 20% (2019) Yes Solar, New/Existing Solar, Fuel Cells, Wind Hawaii 2005 20% (2020) Yes Energy Efficiency None Illinois 2008 25% (2025) Yes Wind None Iowa 1999 105 MW (1999) Yes None None Maine 2000 40% (2017) Yes New/Existing None Maryland 2006 9.5% (2022) Yes Solar, Class I/II Technologies Wind, Methane Massachusetts 2003 9% (2014) No None None Minnesota 2002 25% (2025)
30% (2020): Xcel Yes Wind for Xcel; Goal for
Community-Based Renewables None
Montana 2008 15% (2015) No Community Wind None Nevada 2003 20% (2015) Yes Solar, Energy Efficiency PV, DG, Eff., Waste Tire New Hampshire 2008 23.8% (2025) Yes Solar, New, Existing Biomass/
Methane, Existing Hydro None
New Jersey 2001 22.5% (2021) Yes Solar, Class I/II Technologies None New Mexico 2006 20% (2020): IOUs
10% (2020): Co-ops Yes Solar, Wind, Geothermal or
Biomass, Distributed Generation None2
New York 2006 24% (2013) Yes Distributed Generation None North Carolina 2010 12.5% (2021): IOUs
10% (2018): POUs Yes Solar, Swine Waste, Poultry
Waste, Energy Efficiency None
Oregon 2011 25% (2025): Large 5-10% (2025): Small
No3 Goal for Community-Based and Small-Scale Renewables
None
Pennsylvania 2001 8% (2020) Yes Solar None Rhode Island 2007 16% (2019) Yes New/Existing None Texas 2002 5,880 MW (2015) Yes Goal for Non-Wind All Non-Wind Washington 2012 15% (2020) No None Distributed Generation Washington, DC 2007 11% (2022) Yes Solar, Class I/II Technologies Wind, Solar, Methane Wisconsin 2000 10% (2015)4 Yes None None
Non-Binding Renewable Energy Goals6 Missouri 2012 11% (2020) Yes None PSC Authorized To Do So North Dakota 2015 10% (2015) Yes None None Vermont 2006 Up To 10% (2012)5 No None None Virginia 2010 12% (2022) Yes None Wind, Solar

Environmental Energy Technologies Division • Energy Analysis Department
Two Key Structural Design Differences Stand Out
Tiered Targets– Different targets for different resource types or vintages
Compliance Models– In states with retail electric competition, suppliers are typically
given broad latitude to comply with requirements as they see fit
– In states with still-regulated utility monopolies, electricity regulators oversee utility procurement and contracting
– In New York and Illinois a state agency/instrumentality has direct responsibility to conduct procurements

Environmental Energy Technologies Division • Energy Analysis Department
RPS Policies Frequently Offer Exemptions for Certain LSEs and/or Customers
• Publicly owned utilities (POUs) are often exempted, or given more lenient requirements than other load-serving entities (LSEs)
• Various customer exemptions have also been offered in a number of states
• Result is that percentage of load eventually covered by state RPS policies varies from 56% to 100%, depending on the state
• These exemptions are accounted for in the previous figure
Treatment of POUs State
% of State Sales
Covered Munis Coops Other LSE Exemptions Customer Exemptions
AZ 59% Political subdivisions; utilities with >50% of out-of-state customers None
CA 98% POUs obligated to develop own RPS None CO 94% Munis with < 40,000 customers None CT 100% na Munis obligated to develop own RPS None DE 75% POUs have requested/received exemptions Industrial customers > 1.5 MW load HI 100% na None None IA 75% Applies only to MidAmerican and IPL None
IL 56% IOUs with < 100,000 customers; all competitive ESPs
IOU retail supply customers not with fixed-price service
MA 86% na None None
MD 98% Coops served by existing purchase agreement
Industrial process load > 300 GWh/yr; resid. load in area subject to rate freeze
ME 93% None Sales to certain businesses, until 2010 MN 100% None None
MT 63%
Coops and existing munis with >5,000 customers must develop own RPS; other coops exempt; ESPs and new munis that serve large customers exempt
None
NC 100% None None NH 100% None None NJ 97% None None NM 88% None None NV 88% None None
NY 73% LIPA, NYPA, munis encouraged to establish RPS None
OR 100% Multiple clauses offer possible exemptions to certain suppliers (esp. POUs) in certain years None
PA 97% None Load in area subject to rate freeze RI 99% na None None TX 75% Utilities under a rate freeze Certain large customers upon petition WA 83% All utilities with < 25,000 customers None D.C. 100% na na None None WI 100% None None
Notes: The percent of state sales figures represent the fraction of statewide load ultimately obligated by existing RPS policies. The percentage totals include POUs required to meet an RPS of their own design and LSEs temporarily (but not permanently) exempted from the RPS. In addition to the specific exemptions listed here, Federal power marketing agencies and state-owned electric utilities are assumed to be exempt in all cases.
Must generally meet RPS (in some cases, specific percentage targets are lower, or specific exemptions apply) Munis or coops must meet an RPS of their own design Fully exempt from obligatory RPS
na No entities of that type exist in the state
Environmental Energy Technologies Division • Energy Analysis Department
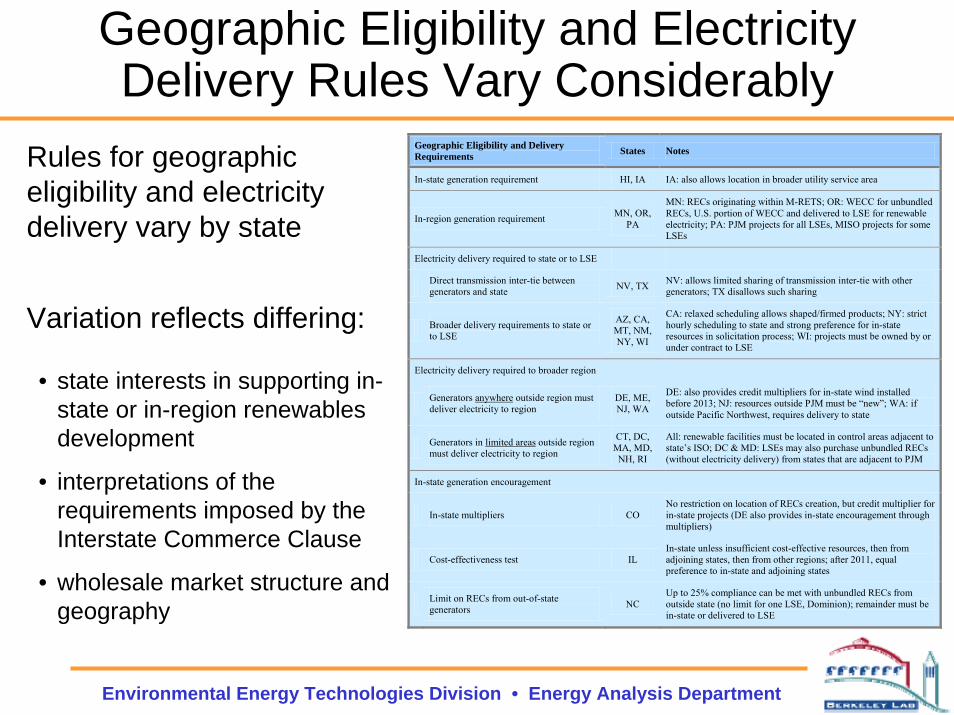
Geographic Eligibility and Electricity Delivery Rules Vary Considerably
Rules for geographic eligibility and electricity delivery vary by state
Variation reflects differing:
• state interests in supporting in-state or in-region renewables development
• interpretations of the requirements imposed by the Interstate Commerce Clause
• wholesale market structure and geography
Geographic Eligibility and Delivery Requirements States Notes
In-state generation requirement HI, IA IA: also allows location in broader utility service area
In-region generation requirement MN, OR, PA
MN: RECs originating within M-RETS; OR: WECC for unbundled RECs, U.S. portion of WECC and delivered to LSE for renewable electricity; PA: PJM projects for all LSEs, MISO projects for some LSEs
Electricity delivery required to state or to LSE
Direct transmission inter-tie between generators and state NV, TX NV: allows limited sharing of transmission inter-tie with other
generators; TX disallows such sharing
Broader delivery requirements to state or to LSE
AZ, CA, MT, NM, NY, WI
CA: relaxed scheduling allows shaped/firmed products; NY: strict hourly scheduling to state and strong preference for in-state resources in solicitation process; WI: projects must be owned by or under contract to LSE
Electricity delivery required to broader region
Generators anywhere outside region must deliver electricity to region
DE, ME, NJ, WA
DE: also provides credit multipliers for in-state wind installed before 2013; NJ: resources outside PJM must be “new”; WA: if outside Pacific Northwest, requires delivery to state
Generators in limited areas outside region must deliver electricity to region
CT, DC, MA, MD,
NH, RI
All: renewable facilities must be located in control areas adjacent to state’s ISO; DC & MD: LSEs may also purchase unbundled RECs (without electricity delivery) from states that are adjacent to PJM
In-state generation encouragement
In-state multipliers CO No restriction on location of RECs creation, but credit multiplier for in-state projects (DE also provides in-state encouragement through multipliers)
Cost-effectiveness test IL In-state unless insufficient cost-effective resources, then from adjoining states, then from other regions; after 2011, equal preference to in-state and adjoining states
Limit on RECs from out-of-state generators NC
Up to 25% compliance can be met with unbundled RECs from outside state (no limit for one LSE, Dominion); remainder must be in-state or delivered to LSE

Environmental Energy Technologies Division • Energy Analysis Department
Trends Among Recently Established or Revised RPS Programs
• Increased stringency of RPS targets
• Expanded use of resource-specific set-asides, especially for solar
• Expanded applicability of RPS policies to publicly owned utilities
• Greater leniency often given to publicly owned utilities in RPS targets and obligations
Environmental Energy Technologies Division • Energy Analysis Department
Use of Energy Efficiency in State RPS Programs Remains Limited
• Three states allow energy efficiency to qualify for a portion of the RPS– Hawaii (up to 50%)– Nevada (up to 25%)– North Carolina (up to 25-40% for IOUs; unlimited for POUs)
• Natural-gas fuels cells, fossil CHP, waste heat sometimes eligible
• A number of other states have or are developing separate energy efficiency portfolio standards– Colorado, Connecticut, Illinois, Minnesota, New Jersey, New
Mexico, Pennsylvania, and Texas
Environmental Energy Technologies Division • Energy Analysis Department
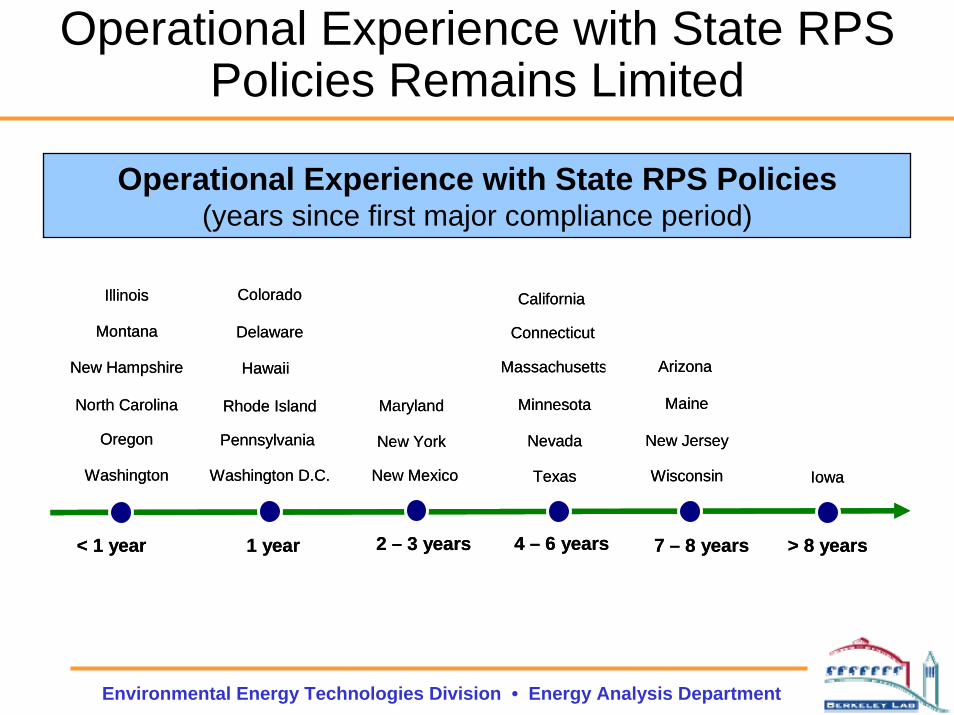
Operational Experience with State RPS Policies Remains Limited
Operational Experience with State RPS Policies(years since first major compliance period)
Washington
Oregon
North Carolina
New Hampshire
Montana
Illinois
Washington D.C.
Rhode Island
Delaware
Colorado
New York
Maryland
Hawaii
TexasNew Mexico
Minnesota
Massachusetts
California
Wisconsin
Pennsylvania New JerseyNevada
Maine
Connecticut
Arizona
Iowa
< 1 year 1 year 2 – 3 years 4 – 6 years 7 – 8 years > 8 years

Environmental Energy Technologies Division • Energy Analysis Department
State RPS’ Are Increasingly Motivating Renewable Energy Development
Cumulative and Annual Non-Hydro Renewable Energy Capacity in RPS and Non-RPS States
Though not an ideal metric for RPS-impact, over 50% of non-hydro renewable additions (8,900 MW) since the late 1990s have come from RPS states; metric increases to 76% in 2007 alone
Cumulative Capacity
13,000
16,000
19,000
22,000
25,000
28,000
31,000
1998 1999 2000 2001 2002 2003 2004 2005 2006 2007
Nam
epla
te C
apac
ity (M
W)
RPS
non-RPS
Annual Capacity Additions
0
1,000
2,000
3,000
4,000
5,000
6,000
1998 1999 2000 2001 2002 2003 2004 2005 2006 2007
Nam
epla
te C
apac
ity (M
W)
RPS
non-RPS

Environmental Energy Technologies Division • Energy Analysis Department
State RPS Policies Are Primarily Supporting Wind Power
Non-Hydro Renewable Energy Capacity Additions in RPS States
Total Capacity Additions (1998-2007)
Solar2%
Geothermal 1%
Wind93%
Biomass4%
Annual Capacity Additions
0
500
1,000
1,500
2,000
2,500
3,000
3,500
4,000
4,500
1998 1999 2000 2001 2002 2003 2004 2005 2006 2007
Nam
epla
te C
apac
ity (M
W) Solar
Geothermal
Biomass
Wind
Environmental Energy Technologies Division • Energy Analysis Department
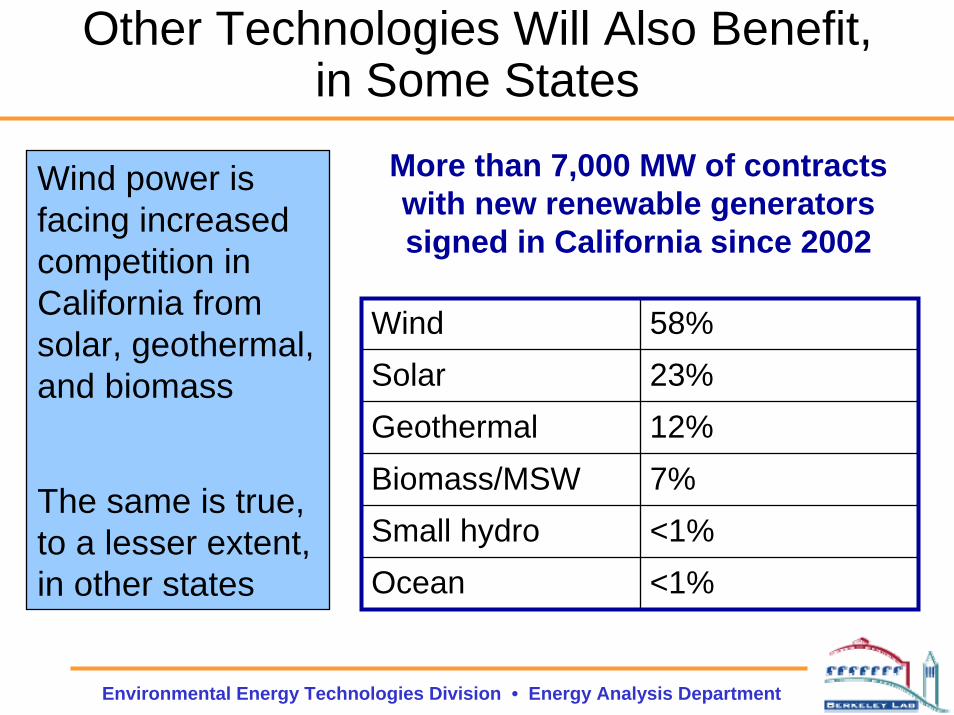
Other Technologies Will Also Benefit, in Some States
Wind power is facing increased competition in California from solar, geothermal, and biomass
The same is true, to a lesser extent, in other states
Wind 58%Solar 23%Geothermal 12%Biomass/MSW 7%Small hydro <1%Ocean <1%
More than 7,000 MW of contracts with new renewable generators signed in California since 2002

Environmental Energy Technologies Division • Energy Analysis Department
Future Impacts of Existing State RPS Policies Are Projected To Be Relatively Sizable
• Roughly 61 GW of new renewables capacity by 2025, if full compliance is achieved (increases to 77 GW including all non-binding renewable targets)
• The 61 GW would represent ~4.7% of total U.S. generation in 2025• 15% of projected load growth from 2000-2025 met by this new generation
0% 5% 10% 15% 20% 25% 30%
D.C.Iowa
Maryland
TexasHawaii
New York
Wisconsin
MaineMontana
ArizonaColorado
WashingtonCalifornia
NevadaIllinois
Rhode IslandDelaware
New Mexico
New JerseyConnecticut
OregonMinnesota
New Renewable Generation Needed by 2025 as a Percent of Projected Statewide Retail Sales
New Hampshire
Pennsylvania
Massachusetts
North Carolina
0 2,000 4,000 6,000 8,000 10,000
D.C.Iowa
HawaiiRhode Island
MaineMontana
New HampshireDelaware
MassachusettsNevada
New MexicoWisconsin
ConnecticutMaryland
North CarolinaNew YorkColorado
OregonWashington
PennsylvaniaArizona
New JerseyTexas
MinnesotaIllinois
California
New Renewable Capacity Needed by 2025 (Nameplate MW)

Environmental Energy Technologies Division • Energy Analysis Department
Solar-Specific RPS Designs Are Becoming More Prevalent
11 states and D.C. have solar or DG set-asides (5 of which were created in 2007), sometimes combined with credit multipliers
NV: 1% solar by 20152.4x multiplier for central PV2.45x multiplier for distributed PV
PA: 0.5% PV by 2020
NJ: 2.12% solar electric by 2021
AZ: 4.5% customer-sited DG by 2025 (half from residential)
NY: 0.1542% customer-sited DG by 2013
CO: 0.8% solar electric by 2020 (half from customer-sited projects)1.25x multiplier for in-state projects3x multiplier for co-ops and munisfor solar installed before July 2015
DC: 0.386% solar electric by 20211.1x multiplier for solar 2007-09
WA: 2x multiplier for DG
NM: 4% solar electric by 2020, 0.6% DG by 2015
DE: 2.005% PV by 2019 3x multiplier for PV installed before 2015
MD: 2% solar electric by 2022
Set-aside
Multiplier
NC: 0.2% solar by 2018
NH: 0.3% solar electric by 2014
Set-aside with multiplier TX: 2x multiplier for all non-wind

Environmental Energy Technologies Division • Energy Analysis Department
Impact of Solar/DG Set-Asides Is Growing: 102 MW PV, 65 MW CSP from 2000-07
Set-asides also benefiting solar-thermal electric (CSP): 1 MW (Arizona) constructed in 2006, and 64 MW (Nevada) in 2007
0
10
20
30
40
50
60
70
2000 2001 2002 2003 2004 2005 2006 2007
Ann
ual G
rid-C
onne
cted
PV
Inst
alla
tions
in R
PS
Stat
es w
ith S
olar
or D
G S
et-A
side
s (M
W)
0%
10%
20%
30%
40%
50%
60%
70%
80%
90%
100%
Perc
ent o
f Ann
ual G
rid-C
onne
cted
PV
Inst
alla
tions
in th
e U
S (%
)
DelawareMarylandDistrict of ColumbiaPennsylvaniaColoradoNevadaNew YorkArizonaNew Jersey
Percent of annual US PV installations [right axis]
Percent of annual US PV installations (excluding California) [right axis]
Environmental Energy Technologies Division • Energy Analysis Department
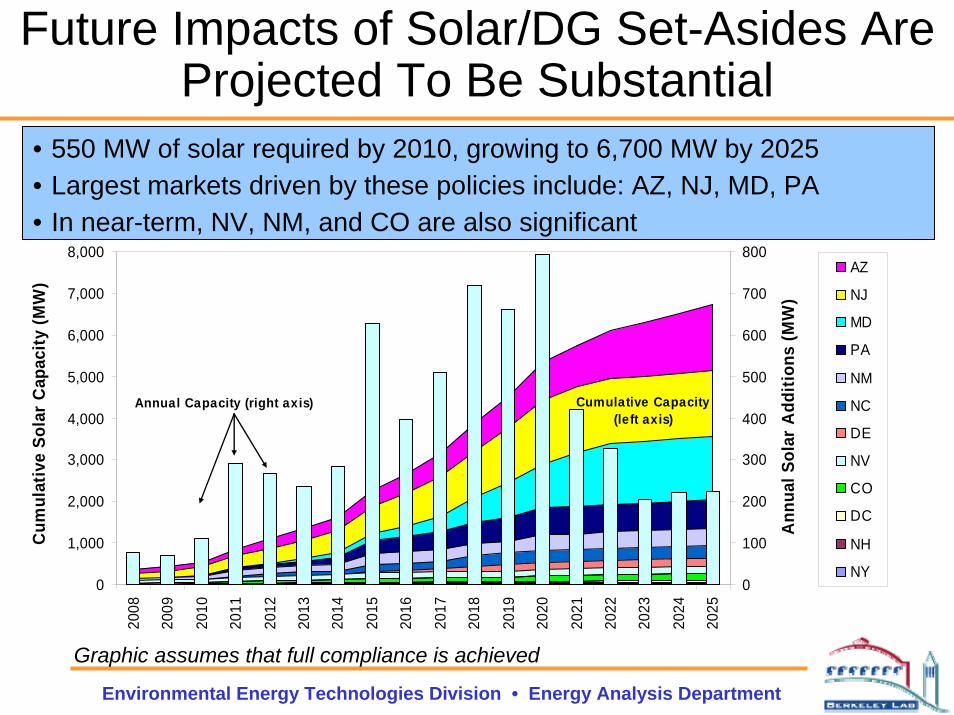
Future Impacts of Solar/DG Set-Asides Are Projected To Be Substantial
• 550 MW of solar required by 2010, growing to 6,700 MW by 2025• Largest markets driven by these policies include: AZ, NJ, MD, PA• In near-term, NV, NM, and CO are also significant
Graphic assumes that full compliance is achieved
0
1,000
2,000
3,000
4,000
5,000
6,000
7,000
8,000
2008
2009
2010
2011
2012
2013
2014
2015
2016
2017
2018
2019
2020
2021
2022
2023
2024
2025
Cum
ulat
ive
Sola
r C
apac
ity (M
W)
0
100
200
300
400
500
600
700
800
Ann
ual S
olar
Add
ition
s (M
W)
AZ
NJ
MD
PA
NM
NC
DE
NV
CO
DC
NH
NY
Annual Capacity (right axis) Cumulative Capacity (left axis)

Environmental Energy Technologies Division • Energy Analysis Department
Whether Full Compliance Is Achieved with Solar/DG Set-Asides Will Be Influenced By…
• The attractiveness of federal tax incentives for solar
• State RPS and REC cost caps, which may be binding in some states
• Force majeure events that may excuse supplier compliance with solar/DG set-asides
• Whether load-serving entities willingly enter into long-term contracts with solar suppliers
Environmental Energy Technologies Division • Energy Analysis Department
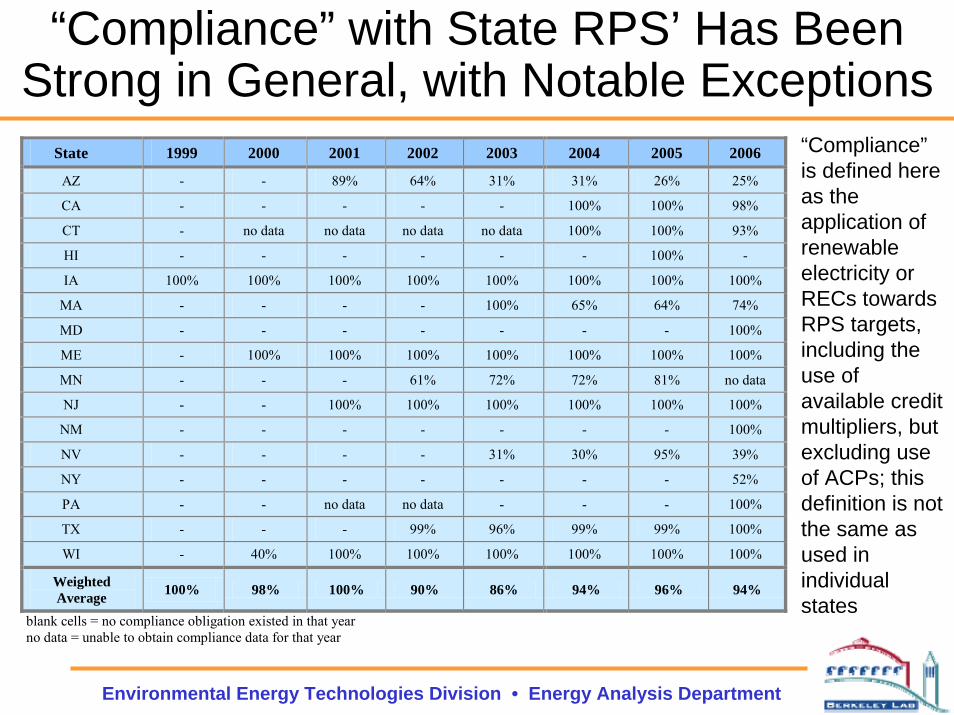
“Compliance” with State RPS’ Has Been Strong in General, with Notable Exceptions
“Compliance”is defined here as the application of renewable electricity or RECs towards RPS targets, including the use of available credit multipliers, but excluding use of ACPs; this definition is not the same as used in individual states
State 1999 2000 2001 2002 2003 2004 2005 2006
AZ - - 89% 64% 31% 31% 26% 25%
CA - - - - - 100% 100% 98%
CT - no data no data no data no data 100% 100% 93%
HI - - - - - - 100% -
IA 100% 100% 100% 100% 100% 100% 100% 100%
MA - - - - 100% 65% 64% 74%
MD - - - - - - - 100%
ME - 100% 100% 100% 100% 100% 100% 100%
MN - - - 61% 72% 72% 81% no data
NJ - - 100% 100% 100% 100% 100% 100%
NM - - - - - - - 100%
NV - - - - 31% 30% 95% 39%
NY - - - - - - - 52%
PA - - no data no data - - - 100%
TX - - - 99% 96% 99% 99% 100%
WI - 40% 100% 100% 100% 100% 100% 100%
Weighted Average 100% 98% 100% 90% 86% 94% 96% 94%
blank cells = no compliance obligation existed in that year no data = unable to obtain compliance data for that year
Environmental Energy Technologies Division • Energy Analysis Department
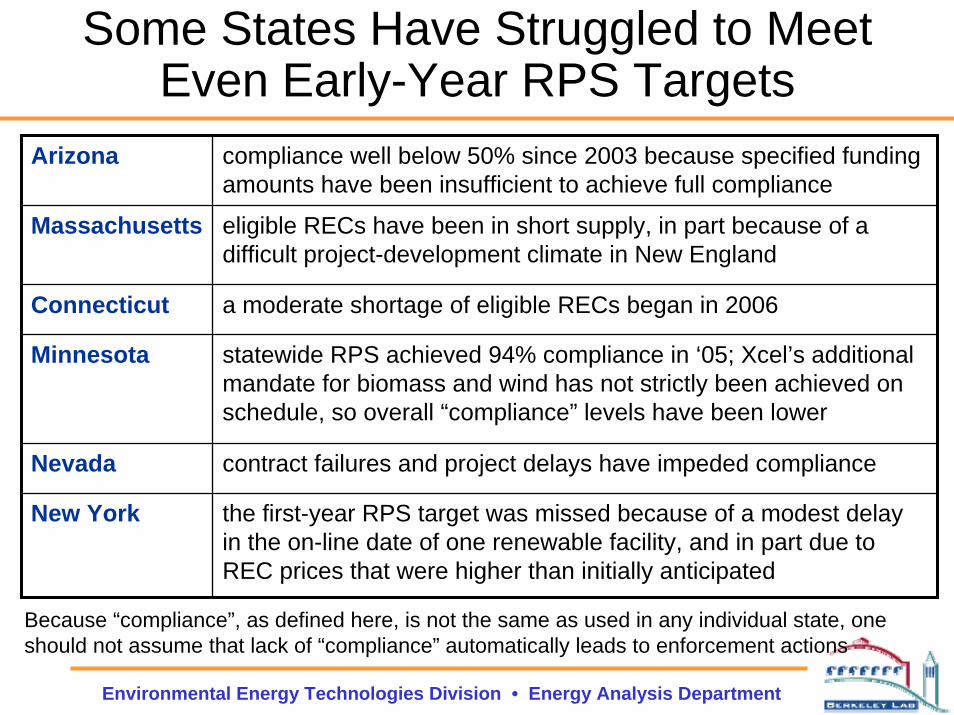
Some States Have Struggled to Meet Even Early-Year RPS Targets
Arizona compliance well below 50% since 2003 because specified funding amounts have been insufficient to achieve full compliance
Massachusetts eligible RECs have been in short supply, in part because of a difficult project-development climate in New England
Connecticut a moderate shortage of eligible RECs began in 2006
Minnesota statewide RPS achieved 94% compliance in ‘05; Xcel’s additional mandate for biomass and wind has not strictly been achieved on schedule, so overall “compliance” levels have been lower
Nevada contract failures and project delays have impeded compliance
New York the first-year RPS target was missed because of a modest delay in the on-line date of one renewable facility, and in part due to REC prices that were higher than initially anticipated
Because “compliance”, as defined here, is not the same as used in any individual state, one should not assume that lack of “compliance” automatically leads to enforcement actions

Environmental Energy Technologies Division • Energy Analysis Department
Compliance with Solar Set-Asides Has Been Mixed, But Experience Remains Limited
0%
20%
40%
60%
80%
100%
2001 2002 2003 2004 2005 2006
Sola
r Ret
irem
ents
as
% o
fSo
lar S
et-A
side
Tar
get
Weighted AverageArizonaNew JerseyNevadaPennsylvania

Environmental Energy Technologies Division • Energy Analysis Department
States Have Established a Variety of Enforcement Mechanisms
$18.2 million in alternative compliance payments (ACPs) collected in 3 states in 2006: MA, NJ, MD (vast majority in MA)
Financial penalties have only been levied in TX ($32 k) and CT ($5.6 million)
Lack of compliance in other states has been excused
Penalties for Non-Compliance States Notes
ACP, Automatic Cost Recovery MA, ME, NH, NJ, RI
Payments generally go to a renewable energy fund; if failure to pay ACP, remedies can include license suspension or revocation and/or financial penalties; ME ACP applies only to new renewables target
ACP, Possible Cost Recovery DE, MD, OR, DC
Cost recovery sometimes only allowed if ACPs are deemed to be the least-cost compliance option; payments generally go to a renewable energy fund; if failure to pay ACP, remedies can include license suspension or revocation and/or financial penalties
Explicit Financial Penalties, No Automatic Cost Recovery
CA, CT, MT, PA, TX, WA,
WI
CA, CT, MT, PA, TX, WA: penalty in $/MWh applies to shortfall; WA: penalty may, in some circumstances, be recoverable in rates; WI: penalty ranges from $5,000 to $500,000; suppliers often given opportunity to petition for a waiver
Discretionary Financial Penalties, No Cost Recovery
AZ, CO, HI, MN, NV
Financial penalties assessed at the discretion of the PUC; penalties can be waived with sufficient cause; in MN, PUC can order renewable investment and can impose financial penalties
Enforcement at PUC Discretion NC, NM PUC has legislative authority to enforce compliance, but no rules have been established to document how this will occur
Not Applicable IA, IL, NY IL and NY rely on administrative agencies to procure renewables on behalf of LSEs; IA RPS has already been fully met

Environmental Energy Technologies Division • Energy Analysis Department
The Use of Renewable Energy Certificates and Certificate Tracking Systems Expand
Operational
Under Development
WREGIS2007
M-RETS2007
GATS2005
GIS2002
ERCOT2001
Operational
Under Development
WREGIS2007
M-RETS2007
GATS2005
GIS2002
ERCOT2001
Electronic REC Tracking SystemsElectronic REC tracking systems are prevalent
Most state RPS policies now allow unbundled RECs (often with some restrictions)
Exceptions are Arizona, California, Hawaii, and Iowa
REC definitions are not uniform across states
Environmental Energy Technologies Division • Energy Analysis Department
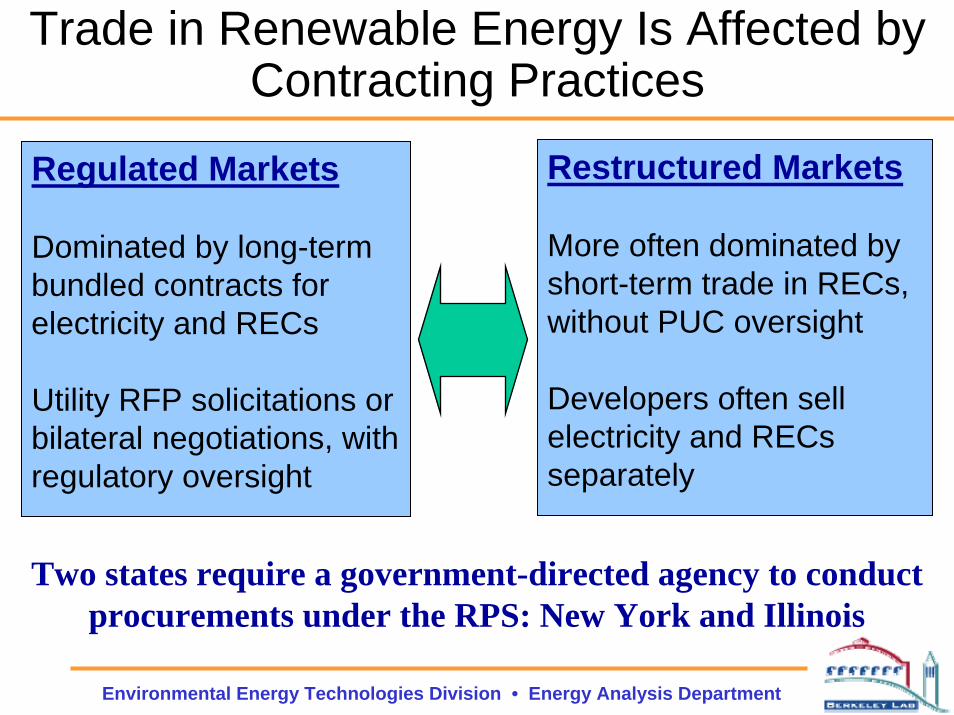
Trade in Renewable Energy Is Affected by Contracting Practices
Regulated Markets
Dominated by long-term bundled contracts for electricity and RECs
Utility RFP solicitations or bilateral negotiations, with regulatory oversight
Restructured Markets
More often dominated by short-term trade in RECs, without PUC oversight
Developers often sell electricity and RECs separately
Two states require a government-directed agency to conduct procurements under the RPS: New York and Illinois
Environmental Energy Technologies Division • Energy Analysis Department
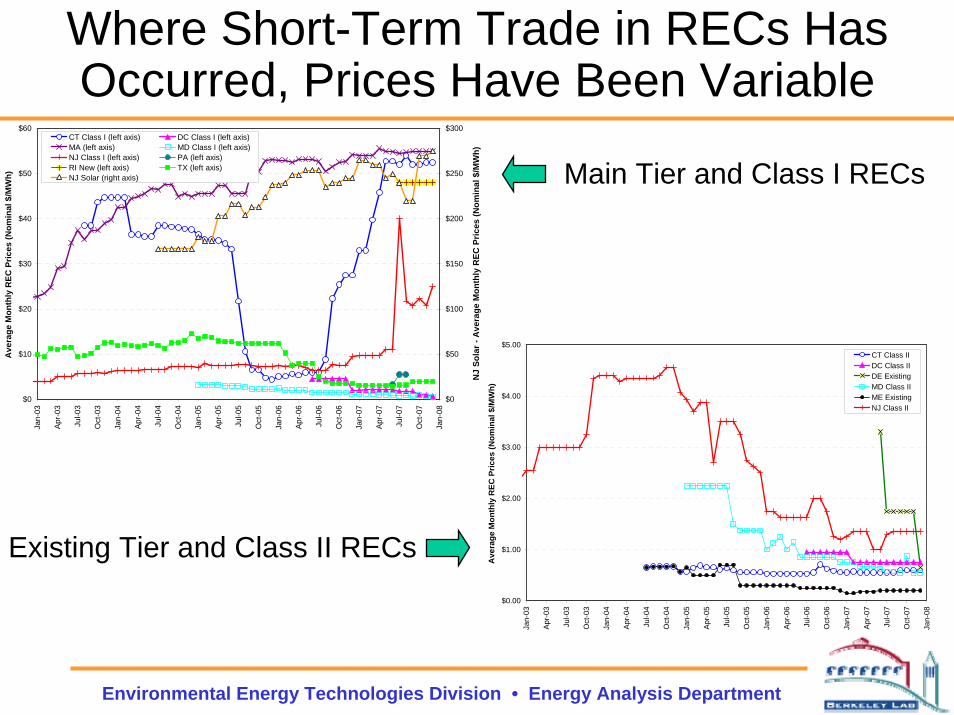
Where Short-Term Trade in RECs Has Occurred, Prices Have Been Variable
$0
$10
$20
$30
$40
$50
$60
Jan-
03
Apr-
03
Jul-0
3
Oct
-03
Jan-
04
Apr-
04
Jul-0
4
Oct
-04
Jan-
05
Apr-
05
Jul-0
5
Oct
-05
Jan-
06
Apr-
06
Jul-0
6
Oct
-06
Jan-
07
Apr-
07
Jul-0
7
Oct
-07
Jan-
08
Ave
rage
Mon
thly
REC
Pric
es (N
omin
al $
/MW
h)
$0
$50
$100
$150
$200
$250
$300
NJ
Sola
r - A
vera
ge M
onth
ly R
EC P
rices
(Nom
inal
$/M
Wh)
CT Class I (left axis) DC Class I (left axis)MA (left axis) MD Class I (left axis)NJ Class I (left axis) PA (left axis)RI New (left axis) TX (left axis)NJ Solar (right axis)
$0.00
$1.00
$2.00
$3.00
$4.00
$5.00
Jan-
03
Apr-
03
Jul-0
3
Oct
-03
Jan-
04
Apr-
04
Jul-0
4
Oct
-04
Jan-
05
Apr-
05
Jul-0
5
Oct
-05
Jan-
06
Apr-
06
Jul-0
6
Oct
-06
Jan-
07
Apr-
07
Jul-0
7
Oct
-07
Jan-
08
Ave
rage
Mon
thly
REC
Pric
es (N
omin
al $
/MW
h)
CT Class IIDC Class IIDE ExistingMD Class IIME ExistingNJ Class II
Main Tier and Class I RECs
Existing Tier and Class II RECs
Environmental Energy Technologies Division • Energy Analysis Department
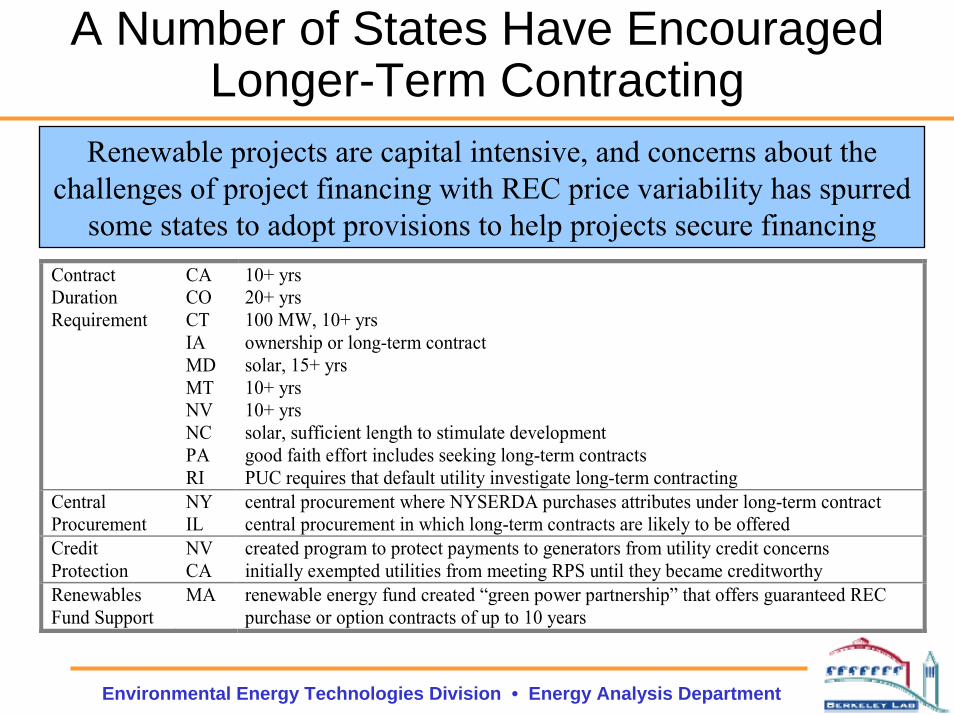
A Number of States Have Encouraged Longer-Term Contracting
Contract Duration Requirement
CA CO CT IA MD MT NV NC PA RI
10+ yrs 20+ yrs 100 MW, 10+ yrs ownership or long-term contract solar, 15+ yrs 10+ yrs 10+ yrs solar, sufficient length to stimulate development good faith effort includes seeking long-term contracts PUC requires that default utility investigate long-term contracting
Central Procurement
NY IL
central procurement where NYSERDA purchases attributes under long-term contract central procurement in which long-term contracts are likely to be offered
Credit Protection
NV CA
created program to protect payments to generators from utility credit concerns initially exempted utilities from meeting RPS until they became creditworthy
Renewables Fund Support
MA renewable energy fund created “green power partnership” that offers guaranteed REC purchase or option contracts of up to 10 years
Renewable projects are capital intensive, and concerns about thechallenges of project financing with REC price variability has spurred
some states to adopt provisions to help projects secure financing

Environmental Energy Technologies Division • Energy Analysis Department
Rate Increases Associated with State RPS Policies Have Rarely Exceeded 1%, So FarTranslating short-term REC prices and state-specific funding limits to
rate impacts in 2007 yields the results shown below
Rate impacts of RPS policies that are dominated by long-term contracts are unknown, but anecdotal evidence suggests limited impacts, and possibly even rate reductions
0.0%
0.2%
0.4%
0.6%
0.8%
1.0%
1.2%
Mar
ylan
d
Mai
ne
Was
hing
ton
D.C
.
Del
awar
e
Pen
nsyl
vani
a
New
Yor
k
Rho
de Is
land
New
Jer
sey
Col
orad
o
Ariz
ona
Mas
sach
uset
ts
Con
nect
icut
Cal
iforn
ia
Iow
a
Min
neso
ta
Nev
ada
New
Mex
ico
Texa
s
Wis
cons
in
Haw
aii
Illin
ois
Mon
tana
New
Ham
pshi
re
Nor
th C
arol
ina
Ore
gon
Was
hing
ton
Est
imat
ed E
lect
ricity
Rat
e Im
pact
in 2
007
(%)
unknowndata not available
not applicableRPS did not apply in '07
Environmental Energy Technologies Division • Energy Analysis Department
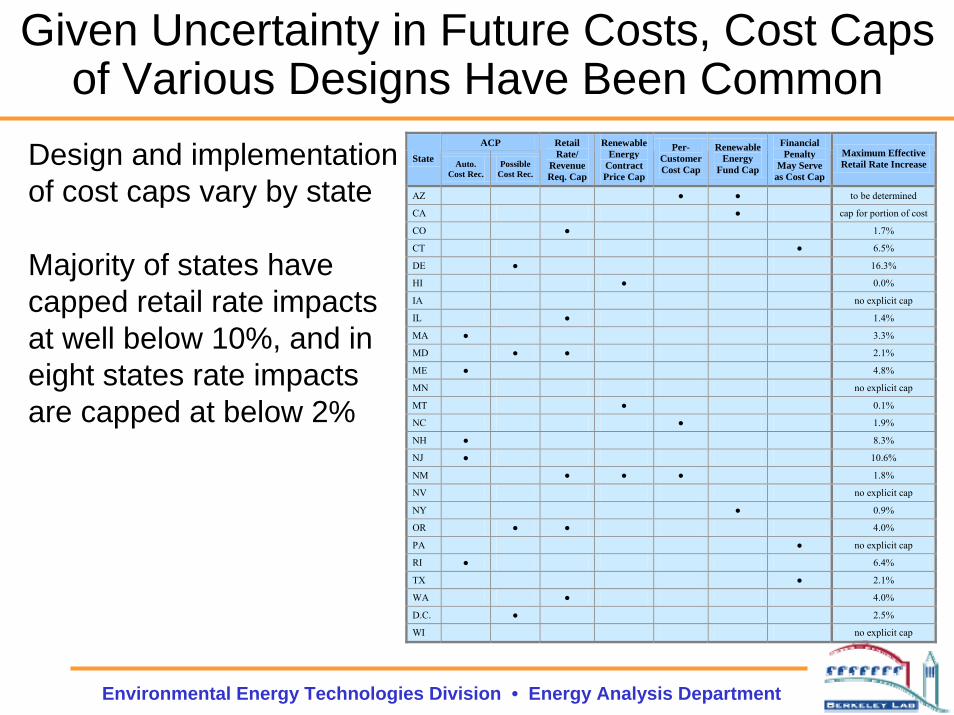
Given Uncertainty in Future Costs, Cost Caps of Various Designs Have Been Common
Design and implementation of cost caps vary by state
Majority of states have capped retail rate impacts at well below 10%, and in eight states rate impacts are capped at below 2%
ACP State Auto.
Cost Rec. Possible
Cost Rec.
Retail Rate/
Revenue Req. Cap
Renewable Energy
Contract Price Cap
Per-Customer Cost Cap
Renewable Energy
Fund Cap
Financial Penalty
May Serve as Cost Cap
Maximum Effective Retail Rate Increase
AZ ● ● to be determined
CA ● cap for portion of cost
CO ● 1.7%
CT ● 6.5%
DE ● 16.3%
HI ● 0.0%
IA no explicit cap
IL ● 1.4%
MA ● 3.3%
MD ● ● 2.1%
ME ● 4.8%
MN no explicit cap
MT ● 0.1%
NC ● 1.9%
NH ● 8.3%
NJ ● 10.6%
NM ● ● ● 1.8%
NV no explicit cap
NY ● 0.9%
OR ● ● 4.0%
PA ● no explicit cap
RI ● 6.4%
TX ● 2.1%
WA ● 4.0%
D.C. ● 2.5%
WI no explicit cap
Environmental Energy Technologies Division • Energy Analysis Department
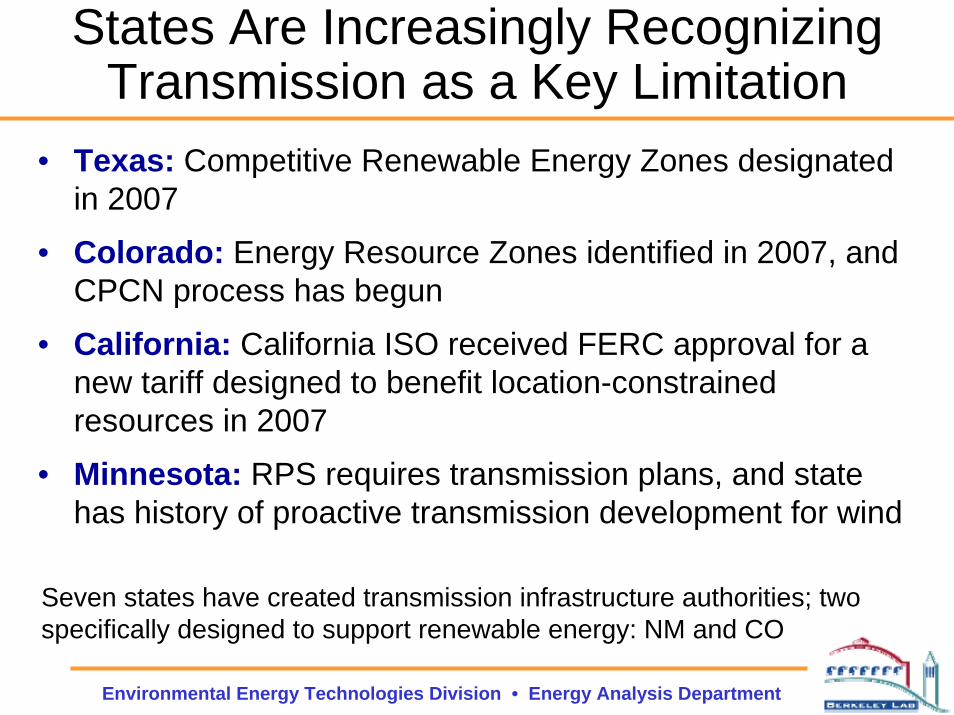
States Are Increasingly Recognizing Transmission as a Key Limitation
• Texas: Competitive Renewable Energy Zones designated in 2007
• Colorado: Energy Resource Zones identified in 2007, and CPCN process has begun
• California: California ISO received FERC approval for a new tariff designed to benefit location-constrained resources in 2007
• Minnesota: RPS requires transmission plans, and state has history of proactive transmission development for wind
Seven states have created transmission infrastructure authorities; two specifically designed to support renewable energy: NM and CO

Environmental Energy Technologies Division • Energy Analysis Department
Federal RPS Policies Have Received Consideration in the U.S. Congress
• Though Federal RPS proposals contain common design features, the specifics of each individual bill have varied
• U.S. Senate has passed a Federal RPS on three occasions since 2002
• U.S. House passed a Federal RPS for the first time in 2007
• Two chambers have yet to agree to a common approach, so a Federal RPS has not reached the President’s desk
Environmental Energy Technologies Division • Energy Analysis Department
Conclusions
• The popularity of state-level RPS policies has grown
• The importance of these programs for renewable energy is expected to build over the coming decade
• The design of these policies vary, and state implementation experience has been mixed
• Comparative experience of states that have and have not achieved substantial renewable energy growth highlight the importance of design details
• Emerging challenge is how to make changes to RPS programs without unduly destabilizing planning and investment decisions made under previous RPS designs

Environmental Energy Technologies Division • Energy Analysis Department
For More Information...
See full report for additional findings, a discussion of the sources of data used, etc.
• http://eetd.lbl.gov/ea/ems/re-pubs.html
To contact the primary authors:
• Ryan Wiser, Lawrence Berkeley National Laboratory 510-486-5474, [email protected]
• Galen Barbose, Lawrence Berkeley National Laboratory 510-495-2593 , [email protected]