Regional Thicknesses and Thickening of Compacted and...
39
Regional Thicknesses and Thickening of Compacted and Trabeculated Myocardial Layers of the Normal Left Ventricle Studied by Cardiovascular Magnetic Resonance Running Title: Dawson et al: Left Ventricular Trabeculation Dana K. Dawson, DM, MRCP, D.Phil, Senior Lecturer in Cardiovascular Medicine and Honorary Consultant Cardiologist, University of Aberdeen, Aberdeen, UK Alicia M. Maceira, MD, Consultant Cardiologist, ERESA-Cardiac Imaging Unit, Valencia, Spain Vimal J. Raj, MB BS, FRCR, Consultant Radiologist, Leicester Royal Infirmary, Leicester, UK Catriona Graham, MSc, BSc (hons), Lead Statistician at the Clinical Research Facility, Western General Hospital and University of Edinburgh, Edinburgh, UK Dudley J. Pennell, MD FRCP FACC FESC, Professor of Cardiology, National Heart and Lung Institute, Imperial College, London, UK Philip J. Kilner, MD, PhD, Consultant and Reader, Royal Brompton Hospital and the National Heart and Lung Institute, Imperial College, London, UK Correspondence to: Dana Dawson Royal Brompton Hospital Sydney Street London, SW3 6NP UK Tel: + 44 20 7352 8121 Fax: +44 20 7351 8816 E-mail: [email protected] Journal Subject Code: [30] MRI r Roy oy oy oy oy oy oyal al al l l al l I I I I I I Inf nf nf nf f f nfi i ir ir i i irma ma ma ma ma ma mary ry UK h h ern General Ho ital and Universit of Edinbur , Edinbu h, U nell, MD FRCP FACC FESC, Professor of Cardiology, National UK ham, MSc, BSc (hons), Lead Statis tician at the Clinical Research ern General Hospital and University of Edinburgh, Edinburgh, U nell, MD FRCP FACC FESC, Professor of Cardiology, National Lung Institute, Imperial College, London, UK by guest on June 11, 2018 http://circimaging.ahajournals.org/ Downloaded from by guest on June 11, 2018 http://circimaging.ahajournals.org/ Downloaded from by guest on June 11, 2018 http://circimaging.ahajournals.org/ Downloaded from by guest on June 11, 2018 http://circimaging.ahajournals.org/ Downloaded from by guest on June 11, 2018 http://circimaging.ahajournals.org/ Downloaded from by guest on June 11, 2018 http://circimaging.ahajournals.org/ Downloaded from by guest on June 11, 2018 http://circimaging.ahajournals.org/ Downloaded from by guest on June 11, 2018 http://circimaging.ahajournals.org/ Downloaded from by guest on June 11, 2018 http://circimaging.ahajournals.org/ Downloaded from
Transcript of Regional Thicknesses and Thickening of Compacted and...
Regional Thicknesses and Thickening of Compacted and Trabeculated
Myocardial Layers of the Normal Left Ventricle Studied by
Cardiovascular Magnetic Resonance
Running Title: Dawson et al: Left Ventricular Trabeculation
Dana K. Dawson, DM, MRCP, D.Phil, Senior Lecturer in Cardiovascular Medicine and Honorary Consultant Cardiologist, University of Aberdeen, Aberdeen, UK
Alicia M. Maceira, MD, Consultant Cardiologist, ERESA-Cardiac Imaging Unit, Valencia, Spain
Vimal J. Raj, MB BS, FRCR, Consultant Radiologist, Leicester Royal Infirmary, Leicester, UK
Catriona Graham, MSc, BSc (hons), Lead Statistician at the Clinical Research Facility, Western General Hospital and University of Edinburgh, Edinburgh, UK
Dudley J. Pennell, MD FRCP FACC FESC, Professor of Cardiology, National Heart and Lung Institute, Imperial College, London, UK
Philip J. Kilner, MD, PhD, Consultant and Reader, Royal Brompton Hospital and the National Heart and Lung Institute, Imperial College, London, UK
Correspondence to: Dana Dawson Royal Brompton Hospital Sydney Street London, SW3 6NP UK Tel: + 44 20 7352 8121 Fax: +44 20 7351 8816 E-mail: [email protected]
Journal Subject Code: [30] MRI
r Royoyoyoyoyoyoyalalalllall IIIIIIInfnfnfnfffnfiiiririiirmamamamamamamaryryUK
h hern General Ho ital and Universit of Edinbur , Edinbu h, U
nell, MD FRCP FACC FESC, Professor of Cardiology, National
UK
ham, MSc, BSc (hons), Lead Statistician at the Clinical Researchern General Hospital and University of Edinburgh, Edinburgh, U
nell, MD FRCP FACC FESC, Professor of Cardiology, NationalLung Institute, Imperial College, London, UK
by guest on June 11, 2018http://circim
aging.ahajournals.org/D
ownloaded from
by guest on June 11, 2018
http://circimaging.ahajournals.org/
Dow
nloaded from
by guest on June 11, 2018http://circim
aging.ahajournals.org/D
ownloaded from
by guest on June 11, 2018
http://circimaging.ahajournals.org/
Dow
nloaded from
by guest on June 11, 2018http://circim
aging.ahajournals.org/D
ownloaded from
by guest on June 11, 2018
http://circimaging.ahajournals.org/
Dow
nloaded from
by guest on June 11, 2018http://circim
aging.ahajournals.org/D
ownloaded from
by guest on June 11, 2018
http://circimaging.ahajournals.org/
Dow
nloaded from
by guest on June 11, 2018http://circim
aging.ahajournals.org/D
ownloaded from

Abstract
Background We used cardiovascular magnetic resonance (CMR) to study normal left
ventricular (LV) trabeculation as a basis for differentiation from pathological non-
compaction.
Methods and Results The apparent end diastolic (ED) and end systolic (ES) thicknesses
and thickening of trabeculated and compact myocardial layers were measured in 120
volunteers using a consistent selection of basal, mid and apical CMR short axis slices. All
had a visible trabeculated layer in one or more segments. The compact, but not the
trabeculated layer, was thicker in males than females (p<0.01 at ED and ES). When plotted
against age, the trabeculated and compact layer thicknesses demonstrated opposite changes:
increase of the compact layer after the fourth decade at both ED and ES (p<0.05), but a
decrease of the trabeculated layer. There was age-related preservation of total wall thickness
at ED but increase at ES (p<0.05). The compact layer thickened whereas the trabeculated
layer thinned with systole but neither change differed between sexes. With age, the most
trabeculated LV segments showed significantly greater systolic thinning of trabeculated
layers and conversely, greater thickening of the compact segments (p<0.05). Total wall
thickening is neither gender nor age-dependent. There were no gender differences in the
trabeculated/compact ratio at ES or ED, but the ES trabeculated/compact ratio was smaller in
older (50-79 years) versus younger groups (20-49 years), p<0.05.
Conclusions We demonstrated age and sex-related morphometric differences in the
apparent trabeculated and compact layer thicknesses, and systolic thinning of the visible
trabeculated layer that contrasts with compact myocardial wall thickening.
Key Words: trabeculae, myocardium, systolic thickening, non-compaction, contractility
ED and ES). WWWWWWWhh
monstrtrtrtrtrtrtratatatatata edededededeed oo o ooooppppppppppppppososoooo i
o )
r a
s b
ompact layer after the fourth decade at both ED and ES (p(( <0.05)
rabeculated layer. There was age-related preservation of total wa
se at ES (p(( <0.05). The compact layer thickened whereas the trab
by guest on June 11, 2018http://circim
aging.ahajournals.org/D
ownloaded from
Comparisons of heart structure between the classes of living vertebrates together with studies
of mammalian cardiogenesis suggest that a spongy, non-compact structure is the fundamental
state of vertebrate ventricular myocardium. The process of compaction is an acquired
characteristic in reptiles, birds and mammals. In human embryonic development, a compact
layer of myocardium appears and gains in relative thickness between the 6th and 12th week, as
ventricular septation is completed1. However, endocardial appearances on imaging or at post
mortem inspection2 show that mature human ventricles typically retain variable degrees of
endocardial trabeculation3 with structural and mechanical properties that differ from those of
the compact layer4, and with considerable further variation between ventricular regions. This
makes the definition of criteria for pathological left ventricular non-compaction (LVNC)
challenging and controversial5. As the current phenotypic definition of LVNC relies on the
ratio of Trabeculated/Compacted myocardium, it is essential to have a detailed description of
this ratio, and its variability, in the normal phenotype. In the current study, we used routine
Cardiovascular Magnetic Resonance (CMR) - to visualize the segmental incidence,
thicknesses and thickening of the visible trabeculated and compacted myocardial layers in a
prospectively recruited cohort of healthy volunteers.
Methods
a. Subjects: We recruited 120 normal volunteers (10 males, 10 females in 6 decile groups
between 20-80 years old). The baseline characteristics of this cohort has been previously
published6. The study was approved by the Royal Brompton Local Research Ethics
Committee and all subjects gave informed consent.
b. Imaging: All subjects underwent CMR imaging on a 1.5 T Siemens Sonata system. After
localizers, three long axis views and a complete short axis stack of balanced steady state free
nononononoonon-n-n-n-nnn cococococococompmpmpmpmpmpmpacacacacacacactitititititiiononononononon (( ( (( ( (
itionnnnnnn ofofofofofofof LLLLLLLVNVNVNVNVNVNVNCCCCCCC rerp yp
a
variability, in the normal phenotype. In the current study, we us
M netic Resonance (CMR) - to visualize the s mental incidenc
p yp
ated/Compacted myocardium, it is essential to have a detailed d
variability, in the normal phenotype. In the current study, we us
Magnetic Resonance (CMR) - to visualize the segmental incidenc
by guest on June 11, 2018http://circim
aging.ahajournals.org/D
ownloaded from
precession cine images were acquired. Sequence parameters included repetition time 3.2ms,
echo time 1.6ms, slice thickness 7mm, inter-slice gap 3mm, in-plane pixel size 2.1x1.3 mm,
flip angle 60 . Acquired pixels were routinely interpolated by the CMR system software
during image reconstruction.
c. Data analysis was performed in CMRTools (Imperial College, London). A consistent
selection of 3 designated short axis slices was applied throughout: the ‘basal’ slice measured
was 2 cm down from the most basal short axis slice, located on the ventricular side of the
atrio-ventricular junctions of both ventricles at end-diastole. The ‘apical’ slice was 2 cm up
from the most apical slice showing LV myocardium. The mid LV slice was equidistant in
between. Manual measurements of the apparent end-diastolic (ED) and end-systolic (ES)
thicknesses of the trabeculated and compacted layers in 16 of the standard 17 segments7,
excluding the true apex, were made for each subject. A schematic presentation of the
selection of slices corresponding to the basal, mid-ventricular and apical short axis,
myocardial segmentation and assignment to walls is presented in Figure 1a. The boundary
between compact and trabecular myocardium was chosen for each segment as the line outside
which no trabeculations were apparent (Figure 1b). Review in cine mode can help locate this
boundary (Movie 1). As the trabecular layer could only rarely be described as having a
uniform thickness in a particular segment, its thickness was measured from this boundary to
the peak of the most prominent trabeculae in each segment. Measurements were performed
by two independent, experienced observers for 6 patients to derive inter- and intra-observer
variability. Wall thickening was calculated separately for the trabecular and the compacted
layers and also for the total LV wall thickness by expressing the systolic increase of each
apparent thickness as a percentage of its apparent ED thickness.
EDED) ) ananananananand d ddddd enenenenenenend-d-d-d-d-d-d-sysysysysysysystststststststoo
e g
e apex, were made for each subject. A schematic presentation f
s corresponding to the basal, mid-ventricular and apical short ax
mentation and assignment to walls is presented in Figure 1a The
e trabeculated and compacted layers in 16 of the standard 17 seg
e apex, were made for each subject. A schematic presentation of
s corresponding to the basal, mid-ventricular and apical short ax
mentation and assignment to walls is presented in Figure 1a The
by guest on June 11, 2018http://circim
aging.ahajournals.org/D
ownloaded from

Statistical analysis was performed in MiniTab 15. Descriptive statistics are expressed as
mean±SD (or SEM) if normally distributed and as median (first, third quartile) if non-
parametric. 2 sample t-test, Mann Whitney, one way-ANOVA and Kruskall-Wallis tests were
used appropriately for parametric or non-parametrically distributed variables to determine
any differences with gender or age groups for each myocardial segment. Where analyses of
variance were significant, linear regression was also employed in order to confirm trends.
Variabilities were calculated as the difference divided by the mean of the two independently
measured variables, expressed as mean SD. Results were considered significant with a p
value <0.05.
Results
Segmental incidence of trabeculae
Figure 1 shows the incidence of an apparent trabecular layer in each segment at ED and ES.
A trabecular layer was visible in one or more segments in all 120 volunteers. Trabeculae were
prevalent in anterior and lateral segments at apical and mid-cavity levels, but usually absent
from septal segments. The apical lateral wall was the most commonly trabeculated territory,
followed by the mid and apical anterior wall, mid ventricular lateral wall and less so by the
inferior wall. No gender or age specific characteristic differences of trabecular distribution
were identified. Trabeculae were consistently more apparent at ED compared to ES. The
intra- and inter-observer variabilities are shown in Table 1.
Trabecular and Compacted layers thicknesses and their variation with gender and age
e
he incidence of an apparent trabecular layer in each segment at E
ence of trabeculae
he incidence of an apparent trabecular layer in each segment at E
by guest on June 11, 2018http://circim
aging.ahajournals.org/D
ownloaded from
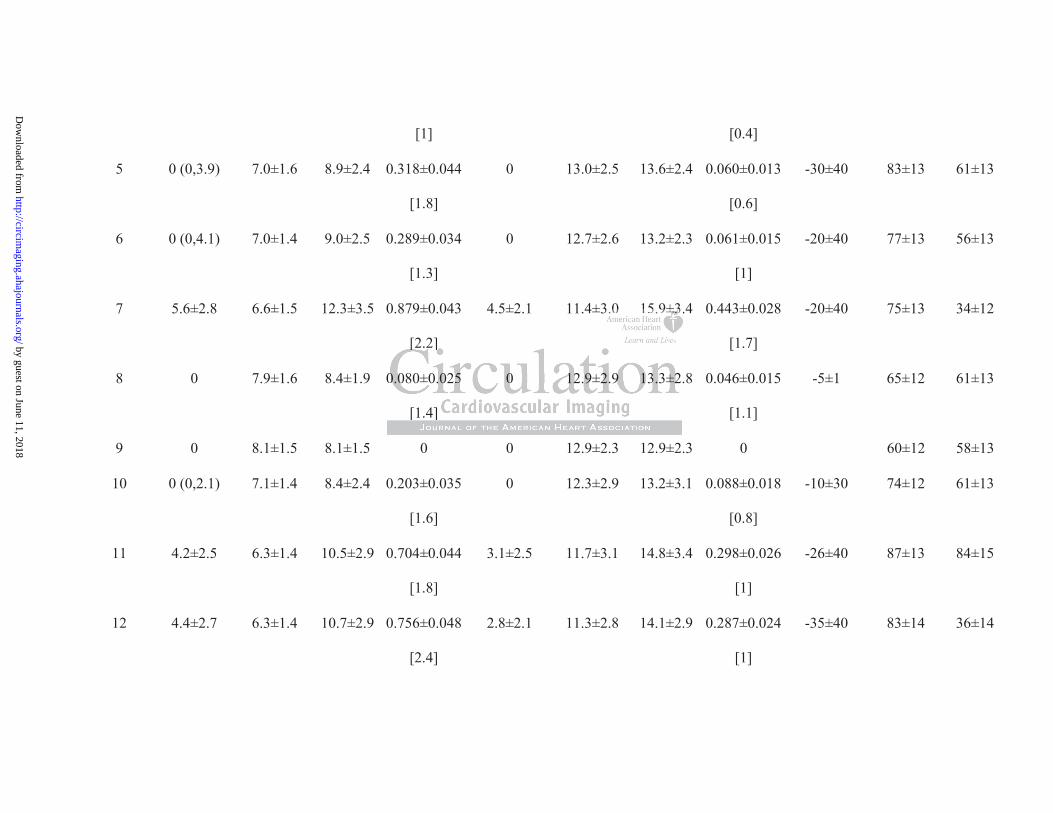
Table 2 presents the mean individual thicknesses of the trabecular and compact layers as well
as the full segmental wall thickness at ED and ES. The apical free wall was the only segment
where the average trabeculated layer exceeded the compact layer thickness, and only at ED.
There were significant gender differences when the thickness of the compacted layer was
compared, at both ES and ED (p<0.05 for all segments), but no gender differences were
found in trabecular layer thickness (p=ns). There were corresponding differences between
males and females in the total myocardial layer thickness, for both phases of the cardiac cycle
(p<0.05 for all segments) - Tables 3 and 4 in the Data Supplement.
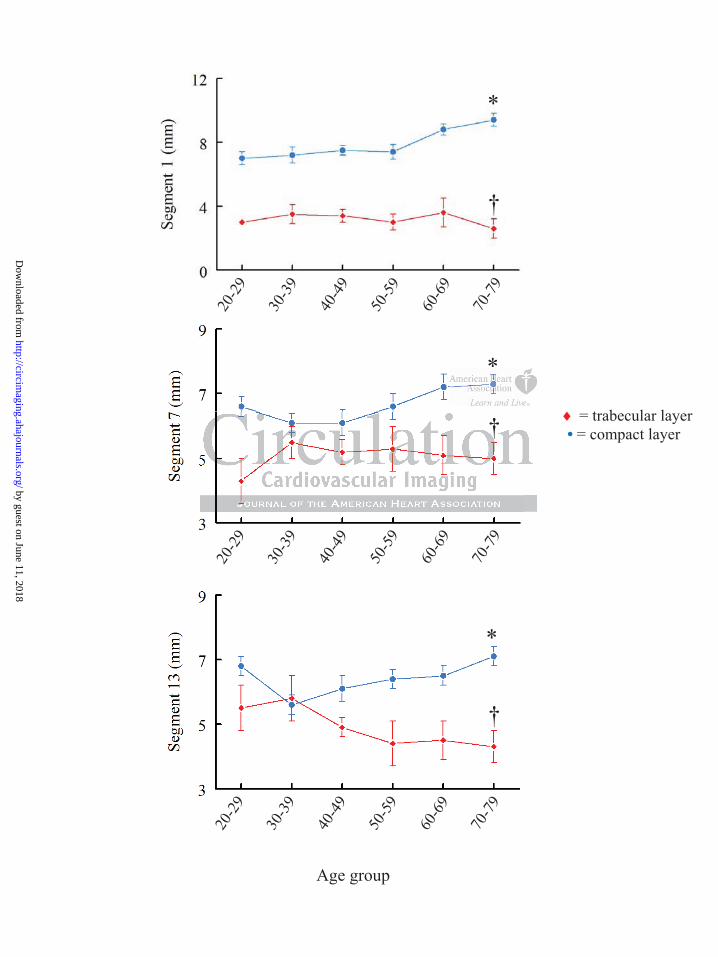
Figure 2 shows a representative age-related change of thickness of the compacted and
trabecular layers at ED (shown here for the anterior wall segments) and Figure 3 illustrates
corresponding findings at ES in the lateral wall. For all compacted myocardial segments the
pattern was similar, with a relatively higher thickness in the third decade of life, followed by
a slight decrease in thickness during the fourth decade and then progressive increase in each
age decile. The differences across age groups in the compact layer thickness measured at both
ED and ES were significant (p<0.05 for all segments). Age-related differences were also
found in the trabecular layer thickness with an opposite pattern of change compared to the
compacted layer, but these differences did not reach significance for all examined segments
(p<0.05 for segments 1, 7, 13, 16 at ED and p<0.05 for segments 1, 5, 6, 12, at ES, the
remaining segments demonstrating only a trend but p=ns).
The age group-related changes in the compacted and trabecular layers contributed to a small,
progressive increase in the total wall thickness measured at ES across age groups (p<0.05 for
all segments) but this difference was no longer apparent across all ED measurements (p<0.05
only for segments 1,7,13 and 16, p=ns for all the rest). Figure 4 demonstrates the ES and ED
of the compactctctctctctctedeeeeee
nts) anananananana d dd d d d FiFiFiFiFiFigugugugugugugurerererererer 3 3
ndings at ES in the lateral wall. For all compacted myocardial se
ar, with a relatively higher thickness in the third decade of life,
e
ndings at ES in the lateral wall. For all compacted myocardial se
ar, with a relatively higher thickness in the third decade of life,
in thickness during the fourth decade and then progressive incre
by guest on June 11, 2018http://circim
aging.ahajournals.org/D
ownloaded from

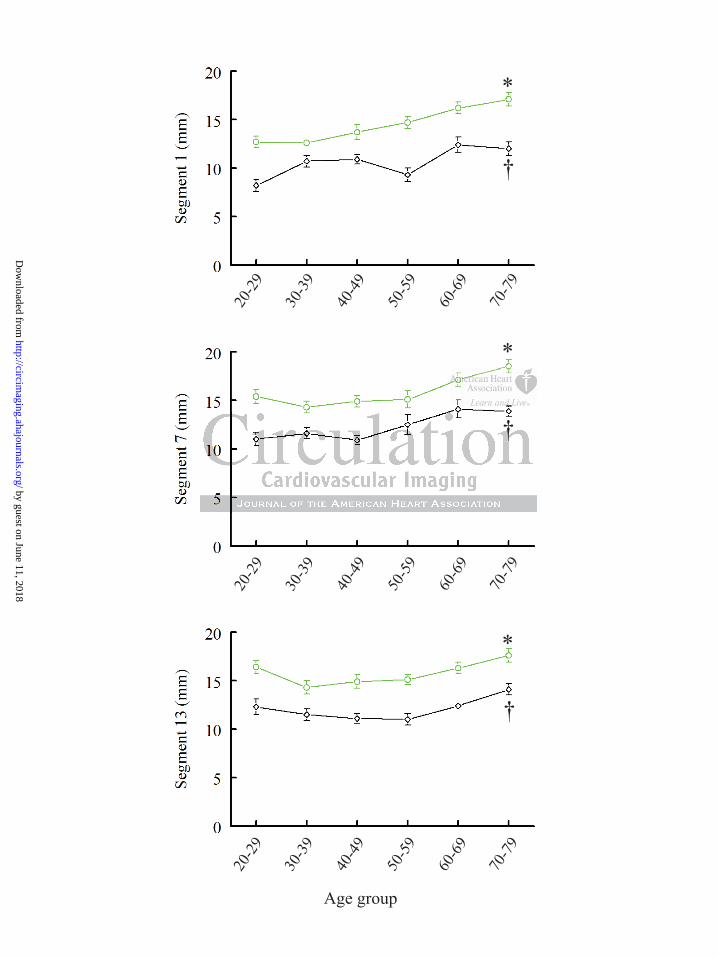
total wall thickness changes with age [shown for the anterior (4A) and lateral wall (4B)
segments].
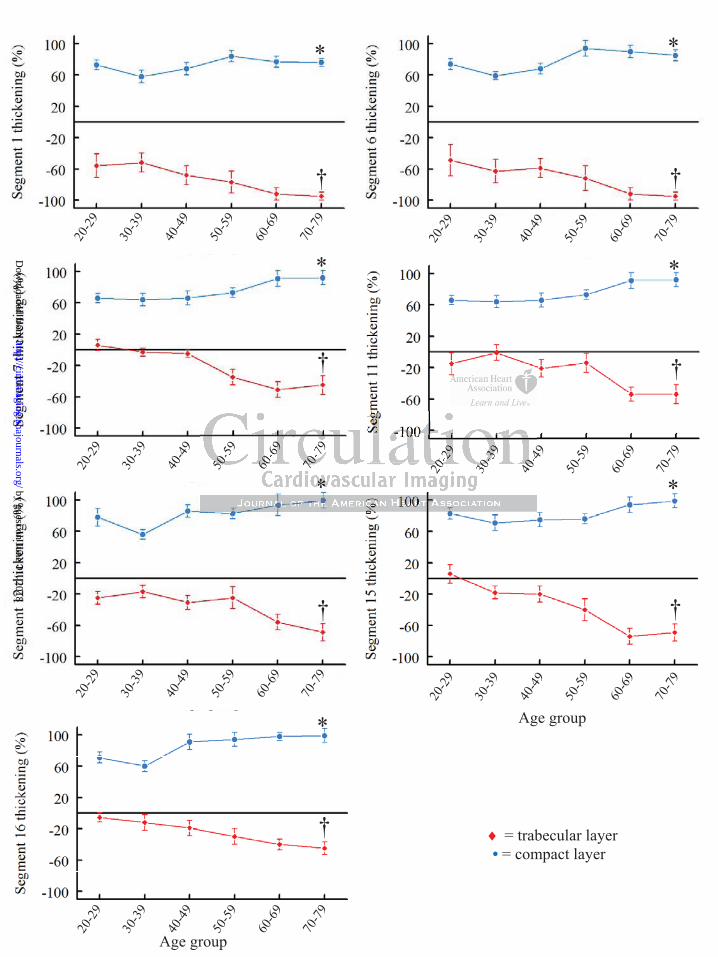
Changes of the Trabecular and Compacted layers during systolic contraction and patterns
of these changes with age
The apparent compact layer thickened relatively uniformly, by an average of 73±13%. In
contrast, the visible trabecular layer became thinner, generally making a negative
contribution to total radial thickening, which averaged 52±13% (individual segment analysis
shown in Table 2).
Neither the trabecular layer thinning nor the compact layer or total wall thickening were
different between sexes in any segment (p=ns) – Table 5, Data Supplement.
As regarding an age-related pattern in systolic changes, there were no significant differences
in thickening across age groups for the total myocardial layer (p=ns for all segments).
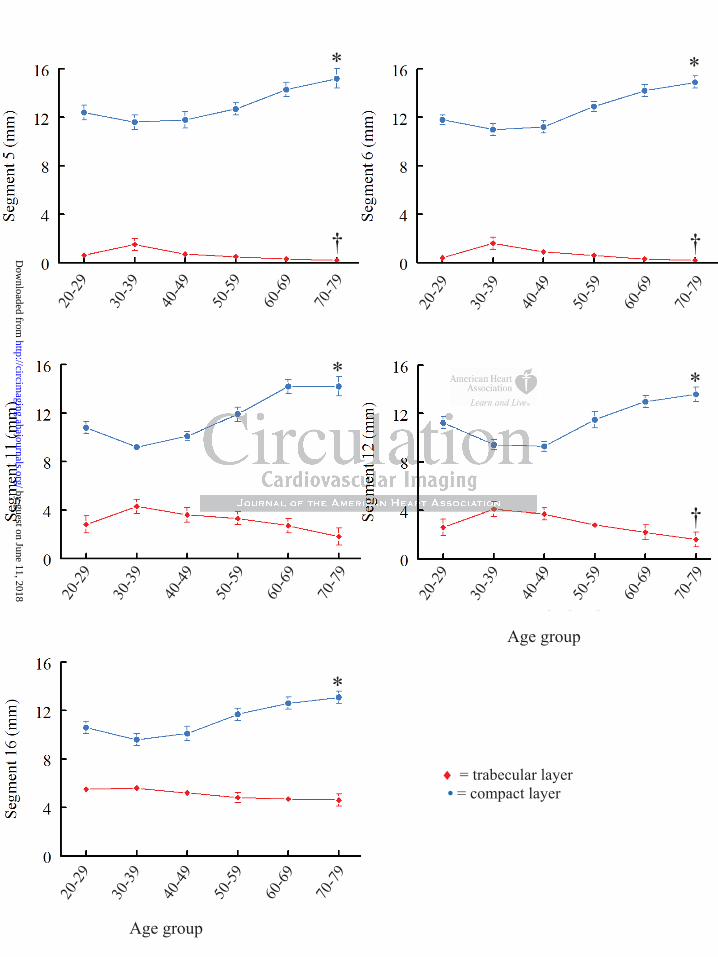
However, when the two components (trabecular and compacted layers) were examined
separately, once again an opposite pattern of change was observed. Figure 5 illustrates how
the systolic thinning of the trabecular layer was progressively greater with age (statistically
significant for segments 1, 6, 7, 11, 12, 15, 16, p<0.05, whereas the remaining segments
demonstrated only a trend in the same direction, p=ns). Conversely, as shown in Figure 5, the
systolic thickening of the compact layer was also progressively greater with age (statistically
significant for segments 1, 6, 7, 11, 12, 15, 16, p<0.05, the remaining segments
demonstrating only a trend which did not reach statistical significance). The segments where
the age-related patterns of thickening/thinning were significant were the most trabeculated
segments.
The trabecular/compacted layer ratio and its changes with cardiac cycle and age
tttttttalalalalalalal w wwwwwwalalalalalalall l lllll thththththththicicicicicicickekekekekekekeninininininininnnnnnn
S lllllll tttttttn sexes in any segment (p( ns) Table 5, Data Supplement.
a t
o e
the two components (trabecular and compacted layers) were exa
n sexes in any segment (p(( ns) Table 5, Data Supplement.
age-related pattern in systolic changes, thaa ere were no significant
oss age groups for the total myocardial layer (p(( =ns for all segme
the two components (trabecular and compacted layers) were exa
by guest on June 11, 2018http://circim
aging.ahajournals.org/D
ownloaded from
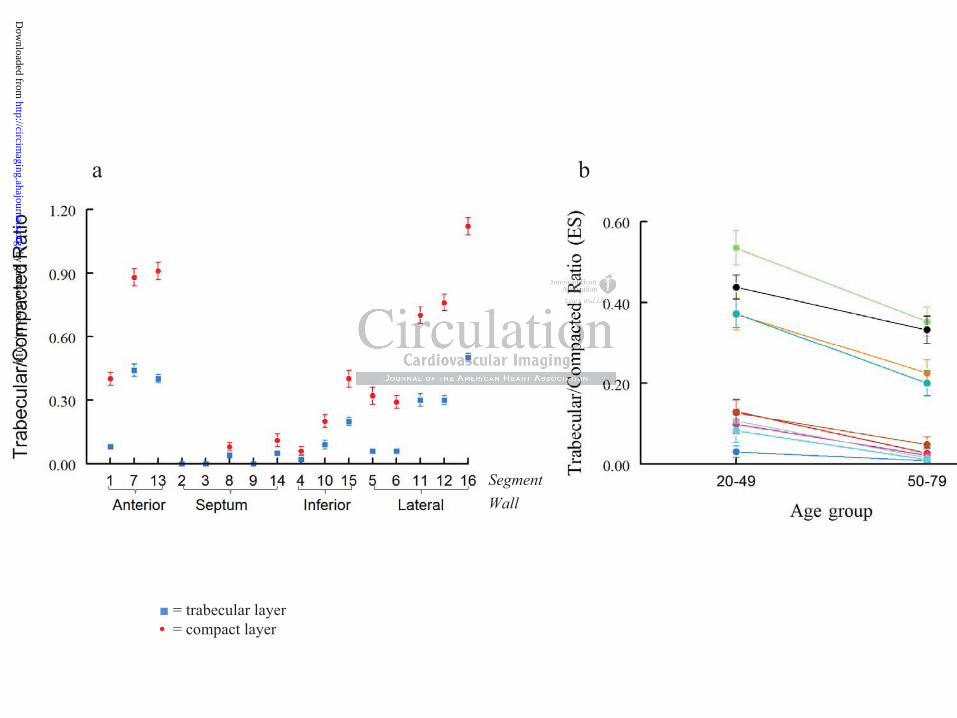
The ratio between the apparent trabecular and compacted layers changed markedly through
systole and diastole. At ED, the ratio was < 1 in all segments but the apical free wall. Of
note, 64% of the normal volunteers had an apical free wall trabecular layer at least as thick as
the compacted layer, 4 volunteers had an ED trabecular/compacted ratio higher than 2, one
being higher than 2.3 (the highest trabecular/compacted ratio recorded in the cohort across all
segments was 3) – see Table 2. At ES, the ratio was <0.5 in all segments with the exception
of the apical free wall. Figure 6a shows the trabecular/compacted ratio for all segments.
There were no gender differences when the trabecular/compacted ratio was compared, either
at ES or ED – data in Tables 3 and 4, Data Supplement. There were no age-related trends in
the trabecular/compacted ratio at ED (p=ns, graphs not shown). However, the
trabecular/compacted ratio at ES was significantly smaller in the older groups (50-79 years)
versus the younger groups (20-49 years), p<0.05 for all trabeculated segments – as shown in
Figure 6b.
Papillary muscles and false tendons
Papillary muscle heads were seen during both diastole and systole (minimum-maximum
number of heads for the antero-lateral and postero-medial respectively): at basal level 0-4/0-
3, mid-ventricular level 0-4/0-5 and at apical level 0-4/0-3. There were 14 false tendons, most
of them located at basal LV level and in the anterior wall.
Discussion
In this study we use CMR to determine the segmental incidence of a trabeculated layer and
the apparent thickness and thickening of the trabecular, compacted and total myocardial
layers of the LVs of a prospectively recruited cohort of healthy volunteers. The main and
HoHoHoHoHoHoHowewewewewewewevevevevevevever,r,r,r,r,r,r, t t ttttthehehehehehehe
e oldedededededederrrrrrr grgrgrgrgrgrgrouououououououpspspspspspsps (((((((505g y g p (
e f
g y g p (
er groups (20-49 years), p<0.05 for all trabeculated segments –
es and false tendons
by guest on June 11, 2018http://circim
aging.ahajournals.org/D
ownloaded from

novel findings of this study are: 1) the prevalence and extent of trabeculated subendocardial
regions in healthy individuals, 2) the apparent systolic thinning of the trabeculated layer in
contrast to the marked thickening of the compact layer during contraction, and 3) specific
age- and gender-related differences in the absolute and proportional thicknesses of these
layers at ES and ED.
We chose to make linear measurements in routine short axis CMR cines for several reasons:
This approach is practical for retrospective analysis of routinely acquired CMR studies, it
lends itself to segmental analysis, and the measurements can be compared directly with
previously proposed echocardiographic criteria for LVNC2,8. We also believe that the short
axis slices orientation is preferable to long axis for technical reasons: as the orientations of
LV trabeculations tend to be predominantly longitudinal, CMR short axis cines seemed more
suitable for distinguishing the trabeculated from the compacted layers than long axis cines, as
studied previously9. Due to the elongated shape of voxels constituting a cine image, short
axis images should be less prone to blurring of boundaries due to partial volume averaging10.
However, disadvantages of short axis slices include systolic through-plane myocardial
movement, particularly relative to the basal slices, and the varying number of slices needed to
cover ventricles of different sizes. For the latter reason, a consistent approach of slice
selection was applied, regardless of ventricular size.
The compact myocardial layer was consistently thicker across all segments in males
compared to females and this relative difference was maintained throughout the cardiac
cycle. The compact myocardial layer was slightly thicker during the third decade of life, a
slight decrease in thickness was observed during the fourth decade, after which it
progressively increased until the eighth decade. These patterns suggestive of exercise
conditioning/deconditioning at identical time-points were also suggested by the Framingham
sonsnssssss: :: ::: : asasasasasasas ttt t tt thehehehehehehe o ooo o o oriririririririenenenenenenen
s tend to be predominant lon tudina CMR short axis cines s
nguishing the trabeculated from the compacted layers than long a
l a
u p g p
s tend to be predominantly longitudinal, CMR short axis cines s
nguishing the trabeculated from the compacted layers than long a
ly9. Due to the elongated shape of voxels constituting a cine ima
uld be less prone to blurring of boundaries due to partial volume
by guest on June 11, 2018http://circim
aging.ahajournals.org/D
ownloaded from

cohort analysis11. The trabecular layer measurements showed an opposite trend for change
with age. As it is unlikely that trabeculae would continue to compact in adult life, the obvious
explanation of our results is that these changes are due to age-related trabecular physiologic
hypertrophy. Because of hypertrophy, the interstices between the more epicardial trabeculae
may become excluded, this region then appearing and being measured as compacted.
However, no significant changes in the total myocardial layer thickness at ED were detected
with increasing age, which suggests that the true compact layer may remain relatively
unchanged over time. These results are consistent with our previous results6 and with those of
others12 who found no change with age in total LV mass measured from ED frames. These
findings can also be reconciled with previous Echocardiography studies which used LV wall
thicknesses to derive changes in LV mass over time and concluded that there was a temporal
increase in LV mass with age13,14. Due to the narrow ultrasound beam thickness (< 5mm) and
noise, fine structures of various curvature and orientation such as trabeculations are less well
resolved by the spatial resolution of trans-thoracic 2D-Echocardiography and it is most likely
that the perceived endocardial border on native echocardiography images was equivalent to
our interpretation of apparent compact layer boundary. This is supported by the finding of
larger ED volumes when LV opacification contrast agents were used versus smaller ED
volumes resulting from native echocardiography images15. The age-related hypertrophy of
the trabecular layer after the fourth decade translating into a progressively thicker effective
compact layer may be a necessary adaptation to maintain a constant myocardial wall stress,
consistent with previously described age-related increases in both systolic and diastolic blood
pressure after the fourth decade in healthy volunteers16. The concept of trabecular layer
hypertrophy as a physiological phenomenon and the bi-phasic pattern of this hypertrophy has
not been known to date.
yyyy s sssssstututututututudididididididieseseseseseses w w wwwwwhihihihihihihichchchchchchch u uu u u uussssss
ded ttttttthahahahahahahattttttt thththththththererererererereeeeeee wawwwwww sg
m (
u a
p
g
mass with age13,14. Due to the narrow ultrasound beam thickness (
ures of various curvature and orientation such as trabeculations a
patial resolution of trans-thoracic 2D-Echocardiography and it i
by guest on June 11, 2018http://circim
aging.ahajournals.org/D
ownloaded from
With the systolic thickening and approximation of individual trabeculations, the apparent
boundary between trabecular and compact layers may shift relative to actual myocardial
structures as visible interstices are eliminated. Part of the diastolic trabeculated layer may
thus appear compact at end systole. This would account in part for the apparent systolic
thinning of the trabeculated layer, and the relatively high measurements made from CMR
cine images of the apparent thickening of the compact layer, which exceeded previously
reported measurements of axially directed strain based on CMR myocardial tagging17. The
subendocardial myocytes are predominantly longitudinally orientated. They must,
individually, thicken in cross section as they contract if they maintain their volume, in spite
of the fact that the endocardial circumference is forced by the contraction of the more
circularly oriented mid-myocardial layers to diminish in systole18. This points to the
potential mechanical advantage, in the endocardium, of a trabeculated rather than compact
myocardial structure. With interstices between, not only the systolic thickening of myocytes,
but also the circumferential shortening of the endocardium can be accommodated by the
exclusion of intervening blood.
This interpretation is potentially relevant to the issue of diagnosing pathological LVNC in the
presence of dilated cardiomyopathy19. An abnormally high trabeculated relative to compact
myocardial layer thickness may, at least in part, be a result and not necessarily a cause of
dilatation. The global stretching of the dilated ventricular wall is likely to be associated with
greater than normal separation of the trabeculations, from one another and possibly from the
abnormally thin compact myocardial layer. Furthermore, the excessive wall tension relative
to trans-mural pressure of a dilated heart tends, according to LaPlace’s law, to result in
pathologic hypertrophy, presumably of trabecular as well as compact myocardium. These
effects would shift the ratio of visibly trabeculated to compact myocardial thickness towards
the apparently non-compacted in any cardiomyopathy that results in global dilatation.
oooooontntntntntntntrararararararactctctctctctctioioioioioioion n n n n n n ofofofofofofof t tttttthehehehehehehe mm m mm m m
e18 TTTTTTThihihihihihihisssssss popopopopopopoininininininintststststststs toy y y p
n n
t o
umferential shortenin of the endocardium can be accommodat d
y y y p
nical advantage, in the endocardium, of a trabeculated rather than
ture. With interstices between, not only the systolic thickening o
umferential shortening of the endocardium can be accommodated
by guest on June 11, 2018http://circim
aging.ahajournals.org/D
ownloaded from
Finally, there were no significant changes either related to gender or age when the ratio of
trabecular/compacted myocardium was examined at ED. Importantly, a ratio less than 1 in all
segments except the apical lateral wall appears to characterize the human volunteer cohort –
this may have important implications in defining segmental LVNC. The
trabecular/compacted ratio was significantly greater at ES in the young age groups compared
to the older ones; this may have implications for the choice of cardiac phase2,8,9 for
discriminating normal from non-compacted LVs. The differentiation may be easier in
segments with abundant rather than sparse trabecular preservation.
Study limitations: Cardiac CT could have offered better spatial resolution and isotropic
voxel size compared to CMR. However, even with modern protocols, the radiation dose
involved could not be justified in the case of volunteers. Due to the same spatial resolution
constraints we could not include segment 17 in our analysis.
Conclusions: These results give novel insight into the prevalence, segmental distribution,
dynamics and likely functional role of a trabecular myocardial layer. We demonstrate for the
first time age and sex related morphometric differences in the apparent trabecular and
compact layer thicknesses which in turn contribute differently to the total wall thickening.
ocololololololols,s,s,s,s,s,s, t t t t t tthehehehehehehe r r r r r rradadadadadadadiaiaiaiaiaiaiatitititititiiooooooo
ot be stified in the case of volunteers. Due to the same spatial
o
hese results give novel insight into the prevalence, segmental d
ot be justified in the case of volunteers. Due to the same spatial
ould not include segment 17 in our analysis.
hese results give novel insight into the prevalence, segmental dis
by guest on June 11, 2018http://circim
aging.ahajournals.org/D
ownloaded from
Sources of Funding
Dr. Dana Dawson was the recipient of the van Geest Advanced Imaging Fellowship (UK). Dr.
Philip Kilner is supported by the British Heart Foundation. The study was supported by the
National Institutes of Health Research Cardiovascular Biomedical Research Unit at the Royal
Brompton and Harefield NHS Foundation Trust and Imperial College.
Disclosures
None.
by guest on June 11, 2018http://circim
aging.ahajournals.org/D
ownloaded from

References
1. Wessels, A. and Sedmera, D.,Wessels, A. and Sedmera, D., Developmental anatomy
of the heart: a tale of mice and man. Physiol Genomics. 2003;15:165-176.
2. Jenni, R., Oechslin, E., Schneider, J., Attenhofer, Jost C., and Kaufmann, P. A.,Jenni,
R., Oechslin, E., Schneider, J., Attenhofer, Jost C., and Kaufmann, P. A.,
Echocardiographic and pathoanatomical characteristics of isolated left ventricular
non-compaction: a step towards classification as a distinct cardiomyopathy. Heart.
2001;86:666-671.
3. Weinsaft, J. W., Cham, M. D., Janik, M., Min, J. K., Henschke, C. I., Yankelevitz, D.
F., and Devereux, R. B.,Weinsaft, J. W., Cham, M. D., Janik, M., Min, J. K.,
Henschke, C. I., Yankelevitz, D. F., and Devereux, R. B., Left ventricular papillary
muscles and trabeculae are significant determinants of cardiac MRI volumetric
measurements: effects on clinical standards in patients with advanced systolic
dysfunction. Int.J Cardiol. 2008;126:359-365.
4. Damon, B. J., Remond, M. C., Bigelow, M. R., Trusk, T. C., Xie, W., Perucchio, R.,
Sedmera, D., Denslow, S., and Thompson, R. P.,Damon, B. J., Remond, M. C.,
Bigelow, M. R., Trusk, T. C., Xie, W., Perucchio, R., Sedmera, D., Denslow, S., and
Thompson, R. P., Patterns of muscular strain in the embryonic heart wall. Dev.Dyn.
2009;238:1535-1546.
5. Kohli, Sanjay K., Pantazis, Antonios A., Shah, Jaymin S., Adeyemi, Benjamin,
Jackson, Gordon, McKenna, William J., Sharma, Sanjay, and Elliott, Perry M.,Kohli,
J. W., Cham, M. D., Janik, M., Min, J. K., Henschke, C. I., Y n
evereux R. B Weinsaft J. W Cha M. D. Jani M Min J.
e r
d t b l i ifi t d t i t f di MRI l
J. W., Cham, M. D., Janik, M., Min, J. K., Henschke, C. I., Yan
evereux, R. B.,Weinsaft, J. W., Cham, M. D., Janik, M., Min, J.
e, C. I., Yankelevitz, D. F., and Devereux, R. B., Left ventricular
d t b l i ifi t d t i t f di MRI l
by guest on June 11, 2018http://circim
aging.ahajournals.org/D
ownloaded from
Sanjay K., Pantazis, Antonios A., Shah, Jaymin S., Adeyemi, Benjamin, Jackson,
Gordon, McKenna, William J., Sharma, Sanjay, and Elliott, Perry M., Diagnosis of
left-ventricular non-compaction in patients with left-ventricular systolic dysfunction:
time for a reappraisal of diagnostic criteria? Eur Heart J. 2008;29:89-95.
6. Maceira, A. M., Prasad, S. K., Khan, M., and Pennell, D. J.,Maceira, A. M., Prasad, S.
K., Khan, M., and Pennell, D. J., Normalized left ventricular systolic and diastolic
function by steady state free precession cardiovascular magnetic resonance. J
Cardiovasc Magn Reson. 2006;8:417-426.
7. Cerqueira, M. D., Weissman, N. J., Dilsizian, V., Jacobs, A. K., Kaul, S., Laskey, W.
K., Pennell, D. J., Rumberger, J. A., Ryan, T., and Verani, M. S.,Cerqueira, M. D.,
Weissman, N. J., Dilsizian, V., Jacobs, A. K., Kaul, S., Laskey, W. K., Pennell, D. J.,
Rumberger, J. A., Ryan, T., and Verani, M. S., Standardized myocardial segmentation
and nomenclature for tomographic imaging of the heart: a statement for healthcare
professionals from the Cardiac Imaging Committee of the Council on Clinical
Cardiology of the American Heart Association. Circulation. 2002;105:539-542.
8. Chin, T. K., Perloff, J. K., Williams, R. G., Jue, K., and Mohrmann, R.,Chin, T. K.,
Perloff, J. K., Williams, R. G., Jue, K., and Mohrmann, R., Isolated noncompaction of
left ventricular myocardium. A study of eight cases. Circulation. 1990;82:507-513.
9. Petersen, Steffen E., Selvanayagam, Joseph B., Wiesmann, Frank, Robson, Matthew
D., Francis, Jane M., Anderson, Robert H., Watkins, Hugh, and Neubauer,
Stefan,Petersen, Steffen E., Selvanayagam, Joseph B., Wiesmann, Frank, Robson,
Matthew D., Francis, Jane M., Anderson, Robert H., Watkins, Hugh, and Neubauer,
, A. K.K.K.K.K.K.K., , , , , , , KaKaKaKaKaKaKaululululululul, , , , , , , SSSSS.S.S ,
ell, D. J., Rumberger, J. A., Ryan, T., and Verani, M. S.,Cerque r
n, N. J., Dilsizian, V., Jacobs, A. K., Kaul, S., Laskey, W. K., e
er, J. A., an, T., and Verani, M. S., Standardized ocardial s
ell, D. J., Rumberger, J. A., Ryan, T., and Verani, M. S.,Cerqueir
n, N. J., Dilsizian, V., Jacobs, A. K., Kaul, S., Laskey, W. K., Pe
er, J. A., Ryan, T., and Verani, M. S., Standardized myocardial s
by guest on June 11, 2018http://circim
aging.ahajournals.org/D
ownloaded from
Stefan, Left Ventricular Non-Compaction: Insights From Cardiovascular Magnetic
Resonance Imaging. Journal of the American College of Cardiology. 2005;46:101-
105.
10. Chan, K. M., Wage, R., Symmonds, K., Rahman-Haley, S., Mohiaddin, R. H., Firmin,
D. N., Pepper, J. R., Pennell, D. J., and Kilner, P. J.,Chan, K. M., Wage, R.,
Symmonds, K., Rahman-Haley, S., Mohiaddin, R. H., Firmin, D. N., Pepper, J. R.,
Pennell, D. J., and Kilner, P. J., Towards comprehensive assessment of mitral
regurgitation using cardiovascular magnetic resonance. J Cardiovasc Magn Reson.
2008;10:61.
11. Savage, D. D., Levy, D., Dannenberg, A. L., Garrison, R. J., and Castelli, W.
P.,Savage, D. D., Levy, D., Dannenberg, A. L., Garrison, R. J., and Castelli, W. P.,
Association of echocardiographic left ventricular mass with body size, blood pressure
and physical activity (the Framingham Study). Am.J Cardiol. 1990;65:371-376.
12. Sandstede, J., Lipke, C., Beer, M., Hofmann, S., Pabst, T., Kenn, W., Neubauer, S.,
and Hahn, D.,Sandstede, J., Lipke, C., Beer, M., Hofmann, S., Pabst, T., Kenn, W.,
Neubauer, S., and Hahn, D., Age- and gender-specific differences in left and right
ventricular cardiac function and mass determined by cine magnetic resonance
imaging. Eur Radiol. 2000;10:438-442.
13. Shub, C., Klein, A. L., Zachariah, P. K., Bailey, K. R., and Tajik, A. J.,Shub, C.,
Klein, A. L., Zachariah, P. K., Bailey, K. R., and Tajik, A. J., Determination of left
ventricular mass by echocardiography in a normal population: effect of age and sex in
addition to body size. Mayo Clin Proc. 1994;69:205-211.
D. D., Levy, D., Dannenberg, A. L., Garrison, R. J., and Castell ,
e, D. D., Levy, D., Dannenberg, A. L., Garrison, R. J., and Caste
o
D. D., Levy, D., Dannenberg, A. L., Garrison, R. J., and Castelli,
e, D. D., Levy, D., Dannenberg, A. L., Garrison, R. J., and Caste
on of echocardiographic left ventricular mass with body size, bl
by guest on June 11, 2018http://circim
aging.ahajournals.org/D
ownloaded from
14. Gerstenblith, G., Frederiksen, J., Yin, F. C., Fortuin, N. J., Lakatta, E. G., and
Weisfeldt, M. L.,Gerstenblith, G., Frederiksen, J., Yin, F. C., Fortuin, N. J., Lakatta,
E. G., and Weisfeldt, M. L., Echocardiographic assessment of a normal adult aging
population. Circulation. 1977;56:273-278.
15. Hoffmann, Rainer, von Bardeleben, Stephan, ten Cate, Folkert, Borges, Adrian C.,
Kasprzak, Jaroslaw, Firschke, Christian, Lafitte, Stephane, Al-Saadi, Nidal, Kuntz-
Hehner, Stefanie, Engelhardt, Marc, Becher, Harald, and Vanoverschelde, Jean
Louis,Hoffmann, Rainer, von Bardeleben, Stephan, ten Cate, Folkert, Borges, Adrian
C., Kasprzak, Jaroslaw, Firschke, Christian, Lafitte, Stephane, Al-Saadi, Nidal,
Kuntz-Hehner, Stefanie, Engelhardt, Marc, Becher, Harald, and Vanoverschelde, Jean
Louis, Assessment of systolic left ventricular function: a multi-centre comparison of
cineventriculography, cardiac magnetic resonance imaging, unenhanced and contrast-
enhanced echocardiography. Eur Heart J. 2005;26:607-616.
16. Pearson, J. D., Morrell, C. H., Brant, L. J., Landis, P. K., and Fleg, J. L.,Pearson, J.
D., Morrell, C. H., Brant, L. J., Landis, P. K., and Fleg, J. L., Age-associated changes
in blood pressure in a longitudinal study of healthy men and women. J Gerontol.A
Biol Sci.Med Sci. 1997;52:M177-M183.
17. Rademakers, F. E., Rogers, W. J., Guier, W. H., Hutchins, G. M., Siu, C. O.,
Weisfeldt, M. L., Weiss, J. L., and Shapiro, E. P.,Rademakers, F. E., Rogers, W. J.,
Guier, W. H., Hutchins, G. M., Siu, C. O., Weisfeldt, M. L., Weiss, J. L., and Shapiro,
E. P., Relation of regional cross-fiber shortening to wall thickening in the intact heart.
Three-dimensional strain analysis by NMR tagging. Circulation. 1994;89:1174-1182.
pphahahhhh neneeeeee, , ,,,, AlAlAlAlAlAlAl-SSaaaaaaaaaadididididididi,,,,, , , NN
ald, anananananananddddddd VaVaVaVaVaVaVanononononononovevevevevevv rs
ssessment of systolic left ventricular function: a multi-centre com
iculography, cardiac magnetic resonance imaging, unenhanced a
ssessment of systolic left ventricular function: a multi-centre com
iculography, cardiac magnetic resonance imaging, unenhanced a
echocardiography. Eur Heart J. 2005;26:607-616. JJ
by guest on June 11, 2018http://circim
aging.ahajournals.org/D
ownloaded from
18. Bogaert, J. and Rademakers, F. E.,Bogaert, J. and Rademakers, F. E., Regional
nonuniformity of normal adult human left ventricle. Am.J Physiol Heart Circ Physiol.
2001;280:H610-H620.
19. Sengupta, P. P., Mohan, J. C., Mehta, V., Jain, V., Arora, R., Pandian, N. G., and
Khandheria, B. K.,Sengupta, P. P., Mohan, J. C., Mehta, V., Jain, V., Arora, R.,
Pandian, N. G., and Khandheria, B. K., Comparison of echocardiographic features of
noncompaction of the left ventricle in adults versus idiopathic dilated cardiomyopathy
in adults. Am.J Cardiol. 2004;94:389-391.
by guest on June 11, 2018http://circim
aging.ahajournals.org/D
ownloaded from
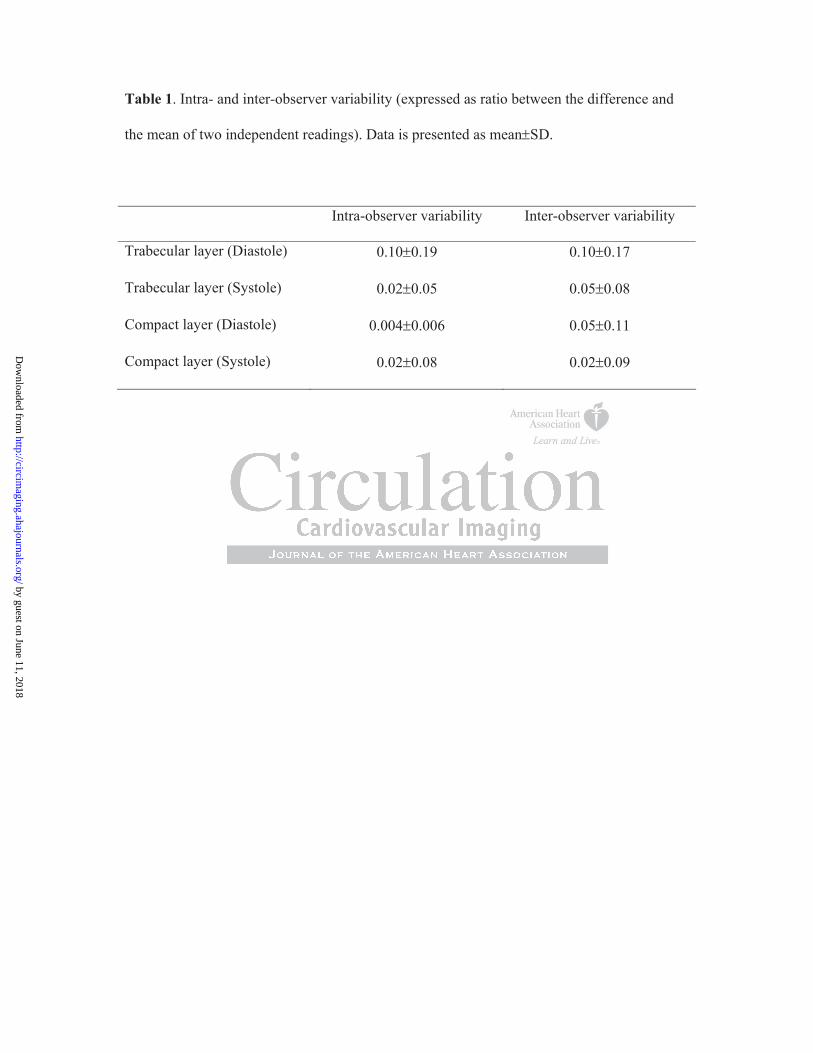
Table 1. Intra- and inter-observer variability (expressed as ratio between the difference and
the mean of two independent readings). Data is presented as mean SD.
Intra-observer variability Inter-observer variability
Trabecular layer (Diastole) 0.10 0.19 0.10 0.17
Trabecular layer (Systole) 0.02 0.05 0.05 0.08
Compact layer (Diastole) 0.004 0.006 0.05 0.11
Compact layer (Systole) 0.02 0.08 0.02 0.09
by guest on June 11, 2018http://circim
aging.ahajournals.org/D
ownloaded from
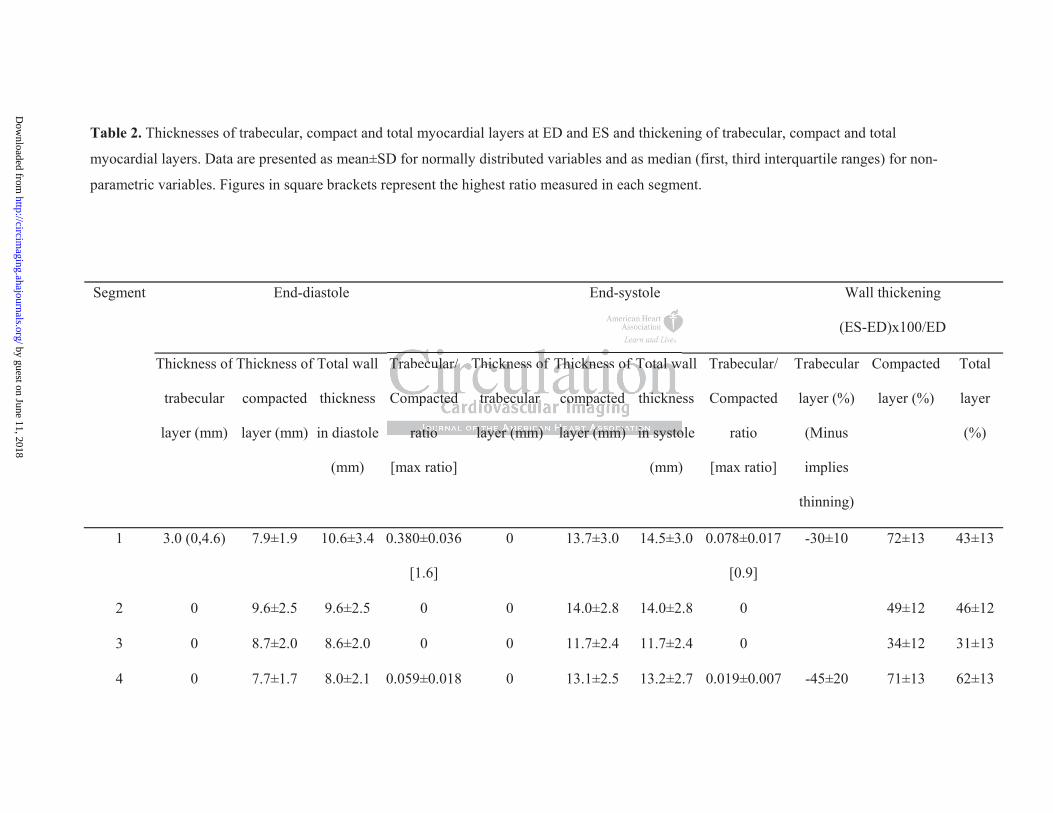
Table 2. Thicknesses of trabecular, compact and total myocardial layers at ED and ES and thickening of trabecular, compact and total
myocardial layers. Data are presented as mean±SD for normally distributed variables and as median (first, third interquartile ranges) for non-
parametric variables. Figures in square brackets represent the highest ratio measured in each segment.
End-diastole End-systole Wall thickening
(ES-ED)x100/ED
Segment
Thickness of
trabecular
layer (mm)
Thickness of
compacted
layer (mm)
Total wall
thickness
in diastole
(mm)
Trabecular/
Compacted
ratio
[max ratio]
Thickness of
trabecular
layer (mm)
Thickness of
compacted
layer (mm)
Total wall
thickness
in systole
(mm)
Trabecular/
Compacted
ratio
[max ratio]
Trabecular
layer (%)
(Minus
implies
thinning)
Compacted
layer (%)
Total
layer
(%)
1 3.0 (0,4.6) 7.9±1.9 10.6±3.4 0.380±0.036
[1.6]
0 13.7±3.0 14.5±3.0 0.078±0.017
[0.9]
-30±10 72±13 43±13
2 0 9.6±2.5 9.6±2.5 0 0 14.0±2.8 14.0±2.8 0 49±12 46±12
3 0 8.7±2.0 8.6±2.0 0 0 11.7±2.4 11.7±2.4 0 34±12 31±13
4 0 7.7±1.7 8.0±2.1 0.059±0.018 0 13.1±2.5 13.2±2.7 0.019±0.007 -45±20 71±13 62±13
ratio layer (mm) layer (mm) in systo
Trabecular/
Compacted
ratio
Thickness of
trabecular
layer (mm)
Thickness of
compacted
layer (mm)
Total w
thickne
in systo
by guest on June 11, 2018http://circim
aging.ahajournals.org/D
ownloaded from
[1] [0.4]
5 0 (0,3.9) 7.0±1.6 8.9±2.4 0.318±0.044
[1.8]
0 13.0±2.5 13.6±2.4 0.060±0.013
[0.6]
-30±40 83±13 61±13
6 0 (0,4.1) 7.0±1.4 9.0±2.5 0.289±0.034
[1.3]
0 12.7±2.6 13.2±2.3 0.061±0.015
[1]
-20±40 77±13 56±13
7 5.6±2.8 6.6±1.5 12.3±3.5 0.879±0.043
[2.2]
4.5±2.1 11.4±3.0 15.9±3.4 0.443±0.028
[1.7]
-20±40 75±13 34±12
8 0 7.9±1.6 8.4±1.9 0.080±0.025
[1.4]
0 12.9±2.9 13.3±2.8 0.046±0.015
[1.1]
-5±1 65±12 61±13
9 0 8.1±1.5 8.1±1.5 0 0 12.9±2.3 12.9±2.3 0 60±12 58±13
10 0 (0,2.1) 7.1±1.4 8.4±2.4 0.203±0.035
[1.6]
0 12.3±2.9 13.2±3.1 0.088±0.018
[0.8]
-10±30 74±12 61±13
11 4.2±2.5 6.3±1.4 10.5±2.9 0.704±0.044
[1.8]
3.1±2.5 11.7±3.1 14.8±3.4 0.298±0.026
[1]
-26±40 87±13 84±15
12 4.4±2.7 6.3±1.4 10.7±2.9 0.756±0.048
[2.4]
2.8±2.1 11.3±2.8 14.1±2.9 0.287±0.024
[1]
-35±40 83±14 36±14
3.0 15.9±±±±±±±3333333
[2.2]
0
[2.2]
0.080±0.025
[1.4]
0 12.9±2.9 13.3±2
by guest on June 11, 2018http://circim
aging.ahajournals.org/D
ownloaded from
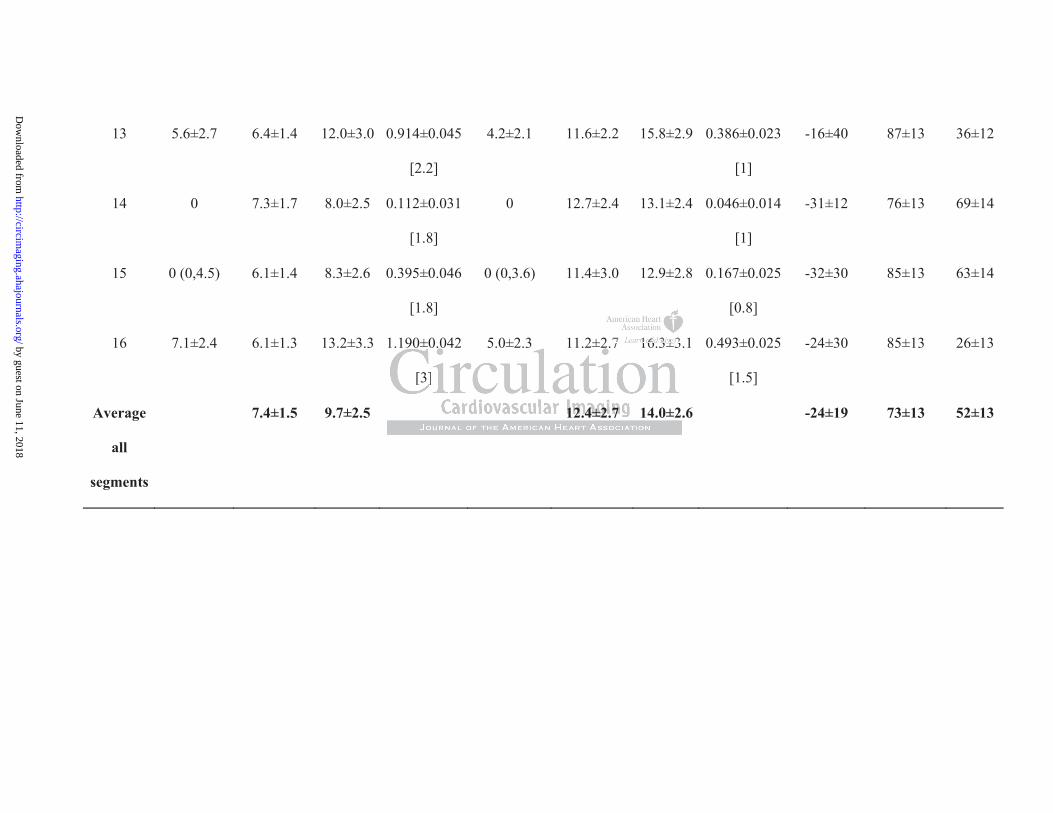
13 5.6±2.7 6.4±1.4 12.0±3.0 0.914±0.045
[2.2]
4.2±2.1 11.6±2.2 15.8±2.9 0.386±0.023
[1]
-16±40 87±13 36±12
14 0 7.3±1.7 8.0±2.5 0.112±0.031
[1.8]
0 12.7±2.4 13.1±2.4 0.046±0.014
[1]
-31±12 76±13 69±14
15 0 (0,4.5) 6.1±1.4 8.3±2.6 0.395±0.046
[1.8]
0 (0,3.6) 11.4±3.0 12.9±2.8 0.167±0.025
[0.8]
-32±30 85±13 63±14
16 7.1±2.4 6.1±1.3 13.2±3.3 1.190±0.042
[3]
5.0±2.3 11.2±2.7 16.3±3.1 0.493±0.025
[1.5]
-24±30 85±13 26±13
Average
all
segments
7.4±1.5 9.7±2.5 12.4±2.7 14.0±2.6 -24±19 73±13 52±13
2 7 11111116666666 3±3±3±3±3±3±3±33331.190 0.042 5.0 2.3 11.2 2.7 16.3 3
12.4±2.7 14.0±2.
1.190 0.042
[3]
5.0 2.3 11.2 2.7 16.3 3
12.4±2.7 14.0±2.
by guest on June 11, 2018http://circim
aging.ahajournals.org/D
ownloaded from
Figure Legends
Figure 1: (a) The systematic selection of basal, mid-cavity and apical slices chosen for
measurements of trabecular and compact layer thickness is shown. The segmental incidence
of apparent trabeculae seen at both ED and ES is indicated as percentages in white for each of
the 16 segments. The dotted line indicates the ES location of the mitral valve. (b) Examples
of ED and ES frames showing the boundaries (white dotted lines) of the trabeculated layer
(red arrows) and compacted layer (blue arrows).
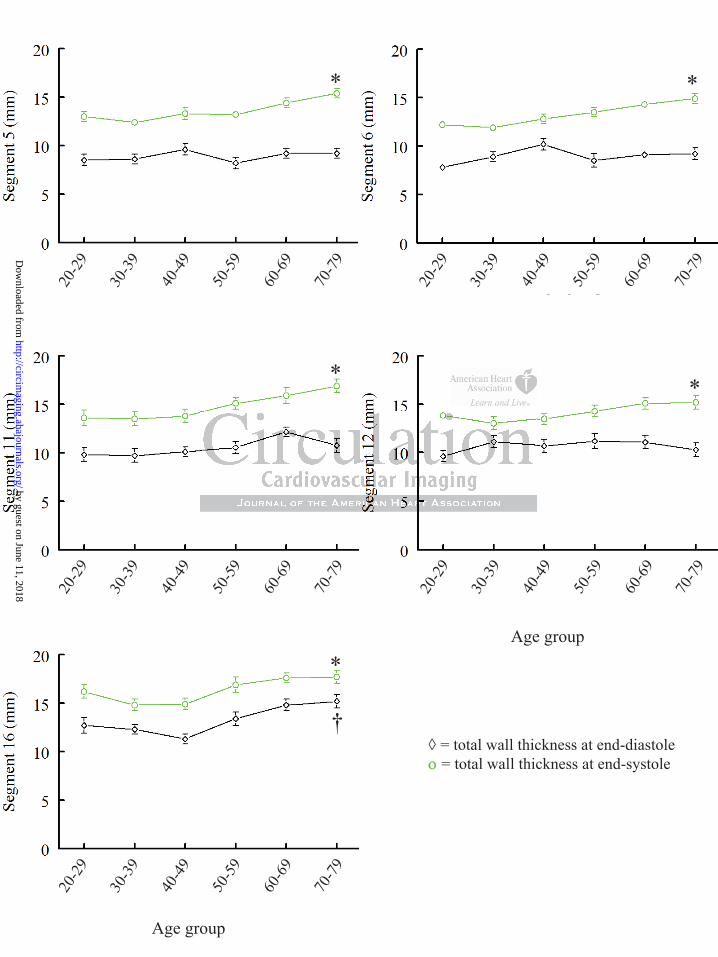
Figure 2: Compacted and trabecular layer thicknesses at ED per age groups (anterior wall).
Data is plotted as mean SEM with the exception of the first data point representing the
trabecular layer thickness in the 20-29 age group on Segment 1,which is shown as median
(first and third quartiles are 0, 4.6). and † = p<0.05 across age groups of the compact and
trabecular layer, respectively.
Figure 3: Compacted and trabecular layer thicknesses at ES per age groups (lateral wall).
Data is plotted as mean SEM. and † = p<0.05 across age groups of the compact and
trabecular layer, respectively.
Figure 4: (a) Total myocardial wall thickness (anterior wall) at ED and ES per age groups;
(b) Total myocardial wall thickness (lateral wall) at ED and ES per age groups. Data is
plotted as mean SEM. and † = p<0.05 across age groups of the total myocardial layer at ES
and ED, respectively.
Figure 5: Systolic trabecular layer thinning and compacted layer thickening shown as a
pattern with age, in the most trabeculated LV segments. Data is plotted as mean SEM. and
† = p<0.05 across age groups of the compact and trabecular layer, respectively.
a poioioioioioiointntntntntntnt r rrr rrrepepepepepepeprererererereresesesesesesesentntntntntntntiiiiiii
h a
u m
r
hickness in the 20-29 age group on Segment 1,which is shown a
uartiles are 0, 4.6). and † = p<0.05 across age groups of the com
respectively.
by guest on June 11, 2018http://circim
aging.ahajournals.org/D
ownloaded from
Figure 6: (a) Trabecular/Compact ratio at ED (red) and ES (blue) in each segment; (b)
Trabecular/Compact ratio at ES in younger versus older patients in all 16 segments. Data is
plotted as mean SEM. = p<0.05 in young versus old age group for each plotted segment.
by guest on June 11, 2018http://circim
aging.ahajournals.org/D
ownloaded from

1
4
2
3 5
6
7
8
9
10
11
12
13
14
15
16
SeptumAnterior wall
Inferior wallLateral wall
b
a
by guest on June 11, 2018http://circim
aging.ahajournals.org/D
ownloaded from
= trabecular layer• = compact layer
†
†
†
20-2
9
30-3
9
40-4
9
50-5
9
60-6
9
70-7
9
20-2
9
30-3
9
40-4
9
50-5
9
60-6
9
70-7
9
20-2
9
30-3
9
40-4
9
50-5
9
60-6
9
70-7
9
Age group
†
by guest on June 11, 2018http://circim
aging.ahajournals.org/D
ownloaded from
= trabecular layer• = compact layer
† †
†
Age group
20-2
9
30-3
9
40-4
9
50-5
9
60-6
9
70-7
9
20-2
9
30-3
9
40-4
9
50-5
9
60-6
9
70-7
9
20-2
9
30-3
9
40-4
9
50-5
9
60-6
9
70-7
9
20-2
9
30-3
9
40-4
9
50-5
9
60-6
9
70-7
9
20-2
9
30-3
9
40-4
9
50-5
9
60-6
9
70-7
9
Age group
by guest on June 11, 2018http://circim
aging.ahajournals.org/D
ownloaded from
†
†
†
Age group
20-2
9
30-3
9
40-4
9
50-5
9
60-6
9
70-7
9
20-2
9
30-3
9
40-4
9
50-5
9
60-6
9
70-7
9
20-2
9
30-3
9
40-4
9
50-5
9
60-6
9
70-7
9
†
by guest on June 11, 2018http://circim
aging.ahajournals.org/D
ownloaded from
= total wall thickness at end-diastole= total wall thickness at end-systole
†
Age group
20-2
9
30-3
9
40-4
9
50-5
9
60-6
9
70-7
9
20-2
9
30-3
9
40-4
9
50-5
9
60-6
9
70-7
9
20-2
9
30-3
9
40-4
9
50-5
9
60-6
9
70-7
9
20-2
9
30-3
9
40-4
9
50-5
9
60-6
9
70-7
9
20-2
9
30-3
9
40-4
9
50-5
9
60-6
9
70-7
9
Age group
by guest on June 11, 2018http://circim
aging.ahajournals.org/D
ownloaded from
= trabecular layer• = compact layer
† †
† †
† †
†
20-2
9
30-3
9
40-4
9
50-5
9
60-6
9
70-7
9
20-2
9
30-3
9
40-4
9
50-5
9
60-6
9
70-7
9
20-2
9
30-3
9
40-4
9
50-5
9
60-6
9
70-7
9
20-2
9
30-3
9
40-4
9
50-5
9
60-6
9
70-7
9
20-2
9
30-3
9
40-4
9
50-5
9
60-6
9
70-7
9
20-2
9
30-3
9
40-4
9
50-5
9
60-6
9
70-7
9
20-2
9
30-3
9
40-4
9
50-5
9
60-6
9
70-7
9
Age group
Age group
49
2200-2
9
30-3
9
40-4
9
50-5
9
60-6
9
70-7
9
by guest on June 11, 2018http://circim
aging.ahajournals.org/D
ownloaded from
a b
= trabecular layer• = compact layer
SegmentWall
by guest on June 11, 2018http://circim
aging.ahajournals.org/D
ownloaded from
KilnerDana K. Dawson, Alicia M. Maceira, Vimal J. Raj, Catriona Graham, Dudley J. Pennell and Philip J.
the Normal Left Ventricle Studied by Cardiovascular Magnetic ResonanceRegional Thicknesses and Thickening of Compacted and Trabeculated Myocardial Layers of
Print ISSN: 1941-9651. Online ISSN: 1942-0080 Copyright © 2010 American Heart Association, Inc. All rights reserved.
TX 75231is published by the American Heart Association, 7272 Greenville Avenue, Dallas,Circulation: Cardiovascular Imaging
published online December 30, 2010;Circ Cardiovasc Imaging.
http://circimaging.ahajournals.org/content/early/2010/12/30/CIRCIMAGING.110.960229World Wide Web at:
The online version of this article, along with updated information and services, is located on the
http://circimaging.ahajournals.org/content/suppl/2010/12/30/CIRCIMAGING.110.960229.DC1Data Supplement (unedited) at:
http://circimaging.ahajournals.org//subscriptions/
is online at: Circulation: Cardiovascular Imaging Information about subscribing to Subscriptions:
http://www.lww.com/reprints Information about reprints can be found online at: Reprints:
document. Permissions and Rights Question and Answer this process is available in the
located, click Request Permissions in the middle column of the Web page under Services. Further information aboutnot the Editorial Office. Once the online version of the published article for which permission is being requested is
can be obtained via RightsLink, a service of the Copyright Clearance Center,Circulation: Cardiovascular Imaging Requests for permissions to reproduce figures, tables, or portions of articles originally published inPermissions:
by guest on June 11, 2018http://circim
aging.ahajournals.org/D
ownloaded from
SUPPLEMENTAL MATERIAL

Table 3 - ED thicknesses of trabeculated, compacted and total layer and trabeculated/compacted ratio in female and male subjects
(Data is presented as mean±SEM) Trab = trabecular, C = compacted, F = female, M = male, na=not applicable, 0∗=measurement <0.01,
thus, not of clinical utility.
Segment Trabeculated p Compacted p Total layer p Trab/C ratio p
F M F M F M F M
1 2.5±0.3 3.1±0.3 0.29 7.1±0.2 8.6±0.2 <0.01 9.5±0.4 11.7±0.4 <0.01 0.3±0.0 0.3±0.0 0.92
2 0.1±0.1 0 0.38 8.6±0.3 10.5±0.3 <0.01 8.6±0.3 10.5±0.3 <0.01 0∗ 0∗ 0.33
3 0 0 na 7.8±0.2 9.6±0.2 <0.01 7.8±0.2 9.6±0.2 <0.01 0 0 na
4 0.3±0.1 0.4±0.1 0.54 6.9±0.2 8.5±0.2 <0.01 7.0±0.2 8.9±0.2 <0.01 0∗ 0∗ 0.97
5 1.9±0.3 1.8±0.3 0.79 6.3±0.2 7.7±0.2 <0.01 8.2±0.3 9.5±0.3 <0.01 0.3±0.0 0.2±0.0 0.22
6 1.9±0.3 1.9±0.3 0.91 6.3±0.1 7.7±0.2 <0.01 8.2±0.3 9.7±0.3 <0.01 0.3±0.0 0.3±0.0 0.53
7 5.3±0.4 6.0±0.4 0.22 6.1±0.2 7.2±0.2 <0.01 11.4±0.4 13.2±0.4 <0.01 0.9±0.0 0.8±0.0 0.38
8 0.6±0.2 0.4±0.2 0.39 7.1±0.2 8.6±0.2 <0.01 7.8±0.2 9.0±0.2 <0.01 0∗ 0∗ 0.27
9 0 0 na 7.4±0.2 8.8±0.2 <0.01 7.3±0.2 8.8±0.2 <0.01 0 0 na

10 1.6±0.3 1.0±0.3 0.20 6.5±0.2 7.7±0.1 <0.01 7.5±0.4 8.8±0.3 <0.01 0.1±0.0 0.1±0.0 0.06
11 4.0±0.4 4.4±0.3 0.44 5.7±0.1 6.8±0.1 <0.01 9.8±0.4 11.2±0.3 <0.01 0.7±0.1 0.7±0.0 0.79
12 4.4±0.4 4.5±0.3 0.81 5.6±0.2 6.9±0.1 <0.01 9.9±0.4 11.4±0.3 <0.01 0.8±0.1 0.7±0.1 0.13
13 5.5±0.3 5.9±0.3 0.42 6.0±0.2 6.5±0.2 <0.05 11.0±0.4 12.4±0.4 <0.05 0.9±0.1 0.9±0.2 0.98
14 0.7±0.3 0.7±0.2 0.98 6.6±0.2 7.9±0.2 <0.01 7.3±0.3 8.7±0.3 <0.01 0.1±0.0 0.1±0.0 0.61
15 2.3±0.3 2.1±0.3 0.76 5.7±0.2 6.6±0.2 <0.01 8.0±0.3 8.7±0.2 <0.05 0.4±0.1 0.3±0.1 0.29
16 6.7±0.3 7.6±0.3 0.05 5.9±0.2 6.4±0.2 <0.05 12.5±0.4 14.0±0.4 <0.05 1.1±0.1 1.2±0.1 0.54

Table 4 - ES thicknesses of trabeculated, compacted and total layer and trabeculated/compacted ratio in female and male subjects
Segment Trabeculated p Compacted p Total layer p Trab/C ratio p
F M F M F M F M
1 0.6±0.2 0.9±0.2 0.22 12.6±0.4 14.9±0.4 <0.01 13.1±0.4 15.9±0.4 <0.01 0 0.1±0.0 0.45
2 0 0 na 13.0±0.4 15.1±0.3 <0.01 13.0±0.4 15.1±0.3 <0.01 0 0 na
3 0 0 na 10.7±0.3 12.7±0.3 <0.01 10.7±0.3 12.7±0.3 <0.01 0 0 na
4 0.1±0.0 0.3±0.1 0.13 12.2±0.3 14.0±0.3 <0.01 12.2±0.3 14.4±0.3 <0.01 0∗ 0∗ 0.32
5 0.6±0.1 0.6±0.1 0.97 12.1±0.3 14.0±0.3 <0.01 12.7±0.3 14.5±0.3 <0.01 0.1±0.0 0.1±0.0 0.66
6 0.5±0.1 0.6±0.2 0.47 11.9±0.3 13.5±0.3 <0.01 12.3±0.3 14.2±0.3 <0.01 0.1±0.0 0.1±0.0 0.67
7 5.3±0.4 6.0±0.3 0.22 10.2±0.4 12.5±0.3 <0.01 14.6±0.4 17.1±0.4 <0.01 0.5±0.1 0.4±0.0 0.07
8 0.6±0.2 0.3±0.2 0.28 11.8±0.4 14.0±0.3 <0.01 12.4±0.4 14.3±0.3 <0.01 0∗ 0∗ 0.68
9 0 0 na 11.8±0.3 14.0±0.3 <0.01 11.8±0.3 14.0±0.3 <0.01 0 0 na
10 1.2±0.3 0.7±0.2 0.14 11.8±0.4 13.5±0.3 <0.01 12.4±0.4 14.1±0.3 <0.01 0.1±0.0 0.1±0.0 0.09
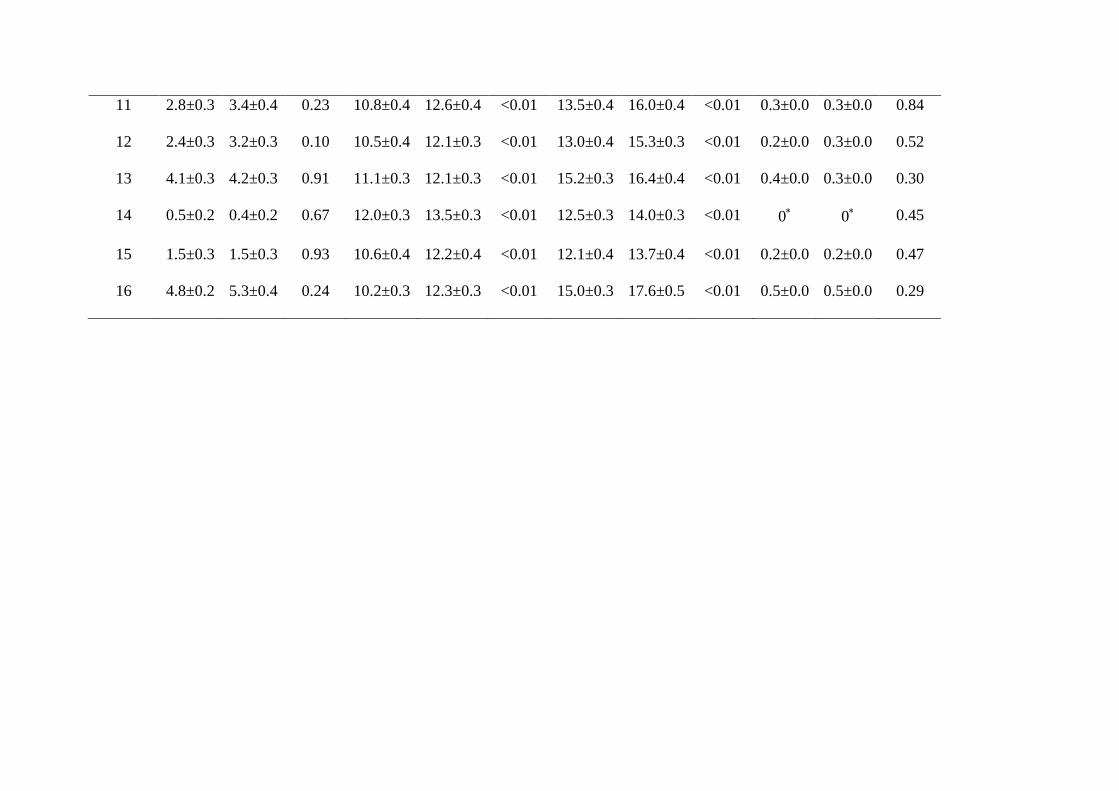
11 2.8±0.3 3.4±0.4 0.23 10.8±0.4 12.6±0.4 <0.01 13.5±0.4 16.0±0.4 <0.01 0.3±0.0 0.3±0.0 0.84
12 2.4±0.3 3.2±0.3 0.10 10.5±0.4 12.1±0.3 <0.01 13.0±0.4 15.3±0.3 <0.01 0.2±0.0 0.3±0.0 0.52
13 4.1±0.3 4.2±0.3 0.91 11.1±0.3 12.1±0.3 <0.01 15.2±0.3 16.4±0.4 <0.01 0.4±0.0 0.3±0.0 0.30
14 0.5±0.2 0.4±0.2 0.67 12.0±0.3 13.5±0.3 <0.01 12.5±0.3 14.0±0.3 <0.01 0∗ 0∗ 0.45
15 1.5±0.3 1.5±0.3 0.93 10.6±0.4 12.2±0.4 <0.01 12.1±0.4 13.7±0.4 <0.01 0.2±0.0 0.2±0.0 0.47
16 4.8±0.2 5.3±0.4 0.24 10.2±0.3 12.3±0.3 <0.01 15.0±0.3 17.6±0.5 <0.01 0.5±0.0 0.5±0.0 0.29
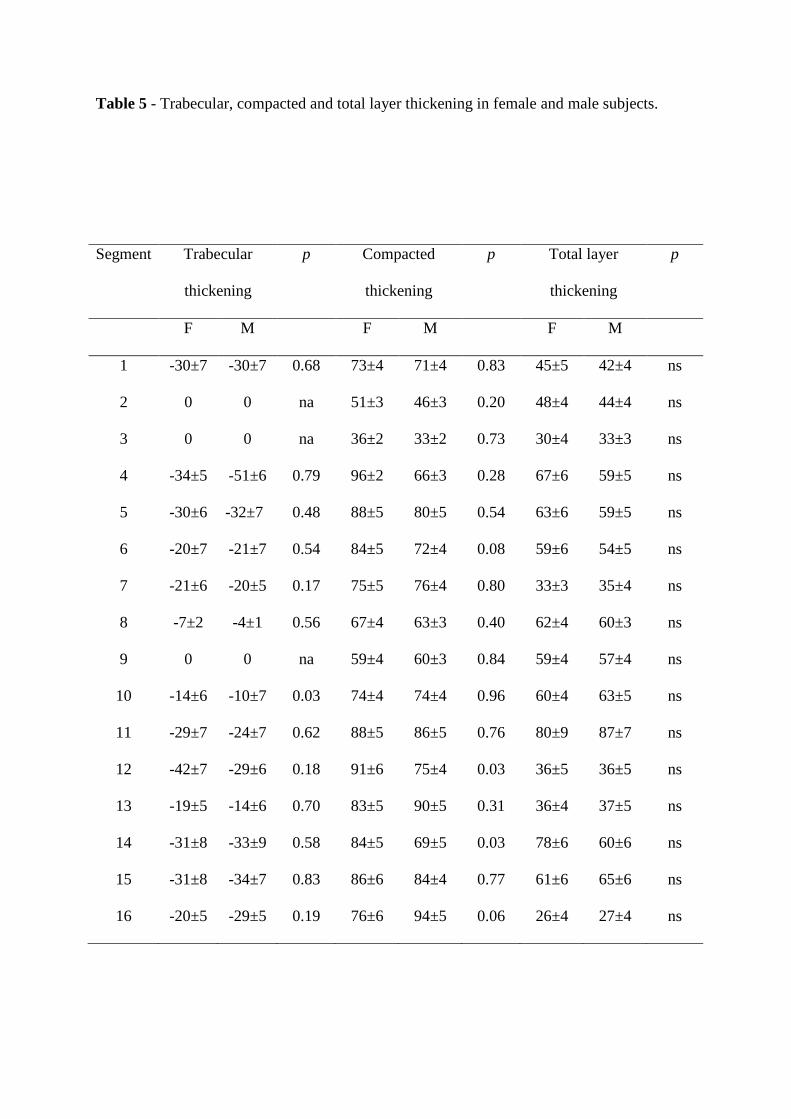
Table 5 - Trabecular, compacted and total layer thickening in female and male subjects.
Segment Trabecular
thickening
p Compacted
thickening
p Total layer
thickening
p
F M F M F M
1 -30±7 -30±7 0.68 73±4 71±4 0.83 45±5 42±4 ns
2 0 0 na 51±3 46±3 0.20 48±4 44±4 ns
3 0 0 na 36±2 33±2 0.73 30±4 33±3 ns
4 -34±5 -51±6 0.79 96±2 66±3 0.28 67±6 59±5 ns
5 -30±6 -32±7 0.48 88±5 80±5 0.54 63±6 59±5 ns
6 -20±7 -21±7 0.54 84±5 72±4 0.08 59±6 54±5 ns
7 -21±6 -20±5 0.17 75±5 76±4 0.80 33±3 35±4 ns
8 -7±2 -4±1 0.56 67±4 63±3 0.40 62±4 60±3 ns
9 0 0 na 59±4 60±3 0.84 59±4 57±4 ns
10 -14±6 -10±7 0.03 74±4 74±4 0.96 60±4 63±5 ns
11 -29±7 -24±7 0.62 88±5 86±5 0.76 80±9 87±7 ns
12 -42±7 -29±6 0.18 91±6 75±4 0.03 36±5 36±5 ns
13 -19±5 -14±6 0.70 83±5 90±5 0.31 36±4 37±5 ns
14 -31±8 -33±9 0.58 84±5 69±5 0.03 78±6 60±6 ns
15 -31±8 -34±7 0.83 86±6 84±4 0.77 61±6 65±6 ns
16 -20±5 -29±5 0.19 76±6 94±5 0.06 26±4 27±4 ns

Movie 1 Legend: Typical selection of the basal, mid-cavity and apical movies which was
used in selected cases to help locate the boundary between the compact and trabeculated
myocardium at end-systole.