
Region_2_Workforce_Report_2010
34
S S t t a a t t e e o o f f t t h h e e W W o o r r k k f f o o r r c c e e R R e e p p o o r r t t V V : : R R e e g g i i o o n n 2 2 Funding for this project was provided by Partners for this project were Alabama Department of Economic and Community Affairs Alabama Department of Industrial Relations Alabama Department of Postsecondary Education Alabama Industrial Development Training Alabama Power Company The University of Alabama June 2011 Center for Business and Economic Research University Center for Economic Development Institute for Social Science Research THE UNIVERSITY OF ALABAMA
-
Upload
morgan-county-alabama-career-pathway -
Category
Documents
-
view
229 -
download
7
description
June 2011 Alabama Department of Economic and Community Affairs Alabama Power Company Alabama Department of Postsecondary Education Alabama Department of Industrial Relations Alabama Industrial Development Training The University of Alabama Funding for this project was provided by Partners for this project were
Transcript of Region_2_Workforce_Report_2010

SSttaattee ooff tthhee WWoorrkkffoorrccee RReeppoorrtt VV:: RReeggiioonn 22
Funding for this project was provided by
Partners for this project were
Alabama Department of Economic
and Community Affairs
Alabama Department of Industrial Relations
Alabama Department of Postsecondary Education
Alabama Industrial Development Training
Alabama Power Company
The University of Alabama
June 2011
Center for Business and Economic Research University Center for Economic Development
Institute for Social Science Research
THE UNIVERSITY OF ALABAMA


State of the Workforce Report V: Region 2 i
State of the Workforce Report V: Region 2
June 2011
by Samuel Addy, Ph.D., Director and Research Economist Kathleen Gabler, Socioeconomic Research Associate Ahmad Ijaz, Director of Economic Forecasting Jonathan Law, Socioeconomic Research Associate Kilungu Nzaku, Ph.D., Postdoctoral Researcher Dong-Yop Oh, Graduate Research Assistant Arben Skivjani, Economic Forecaster Carolyn Trent, Socioeconomic Analyst Center for Business and Economic Research Culverhouse College of Commerce and Business Administration The University of Alabama Box 870221, Tuscaloosa, AL 35487-0221 Tel: (205) 348-6191 Fax: (205) 348-2951 [email protected]
Results Dissemination: Nisa Miranda, Director, University Center for Economic Development Underemployment Survey: Debra McCallum, Research Social Scientist and Director of the Capstone Poll
Michael Conaway, Project Coordinator for the Capstone Poll Institute for Social Science Research

ii UA/CBER State of the Workforce Report V: Region 2

State of the Workforce Report V: Region 2 UA/CBER iii
Acknowledgments
Funding for this project was provided by the U.S. Small Business Administration (SBA) under grant/cooperative agreement number SBAHQ-10-I-0233. All opinions, conclusions, or recommendations expressed in this report are those of the authors and do not necessarily reflect the views of the SBA. Completion of this project was due to the timely contributions of many people. We are very grateful to the Labor Market Information (LMI) Division of the Alabama Department of Industrial Relations (ADIR). LMI provided significant staff time and this report would not have been possible without large amounts of data from LMI. Many thanks also to our colleagues at the Center for Business and Economic Research, the Capstone Poll, the Institute for Social Science Research, and the University Center for Economic Development for their help on various phases of this research project. Last, but not least, much gratitude is owed to the thousands of Alabamians who responded to the extensive survey on the state’s workforce and related issues, as well as to the community and industry leaders whose work on these issues provides the critical data required in reports of this kind. Partners on the project included:
Alabama Department of Economic and Community Affairs Alabama Department of Industrial Relations Alabama Department of Postsecondary Education Alabama Industrial Development Training Alabama Power Company The University of Alabama

iv UA/CBER State of the Workforce Report V: Region 2
State of the Workforce Report V: Region 2 UA/CBER v
Contents
Acknowledgments iii
Summary vii
Workforce Supply 1
Labor Force Activity 1
Commuting Patterns 3
Population 3
Per Capita Income 5
Educational Attainment 6
Underemployment and Available Labor 7
Workforce Demand 11
Industry Mix 11
Job Creation and Net Job Flows 12
High-Demand, Fast-Growing, High-Earning, and Sharp-Declining Occupations 13
Skills and Skills Gap Analyses 17
Education and Training Issues 20
Implications and Recommendations 23

vi UA/CBER State of the Workforce Report V: Region 2

State of the Workforce Report V: Region 2 UA/CBER vii
Summary
This report analyzes workforce supply and demand issues using available metrics of workforce characteristics for Workforce Development Region 2 and presents implications and recommendations.
Region 2 had a 9.3 percent unemployment rate in January 2011, with 38,336 unemployed. An
underemployment rate of 22.7 percent for 2010 means that the region has a 122,678-strong available labor pool that includes 84,342 underemployed workers who are looking for better jobs and are willing to commute farther and longer for such jobs.
Net in-commuting fell from 4,527 in 2000 to 3,696 in 2006, but increased levels of commuting
to, out of, and within the region led to congestion. However, the congestion eased in 2010 due to job losses. Continuous maintenance and development of transportation infrastructure and systems is important to avoid slowing economic development and recovery.
By sector the top five employers in the region are manufacturing; retail trade; professional,
scientific, and technical services; health care and social assistance; and accommodation and food services. These five industries provided 206,527 jobs, 62.5 percent of the regional total in the first quarter of 2010. Two of these leading employers—manufacturing and professional, scientific, and technical services—paid higher wages than the region’s $3,304 monthly average. Economic development should continue to diversify and strengthen the region’s economy by retaining, expanding, and attracting more high-wage providing industries. Workforce development should also focus on preparing workers for these industries.
On average 17,051 jobs were created per quarter from second quarter 2001 to first quarter 2010;
quarterly net job flows averaged 1,544. Job creation is the number of new jobs that are created either by new businesses or through expansion of existing firms. Net job flows reflect the difference between current and previous employment at all businesses.
The top five high-demand occupations are Registered Nurses; Computer Systems Analysts;
Home Health Aides; Computer Software Engineers, Systems Software; and Licensed Practical and Licensed Vocational Nurses.
The top five fast-growing occupations are Marriage and Family Therapists; Veterinary
Technologists and Technicians; Network Systems and Data Communications Analysts; Rehabilitation Counselors; and Medical Assistants.
The top 50 high-earning occupations are in health, management, engineering, computer, science,
and finance fields and have a minimum salary of $83,157. Seven of the top 10 are health occupations.
Of the top 40 high-demand, the top 34 fast-growing, and 50 high-earning occupations, three
belong to all three categories: Anesthesiologists; Computer Software Engineers, Applications; and Physical Therapists. Nine additional occupations are both high-demand and high-earning. Twenty occupations are both high-demand and fast-growing.

viii UA/CBER State of the Workforce Report V: Region 2
Of the region’s 840 occupations and occupational categories, 79 are expected to decline over the
2008 to 2018 period. Twenty occupations are expected to sharply decline by at least 6 percent, with each losing a minimum of 40 jobs. Education and training for these 20 occupations should slow accordingly.
Skill and education requirements for jobs keep rising. Educational and training requirements of
high-demand, fast-growing, and high-earning occupations demonstrate the importance of education in developing the future workforce. In the future, more jobs will require postsecondary education and training at a minimum.
The importance of basic skills generally and for high-demand, high-growth, and high-earning jobs indicates a strong need for training in these skills. For Region 2 the pace of training needs to increase for technical, systems, and complex problem solving skills. The scale of training should be raised for basic and social skills. Ideally, all high school graduates should possess basic skills so that postsecondary and higher education can focus on other and more complex skills. Employers should be an integral part of planning for training as they can help identify future skill needs and any existing gaps.
From a 2008 base, a worker surplus of about 35,098 for 2018 and a worker shortfall of roughly
11,893 for 2025 are expected. This will demand a focus on worker skills through 2018, after which both skills and the expected shortfall must be priorities through 2025. Worker shortfalls for critical occupations will need to be addressed continuously. Strategies to address skill needs and worker shortfalls might include: (1) improvements in education and its funding; (2) use of economic opportunities to attract new residents; (3) focus on hard-to-serve populations (e.g. out-of-school youth); (4) lowering the high school dropout rate; (5) continuation and enhancement of programs to assess, retrain, and place dislocated workers; (6) encouragement of older worker participation in the labor force; and (7) facilitation of in-commuting.
Improving education is important because (i) a highly educated and productive workforce is a critical economic development asset, (ii) productivity rises with education, (iii) educated people are more likely to work, and (iv) it yields high private and social rates of return on investment. Workforce development must view all of education and other programs (e.g. adult education, career technical training, worker retraining, career readiness, etc.) as one system. Funding to support workforce development may require tax reform at state and local levels and should provide for flexibility as workforce needs change over time and demand different priorities. Publicizing both private and public returns to education can encourage individuals to raise their own educational attainment levels, while also promoting public and legislative support for education.
Higher incomes that come with improved educational attainment and work skills will help to
increase personal income for the region as well as raise additional local (county and city) tax revenues. This is important, even for a region that has relatively high population and labor force growth rates.
Together, workforce development and economic development can build a strong, well-
diversified Region 2 economy. Indeed, one cannot achieve success without the other.

State of the Workforce Report V: Region 2 UA/CBER 1
Workforce Supply
Labor Force Activity
The labor force includes all persons in the civilian noninstitutional population who are age 16 and over and who have a job or are actively looking for one. Typically, those who have no job and are not looking for one are not included (e.g. students, retirees, discouraged workers, and the disabled). Table 2.1 shows labor force information for Region 2 and its eight counties for 2010 and January 2011. Alabama labor force information is available from the Labor Market Information (LMI) Division of the Alabama Department of Industrial Relations. LMI compiles data in cooperation with the U.S. Bureau of Labor Statistics.
Table 2.1 Region 2 Labor Force Information
2010
Labor Force Employed Unemployed Rate (%)
Cullman 37,306 33,857 3,449 9.2DeKalb 28,716 25,234 3,483 12.1Jackson 25,527 22,902 2,625 10.3Lawrence 15,403 13,634 1,768 11.5Limestone 37,602 34,361 3,241 8.6Madison 168,102 155,434 12,669 7.5Marshall 39,858 36,352 3,506 8.8Morgan 55,167 49,635 5,533 10.0Region 2 407,681 371,409 36,274 8.9Alabama 2,127,211 1,925,064 202,147 9.5United States 153,889,000 139,064,000 14,825,000 9.6
January 2011
Labor Force Employed Unemployed Rate (%)
Cullman 37,419 33,956 3,463 9.3DeKalb 28,731 25,154 3,577 12.4Jackson 26,057 23,417 2,640 10.1Lawrence 15,553 13,550 2,003 12.9Limestone 37,705 34,377 3,328 8.8Madison 168,161 154,562 13,599 8.1Marshall 40,464 36,715 3,749 9.3Morgan 55,961 49,984 5,977 10.7Region 2 410,051 371,715 38,336 9.3Alabama 2,106,305 1,898,661 207,644 9.9United States 152,536,000 137,599,000 14,937,000 9.8Source: Alabama Department of Industrial Relations and U.S. Bureau of Labor Statistics.
Job losses resulting from the recession that began in December 2007 have raised county unemployment rates from a range of 7.5 percent to 12.1 percent for 2010 (8.9 percent for the region) to between 8.1 percent and 12.9 percent in January 2011, with 9.3 percent for the region. The unemployment rate was lowest in Madison County and highest in Lawrence. Four of the region’s counties had unemployment rates below Alabama’s 9.9 percent.
Annual unemployment rates for 2000 to 2010 are shown in Figure 2.1. The region’s unemployment rates were low before the 2001 and the most recent recession. The 2003 high of 5.0 percent was due to

2 UA/CBER State of the Workforce Report V: Region 2
the effects of the 2001 recession. Employment gains since 2003 resulting from successful state and local economic development efforts brought unemployment to a record low 3.0 percent in 2007. However, the recent recession resulted in major job losses. In 2009 unemployment rose to 9.0 percent and slightly declined to 8.9 percent in 2010. Year-to-date monthly labor force data point to a higher regional unemployment rate for 2011 than the 8.9 percent seen in 2010. The slow recovery from the recent recession is expected to keep unemployment rates high for a few more years.
2.0%
4.0%
6.0%
8.0%
10.0%
2000 2001 2002 2003 2004 2005 2006 2007 2008 2009 2010
Figure 2.1 Region 2 Unemployment Rate
Source: Alabama Department of Industrial Relations.
Nonagricultural employment of the region’s residents averaged 336,604 quarterly from the second quarter of 2001 to the first quarter of 2010 (Figure 2.2). The number of jobs has been declining steadily since the peak of 358,604 in the second quarter of 2008.
300,000
320,000
340,000
360,000
Figure 2.2 Region 2 Nonagricultural Employment
Source: Alabama Department of Industrial Relations and U.S. Census Bureau.
Table 2.2 shows worker distribution by age in Region 2 for the first quarter of 2010. Older workers, age 45 and over, are 42.5 percent of the region’s nonagricultural employment, just below the state’s 42.6 percent. The region’s 3.9 percent of workers who are age 65 and over is also slightly below the state’s 4.1 percent. To meet future occupational projections for growth and replacement, labor force participation of younger residents must increase; else older workers may have to work longer.

State of the Workforce Report V: Region 2 UA/CBER 3
Table 2.2 Workers by Age Group (First Quarter 2010)
Age group Nonagricultural Employment Number Percent
14-18 6,739 2.0 19-24 35,367 10.7 25-34 71,069 21.5 35-44 76,870 23.3 45-54 81,017 24.5 55-64 46,292 14.0
65+ 12,993 3.9 45 and over total 140,302 42.5
Total all ages 330,347 100.0 Note: Rounding errors may be present. Nonagricultural employment is by place of work, not
residence.
Source: U.S. Census Bureau, Local Employment Dynamics Program.
Commuting Patterns
In 2000 workers who commuted into the region exceeded residents who commuted out by 4,527 (Table 2.3). Although net in-commuters dropped to 3,696 in 2006, the level of in- and out-commuting more than doubled. There is significant commuting inside the region as well. Table 2.3 shows that one-way average commute time and distance for workers went down slightly in 2010 from 2009 implying that congestion eased. As population grows and the region recovers from the recent recession, more people will experience longer commute time and distance to work. Thus, transportation infrastructure and systems must be developed and maintained properly to ensure that the flow of goods and movement of workers are not hindered. Congestion slows the mobility of workers and goods and can thus impede economic development in the region.
Population
The Region 2 population count of 869,183 for 2010 is 13.4 percent more than was recorded for 2000 (Table 2.4). Population grew in six counties and shrank in the other two. The region’s population growth was greater than the state’s and nation’s growth rate of 7.5 percent and 9.7 percent. Population growth was fastest in Limestone and Madison counties. Jackson and Lawrence counties lost population.
Table 2.5 shows Region 2’s population counts, estimates, and projections by age group. The 65 and over age group grows rapidly after 2010, with the first of the baby boom generation turning 65 in 2011. As a result, growth of the prime working age group (20-64) and youth (0-19) will lag that of the total population. This poses a challenge for workforce development as employment growth is expected to outpace labor force growth in the long term. Communities that experience rapid job gains may need to consider investments in amenities and infrastructure to attract new residents.

4 UA/CBER State of the Workforce Report V: Region 2
Table 2.3 Commuting Patterns
Area Inflow, 2000 Outflow, 2000
Number Percent Number Percent Cullman 2,602 10.2 4,937 23.5 DeKalb 2,388 9.3 3,098 14.7 Jackson 1,356 5.3 3,772 17.9 Lawrence 1,451 5.7 1,244 5.9 Limestone 2,395 9.4 1,542 7.3 Madison 7,125 27.9 2,943 14.0 Marshall 5,800 22.7 2,352 11.2 Morgan 2,457 9.6 1,159 5.5
Region 2 25,574 100.0 21,047 100.0
Inflow, 2006 Outflow, 2006
Number Percent Number Percent
Region 2 57,471 100.0 53,775 100.0
Percent of workers Average commute time (one-way) 2004 2005/2006 2008 2009 2010
Less than 20 minutes 59.0 55.0 55.8 53.1 53.420 to 40 minutes 28.0 28.7 31.4 31.6 35.040 minutes to an hour 8.6 9.6 8.2 9.5 8.3More than an hour 1.3 2.0 1.0 1.3 1.7
Average commute distance (one-way) 2004 2005/2006 2008 2009 2010Less than 10 miles 46.2 45.7 44.9 43.8 43.810 to 25 miles 31.6 31.2 37.6 37.9 40.425 to 45 miles 13.1 13.0 11.2 13.7 11.2More than 45 miles 4.7 4.9 3.6 3.6 3.1
Note: Rounding errors may be present. Source: U.S. Census Bureau; Alabama Department of Industrial Relations; and Center for Business and Economic
Research, The University of Alabama.
Table 2.4 Region 2 Population by County 1990
Census2000
Census2010
CensusChange
2000-2010 % Change 2000-2010
Cullman 67,613 77,483 80,406 2,923 3.8DeKalb 54,651 64,452 71,109 6,657 10.3Jackson 47,796 53,926 53,227 -699 -1.3Lawrence 31,513 34,803 34,339 -464 -1.3Limestone 54,135 65,676 82,782 17,106 26.0Madison 238,912 276,700 334,811 58,111 21.0Marshall 70,832 82,231 93,019 10,788 13.1Morgan 100,043 111,064 119,490 8,426 7.6Region 2 665,495 766,335 869,183 102,848 13.4Alabama 4,040,587 4,447,100 4,779,736 332,636 7.5United States 248,709,873 281,421,906 308,745,538 27,323,632 9.7
Source: Center for Business and Economic Research, The University of Alabama and U.S. Census Bureau.

State of the Workforce Report V: Region 2 UA/CBER 5
Table 2.5 Population by Age Group and Projections Age Group 2000 2008 2018 2025
0-19 213,316 226,452 236,341 246,473 20-24 47,346 56,787 62,938 63,034 25-29 51,060 51,149 61,909 62,330 30-34 55,058 51,898 60,104 66,886 35-39 64,096 57,474 57,136 64,506 40-44 61,995 62,545 56,827 61,373 45-49 54,050 66,936 61,634 56,590 50-54 50,071 61,924 66,503 62,463 55-59 40,575 53,633 68,872 63,335 60-64 34,428 45,043 60,153 67,880
65+ 94,340 110,675 145,880 178,171 20-64 Total 458,679 507,389 556,076 568,397
Total Population 766,335 844,516 938,297 993,041 Change from 2008
0-19 4.4% 8.8% 20-64 9.6% 12.0%
Total Population 11.1% 17.6%
Source: Center for Business and Economic Research, The University of Alabama and U.S. Census Bureau.
Per Capita Income
Per capita income (PCI) in Region 2 was $33,908 in 2009 (Figure 2.3), up 73 percent from 1994, and $497 above the state average of $33,411; Madison county ($39,897) had higher PCI than the state. PCI was highest in Madison County and lowest in DeKalb ($25,989).
$19,545 $20,403 $20,954 $21,935 $23,101 $23,642 $24,813 $25,651 $26,127 $27,359 $28,711 $30,039 $31,348 $32,873 $34,181 $33,908
1994 1995 1996 1997 1998 1999 2000 2001 2002 2003 2004 2005 2006 2007 2008 2009
Figure 2.3 Region 2 Per Capita Income
Source: U.S. Bureau of Economic Analysis and Center for Business and Economic Research, The University of Alabama.
Educational Attainment
Educational attainment in 2005 to 2009 of Region 2 residents who were 25 years old and over is shown in Table 2.6 and Figures 2.4 and 2.5. Eighty percent graduated from high school and 23 percent held a bachelor’s or higher degree. Madison and Morgan counties have higher educational attainment than the other six and the regional attainment. Educational attainment is important as skills rise with education and high-wage jobs for the 21st century demand more skill sets.

6 UA/CBER State of the Workforce Report V: Region 2
Table 2.6 Educational Attainment of Population 25 Years and Over, 2005 - 2009
Cullman DeKalb Jackson Lawrence Limestone Madison Marshall MorganRegion
2
Total 55,091 45,889 36,770 23,233 50,490 206,313 58,036 77,272 553,094No schooling completed 485 811 355 292 649 1,375 781 867 5,615Nursery to 4th grade 416 914 575 130 530 848 1,081 673 5,1675th and 6th grade 1,126 1,690 870 423 1,148 1,568 1,688 1,398 9,9117th and 8th grade 2,781 3,566 2,167 1,135 1,837 3,964 2,937 2,498 20,8859th grade 2,561 2,457 1,694 954 1,693 3,416 2,563 2,157 17,49510th grade 2,280 2,840 1,720 1,434 2,206 4,799 2,793 2,629 20,70111th grade 2,564 2,227 1,817 965 1,759 5,328 2,604 2,796 20,06012th grade, no diploma 1,470 791 697 473 742 3,622 1,106 1,432 10,333
High school graduate/equivalent 18,709 15,458 13,944 9,104 16,959 46,203 18,008 24,406 162,791Some college, less than 1 year 3,402 2,437 2,609 1,258 3,509 12,217 4,066 5,991 35,489Some college, 1+ years, no degree 7,257 5,186 3,974 3,021 6,893 31,057 7,689 11,991 77,068Associate degree 4,740 2,846 2,183 1,646 3,382 13,646 4,181 5,323 37,947Bachelor’s degree 4,499 2,794 2,730 1,718 6,338 50,739 5,441 10,431 84,690Master’s degree 2,093 1,489 1,031 472 2,309 20,780 2,548 3,623 34,345Professional school degree 553 254 321 118 273 3,610 401 760 6,290Doctorate degree 155 129 83 90 263 3,141 149 297 4,307
Source: Center for Business and Economic Research, The University of Alabama and U.S. Census Bureau.
75.2% 66.7% 73.1% 75.0% 79.1% 87.9% 73.2% 81.3% 80.1%
Figure 2.4 High School Graduate or Higher, 2005 - 2009
13.3% 10.2% 11.3% 10.3%18.2%
37.9%
14.7% 19.6% 23.4%
Figure 2.5 Bachelor's Degree or Higher, 2005 - 2009
Source: Center for Business and Economic Research, The University of Alabama and U.S. Census Bureau.

State of the Workforce Report V: Region 2 UA/CBER 7
Underemployment and Available Labor
Labor force data are often limited to information on the employed and the unemployed that is available from government sources. However, this information is not complete from the perspective of employers. New or expanding employers are also interested in underemployment because current workers are potential employees. In fact, experience requirements in job ads are evidence that many prospective employers look beyond the unemployed for workers.
Workers in occupations that underutilize their experience, training, and skills are underemployed. These workers might look for other work because their current wages are below what they believe they can earn or because they wish to not be underemployed. Underemployment occurs for various reasons including (i) productivity growth, (ii) spousal employment and income, and (iii) family constraints or personal preferences. Underemployment is unique to areas because of the various contributing factors combined with each area’s economic, social, and geographic characteristics.
The existence of underemployment identifies economic potential that is not being realized. It is extremely difficult to measure this economic potential because of uncertainties regarding additional income that the underemployed can bring to an area. It is clear, however, that underemployment provides opportunities for selective job creation and economic growth. A business that needs skills prevalent among the underemployed could locate in places that have such workers regardless of those areas’ unemployment rates. A low unemployment rate, which may falsely suggest limited labor availability, is therefore not a hindrance to the business.
The underemployed present a significant pool of labor because they tend to respond to job opportunities that they believe are better for reasons that include (i) higher income, (ii) more benefits, (iii) superior terms and conditions of employment, and (iv) a better match with skills, training, and experience. The underemployed also create opportunities for entry level workers as they leave lower-paying jobs for better-paying ones. Even if their previously held positions are lost or not filled (perhaps due to low unemployment or adverse economic conditions), there is economic growth in gaining higher-paying jobs. Such income growth boosts consumption, savings, and tax collections. Quantifying the size of the underemployed is a necessary first step in considering this group for economic development, workforce training, planning, and other purposes. It is important to note that the underemployed can take on more responsibilities and earn more income, but they cannot be counted on to address possible future worker shortages as they are already employed.
Region 2 had an underemployment rate of 22.7 percent in 2010. Applying this rate to January 2011 labor force data means that 84,342 employed residents were underemployed (Table 2.7). Adding the unemployed gives a total available labor pool of 122,678 for the region. This is 3.1 times the number of unemployed and is a more realistic measure of the available labor pool in the region. Prospective employers must be able to offer the underemployed higher wages, better benefits or terms of employment, or some other incentives to induce them to change jobs. Underemployment rates ranged from 17.9 percent for Lawrence County to 28.8 percent for Cullman. Lawrence County had the smallest available labor pool and Madison had the largest.

8 UA/CBER State of the Workforce Report V: Region 2
Table 2.7 Underemployed and Available Labor by County
Region 2 Cullman DeKalb Jackson Lawrence
Labor Force 410,051 37,419 28,731 26,057 15,553
Employed 371,715 33,956 25,154 23,417 13,550
Underemployment rate 22.7% 28.8% 27.6% 19.0% 17.9%Underemployed workers 84,342 9,776 6,940 4,442 2,420
Unemployed 38,336 3,463 3,577 2,640 2,003
Available labor pool 122,678 13,239 10,517 7,082 4,423
Limestone Madison Marshall Morgan
Labor Force 37,705 168,161 40,464 55,961
Employed 34,377 154,562 36,715 49,984
Underemployment rate 18.2% 22.3% 20.3% 26.7%Underemployed workers 6,250 34,467 7,468 13,331
Unemployed 3,328 13,599 3,749 5,977
Available labor pool 9,578 48,066 11,217 19,308
Note: Rounding errors may be present. Based on January 2011 labor force data and 2010 underemployment rates.
Source: Center for Business and Economic Research, The University of Alabama and Alabama Department of Industrial Relations.
Underemployment rates for counties, Workforce Development Regions (WDRs), and the state were determined from an extensive survey on the state’s workforce. A total of 1,411 complete responses were obtained from Region 2. About 51 percent (714 respondents) were employed, of whom 162 stated that they were underemployed. A lack of job opportunities in their area, low wages at available jobs, other family or personal obligations, living too far from jobs, and child care responsibilities are the primary reasons given for being underemployed. Ongoing economic development efforts can help in this regard. Nonworkers cite retirement and disability or other health concerns as the main reasons for their status, but some also cite a lack of job opportunities in their area and low wages as additional key factors. Such workers may become part of the labor force if their problems can be addressed.
A comparison of underemployed workers to the overall workforce in Region 2 shows that:
Fewer work full-time and more of the part-timers prefer full-time work. More hold multiple jobs. Their commute times and distance travelled to work are longer. More are transportation and material moving workers, sales and related occupations,
personal care and service, building and grounds cleaning and maintenance, healthcare practitioners and technicians, and computer and mathematical workers.
More are in retail trade, real estate, health care and social assistance, entertainment and recreation, and accommodation and food services industries.
They earn less and have shorter job tenure. Fewer believe their jobs fit well with their education and training, skills, and experience. More believe they are qualified for a better job.
State of the Workforce Report V: Region 2 UA/CBER 9
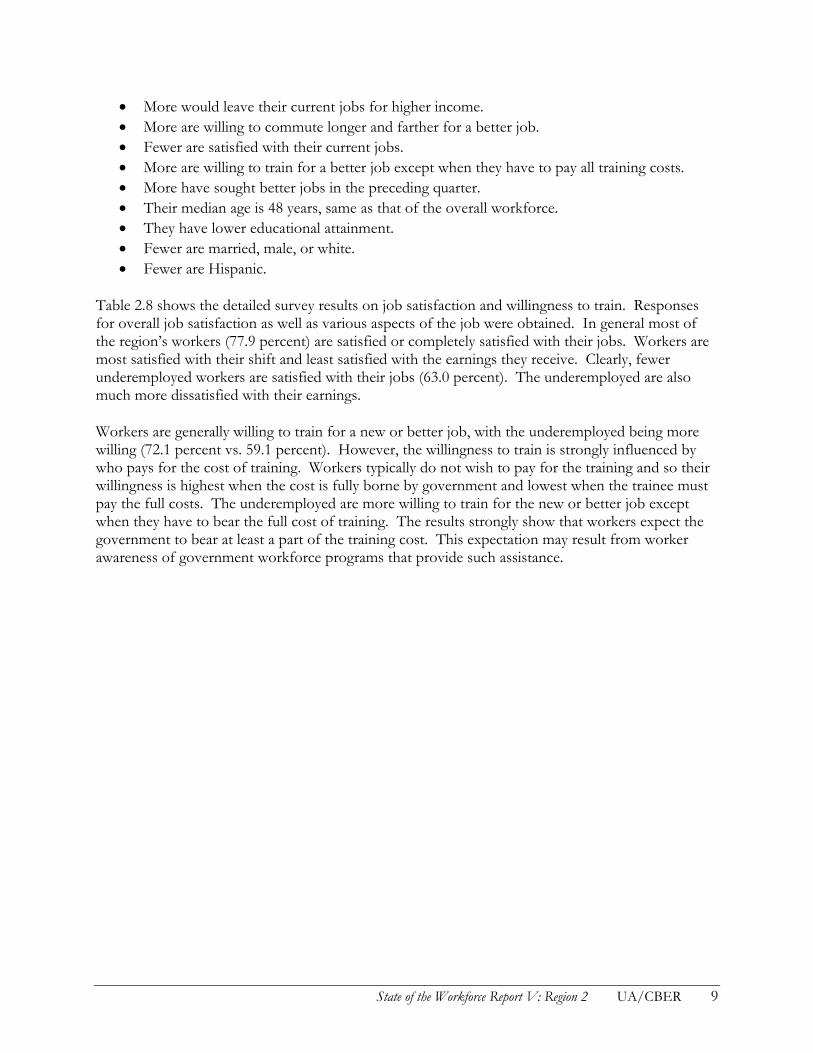
More would leave their current jobs for higher income. More are willing to commute longer and farther for a better job. Fewer are satisfied with their current jobs. More are willing to train for a better job except when they have to pay all training costs. More have sought better jobs in the preceding quarter. Their median age is 48 years, same as that of the overall workforce. They have lower educational attainment. Fewer are married, male, or white. Fewer are Hispanic.
Table 2.8 shows the detailed survey results on job satisfaction and willingness to train. Responses for overall job satisfaction as well as various aspects of the job were obtained. In general most of the region’s workers (77.9 percent) are satisfied or completely satisfied with their jobs. Workers are most satisfied with their shift and least satisfied with the earnings they receive. Clearly, fewer underemployed workers are satisfied with their jobs (63.0 percent). The underemployed are also much more dissatisfied with their earnings.
Workers are generally willing to train for a new or better job, with the underemployed being more willing (72.1 percent vs. 59.1 percent). However, the willingness to train is strongly influenced by who pays for the cost of training. Workers typically do not wish to pay for the training and so their willingness is highest when the cost is fully borne by government and lowest when the trainee must pay the full costs. The underemployed are more willing to train for the new or better job except when they have to bear the full cost of training. The results strongly show that workers expect the government to bear at least a part of the training cost. This expectation may result from worker awareness of government workforce programs that provide such assistance.

10 UA/CBER State of the Workforce Report V: Region 2
Table 2.8 2010 Job Satisfaction and Willingness to Train (Percent)
Job Satisfaction
Completely Dissatisfied Dissatisfied Neutral Satisfied
Completely Satisfied
Employed Overall 2.1 3.1 16.8 30.8 47.1
Earnings 7.3 10.1 22.7 27.6 31.9
Retention 3.9 4.5 12.9 20.3 57.6
Work 1.1 3.1 9.4 24.8 61.3
Hours 4.5 4.2 11.2 21.9 58.0
Shift 2.4 2.8 7.4 15.0 72.0
Conditions 2.5 4.3 14.7 28.2 50.1
Commuting Distance 3.8 4.1 10.8 17.4 63.9
Underemployed Overall 3.7 6.8 26.5 33.3 29.6
Earnings 14.8 19.8 27.2 21.0 17.3
Retention 9.3 6.8 19.1 22.8 40.7
Work 1.9 4.9 15.4 28.4 48.8
Hours 6.8 5.6 11.7 25.3 50.0
Shift 3.1 2.5 11.1 12.4 71.0
Conditions 4.9 6.2 21.6 29.0 38.3
Commuting Distance 1.9 9.3 14.2 14.2 60.5
Willingness to Train
Completely
Unwilling Unwilling Neutral Willing Completely
Willing
Employed For a new or better job 18.3 5.5 15.8 13.9 45.3
If paid by trainee 44.4 19.8 23.0 5.7 4.1
If paid by trainee and government 11.1 14.8 35.9 19.6 15.4
If paid by government 5.7 3.9 10.7 13.7 65.0
Underemployed For a new or better job 13.6 3.4 8.8 15.0 57.1
If paid by trainee 39.4 19.7 29.1 3.2 3.2
If paid by trainee and government 8.7 11.0 37.0 18.1 20.5
If paid by government 3.2 0.8 6.3 12.6 77.2
Note: Rounding errors may be present.
Source: Center for Business and Economic Research, The University of Alabama.

State of the Workforce Report V: Region 2 UA/CBER 11
Workforce Demand Industry Mix
The manufacturing sector was the leading employer in Region 2 with 64,915 jobs in first quarter 2010 (Table 2.9). Rounding out the top five industries by employment are retail trade; professional, scientific, and technical services; health care and social assistance; and accommodation and food services. These five industries provided 206,527 jobs, 62.5 percent of the regional total. The average monthly wage across all industries in the region was $3,304; two of the leading employers paid more than this average. New hire monthly earnings averaged $2,110, about 64 percent of the region’s average monthly wage. The highest average monthly wages were for professional, scientific, and technical services at $5,987, mining $4,670, wholesale trade $4,204, and utilities $4,185. Accommodation and food services paid the least at $1,217. Professional, scientific, and technical services had the highest average monthly new hire wages with $4,903, followed by management of companies and enterprises at $4,732. Art, entertainment, and recreation paid newly hired workers the least, $799.
Table 2.9 Industry Mix (First Quarter 2010)
Industry by 2-digit NAICS Code Total
Employment
Share
Rank
Average Monthly
Wage
Average Monthly New Hire Earnings
11 Agriculture, Forestry, Fishing and Hunting 1,635 0.49% 19 $2,510 $1,519
21 Mining 487 0.15% 20 $4,670 $4,527
22 Utilities 2,427 0.73% 17 $4,185 $1,896
23 Construction 14,325 4.34% 8 $3,324 $3,950
31-33 Manufacturing 64,915 19.65% 1 $4,052 $2,695
42 Wholesale Trade 11,301 3.42% 10 $4,204 $3,029
44-45 Retail Trade 40,672 12.31% 2 $2,050 $1,155
48-49 Transportation and Warehousing 8,489 2.57% 12 $2,709 $2,254
51 Information 4,000 1.21% 14 $3,648 $1,815
52 Finance and Insurance 8,679 2.63% 11 $3,963 $2,881
53 Real Estate and Rental and Leasing 3,373 1.02% 15 $2,461 $1,819
54 Professional, Scientific, and Technical Services 36,966 11.19% 3 $5,987 $4,903
55 Management of Companies and Enterprises 1,928 0.58% 18 $4,108 $4,732
56 Administrative and Support and Waste Management and Remediation Services
18,845 5.70% 7 $2,215 $1,884
61 Educational Services 26,637 8.06% 6 $2,943 $844
62 Health Care and Social Assistance 36,852 11.16% 4 $2,902 $1,855
71 Arts, Entertainment, and Recreation 2,531 0.77% 16 $1,323 $799
72 Accommodation and Food Services 27,122 8.21% 5 $1,217 $918
81 Other Services (Except Public Administration) 6,910 2.09% 13 $2,327 $1,963
92 Public Administration 12,253 3.71% 9 $2,728 $1,987
ALL INDUSTRIES 330,347 100.00% $3,304 $2,110
Source: Alabama Department of Industrial Relations and U.S. Census Bureau.

12 UA/CBER State of the Workforce Report V: Region 2
By broad industry classification, service providing industries generated almost 72 percent of jobs in first quarter 2010 (Figure 2.6). Goods producing industries were next with about 25 percent and public administration accounted for 3.7 percent. The distribution is for all nonagricultural jobs in the region, but there is significant variation by county.
24.6%
71.7%
3.7%
0% 20% 40% 60% 80% 100%
Goods Producing
Service Providing
Public Administration
Figure 2.6 Region 2 Employment Distribution
Source: Alabama Department of Industrial Relations and U.S. Census Bureau.
Job Creation and Net Job Flows
On average, 17,051 jobs were created per quarter from second quarter 2001 to first quarter 2010 (Figure 2.7); quarterly net job flows averaged 1,544 (Figure 2.8). Quarterly net job flows over the period have fluctuated between a loss of 4,639 to a gain of 6,794. Both job creation and net job flows have been rising since the third quarter of 2009 although the level of job creation is below the pre-2008 levels. Job creation refers to the number of new jobs that are added into the region either by new area businesses or through the expansion of existing firms. Net job flows reflect the difference between current and previous employment at all businesses.
10,00013,00016,00019,00022,000
Figure 2.7 Job Creation in Region 2
-8,000-4,000
04,0008,000
Figure 2.8 Region 2 Net Job Flows
Source: Alabama Department of Industrial Relations and U.S. Census Bureau.

State of the Workforce Report V: Region 2 UA/CBER 13
High-Demand, Fast-Growing, High-Earning, and Sharp-Declining Occupations
Out of a total 840 occupations and occupational categories in the region, 725 are single occupations. Table 2.10 shows the 40 occupations that are expected to be in high-demand, ranked by projected average annual job openings over the 2008 to 2018 period. Many of these occupations are common to three of the five largest employment sectors identified earlier (Table 2.9): manufacturing; professional, scientific, and technical services; and health care and social assistance. Thus, these sectors will continue to dominate employment in the region.
The top five high-demand occupations are Registered Nurses; Computer Systems Analysts; Home Health Aides; Computer Software Engineers, Systems Software; and Licensed Practical and Licensed Vocational Nurses. Twenty of the high-demand occupations are also fast-growing. This means that these 20 occupations have a minimum annual growth rate of 2.82 percent, much faster than the regional and state occupational growth rates of 1.23 percent and 1.01 percent, respectively.
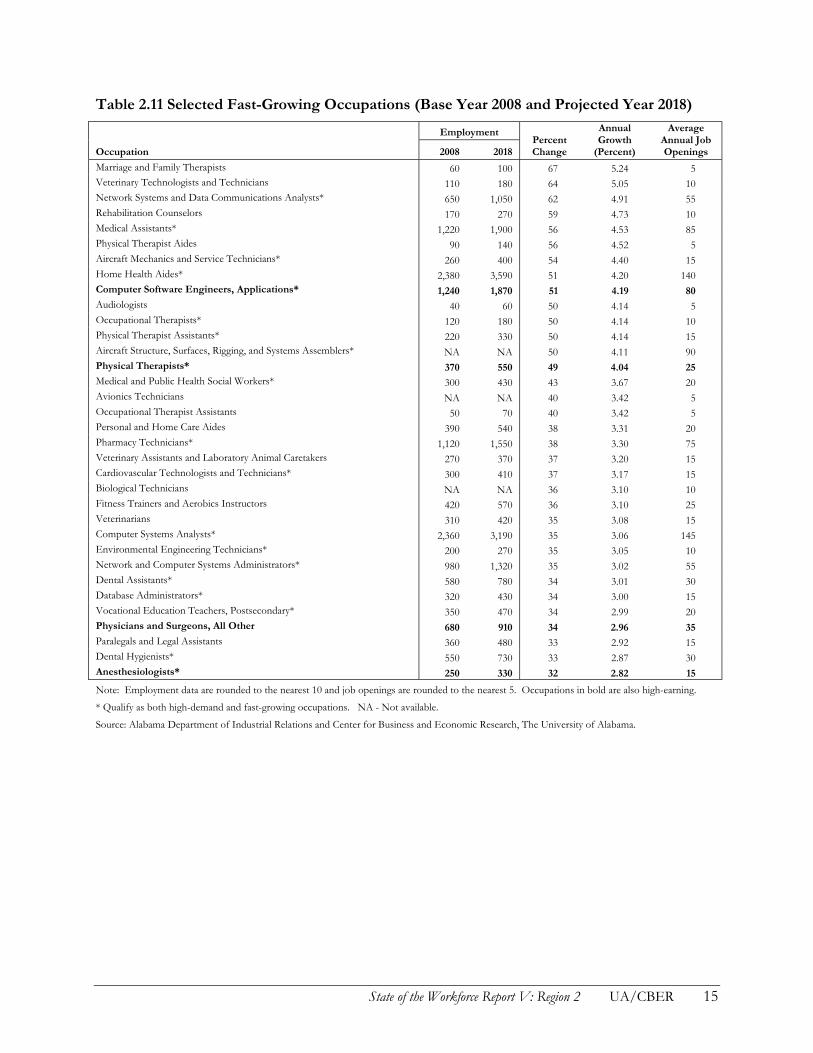
The 34 fastest growing occupations ranked by projected growth of employment are listed in Table 2.11. Most of these occupations are related to health and professional, scientific, and technical services industries. The top five fast-growing occupations are Marriage and Family Therapists; Veterinary Technologists and Technicians; Network Systems and Data Communications Analysts; Rehabilitations Counselors; and Medical Assistants.
Table 2.12 shows the 50 selected highest earning occupations in the region. These occupations are mainly in health, management, engineering, computer, science, and finance fields. Seven of the top 10 listed are health occupations. Any discussion of earnings must consider that wages vary with experience. Occupations with the highest entry wages may not necessarily have the highest average or experienced wages.
The selected high-earning occupations are generally not fast-growing or in high-demand. Twelve occupations are both high-earning and in high-demand (Table 2.10). The following three occupations are in high-demand, fast-growing, and high-earning:
1. Anesthesiologists 2. Computer Software Engineers, Applications 3. Physical Therapists
Of the region’s 840 occupations and occupational categories, 79 are expected to decline over the 2008 to 2018 period. Employment in the 20 sharpest-declining occupations will fall by at least 6 percent, with each losing a minimum of 40 jobs over the period (Table 2.13). No efforts should be made to sustain these occupations because they are declining as a result of structural changes in the economy of the region.

14 UA/CBER State of the Workforce Report V: Region 2
Table 2.10 Selected High-Demand Occupations (Base Year 2008 and Projected Year 2018)
Average Annual Job Openings
Occupation Total Due to Growth
Due to Separations
Registered Nurses 320 210 110 Computer Systems Analysts* 145 85 65 Home Health Aides* 140 120 20 Computer Software Engineers, Systems Software 115 70 40 Licensed Practical and Licensed Vocational Nurses 115 55 60 Accountants and Auditors 105 55 50 Aircraft Structure, Surfaces, Rigging, & Systems Assemblers* 90 65 25 Aerospace Engineers 85 45 40 Medical Assistants* 85 70 15 Computer Software Engineers, Applications* 80 60 20 Logisticians 80 50 30 Management Analysts 75 40 35 Pharmacy Technicians* 75 45 35 Civil Engineers 65 30 35 Network and Computer Systems Administrators* 55 35 20 Network Systems and Data Communications Analysts* 55 40 15 Industrial Engineers 45 25 20 Sales Representatives, Wholesale & Manufacturing, Technical & Scientific Products 40 20 20 Surveyors 40 20 20 Construction and Building Inspectors 35 25 15 Dental Assistants* 30 20 10 Dental Hygienists* 30 20 10 Employment, Recruitment, and Placement Specialists 30 15 15 Pharmacists 30 20 10 Computer and Information Systems Managers 25 15 10 Environmental Engineers 25 10 10 Physical Therapists* 25 20 5 Environmental Scientists & Specialists, Including Health 20 10 10 Medical and Health Services Managers 20 10 10 Medical and Public Health Social Workers* 20 15 5 Vocational Education Teachers, Postsecondary* 20 10 5 Aircraft Mechanics and Service Technicians* 15 15 5 Anesthesiologists* 15 10 5 Cardiovascular Technologists and Technicians* 15 10 5 Database Administrators* 15 10 5 Personal Financial Advisors 15 10 5 Physical Therapist Assistants* 15 10 5 Veterinarians* 15 10 5 Chiropractors 10 5 0 Occupational Therapists* 10 5 0
Note: Occupations are growth- and wages-weighted and data are rounded to the nearest 5. Occupations in bold are also high-earning.
* Qualify as both high-demand and fast-growing occupations.
Source: Alabama Department of Industrial Relations and Center for Business and Economic Research, The University of Alabama.
State of the Workforce Report V: Region 2 UA/CBER 15
Table 2.11 Selected Fast-Growing Occupations (Base Year 2008 and Projected Year 2018)
Employment Percent Change
Annual Growth
(Percent)
Average Annual Job Openings Occupation 2008 2018
Marriage and Family Therapists 60 100 67 5.24 5 Veterinary Technologists and Technicians 110 180 64 5.05 10 Network Systems and Data Communications Analysts* 650 1,050 62 4.91 55 Rehabilitation Counselors 170 270 59 4.73 10 Medical Assistants* 1,220 1,900 56 4.53 85 Physical Therapist Aides 90 140 56 4.52 5 Aircraft Mechanics and Service Technicians* 260 400 54 4.40 15 Home Health Aides* 2,380 3,590 51 4.20 140 Computer Software Engineers, Applications* 1,240 1,870 51 4.19 80 Audiologists 40 60 50 4.14 5 Occupational Therapists* 120 180 50 4.14 10 Physical Therapist Assistants* 220 330 50 4.14 15 Aircraft Structure, Surfaces, Rigging, and Systems Assemblers* NA NA 50 4.11 90 Physical Therapists* 370 550 49 4.04 25 Medical and Public Health Social Workers* 300 430 43 3.67 20 Avionics Technicians NA NA 40 3.42 5 Occupational Therapist Assistants 50 70 40 3.42 5 Personal and Home Care Aides 390 540 38 3.31 20 Pharmacy Technicians* 1,120 1,550 38 3.30 75 Veterinary Assistants and Laboratory Animal Caretakers 270 370 37 3.20 15 Cardiovascular Technologists and Technicians* 300 410 37 3.17 15 Biological Technicians NA NA 36 3.10 10 Fitness Trainers and Aerobics Instructors 420 570 36 3.10 25 Veterinarians 310 420 35 3.08 15 Computer Systems Analysts* 2,360 3,190 35 3.06 145 Environmental Engineering Technicians* 200 270 35 3.05 10 Network and Computer Systems Administrators* 980 1,320 35 3.02 55 Dental Assistants* 580 780 34 3.01 30 Database Administrators* 320 430 34 3.00 15 Vocational Education Teachers, Postsecondary* 350 470 34 2.99 20 Physicians and Surgeons, All Other 680 910 34 2.96 35 Paralegals and Legal Assistants 360 480 33 2.92 15 Dental Hygienists* 550 730 33 2.87 30 Anesthesiologists* 250 330 32 2.82 15
Note: Employment data are rounded to the nearest 10 and job openings are rounded to the nearest 5. Occupations in bold are also high-earning.
* Qualify as both high-demand and fast-growing occupations. NA - Not available.
Source: Alabama Department of Industrial Relations and Center for Business and Economic Research, The University of Alabama.

16 UA/CBER State of the Workforce Report V: Region 2
Table 2.12 Selected High-Earning Occupations (Base Year 2008 and Projected Year 2018)
Employment Annual Growth
(Percent)
Average Annual Job Openings
Mean Annual
Salary ($)Occupation 2008 2018
Surgeons 170 200 1.64 5 226,497 Physicians and Surgeons, All Other 680 910 2.96 35 223,041 Anesthesiologists* 250 330 2.82 15 220,389 Psychiatrists 60 80 2.92 5 215,300 Dentists, General 340 380 1.12 10 179,984 Internists, General 130 150 1.44 5 171,704 Chief Executives 1,090 1,140 0.45 35 164,461 Family and General Practitioners 190 230 1.93 5 145,155 Environmental Engineers* 410 520 2.41 25 135,215 Personal Financial Advisors* 350 460 2.77 15 122,584 Pharmacists* 650 830 2.47 30 118,721 Engineering Managers 1,150 1,310 1.31 40 116,532 Lawyers 970 1,130 1.54 35 115,805 Podiatrists 40 50 2.26 5 111,945 Marketing Managers 210 250 1.76 10 110,471 Computer and Information Systems Managers* 640 780 2.00 25 108,200 Engineers, All Other 3,260 3,650 1.14 75 106,879 Financial Managers 820 930 1.27 25 106,665 Natural Sciences Managers 50 60 1.84 0 106,652 Physicists 140 160 1.34 5 105,800 Aerospace Engineers* 2,120 2,560 1.90 85 103,838 Computer and Information Scientists, Research 200 230 1.41 10 101,707 Purchasing Managers 300 330 0.96 15 99,861 Psychologists, All Other 20 20 0.00 0 99,535 General and Operations Managers 6,580 6,930 0.52 195 97,642 Sales Managers 520 590 1.27 20 96,402 Computer Hardware Engineers 960 1,080 1.18 40 94,649 Electronics Engineers, Except Computer 1,220 1,350 1.02 40 93,947 Materials Engineers 280 340 1.96 15 93,902 Managers, All Other 2,160 2,440 1.23 70 93,723 Clinical, Counseling, and School Psychologists 190 230 1.93 10 92,855 Civil Engineers* 1,310 1,600 2.02 65 91,263 Operations Research Analysts 280 290 0.35 5 91,191 Securities, Commodities, and Financial Services Sales Agents 150 170 1.26 5 90,988 Education Administrators, Postsecondary 260 300 1.44 10 90,832 Computer Software Engineers, Applications* 1,240 1,870 4.19 80 90,138 Computer Software Engineers, Systems Software* 2,830 3,550 2.29 115 89,404 Computer Specialists, All Other 990 1,230 2.19 50 87,871 Human Resources Managers, All Other 140 170 1.96 5 87,684 Management Analysts* 2,040 2,460 1.89 75 87,650 Electrical Engineers 1,380 1,570 1.30 50 87,407 Physician Assistants 60 70 1.55 5 87,310 Chiropractors* 200 260 2.66 10 86,681 Chemical Engineers 320 340 0.61 10 86,351 Optometrists 120 150 2.26 5 86,236 Physical Therapists* 370 550 4.04 25 85,348 Public Relations Managers 220 250 1.29 10 84,516 Construction Managers 1,520 1,780 1.59 50 83,897 Social Scientists and Related Workers, All Other 70 80 1.34 5 83,896 Health and Safety Engineers, Except Mining Safety Engineers and Inspectors 130 140 0.74 5 83,157
Note: Employment and salaries data are rounded to the nearest 10; openings to the nearest 5. The salary data provided are based on the May 2010 release of the Occupational Employment Statistics (OES) combined employment and wage file. Estimates for specific occupations may include imputed data. Occupations in bold are also fast-growing.
* Qualify as both high-earning and high-demand occupations.
Source: Center for Business and Economic Research, The University of Alabama and Alabama Department of Industrial Relations.

State of the Workforce Report V: Region 2 UA/CBER 17
Table 2.13 Selected Sharp-Declining Occupations (Base Year 2008 and Projected Year 2018)
Employment Net Change
Percent Change Occupation 2008 2018
Textile Knitting and Weaving Machine Setters, Operators, and Tenders 1,300 640 -660 -37
Sewing Machine Operators 1,600 1,080 -520 -27
Electrical and Electronic Equipment Assemblers 1,840 1,390 -450 -29
Farmers and Ranchers 3,780 3,350 -430 -24
Packers and Packagers, Hand 2,230 1,800 -430 -50
Order Clerks 570 370 -200 -45
Pressers, Textile, Garment, and Related Materials 630 430 -200 -9
Textile Winding, Twisting, & Drawing Out Machine Setters, Operators, & Tenders 530 330 -200 -7
Cutting, Punching, & Press Machine Setters, Operators, & Tenders, Metal & Plastic 1,480 1,300 -180 -14
Machine Feeders and Offbearers 940 760 -180 -15
Textile Bleaching and Dyeing Machine Operators and Tenders 420 250 -170 -10
File Clerks 450 290 -160 -8
Packaging and Filling Machine Operators and Tenders 1,200 1,080 -120 -8
Textile Cutting Machine Setters, Operators, and Tenders 380 290 -90 -9
Computer Operators 330 250 -80 -19
Lathe & Turning Machine Tool Setters, Operators, & Tenders, Metal & Plastic 310 240 -70 -29
Coil Winders, Tapers, and Finishers 190 130 -60 -6
Photographic Processing Machine Operators 130 70 -60 -22
Extruding & Forming Machine Setters, Operators, & Tenders, Synthetic & Glass Fibers NA NA -40 -17
Weighers, Measurers, Checkers, and Samplers, Recordkeeping 170 130 -40 -6
Note: Employment data are rounded to the nearest 10. NA - Not available.
Source: Alabama Department of Industrial Relations and Center for Business and Economic Research, The University of Alabama.
Skills and Skills Gap Analyses
Jobs require skill sets and it is necessary that jobholders have the relevant skills. Table 2.14 shows skill types and definitions as provided by O*NET Online, which offers skill sets for all occupations ranked by the degree of importance. High-earning occupations typically require skills that are obtained in the pursuit of the high educational attainment levels that such jobs require. Lower earning occupations require more basic skill sets. Some occupations have no minimum skill set requirements (e.g. dishwashers and maids).
Table 2.15 shows the percentage of selected occupations in the region that list a particular skill as primary. We define primary skills as the 10 most important skills in the required skill set for an occupation. It is important to note that a particular skill may be more important and more extensively used in one occupation than another. Table 2.15 does not address such cross-occupational skill importance comparisons. In general, basic skills are most frequently listed as primary, which means that they are important for practically all jobs.

18 UA/CBER State of the Workforce Report V: Region 2
Table 2.14 Skill Types and Definitions
Basic Skills: Developed capacities that facilitate learning or the more rapid acquisition of knowledge.
Active Learning — Understanding the implications of new information for both current and future problem-solving and decision-making.
Active Listening — Giving full attention to what other people are saying, taking time to understand the points being made, asking questions as appropriate, and not interrupting at inappropriate times.
Critical Thinking — Using logic and reasoning to identify the strengths and weaknesses of alternative solutions, conclusions, or approaches to problems.
Learning Strategies — Selecting and using training/instructional methods and procedures appropriate for the situation when learning or teaching new things.
Mathematics — Using mathematics to solve problems.
Monitoring — Monitoring / Assessing performance of yourself, other individuals, or organizations to make improvements or take corrective action.
Reading Comprehension — Understanding written sentences and paragraphs in work-related documents.
Science — Using scientific rules and methods to solve problems.
Speaking — Talking to others to convey information effectively.
Writing — Communicating effectively in writing as appropriate for the needs of the audience.
Complex Problem Solving Skills: Developed capacities used to solve novel, ill-defined problems in complex, real-world settings.
Complex Problem Solving — Identifying complex problems and reviewing related information to develop and evaluate options and implement solutions.
Resource Management Skills: Developed capacities used to allocate resources efficiently.
Management of Financial Resources — Determining how money will be spent to get the work done and accounting for these expenditures.
Management of Material Resources — Obtaining and seeing to the appropriate use of equipment, facilities, and materials needed to do certain work.
Management of Personnel Resources — Motivating, developing, and directing people as they work, identifying the best people for the job.
Time Management — Managing one's own time and the time of others.
Social Skills: Developed capacities used to work with people to achieve goals.
Coordination — Adjusting actions in relation to others' actions.
Instructing — Teaching others how to do something.
Negotiation — Bringing others together and trying to reconcile differences.
Persuasion — Persuading others to change their minds or behavior.
Service Orientation — Actively looking for ways to help people.
Social Perceptiveness — Being aware of others' reactions and understanding why they react as they do.
Systems Skills: Developed capacities used to understand, monitor, and improve socio-technical systems.
Judgment and Decision Making — Considering the relative costs and benefits of potential actions to choose the most appropriate one.
Systems Analysis — Determining how a system should work and how changes in conditions, operations, and the environment will affect outcomes.
Systems Evaluation — Identifying measures or indicators of system performance and the actions needed to improve or correct performance, relative to the goals of the system.
Technical Skills: Developed capacities used to design, set-up, operate, and correct malfunctions involving application of machines or technological systems.
Equipment Maintenance — Performing routine maintenance on equipment and determining when and what kind of maintenance is needed.
Equipment Selection — Determining the kind of tools and equipment needed to do a job.
Installation — Installing equipment, machines, wiring, or programs to meet specifications.
Operation and Control — Controlling operations of equipment or systems.
Operation Monitoring — Watching gauges, dials, or other indicators to make sure a machine is working properly.
Operations Analysis — Analyzing needs and product requirements to create a design.
Programming — Writing computer programs for various purposes.
Quality Control Analysis — Conducting tests and inspections of products, services, or processes to evaluate quality or performance.
Repairing — Repairing machines or systems using the needed tools.
Technology Design — Generating or adapting equipment and technology to serve user needs.
Troubleshooting — Determining causes of operating errors and deciding what to do about it.
Source: O*NET Online (http://online.onetcenter.org/skills/).

State of the Workforce Report V: Region 2 UA/CBER 19
Table 2.15 Percentage of Selected Occupations for Which Skill Is Primary
Selected High-Demand Occupations
Selected Fast-Growing Occupations
Selected High-Earning Occupations
Basic Skills Active Learning 30 38 38 Active Listening 93 94 74 Critical Thinking 93 91 78 Learning Strategies 3 6 2 Mathematics 13 9 12 Monitoring 63 82 38 Reading Comprehension 85 68 66 Science 28 15 34 Speaking 90 91 72 Writing 50 35 42
Complex Problem Solving Skills Complex Problem Solving 60 53 64
Resource Management Skills Management of Financial Resources 0 0 2 Management of Material Resources 0 0 0 Management of Personnel Resources 5 0 10 Time Management 30 24 22
Social Skills Coordination 43 44 28 Instructing 10 18 4 Negotiation 3 0 6 Persuasion 5 0 12 Service Orientation 43 53 14 Social Perceptiveness 48 56 36
Systems Skills Judgment and Decision Making 70 68 74 Systems Analysis 18 21 14 Systems Evaluation 10 12 8
Technical Skills Equipment Maintenance 3 6 0 Equipment Selection 0 0 0 Installation 0 0 0 Operation and Control 3 3 0 Operation Monitoring 13 18 4 Operations Analysis 18 9 20 Programming 10 9 6 Quality Control Analysis 5 9 0 Repairing 3 6 0 Technology Design 0 0 0 Troubleshooting 3 6 0
Note: Rounding errors may be present.
Source: O*NET Online and Center for Business and Economic Research, The University of Alabama.

20 UA/CBER State of the Workforce Report V: Region 2
High-earning occupations require more science, complex problem solving, resource management, persuasion, negotiation, judgment and decision making, and operation analysis than both high-demand and fast-growing jobs. These are skills that require long training periods and postsecondary education. However, high-earning jobs require slightly less social skills (except persuasion and negotiation) and significantly less technical skills (except operations analysis). High-demand occupations require somewhat more complex problem solving and resource management skills than fast-growing occupations; but less social and technical skills.
Table 2.16 shows skill gap indexes for all 35 skills in Table 2.14. Skills gap indexes range up to 100 and are standardized measures of the gap between current supply and projected demand. The index does not provide any information about current or base year skill supply. Its focus is on the projection period, which for Table 2.16 is 2008 to 2018, and identifies critical skill needs. The index essentially ranks expected training needs. The higher the index the more critical is the skill over the specified projection period.
For policy and planning purposes, skill gap indexes have to be considered together with replacement indexes, which are the expected shares of job openings due to replacement. Replacement is necessary because of turnover and people leaving the labor force. The smaller the replacement index, the larger the share of job openings due to growth, which in turn implies a need to increase the pace of skill training. Skill gap indexes point to the need to ramp up the scale of skill training while replacement indexes address the pace of training.
By skill type the skill gap indexes show that basic skills are most critical followed by social, complex problem solving, resource management, system, and technical skills. The importance of basic skills generally and for high-demand, high-growth, and high-earning jobs indicates a strong need for training in these skills. The pace of training needs to increase for technical, systems, and complex problem solving skills; the scale of training should be raised for basic and social skills.
Education and Training Issues
Educational attainment in Region 2 is above that of the state as a whole. Eighty percent of residents age 25 and over had graduated from high school in 2000, compared to nearly 81 percent for Alabama. Of that population, about 23 percent have a bachelor’s or higher degree versus 22 percent for the state. Skill and education requirements for jobs keep rising. This highlights a strong need to raise educational attainment as rates vary considerably across the region.
Table 2.17 shows the number of selected occupations in the region for which a particular education/training category is most common. In general, high-earning occupations require high educational attainment levels; all but two of the high-earning occupations require a bachelor’s or higher degree. Thirty one (78 percent) of the 40 high-demand occupations require an associate degree at the minimum and 27 (68 percent) require a bachelor’s or higher degree. Twenty-three (68 percent) of the 34 fast-growing occupations require an associate degree at the minimum, with 16 (47 percent) requiring a bachelor’s or higher degree.
The 2008 to 2018 occupational projections indicate that future jobs will require postsecondary education and training at a minimum. Job ads are increasingly requiring a high school diploma or

State of the Workforce Report V: Region 2 UA/CBER 21
GED at a minimum. Of the region’s 840 occupations and occupational categories, 79 are expected to decline over the period and education and training for these should slow accordingly.
Table 2.16 Skills Gap Indexes (Base Year 2008 and Projected Year 2018)
Skill Total Openings
(Projected Demand) Replacement
Index Skills Gap
Index
Reading Comprehension 7,800 55 100 Active Listening 7,785 55 97 Critical Thinking 6,865 55 94 Speaking 6,325 54 91 Active Learning 6,360 55 89 Coordination 6,060 55 86 Writing 5,635 55 83 Time Management 5,425 54 80 Instructing 5,570 55 77 Monitoring 5,440 55 74 Learning Strategies 5,100 55 71 Social Perceptiveness 4,255 54 69 Service Orientation 3,775 52 66 Complex Problem Identification 3,785 54 63 Judgment and Decision Making 3,995 55 60 Persuasion 3,990 56 57 Mathematics 3,580 54 54 Equipment Selection 2,950 56 51 Troubleshooting 2,100 55 49 Negotiation 1,980 61 46 Management of Personnel Resources 1,880 61 43 Operations Analysis 1,520 53 40 Installation 1,500 55 37 Equipment Maintenance 1,450 56 34 Systems Analysis 1,070 48 31 Systems Evaluation 1,155 51 29 Quality control 1,430 57 26 Technology Design 975 50 23 Management of Financial Resources 1,170 61 20 Science 930 53 17 Repairing 830 60 14 Operation and Control 1,030 62 11 Operation Monitoring 1,070 66 9 Management of Material Resources 745 63 6 Programming 270 46 3 Source: Alabama Department of Industrial Relations.

22 UA/CBER State of the Workforce Report V: Region 2
Table 2.17 Number of Selected Occupations by Education/Training Requirement
Most Common Education/Training Requirements Categories
Selected High-Demand Occupations
Selected Fast-Growing Occupations
Selected High-Earning Occupations
First Professional Degree 4 4 12 Doctoral Degree 0 0 3 Master's Degree 3 4 5 Work Experience Plus a Bachelor's or Higher Degree 4 1 13 Bachelor's Degree 16 7 15 Associate Degree 4 7 1 Postsecondary Vocational Training 2 3 0 Work Experience in a Related Occupation 2 0 1 Long-term On-the-job Training 0 0 0 Moderate-term On-the-job Training 4 4 0 Short-term On-the-job Training 1 4 0
Note: The last three education and training requirements categories are based on the length of time it generally takes an average worker to achieve proficiency for occupations in which postsecondary training is usually not needed for entry. Long-term requires more than 12 months on-the-job training that can include up to four years of apprenticeship, formal classroom instruction, and short-term employer-sponsored training. Trainees are generally considered to be employed in the occupation. Moderate-term requires one to 12 months on-the-job experience and informal training. Short-term requires up to one month on-the-job experience and training.
Source: O*NET Online; Center for Business and Economic Research, The University of Alabama; and Alabama Department of Industrial Relations.

State of the Workforce Report V: Region 2 UA/CBER 23
Implications and Recommendations
From a 2008 base, a worker surplus of 35,095 for 2018 and a worker shortfall of 11,893 for 2025 are expected (Table 2.18). Worker surplus may be somewhat overstated because of the expected impact of Base Realignment and Closures (BRAC) related troop increases and job opportunities at the Redstone Arsenal Military Facility in Huntsville. A focus on worker skills must be a priority through 2018, after which both skills and the expected shortfall must be priorities through 2025. Worker shortfalls for critical occupations will need to be addressed continuously through 2025 as well.
Table 2.18 Expected Worker Shortfall
2008-2018 2008-2025Total population growth (percent) 11.1 17.6Age 20-64 population growth (percent) 9.6 12.0Job growth (percent) 2.3 14.5Worker shortfall (percent) -7.3 2.5Worker shortfall (number) -35,098 11,893
Note: Rounding errors may be present.
Source: Center for Business and Economic Research, The University of Alabama.
Employment is critical to economic development and so strategies to address potential shortfalls must be adopted and implemented. Such strategies should aim at increasing labor force participation, encouraging in-migration, and raising worker productivity. Efforts to address the need for higher labor force participation, higher productivity, and faster labor force growth to meet workforce demand must include: (1) improvements in education and its funding; (2) continuation and enhancement of programs to assess, retrain, and place dislocated workers; (3) focus on hard-to-serve populations (e.g. out-of-school youth); (4) lowering the high school dropout rate; (5) use of economic opportunities to attract new residents; (6) encouragement of older worker participation in the labor force; and (7) facilitation of in-commuting.
Improving education is vital because a highly educated and productive workforce is a critical economic development asset. The educational and training requirements of high-demand, fast-growing, and high-earning occupations show the significance of education in developing the workforce of the future. The importance of basic skills generally and for high-demand, high-growth, and high-earning jobs demonstrates a strong need for training in these skills. The pace of training needs to increase for technical, systems, and complex problem solving skills; the scale of training should be raised for basic and social skills. Ideally, all high school graduates should possess basic skills so that postsecondary and higher education can focus on other and more complex skills while enhancing these basic skills. Employers should be an integral part of planning for training as they can help to identify future skill needs and any existing gaps. Education and training for the 20 sharp-declining occupations in Table 2.13 should slow accordingly.
Another very important reason to improve education is that more educated people are more likely to work; data on worker participation and educational attainment show that labor force participation increases with worker education. Productivity also rises with education, which yields high private and social returns. Workforce development must view all of the education and other programs (e.g. adult education, career technical training, worker retraining, career readiness, etc.) as one system.

24 UA/CBER State of the Workforce Report V: Region 2
Funding to support workforce development may require tax reform at state and local levels and must provide for flexibility as workforce needs change over time and demand different priorities.
Programs to assess, retrain, and place dislocated workers—especially those affected by outsourcing and structural changes in the economy—should be continued and enhanced because they can improve the labor force participation rate. Hard-to-serve populations include persons in poverty, those receiving welfare, those in sparsely populated areas, and those on active parole. These populations are often outside of the mainstream economy and are in poverty. They usually have difficulty finding work because they have low levels of educational attainment, lack occupational skills, or face geographic or other barriers. They are a potential human resource and investment in training, transportation, child care, infrastructure, etc. may be needed to tap this resource.
In-migration is one way of growing the labor force to fill the critical, specialized skill needs seen in some areas of Region 2. While the region’s population growth rate is above average, there is a strong need for workers with higher education and experience in science and engineering to meet the expected job demand. Higher employment demand could be partially served by in-commuting. However, new residents can be attracted using higher-paying job opportunities from the region’s economic development successes. Investment in amenities and infrastructure may be needed to support such growth. In-migration is generally more beneficial to a region than in-commuting since it grows the economy faster and adds to the tax base.
Policies that facilitate and encourage older worker participation are needed as older workers can help meet the region’s workforce challenge. Such policies can be related to income taxation, job flexibility, and retirement programs. As the share of older people in the population is projected to increase (see Table 2.5), it becomes even more important that they be active in the workforce. Older worker participation has been rising nationally since the early 1990s. This has been attributed to reasons including:
• Older workers can work longer because they are healthier • The number of physically demanding jobs is falling • Defined contribution plans are replacing pensions • There are fewer employer-paid retiree health insurance programs • Social security reforms affecting those born after 1938 (i) gradually raise the normal
retirement age from 65 to 67, (ii) increase the rate at which monthly payments rise with delayed benefits, and (iii) eliminate the reduction in benefits for those working beyond the full retirement age.
Diversifying the region’s economy will strengthen it. This demands that economic development also focus on retaining, expanding, and attracting businesses that provide more high-earning jobs. Current workers—including the underemployed—would welcome higher-earning opportunities. An economic development focus on diversification would require that workforce development pay attention to postsecondary and higher educational systems to ensure a ready and available workforce for new and expanding businesses. The higher incomes earned by graduates of these institutions would help raise personal income for the region and provide additional local (county and city) tax revenue. Raising personal income by improving educational attainment and technological skills is an effective economic development strategy even for a region that has relatively high population and labor force growth rates. Together, workforce development and economic development can build a strong, well-diversified economy. Indeed, one cannot achieve success without the other.


