Refining An Overview - Pakistan Credit Rating … · 2014-12-31 · Refining –An Overview October...
37
Refining – An Overview October 2014 Petroleum Industry: Technical Jargons Crude Oil Shale Oil International Refining Trends Lube Base Oil (LBO) Domestic Oil Dynamics Domestic Refineries Outlook
Transcript of Refining An Overview - Pakistan Credit Rating … · 2014-12-31 · Refining –An Overview October...

Refining – An Overview
October 2014
Petroleum Industry: Technical Jargons
Crude Oil Shale OilInternational
Refining Trends
Lube Base Oil (LBO)
Domestic Oil Dynamics
Domestic Refineries
Outlook

Petroleum Industry – Technical Jargons
Upstream - It involves the exploration for and extraction of petroleum crude
oil and natural gas. The upstream oil sector is also known as the exploration and production
(E&P) sector.
Midstream - The midstream involves storing, marketing and transporting petroleum
crude oil, natural gas. Midstream operations are sometimes included in the downstream category.
Downstream - The downstream sector includes petroleum refineries, petroleum
product distribution, retail outlets and natural gas distribution companies.
Petroleum Industry: Technical Jargons
Crude Oil Shale OilInternational
Refining Trends
Lube Base Oil (LBO)
Domestic Oil Dynamics
Domestic Refineries
Outlook

Crude Oil
Petroleum Industry: Technical Jargons
Crude Oil Shale OilInternational
Refining Trends
Lube Base Oil (LBO)
Domestic Oil Dynamics
Domestic Refineries
Outlook
Largest Consumer
USA - 801 mln tonnes
China - 507 mln tonnes
Largest Producer
Saudi Arabia - 542 mln tonnes
Russia - 531 mln tonnes
Largest Reserves
Venezuela - 46,576 mln tonnes
Saudi Arabia - 36,518 mln tonnes
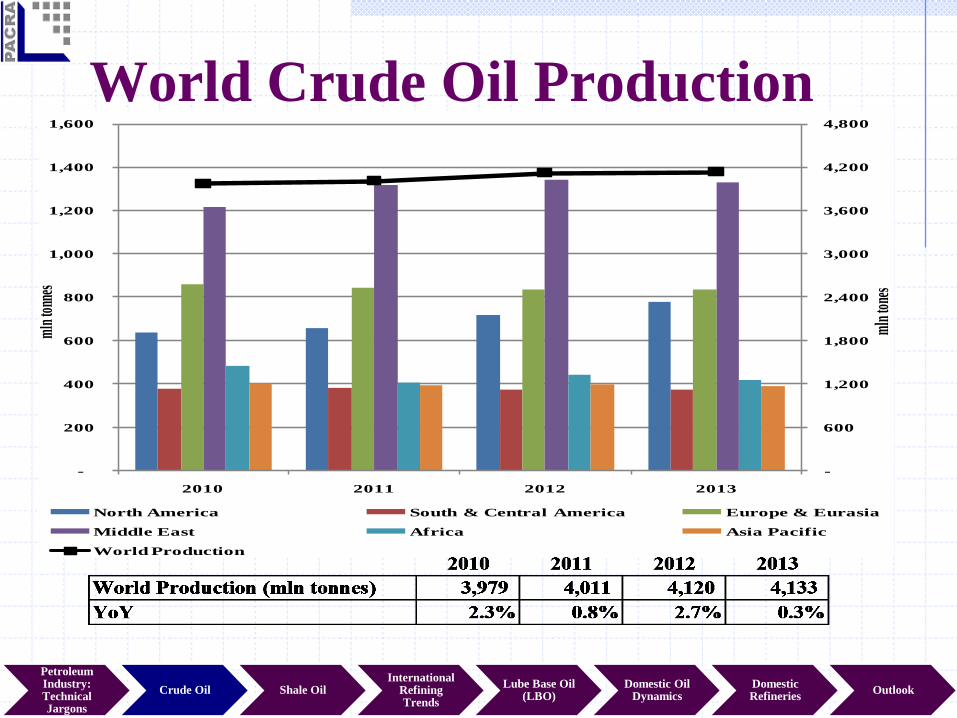
mln tonnes 1990 2000 2010 2013
World Oil Reserves 145,007 177,550 228,851 238,204
World Consumption (annual) 3,162 3,584 4,040 4,185
World Production (annual) 3,175 3,620 3,979 4,133
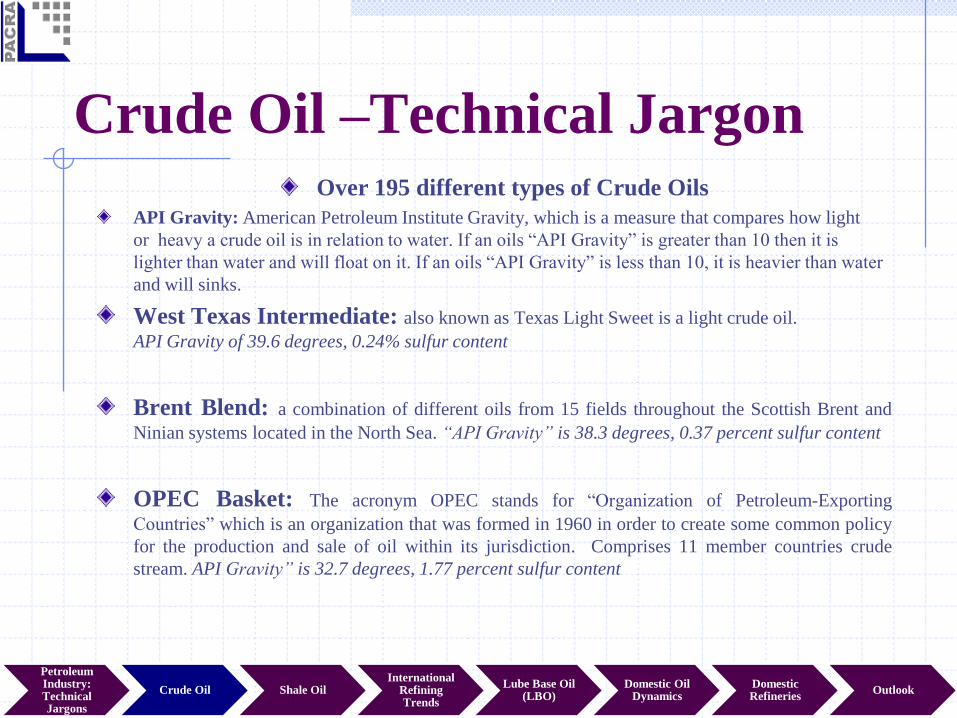
Crude Oil –Technical JargonOver 195 different types of Crude Oils
API Gravity: American Petroleum Institute Gravity, which is a measure that compares how light
or heavy a crude oil is in relation to water. If an oils “API Gravity” is greater than 10 then it is
lighter than water and will float on it. If an oils “API Gravity” is less than 10, it is heavier than water
and will sinks.
West Texas Intermediate: also known as Texas Light Sweet is a light crude oil.
API Gravity of 39.6 degrees, 0.24% sulfur content
Brent Blend: a combination of different oils from 15 fields throughout the Scottish Brent and
Ninian systems located in the North Sea. “API Gravity” is 38.3 degrees, 0.37 percent sulfur content
OPEC Basket: The acronym OPEC stands for “Organization of Petroleum-Exporting
Countries” which is an organization that was formed in 1960 in order to create some common policy
for the production and sale of oil within its jurisdiction. Comprises 11 member countries crude
stream. API Gravity” is 32.7 degrees, 1.77 percent sulfur content
Petroleum Industry: Technical Jargons
Crude Oil Shale OilInternational
Refining Trends
Lube Base Oil (LBO)
Domestic Oil Dynamics
Domestic Refineries
Outlook

World Crude Oil Reserves
Petroleum Industry: Technical Jargons
Crude Oil Shale OilInternational
Refining Trends
Lube Base Oil (LBO)
Domestic Oil Dynamics
Domestic Refineries
Outlook
-
50
100
150
200
250
2011 2012 2013
000'
mln
tonn
es
North America South & Central America Europe & Eurasia
Middle East Africa Asia Pacific
Total
-
600
1,200
1,800
2,400
3,000
3,600
4,200
4,800
-
200
400
600
800
1,000
1,200
1,400
1,600
2010 2011 2012 2013
mln
tone
s
mln
tonn
es
North America South & Central America Europe & Eurasia
Middle East Africa Asia Pacific
World Production
World Crude Oil Production
Petroleum Industry: Technical Jargons
Crude Oil Shale OilInternational
Refining Trends
Lube Base Oil (LBO)
Domestic Oil Dynamics
Domestic Refineries
Outlook

World Crude Oil Consumption
-
600
1,200
1,800
2,400
3,000
3,600
4,200
4,800
-
200
400
600
800
1,000
1,200
1,400
1,600
2010 2011 2012 2013
mln
tone
s
mln
tonn
es
North America South & Central America Europe & Eurasia
Middle East Africa Asia Pacific
World Consumption
Petroleum Industry: Technical Jargons
Crude Oil Shale OilInternational
Refining Trends
Lube Base Oil (LBO)
Domestic Oil Dynamics
Domestic Refineries
Outlook

Petroleum Industry: Technical Jargons
Crude Oil Shale OilInternational
Refining Trends
Lube Base Oil (LBO)
Domestic Oil Dynamics
Domestic Refineries
Outlook
-
20
40
60
80
100
120
140
160
US
D / b
bl
Price Comparison | WTI and Brent
Brent Crude WTI

Global Crude Oil TradeIn mln tons
Petroleum Industry: Technical Jargons
Crude Oil Shale OilInternational
Refining Trends
Lube Base Oil (LBO)
Domestic Oil Dynamics
Domestic Refineries
Outlook

Shale Oil
Petroleum Industry: Technical Jargons
Crude Oil Shale OilInternational
Refining Trends
Lube Base Oil (LBO)
Domestic Oil Dynamics
Domestic Refineries
Outlook

Shale Oil & Shale Gas –Technically Recoverable Reserves
Petroleum Industry: Technical Jargons
Crude Oil Shale OilInternational
Refining Trends
Lube Base Oil (LBO)
Domestic Oil Dynamics
Domestic Refineries
Outlook
Shale Oil
Shale Gas

International Refining Trends
Petroleum Industry: Technical Jargons
Crude Oil Shale OilInternational
Refining Trends
Lube Base Oil (LBO)
Domestic Oil Dynamics
Domestic Refineries
Outlook
1990 2000 2010 2013
Global Refining Capacities (mln tonnes) 3,706 4,094 4,572 4,727
YoY 10.5% 11.7% 3.4%

Refining Process
}
}}
Light
Distillates
Medium
Distillates
Heavy
Distillates
Petroleum Industry: Technical Jargons
Crude Oil Shale OilInternational
Refining Trends
Lube Base Oil (LBO)
Domestic Oil Dynamics
Domestic Refineries
Outlook

Types of RefineriesTopping - The topping refinery just separates the crude into its constituent petroleum products by distillation,
known as Atmospheric Distillation. Topping Refinery produces naphtha but no gasoline.
Hydroskimming - The hydroskimming refinery is equipped with Atmospheric Distillation, naphtha
reforming and necessary treating processes. Hydroskimming refinery is more complex than a topping refinery
and it produces gasoline.
Cracking - The cracking refinery, in addition to the above, is equipped with vacuum distillation and catalytic
cracking. The cracking refinery reduces fuel oil by conversion to light distillates and middle distillates.
Coking - The coking refinery is equipped to process the vacuum residue into high value products using the
Delayed Coking Process. The coking refinery adds further complexity to the cracking refinery by high
conversion of fuel oil into distillates and petroleum coke.
Nelson Complexity Index - The Nelson Complexity Index typically varies from about 2 for
Hydroskimming refineries, to about 5 for the Cracking refineries and over 9 for the Coking refineries.
Refineries, with high Nelson Complexity Index have the necessary flexibility in processing a wide variety of
crudes and are capable of achieving higher value addition.
Petroleum Industry: Technical Jargons
Crude Oil Shale OilInternational
Refining Trends
Lube Base Oil (LBO)
Domestic Oil Dynamics
Domestic Refineries
Outlook

-
600
1,200
1,800
2,400
3,000
3,600
4,200
4,800
-
200
400
600
800
1,000
1,200
1,400
1,600
2010 2011 2012 2013
mln
tone
s
mln
tonn
es
North America South & Central America Europe & Eurasia
Middle East Africa Asia Pacific
Global Refining Capacities
Global Refining Capacities
2010 2011 2012 2013
Global Refining Capacities (mln tonnes) 4,572 4,591 4,658 4,727
YoY 1.1% 0.4% 1.5% 1.5%
Petroleum Industry: Technical Jargons
Crude Oil Shale OilInternational
Refining Trends
Lube Base Oil (LBO)
Domestic Oil Dynamics
Domestic Refineries
Outlook

Regional Capacity Utilization
50%
60%
70%
80%
90%
50%
60%
70%
80%
90%
2010 2011 2012 2013
%a
ge
%age
North America South & Central America Europe & Eurasia
Middle East Africa Asia Pacific
Global Capacity Utilization
Petroleum Industry: Technical Jargons
Crude Oil Shale OilInternational
Refining Trends
Lube Base Oil (LBO)
Domestic Oil Dynamics
Domestic Refineries
Outlook

In mln tons
Global Refined Products Trade
Petroleum Industry: Technical Jargons
Crude Oil Shale OilInternational
Refining Trends
Lube Base Oil (LBO)
Domestic Oil Dynamics
Domestic Refineries
Outlook

Lube Base Oils (LBO)
Petroleum Industry: Technical Jargons
Crude Oil Shale OilInternational
Refining Trends
Lube Base Oil (LBO)
Domestic Oil Dynamics
Domestic Refineries
Outlook

Lube Oil –Technical JargonViscosity Index?
Used to measure the “thickness” of liquid.
High for “thin” liquids and “low” for thick, which means,
The higher the VI, the less an oil will thicken as it gets cold and the less it will thin out at higher temperatures –
providing better lubricant performance at both temperature extremes.
Petroleum Industry: Technical Jargons
Crude Oil Shale OilInternational
Refining Trends
Lube Base Oil (LBO)
Domestic Oil Dynamics
Domestic Refineries
Outlook
50%
30%
11%9%
Group I Group II
Group III Group IV & V
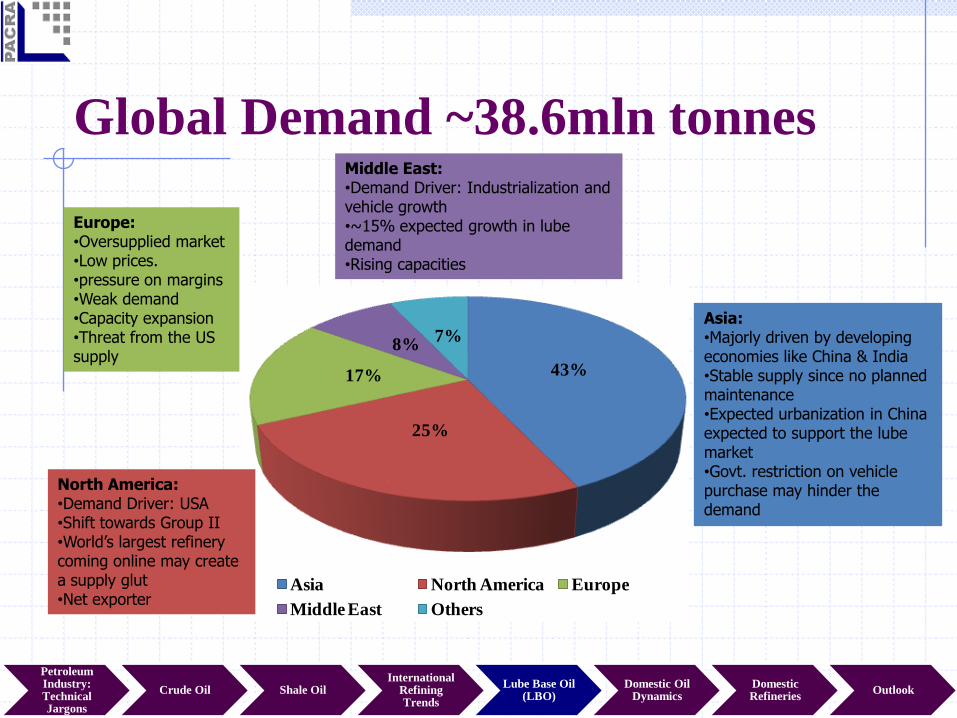
Global Demand ~38.6mln tonnes
43%
25%
17%
8%7%
Asia North America Europe
Middle East Others
Europe:•Oversupplied market•Low prices.•pressure on margins•Weak demand•Capacity expansion •Threat from the US supply
Asia:•Majorly driven by developing economies like China & India•Stable supply since no planned maintenance•Expected urbanization in China expected to support the lube market•Govt. restriction on vehicle purchase may hinder the demand
North America:•Demand Driver: USA•Shift towards Group II•World’s largest refinery coming online may create a supply glut•Net exporter
Middle East:•Demand Driver: Industrialization and vehicle growth•~15% expected growth in lube demand•Rising capacities
Petroleum Industry: Technical Jargons
Crude Oil Shale OilInternational
Refining Trends
Lube Base Oil (LBO)
Domestic Oil Dynamics
Domestic Refineries
Outlook

•Margins still under pressure post Baltic Sea glut problems.
•Going forward, the margins are expected to remain under pressure owing to the extensive
capacity expansion, which is expected to rise by ~3.5mln tonnes per annum by 2014.
Refining Margins
Petroleum Industry: Technical Jargons
Crude Oil Shale OilInternational
Refining Trends
Lube Base Oil (LBO)
Domestic Oil Dynamics
Domestic Refineries
Outlook

Capacity Expansion
Petroleum Industry: Technical Jargons
Crude Oil Shale OilInternational
Refining Trends
Lube Base Oil (LBO)
Domestic Oil Dynamics
Domestic Refineries
Outlook

Domestic Oil Dynamics
Petroleum Industry: Technical Jargons
Crude Oil Shale OilInternational
Refining Trends
Lube Base Oil (LBO)
Domestic Oil Dynamics
Domestic Refineries
Outlook

Recoverable Reserves
51%
60% 58%
20%
15%14%
11%8% 10%
9% 8% 8%
7% 9%9%2% 1%
-
80
160
240
320
400
0%
20%
40%
60%
80%
100%
2011 2012 2013
mln
ba
rrel
s
%
ag
e
OGDCL MOL PPL POL UEPL Others Total
Petroleum Industry: Technical Jargons
Crude Oil Shale OilInternational
Refining Trends
Lube Base Oil (LBO)
Domestic Oil Dynamics
Domestic Refineries
Outlook

Crude Production
56% 57% 54%
11% 12%14%
10%10%
9%
5%4%
3%
13% 10% 15%
5% 6% 5%
-
6
12
18
24
30
0%
20%
40%
60%
80%
100%
2011 2012 2013
mln
bar
rels
% a
ge
OGDCL MOL PPL POL UEPL Others Total
Petroleum Industry: Technical Jargons
Crude Oil Shale OilInternational
Refining Trends
Lube Base Oil (LBO)
Domestic Oil Dynamics
Domestic Refineries
Outlook

Domestic Refineries
Petroleum Industry: Technical Jargons
Crude Oil Shale OilInternational
Refining Trends
Lube Base Oil (LBO)
Domestic Oil Dynamics
Domestic Refineries
Outlook

Refining Capacity & Utilization
Capactity Utilization Capactity Utilization Capactity Utilization
Byco Petroleum 1.7 26.9% 1.8 7.3% 7.2 10.8% -
Pak Arab Refinery 4.5 74.6% 4.5 70.4% 4.5 91.6% -
National Refinery 2.7 89.3% 2.7 83.9% 2.7 78.8% -
Pakistan Refinery 2.1 76.2% 2.1 78.7% 2.1 74.1% -
Attock Refinery 1.9 95.8% 1.9 97.5% 2.0 100.0% 0.5
ENAR Petrotech 0.1 86.3% 0.1 98.2% 0.3 56.0% -
Dhodak Refinery 0.1 4.4% - - - - -
Total 13.15 74% 13.09 70% 18.79 57% 0.5
11.6 86%
Refinery 2011 2012 2013
Expansion
Without Byco
Petroleum Industry: Technical Jargons
Crude Oil Shale OilInternational
Refining Trends
Lube Base Oil (LBO)
Domestic Oil Dynamics
Domestic Refineries
Outlook

Crude Oil Processed
12.4 11.5 10.5
6.7 6.1
7.4
3.1
3.1 3.3
-
5.0
10.0
15.0
20.0
25.0
2011 2012 2013
mln
to
nn
es
POL Imports Imported Crude Local Crude
Petroleum Industry: Technical Jargons
Crude Oil Shale OilInternational
Refining Trends
Lube Base Oil (LBO)
Domestic Oil Dynamics
Domestic Refineries
Outlook
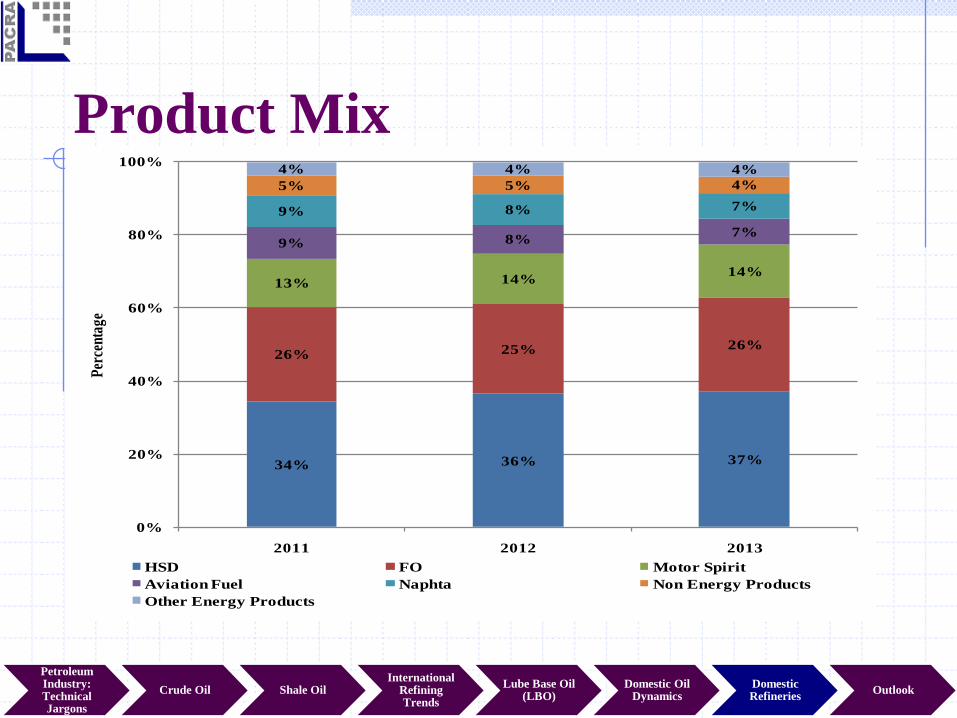
Product Mix
34% 36% 37%
26% 25% 26%
13% 14%14%
9% 8%7%
9% 8% 7%
5% 5% 4%
4% 4% 4%
0%
20%
40%
60%
80%
100%
2011 2012 2013
Per
cent
age
HSD FO Motor Spirit
Aviation Fuel Naphta Non Energy Products
Other Energy Products
Petroleum Industry: Technical Jargons
Crude Oil Shale OilInternational
Refining Trends
Lube Base Oil (LBO)
Domestic Oil Dynamics
Domestic Refineries
Outlook

Supply Demand Mix – Fuels
56%
48%43%
50%56% 54%
75% 77%
67%
44%
52%57%
50%44% 46%
25% 23%
33%
-
2
4
6
8
10
0%
20%
40%
60%
80%
100%
2011 2012 2013 2011 2012 2013 2011 2012 2013
HSD Motor Spirit Furnace Oil
mln
to
nn
es
% a
ge
Imports Local Consumption
Petroleum Industry: Technical Jargons
Crude Oil Shale OilInternational
Refining Trends
Lube Base Oil (LBO)
Domestic Oil Dynamics
Domestic Refineries
Outlook

Petroleum Industry: Technical Jargons
Crude Oil Shale OilInternational
Refining Trends
Lube Base Oil (LBO)
Domestic Oil Dynamics
Domestic Refineries
Outlook

88
92
96
100
104
108
112
Jun-13 Sep-13 Dec-13 Mar-14 Jun-14
Exchange Rate
Exchange Rate
(1,500)
(1,000)
(500)
-
500
1,000
1QFY14 2QFY14 3QFY14 4QFY14
Exchange Gain / Loss
PARCO NRL ARL PRL
Petroleum Industry: Technical Jargons
Crude Oil Shale OilInternational
Refining Trends
Lube Base Oil (LBO)
Domestic Oil Dynamics
Domestic Refineries
Outlook

Impact of Regulatory Duty
Petroleum Industry: Technical Jargons
Crude Oil Shale OilInternational
Refining Trends
Lube Base Oil (LBO)
Domestic Oil Dynamics
Domestic Refineries
Outlook
Sale of HSD (Thousand Tonnes) 6,820 2,954 3,866 554 725 1,655 607 290
Conversion to Liters (Mln Liters) 8,149 3,530 4,620 661 866 1,978 725 346
Average Ex-Refinery Price (PKR/Liter) 74.39 74.39 74.39 74.39 74.39 74.39 74.39 74.39
Total Revenue (PKR Mln) 507,318 219,726 287,592 41,177 53,920 123,128 45,159 21,538
Deemed Duty on HSD - 7.5% (PKR Mln) 38,049 16,479 21,569 3,088 4,044 9,235 3,387 1,615
Profitability (PKR Mln) 27,580 2,627 3,520 19,950 1,482
Profitability excluding deemed duty (PKR Mln) 6,010 (461) (524) 10,716 (1,905)
Deemed Duty increase from FY16 - 9% (PKR Mln) 7,610 3,296 4,314 618 809 1,847 677 323
Pakistan
Refinery
(PRL)
Byco
Petroleum
Pakistan
(Byco)
Refining
Sector
Government of
Pakistan
(Imports)
Country's
CollectionFY13
Attock
Refinery
(ARL)
National
Refinery
(NRL)
Pak
Arab
Refinery
(PARCO
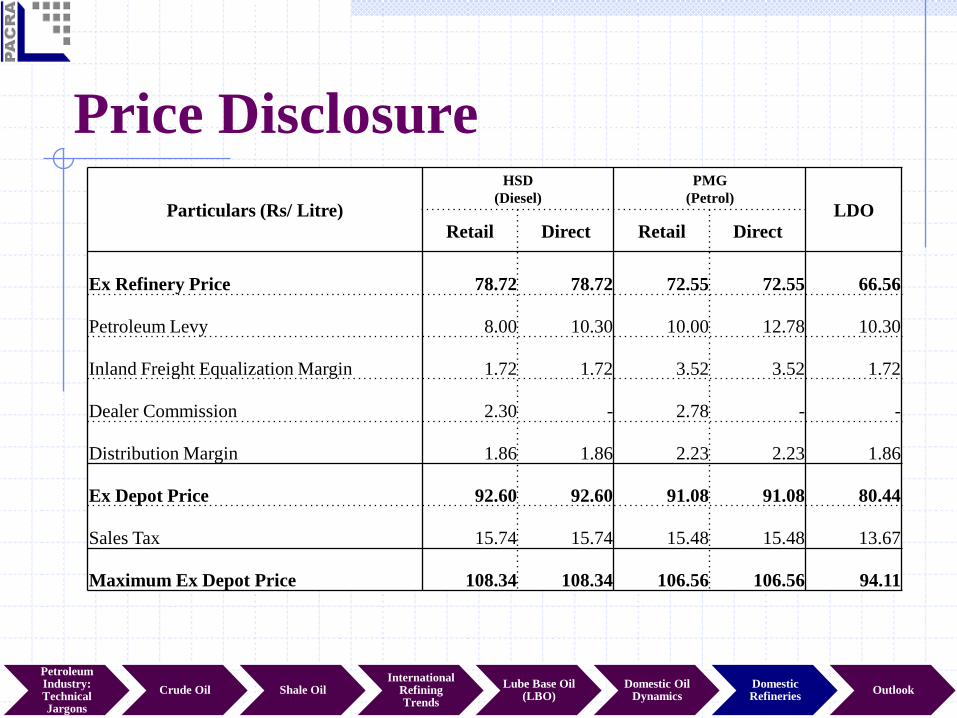
Price Disclosure
Particulars (Rs/ Litre)
HSD
(Diesel)
PMG
(Petrol)LDO
Retail Direct Retail Direct
Ex Refinery Price 78.72 78.72 72.55 72.55 66.56
Petroleum Levy 8.00 10.30 10.00 12.78 10.30
Inland Freight Equalization Margin 1.72 1.72 3.52 3.52 1.72
Dealer Commission 2.30 - 2.78 - -
Distribution Margin 1.86 1.86 2.23 2.23 1.86
Ex Depot Price 92.60 92.60 91.08 91.08 80.44
Sales Tax 15.74 15.74 15.48 15.48 13.67
Maximum Ex Depot Price 108.34 108.34 106.56 106.56 94.11
Petroleum Industry: Technical Jargons
Crude Oil Shale OilInternational
Refining Trends
Lube Base Oil (LBO)
Domestic Oil Dynamics
Domestic Refineries
Outlook
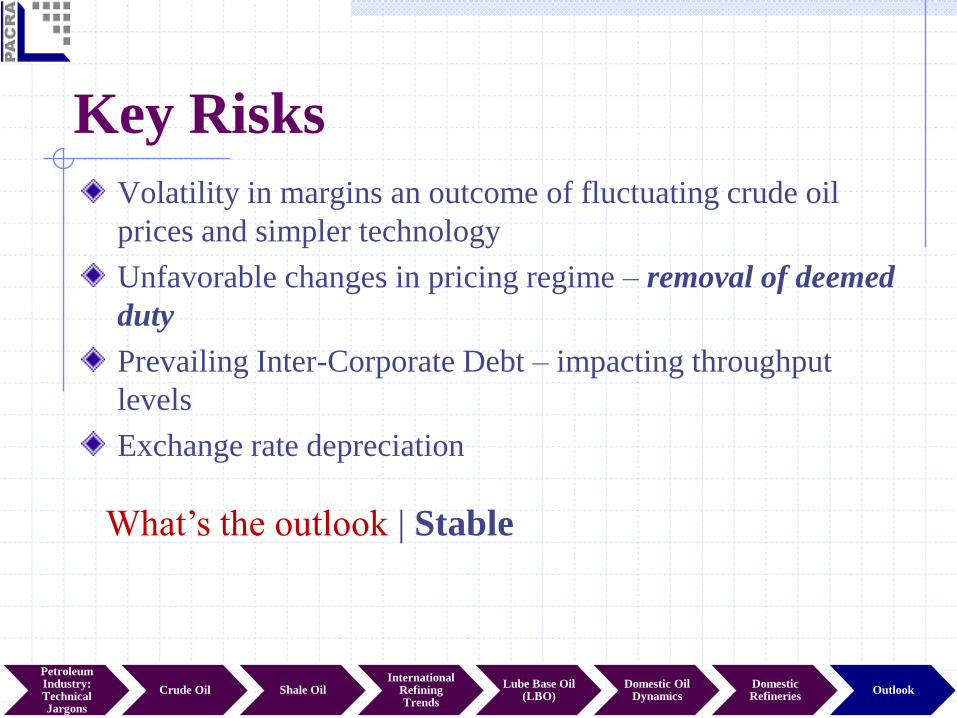
Key Risks
Volatility in margins an outcome of fluctuating crude oil
prices and simpler technology
Unfavorable changes in pricing regime – removal of deemed
duty
Prevailing Inter-Corporate Debt – impacting throughput
levels
Exchange rate depreciation
What’s the outlook | Stable
Petroleum Industry: Technical Jargons
Crude Oil Shale OilInternational
Refining Trends
Lube Base Oil (LBO)
Domestic Oil Dynamics
Domestic Refineries
Outlook

Bibliography
1. Pakistan Energy Year Book : 2012-2013
2. Attock Petroleum Limited: www.apl.com.pk | Petroleum Product Prices
3. Attock Refinery Limited –Annual & Quarterly Financial Statements –Sep13, Dec13, Mar14, Jun14
4. BP Statistical Review of World Energy 2013: bp.com
5. US Energy Information Administration
6. Bain & Company: www.bain.com | Global Refining
7. zedatawatch: A Brief History of Oil Prices and Middle East Tensions: Fear of a Black Gold Shortage
8. Oil Price History and Analysis: http://www.wtrg.com/prices.htm
9. The Economist: http://www.economist.com/node/18285768
10. ICIS Base Oil Review 2013
11. Argus Base Oil Report -2014
12. Kline & Company
13. Fuels & Lube International: http://fuelsandlubes.com
14. Lube Report: www.lubengreases.com
15. Ernst & Young - The international dynamics of shale
16. Ernst & Young -Shale gas in Europe: Revolution or evolution?
17. KPMG -Shale Development: Global Update
18. PricewaterhouseCoopers Shale Oil, the next energy resolution
19. Deloitte University Press- US shale: A game of choices
20. Oxford Business Group
21. http://instituteforenergyresearch.org/analysis/colorado-an-energy-and-economic-analysis/
DISCLAIMERPACRA has used due care in preparation of this document. Our information has been obtained
from sources we consider to be reliable but its accuracy or completeness is not guaranteed.
The information in this document may be copied or otherwise reproduced, in whole or in part,
provided the source is duly acknowledged. The presentation should not be relied upon as
professional advice.
Analysts Rai Umar Zafar
Manager Ratings
+92 42 3586 9504
Muhammad Siddiq
Senior Financial Analyst
+92 42 3586 9504
Suffiyan Saleem
Financial Analyst
+92 42 3586 9504