REDINGTON (INDIA) LIMITED
29
REDINGTON (INDIA) LIMITED Q2FY22 Earnings Presentation Sep 2021
Transcript of REDINGTON (INDIA) LIMITED
REDINGTON (INDIA) LIMITEDQ2FY22 Earnings Presentation
Sep 2021
Disclaimer
This presentation contains “forward looking statements” including, but without limitation, statements relating to
the implementation of strategic initiatives, and other statements relating to Redington India Limited’s future
business developments and economic performance.
While these forward looking statements indicate our assessment and future expectations concerning the
development of our business, a number of risks, uncertainties and other unknown factors could cause actual
developments and results to differ materially from our expectations.
These factors include, but are not limited to, general market, macro-economic, governmental and regulatory trends,
movements in currency exchange and interest rates, competitive pressures, technological developments, changes in
the financial conditions of third parties dealing with us, legislative developments, and other key factors that could
affect our business and financial performance.
Redington India Limited undertakes no obligation to periodically revise any forward looking statements to reflect
future / likely events or circumstances.
2
Financial Highlights
3
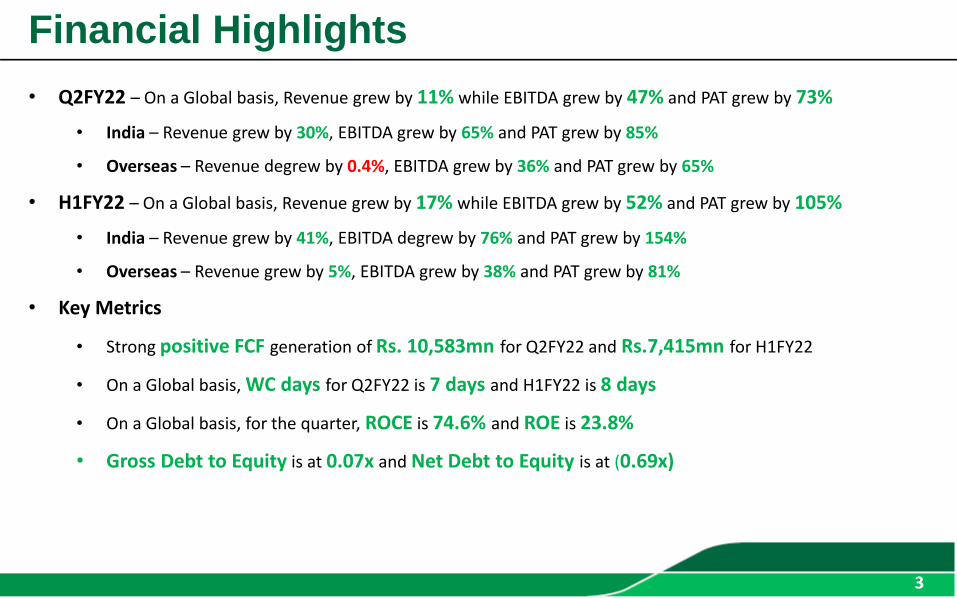
• Q2FY22 – On a Global basis, Revenue grew by 11% while EBITDA grew by 47% and PAT grew by 73%
• India – Revenue grew by 30%, EBITDA grew by 65% and PAT grew by 85%
• Overseas – Revenue degrew by 0.4%, EBITDA grew by 36% and PAT grew by 65%
• H1FY22 – On a Global basis, Revenue grew by 17% while EBITDA grew by 52% and PAT grew by 105%
• India – Revenue grew by 41%, EBITDA degrew by 76% and PAT grew by 154%
• Overseas – Revenue grew by 5%, EBITDA grew by 38% and PAT grew by 81%
• Key Metrics
• Strong positive FCF generation of Rs. 10,583mn for Q2FY22 and Rs.7,415mn for H1FY22
• On a Global basis, WC days for Q2FY22 is 7 days and H1FY22 is 8 days
• On a Global basis, for the quarter, ROCE is 74.6% and ROE is 23.8%
• Gross Debt to Equity is at 0.07x and Net Debt to Equity is at (0.69x)
3
Financial Highlights
4
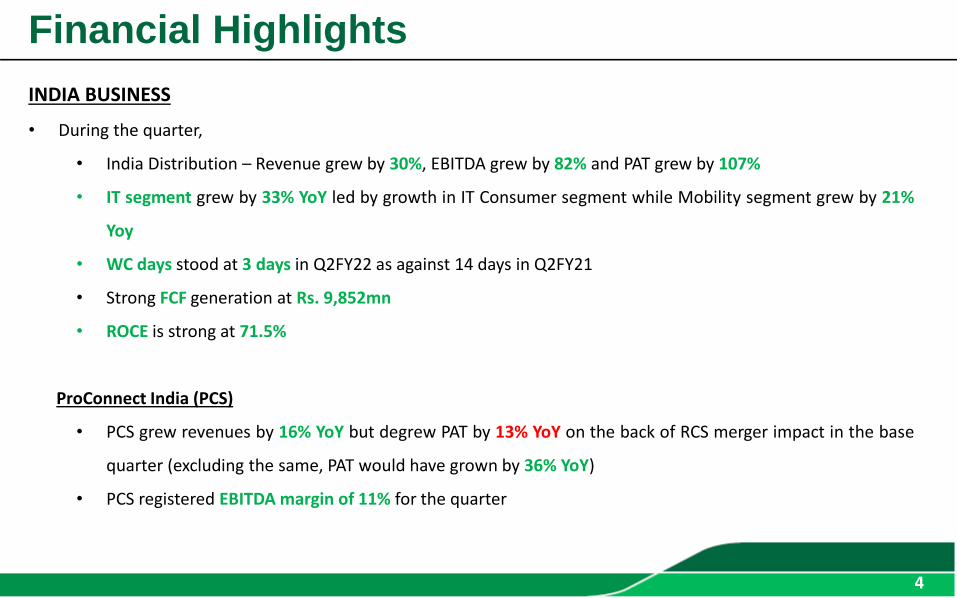
INDIA BUSINESS
• During the quarter,
• India Distribution – Revenue grew by 30%, EBITDA grew by 82% and PAT grew by 107%
• IT segment grew by 33% YoY led by growth in IT Consumer segment while Mobility segment grew by 21%
Yoy
• WC days stood at 3 days in Q2FY22 as against 14 days in Q2FY21
• Strong FCF generation at Rs. 9,852mn
• ROCE is strong at 71.5%
ProConnect India (PCS)
• PCS grew revenues by 16% YoY but degrew PAT by 13% YoY on the back of RCS merger impact in the base
quarter (excluding the same, PAT would have grown by 36% YoY)
• PCS registered EBITDA margin of 11% for the quarter
4
Financial Highlights
5
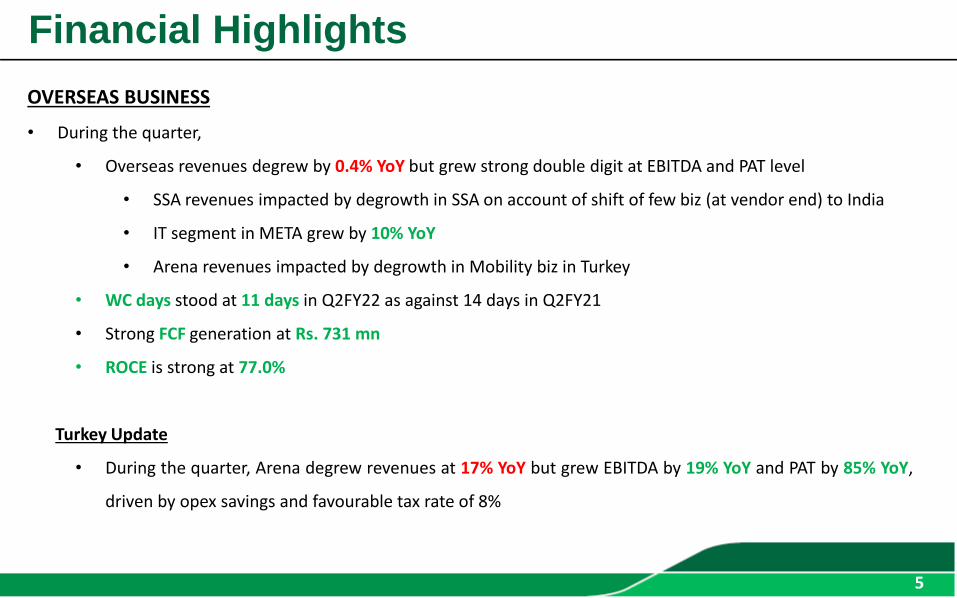
OVERSEAS BUSINESS
• During the quarter,
• Overseas revenues degrew by 0.4% YoY but grew strong double digit at EBITDA and PAT level
• SSA revenues impacted by degrowth in SSA on account of shift of few biz (at vendor end) to India
• IT segment in META grew by 10% YoY
• Arena revenues impacted by degrowth in Mobility biz in Turkey
• WC days stood at 11 days in Q2FY22 as against 14 days in Q2FY21
• Strong FCF generation at Rs. 731 mn
• ROCE is strong at 77.0%
Turkey Update
• During the quarter, Arena degrew revenues at 17% YoY but grew EBITDA by 19% YoY and PAT by 85% YoY,
driven by opex savings and favourable tax rate of 8%
5

Connecting The Dots
Transformation from ‘Product’ to ‘Utility of Product’
6
Q4FY18 HighlightsQ2FY22 Highlights
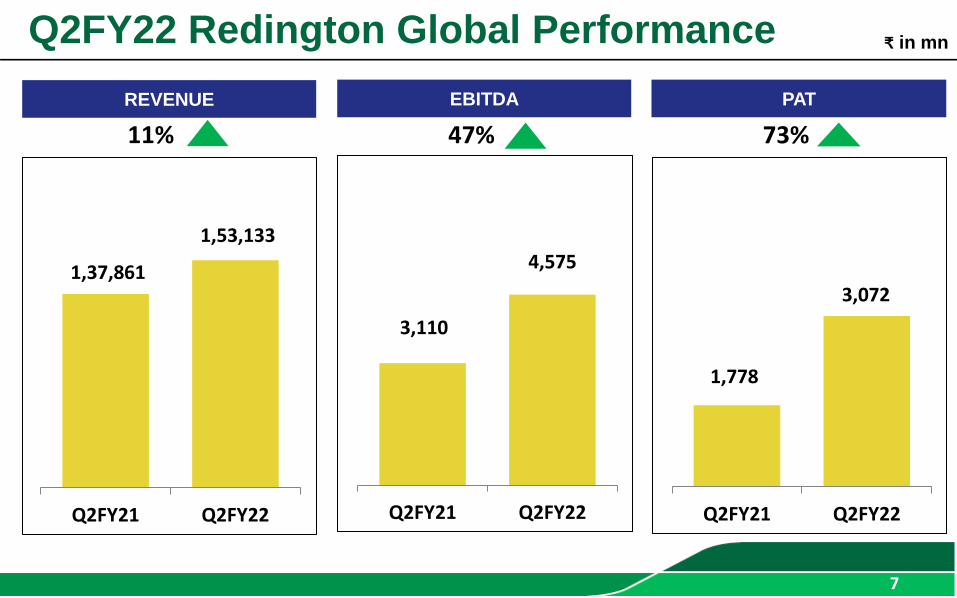
Q2FY22 Redington Global Performance
1,778
3,072
Q2FY21 Q2FY22
REVENUE EBITDA PAT
1,37,861
1,53,133
Q2FY21 Q2FY22
11% 47% 73%
3,110
4,575
Q2FY21 Q2FY22
7
₹ in mn
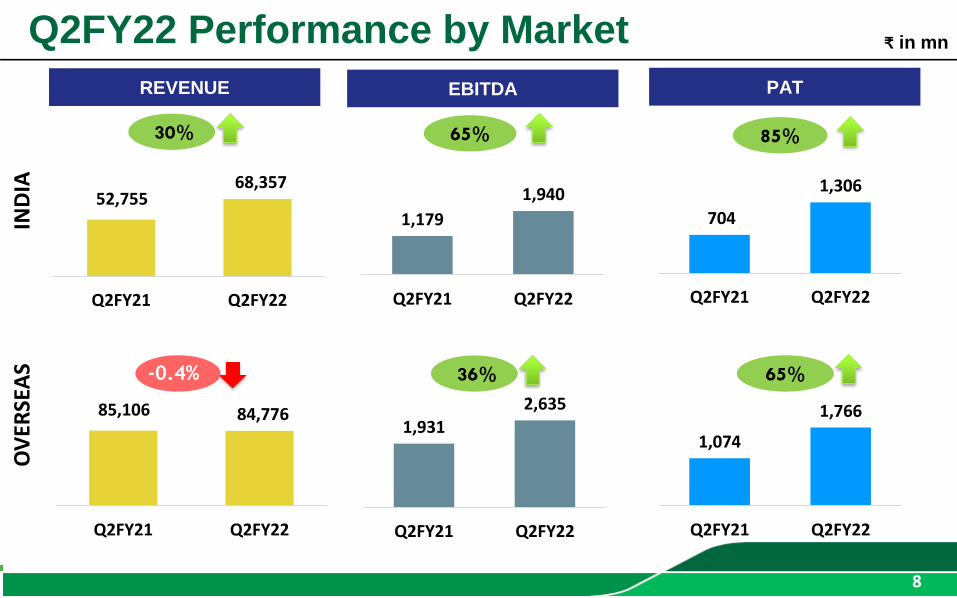
Q2FY22 Performance by Market ₹ in mn
30% 65%
65%
REVENUE EBITDA PAT
IND
IAO
VER
SEA
S
85%
36%-0.4%
1,931 2,635
Q2FY21 Q2FY22
1,074
1,766
Q2FY21 Q2FY22
52,755 68,357
Q2FY21 Q2FY22
8
1,179
1,940
Q2FY21 Q2FY22
704
1,306
Q2FY21 Q2FY22
85,106 84,776
Q2FY21 Q2FY22
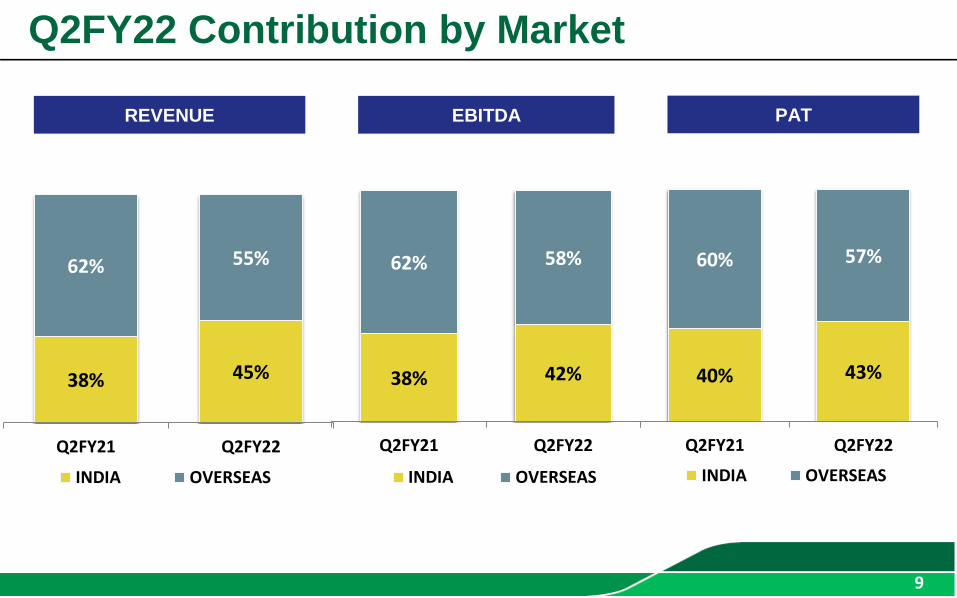
Q2FY22 Contribution by Market
REVENUE EBITDA
38% 45%
62% 55%
Q2FY21 Q2FY22
INDIA OVERSEAS
38% 42%
62% 58%
Q2FY21 Q2FY22
INDIA OVERSEAS
40% 43%
60% 57%
Q2FY21 Q2FY22
INDIA OVERSEAS
PAT
9
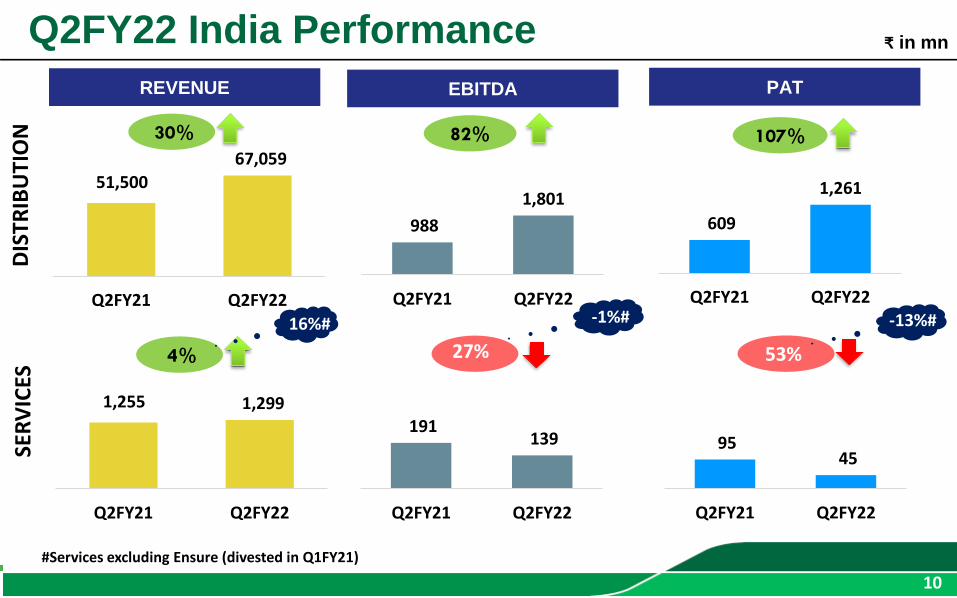
Q2FY22 India Performance
10
30% 82%
REVENUE EBITDA PAT
DIS
TRIB
UTI
ON
SER
VIC
ES
107%
4% 27% 53%
#Services excluding Ensure (divested in Q1FY21)
₹ in mn
51,500
67,059
Q2FY21 Q2FY22
988
1,801
Q2FY21 Q2FY22
1,255 1,299
Q2FY21 Q2FY22
-1%# -13%#16%#
609
1,261
Q2FY21 Q2FY22
191 139
Q2FY21 Q2FY22
95 45
Q2FY21 Q2FY22
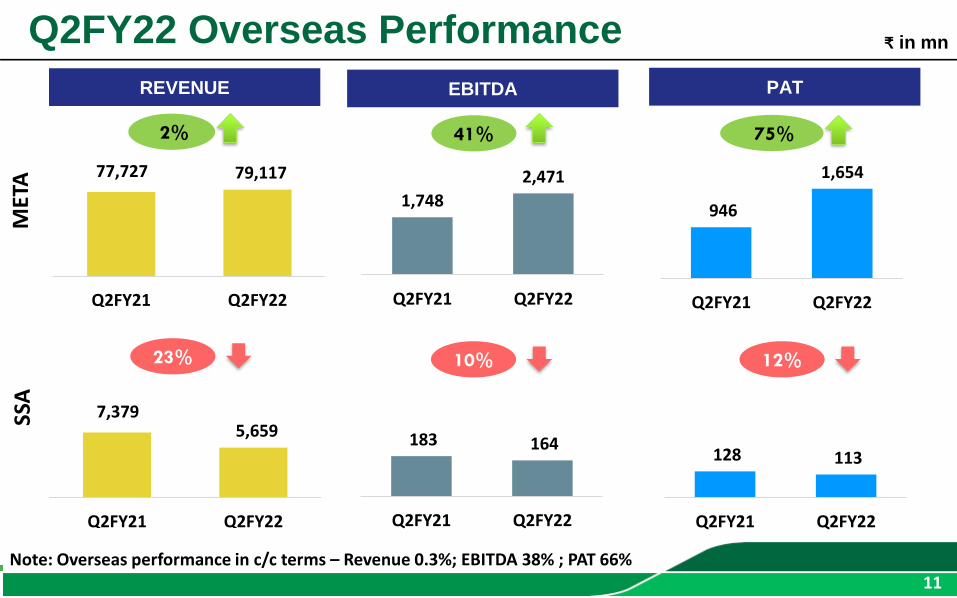
Q2FY22 Overseas Performance
11
2% 41%
REVENUE EBITDA PAT
MET
ASS
A
10%
Note: Overseas performance in c/c terms – Revenue 0.3%; EBITDA 38% ; PAT 66%
75%
23% 12%
₹ in mn
77,727 79,117
Q2FY21 Q2FY22
1,748
2,471
Q2FY21 Q2FY22
946
1,654
Q2FY21 Q2FY22
7,379 5,659
Q2FY21 Q2FY22
183 164
Q2FY21 Q2FY22
128 113
Q2FY21 Q2FY22
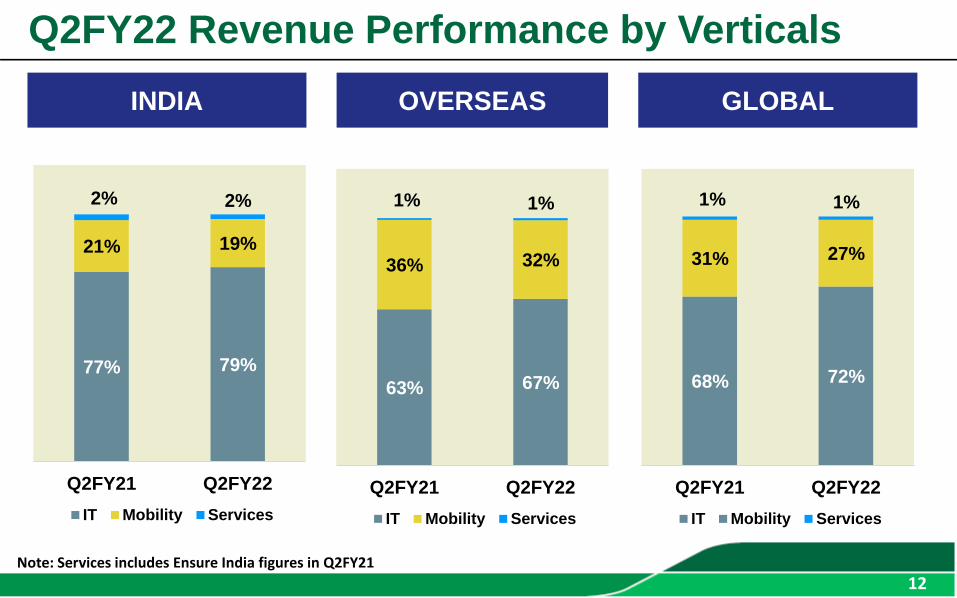
Q2FY22 Revenue Performance by Verticals
12
INDIA OVERSEAS
77% 79%
21% 19%
2% 2%
Q2FY21 Q2FY22
IT Mobility Services
GLOBAL
Note: Upon re-grouping, only smartphones are shown under Mobility
63% 67%
36% 32%
1% 1%
Q2FY21 Q2FY22
IT Mobility Services
68% 72%
31% 27%
1% 1%
Q2FY21 Q2FY22
IT Mobility Services
12Note: Services includes Ensure India figures in Q2FY21
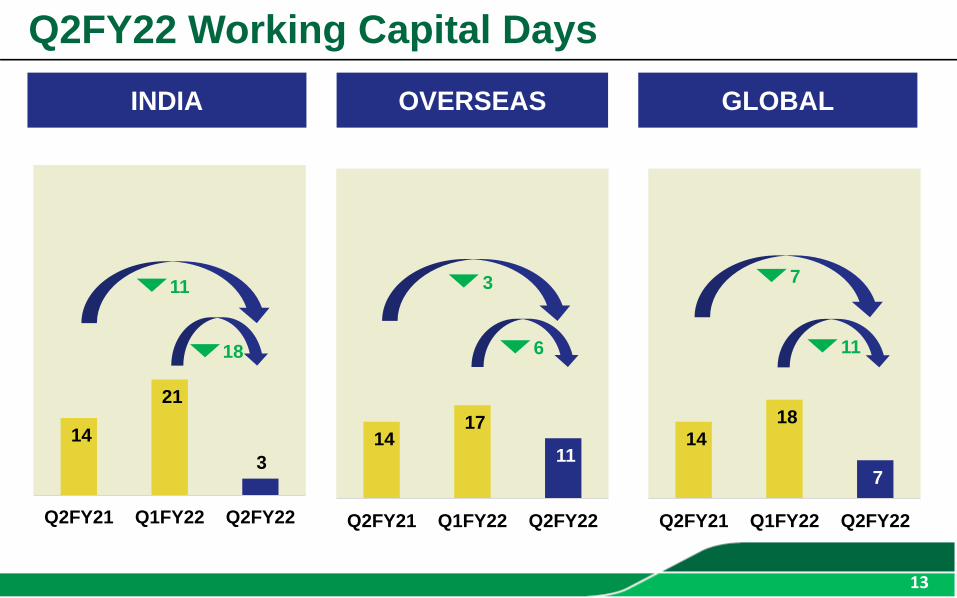
14
18
7
Q2FY21 Q1FY22 Q2FY22
Q2FY22 Working Capital Days
13
INDIA OVERSEAS GLOBAL
13
14 17
11
Q2FY21 Q1FY22 Q2FY22
3
14
21
3
Q2FY21 Q1FY22 Q2FY22
18
11
6
7
11
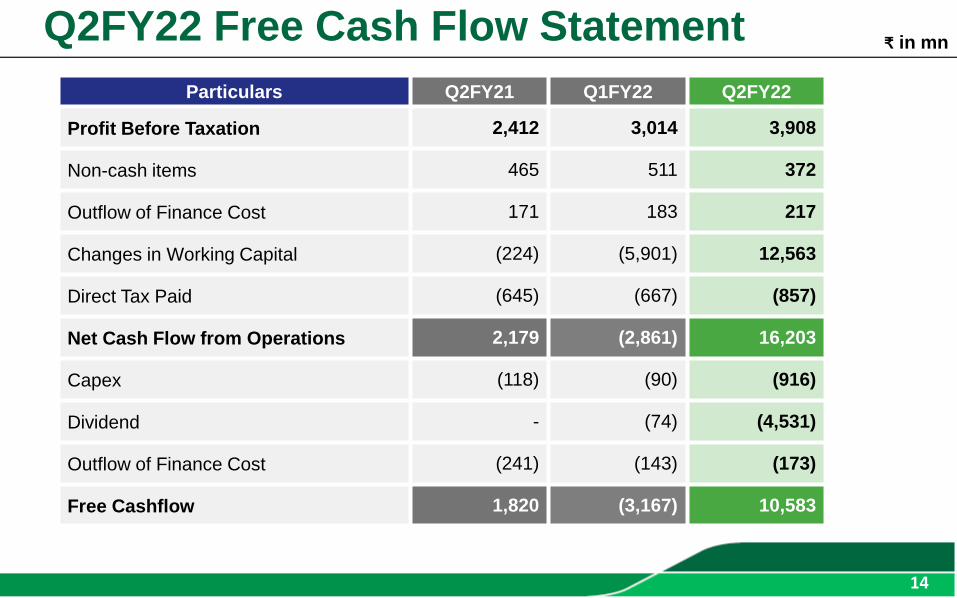
Q2FY22 Free Cash Flow Statement
14
Particulars Q2FY21 Q1FY22 Q2FY22
Profit Before Taxation 2,412 3,014 3,908
Non-cash items 465 511 372
Outflow of Finance Cost 171 183 217
Changes in Working Capital (224) (5,901) 12,563
Direct Tax Paid (645) (667) (857)
Net Cash Flow from Operations 2,179 (2,861) 16,203
Capex (118) (90) (916)
Dividend - (74) (4,531)
Outflow of Finance Cost (241) (143) (173)
Free Cashflow 1,820 (3,167) 10,583
14
₹ in mn
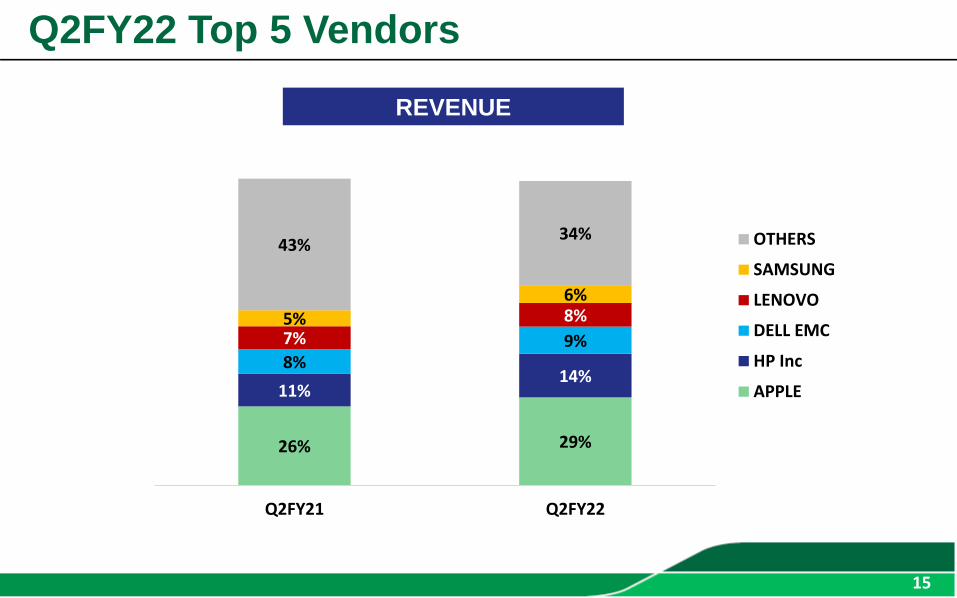
Q2FY22 Top 5 Vendors
15
REVENUE
26% 29%
11%14%
8%9%7%8%5%
6%
43%34%
Q2FY21 Q2FY22
OTHERS
SAMSUNG
LENOVO
DELL EMC
HP Inc
APPLE
15
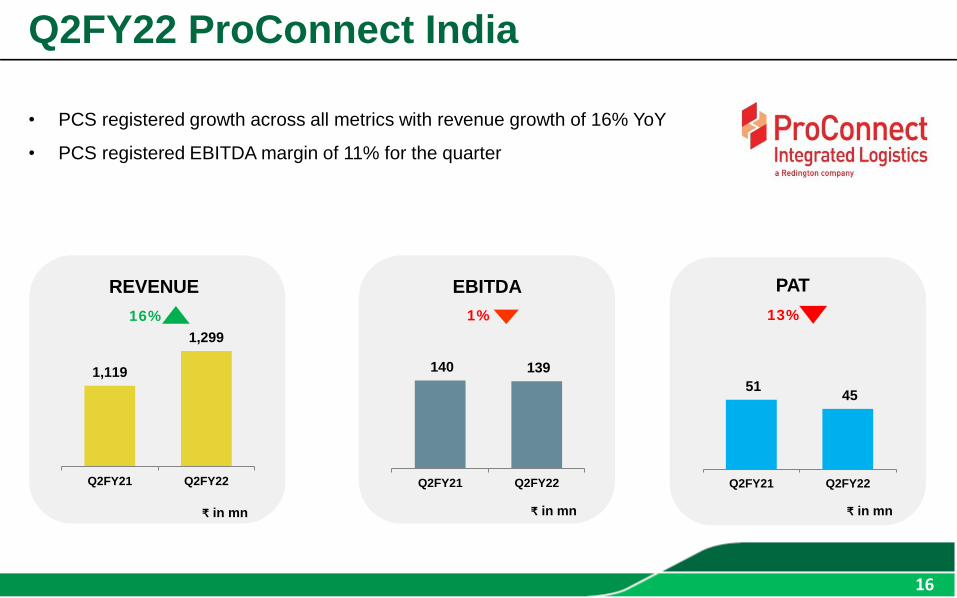
Q2FY22 ProConnect India
16
16% 1%
REVENUE EBITDA PAT
• PCS registered growth across all metrics with revenue growth of 16% YoY
• PCS registered EBITDA margin of 11% for the quarter
Above figures include Mission Critical Services
16
₹ in mn ₹ in mn ₹ in mn
140 139
Q2FY21 Q2FY22
51 45
Q2FY21 Q2FY22
13%
1,119
1,299
Q2FY21 Q2FY22
Connecting The Dots
Transformation from ‘Product’ to ‘Utility of Product’
17
9MFY18 Highlights
17
Q3FY18 HighlightsH1FY22 Performance
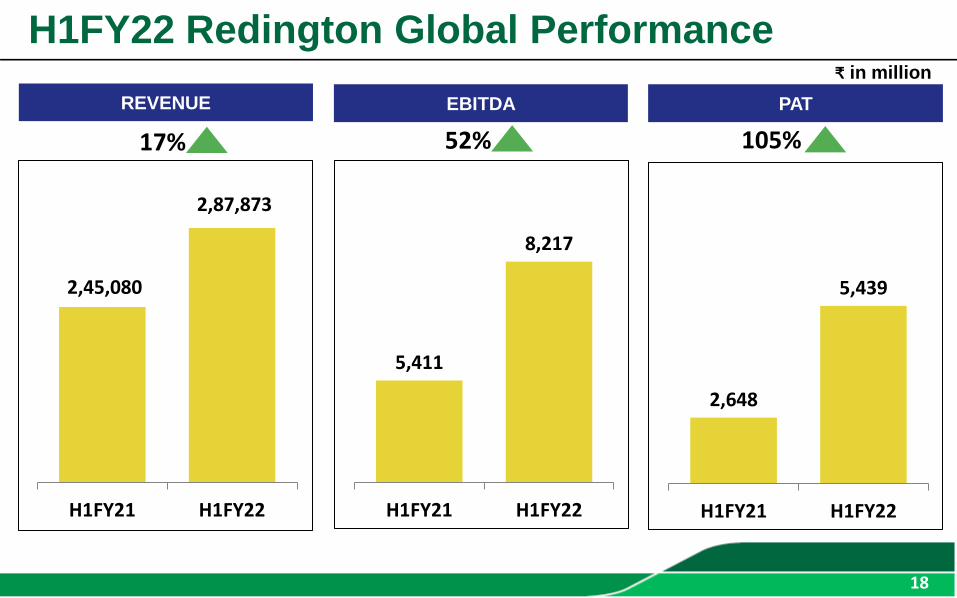
H1FY22 Redington Global Performance
18
₹ in million
2,648
5,439
H1FY21 H1FY22
REVENUE EBITDA PAT
17% 52% 105%
5,411
8,217
H1FY21 H1FY22
2,45,080
2,87,873
H1FY21 H1FY22
18
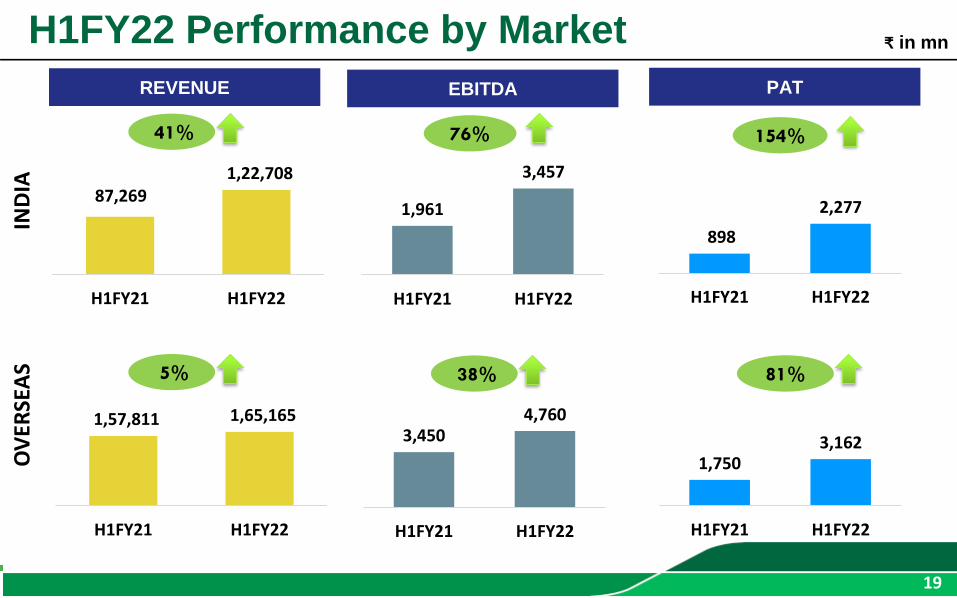
H1FY22 Performance by Market ₹ in mn
19
41% 76%
81%
REVENUE EBITDA PAT
IND
IAO
VER
SEA
S
154%
38%
87,269 1,22,708
H1FY21 H1FY22
1,961
3,457
H1FY21 H1FY22
898
2,277
H1FY21 H1FY22
1,57,811 1,65,165
H1FY21 H1FY22
5%
3,450 4,760
H1FY21 H1FY22
1,750 3,162
H1FY21 H1FY22
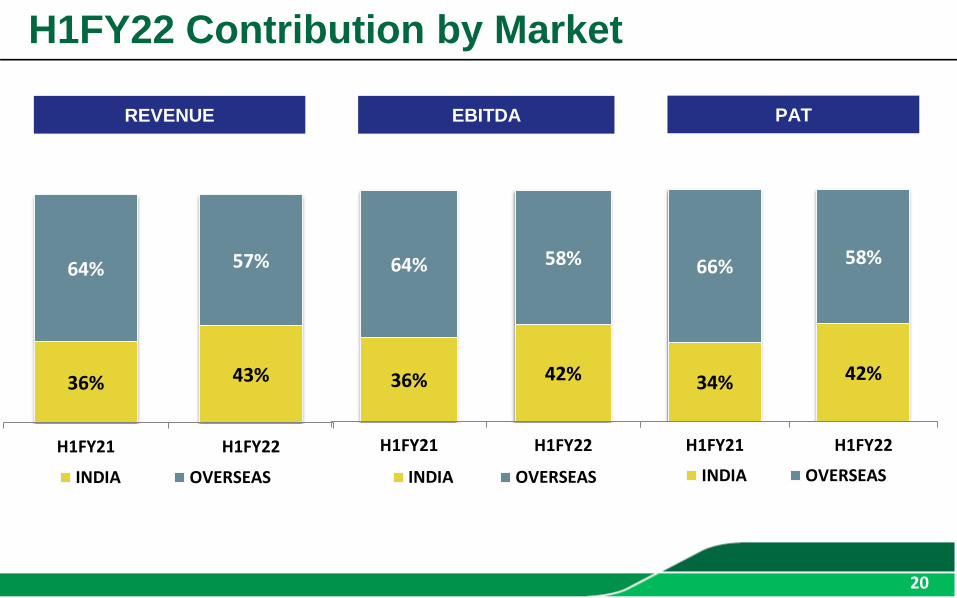
H1FY22 Contribution by Market
REVENUE EBITDA
36% 43%
64% 57%
H1FY21 H1FY22
INDIA OVERSEAS
36% 42%
64% 58%
H1FY21 H1FY22
INDIA OVERSEAS
34% 42%
66% 58%
H1FY21 H1FY22
INDIA OVERSEAS
PAT
20
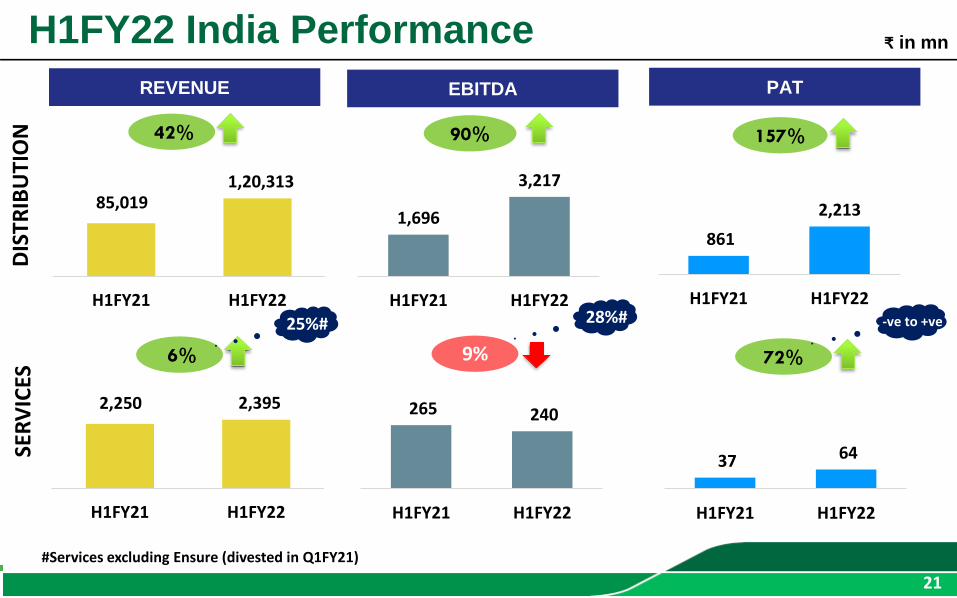
H1FY22 India Performance
21
42% 90%
72%
REVENUE EBITDA PAT
DIS
TRIB
UTI
ON
SER
VIC
ES
157%
6% 9%
#Services excluding Ensure (divested in Q1FY21)
₹ in mn
-ve to +ve
85,019 1,20,313
H1FY21 H1FY22
1,696
3,217
H1FY21 H1FY22
861
2,213
H1FY21 H1FY22
2,250 2,395
H1FY21 H1FY22
37 64
H1FY21 H1FY22
28%#25%#
265 240
H1FY21 H1FY22
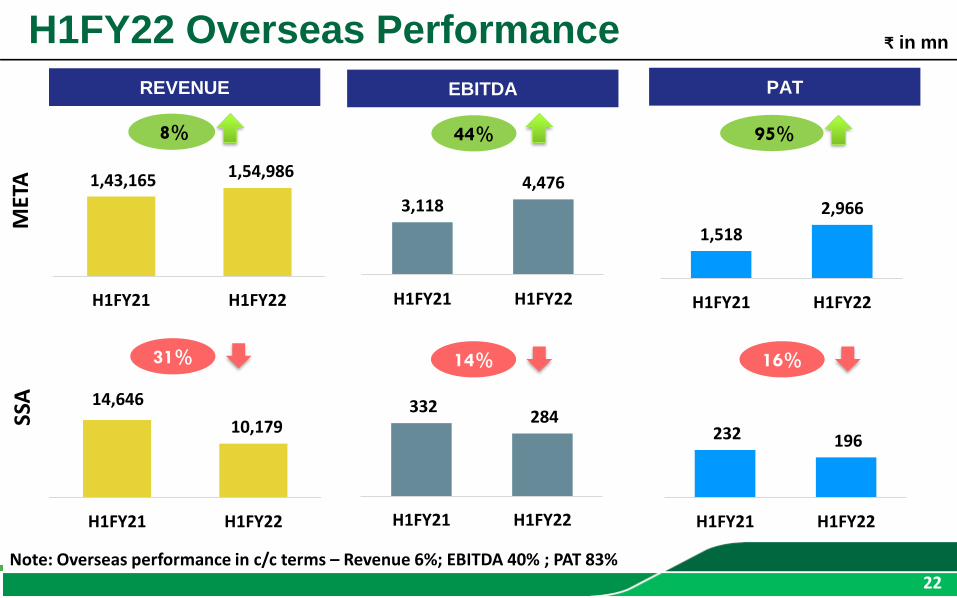
H1FY22 Overseas Performance
22
8% 44%
REVENUE EBITDA PAT
MET
ASS
A
14%
Note: Overseas performance in c/c terms – Revenue 6%; EBITDA 40% ; PAT 83%
95%
31% 16%
₹ in mn
1,43,165 1,54,986
H1FY21 H1FY22
3,118 4,476
H1FY21 H1FY22
1,518
2,966
H1FY21 H1FY22
14,646
10,179
H1FY21 H1FY22
332 284
H1FY21 H1FY22
232 196
H1FY21 H1FY22
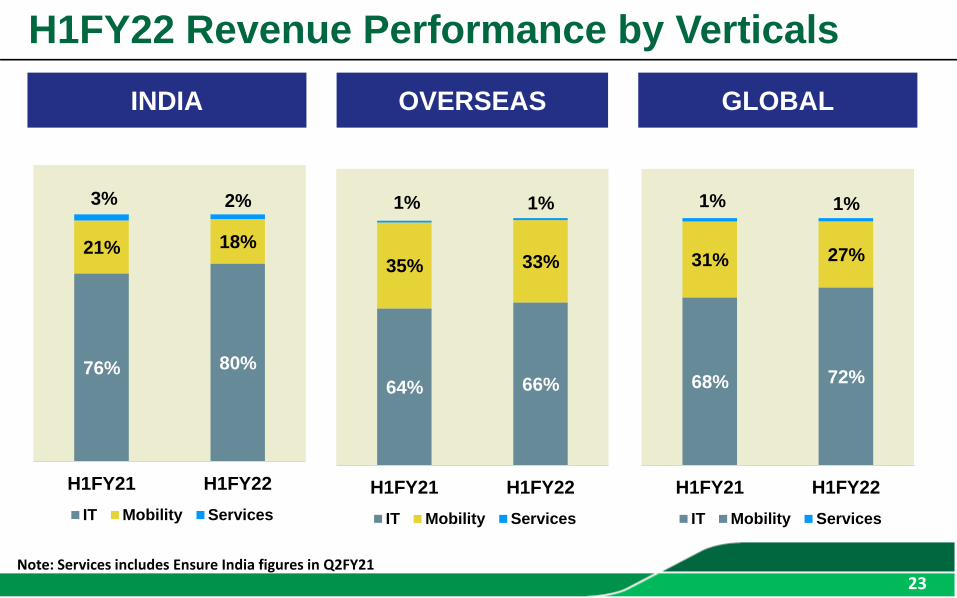
H1FY22 Revenue Performance by Verticals
23
INDIA OVERSEAS
76% 80%
21% 18%
3% 2%
H1FY21 H1FY22
IT Mobility Services
GLOBAL
Note: Upon re-grouping, only smartphones are shown under Mobility
64% 66%
35% 33%
1% 1%
H1FY21 H1FY22
IT Mobility Services
68% 72%
31% 27%
1% 1%
H1FY21 H1FY22
IT Mobility Services
23Note: Services includes Ensure India figures in Q2FY21

15 18
8
H1FY21 Q1FY22 H1FY22
H1FY22 Working Capital Days
24
INDIA OVERSEAS GLOBAL
24
15 17
11
H1FY21 Q1FY22 H1FY22
4
16
21
3
H1FY21 Q1FY21 H1FY22
18
13
6
7
10
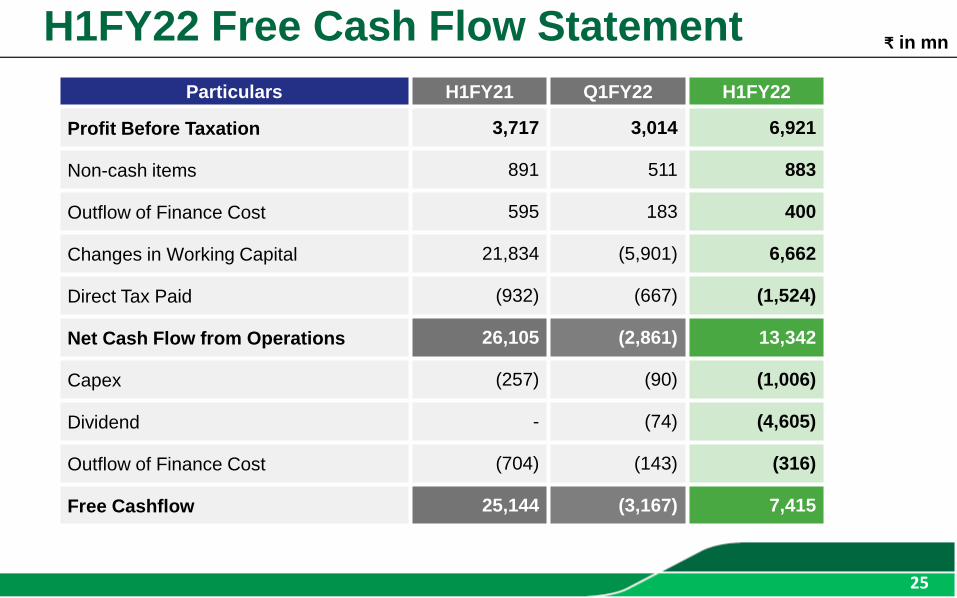
H1FY22 Free Cash Flow Statement
25
Particulars H1FY21 Q1FY22 H1FY22
Profit Before Taxation 3,717 3,014 6,921
Non-cash items 891 511 883
Outflow of Finance Cost 595 183 400
Changes in Working Capital 21,834 (5,901) 6,662
Direct Tax Paid (932) (667) (1,524)
Net Cash Flow from Operations 26,105 (2,861) 13,342
Capex (257) (90) (1,006)
Dividend - (74) (4,605)
Outflow of Finance Cost (704) (143) (316)
Free Cashflow 25,144 (3,167) 7,415
25
₹ in mn
26
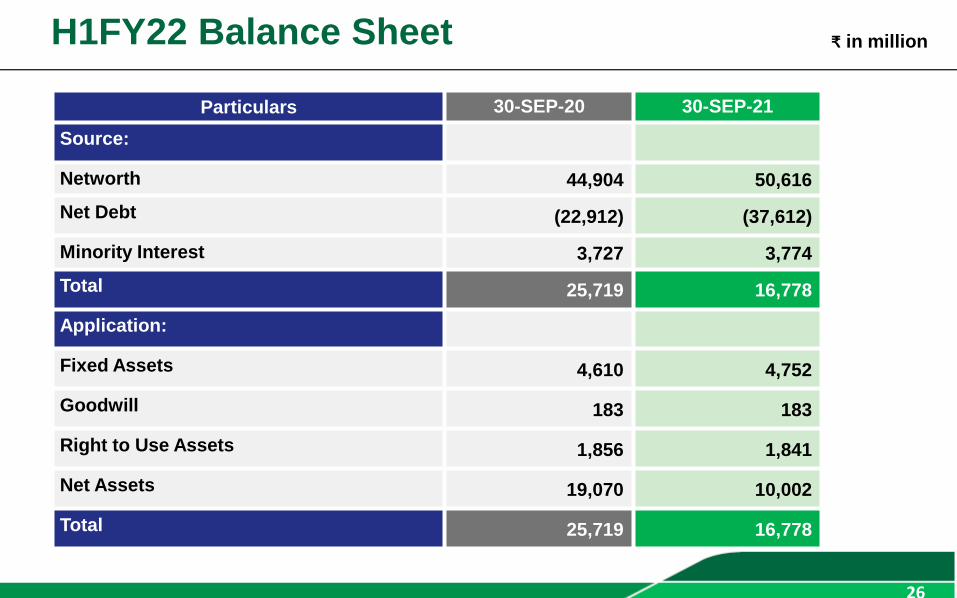
₹ in million H1FY22 Balance Sheet
26
Particulars 30-SEP-20 30-SEP-21
Source:
Networth 44,904 50,616
Net Debt (22,912) (37,612)
Minority Interest 3,727 3,774
Total 25,719 16,778
Application:
Fixed Assets 4,610 4,752
Goodwill 183 183
Right to Use Assets 1,856 1,841
Net Assets 19,070 10,002
Total 25,719 16,778
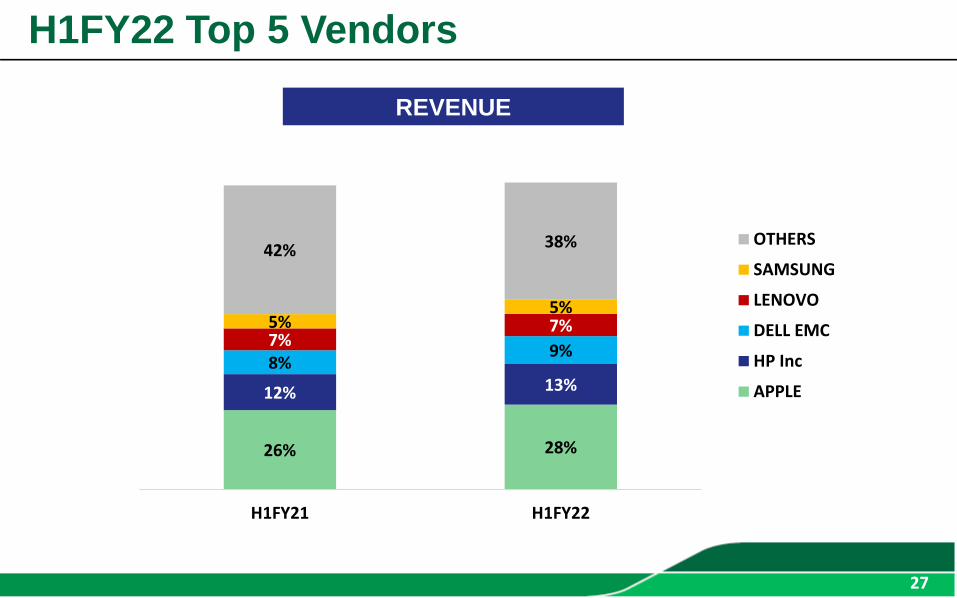
H1FY22 Top 5 Vendors
27
REVENUE
26% 28%
12% 13%8%
9%7%
7%5%5%
42% 38%
H1FY21 H1FY22
OTHERS
SAMSUNG
LENOVO
DELL EMC
HP Inc
APPLE
27
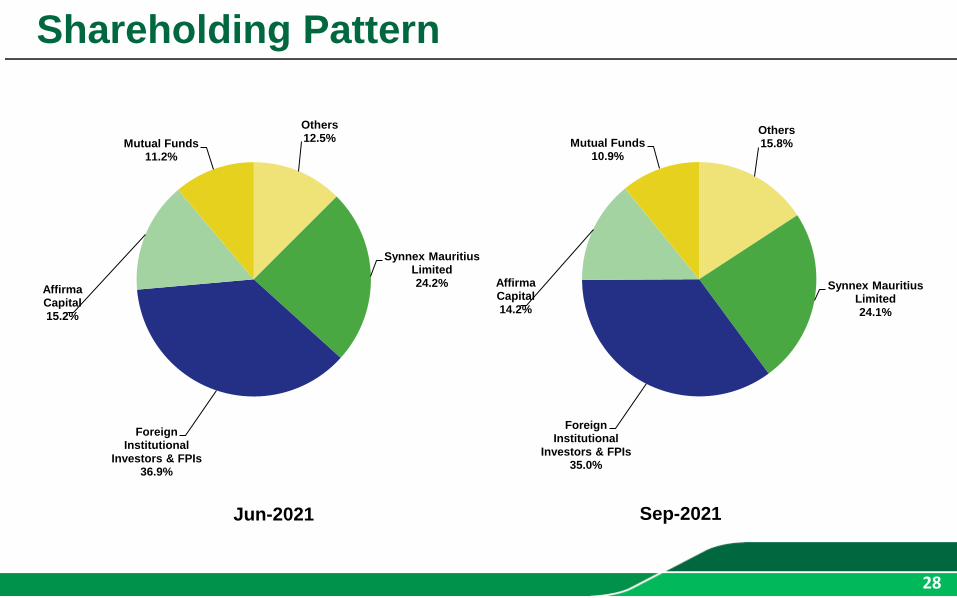
Shareholding Pattern
2828
Jun-2021
Others12.5%
Synnex Mauritius Limited24.2%
Foreign Institutional
Investors & FPIs36.9%
Affirma Capital15.2%
Mutual Funds11.2%
Sep-2021
Others15.8%
Synnex Mauritius Limited24.1%
Foreign Institutional
Investors & FPIs35.0%
Affirma Capital14.2%
Mutual Funds10.9%

Connecting The Dots
Transformation from ‘Product’ to ‘Utility of Product’
29
Investor Contacts
M. Muthukumarasamy
Compliance Officer
Redington (India) Limited
SPL Guindy House, 95 Mount Road,
Guindy, Chennai 600 032
https://www.redingtongroup.com
Sowmiya M
Senior Manager – Investor Relations
CIN - L52599TN1961PLC028758


![I Re I n to n · Corporate Office R I Redington [India] Limited edI n ton Redington House Centre Point, Plot. Nos. 8 &11[SP] SEAMLESS PARTNERsHms Thiru.Vi.Ka industrial Estate, Guindy.](https://static.fdocuments.net/doc/165x107/5f07cd6b7e708231d41ed22b/i-re-i-n-to-n-corporate-office-r-i-redington-india-limited-edi-n-ton-redington.jpg)