REDD+ FOR THE GUIANA SHIELD - WordPress.com · 2014-04-07 · algorithms. As the motto of OTB goes,...
10
1 Step-by-step tutorial of supervised classification with OTB in the QGIS interface Anoumou KEMAVO and Marie CALMEL, ONF International March 2014 REDD+ FOR THE GUIANA SHIELD
Transcript of REDD+ FOR THE GUIANA SHIELD - WordPress.com · 2014-04-07 · algorithms. As the motto of OTB goes,...

1
Step-by-step tutorial of supervised
classification with OTB in the QGIS
interface
Anoumou KEMAVO and Marie CALMEL, ONF International
March 2014
REDD+ FOR THE GUIANA SHIELD

Table of Contents
1. Introduction ................................................................................................................................................................ 3
2. Opening OTB in QGIS .............................................................................................................................................. 3
3. Adding a raster (e.g. in Landsat image) in QGIS .......................................................................................... 4
4. Preparing virtual raster ......................................................................................................................................... 5
5. Definition of training areas .................................................................................................................................. 6
6. Classification .............................................................................................................................................................. 8
1. Creating a statistics file of the source image ............................................................................................ 8
2. Training the SVM classifier .............................................................................................................................. 9
3. Creating the classification ............................................................................................................................. 10

3
1. Introduction
This tutorial demonstrates the steps to make an supervised classification with the Orfeo Toolbox
in QGIS. Orfeo Toolbox (OTB) is distributed as an open source library of image processing
algorithms. As the motto of OTB goes, Orfeo Toolbox is not a black box, OTB encourages full
access to the details of all the algorithms.
The tutorial was developed as an output of the Second Working Group meeting, which was held
in Paramaribo, Suriname on 27-28 February 2014, as part of the REDD+ for the Guiana Shield
project. The topic of the working group meeting was "Mapping for REDD+: Tools and
classification methods for forest cover monitoring".
REDD+ for the Guiana Shield - Technical Regional Platform for REDD+ Development in the
Guiana Shield is a regional project funded at the level of € 2.7 million by the European Regional
Development Fund (FEDER), the French Global Environment Facility (FFEM) and the local
government of French Guiana (Région Guyane). The project involves Guyana, Suriname, the state
of Amapá and French Guiana. The project is coordinated by the regional office of the French
Forest Office (ONF) in French Guiana, while the implementation is delegated to its subsidiary
ONF International (ONFI).
Please visit the project's website for more information about this event:
http://reddguianashield.com/working-groups/working-group-2/
2. Opening OTB in QGIS
Open the OTB tool via the " Treatments " menu / "tool-box"
Once the tool box displayed, click on the drop down menu in the toolbox and select the
mode "Advanced Interface"

4
OTB tool used in this tutorial is then displayed where it mentions "Orfeo Toolbox"
3. Adding a raster (e.g. in Landsat image) in QGIS
Adding a raster layer

5
4. Preparing virtual raster
Open 8 bands of landsat image and organizing 8 bands descending thinking well
check the box so as to make "visible" layers
Click: Raster / Miscellaneous / Construct a virtual raster
In the window click on 'Use visible rasters as input'. Output file: The file should include the name of the scene to be copied to the folder of production, then a subfolder showing the name of the scene is: example LC81930522014065LGN00_B2
Click on 'Split' Click to load into the map when finished 1. Click OK 2. In the new window click OK if the process went well 3. Click Close on the first window

6
The image is added in the layer manager .
Change the style of the image.
Click Properties / Style tab
5. Definition of training areas
Goal: to create a shape layer file containing a field named "class", for example, integer. This field
will inform the class number.
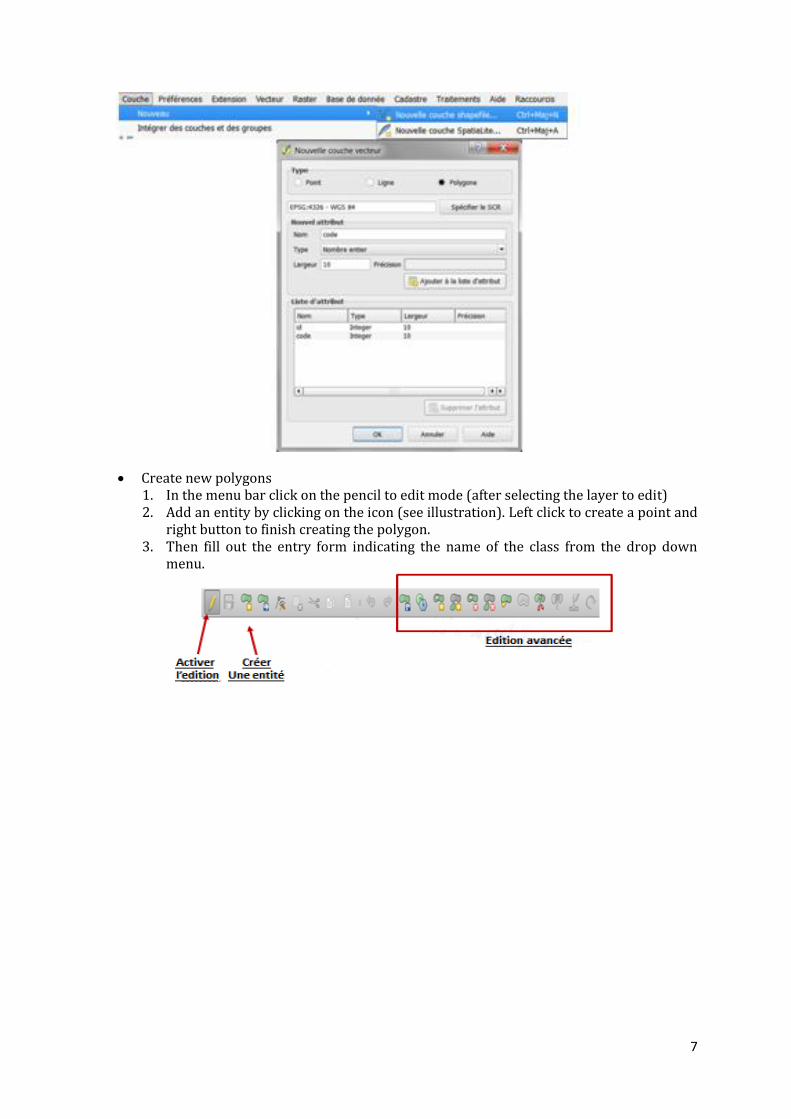
Go to the menu "layer" and click "New" -> "New layer shape file" In the new window:
Select "Polygon" Specify the projection system by clicking on "specify the scr" WGS 84 - EPSG: 4326 To add an attribute: In the Name field, the name field to create 'code' Type "integer" Click on "add to the list attribute" Click on "OK"
7
Create new polygons 1. In the menu bar click on the pencil to edit mode (after selecting the layer to edit) 2. Add an entity by clicking on the icon (see illustration). Left click to create a point and
right button to finish creating the polygon. 3. Then fill out the entry form indicating the name of the class from the drop down
menu.

8
6. Classification
1. Creating a statistics file of the source image
Keep in your project:
- The image previously filtered
- The previously created polygon shapefile
Creating a statistics file of the source image
Start menu "1 - Calculations statistics of an image"
1. Click on the button "Data input image"
2. Specify the value of the background (usually 0)
3. Click the "Statistical Release File" button remembering to add the extension ". Xml" at the end of the file name output
4. Click on "Run"

9
2. Training the SVM classifier
Start menu "2 - Linear SVM Learning"
1. Click on the button "Data input image" and indicate the filtered image
2. Click on the "Data Vector training" button and show the file containing the training vectors
3. Click the button "File Statistics" and give the file statistics previously created
4. Write the name of the field containing the class numbers of training vector file
5. In the first approach indicate a cost of 100 and then let the other options default to start
6. Specify the name of the output file SVM model by adding even the extension ".txt"
7. Specify the output file for the confusion matrix
8. Click "Run" and see the result text that appears in the LOG tab

10
3. Creating the classification
Creation of the classification
Start menu "3 - Classification of the image"
1. Click on the button "Data input image" and select the filtered image
2. Click the button "File Statistics" and give the statistics file previously created
3. Click on the button "File classification model" and give the template file previously created
4. Specify the name of the output file classification
5. Click on "Run"