REASSESSING THE PRODUCTIVITY GAINS FROM TRADE AND …€¦ · REASSESSING THE PRODUCTIVITY GAINS...
24
REASSESSING THE PRODUCTIVITY GAINS FROM TRADE AND FDI LIBERALIZATION: AN INDUSTRY -LEVEL APPROACH: JaeBin Ahn, Era Dabla-Norris, Romain Duval, Bingjie Hu and Lamin Njie International Monetary Fund IMF-WB-WTO Joint Trade Workshop IMF WB WTO Joint Trade Workshop June 29, 2015
Transcript of REASSESSING THE PRODUCTIVITY GAINS FROM TRADE AND …€¦ · REASSESSING THE PRODUCTIVITY GAINS...

REASSESSING THE PRODUCTIVITY GAINSFROM TRADE AND FDI LIBERALIZATION: AN INDUSTRY-LEVEL APPROACH:
JaeBin Ahn, Era Dabla-Norris, Romain Duval, Bingjie Hu and Lamin Njie
International Monetary Fund
IMF-WB-WTO Joint Trade WorkshopIMF WB WTO Joint Trade WorkshopJune 29, 2015

WHY AGAIN?WHY…AGAIN?
Trade and FDI liberalization:
Essential component of country and global policy agendas
Welfare gains
Productivity gainsy g
Challenges in quantifying gains from trade:
Various channels
Cross-country as well as cross-sector heterogeneity
Interaction with structural factors Interaction with structural factors
This paper aims to tackle those challenges in country-sector-year set-up
2
g y y
with a particular focus on the role of resource reallocation

PREVIOUS THEORETICAL STUDIESPREVIOUS THEORETICAL STUDIES
Firm-level productivity gains from trade liberalization
Pro-competition channel
Scale economies (Helpman and Krugman, 1985)
Innovation incentives (Aghion et al, 2005)
cf. Rodrik (1988, 1991)
Input variety channelInput variety channel
Kasahara and Rodrigue, 2008; Gopinath and Neiman, 2014; Halpen, Koren, and Szeidl, 2015
T h l i l ill h l Technological spillover channel
Industry-level productivity gains from trade
Resource reallocation within a sector across firms (e.g., Melitz, 2003)
3
Resource reallocation within a sector across firms (e.g., Melitz, 2003)
Backward and forward linkages (e.g., Rodgriguez-claire, 1996)

PRODUCTIVITY GAINS FROM TRADE LIBERALIZATIONPRODUCTIVITY GAINS FROM TRADE LIBERALIZATION
Tariff cuts in sector i Firms in sector i
Direct effectCompetition channel
Sector i
Resource reallocation within each sector
Complementarity or substitutability?
Fi i t j j S t jFirms in sector j≠j Sector j
4
Firm-level TFP gains via output and input market channels will be amplified by the resource reallocation process within each sector

PREVIOUS EMPIRICAL FINDINGSPREVIOUS EMPIRICAL FINDINGS
Country-level studies
Sachs and Warner (1995, BPEA); Frankel and Romer (1999, AER); Wacziarg and Welch (2008, WBER), etc.
Carefully controlling endogeneity issues
Difficult to identify specific channels
Firm level studies Firm-level studies
Amiti and Konings (2007, AER); Fernandes (2007, JIE); Topalova and Khandelwal(2011, ReStat)
I d i C l bi I di Indonesia; Colombia; India
Separately identify output and input market effects
Limited analysis of the role of resource reallocation
5

CONTRIBUTIONCONTRIBUTION
Building a unique, comprehensive database of tariff rates
Incorporate various types of preferential rates beyond MFN rates
Estimating output and input market channels separately Estimating output and input market channels separately
Study relationship between output and input tariffs
Explore interactions with structural factors across countries or country-sectors
Investigating complementarities between trade and FDI liberalization
Tariff and non tariff barriers; Trade in goods and services
Policy simulations from potential reforms (not today)
6
Policy simulations from potential reforms (not today)

PREVIEW OF MAIN FINDINGSPREVIEW OF MAIN FINDINGS
Dominant input market channels:
Complementarity between output and input tariffs
Stronger effect in more flexible economies:g
Labor market flexibility
Product market regulation
Complementarity between tariff and FDI regulations:
Input (output) market channels stronger as FDI regulations are weaker in input Input (output) market channels stronger as FDI regulations are weaker in input (output) markets
7

DATADATA
Sector-level TFP data from EU KLEMS and World KLEMS
17 countries with up to 18 sectors over 23 years
Tariff data from TRAINS/WITS Tariff data from TRAINS/WITS
Comprehensive tariff information
MFN, GSP, RTA, PTA, bilateral preferential rates, etc
Trade data from UN Comtrade
Other country or country sector level data on the market flexibility Other country- or country-sector level data on the market flexibility
Employment Protection Index, Product Market Regulation Index, FDI restrictiveness index (OECD).
8

TARIFF RATE DATA CONSTRUCTIONTARIFF RATE DATA CONSTRUCTION
Comprehensive measure at the product level
MFN Pref non-MFN
, , , ,t t tN N N
i g g ij g g ij g g ij gt ij t ij t ij t
j j jw MFN w PREF w NONMFN
Raw data at HS8-10 level from TRAINS/WITS
weights from initial year’s bilateral HS6 trade data
Aggregate up to 2 digit ISIC sector level (Output tariff)
weights from initial year’s aggregate HS6 trade data
I t IO t bl (I t t iff) Incorporate IO tables (Input tariff)
, ,, , ,i j i i k
t input jk t outputk
9
where is the share of imported inputs from sector in total inputs used in sector i
jk k j

MFN VS EFFECTIVE TARIFFMFN VS EFFECTIVE TARIFF
7USA
5
6effective tariff rate MFN rate
3
4
1
2
The effecti e tariff meas re tends to be lo er and more olatile than the
0
1991
1992
1993
1995
1996
1997
1998
1999
2000
2001
2002
2003
2004
2005
2006
2007
2008
2009
2011
2012
2013
10
The effective tariff measure tends to be lower and more volatile than the simple average of MFN rates
By accounting for other preferential rates

MFN VS EFFECTIVE TARIFFMFN VS EFFECTIVE TARIFF
7
Czech Republic
5
6
7effective tariff rate MFN rate
3
4
5
1
2
The effecti e tariff meas re tends to be lo er and more olatile than the
0
1996
1997
1998
1999
2000
2001
2002
2003
2004
2005
2006
2007
2008
2009
2010
2011
2012
2013
11
The effective tariff measure tends to be lower and more volatile than the simple average of MFN rates
By accounting for other preferential rates
THE EVOLUTION OF TARIFF RATESTHE EVOLUTION OF TARIFF RATES
0 5 10 15 20 25 30
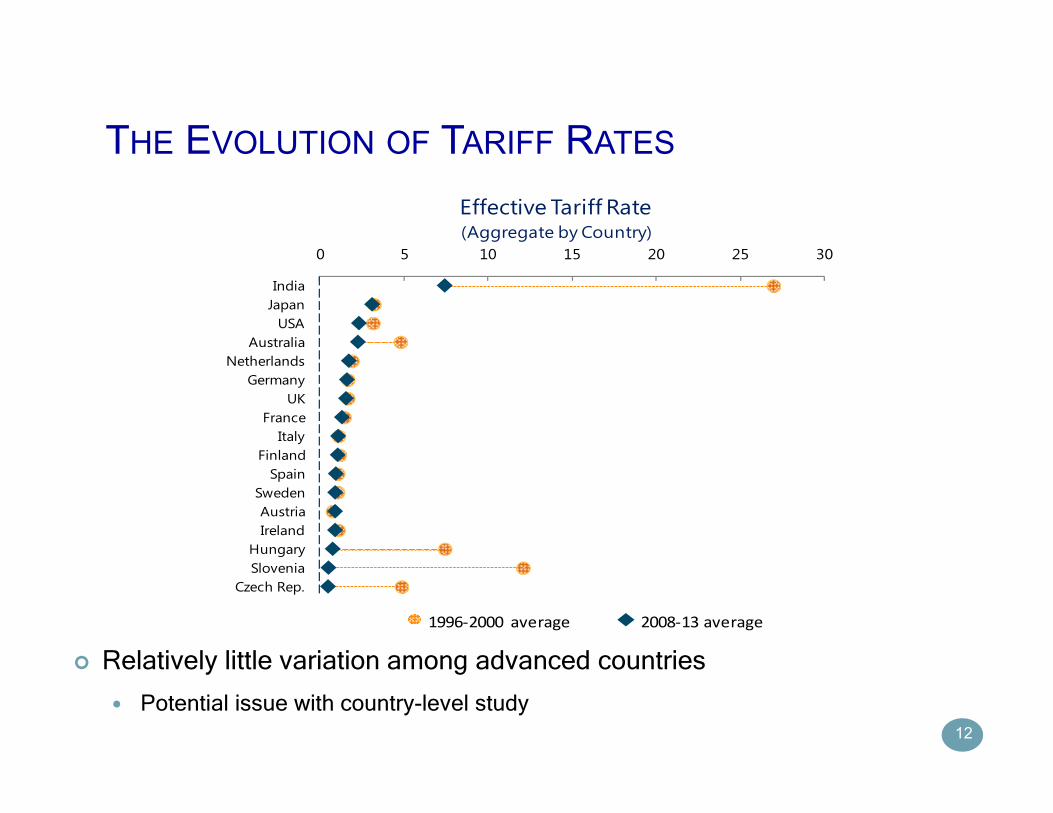
Effective Tariff Rate(Aggregate by Country)
0 5 10 15 20 25 30
IndiaJapan
USAAustralia
NetherlandsGermany
UKFrance
ItalyFinlandFinland
SpainSwedenAustriaIreland
HungarySlovenia
Czech Rep.
1996-2000 average 2008-13 average
Relatively little variation among advanced countries
12
Relatively little variation among advanced countries
Potential issue with country-level study

THE EVOLUTION OF TARIFF RATESTHE EVOLUTION OF TARIFF RATES
0 1 2 3 4
EffectiveTariff Rate(Selected Sectors: Sector-level Median in Advanced EU Countries)
0 1 2 3 4
Food products, beverages and tobacco
Textiles, apparel, leather etc.
Wood and cork
Paper printing and publishingPaper, printing and publishing
Coke and refined petroleum products
Chemicals and chemical products
Rubber and plastic products
Other non-metallic mineral
Basic and fabricated metals
Electrical and optical equipment
Machinery and equipment
Transport equipment
Other manufacturing
g
Agriculture, forestry, and fishing
Mining and quarrying
1996-2000 average 2008-13 average
13
Substantial variation across sectors even among EU countries
Will be exploited along with variation in TFP growth

EMPIRICAL STRATEGYEMPIRICAL STRATEGY
Baseline specification
ln ,ist ist j ist j ist j ist j is it ist
OutputTariff InputTariff
TFP EPR InputTariff EPR InputTariff FE FE
where
1 /ist j ist j
is
OutputTariff InputTariffEPR
Input VA
Introducing interaction terms with other structural measures
Identification strategy
Aghion et al (2008, AER): state-industry level delicensing in India
P d i i ff f d li i
14
Productivity effects of delicensing
Variation in labor market institutions across states

OUTPUT VS INPUT TARIFFOUTPUT VS INPUT TARIFF
Output and Input Tariff(In deviation from country-sector and country-year average)
60
80
100
te (E
PR)
y = 2.6839x + 7E-09
0
20
40
ve P
rote
ctio
n Ra
t
-60
-40
-20-10 -8 -6 -4 -2 0 2 4 6 8 10
Effe
ctiv
Strong correlation between output and input tariff
60
Input Tariff
15
But not enough to generate collinearity concerns

TFP AND TARIFF: A SNAP SHOTTFP AND TARIFF: A SNAP SHOT
d ff d ff
0 9
1.4
TFP and Input Tariff(In deviation from country-sector and country-year average, 2007)
1.4
TFP and Input Tariff(In deviation from country-sector and country-year average, 2007)
y = -0.318x - 3E-10
0 1
0.4
0.9
ln(T
FP)
y = -3.2583x + 5E-09
0 1
0.4
0.9
ln(T
FP)
-0.6
-0.1-0.5 -0.3 -0.1 0.1 0.3 0.5
3 year lagged input tariff
-0.6
-0.1-0.15 -0.1 -0.05 0 0.05 0.1 0.15
3 year lagged input tariff
Negative correlation between TFP and Tariff
16 Stronger relationship in more flexible labor market countries

REGRESSION: BASELINE WITH COMPLEMENTARITYREGRESSION: BASELINE WITH COMPLEMENTARITY
Dependent variable: ln(TFP)ist(1) (2) (3) (4)(1) (2) (3) (4)
j=1 j=2 j=3 j=4
EPRist-j -0.002** -0.002** -0.002* -0.002(0.001) (0.001) (0.001) (0.001)
Effective Input Tariffist-j -0.088*** -0.088*** -0.087*** -0.086***(0.017) (0.015) (0.015) (0.014)
EPRist-j 0.001*** 0.001*** 0.001*** 0.001***×Effective Input Tariffist-j (0.000) (0.000) (0.000) (0.000)
Country-sector FE Yes Yes Yes YesCountry-year FE Yes Yes Yes YesObs 3,292 3,044 2,796 2,548
Strong and negati e effect of inp t and o tp t tariffs on TFP
, , , ,(Adj)R squared 0.651 0.697 0.723 0.751
Standard errors in parentheses are clustered at the country-year level . Significance: * 10 percent; ** 5 percent; *** 1 percent.
17
Strong and negative effect of input and output tariffs on TFP
Dominant input channels; potential complementarity between input and output tariffs

REGRESSION: BASELINE WITH COMPLEMENTARITYREGRESSION: BASELINE WITH COMPLEMENTARITY
Dependent variable: ln(TFP)ist(1) (2) (3) (4)(1) (2) (3) (4)
j=1 j=2 j=3 j=4
EPRist-j -0.002** -0.002** -0.002* -0.002(0.001) (0.001) (0.001) (0.001)
Effective Input Tariffist-j -0.088*** -0.088*** -0.087*** -0.086***(0.017) (0.015) (0.015) (0.014)
EPRist-j 0.001*** 0.001*** 0.001*** 0.001***×Effective Input Tariffist-j (0.000) (0.000) (0.000) (0.000)
Country-sector FE Yes Yes Yes YesCountry-year FE Yes Yes Yes YesObs 3,292 3,044 2,796 2,548, , , ,(Adj)R squared 0.651 0.697 0.723 0.751
Standard errors in parentheses are clustered at the country-year level . Significance: * 10 percent; ** 5 percent; *** 1 percent.
18
One s.d decline in effective input tariffs (-1.4%) raises TFP by around 7%, when EPR is at median level (0.6; U.S. electrical equipment)

REGRESSION: BASELINE WITH MFN RATESREGRESSION: BASELINE WITH MFN RATES
Dependent variable: ln(TFP)ist(1) (2) (3) (4)
j=1 j=2 j=3 j=4
EPRist-j -0.002 -0.002 -0.002 -0.003(0 002) (0 002) (0 002) (0 002)(0.002) (0.002) (0.002) (0.002)
Effective Input Tariffist-j 0.003 0.008 0.014 0.014(0.020) (0.020) (0.022) (0.022)
EPRist-j 0.000 0.000 0.000 0.000×Effective Input Tariffist j (0 000) (0 000) (0 000) (0 000)×Effective Input Tariffist-j (0.000) (0.000) (0.000) (0.000)
Country-sector FE Yes Yes Yes YesCountry-year FE Yes Yes Yes YesObs 3,292 3,044 2,796 2,548Obs 3,292 3,044 2,796 2,548(Adj)R squared 0.643 0.690 0.717 0.746
Standard errors in parentheses are clustered at the country-year level . Significance: * 10 percent; ** 5 percent; *** 1 percent.
19
No such patterns when using simple average of MFN rates

REGRESSION: STRUCTURAL FACTORSREGRESSION: STRUCTURAL FACTORSDependent variable: ln(TFP)ist
(1) (2) (3) (4)Rigidity=(EPL)i Rigidity=(Severance Pay)i Rigidity=(PMR)i
EPRist-3 -0.002* -0.005*** -0.010** -0.005(0.001) (0.002) (0.004) (0.003)
Effective Input Tariffist-3 -0.087*** -0.132*** -0.190*** -0.141***(0.015) (0.027) (0.049) (0.036)
EPRist-3× 0.001*** 0.003*** 0.005*** 0.003***Eff i I T iffi 3 (0 000) (0 001) (0 001) (0 001)Effective Input Tariffist-3 (0.000) (0.001) (0.001) (0.001)
EPRist-3× 0.004*** 0.006** 0.003Rigidity (0.001) (0.002) (0.002)
Effective Input Tariffist-3× 0.055** 0.078** 0.045*Ri idit (0 028) (0 033) (0 026)Rigidity (0.028) (0.033) (0.026)
EPRist-3× -0.002*** -0.003*** -0.002***Effective Input Tariffist-3× (0.001) (0.001) (0.001)Rigidity
Country-sector FE Yes Yes Yes YesCountry-year FE Yes Yes Yes YesObs 2,796 2,796 2,796 2,796(Adj)R squared 0.723 0.725 0.726 0.724
Standard errors in parentheses are clustered at the country-year level Significance: * 10 percent; ** 5 percent; *** 1 percent
20
Both channels stronger in more flexible labor or product market economies
Standard errors in parentheses are clustered at the country year level . Significance: 10 percent; 5 percent; 1 percent.

REGRESSION: STRUCTURAL FACTORSREGRESSION: STRUCTURAL FACTORSDependent variable: ln(TFP)ist
(1) (2) (3) (4)Rigidity=(EPL)i Rigidity=(Severance Pay)i Rigidity=(PMR)i
EPRist-3 -0.002* -0.005*** -0.010** -0.005(0.001) (0.002) (0.004) (0.003)
Effective Input Tariffist-3 -0.087*** -0.132*** -0.190*** -0.141***(0.015) (0.027) (0.049) (0.036)
EPRist-3× 0.001*** 0.003*** 0.005*** 0.003***Eff i I T iffi 3 (0 000) (0 001) (0 001) (0 001)Effective Input Tariffist-3 (0.000) (0.001) (0.001) (0.001)
EPRist-3× 0.004*** 0.006** 0.003Rigidity (0.001) (0.002) (0.002)
Effective Input Tariffist-3× 0.055** 0.078** 0.045*Ri idit (0 028) (0 033) (0 026)Rigidity (0.028) (0.033) (0.026)
EPRist-3× -0.002*** -0.003*** -0.002***Effective Input Tariffist-3× (0.001) (0.001) (0.001)Rigidity
Country-sector FE Yes Yes Yes YesCountry-year FE Yes Yes Yes YesObs 2,796 2,796 2,796 2,796(Adj)R squared 0.723 0.725 0.726 0.724
Standard errors in parentheses are clustered at the country-year level Significance: * 10 percent; ** 5 percent; *** 1 percent
21
Input channel is about twice stronger in U.S. (coeff=-0.23 with EPL=0.26) than in Spain (coeff=-0.10 with EPL=1.63)
Standard errors in parentheses are clustered at the country year level . Significance: 10 percent; 5 percent; 1 percent.

REGRESSION: COMPLEMENTARITY WITH FDI POLICYREGRESSION: COMPLEMENTARITY WITH FDI POLICY
Dependent variable: ln(TFP)ist(1) (2) (3)
(Direct FDI Regulation)is (Indirect FDI Regulation)is( g ) ( g )
EPRist-3 -0.002* -0.003** 0.000(0.001) (0.002) (0.003)
Effective Input Tariffist-3 -0.087*** -0.105*** -0.102***(0.015) (0.022) (0.021)
EPRist-3× 0.001*** 0.002*** 0.001*Effective Input Tariffist-3 (0.000) (0.000) (0.000)
EPRist-3× 0.021*** 0.009FDI Regulation (0.007) (0.008)
Effective Input Tariffist-3× 0.285 0.423*FDI Regulation (0.246) -0.249
EPRist-3× -0.012** -0.004Effective Input Tariffist-3× (0.005) (0.003)FDI Regulation
Country-sector FE Yes Yes YesCountry-year FE Yes Yes YesObs 2,796 2,439 2,439(Adj)R squared 0.723 0.723 0.723
22 Input (output) market channels stronger as FDI regulations are weaker in
input (output) markets
Standard errors in parentheses are clustered at the country-year level . Significance: * 10 percent; ** 5 percent; *** 1 percent.

INTERIM SUMMARY AND POLICY IMPLICATIONSINTERIM SUMMARY AND POLICY IMPLICATIONS
Dominant input market channels:
Targeted trade policy design
Stronger effect in more flexible economies: Stronger effect in more flexible economies:
Structural reforms to maximize gains from trade liberalization
Complementarity between tariff and FDI regulations:
Scrapping non-tariff barriers to maximize gains from trade liberalization
23

EXTENSIONSEXTENSIONS
Country-sector-year varying measures on structural factors
Extending samples with labor productivity measure
Checking robustness with labor productivity Checking robustness with labor productivity
Checking (dis)similarity between advanced and emerging market economies
Accounting for catch-up dynamics
Dynamic analysis with sector-level PPP adjustments
C ff f ? Can trade policies affect the speed of catch-up?
Policy simulations
24
Policy simulations
Under hypothetical scenarios of potential reforms
Advanced back-of-envelope calculations