Generation and distribution of productivity gains in beef ...
12
HAL Id: hal-02107423 https://hal.archives-ouvertes.fr/hal-02107423 Submitted on 26 May 2020 HAL is a multi-disciplinary open access archive for the deposit and dissemination of sci- entific research documents, whether they are pub- lished or not. The documents may come from teaching and research institutions in France or abroad, or from public or private research centers. L’archive ouverte pluridisciplinaire HAL, est destinée au dépôt et à la diffusion de documents scientifiques de niveau recherche, publiés ou non, émanant des établissements d’enseignement et de recherche français ou étrangers, des laboratoires publics ou privés. Generation and distribution of productivity gains in beef cattle farming: Who are the winners and losers between 1980 and 2015? P. Veysset, M. Lherm, P. Natier, Jean-Philippe Boussemart To cite this version: P. Veysset, M. Lherm, P. Natier, Jean-Philippe Boussemart. Generation and distribution of pro- ductivity gains in beef cattle farming: Who are the winners and losers between 1980 and 2015?. Animal, Published by Elsevier (since 2021) / Cambridge University Press (until 2020), 2019, 13 (05), pp.1063-1073. 10.1017/S1751731118002574. hal-02107423
Transcript of Generation and distribution of productivity gains in beef ...
HAL Id: hal-02107423https://hal.archives-ouvertes.fr/hal-02107423
Submitted on 26 May 2020
HAL is a multi-disciplinary open accessarchive for the deposit and dissemination of sci-entific research documents, whether they are pub-lished or not. The documents may come fromteaching and research institutions in France orabroad, or from public or private research centers.
L’archive ouverte pluridisciplinaire HAL, estdestinée au dépôt et à la diffusion de documentsscientifiques de niveau recherche, publiés ou non,émanant des établissements d’enseignement et derecherche français ou étrangers, des laboratoirespublics ou privés.
Generation and distribution of productivity gains in beefcattle farming: Who are the winners and losers between
1980 and 2015?P. Veysset, M. Lherm, P. Natier, Jean-Philippe Boussemart
To cite this version:P. Veysset, M. Lherm, P. Natier, Jean-Philippe Boussemart. Generation and distribution of pro-ductivity gains in beef cattle farming: Who are the winners and losers between 1980 and 2015?.Animal, Published by Elsevier (since 2021) / Cambridge University Press (until 2020), 2019, 13 (05),pp.1063-1073. �10.1017/S1751731118002574�. �hal-02107423�

Ver
sion
pre
prin
t
Comment citer ce document :Veysset, P., Lherm, M., Boussemart, J. P., Natier, P. (2019). Generation and distribution of
productivity gains in beef cattle farming: Who are the winners and losers between 1980 and 2015?.Animal, 13 (5), 1-11. , DOI : 10.1017/S1751731118002574
Generation and distribution of productivity gains in beef cattlefarming: Who are the winners and losers between 1980 and 2015?
P. Veysset1†, M. Lherm1, J. P. Boussemart2 and P. Natier2
1Université Clermont Auvergne, INRA, VetAgro Sup, UMR Herbivores, F-63122 Saint-Genès-Champanelle, France; 2Université Lille, CNRS, IESEG School ofManagement, UMR 9221-LEM, F-59000 Lille, France
(Received 9 March 2018; Accepted 28 August 2018)
Surplus accounting is a method for evaluating trends in how a firm’s productivity factors (intermediate inputs, capital, land, labour)are performing and how the productivity gains are redistributed between agents in the economy. Here the surplus accountingmethod was applied on a database of 164 Charolais-area suckler cattle farms running from 1980 to 2015. Over this 36-year period –with differences per sub-period – the cumulative productivity surplus (PS) increased at a low rate of +0.17%/year (i.e. cumulativevolume of outputs produced increased slightly more than cumulative volume of inputs used). This timid increase in PS is linked tothe constant expansion in labour productivity whereas other factor productivities have shrunk. The observable period-widemacrotrends are that commercial farm businesses struggle to protect their revenues, we also observe a slight fall in input prices,land rent and financing costs, and a huge climb in direct support-policy payments. The bulk of the cumulative economic surplus hasbeen captured downstream – 64% downstream of the cattle value chain as a drop in prices, and 22% downstream of other valuechains (chiefly cereals). It emerges that the productivity gains in beef cattle farming mostly benefit the downstream value chain(packers–processors, distributors and consumers), whereas it is mainly government money backing this drop in prices of agriculturaloutput. Here we see the principal of the 1992 ‘MacSharry’ reform at work, with a transfer from the taxpayer through direct support-policy payments through to the consumer via lower prices. The simple fact that farmers’ incomes are stagnating is a clear indicationthat they are net losers in this distribution of productivity gains, despite the improvement in labour factor productivity.
Keywords: efficiency, farm economics, livestock farms, beef sector, surplus account
Implications
Despite a constant increase in the productivity of their labour,suckler beef farmers have seen zero gain in income for over 30years now. This rise in labour productivity masks a drop in allother factors of production, ultimately culminating in onlytimid gains in total factor productivity (TFP) growth. Thebeneficiaries of these productivity gains are actors in thedownstream value chain, and the drop in commodity prices isessentially backed by government money.
Introduction
Factor (labour and/or capital and/or intermediate inputs)productivity has always been seen as the main driver ofeconomic growth (Kendrick and Sato, 1963) and competi-tiveness (Ball et al., 2010; Latruffe, 2010). Productivity gainsmade by agriculture, which outstripped practically everyother sector of the French economy over the last six decades,
have enabled declining farm production costs and decliningfarm commodity prices (Charroin et al., 2012). Up until theearly 1990s, agriculture made substantial productivity gainsin both Europe and the United States (Ball et al., 2001).French agricultural output swelled 2.2-fold in volumebetween 1955 and 2010, driven by specialized farms,increased use of inputs, and increased capital intensity(equipment and buildings), while the share of the working-age population in agricultural work collapsed from 31% to3.4% (Charroin et al., 2012). Nevertheless, since the late1990s, even though labour productivity on commercial farmscontinues to climb, French agriculture and the wider food-farming industry have been losing competitiveness (Butaultand Réquillard, 2012), as farmers struggle to hold onto theirincome and the productivity of all other resource factors(capital, land, intermediate inputs) is asphyxiating. Sucklerbeef production has counted among the sectors of agri-culture most heavily subsidized by support-policy aids sincethe 1992 Common Agricultural Policy (CAP) reforms (Cha-tellier et al., 2003). Beef cattle farms in France have beencontinually restructuring, rebuilding, readapting and† E-mail: [email protected]
Animal, page 1 of 11 © The Animal Consortium 2018doi:10.1017/S1751731118002574
animal
1
Ver
sion
pre
prin
t
Comment citer ce document :Veysset, P., Lherm, M., Boussemart, J. P., Natier, P. (2019). Generation and distribution of
productivity gains in beef cattle farming: Who are the winners and losers between 1980 and 2015?.Animal, 13 (5), 1-11. , DOI : 10.1017/S1751731118002574
improving their labour productivity, and yet beef cattlefarmers continue to register less income than practically anyother sector of the French agriculture economy with no realsigns of improvement on the horizon (Charroin et al., 2012;Veysset et al., 2014a). Veysset et al. (2015) have demon-strated and analysed the drop in variable-factor productivityfor French suckler-cattle farms over 23 years (from 1990 to2012). The aim of this study is to measure the evolution ofthe partial and TFP over the past 36 years (1980–2015) forthese French suckler-cattle farms, and to analyse the dis-tribution between agents in the economy of these pro-ductivity gains. The generation and distribution of TFP gainsare evaluated here by the surplus accounting method (Bur-laud and Dahan, 1985; Boussemart et al., 2012).After presenting the study sample of Charolais suckler beef
farms, we start by detailing the methodology choices adop-ted. We then chart the macrotrends over a 36-year timeseries (1980–2015), by dividing this long period into threesub-periods (1980–92, 1993–2005 and 2006–15) andaccounting for partial factor productivities, productivity sur-plus (PS) and how this surplus is redistributed betweenagents in the economy. We go on to discuss the macrotrendsobserved over three sub-periods.
Material and methods
The scholarship on productivity gain distribution addresseseither a whole sector such as agriculture or a specific productsub-sector (Christensen, 1975; Ball et al., 1997; Boussemartet al., 2012), and either way, it is always entirely reliant onaggregated data from national or regional agriculture-sectoraccounts. However, the former employment, income and costsCouncil of France (CERC, 1980) underlines that it is better towork on individual data rather than aggregates, as the surpluscalculations are affected by aggregation biases. Data on indi-vidual businesses is rarely available, often blurred (statisticalsecrecy), and already part-aggregated without the technicaldetails on farm businesses’ component commodity steams.Here we adopt a novel approach that breaks from pre-existingstudies by analysing the productivity gains of a network ofsuckler beef farms via a bottom-up approach. Accountancydata for this livestock farm network provides detailed struc-tural, technical and econometric data on each individual farm.The productivity gains and price advantages (PA) of the farmproducts and factors of production are first calculated for eachindividual farm and then aggregated up to analyse the long-run trend trajectories of the whole-network data set.
Data from a Charolais suckler beef farms networkIn order to conduct studies on the structural, technical andeconomic evolutions of French beef farms, since the 1970sthe French National Institute for Agricultural Research (INRA)set up a Charolais-region farm network for long-termobservations (Veysset et al., 2015). Each farm in the net-work is sample-surveyed every year. Data is collected onlabour, structure, hectarage and land allocation scheme,
herd, intermediate inputs, sales, aids and subsidies, invest-ments, and borrowing. The set of technical–economic vari-ables computed from these field surveys are geared to atechnical–economic vision of farm management, which fea-tures a harmonized calculation on depreciation and deple-tion for each farm. As productivity gains measure year-on-year variation (see below), we filtered our database for thesub-sample of farms that had been surveyed at least twoconsecutive years after 1980 (the year marking the time-series with zero missing data across all farms in our surveynetwork). Our sub-sample thus counts 164 farms between1980 and 2015, that is, 3127 farm–year observationaldatapoints over the 36-year series, with a mean of 87observations per year (the network counts a maximum of 99farms in 1985 and 1986 and a minimum of 60 farms in2015). Our sample is relatively stable over the long-term,with a mean farm presence-in-series of 19 years.These farms are big commercial beef cattle operations
(Table 1). Between 1980 and 2015, at near-constant labourunits, they have expanded in hectarage (+64%) and herd size(+75%), thus doubling their meat output in the process.Operating capital (excluding land) increased by 46%. The farmsin this sample all run a grass-based feed systems with relativelynon-intensive main forage area (MFA) management (stockingrate at 1.17 to 1.20 livestock units (LSU)/ha MFA). Demand-side pressure (Italian market) has driven deep change in thetype of cattle farmed, operating a switch from long grow-outcycles (fattened steers and heifers sold between 30 and36 months) to young store cattle (weanling cattle sold between10 and 12 months). These structural and productive systemshifts, even coupled with huge increases in aid paymentsreceived under successive common agricultural policy (CAP)reforms, only managed to just about protect the income oflivestock farmers (Veysset et al., 2014a). Both the structuraltrends (labour, hectarage, herd size) and economics trends(output, intermediate inputs, capital, income) observed on thisINRA–Charolais-network sub-sample are wholly comparable tothe trends observed on the commercial beef cattle farms in theFarm Accountancy Data Network (farming type 46 specialistcattle) statistically representative of French farm businesses(Veysset et al., 2015).
Gains in total factor productivity and surplus accountBetween two fiscal years (year t and year t+ 1), the pro-ductivity gains measure changes in output volume net ofvariations in factor volumes (intermediate inputs, capital,land, labour). A variation in the partial productivity of a givenfactor is readily measurable, by ratioing output to that factoronly (the output yield or partial productivity of one hectare ofcereal crop, for instance), but this approach fails to co-account all the factors used to produce output. In contrast,the more exhaustive measure of TFP is a calculation thatmodels the aggregate value of all product (output) variationsas a function of the aggregate value of all factor (input)variations. As explained by Christensen (1975), and used byBall et al. (1997), the measure of the TFP of the agriculturalsector (or of a farm) has to include the intermediate inputs,
Veysset, Lherm, Boussemart and Natier
2

Ver
sion
pre
prin
t
Comment citer ce document :Veysset, P., Lherm, M., Boussemart, J. P., Natier, P. (2019). Generation and distribution of
productivity gains in beef cattle farming: Who are the winners and losers between 1980 and 2015?.Animal, 13 (5), 1-11. , DOI : 10.1017/S1751731118002574
as well as capital and labour. If Yjt and Xit are the respectiveamounts of output j and input i at date-point t, dYj and dXiare their corresponding variations between the two date-points t and t+ 1, αj is the portion of output j in total outputproduced and βi is the portion of input i in total volume ofinputs, then we get:
dTFPTFPt
=XJ
j = 1
αjdYj
Yj;t�XI
i= 1
βidXi
Xi;t
dYj =Yj;t + 1�Yj;t
dXi =Xi;t + 1�Xi;t ð1ÞThis calculation has to proceed in two steps. The first step isto measure the volume change in each item. If the volumes ofeach item are unknown, they are computed from the annualmean econometric quantities observed and their specificprice indexes (Diewert, 2003). By investigating in constantprice terms, that is, by deflating the value of each income orexpenditure by its respective price index, the observed year-on-year variation corresponds to the volume change of theitem. Then, the second step is to weight the rate of input andoutput variation by the 2-year means of their respectiveshares in total all-output returns.
αj =12
pj;tYj;t
PJj= 1
pj;tYj;t
+pj;t + 1Yj;t + 1
PJj = 1
pj;t + 1Yj;t + 1
0BBB@
1CCCA
βi =12
wi;tXi;t
PIi = 1
wi;tXi;t
+wi;t + 1Xi;t + 1
PIi= 1
wi;t + 1Xi;t + 1
0BBB@
1CCCA
pj =unit price of productðoutputÞjwi =unit price of factorðinputÞi
The surplus accounts serve to single out how the economicsurplus driven by productivity gains is distributed betweenagents in the economy. For each fiscal year at date t, consideringthat total value of different outputs J totally covers the value ofdifferent inputs I (balanced general profit/loss account; a generalequilibrium that corresponds to the assumption of total incomeentirely dissolved in paying off total factor costs), we arrive at:
XJ
j = 1
pj;tYj;t =XI
i = 1
wi;tXi;t
Thus, between two periods t and t+ 1, the variation in out-put values will be equal to the variation in input value:
XJ
j=1
pj;t+1Yj;t+1�XJ
j=1
pj;tYj;t=XI
i=1
wi;t+1Xi;t+1
�XI
i=1
wi;tXi;t ð2Þ
After a re-arrangement of equation (2), it is easy to showthat the period-to-period output and input value variationscan be decomposed into volume and price variations.
XJ
j=1
pj;tdYj�XI
i=1
wi;tdXi=�XJ
j=1
Yj;t+1dpj
+XI
i=1
Xi;t+1dwi
PS=PA ð3ÞIn equation (3), the left-hand side term becomes the differ-ence, between periods t and t+ 1, in volume variationsbetween outputs and inputs at the initial-period price. Thisvalue gap tied to volume variations is called PS. Productivitysurplus will be positive (between two periods) when outputvolumes grow faster than input volumes, and negativeotherwise. The right-hand side term measures the sum of the
Table 1 Main structural and economic characteristics of the sample of Charolais suckler beef farms from the inra-network for the years 1980, 1992,2005 and 2015
198091 farms
Mean (RSD)1
199294 farms
Mean (RSD)1
200584 farms
Mean (RSD)1
201560 farms
Mean (RDS)1
Utilized agricultural area (UAA) (ha) 110 (40) 122 (44) 153 (44) 181 (41)Non-waged workers (AWU) (n) 1.5 (40) 1.8 (36) 1.7 (40) 1.6 (38)Waged workers (AWU) (n) 0.5 (120) 0.2 (205) 0.3 (147) 0.3 (154)Livestock units (LSU) (n) 97 (41) 127 (46) 151 (47) 170 (43)Cows (n) 47 (33) 69 (43) 85 (44) 100 (48)Stocking rate (LSU/ha main fodder area) 1.17 (24) 1.33 (18) 1.20 (14) 1.20 (18)Operating capital (k€ 2015) 333 (39) 347 (44) 434 (47) 485 (41)Beef production (kg live weight) 25 516 (40) 38 099 (49) 48 085 (53) 54 325 (47)Aids/subsidies received (€ 2015) 6266 (37) 24 920 (52) 72 402 (40) 71 249 (33)Profit (or net farm income)2 (€ 2015) 43 312 (63) 39 734 (57) 48 025 (61) 35 547 (87)
AWU= annual work units.1RSD= Relative standard deviation= standard deviation
mean % .2Profit (or net farm income)= gross farm product (including aids and subsidies)− intermediate inputs− labour costs (wages, payroll taxes and social contributions)− land rent− financial costs.
Productivity gains in beef cattle farming
3

Ver
sion
pre
prin
t
Comment citer ce document :Veysset, P., Lherm, M., Boussemart, J. P., Natier, P. (2019). Generation and distribution of
productivity gains in beef cattle farming: Who are the winners and losers between 1980 and 2015?.Animal, 13 (5), 1-11. , DOI : 10.1017/S1751731118002574
PA. For a given agent in the economy, their PA between twoperiods t and t+ 1 equals the price variations weighted by thevolumes of period t+ 1. An input price increase is considered aPA for the input supplier (who gets paid more), while anoutput price decrease is considered a PA for the customer (asthe output price becomes cheaper). Equation (3) expressesthat PS equals sum of PA. This equality explicitly demonstratesthat between two periods, a business cannot distribute aspayment changes (or PA) more than it can generate fromproductivity gains. Net-negative PA can be considered as netprovisions from stakeholders, and is cumulatable with a net-positive PS, which thus gives the total amount of resourcesthat the beneficiaries of positive PA will share out. If thebusiness registers a drop in productivity (PS< 0), it has tocounterbalance by making certain stakeholders pay more foroutputs or less for inputs – and either way bear the brunt ofprice disadvantages, as the absolute (real) value of the PSbecomes an added amount to finance. Here we can establish auses/resources-balanced surplus account (Table 2).On aggregate, the price and quantity variations connect to
either an ‘origin’ (resource) or a ‘distribution’ (use) of thetotal economic surplus, thus enabling us to analyse all thecorresponding transfers (Figure 1) among customers, sup-pliers of intermediate inputs (feedingstuffs, fertilizers, fuels,services and so on), suppliers of primary factors (labour, land,fixed assets) and government subsidies and taxes (EU,national, regional, etc.).Working up from equation (1), the relative (expressed in %
terms) rate of TFP growth can likewise be calculated usingthe surplus rate by dividing PS by the total value of output(Boussemart et al., 2012).
dTFPTFPt
=
PJj = 1
pj;tdYj�PIi= 1
wi;tdXi
PJj = 1
pj;tYj;t
In equation (3), the volume variations between periodst and t+ 1 were weighted by the initial-period prices
(Laspeyres-type index) while the price variations were weigh-ted by the final-period volumes (Paasche-type index). Wecould equally well have chosen a Paasche-type index for thevolume variations and a Laspeyres-type index for the pricevariations. The choice of index used is not, therefore, a neutralchoice. To ensure that the final result is not dependent on arandom choice of index type, we use the Bennet approachwhich consists in computing the arithmetic mean of the Las-peyres and Paasche expressions (Caves et al., 1982):
XJ
j = 1
pj;t +pj;t + 1
2
� �dyj�
XI
i= 1
wi;t +wi;t + 1
2
� �dxi =
�XJ
j= 1
yj;t + yj;t + 12
� �dpj +
XI
i= 1
xi;t + xi;t + 12
� �dwi
Empirical modellingFor each farm in our database of suckler cattle operations, wehave the real volumes (quantities) for the following outputs:
∙ beef live weight produced;∙ sheep live weight produced;∙ cereal crops produced.
These three outputs together account for 90% to 95% ofthe gross value excluding aids of total farm output. With thevalue and volumes of these outputs for each farm and eachyear, we were able to compute the year-by-year unit prices ofeach of these outputs, and directly dissociate the volume andprice values for a compact number of inputs farm-by-farm.
The labour factor. For waged labour, the net wages andpayroll taxes are the values and the number of wage-earningannual work units (AWU) is taken as the volume. Net farmincome, calculated as the balance between the farm’s outputreturns and input expenditures (including social contribu-tions), is considered as the profit made by the farmer, andthis net income (or profit) thus corresponds to payment fornon-waged labour, the volume of which is given by thenumber of AWU going unwaged.
Table 2 Balanced economic surplus account of a holding
Uses Resources
− PS (if< 0) economic loss tied to a bigger drop in input volumesused over the period than output volumes
PS (if> 0) economic gain tied to a bigger rise in output volumesover the period than input volumes used
− Yj,t+ 1dpj1 drop in output tied to the drop in price of
commodity j over the periodYj,t+ 1dpj
1 rise in output tied to the rise in price of commodityj over the period
Xi,t+ 1dwi2 increase in expenditure tied to the rise in price of
input i over the period− Xi,t+ 1dwi
2 drop in expenditure tied to the drop in price ofinput i over the period
… …
Total economic surplus Total economic surplus
PS= productivity surplus.The surplus accounts singles out how the economic surplus driven by productivity gains (quantities variations) is distributed between agents in the economy (pricesvariations). All the origins (Resources) of the balanced account are distributed (Uses).1Yj,t+ 1 amounts of output j at date-point t+ 1, dpj price variations of the output j between the two date-points t and t+ 1.2Xi,t+ 1 amounts of input i at date-point t+ 1, dwi price variations of the input i between the two date-points t and t+ 1.
Veysset, Lherm, Boussemart and Natier
4

Ver
sion
pre
prin
t
Comment citer ce document :Veysset, P., Lherm, M., Boussemart, J. P., Natier, P. (2019). Generation and distribution of
productivity gains in beef cattle farming: Who are the winners and losers between 1980 and 2015?.Animal, 13 (5), 1-11. , DOI : 10.1017/S1751731118002574
The land factor. The cost of use of land is represented by landrent. To overcome the biases in system of land tenure, weconsidered that the all utilized agricultural area (UAA) of allthe farms was under land-leasing arrangements. We thusapplied a mean rental on ownership land. The volume of the‘land’ factor is thus the UAA expressed in hectares.
The capital factor and financing costs. The capital addressedhere only concerns fixed assets (farm buildings and fixedequipment, land improvements, machinery and equipment)and does not integrate the land and the herd-count. Wedistinguish two components of the account relating to thecapital: (i) the physical capital (equipment, buildings), whoseuse in the production process causes equipment wear (con-sumption of fixed capital); this is measured by the depre-ciation; (ii) the immobilization in the holding of a financialcapital provided by a supplier; these debts are remuneratedby the interest paid. To respect the principle of the surplusaccounts method, which is to assign a PA per partner iden-tified for each entry of the farming accounts, we allocate thefinancial costs to the suppliers of the borrowed capital(mainly banks), and depreciation to the suppliers ofequipment.The volume (kg) of concentrate feedingstuffs purchased is
known. This item accounts for 15% to 20% by value of totalintermediate inputs.As we only have the economic value for the other outputs
and inputs, we use their respective prices indices todecompose the volume–price split. The index of producerprices of agricultural products (IPPAP) is designed as a metricof changes in prices paid to farmers (Eurostat, 2017). Theannual values of output oilcrops, pigs and poultry for eachfarm in our farm network sample were deflated by theirrespective IPPAP.Given the significance of aids and subsidies as important
returns of livestock farm economics, the question arises as totheir volume–price split. We worked to the assumption that
these aids and subsidies did not change volume as they arebroadly decoupled, and so price-effect of variation insubsidization thus corresponds to the observed variation intotal price value. This means that we have year-to-year pricemovement but not year-to-year volume change.The index of purchase prices of the means of agricultural
production (IPPMAP) serves to track and trend the unit pricesthat farmers pay for goods and services needed for theirfarming activity (Eurostat, 2017). Just like for the outputseries, the annual mean values of each expenditure – seed,fertilizer and soil amendments, veterinary, pest controlproducts, energy, capital goods, consultancy and overheads– of each farm in our network sample were deflated withtheir own respective annual IPPMAP.All changes in volumes, prices (all nominal-value prices
internalize currency depreciation using the national con-sumer price index as deflator), PS and PA are calculated atevery year t+ 1 as the differential with year t for each farmpresent in-sample at both years t and t+ 1. The annual PSand PA results are averaged and then the averages aresummed to get the cumulative PS and PA surplus figures, andthus establish the balanced surplus account over the periodof study.The 36-year period (1980–2015) was stratified into three
sub-periods charting the major CAP reform landmarks andthe year these reforms came into full force. The core of the1992 ‘MacSharry reforms’, which were phased in from 1993,was to cut intervention prices for cereals and beef andcompensate farmers through producer subsidies coupled tohectare of land and head of livestock. The 2003 ‘LuxembourgAgreement’, which came into full force in 2006, introducedthe partial decoupling of subsidies and the single paymentscheme. 2015 was the first year of the new 2015–20 CAP,and did not represent a significant breakdown compared tothe previous rules (the new payments will be implementedprogressively over the 5 years). The three sub-periods thusspan: 1980–92 (13 years), 1993–2005 (13 years) and 2006–
Figure 1 Distribution of the productivity gains and price advantages. Balanced economic surplus account.
Productivity gains in beef cattle farming
5

Ver
sion
pre
prin
t
Comment citer ce document :Veysset, P., Lherm, M., Boussemart, J. P., Natier, P. (2019). Generation and distribution of
productivity gains in beef cattle farming: Who are the winners and losers between 1980 and 2015?.Animal, 13 (5), 1-11. , DOI : 10.1017/S1751731118002574
15 (10 years). The 36-year period was also marked by arecord-breaking drought in 2003 that caused a collapse infodder production, two bovine spongiform encephalopathycrises in 1996 and 2000–01, and cereal price spikes in 2007and 2012.
Results
Partial and total factor productivity and productivity surplusOver the 36-year period under study, mean farm area (UAA)has increased at a mean rate of 1.69% per year and volumeof farm output has increased at a mean pace of 2.03% peryear, whereas total labour input has remained practicallyunchanged, and is even tending to drop (−0.05%/year). Wethus have contrasted trajectories of the partial factor pro-ductivity figures (Table 3). Labour-factor productivity hasclimbed steadily over the 36 years, whereas land-factorproductivity has been in decline since 1992 (with an exten-sification of fodder area while cereal crop yields have stag-nated). In global trend terms, there has been a net decline inthe productivity growth of intermediate inputs. Heavyinvestment in buildings and equipment over the 1990smeant that farm equipment productivity plummetedbetween 1993 and 2005. In global trend terms, after a phaseof growth from 1980–92 (+0.51%/year), TFP (or the cumu-lative trend in PS) shrank by 0.42%/year from 1993 to 2005and 0.16%/year since 2006, that is, a net decline in TFP of0.07%/year between 1993 and 2015 (Figure 2).
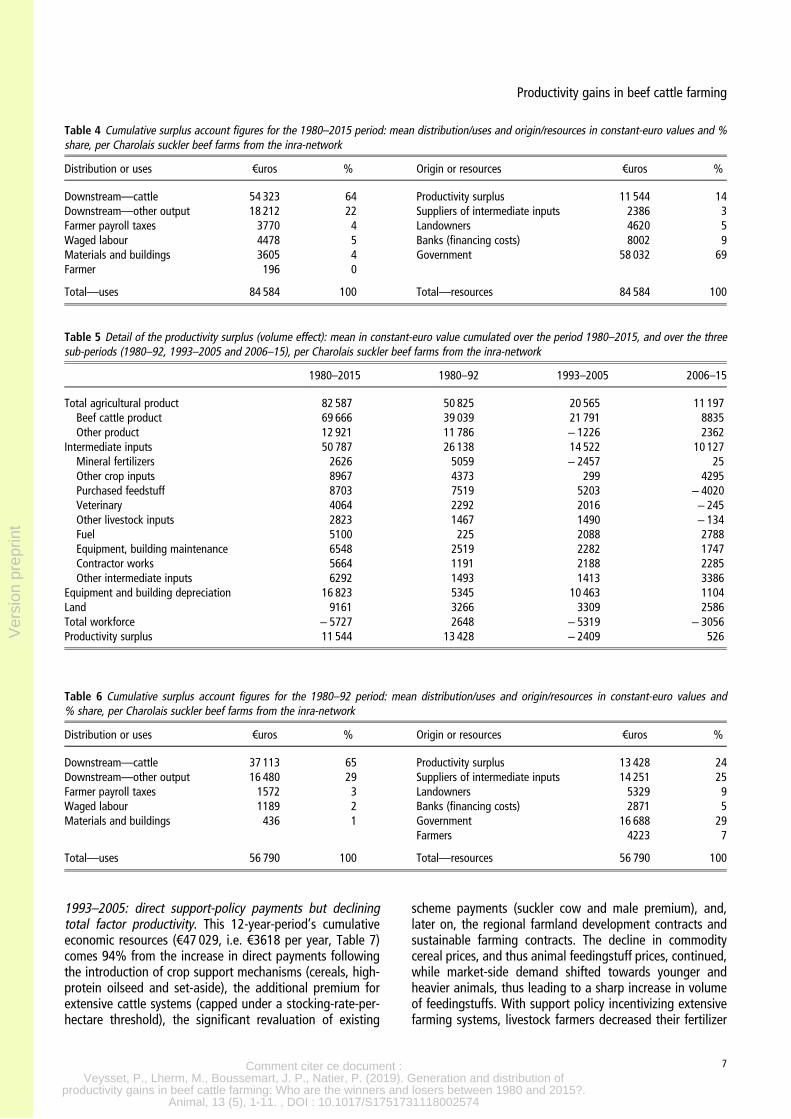
Surplus accounting: origin (resources) and distribution (use)of the cumulative economic surplusOver the end-to-end 36-year period, the cumulative surplusof TFP and absolute (real) value of negative PA, in constant-euro values and per-farm mean, comes to a total economicsurplus of €84 584, that is, €2350/year (Table 4). This eco-nomic surplus essentially comes from government (69%) viaaid support to livestock farmers, with only 14% coming fromproductivity gains. In global trend terms, over the period,there has been an observable drop in intermediate inputprices and land leasing prices (which account for 3% and5%, respectively, of economic surplus). Despite some pro-ductivity gains (PS> 0, Table 5) and all the governmentsubsidies, farmer income has not moved and remains flat.86% of these resources is captured downstream, as a drop incommodity prices. The downstream beef cattle value chain
captures 64% of the resources generated. Farmers’ payrolltaxes have increased despite stagnating income capturing4% of resources, cost of waged labour has only slightlyincreased, and suppliers of fixed assets and equipment havecaptured 4% of the surplus.
1980–92 period: gains in productivity and strong drops incommodity prices. Over this 13-year period, the origin of thetotal economic resources (€56 790, i.e. €4368/year, Table 6)was shared between gains TFP (24%), a drop in intermediateinput prices (25%), and an increase in government money(29%). A 94% majority of these resources has been captureddownstream – 65% downstream of the cattle value chain asa drop in prices. The drop in intermediate input prices wasessentially driven by the drop in petrol prices, which led to adrop in the cost of fertilizers, and by the drop in cost ofanimal feedingstuffs, which is itself linked to the drop incereal prices. The rise in subsidization – and thus in gov-ernment money – in the origin of the economic surplus islinked to the introduction, in 1980, of the suckler cow pre-mium as a mechanism to stop suckler beef herds beingconverted to more lucrative dairy cow herds, at a time whenthe EU already registered a milk surplus. In 1987, the specialpremium for male animal was also brought in to encouragefattening of bulls and steers. The drop in intermediate inputprices, the technical efforts of the farmers to limit the volumeof inputs used (PS>0, Table 5), and the stronger governmentsubsidization support still failed to offset the PA captureddownstream, and farmer incomes fell slightly. This drop inpayment for the farmers’ labour accounts for 7% of theresources in the economic surplus generated over this13-year period.
Table 3 Breakdown of partial and total factor productivity, average annual growth rate of the Charolais suckler beef farms from the inra-network,in %
Period and sub-periods 1980–2015 1980–92 1993–2005 2006–15
Labour 2.03 2.71 1.05 2.53Land 0.29 1.95 − 0.26 − 0.12Intermediate inputs − 0.37 − 0.14 − 1.40 0.13Fixed asset (farm equipment) − 0.85 1.10 − 3.19 1.02Total factor productivity growth 0.17 0.51 − 0.42 − 0.16
Figure 2 Productivity surplus as cumulative 1980–2015 figure andannual growth rate per sub-period for the Charolais suckler beef farmsfrom the inra-network.
Veysset, Lherm, Boussemart and Natier
6
Ver
sion
pre
prin
t
Comment citer ce document :Veysset, P., Lherm, M., Boussemart, J. P., Natier, P. (2019). Generation and distribution of
productivity gains in beef cattle farming: Who are the winners and losers between 1980 and 2015?.Animal, 13 (5), 1-11. , DOI : 10.1017/S1751731118002574
1993–2005: direct support-policy payments but decliningtotal factor productivity. This 12-year-period’s cumulativeeconomic resources (€47 029, i.e. €3618 per year, Table 7)comes 94% from the increase in direct payments followingthe introduction of crop support mechanisms (cereals, high-protein oilseed and set-aside), the additional premium forextensive cattle systems (capped under a stocking-rate-per-hectare threshold), the significant revaluation of existing
scheme payments (suckler cow and male premium), and,later on, the regional farmland development contracts andsustainable farming contracts. The decline in commoditycereal prices, and thus animal feedingstuff prices, continued,while market-side demand shifted towards younger andheavier animals, thus leading to a sharp increase in volumeof feedingstuffs. With support policy incentivizing extensivefarming systems, livestock farmers decreased their fertilizer
Table 4 Cumulative surplus account figures for the 1980–2015 period: mean distribution/uses and origin/resources in constant-euro values and %share, per Charolais suckler beef farms from the inra-network
Distribution or uses €uros % Origin or resources €uros %
Downstream—cattle 54 323 64 Productivity surplus 11 544 14Downstream—other output 18 212 22 Suppliers of intermediate inputs 2386 3Farmer payroll taxes 3770 4 Landowners 4620 5Waged labour 4478 5 Banks (financing costs) 8002 9Materials and buildings 3605 4 Government 58 032 69Farmer 196 0
Total—uses 84 584 100 Total—resources 84 584 100
Table 5 Detail of the productivity surplus (volume effect): mean in constant-euro value cumulated over the period 1980–2015, and over the threesub-periods (1980–92, 1993–2005 and 2006–15), per Charolais suckler beef farms from the inra-network
1980–2015 1980–92 1993–2005 2006–15
Total agricultural product 82 587 50 825 20 565 11 197Beef cattle product 69 666 39 039 21 791 8835Other product 12 921 11 786 − 1226 2362
Intermediate inputs 50 787 26 138 14 522 10 127Mineral fertilizers 2626 5059 − 2457 25Other crop inputs 8967 4373 299 4295Purchased feedstuff 8703 7519 5203 − 4020Veterinary 4064 2292 2016 − 245Other livestock inputs 2823 1467 1490 − 134Fuel 5100 225 2088 2788Equipment, building maintenance 6548 2519 2282 1747Contractor works 5664 1191 2188 2285Other intermediate inputs 6292 1493 1413 3386
Equipment and building depreciation 16 823 5345 10 463 1104Land 9161 3266 3309 2586Total workforce − 5727 2648 − 5319 − 3056Productivity surplus 11 544 13 428 − 2409 526
Table 6 Cumulative surplus account figures for the 1980–92 period: mean distribution/uses and origin/resources in constant-euro values and% share, per Charolais suckler beef farms from the inra-network
Distribution or uses €uros % Origin or resources €uros %
Downstream—cattle 37 113 65 Productivity surplus 13 428 24Downstream—other output 16 480 29 Suppliers of intermediate inputs 14 251 25Farmer payroll taxes 1572 3 Landowners 5329 9Waged labour 1189 2 Banks (financing costs) 2871 5Materials and buildings 436 1 Government 16 688 29
Farmers 4223 7
Total—uses 56 790 100 Total—resources 56 790 100
Productivity gains in beef cattle farming
7

Ver
sion
pre
prin
t
Comment citer ce document :Veysset, P., Lherm, M., Boussemart, J. P., Natier, P. (2019). Generation and distribution of
productivity gains in beef cattle farming: Who are the winners and losers between 1980 and 2015?.Animal, 13 (5), 1-11. , DOI : 10.1017/S1751731118002574
input volumes, but at the same time investing in buildingsand new fodder harvesting–storage–distribution machinerygenerating extra fuel-use and new needs for contractoperations. In global trend terms, volume of inputs increasedfaster than volume of outputs (Table 5). Government moneyfinanced the entire drop in productivity, as well as the con-tinuing drop in commodity prices and the increase in farmerincomes. These government support-policy aids, cumulatedwith a drop in interest rates, are distributed between thedownstream sector supply chains (61%), farmers’ incomeand payroll taxes (21% and 8%, respectively), and the dropin TFP (5%).Note that this period includes the heatwave year 2003,
when the hottest summer on record led to a 50%-odd drop ingrass growth. The heatwave brought about a tangible dropin quantities produced (livestock sold at lighter weight) and,crucially, an increase in animal feedingstuffs purchased. Thisclimate episode caused a sharp decline in PS (Figure 1) andcancelled out the productivity gains made over the previous23 years. Even if we exclude the year-2003 figures,cumulative PS over the 1993–2002 remains negative(− €345). This does not undermine the observation madeabove: there was effectively a real downward trend inproductivity over this period, but the 2003 climate episodeaccentuated the trend.
2006–15 period: rise in intermediate input prices, drop ingovernment support aids and subsidies. This period has
proven the most economically stable of the three, since theannualized mean resources amount to just €1720 per year.Highlighting the period is the rise in producer price forcattle. This price rise is at the origin of 20% of the 10-year-period’s cumulative economic surplus (Table 8). Thecereal price spikes in 2007 and 2012 are at the origin of30% of the 10-year-period’s cumulative economic surplus.The rise in cereal prices, and thus animal feedingstuff pri-ces, explains 50% of the rise in intermediate input prices,but it also prompted livestock farmers to distribute less totheir animals. This declining use of purchased animal fee-dingstuffs, combined with the slowdown of investments inequipment and buildings, and thus a decrease in the useof capital assets, explains why PS swung back into thepositive (Table 5), but it also accounts for just 3% of theorigin of cumulative resources. The fact that the PScumulated over this 10-year sub-period inched up into thepositive is linked to the fact that the increase in UAA, fixedassets and intermediate inputs used is compensated for bythe drop in number of AWU. However, the multi-factor(primarily labour) productivity gain and the rise in cerealcrop and cattle outputs were still not enough to compen-sate for the rise in intermediate input prices and the scale-back of support policy (phase-out of regional farmlanddevelopment contracts and ‘modulation’ of payments), allof which converged to decrease farmer income. This dropin payment for the farmers’ labour accounts for 28% ofsurplus-account resources.
Table 7 Cumulative surplus account figures for the 1993–2005 period: mean distribution/uses and origin/resources in constant-euro values and %share, per Charolais suckler beef farms from the inra-network
Distribution or uses €uros % Origin or resources €uros %
Downstream—cattle 20 588 46 Banks (financing costs) 2938 6Downstream—other output 6861 15 Government 44 091 94Suppliers of intermediate inputs 972 2Farmer payroll taxes 3430 8Waged labour 2015 5Landowners 379 1Materials and buildings 1218 3Farmer 9157 21Productivity surplus 2409 5
Total—uses 47 029 100 Total—resources 47 029 100
Table 8 Cumulative surplus account figures for the 2006–15 period: mean distribution/uses and origin/resources in constant-euro values and %share, per Charolais suckler beef farms from the inra-network
Distribution or uses €uros % Origin or resources €uros %
Suppliers of intermediate inputs 10 893 63 Productivity surplus 526 3Waged labour 1275 7 Downstream—cattle 3378 20Landowners 330 2 Downstream—other output 5129 30Materials and buildings 1951 11 Banks (financing costs) 2193 13Government 2747 16 Farmer payroll taxes 1232 7
Farmer 4738 28Total—uses 17 196 100 Total—resources 17 196 100
Veysset, Lherm, Boussemart and Natier
8

Ver
sion
pre
prin
t
Comment citer ce document :Veysset, P., Lherm, M., Boussemart, J. P., Natier, P. (2019). Generation and distribution of
productivity gains in beef cattle farming: Who are the winners and losers between 1980 and 2015?.Animal, 13 (5), 1-11. , DOI : 10.1017/S1751731118002574
Discussion
The surplus accounting method, like most methods, is sen-sitive to the underlying assumptions. Decomposing economicvalue change into a volume effect and a price effect entailschoices between indexes and between assumptions. Here,for instance, we chose to only consider a price effect onchange in government subsidization, but as direct paymentsare allocated on the basis of headage or hectarage, we couldequally well have chosen to consider a volume effect repre-sented by change in number of premium-scheme cows orhectares. Calculations were repeated with this newassumption, and although the results were different in valueterms, the trends of change were the same.The bottom-up approach adopted here avoided the biases
inherent to using aggregate national indexes that are notspecific to a localized sector of activity. Working with realprices and volumes recorded every year for a significant setof items in the profit/loss account of each individual farmenables us to more accurately track and trend the changes inTFP established at domestic sub-sector and/or regional level.
Total factor productivity or labour productivity?The (very timid) productivity gains over this long 36-yeartime-series period manage to emerge. These gains are notcontinuous, and they vary significantly between periods. Thekey highlights are continuous growth in labour productivity,stagnation in farmer income and continuous decline intechnical efficiency (productivity of intermediate inputs) ofthe production systems. These results counter most of theresults found in literature. Many studies concluded that smallfamily-farms, at a national level, are less efficient with alower productivity than largest specialized farms that useimproved technologies and economies of scale (Gorton andDavidova, 2004; Morrison Paul et al., 2004; Latruffe et al.,2005; Mosheim and Knox Lovell, 2009). However, the eco-efficiency (Keating et al., 2010) of a livestock farm dependsnot only on its size, but also on its location or system man-agement (Soteriades et al., 2016). We observe capital dee-pening with a work-for-assets/inputs switch. The upshot isthat the only real productivity gains made in beef cattlefarming over the past 36 years are labour productivity gains.It is legitimate to question whether this strategy holds rele-vancy, if it does not benefit the worker, if it completely masks(or even holds back) the expression of technical, genetic andknowledge-capital gains.
The downstream meat value chain captures the government-financed economic surplusThe cumulative economic surplus over the 36 years understudy comes 69% from government aids and goes 86% todownstream value chains, with 64% captured by thedownstream beef value chain. The downstream beef valuechain stretches from the first link into market (livestockcommodities market, at the slaughterhouse gate) through tothe consumer end, including an array of actors in the econ-omy (livestock trader, packers and processors, caterers,
distributors, and more). Thus arises the question of how thissurplus is distributed throughout the value chain down-stream of the farm gate. Down at the very end of the chain,the meat consumer has failed to benefit from the drop inproducer prices. On aggregate, over the past 36 years, inconstant-euro values, the price of cattle paid to producersslumped by 40%, whereas the price of beef paid by con-sumers (consumer price index for beef) climbed 20%. Thepattern of change in this index thus includes a quality effect,featuring a shift towards a more services-intensive productoutput (mincing, marketing, packaging, food safety guaran-tees) (Verbeke et al., 2010; Font-i-Furnols and Guerrero,2014) with all the allied costs involved, whereas back on thefarm, the beef grade cattle have remained practically thesame (mostly female cull cows and heifers aged 30 months-plus). France has a food pricing and profit margins observa-tory that monitors how prices and margins are generatedthroughout the farmed food supply chains and on to retail. Inits latest report (FranceAgriMer, 2016), the observatory notesthat beef packers and processors are still registering paper-thin pre-tax profits (0.4% to 2% of the value produced). Thiscan be explained by the difficulties in improving rawmaterial-to-final product conversion yields, difficulties com-pounded by the fact that yield gains cannot offset thetougher new environmental and food safety standards. Thedrop in producer price for cattle has thus been dilutedthrough the downstream supply chain.Government has been the main driver behind of these
changes. Prior to the 1992 MacSharry reforms, the indirectsupport-policy payments including in commodity selling pri-ces did not prevent productivity gains generated by farmersgetting transferred downstream the beef cattle value chain.Then, over the period during which policy aids were coupledto headage and hectarage, livestock farmers were able tobenefit from upvaluation through the heavy aid-schemepremiums whereas the downstream supply chain continuedto profit from declining prices. Lastly, since 2006, livestockfarmers have not benefited from the (partial) decoupling andmodulation of support payments. By modelling, Ash et al.(2015) observed a positive impact of the factor productivityon beef farm profitability, but, in other hand, CAP subsidiescould affect negatively the farm productivity (Rizov et al.,2013). Bojnec and Latruffe (2013) observed that medium-size farms in Slovenia are the less profitable: large farms aretechnically efficient and small farms are highly subsidizedand more allocatively efficient. Ultimately, French beeffarmers’ income is not correlated to farmer productivitygains, and government subsidies do not always benefit theprofessional branch they are partly intended for. Governmentsubsidies to farming are designed to support a number ofobjectives (to support farming income, to support price-competitive agrifood supply chains, to curb food price infla-tion, etc.), yet in the case of the beef sector, producers havecaptured practically none of this support.The constant increase in the farms and herds’ size,
encouraged by the non-capped subsidies, led to an increasein inputs and equipment used per unit of output. Thus, we
Productivity gains in beef cattle farming
9

Ver
sion
pre
prin
t
Comment citer ce document :Veysset, P., Lherm, M., Boussemart, J. P., Natier, P. (2019). Generation and distribution of
productivity gains in beef cattle farming: Who are the winners and losers between 1980 and 2015?.Animal, 13 (5), 1-11. , DOI : 10.1017/S1751731118002574
observed an increase in the use of fossil-fuel energy and ingreenhouse gas (GHG) emissions per kilogram live weightproduced, and a negative correlation between the size ofthese Charolais suckler-cattle farms and these environmentalperformances (Veysset et al., 2014b). It also appeared that,through better technical performances and lower use ofinputs, the less-GHG-emitting farms (that are smaller thanthe most-GHG-emitting farms) generated higher income perworker while consuming less fossil energy. The enlargementstrategy runs counter to the clean energy challenge and theproject of agroecology transition for green growth.
Conclusion
Analysis of how the Charolais beef cattle sector’s productiveresources have been redistributed over the course of the past 36years finds that the sector’s downstream customers have comeout as the main winners via declining prices,. These decliningprices have essentially been subsidized by government via CAPpayments and other support-policy aids. There are TFP gains,but they tend to be modest, fluctuating between periods buttending to a downward curve, whereas the labour productivityof the livestock farmers shows constant steady growth. Thegains in labour productivity made by the farmers mask thesteady decline in all other factor productivity (land, intermediateinputs and equipment) leaving the beef cattle production sys-tems increasingly inputs- and capital-dependent. The simple factthat farmers struggle to protect their income is a clear indicationthat they have been losers in this distribution of productivitygains. The strategy of continually re-adapting farm structure(up-scaling size and down-sizing labour, development of asso-ciative organization structures, investment in new infrastructureand new technologies) and farm systems (standardization offarmed animal output and feed management practices) to meetmarket requirements (basic commodity raw material) has notproven an entirely winning strategy for the farmers themselves.These macrotrends manifestly mask relatively significant inter-farm and year-on-year variabilities that warrant further investi-gation in future studies.Livestock is more than just a sector of the economy pro-
ducing market goods – it also plays a pivotal role in territorialland occupancy and rural development in less-favouredpasture-based zones where few if any viable alternativesexist. To stem the decline in value-added created by livestockfarming and improve livestock farmer profits (without redis-tributing their share down to other agents in the economy),one solution could be to more actively couple farm outputs toterritory, via localized bioregional farming practices (fatten-ing livestock locally) and quality labels. In a context of beefconsumption declining, consumers express preference andwillingness to pay for country‐of‐origin‐labelled beef andfood safety enhancements. The challenge is for livestockfarmers to capture a share of the fast-growing services valuecomponent of food consumption, for example, through newmarketing chains or cooperatives. Public policies, and
especially the laws, could have a role by inciting the bovinesector stakeholders to establish fair agreements.
AcknowledgementsThe authors thank the farmers who kindly provided the yearlydata from their registers to complete this study.
Declaration of interestThe authors declare no competiting interests regarding thispublication.
Ethics statementSection is irrelevant for this study.
Software and data repository resourcesData used are individual economic data protected by statisticalconfidentiality. They were not deposited in an officialrepository.
ReferencesAsh A, Hunt L, McDonald C, Scanlan J, Bell L, Cowley R, Watson I, McIvor J andMacLeod N 2015. Boosting the productivity and profitability of northern Aus-tralian beef enterprises: exploring innovation options using simulation model-ling and systems analysis. Agricultural Systems 139, 50–65.
Ball VE, Bureau JC, Butault JP and Nehring R 2001. Levels of farm sector pro-ductivity: an international comparison. Journal of Productivity Analysis 15, 5–29.
Ball VE, Bureau JC, Nehring R and Somwaru A 1997. Agricultural productivityrevisited. American Journal of Agricultural Economics 79, 1045–1063.
Ball VE, Butault JP, Juan CS and Mora R 2010. Productivity and internationalcompetitiveness of agriculture in the European Union and the United States.Agricultural Economics 41, 611–627.
Bojnec S and Latruffe L 2013. Farm size, agricultural subsidies and farm per-formance in Slovenia. Land Use Policy 32, 207–217.
Boussemart JP, Butault JP and Ojo O 2012. Generation and distribution ofproductivity gains in French agriculture. Who are the winners and the losers overthe last fifty years? Bulletin USAMV, Horticulture 69, 55–67.
Burlaud A and Dahan L 1985. Global productivity surplus accounts. InternationalJournal of Accounting Education and Research 21, 159–169.
Butault JP and Réquillard V 2012. L’agriculture et l’agroalimentaire français à larecherche d’une compétitivité perdue. INRA Sciences Sociales 4, 4.
Caves DW, Christensen LR and Diewert WE 1982. Multilateral comparisons ofoutput, input, and productivity using superlative index numbers. EconomicJournal 92, 73–86.
CERC 1980. Productivité globale et comptes de surplus. Documents du CERC(Centre d’Etude des Revenus et des Coûts) 55/56, 3e-4e trim., Documentationfrançaise, Paris.
Charroin T, Veysset P, Devienne S, Fromont JL, Palazon R and Ferrand M 2012.Labour productivity and economy in herbivore rearing: concepts, analysisand stakes. INRA Productions Animales 25, 193–210.
Chatellier V, Guyomard H and Le Bris K 2003. La production bovine dans l’Unioneuropéenne : entre économie de marché et politique de territoire. Déméter 2004,Ed. Armand Colin, Paris, pp. 67–177.
Christensen LR 1975. Concepts and measurement of agricultural productivity.American Journal of Agricultural Economics 57, 910–915.
Diewert WE 2003. Index number concepts, measures and decomposition ofproductivity growth. Journal of Productivity Analysis 19, 127–159.
Eurostat 2017. Price indices of agricultural products. Retrieved on 8 November2017 from http://ec.europa.eu/eurostat/cache/metadata/en/apri_pi_esms.htm.
Font-i-Furnols M and Guerrero L 2014. Consumer preference, behavior and per-ception about meat and meat products: an overview. Meat Science 98, 361–371.
Veysset, Lherm, Boussemart and Natier
10
Ver
sion
pre
prin
t
Comment citer ce document :Veysset, P., Lherm, M., Boussemart, J. P., Natier, P. (2019). Generation and distribution of
productivity gains in beef cattle farming: Who are the winners and losers between 1980 and 2015?.Animal, 13 (5), 1-11. , DOI : 10.1017/S1751731118002574
FranceAgriMer 2016. Observatoire de la formation des prix et des marges desproduits alimentaires. Rapport au Parlement 2016, 262.Gorton M and Davidova S 2004. Farm productivity and efficiency in the CEEapplicant countries: a synthesis of results. Agricultural Economics 30, 1–16.Keating BA, Carberry PS, Bindraban PS, Asseng S, Meinke H and Dixon J 2010.Eco-efficient agriculture: concepts, challenges, and opportunities. Crop Science50, 109–119.Kendrick JW and Sato R 1963. Factor prices, productivity and economic growth.American Economic Review 53, 973–1004.Latruffe L 2010. Competitiveness, productivity and efficiency in the agriculturaland agri-food sectors. OECD Food, Agriculture and Fisheries Papers 30, OECDPublishing.http://dx.doi.org/10.1787/5km91nkdt6d6-en.Latruffe L, Balcombe K, Davidova S and Zawalinska K 2005. Technical and scaleefficiency of crop and livestock farms in Poland: does specialization matter?Agricultural Economics 32, 281–296.Morrison Paul C, Nehring R, Banker D and Somwaru A 2004. Scale economiesand efficiency in U.S. agriculture: are traditional farms history? Journal of Pro-ductivity Analysis 22, 185–205.Mosheim R and Knox Lovell CA 2009. Scale economies and inefficiency. Amer-ican Journal of Agricultural Economics 91, 777–794.
Rizov M, Pokrivcak J and Ciaian P 2013. CAP subsidies and productivity of theEU farm. Journal of Agricultural Economics 64, 537–557.
Soteriades AD, Faverdin P, Moreau S, Charroin T, Blanchard M and Stott AW2016. An approach to holistically assess (dairy) farm eco-efficiency by combininglife cycle analysis with data envelopment analysis models and methodologies.Animal 10, 1899–1910.
Verbeke W, Pérez-Cueto FJA, de Barcellos MD, Krystallis A and G. Grunert KG2010. European citizen and consumer attitudes and preferences regarding beefand pork. Meat Science 84, 284–292.
Veysset P, Benoit M, Laignel G, Bébin D, Roulenc M and Lherm M 2014a.Analysis and determinants of the performances evolution of sheep for meat andsuckler cattle farms in less favoured areas from 1990 to 2012. INRA ProductionsAnimales 27, 49–64.
Veysset P, Lherm M, Bébin D, Roulenc M and Benoit M 2014b. Variability ingreenhouse gas emissions, fossil energy consumption and farm economics insuckler beef production in 59 French farms. Agriculture, Ecosystems and Envir-onment 188, 180–191.
Veysset P, Lherm M, Roulenc M, Troquier C and Bébin D 2015. Productivity andtechnical efficiency of suckler beef production systems: trends for the period1990 to 2012. Animal 9, 2050–2059.
Productivity gains in beef cattle farming
11