Renewable Energy in Africa Status and Prospects AFREPREN/FWD.

RE-thinkingAccess
to Energy Business Models
Ways to Walk the Water-Energy-Food Nexus Talk
in Sub-Saharan Africa
RE-
thin
kin
g A
cces
s to
En
erg
y B
usi
nes
s M
od
els
Foundation
This study aims at exploring business models and innovative approaches, as well as understanding technical, social, regulatory and financial barriers, to foster the growth of decentralized renewable energy solutions in Africa. In this way, RES4Africa Foundation aims to contribute to the achievement of access to energy for all and ultimately, through inclusive growth and sustainable development, to the creation of a prosperous Africa.
Renewable Energy Solutions for Africa (RES4Africa) Foundation promotes the deployment of large scale and decentralized renewable energy in African markets to meet local energy needs for growth. RES4Africa gathers a member network from across the clean energy value chain and supports the creation of an enabling environment for renewable energy investments and strategic partnerships.
www.gangemieditore.it
3804-4 Res4Africa - BM Study 2019 COVER d10.indd 1 03/12/19 09:16

©Literary property reserved
Gangemi Editore spaVia Giulia 142, Romawww.gangemied i tore . i t
No part of this publication can be memorised, photocopied or in any way reproduced without specific authorisation.Our publications, both as books and ebooks, are available in Italy and abroad.
ISBN 978-88-492-3804-4

RE-thinkingAccess to Energy Business Models
Ways to Walk the Water-Energy-Food Nexus Talk
in Sub-Saharan Africa

Production: RES4Africa Foundation, Rome, ItalyProject management team: Marco Aresti, Luca Traini (RES4Africa Foundation)Lead coordinator: Luca Traini (RES4Africa Foundation)Overall editor: EnGreen
Authors: Marco Aresti (RES4Africa Foundation), Amy Barclay (ERM), Paolo Cherubini (University of Pisa), Olivier Dubois (FAO), Florent Eveillé (FAO), Davide Fioriti (University of Pisa), Valeria Gambino (University of Florence), Christian Gertig (RINA Consulting), Andrés González García (Massachusetts Institute of Technology and Instituto de Investigación Tecnológica Universidad P. Comillas Universal Energy Access Lab), Andrea Micangeli (Sapienza University of Rome), John Shehata (PwC TLS), Susan Stritzke (University of Oxford), Carlo Tacconelli (Sapienza University of Rome), Luca Traini (RES4Africa Foundation), Philipp Trotter (University of Oxford), Stephan van den Berg (ERM), Timothy Volk (State University of New York). Contributors: Esther Addei (PwC), Frank Andoh (PwC), Francesco Belfiore (ERM), Hawa Bonaya (PwC), Stefania Bracco (FAO), Dario D’Angelo (RES4Africa Foundation), Stefania Gaudrault Valente (RES4Africa Foundation), Japheth Omari (Strathmore University), Paolo Ghezzo (RINA Consulting), Benedetta Giugliano (PwC), David Lecoque (ARE), Moonga Hamukale (PwC), Fulvio Mariani (RINA Consulting), Mumbi Ng’andwe (PwC), Isaac Otolo (PwC), Matthew Sisul (Columbia University in the City of New York), Marcus Wiemann (ARE).
Data providers for case studies: ACRA Foundation, CEFA Onlus, DCGO, REDAVIA, Trama TecnoAmbiental.
Thanks to: GhamPower for Box 2, Devergy for Box 3 and OpenEconomics for Box 5.
Photos: Saverio Frullani, Chiara Buzzico, Riccardo Del Citto, Valeria Gambino.
Disclaimer: The views expressed are solely those of the authors. The publication is available for download on www.res4africa.org/library.
For further information: [email protected]© December 2019, RES4Africa Foundation
Contact: Via Ticino, 14 – 00198 Rome T +39 06 8552236 F+39 06 85832954 www.res4africa.org
FAO contributed also in sharing its methodology for analysis of business models and providing technical advisory.
This report was made possible thanks to the support of Enel Foundation.
This report was ideated and produced in collaboration with RES4Africa members.

5
About RES4Africa Foundation
Who we areRES4Africa Foundation promotes the deployment of large-scale and decentralized renewable energy solutions in African countries to meet local energy needs. Since its inception in 2012, the foundation gathers the perspectives and expertise of a member network from across the sustainable energy value chain.
Our workRES4Africa Foundation functions as a platform for members and partners of emerging markets to foster dialogue and partnerships, share knowledge and build capacity to advance sustainable energy investments in African countries.
Our missionRES4Africa Foundation aims to create an enabling environment for renewable energy investments in emerging markets through three work streams:
■ Promoting policy dialogue and delivering advisory services to countries on what it takes to enable RE investments;
■ Spearheading strategic initiatives to catalyze innovative market solutions; ■ Building capacity to empower communities, create businesses, and transform institutions.
MembersRES4Africa Foundation gathers a network of members from across the sustainable energy value chain including industries, agencies, utilities, manufacturers, financing institutions, consultancies, legal and technical services providers, research institutes, and academia.
PartnersRES4Africa Foundation works with local, regional and international partners, agencies and organizations to pursue its mission and promote renewable energy deployment in the region of focus.

6
Partners
Enel Foundation Enel Foundation is a non-profit organization focusing on the crucial role of clean energy to ensure a sustainable future for all. By developing partnerships with pre-eminent experts and institutions, leveraging on the vast knowledge of its Founders, Enel Foundation conducts research to explore the implications of global challenges in the energy domain and offers education programs to the benefit of talents in the scientific, business and institutional realms.Enel Foundation develops and shares knowledge on four main areas that are shaping the global evolution of the energy sector. These include the way in which technology is creating new possibilities for electricity generation, storage, distri-bution, management and usage, and consequently how policy and regulation dimensions need to adjust and adapt to such technological innovation. The Foundation also explores how human and natural capital are accelerating or shaping the energy transition process, especially in areas of the world mostly exposed to the challenges of climate change, and the ways in which different geographies cope with the global megatrends and achieve their transition towards a world powered by affordable, reliable, sustainable and modern electricity, smartly distributed to all.
PwC TLSPwC TLS Avvocati e Commercialisti is a member firm of PwC Network, with offices in 158 countries.PwC TLS is one of the largest Italian law firms in terms of turnover and it is the fastest growing legal practice in Italy. PwC TLS creates value for its clients thanks to a multidisciplinary approach and digital mindset that allow the firm to provide integrated solutions.PwC has an outstanding team of lawyers and tax advisers focused on dealing with emerging markets, with a deep experience in the infrastructures sector, and that can provide the most up to date assistance to clients that are dealing with rapidly evolving international markets challenges.
ERMERM is a leading global provider of environmental, health, safety, risk, social consulting services and sustainability related services. We work with the world’s leading organizations, delivering innovative solutions and helping them to under-stand and manage their sustainability challenges. To do this, we have more than 5,500 people in over 40 countries and territories working out of more than 160 offices. ERM has been involved in projects in every country in Africa for over 40 years, and in 2003 established a permanent presence in Africa to meet the growing needs of our clients. We pride ourselves being the largest, totally focused, sustain-ability consulting firm on the continent with over 150 dedicated staff involved in environmental and social projects across Africa. ERM has offices in Kenya, Mozambique, South Africa and Senegal, and we offer consistent, effective, cost-conscious solutions of the highest quality using experienced local and global expertise to create value for our clients.

7
RINARINA is a global corporation that provides engineering and consultancy services, as well as testing, inspection and certification. RINA is the result of the integration of a number of internationally respected companies including D’Appo-lonia, Centro Sviluppo Materiali, Edif ERA (ERA Technology), G.E.T., Logmarin Advisors, OST Energy, Polaris, SC Sembenelli Consulting and Seatech, RINA brings together a rich heritage of engineering consultancy expertise into one unique organisation.Working alongside Clients, as a trusted technical partner, RINA provides a wide range of traditional and innovative ser-vices to critical industry sectors, including Renewables, Power, Oil & Gas, Space & Defence, Transport & Infrastructure sectors. RINA’s 3,700 talented professionals give it the depth of experience across engineering disciplines to support Clients at each phase of their project – from initial concepts and design, through to operation, maintenance and decom-missioning.RINA is committed to providing services that are of the highest quality for our Clients, creating added value for their business through our technical advice and support - managing risk, operating safely, in a sustainable way and optimising performance.
Sapienza University - Department of Mechanical and Aerospace EngineeringUniversity of Rome “Sapienza” was founded in year 1303. It is public and it is dedicated to teachings, researches and technology transfer activities. The main campus in Rome enrols approximately 120,000 undergraduate and graduate students. Sapienza’s Engineering program has a tradition of collaboration with international partners. Engineering grad-uates are trained in innovative design and models. In the Department of Mechanical and Aerospace Engineering – DIMA – research activities are focused on theoretical and applied mechanics, aerospace, management, energy and power systems. A solid knowledge and an attitude for a complex methodological approach is the base of the collaborations with international universities and research centres. One example is the Grand Challenges Scholars Program and Study Abroad dedicated to technology transfer towards rural communities. Students and researchers are involved in proactive initiatives through field activities in rural areas like impact evaluation, data collection, projects writing, stakeholders’ engagement.

Index
Acknowledgements 4
About RES4Africa Foundation 5
Partners 6
Executive summary 11
Introduction 15
1. Sub-Saharan Africa’s off-grid market 191.1. Market size 19
1.1.1. Access to electricity: current status and forecast 191.1.2. Demographic and electrification trends 211.1.3. Beyond the potential market: a comprehensive framework to enable project deployment 22
1.2. RE solutions for universal access to electricity 251.2.1. Grid extension 271.2.2. Mini-grids 271.2.3. Individual systems 281.2.4. Combining delivery modes 28
1.3. Access to electricity for socio-economic development 301.3.1. Electricity access tiers 311.3.2. Impact on economic development 331.3.3. Impact on wellbeing and quality of life 341.3.4. Water-energy-food nexus 351.3.5. Joining off-grid solutions, productive use of energy and water-energy-food nexus 36
2. Analysis of business models for decentralised RE solutions 39BOX 1. Methodology of case study analysis 402.1. Business model classifications 41
2.1.1. Classification based on services provided 412.1.2. Classification based on operating methods 432.1.3. Classification based on ownership 45
2.2. Value propositions for target market and access to finance 462.3. Financial analysis results 49
3. Integrated strategies to foster deployment of rural electrification projects 553.1. Productive use of electricity and water-energy-food nexus: links and opportunities 55BOX 2. Integrated business models based on WEF nexus-related services: a successful story from the Asian mini-grid sector 583.2. Customer management and payment systems 603.3. Complementary activities: investing in local communities to enhance project bankability and sustainability 61

3.4. Social Return on Investment: monetizing socio-economic and environmental benefits 63BOX 3. Small-size micro-grids for low-income rural people: a successful low-risk approach from the Tanzanian energy sector 65
4. Technical analysis of RE mini-grids and productive use of electricity 694.1. Technical requirements 70
4.1.1. Generation systems 714.1.2. Distribution systems 724.1.3. End-user systems 73
BOX 4. Demand management strategy 744.2. RE mini-grid systems for productive use of electricity 75
4.2.1. Integrated water, agricultural and farming services 754.2.2. Integrated refrigeration and ice supply services 764.2.3. Integrated end-user appliance sale 77
5. Sustainability analysis 815.1. Sustainable Development Goals and shared value 815.2. Environmental impacts 835.3. Social impacts and population resilience 835.4. Environmental and social impact assessment: a strength for project bankability 85BOX 5. WEF nexus integrated business model: impact assessment of a successful case study from Tanzania 87
6. Policies and Regulations for decentralised RE solutions 916.1. Key challenges for the regulatory framework to enable up-to-scale development of the decentralized RE sector 916.2. Five country-cases in off-grid and RE sector 93
7. Financing the deployment of off-grid solutions 1077.1. Type of finance available for the mini-grid sector 1077.2. Mitigation of financial risks for mini-grid developers 1097.3. Type of finance available for energy end-users 114
8. RE-thinking Access to Energy Business Models 1198.1. Business Model 1: Electricity supply & appliances provision 1208.2. Business Model 2: Electricity supply & agri-food production 1228.3. Business Model 3: Electricity supply & water-related services 1248.4. Business Model 4: WEF multi-service supply 126
9. Highlights and recommendations 129
References 137Abbreviations 142

A child stands on a hill during a survey of non-electrified villages – Wolayita, Ethiopia

11
Executive summary
Looking at 2030, universal access to electricity will remain an African issue. Considering the policies and implementing measures adopted as of mid-2018 along with relevant policy proposals announced, the IEA estimates that the world will count 650 million people with no electricity in 2030, 90% of which in Sub-Saharan Africa, and mostly living in rural areas. Promoting private sector’s investments is now recognized as fundamental to accelerate access to electricity. This urges governments to strike a balance between ensuring affordable and equitable access to energy to rural people, and fa-vouring a low risk environment to developers and investors. The main issue lies in the fact that rural electrification is more expensive than the electrification of high-density and well-connected urban areas, and this applies to grid extension, micro-grid electrification and isolated systems. Therefore, to reach rural areas and provide access to affordable, reliable, sustainable and modern electricity to low income people, it is necessary to fill the gap between possible revenues from off-takers and the costs of rural electrification.
A mix of grid extension and off-grid solutions should be properly combined in the country’s electrification masterplan to pursue universal access to electricity. Despite the business of individual systems, the viability of which has already been proven in several developing countries, the mini-grid sector still requires to demonstrate solid business models. In this sense, opportunities arise when looking beyond the sole electricity supply: additional services, complementary value chains, innovative partnerships and horizontal integration can bridge the gap between viable and non-viable projects. This study analyses access to energy business models with a focus on the productive use of electricity, excluding captive projects with a unique industrial off-taker since their financial feasibility is already demonstrated and they represent a notable potential market in developing countries, even though still relatively untapped.
An analysis of the technical, regulatory and financial challenges and opportunities was carried out to clearly identify the most viable and scalable business models for mini-grid projects. The results confirm that a broader perspective including different actors and sectors in an integrated manner is able to pursue business for impact.
The more than 20 rural electrification projects in Sub-Saharan Africa analysed in this study give a picture of a growing and innovative sector with heterogeneous experiences. Process for identification of the most promising business models has gone through the analysis of these case studies, which have been classified on the basis of three criteria: (i) services provided, (ii) operating methods and (iii) ownership.
The classification based on the provided services shows that 67% of case studies provide sole electricity, 14% electricity and other energy-related products/services, while 19% provide electricity and other WEF nexus-related services. All the projects included in the latter two classes are ranked among the top-10 most financially sustainable projects. The only one exception is emblematic to RE-think viable business models, as it’s characterized by (i) unfavourable regulatory

RE-thinking Access to Energy Business Models
12
framework, (ii) not-for-profit WEF related activity and (iii) large diesel component in the power mix on one hand, whereas it is successful by looking at the project’s results on the other hand.
The top-10 also reveal a clear correlation between project’s financials, operating methods and ownership: firstly, all of them apply a build-own-operate or a build-short operate-transfer model (typical of no-profit organizations), and sec-ondly all the private actors applying a build-own-operate model are ranked in the top-10. The classification based on the ownership highlights that publicly owned projects show low level of performance: all public cases analysed operate in steady loss, meaning that the revenue streams are not able to cover the OPEX. The situation is similar for the other two cases with a hybrid public-private ownership. Moreover, projects unable to cover running expenses are almost fully funded, either from grants or public funds. Another common factor of all the projects operating in steady loss is that they are mini-grids with a prevalent diesel generation component, that have confirmed to be unsustainable with a uniform national tariff plan.
Investing in energy and in other complementary sectors, such as food and water, allows developers to add and diversify revenue streams, strengthen customers’ ability to pay and increase energy demand, as well as enable the improvement of the socio-economic environment. Agri-food processing, cooling services and ice production, for instance, can represent new revenue streams and pro-duce a positive impact on local economy, in addition to the electricity supply for domestic and business use, so to strengthen resilience to market price fluctuation (e.g. crop), increase communities’ income and reduce agricultural waste. Furthermore, the provision of electrical appliances (selling, renting or leasing), especially in the first operational phase of micro-grid projects, can boost energy demand and promote energy efficiency, providing valuable services to customers as well as ensuring the use of equipment compatible with the installed energy systems.
An approach that integrates clean water supply, irrigation, and agro and fish-processing activities, can capture different types of value: needs-based irrigation increases food producers’ resilience against droughts and breaks the cycle of sea-sonal income, just as ice production allows for a more efficient value chain for fish production. Such processing services can lead to a more stable income generation and diversification of economic activity. The availability of clean water improves the quality of life and health conditions in a community. Finally, these water and food related energy demands help to drive the economic sustainability of off-grid projects by supporting energy consumption. However, this approach comes at a cost. Developers and investors should assess both corporate and market benefits, but also risks: developing integrated projects usually (i) increases capital expenditure, (ii) requires knowledge of other business sectors, and (iii) could lead to conflict with local communities. Partnerships between private companies and local organizations are suggested to mitigate those risks.
Even if this study analysed projects operating for years by applying such approach (the oldest mini-grid has been op-erating since 1986), this is yet to be tested at scale as most off-grid systems don’t provide integrated services yet. The present study highlights four business models as a way to suggest possible integrated approaches, exploring private-led, public-private, private-community as well as private-private models. Each model presents a different integration of pro-ductive uses of energy and energy-related services: provision of electrical appliances, agro-business activities, water and irrigation supply, cooling services, storage solutions and complementary activities such as micro-credit and technical assistance.

13
On one side, in order to be effective and viable, integrated approaches need to be tailored to community’s needs and focus on local market strengths and opportunities for growth. On the other side, they can be managed to shape the best business model for a given developer, in a given country, with a given investment ticket or capability of fundraising.
So far, energy investments in mini-grids with a full equity structure are not viable, and governments struggle to support them because of public energy companies’ poor balance sheets and political priorities, which are often linked. Rural electrification alone will not be able to support local development and create its own energy demand. However, if rural electrification is integrated with investments along the food value chain and other productive uses of energy, it can bring substantial development results and thus attract the attention of governments, international development agencies and investors, who pay attention to impact objectives and indicators.
In recent years, the majority of funding programmes led by international cooperation agencies, development banks, foundations and public institutions have recognized energy and its productive uses as key drivers for local development. In this perspective, the more a developer is able to prove the effectiveness of its strategy to ensure both the business sustainability and achieve a notable impact on the ground, the more it increases its competitiveness in accessing finance.Building energy projects and services around productive uses of energy, and leveraging on positive spill-overs of the WEF nexus approach, can support developers in attracting blended finance. On the other side, in order to stimulate access to electricity and PUE, governments and donors should establish credit schemes and concessional loans, as well as test innovative finance instruments such as results-based financing and targeted subsidies.
Governments, private sector actors, international financing institutions and development agencies are called to col-laborate to: (i) ensure clear and effective policies and regulations, (ii) provide access to the right finance, and (iii) prove business models. The in-depth analysis of these three dimensions reveals that the current vision is partial, or at least too sectorial. Accelerating rural electrification also depends on the capacity to support local socio-economic development, and it requires energy and non-energy players to go beyond their comfort zone, working and investing together.

Laboratory on Programmable Logic Controller for electric plant held at St.Kizito VTI – Nairobi, Kenya

15
Introduction
Rethinking access to clean, reliable and affordable electricity is key to win the energy poverty fight in Sub-Saharan Africa, where one person out of two lives in the darkness, and enable economic and sustainable development. While access to electricity is not enough to achieve economic growth, the high potential of the Sub-Saharan region, both in terms of resources and market potentials, is not enough to attract investments at the level required to achieve the Sustainable Development Goal 7 by 2030. In fact, to meet the objectives set out with the SDGs, more than a five-fold cumulative investment will be needed compared to the scenario which considers the policies and implementing measures adopted and announced as of mid-2018. Decentralised renewable energy solutions are key in achieving this goal and particularly in reaching rural areas, where the majority of people with no access to electricity – who very often, lack access to safe water and have issue of food security too – is living.
Universal access to electricity will not be achieved, neither at the needed scale or speed, if we won’t be able to attract private sector investments. Bridging this financing gap and accelerating the deployment of decentralized renewable energy (RE) solutions will mainly need to (i) prove viable business models and (ii) ensure an enabling environment for private investment.The perceived high-risk environment in Sub-Saharan energy markets is a main barrier that hampers the growth of decentralized RE industry due to a lack of attractive, competitive and adequate policy and regulatory frameworks. Additionally, private developers face the major challenge of having to reach the bottom of the pyramid, characterized by low income – often below the poverty line – and low energy consumption, limited ability to pay for energy services, and mostly vulnerable to environment, social and economic threats.
Reliable and affordable electricity directly influences the productive capacity and the resilience to extreme events of rural populations; it can power small and medium-scale rural enterprises, increasing their contribution to job creation and income generation as well as improving living conditions in rural areas. Electricity consumption and economic growth go hand-in-hand since the beginning of the last century, and today it’s more important than ever to recognize this relationship. In the chicken and egg game between the two dimensions, which often hide the poverty cycle (people with scarce economic resources cannot afford electricity, and without electricity businesses cannot flourish), an integrated water-energy-food (WEF) nexus approach can innovate business models and serve both objectives: accelerate rural electrification and promote inclusive economic growth.

RE-thinking Access to Energy Business Models
16
Actors from different sectors such as water, energy and food have usually different objectives, business models, sources of financing and often work in silos. On the contrary, their chances to succeed are interlinked. Integrating the WEF approach would require both private and public sector stakeholders to break the silo-thinking and to focus on people’ and businesses’ needs. This would allow to identify new market segments and to innovate business models reaching unserved customers and unaddressed needs through more viable projects. Rethinking access to energy is crucial to define how decentralized RES could be integrated with local socio-economic development, as well as embedded in regulatory frameworks and electrification master plans, so to power industrialization processes which should have the ambition to be as rapid and inclusive as the population and urbanization growth of the continent.
We believe that promoting integrated business models and joining innovative partnerships between water, energy and food actors will be the power of Africa’s economic revolution.
RES4Africa Foundation, through this study, aims at exploring business models and innovative approaches to foster deployment of decentralized renewable energy solutions, with a focus on mini-grids, contributing to ensure access to energy for all and, ultimately, to a prosperous Africa, based on inclusive growth and sustainable development.

17


19
1. Sub-Saharan Africa’s off-grid market1.1. Market size
1.1.1. Access to electricity: current status and forecast
It is estimated that 1.2 billion people gained access to electric-ity between 1990-20161, and that the global share of popula-tion with access to electricity increased from 71.4% to 87.4%2.
The progress has been substantial and has accelerated in the last years: whereas 62 million people gained access each year from 2000 to 2012, this amount has raised to 100 million people per year since 20123. In 2018, the number of people without access to electricity worldwide fell below 1 billion for the first time in modern history4.
Figure 1 – Share of population with access to electricity in 2016 (%). Source: World Bank 5.
Figure 2 – Annual increase in electricity access rate in 2010-2016 in access deficit countries. Source: World Bank 6.

RE-thinking Access to Energy Business Models
20
Despite all these encouraging achievements, the world is still off-track to comply with the tar-gets of Sustainable Development Goal (SDG) 7 (ensure access to affordable, reliable, sustainable and
modern energy for all by 2030). Taking as reference the most recent issue of the World Energy Outlook7, International Energy Agency (IEA) draws two scenarios to assess the future of access to electricity:
i) the New Policies Scenario, which considers the policies and implementing measures adopted as of mid-2018 along with relevant policy proposals announced;
ii) the Sustainable Development Scenario, which considers the steps to be undertaken to comply with the objectives set out with the SDGs, particularly SDG 7.
In the first scenario, which considers an average annual elec-tricity access investment of USD 30 billion, there would still be 650 million people without access in 2030 and 720 million in 2040, due to population growth outpacing the rate of access: an outcome that would clearly be very far from the universal access goal. For the second scenario, the IEA estimates that about USD 55 billion need to be invested every year between 2018 and 2030. Thus, compared to the New Policies Scenario, the Sustainable Development Scenario implies an additional investment of 82% in Sub-Saharan Africa alone.
Figure 3 - Progress since 2000 and outlook to 2030 for electricity access in the New Policies Scenario. Source: IEA 8.
In fact, most of recent progress in electricity access has been made in developing Asia, with China reaching universal ener-gy access in 2015 and India announcing the complete elec-trification of the country through the Saubhagya scheme9. Sub-Saharan Africa is still lagging behind, with more than 600 million people still lacking access to electricity. Even though over 200 million people have gained access since 2000, this increase was lower than the overall population growth10. As a result, Sub-Saharan Africa’s share in the global access deficit has more than doubled between 1990 and 201611.
Furthermore, the IEA highlights how progress in the region has been uneven: 60% of new accesses since 2011 have been concentrated in Kenya, Ethiopia, Tanzania and Nigeria only.Therefore, by looking at the IEA’s forecasts (Figure 3), it is evident that with the current and announced policies, Sub-Saharan Africa will be the region mostly affected by lack of electricity access. In fact, out of the 650 million people still lacking access to electricity worldwide in 2030, most of them will live in rural settlements in Sub-Saharan Africa, which will have reached only a 61% electrification rate.
In 2030, 650 million people will still be without access to electricity

Sub-Saharan Africa’s off-grid market
21
1.1.2. Demographic and electrification trends
As anticipated in the previous section, the forecast of elec-tricity access in Sub-Saharan Africa largely depends, among other factors, on the population growth. Therefore, to get an insight of the future electrification needs and potential markets, demographic and migratory trends should be con-sidered. Following United Nations’ projections, Africa’s popu-lation in 2050 will be more than double than today, reaching 2.5 billion people starting from today’s 1.2 billion12. To assess future needs, this figure should be evaluated considering two phenomena: (i) the urbanization rate, that is expected to rise from 40% in 2015 to 56% by 2050, (ii) future migration trends and their drivers, such as conflicts, political instability, environmental factors, employment opportunities and more.
International migration is a growing phenomenon, but it is mostly an intra-African rather than extra-continental one: in 2017, around 19.4 million people resettled by moving within African states13. There is also an ongoing trend of rural to urban migration within single countries, which is another challenge to face in order to guarantee access to energy for all. In the next decades, Africa will experience a very fast urbanization, and it is estimated that in 2030 there will be 17 cities with more than 5 million people and 5 cities with more than 10 million people, whereas in 2015 there were 6 and 3 respec-tively14 (Figure 4). This shift will pose new challenges to urban electricity infrastructures: for instance, the IEA cites the case of South Africa, which saw its electrification rate decline since 2014, mostly because the electricity supply has not been upgraded in urban areas in response to population growth15.
Figure 4 – African cities by population in 2015 and 2030. Source: McKinsey&Company, quoted by RES4Africa Foundation 16.
5 - 10 MILLION PEOPLE > 10 MILLION PEOPLE
CAIRO
KHARTOUM
KINSHASA
LUANDA
LAGOS
GREATERJOHANNESBURG
KANO
IBADAN
DAKAR
BAMAKO
OUAGADOUGOU
ABIDJANNAIROBI
ANTANANARIVO
ALEXANDRIACAIRO
KHARTOUM
KINSHASA
LUANDA
LAGOS
GREATERJOHANNESBURGNUMBER
Cities in 2015
Cities in 2030
OF CITIES:
> 1 million> 5 million> 10 million
5463
NUMBER OF CITIES:
> 1 million> 5 million> 10 million
89175
Infograf 1.2 rev.GE.pdf 1 21/11/19 10:35
However, the need for electrification remains mostly a rural issue. Despite the fact that rural electrification is rising more rapidly than urban electrification due to lower population growth17, in Sub-Saharan Africa over 80% of the people without electricity live in rural areas with an electrification rate for urban households estimated at 71%. This number is way ahead of the 25% rate reported for rural ones18.The IEA estimates that, with the current and announced policies, 80% of the world’s population without access to electricity in 2030 will live in rural Sub-Saharan Africa19,
confirming that achieving SDG 7 will depend on finding sustainable business models for the deployment of decen-tralised solutions and supply electricity to the more remote segments of the population.A picture of the current status and needs is presented in Figure 5, which highlights the 20 African countries with the highest number of people lacking access. The millions of people without access to electricity in each country are shown with the corresponding percentage of urban and rural population lacking access.

RE-thinking Access to Energy Business Models
22
Figure 5 - Millions of people without access to electricity, with respect to urban and rural population lack of access. Bubbles represent the twenty countries with the highest amount of population without access. Source: IEA 20.
Nigeria, 77
Democratic Republic of the Congo, 69
Ethiopia, 58
Tanzania, 39 Uganda, 34
Sudan, 22
Mozambique, 21
Madagascar, 20Angola, 19
Niger, 19Malawi, 17
Burkina Faso, 16 Chad, 14
Kenya, 13
South Sudan, 12
Somalia, 12Zambia, 12
Mali, 11
Zimbabwe, 11
Guinea, 11
0,0%
20,0%
40,0%
60,0%
80,0%
100,0%
120,0%
0,0% 10,0% 20,0% 30,0% 40,0% 50,0% 60,0% 70,0% 80,0% 90,0% 100,0%
% o
f rur
al p
opul
atio
n w
ith n
o ac
cess
% of urban population with no access
Although data on people living in urban and rural areas with-out access to electricity provide an initial estimation of the volume of intervention needed in each country, they do not provide a clear indication of the market size for decentralised renewable energy (RE) solutions. In fact, there are many other factors influencing the optimality (in general intended as the least-cost solutions) of the three main ways to achieve access (grid extension, mini-grids, individual systems). They will be analysed in section 1.2.
1.1.3. Beyond the potential market: a comprehensive framework to enable project deployment
The definition of a potential market in energy access-deficit countries goes beyond the assessment of current status and unmet population needs. Actual market opportunities for investments should be investigated through comprehensive country assessments taking into consideration factors which could hinder the development of domestic and foreign invest-ments, such as political instability, gross domestic product and
currency fluctuations, corruption, lack of clear policy and regu-latory frameworks21. Main pillars and filters to analyse and select countries of intervention are reported in the Figure 6 below.
Figure 6 – Main pillars for comprehensive country assessments in Sub-Saharan Africa.
Natural resources potential
Macroeconomic conditions
Political stability and implementation
capacity
Access to incentives
and �nancing
Policies and regulations
Market size and
opportunities
Sub-Saharan Africa’s off-grid market
23
All pillars are strictly interconnected and relevant, however, most stake-holders agree that in order to accel-erate investments in rural electrifica-tion and decentralised solutions, it will be necessary to: (i) ensure clear and effective policy and regulation,
(ii) provide access to the right finance, and (iii) prove the busi-ness model, ensuring bankability and economic sustainability. This study aims at analysing them in detail in the following chapters, whereas a broader overview is addressed hereafter.
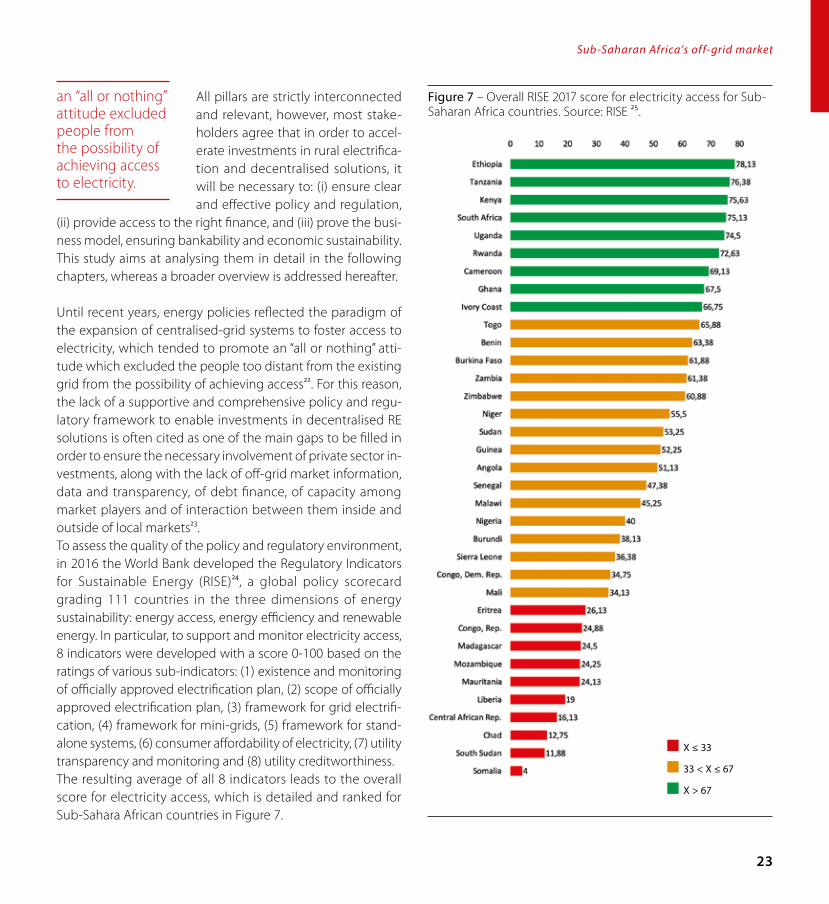
Until recent years, energy policies reflected the paradigm of the expansion of centralised-grid systems to foster access to electricity, which tended to promote an “all or nothing” atti-tude which excluded the people too distant from the existing grid from the possibility of achieving access22. For this reason, the lack of a supportive and comprehensive policy and regu-latory framework to enable investments in decentralised RE solutions is often cited as one of the main gaps to be filled in order to ensure the necessary involvement of private sector in-vestments, along with the lack of off-grid market information, data and transparency, of debt finance, of capacity among market players and of interaction between them inside and outside of local markets23.To assess the quality of the policy and regulatory environment, in 2016 the World Bank developed the Regulatory Indicators for Sustainable Energy (RISE)24, a global policy scorecard grading 111 countries in the three dimensions of energy sustainability: energy access, energy efficiency and renewable energy. In particular, to support and monitor electricity access, 8 indicators were developed with a score 0-100 based on the ratings of various sub-indicators: (1) existence and monitoring of officially approved electrification plan, (2) scope of officially approved electrification plan, (3) framework for grid electrifi-cation, (4) framework for mini-grids, (5) framework for stand-alone systems, (6) consumer affordability of electricity, (7) utility transparency and monitoring and (8) utility creditworthiness.The resulting average of all 8 indicators leads to the overall score for electricity access, which is detailed and ranked for Sub-Sahara African countries in Figure 7.
Figure 7 – Overall RISE 2017 score for electricity access for Sub-Saharan Africa countries. Source: RISE 25.
an “all or nothing” attitude excluded people from the possibility of achieving access to electricity.
X ≤ 33
33 < X ≤ 67
X > 67

RE-thinking Access to Energy Business Models
24
A further main barrier to the extensive rollout of off-grid projects is access to financing, due to the high investment risk and low bankability of projects,
especially the ones targeting the bottom of the pyramid segment. Despite this, in recent years rural electrification has been transitioning from a foreign aid area of interven-tion to a real market opportunity that is being scouted and looked with interest by investors26.
Mini-grids, although considered one of the key solutions for universal energy access (see section 1.2), are lagging in their development, especially if compared to off-grid solar devices. However, mini-grids has recently witnessed signif-icant attention from governments and financiers27. Accord-ing to data compiled by Bloomberg New Energy Finance (BNEF)28, financing for startups selling energy to off-grid areas recorded a huge hike in 2015, raising USD 180 million including both off-grid solar devices and rural mini-grids, but the latter have been raising relevant amounts only from 2016 (USD 88 million, accounting for 30% of the total), con-firmed in 2017 and 2018. This shows that financers consider mini-grids as emerging business opportunity.
Figure 8, instead, shows the estimated sales for off-grid solar devices from 2010, divided into different segments of devices: pico systems, plug and play solar home systems (PnP SHS) and component-based systems, hereafter named Off-Grid Solar (OGS) solutions to be consistent with data source29. This figure describes trends for each segment that are common across most geographic areas. As shown, initial explosive growth (+170% in 2010-12 and +97% in 2012-14) has slowed since 2014 (+9% in 2014-16) and is now expect-ed to contract for the first time in 2017 based on data from the first half of the year. This contraction is reflective of the growing base of existing OGS customers as well as segment and geography specific trends, such as exogenous shocks in the key markets of India, Kenya, Tanzania and Nigeria that inhibited customers’ purchasing power.
Figure 8 – Annual sales of Off-Grid Solar (OGS) devices. Source: IFC30.
2010 2011 2013 20152012 2014 2016 2017 (est.)
0.9
2.6
+170%
+97%
+9%
6.5
17.6
25.2
26.7
30.1
25.8
12.9
1.1
2.6
2.32.2
0.1
0.3
0.70.8
0.3
0.4
0.30.1
0.2
0.4
0.20.1
7.9
18.6
16.415.6
3.3
7.76.86.4
2017 H2, est.Open-market component-based systems, est.
fig.8.pdf 1 21/11/19 11:45
The specific trends in South Asia, which was predominantly driven by the Indian market, and Sub-Saharan Africa reveal that Pico sales (< 11kWp) fell in 2016-17 whereas PnP SHS sales (>11kWp) show an increase in the customers’ energy needs (Figure 9). These data should be read together with crosscutting factors on enabling environment, potential market as a whole, distribution ecosystem and the maturity of the market.
Figure 9 - Regional sales trends, by product category. Source: IFC 31.
2016 H1
2.28
3.123.01
-12%
2.76
1.83
-36%
1.46
0.03
0.34 0.30
+13%
0.39
0.03
+110%
0.07
2016 H12016 H2
South Asia Sub-Saharan Africa
2016 H22017 H1 2017 H1
Pico PnP SHS
fig.9.pdf 1 21/11/19 11:47
financers consider mini-grids as an emerging business opportunity

Sub-Saharan Africa’s off-grid market
25
Following this perspective, the contraction of off-grid solar solutions reflects the strategies of main players and investors, who have raised cumulatively and worldwide 922 million USD between 2012 and 2017: 38,5% from Impact Investors; 25% from Development Finance Institutions (DFIs); 21% from com-mercial debt and equity; and 13% from corporate foundations and family offices, with a small component of crowdfunding32. Except for commercial banks and equity investors, the financ-ing entities, accounting for 79% of the total, pay particular attention to SDGs achievement and impact indicators at me-dium-long term. One could reasonably estimate that, after an initial strong focus on OGS solutions to rapidly reach the rural market and prove progresses on access to energy, ex-post impact evaluations have highlighted relevant challenges. Firstly, on how the productive use of energy cannot notably benefit of such OGS solutions and therefore play a crucial role in support of local development and, secondly, on the actual contribution to the SDG 7 on access to modern energy for all. In fact, customers served by OGS require device replacement every 2-4 years, and therefore remain part of the potential mar-ket. Additionally, customers gaining access to electricity for the first time usually desire more and therefore may be targeted for upgrades to systems that offer higher levels of service33. In conclusion, recent data show that access to finance for mini-grids is slowly achieving maturity but the transition from a grant-based structure to more commercial sources of funding needs to be supported by tailored policies and development finance. Governments, DFIs and International Development Agencies (IDAs) are called to collaborate with the private sector to ensure clear and transparent regulatory frameworks (e.g. electricity tariff regulation and smart subsidies), and to promote comprehensive financing instruments and tools to foster proj-ect viability and accelerate investments in the mini-grid sector.
1.2. RE solutions for universal access to electricity
It is estimated that about 57 million people in Sub-Saharan Africa have to be provided access to electricity every year in order to achieve universal access by 203034. This will require a combination of investments in national networks, both in terms of added generation capacity and transmission and
distribution (T&D) extension, and deployment of off-grid solutions either mini-grids or stand-alone systems. The best solutions for electrifica-tion are generally evaluated in terms of the least-cost solution that provides the
prescribed tier of supply, which can be pursued systematically in developing national plans, as discussed in section 1.2.4.
Thus, considering the three options, grid extension and stand-alone individual solutions have traditionally received greater attention, while mini-grid systems have been left behind (see section 1.1.3), even if they can offer a collective solution at a relatively lower cost and they tend to facilitate basic needs as well as productive use of electricity thereby promoting local economic development. This is probably be-cause the electricity supply business developed by means of mini-grid has to face a number of challenges including risky business environment due to unknown consumer charac-teristics and unfamiliar business activities, weak institutional arrangements arising from non-supportive regulatory and policy frameworks, limited access to low cost finance and in-adequacies in local skills and capacities. However, mini-grid is currently considered as a key solution for rural electrification.
For Sub-Saharan Africa, the IEA provided outlooks for invest-ments in the three main energy access pathways, consider-ing both the New Policies Scenario, based on current and announced policies, and Energy for All Scenario, a path of compliance with SDG 7, as reported in Figure 10.In the first scenario, the cumulative investment is estimated to be USD 84 billion over the 2017-30 period. 40% of cumulative investment is for decentralised systems (including mini-grid and off-grid solutions, such as individual systems, as classified by IEA in the figure) while mini-grids alone will account for around 15% (USD 12.6 bn). Even if less than a half of the invest-ments will be addressed to decentralised solutions, they will provide energy to two thirds of the people living in rural areas. However, it is important to stress how this scenario will result in 600 million people with no access to electricity in 2030, with
About 57 million people in Sub-Saharan Africa have to be provided access to electricity every year in order to achieve universal access by 2030

RE-thinking Access to Energy Business Models
26
80% of them living in rural areas.In the second scenario, more than a five-fold cumulative investment will be needed, compared to the first scenario, in order to achieve
universal access to electricity in Sub-Saharan Africa. More than half of those who gain access will do so through decentralised
systems. Mini-grids will attract half of the additional investment (USD 185), which will cover 44% of the additional 600 million people to be connected. Thus, projections show that the mini-grid contribution is partic-ularly relevant to reach universal access to electricity by 2030: it results to be the least-cost solution for 30% of total connections in the Energy for All Scenario.
Figure 10 – Type of new connections, generation technologies and overall investment needed in Sub-Saharan Africa for 2017-2030 in the New Policies Scenario and the Energy for All Scenario. Source: IEA 35.
Cumulative investment: 84 bn USDAn average of 6 bn USD per year
Cumulative investment: 454 bn USDAn average of 32 bn USD per year
Furthermore, if we look at the status of investments for 13 coun-tries in Sub-Saharan Africa in 2015-16 (Figure 11), we can see how the financing for electricity investments has been unevenly distributed among countries, too small in volume to meet SDG 7
and still reliant on grid connected fossil fuel plants. Investments in the off-grid sector are rising quickly but are mostly driven by solar stand-alone system companies in East Africa and Nigeria, thus confirming the urgency to fill the viability gap for mini-grids.
Figure 11 – Electricity sectors financed in Sub-Saharan Africa in 2015-16 (USD million). Source: SEforALL36. Legend: FF: Fossil Fuels, RE: Renewable Energy, OGS: Off-Grid Solutions, T&D: Transmission and Distribution
More than five-fold cumulative investment will be needed in Sub-Saharan Africa

Sub-Saharan Africa’s off-grid market
27
1.2.1. Grid extension
Extending the national grid is the often the most obvious and desirable solution to increase access. According to BNEF, con-necting new customers via grid extension costs between USD 266 and 2,100 per household37; however, the cost increases as distance from the existing infrastructure grows and as densi-ty of demand decreases. Potential customers in remote areas generally have a low-income status, a scarce ability to pay and a low annual energy consumption that seldom justify such costly extensions. Furthermore, the mere presence of the grid does not directly translate into energy access, as low take-up rates have been reported by the World Bank in vari-ous Sub-Saharan African states (Figure 12). Lastly, actual grid off-takers are often served by an unreliable service: a survey conducted by Afrobarometer across 36 countries found that only 4 out of 10 Africans enjoyed a reliable electricity supply from the grid38.
Figure 12 – Percentages of people living under the grid but not taking up. Source: World Bank 39.
Percent
0 10 20 30 40 50 60 70
South AfricaNigeria
Cabo VerdeGabon
CameroonCote d'Ivoire
GhanaSão Tomé and Príncipe
MaliSudan
SenegalZimbabwe
TogoBenin
BotswanaNamibia
SwazilandLesotho
MadagascarZambiaGuinea
MozambiqueBurkina Faso
KenyaTanzaniaBurundi
Sierra LeoneLiberia
NigerUgandaMalawi
Livingunder Grid but not Taking up
fig.12.pdf 1 21/11/19 12:19
1.2.2. Mini-grids
Mini-grids represent the optimal alternative to grid extension for rural communities that have an adequate size, are densely populated and have enough economic strength to justify such investment40. Historically, rural mini-grids were powered by diesel generators and relied entirely on fossil fuels. More than 2000 mini-grids are currently installed in Africa, but only 40% of them are solar projects41. Overall, IRENA estimates that between 50 and 250 GW of off-grid diesel capacity world-wide could be hybridized with renewables42. The retrofitting of existing mini-grids represents a market opportunity as it could bring environmental benefits and significant operating expense (OPEX) savings, and reducing the risks tied to oil price fluctuations. Furthermore, the deployment of mini-grids has benefitted from steadily decreasing costs of renewable gener-ation and energy storage, and this trend is expected to contin-ue. IRENA estimates that the unsubsidized costs for renewable mini-grids, that in 2015 ranged from 0.47 to 0.92 USD/kWh, will fall in 2035 to the 0.19-0.35 USD/kWh range43. The need for hy-bridization is not restricted to mini-grids for local communities: BNEF estimates that, globally, mobile network operations and cellular tower operators spend USD 3.8 billion for diesel fuel annually, and that they could get a 54% cheaper service by using hybridized off-grid towers44. This example highlights the potential of hybrid mini-grids in combining productive uses of energy with last-mile access to energy. GIZ, the German de-velopment agency, proposed an Anchor-Business-Community model45, by which, among the potential off-grid communities in a given area, a developer should identify a potential anchor customer to ensure a high volume of sales backed up by enough purchasing power, and then target businesses and rural households. Aggregating the demand of households and commercial customers, in addition to providing enough de-mand to ensure the financial viability of a project, can also help on the technical side by balancing loads that peak at different times. That would be the case, for example, of the integration of domestic rural electrification with the connection of small agribusinesses, which can greatly improve their yield through irrigation, their productivity through mechanization and their products’ added value through processing46.

RE-thinking Access to Energy Business Models
28
Since mini-grids can provide the same service quality of a reliable grid, this opportunity can be extended to all existing or intended productive use of
energy, such as drying, cooling, processing, washing, water purification and so on.
1.2.3. Individual systems
Regardless of the source, any system that produces electricity that is not connected to a grid and typically gives power to a single person or household47, falls under the category of “indi-vidual system”. However, this term generally refers to photovol-taic devices with a variety of power ratings, which start from Pico Solar systems (below 11 Wp)48, comprising single light systems such as solar lanterns that provide a level of supply below Tier 1, and simple multiple-light systems, providing also mobile charging. Plug-and-play solar home systems (PnP SHS) are packaged kits with photovoltaic panels for 11 Wp or more, which are equipped with 3-4 lights and other basic appliances, such as a fans, radios, TVs, and so on49. SHS can reach up to 100 Wp of photovoltaic panels and even more, making them capable of operating direct current (DC) appliances for pro-ductive use, such as refrigerators, solar water pumps or other processing tools in agriculture or other crafts50.In addition to devices and kits marketed by companies as plug-and-play solutions, there is a parallel segment of “com-ponent-based systems”, which are assembled by the users ac-quiring the various elements (photovoltaics panels, batteries, inverters, etc.) separately on the market.Individual systems such as Pico Solar, PnP SHS and compo-nent-based systems, have been estimated to have reached over 360 million people globally in 2017, but there is still a big potential market estimated in 434 million households51. Sub-Saharan Africa in particular, given the population growth in off-grid areas with disperse demand, is a big market for these devices, and has already several active players especially in the countries with a strong mobile money ecosystem due to the ever so common adoption of a pay-as-you-go (PAYG) business model. In addition, potential customers also include
the segments of population served by an unreliable grid, as well as existing customers in need for components replace-ment and service upgrade52.
1.2.4. Combining delivery modes
Looking at an individual community without access to energy, decision makers should analyse various factors when planning to deliver electricity with grid extension, mini-grid or individual systems. The population’s energy needs should be carefully investigated: assessing needs for domestic users, existing or potential business and anchor loads, as well as identifying tier of supply and size required, is essential to forecast the total magnitude of the demand to be served. Furthermore, distance from the existing grid is one of the main factors influencing the feasibility of grid extension, along with the density of the settlement. In fact, mini-grids are ideal for communities distant from the grid if households are clustered enough to limit the investment in the local distribution network, and individual systems are best suited to provide access to dispersed loads.Specialized software can support decision makers in devel-oping a systematic plan that harmonizes the three delivery modes in the optimal way. The Open Source Spatial Electrification Toolkit (OnSSET) mod-el has been elaborated by KTH Royal Institute of Technology (KTH) and other important partners. It estimates, analyses and visualizes the most cost-effective electrification option (grid, mini-grid and individual systems) for the achievement of electricity access goals, taking into account data as popu-lation density, proximity to transmission, night-time lights, RE potential and so on 53. A more in-depth analysis can be per-formed by using a desktop version of the tool using Python, which can provide higher level of input/output detail and customized electrification results54.With a similar purpose of geospatial electrification planning, the Universal Energy Access Lab, a project by Massachusetts Institute of Technology (MIT) and Instituto de Investigación Tecnológica Comillas (IIT Comillas), developed the Reference Electrification Model (REM), a software capable of performing an automated cost-optimal electrification design for a given region combining the three delivery modes, and has been
Individual systems have reached over 360 million people globally in 2017

Sub-Saharan Africa’s off-grid market
29
used to develop Rwanda’s national electricity master plan55. Its uniqueness lies in the capability of considering individu-al consumers, as each customer is automatically localized through satellite imagery and has a load profile assigned, as well as in grouping them into optimal electrification clusters
so that total system costs are minimized. Then, optimization techniques output the optimal generation mix and network layout for each mini-grid and grid extension, along with the clusters or single-users to be supplied with individual systems (named isolated in Figure 13).
Figure 13 – Example of REM outputs for a reference case study electrification solution. The MV existing power grid is represented with black lines. Source: Amatya, R et al. (2018) 56.
To get a sense of the impact of demand levels in determin-ing the outcome of optimal cost allocation of electricity delivery modes, an appropriate reference is the Electrifi-cation Pathways, another model developed by the World Bank, the Energy Sector Management Assistance Program (ESMAP) and KTH Division of Energy Systems Analysis57, available as a web-based open source application for developing universal access scenarios in Zambia, Nigeria and Tanzania.The model provides a more simplistic output, giving at a 1
by 1 km resolution the least-cost option among the three delivery models. The model uses as inputs geographic in-formation systems (GIS) data of population density, distance from existing and planned transmission infrastructure, proximity to road network, night-time light, as well as en-ergy resource availability. Taking as a reference the Dodoma region in Tanzania, Figure 14 shows how increasing the target level of access drastically changes the feasibility of grid extension and mini-grids in comparison with individual systems (named stand-alone - S.A. - in the figure).

RE-thinking Access to Energy Business Models
30
Figure 14 – Comparative results of universal access pathways with Tier 3 and Tier 4 service for the Dodoma Region of Tanzania, with a diesel price of 0.82 USD/l. Source: World Bank, KTH 58.
The usage of such tools can greatly help in the definition of national electrification plans as well as support developers in scoping market opportunities. However, the fact that the quality of the outputs is highly dependent on the accuracy of input data must be stressed. For instance, in the assessment of the current electrification network, their usage might be hindered by the fact that distribution companies in Sub-Saha-ran Africa hardly have structured and digitized information on their low-voltage distribution lines59.
1.3. Access to electricity for socio-economic development
The potential impact of electrification in Sub-Saharan Africa is substantial and multi-faceted. The United Nations has defined 17 SDGs and 169 associated specific targets to be achieved
worldwide by 2030. Recent research has shown that the overwhelming majority of these targets (143 out of 169) have synergies with SDG 760 (ensure access to affordable, reliable, sustainable and modern energy for all). As such synergies show, in terms of development, electrification impacts three main domains, namely (i) economic development, (ii) social wellbeing and quality of life, and (iii) environmental aspects, in-cluding natural resource use and the water-energy-food (WEF) nexus. However, as the following discussion of these three topics indicates, a positive and sustainable impact of electrifi-cation is not an automatic given but requires an adequate and encompassing developmental approach going forward. Before approaching the topic, it is important to have a clear picture of the different options in terms of levels of access to electricity provided (tiers), how they can be classified and thus

Sub-Saharan Africa’s off-grid market
31
easily identify indicators in the rural electrification projects that actually allow to achieve expected targets and impacts.
1.3.1. Electricity access tiers
The difficulty of measuring access to energy and refer to a uni-versal reference classification lies within the multi-dimension-al nature of access to energy. Access to electricity has typically been measured as having a household electrical connection, while access to modern cooking solutions has been mea-sured as cooking with clean nonsolid fuels61. However, in the last years, the idea of energy access as such binary parameter has been challenged to find a more comprehensive metric that uses a technology-neutral multi-tier framework62 and has
been supported by reference definitions on access to energy published by SDGs, IEA and World Bark among others.
A methodology of Multi-Tier Framework (MTF) was proposed by SE4ALL in 201363 in order to reflect the multi-dimensional na-ture of access to energy and quantitatively describe the level of electricity supply by assigning a score (tier) to a set of attributes that qualify the level of access provided (capacity, availability, reliability, quality, affordability, legality, health and safety). Figure 15 shows the matrix used to assign to household an overall tier of access by using the lowest score in any of the attributes, whereas Figure 16 shows the indicative electrical appliances, the related load level and the associated capacity tiers.
Figure 15 – Multi-tier Matrix for Measuring Access to Household Electricity Supply. Source: World Bank 64.

RE-thinking Access to Energy Business Models
32
Figure 16 – Load levels, indicative electric appliances, and associated Capacity tiers. Source: World Bank 65.
In other words, in the multi-tier approach to measuring access to energy, the combination of attributes reflects the performance of the energy supply and thus, the tier assigned or achieved directly reflects the project’s impact on target population development, including socio-economic and environmental dimensions.
The relevance of the matter beyond the technical discussion can be effectively given by reporting an interesting case study
which attests the impact of the MTF applied to a survey imple-mented in Ethiopia by the World Bank in the first months of 2017. World Bank indicator reports a 42.9% level of access for Ethiopia in 201666. The MTF survey67 provides a similar figure for the level of access, but gives a lot of extra information on the actual level of access reached, as showcased in Figure 17 and Figure 18: only 43% of people that fall in Tier 0 have no electric-ity access at all, but the rest of them have access to inadequate off-grid solution or even to a particularly unreliable grid.
Figure 17 – Aggregate data for tiers of access/lack of access in Ethiopia. Source: World Bank 68.

Sub-Saharan Africa’s off-grid market
33
Figure 18 – Disaggregate data divided per energy source. Source: World Bank 69.
MTF surveys provide data also on energy spending and use, willingness to pay for off and on-grid solutions, user prefer-ences and satisfaction with current access status. It’s clear how this information is useful to assess the need of people with access to move to higher tiers and which are the ade-quate tiers of supply for new users. The output of the MTF implementation in Ethiopia suggests, for example, that 96% of unconnected households have the willingness to pay for a grid connection, and that the main impediments towards this goal are the distance from the grid and the complicated administrative procedures to get a connection. The evidence indicates also a high willingness to pay for Tier 1 and Tier 2 systems, which off-grid solar solutions are the most suitable for, and thus they should be prioritized to achieve a large access to electricity. Such results reveal how MTF surveys can effectively be used by Sub-Saharan African governments to better define energy access targets, to update their policies accordingly, and to better quantify their investment needs.
1.3.2. Impact on economic development
A recent review of the academic literature has found that a majority of researchers observe positive economic impacts of electrification in developing countries70. These observed impacts have included increases of household income, sig-nificant household cost savings from reduced fossil fuel and
battery expenditure, increases of female employment rates, a higher uptake of trainings and education aimed at increased productivity, higher overall consumption levels, and local migration from non-electrified to electrified villages.
Increases in income through electrification occur when new appliances are run and boost economic activities. This is com-monly referred to a productive use of electricity. Electric appli-ances for productive use can be grouped into requiring either light, medium or heavy amounts of electricity (see Table 1 for some examples). The potential for adding value tends to increase with the electricity demand of the machines, implying that finance and/or savings can trans-late into more income generation potential. For instance, a 1 kW solar hammer mill which is able to treat roughly 40 kg of produce per hour costs around USD 4,000. Another example is the case of cassava and maize milling in Uganda, where it can more than triple the crops’ value by weight. Considering that in Uganda maize in grain form sells at around 0.25 USD/kg (prices vary a lot depending on the season), while milled grain sells for roughly 0.75 USD/kg, the machine would be required to run with a 20% capacity factor during a two-month maize harvest period for the investment to be recovered.
electrification is a necessary but not sufficient condition for sustained economic development in remote areas

RE-thinking Access to Energy Business Models
34
Table 1 – Examples of electric appliances and their productive use*
Appliance type Electric appliance Productive use and types of businesses
Light appliances
(< 0.1 kW)
Lights Longer opening times / improved appeal for shop ownersSockets Mobile phone and laptop charging businessMobile phones Rental of phones for calls on fee basisTV sets Small community cinema / football broadcastsSewing machines Textile manufacturingHair clippers / salon driers Hair dresser / barbershop
Medium / continuous appliances
(0.1 – 1kW)
Power tools Metalworking and carpentryWashing machines Cleaning businessWater pumps Water supply businessSprinklers, drips Irrigation for farmersCommercial dryers Drop drying, fish dryingElectric stoves (mostly resistive heating coils) Restaurants
Heavy / continuous appliances
(> 1 kW)
Continuous refrigeration, freezing and ice making
Dairy farmers, fisheries, butchers, food and medicine transport and storage, bars
Electric brick makers ConstructionElectric mills Value add for grains and cereals Oil seed processing machinery Producers of vegetable oils (groundnut, sunflower, etc.)Air conditioning Improved shopping experience in large retail shops
* Power requirements are indicative only and depend on the individual application.
It should be noted, however, that the positive impacts observed in the academic literature are more salient in de-veloping countries outside of rather than within Sub-Sa-haran Africa. In fact, of the 8 studies on Sub-Saharan African countries reviewed by Bos et al. 71, only 3 find clear posi-tive effects of electrification on economic development, while the other 5 find no significant effects. For instance, a study examining Rwanda’s Electricity Access Role-Out Program (EARP), an ambitious plan to expand the grid to rural areas, finds no notable increase of household income after more than 3 years of electrification and that both the amount of consumed electricity and the uptake of new appliances remained at low levels. Similar results on limited appliance uptake are reported for productive use in micro-enterprises72. In summary, it’s clear that electrification is a necessary but not sufficient condition for sustained economic devel-opment in remote areas of Sub-Saharan Africa. Access to
finance, quality education, effective industrial policies, and a generally favourable environment need to have been in place for some years in order to achieve tangible results.
1.3.3. Impact on wellbeing and quality of life
There is a widespread agreement among scholars and pol-icy makers that electrification increases the wellbeing and quality of life of those electrified73. The following specific impacts have been documented:
■ Positive effects for education The most evident and documented benefit provided by
electric lighting to education is the possibility for children to study at home during dark hours, in a safe way and with increased quality if compared to traditional lighting sourc-es. Teachers are more favourable to work in rural schools if these are served by electricity, therefore access to elec-

Sub-Saharan Africa’s off-grid market
35
tricity also promotes student attendance74. Furthermore, electricity enables the usage of computers and internet connection as educational tools, and also the establish-ment of after-school programs75.
■ Positive health-related effects Reliance on inefficient fuels combined with inefficient
technologies such as traditional cookstoves or kerosene lanterns expose poor people to health‐related problems. Electric lighting significantly reduces indoor air pollution, and specifically the risk of kerosene poisoning, which commonly affects children in rural households76. Moreover, access to media (television, radio and internet) enabled by electricity, is a major source of knowledge about sanitary and welfare issues, contributing to improve the health status through enhanced health knowledge77.
■ Positive effects for social interactions and leisure-time There are several household activities that involve energy:
cooking, cleaning, maintenance, ironing and caretaking, consumption of information and entertainment, communi-cation as well as income-generating activities78. In addition to the direct benefit given by the usage of electrical appli-ances, electricity light helps performing such activities with more efficiency, flexibility in their scheduling, and saving time79. Mini‐grids also enable the usage of appliances (such as pumps, grinders, mills, blenders) that alleviate labour-in-tensive tasks especially in agricultural and food processing activities80. The overall result is an improvement in quality of life and increase of available free time, which can be spent for leisure activities and improved social interaction. Entertainment opportunities are increased and varied, through access to TV, radio and internet.
■ Empowerment of women Women’s empowerment is defined by Winther et al. 81 as “a
process towards gender equality, understood as women’s and men’ s equal rights, access to and control over resources and power to influence matters that concern or affect them”. In this sense, there are many evidences showing a direct and universal impact of electricity on factors - like education,
access to information through television, and time use – that are ‘em-powerment enablers’ 82. In some cases, the reduction of drudgery translates to a permanent reduction of domestic workload, opening to em-ployment opportunities for women outside the household; awareness about family planning gained through television leads to a controlled reduction of fertility83. The increase in women’s autonomy and agency can ultimately determine a shift in gender norms and reduction of inequalities.
1.3.4. Water-energy-food nexus
In addition to the energy challenges, access to clean water is a significant problem in many areas of rural Sub-Saharan Africa. The majority of the rural population has either no ac-cess to a clean water source at all or drinking water must be fetched from a long distance which causes a major burden for local households84. About 60% of the population in rural Sub-Saharan Africa areas rely on rainfed, small-scale farming activities as the primary income source85. Due to the depen-dency on periodic rainfalls, these forms of agriculture are often seasonal which limits the households’ ability to gener-ate a stable income over the year. This in turn makes it more difficult for developers to achieve financial sustainability of their off-grid energy systems in rural areas. In addition to this, rainfed farming practices are particularly vulnerable to the effects of climate change. The three dimensions “water”, “energy” and “food” are deeply interdependent, requiring integrated approaches on a policy and a project development level to achieve the SDGs86. Yet policy-making and planning approaches are often sectorially driven87 which can result in conflicting, counterproductive strategies88. By contrast, an integrated approach goes beyond the sole provision of household electricity and incorporates clean water supply, irrigation, and agro and fish-processing activities (see section 3.1), enabling to capture different types of value: needs-based irrigation increases food producers’ resilience against droughts and breaks the cycle of seasonal
An integrated approach goes beyond the sole provision of household electricity

RE-thinking Access to Energy Business Models
36
income as well as ice production allows for a more efficient value chains of fish products. Such processing services can lead to a more stable income generation and diversification of economic
activity. The availability of clean water improves the quality of life and health conditions in a community. Finally, these water and food related energy demands help to drive economic sustainability of off-grid projects by increasing their utilization. This approach is yet to be tested at scale as most off-grid systems not yet provide integrated services but are usually focused on either agro and fish processing, irrigation, clean water supply or the domestic provision of electricity. It needs to be tailored to the demands of communities, require multi-criteria planning with multi-stakeholder engagement89 featuring joint efforts from developers, communities, finan-ciers, and researchers as well as policy-makers to set the formal framework for frictionless project implementation.
1.3.5. Joining off-grid solutions, productive use of energy and water-energy-food nexus
Researchers have been propagating three complementary strategies to ensure that electrification has a broader develop-mental impact in Sub-Saharan Africa, namely (i) a comprehen-sive rural development strategy, (ii) the promotion of off-grid electrification solutions, and (iii) the promotion of productive use of energy.
Firstly, rural development requires a multitude of input factors to manifest itself. These include access to quality ed-ucation and training, health care services, finance, infrastruc-ture (water provision, roads, electricity), an enabling policy environment, and a concrete strategy on how these inputs can best be transformed into economic gains. While many of
these areas are intertwined, a focus on electrification alone will not lead to sustained socio-economic development in Sub-Saharan Africa.
Secondly, in order to improve the cost-benefit balance of elec-trification, researches on impact of electrification in Sub-Sa-haran Africa have advocated to focus much more strongly on off-grid technologies90. Especially in areas with low initial demand, small-scale off-grid technologies are considerably cheaper than expanding the grid on a per-household basis. In Rwanda for example, off-grid solutions have been found to be able to offer the same initial benefits to roughly four times more households compared to grid extension at the same cost91. Recent academic energy planning studies have clearly indicated the cost-optimality of stand-alone and mini-grid technologies in vast areas of Africa92. Yet, despite this potential, current national electrification plans in Africa underrepresent off-grid solutions93, often due to more expe-rience with on-grid electrification and a perceived superiority of grid connections, indicating the need to convince public sector stakeholders of their importance going forward.
Thirdly, policies that actively foster the productive use of energy need to be implemented. This includes to enable the proper usage of commercially available alternating and direct current (AC and DC) appliances by providing financing mechanisms or setting up appliance rental systems as well as increasing off-takers awareness. This approach would enable customers with limited savings to benefit from these appli-ances by being able to add economic value to the goods and services they provide and use the extra income to payback the appliances/rental fees. Furthermore, developers of mini-grid systems would benefit of a higher energy demand, which mainly arises from the business activities and possible anchor loads, and indirect impacts on socio-economic development (see chapter 5).
Current national electrification plans in Africa underrepresent off-grid solutions


RES4Africa’s Micro-Grid Academy training held at Strathmore University’s grid-connected PV plant – Nairobi, Kenya

3939
2. Analysis of business models for decentralised RE solutions
As mentioned in the previous chapter, a mix of grid exten-sion and off-grid solutions, such as solar home systems and mini-grids, should be properly combined in the country’s electrification masterplan to pursue universal access to electricity. Furthermore, considering the current investment gap, achieving SDG 7 will largely depend on the capacity of each country to attract private investments in the off-grid sector and, particularly, in the mini-grid sector, which is esti-mated to attract a significant part of worldwide investments in increasing access to electricity (see section 1.2). Despite the individual systems’ business, which is proven to be viable and running in several developing countries, the mini-grid sector still requires an analysis and investigation of inno-vative business models that go beyond the sole electricity supply, looking at additional services, complementary value chains, innovative partnership and horizontal integration.
Thus, this study will exclusively analyse mini-grid business models for access to electricity with a focus on productive use of electricity. It will exclude captive projects with a unique industrial off-taker since their financial feasibility is already demonstrated and they represent a notable po-tential market in developing countries, and still relatively untapped. In this chapter, the study classifies and analyses business models of 21 mini-grid projects in Sub-Saharan Africa, identified among 32 pre-selected cases on the basis of se-lection criteria which took into consideration: i) geographic coverage; ii) location; iii) technological solution; iv) services provided; v) system size; vi) source of power; vii) project status. For detailed information on analysis methodology and selec-tion criteria, see Box 1.
Figure 19 – Map of the 21 projects analysed
Cape Verde (1):Solar PV + Diesel (2014)
Ghana (5):Solar PV + Diesel (2016)Solar PV + Diesel (2016)Solar PV + Diesel (2016)Solar PV + Diesel (2016)Solar PV + Diesel (2016)
Sud Africa (2):Solar PV (2017)Solar PV (2017)
Kenya (4):Solar PV + Diesel (2015)Solar PV + Diesel (2011)Solar PV + Wind + Diesel (2010)Wind + Diesel (2000)
Tanzania (7):Solar PV (2016)Solar PV + Diesel (2016)Solar PV + Diesel (2016)Hydro (2014)Hydro (2004)Hydro (2001)Hydro (1986)
Zambia (2):Solar PV + Diesel (2017)Solar PV + Diesel (2014)
Grafico aggiunto.pdf 1 25/11/19 16:46

Methodology of case study analysis
BOX 1
40
General assumptions in the data analysisThe data analysis has been done on 21 mi-ni-grid projects in SSA, identified among 32 pre-selected cases on the basis of selection criteria detailed here below. Each case study has been classified following three criteria: based on services provided, operating methods and ownership, as ex-plained in Chapter 2.
Data collectionThe data collection activity was carried out from December 2018 to March 2019. In the data gathering phase, actual data from operational plants, both from the design and implementation phase (purpose and business model of the project, detailed CAPEX, tariff structure, technical specifica-tions of the mini-grid) and their operational phase (OPEX, actual revenue streams, sale of electricity and other services/products, elec-tricity consumption, number of customers and potential market) have been collected from the developers and complemented also through local stakeholders.
Types of data collected:
■ Description of the business model: (i) sales model; (ii) type of services; (iii) ownership; (iv) other.
■ Business plan: (i) IRR; (ii) NPV; (iii) pay-back period; (iv) CAPEX; (v) financial structure (equity, debt, grant); (vi) other.
■ Real data: (i) date of commissioning; (ii) current status; (iii) actual investment (real CAPEX); (iv) revenues, over the operational time; (v) tariff, over the operational time (with type of tariff plan);
(vi) OPEX, with breakdown costs when available; (vii) repowering, if any (not referring to spare parts but to increase/modify generation, storage, etc.); (viii) electricity production in operational (kWh produced and and with reference to RE share in the energy mix; (ix) amount of not served energy (kWh); (x) sales volume (amount of product sold depending on the business: electricity, litres of water, Kg of food processed, etc.); (xi) continuity/discontinuity of the service over the operational time; (xii) number of customers (e.g. connections, etc.); (xiii) potential direct market (number of households or population); (xiv) other.
■ Other data relevant to the analysis.
Data analysisAn Excel model was created to evaluate the financial sustainability of the plants using as many real performance data available as possible. Where necessary, specific assump-tions and projections to estimate financial parameters (NPV, IRR) were included over a 20-year financial plan.The values of all the financial data has been kept in local currency, and adjusted for infla-tion, using a ten-year average of the inflation rate registered in the country according to World Bank datasource. The IRR was calculated with reference to the local currency, while the NPVs have been converted to USD for ease of comparison, using the exchange rate of the 31th of December of the year of commission-ing. IRR was selected as the reference financial indicator to rank the profitability across pro-jects of different scale and it is not related to the volume of the investment as the NPV.
In calculating IRR and NPV, all projects have been assumed with a CAPEX fully funded by equity, to assess the sustainability and scalability of existing projects, regardless of the usage of grants or loans in the actual financing of the project. However, data on projects’ financial structure has been analyz-ed separately and reported in Chapter 2. To discount future cashflows, the average WACC for utilities in each country has been used. Missing data has been often estimated using a proxy approach from the most similar plant among the case studies, especially ones sharing the same developer and country of intervention. The modelization has been implemented dynamically, envisaging a growth of elec-tricity consumption and new connections, in consideration of the potential market of each site. From longer operating plants, which had a evident growth in the histori-cal trends, a reference curve for consumer takeoff and consumption increase has been derived, and used for newer plants to per-form projections.The possibility of expanding the plants was not considered in doing projections, as the evaluation was limited to the capability of the assets currently on the ground. An extraordinary maintenance of all the mini-grid components has been assumed to happen at the 10th year of operation, and es-timated considering current prices and cost reduction trends of the various technologies adopted. However, in case it was known any faulty components, their repayments were assumed at the first year of forecasting.
Exceptions The model was created starting from the eligibility criteria of case studies, thus having in mind mini-grid projects that comprise a central generation plant with a distribution system, possibly integrated with the supply of other services and associated revenue streams.

Methodology of case study analysis
41
2.1. Business model classifications
There are different criteria to classify business models (BMs) for mini-grids. The most common ones are based on ownership, pay-ment systems, distribution strategy, financial structure, operating entity, scalable approach as well as multi-criteria classifications. The business models classifications that result particularly interesting from a mini-grid developer point of view and that best fit the business cases selected for this analysis as well as the WEF nexus, are the ones based on:
■ services provided; ■ operating methods; ■ ownership.
2.1.1. Classification based on services provided
This study aims at exploring effective solutions to foster the deployment of decentralised RE solutions in Sub-Saharan Africa. Since the analysis of correlations between integrated business models, the application of the WEF nexus and busi-ness financial sustainability are at the core of this study, the business model classification based on services provided is instrumental to present the analysis’ results.
Table 2 – BM classification based on services provided
Services provided N° of cases
Electricity supply 14 (67%)
Electricity supply & other energy-related products/services
3 (14%)
Electricity supply & other WEF nexus-related services 4 (19%)
Total 21 (100%)
However, two business cases developed in South Africa and based on decentralized renewable energy solutions have been included even if not in compliance with the eligibility criteria, being in operation for less than 2 years and based on resi-dential nano-grids, where a small power station interconnects groups of a dozen households. They have been considered to include potentially disruptive new business models, that even if nascent or at pilot stage are worthy of consideration even if their performance cannot be analysed with the criteria used for the rest of the case studies. In the remainder of the study, there is a clear indication when reference is made to these two case studies.
Criteria for selection of case studies
■ Geographical criteria: – Priority 1: Zambia, South Africa,
Kenya, Ethiopia – Priority 2: other Sub-Saharan
African countries
■ Location: – Priority 1: rural – Priority 2: peri-urban
■ System type: – Decentralized renewable energy
solution (grid connected systems were considered if they included independent generation and distribution)
■ Services provided: – Energy supply (electricity, heating,
cooling, etc.)
– Water related services – Food processing and conservation – Energy/water/waste management – Others
(telecommunications, heath, housing, etc.)
■ System sizing: – Priority 1: > 100 kW – Priority 2: 10÷100 kW
■ Source of power: – at least one renewable source in
the power generation mix
■ Current status of the project: – Priority 1: operational for at least
5 years – Priority 2: operational for at least
2 years – Priority 3: standby/
decommissioned

RE-thinking Access to Energy Business Models
42
Table 2 shows that the majority of projects only provides a electricity supply service, accounting for 67% of total case studies, while only 7 cases (33%) provide other services in addition to electricity supply and thus apply an integrated business model. Among them, 4 cases (19%) provide WEF nexus-related services and therefore integrate the nexus ap-proach in their business’ value proposition, whereas the other
3 (14%) deal with other energy-related products/services, such as sale or facilitation in purchasing of electrical appliances and technical services. Mapping energy-related products/services and WEF nexus-related services enables the identification of service integration and provides an overview of potential correlations, as Table 3 shows.
Table 3 – Mapping potential services provided
Types of BM based on services provided
Services provided in detail Electricity supply Electricity supply & other energy-related products/services
Electricity supply & other WEF nexus-related services
Electricity supply V V VProvision of electrical appliances V VTechnical services V VWater supply VIrrigation and land cultivation VForestry and wood processing VIce production VLivestock VAnimal feed production VMeat processing VDairy production VOther food production/processing V Micro-credit services V V
V = mandatory; V = optional
Taking into consideration the 4 projects that provide WEF nexus-related services, the following activities can be noticed:
■ 1 case on electricity supply and water supply; ■ 1 case on electricity supply, water supply, forestry, livestock
and animal feed production; ■ 1 case on electricity supply, water supply, forestry, jam
production and cattle meat rearing; ■ 1 case on electricity supply and ice production.
Considering on one hand that only a few cases integrate electricity supply with other services in a single business, and
on the other hand that all of them run water-related services as not-for-profit public services (such as water supply at a social tariff just to cover maintenance costs or free ice provision), it is interesting to investigate whether such approach, usually devel-oped by non-governmental organizations (NGOs) and public entities, could be integrated in a business strategy adopted by a private entity. In other words, could water-related services, and in particular water supply, be provided not-for-profit by a private entity as well? If such services came at a financially sustainable cost, could they represent an added value for the developer since they sustain local development and ultimately may lead to customers’ improved quality of life and ability to pay?

Analysis of business models for decentralised RE solutions
43
2.1.2. Classification based on operating methods
In order to define a tailored classification based on operating methods, the classes identified by a World Bank’s study on mini-grids94 have been integrated with two additional classes to best describe the following aspects: (i) projects with Power Purchase Agreements (PPAs) or Public Private Partnership (PPPs), which should fall in class A (“build, own, operate”) or the new one F (“build, own, operate, transfer”) and (ii) projects de-veloped by non-profit actors, which should fall in the new class E (“build, short-operate, transfer”). The latter addresses the pe-culiarity of non-profit developers to shadow the start-up phase of the project (sometimes even for 6-12 months or more) and to assign the ownership to a local association/cooperative/community-based organization. It is usually a project partner in the development phase, so that the non-profit developer is not the owner at any stage of the project, but instead there
is an actual transfer of responsibility as planned in the project design. The complete list of operating methods is:
A. build, own, operateB. build, own, outsourceC. build, own, leaseD. build, sellE. build, short-operate, transferF. build, own, operate, transfer
Furthermore, in order to give more prominence to the addi-tional services provided beyond electricity supply and thus clearly identify the projects that apply an integrated business, a second level of classification for such additional services, based on the same criteria of operating methods, is added (Table 4). Among integrated business models the study fo-cuses on those performing the WEF nexus.
Table 4 – BM classification based on operating methods
Supply of electricity N° of cases Supply of other services N° of cases
A. build, own, operate 7 (33%) 1. build, own, operate 3 (14%)B. build, own, outsource 9 (43%) 2. build, own, outsource -
C. build, own, lease - 3. build, own, lease -D. build, sell - 4. build, sell -E. build, short-operate, transfer 5 (24%) 5. build, short-operate, transfer 4 (19%)F. build, own, operate, transfer - 6. build, own, operate, transfer -
7. none 14 (67%)Total projects 21 (100%) 21 (100%)
Note: each case study is classified as X.0
Table 5 shows that only 3 operating methods are represented by the case studies: build-own-outsource (B) (9 cases – 43%), build-own-operate (A) (7 cases – 33%) and build-short oper-ate-transfer (E) (5 cases – 24%). Furthermore, the 7 cases (33%) that apply an integrated business model fall into class A.1 or E.5, meaning that they apply the same operating method to both electricity supply and other services, and that these services are managed by the same entity, without partial outsourcing or leasing. Considering that, among these, 4 cases (19%) provide WEF nexus related services, this suggests that there are already
developers with the relevant operational capacity necessary to manage a multi-utily structure in rural Sub-Saharan Africa. This should be read together with the relevance of complementary activities carried out during the project implementation in order to strengthen the technical and managing team (see section 3.3). Lastly, the other 3 cases (14%) deal with other energy-re-lated products/services such as the selling or facilitating the purchase of electrical appliances and technical services; these cannot be directly linked to the WEF nexus approach, but they add revenue streams to sustain the project viability.

RE-thinking Access to Energy Business Models
44
Table 5 – Correlation between operating methods and services provided
Operating method for supply of electricity
N° of cases Operating method for supply of other services
N° of cases Class code
Services provided
A. build, own, operate 7 (33%) 1. build, own, operate 3 (14%) A.1 2 (10%) electricity supply & other energy-related products/services1 (5%) electricity supply & other WEF nexus-related services
7. none 4 (19%) A.7 4 (19%) electricity supply
B. build, own, outsource 9 (43%) 7. none 9 (43%) B.7 9 (43%) electricity supply E. build, short-operate, transfer 5 (24%) 5. build, short-operate, transfer 4 (19%) E.5 1 (5%) electricity supply & other
energy-related products/services3 (14%) electricity supply & other WEF nexus-related services
7. none 1 (5%) E.7 1 (5%) Electricity supply
Total projects21 (100%)
Total integrated projects 7 (33%)
Total WEF integrated projects 4 (19%)
Additionally, in order to compare the results to a wider sample, on over a total of 32 pre-selected case studies, 11 (34% of the total) apply an integrated business model, and among them
only 6 (19% of the total) apply the WEF nexus approach. Thus, both percentages confirm the result reported above, given by the analysis on the 21 selected case studies (Figure 20).
Figure 20 - Incidence of WEF integrated projects on mini-grid applications
Distribution on the 21 selected case studies Distribution on the 32 pre-selected case studies
Relevantly, 3 out of 4 cases applying the WEF nexus (see Table 5) approach are implemented through a build-short operate-transfer business model, which identifies projects developed by non-profit actors in this BM classification. This highlights how, among all the other criteria to classify a mi-
ni-grid project, the issue of ownership stands out as one of the most interesting, also considering its relevance in the operat-ing methods. That is the reason why ownership is selected as the third BM classification criteria in this study, as explained in the next section.
1467%
314%
419%
2165%
516%
619% Electric supply
Electric supply & other energy-related product/services
Electric supply & other WEF nexus-related product/services

Analysis of business models for decentralised RE solutions
45
2.1.3. Classification based on ownership
In general terms, the ownership structure of a mini-grid should fit in one of the following models: community, public utility, private company or hybrid, featuring for instance a PPP95. Case studies classified according to the operating method criteria (see section 2.1.2) can be read in correlation with the ownership model in Table 6 below, which reveals univocal correlations: public ownership projects operate through a build-own-outsource business model, private ownership pro-jects operate through a build-own-operate business model, community ownership projects operate through a build-short operate-transfer business model, while hybrid ownership pro-jects represent a minority of cases.
Table 6 – BM classification based on ownership and its correlation with operating methods
Ownership model N° of cases Operating method*Public 9 (43%) 9 cases B.7Private 6 (28%) 2 cases A.1
4 cases A.7Community 4 (19%) 4 cases E.5 Hybrid 2 (10%) 1 case A.1
1 case E.7Total 21 (100%)
*Class codes refer to Table 4: class A: build, own, operate /class B: build, own, outsource / class E: build, short-operate, transfer.
Taking into consideration at the history of rural electrifica-tion, many individuals and communities in rural areas have spontaneously taken it upon themselves, or have done so supported by NGOs, to construct their own rudimentary electricity distribution system supplied by isolated power sources96. Once the centralized generation paradigm was challenged and the space for mini-grids was recognized, more structured actions were undertaken to assure a high-er standard of service and safety, in which NGOs acted as project developers and transferred the asset and its man-agement to recipient communities.The community ownership model is represented here by case studies that show the effectiveness of such model
if developed by non-profit actors, while providing energy access within a long-term integrated programme that aims at empowering the communities through capacity building, provision of other services and stimulation of productive uses of energy.The private company model is emerging and it can be com-pared to community models in quantitative terms. This is not an unexpected result, since the approach to the problem of access to energy has gone through a profound change in the last decade during which cooperation development agen-cies, that usually supported only non-profit actors in the rural electrification sector, are now targeting private investors and consider them eligible for funding. The necessity of involving private capital to reach a wider impact of the international action comes from the high ratio between project budget and beneficiaries in mini-grid projects: public finance is not available to justify high grant funding on large scale programs and non-profit actors cannot afford such important co-con-tribution97. This political and financial framework has encour-aged private developers and hampered non-profit actions in the last years. In fact, as this study shows, projects developed by private actors were commissioned after 2016 whereas those developed by non-profit actors were commissioned before 2016. However, it must be underlined that pilot pro-jects are testing partnerships between profit and non-profit actors, where the latter usually play the role of local partners which facilitate preliminary studies and community inclusion by means of complementary activities (see section 3.3), with or without providing a financial contribution. In fact, enabling the local environment is one of the key barriers that private developers have to face. However, it may not be the main one: all of the private initiatives featured in this study, except two, have been relying on grants (see section 2.3) which reveals that it is fundamental to reach an acceptable return on invest-ment (ROI) to make the project feasible in a piloting phase
and support the scaling-up phase to reach a commercial financial sustainability of the business to justify its replicability. On the other hand, local govern-ments have also made efforts to
Pilot projects are testing partnerships between profit and non-profit actors

RE-thinking Access to Energy Business Models
46
increase energy access without solely resorting to grid ex-tension. However, the public utility model is represented by case studies with poor technical and financial performances and severe sustainability problems, because (i) they often apply national tariffs which are usually very low, especially if compared to those awarded to private operators after nego-tiation and licence procedures, (ii) use diesel as a main power source, (iii) have poor community involvement and lack of a more comprehensive approach to support access to energy.Lastly, hybrid models are a promising alternative as they exploit fruitful cooperation of public and private actors within a clear and established electrification pathway and regulatory framework. Among the case studies analysed, the Monte Trigo micro-grid in Cape Verde was built combining a grant with an investment from the local municipality98, which part-nered with a private actor to create a mixed company that is in charge of O&M and owns the movable assets of the plant, whereas the municipality retains ownership of the distribution grid and power room.
2.2. Value propositions for target market and access to finance
Value propositions should integrate a combination of prod-ucts and services that provides value to final customers and potential investors by resulting as the solution of one or more problems they are facing or opportunities they are looking for. Thus, considering the focus of this publication on how to accelerate the mini-grid industry’s growth, reach commercial viability and facilitate access to finance, two faces of business models’ value proposition are analysed: i) value proposition for target market; and ii) value proposition for access to finance99.In order to provide a comprehensive overview aimed at point-ing out insights of a mini-grid value proposition, the following aspects are treated:
– different approaches in defining the value proposition, – common factors of mini-grid value propositions, – productive use of electricity,
– marketing strategy, – pricing strategy, – service level performance, – risk reduction strategy.
■ The value proposition for target market should start from a need analysis and understanding of target population. However, it is crucial to identify the approach to apply in defining a successful business model, and the related value proposition, in the mini-grid sector for the rural context. In other words, (i) does the business model aim at addressing the needs of a pre-selected target market or (ii) does it aim at pre-selecting reference needs to satisfy which guide the identification of eligible target markets?
With reference to the analysis conducted in this study, the first approach is typical of two types of projects: those de-veloped by NGOs, which usually have strong ties with areas they have been acting for long time, and mini-hydropower projects, which serve the surrounding areas of the natural re-source, meaning that the target market is given. The second approach is more typical of private developers or govern-mental agencies’ initiatives, where the target market’s profile is already defined to meet financial expectations for the first ones or to achieve impact results or political commitments for the second ones, meaning that the site identification is a crucial preliminary activity to assure the project’s success. This distinction helps to highlight the two sides of the value proposition for a mini-grid project.
■ There are common factors among the case studies collected, also given by the selection criteria (see Box 1), which mainly define the value propositions for access to finance: (i) access to energy for all, (ii) focus on rural/remote areas, (iii) environmental benefits of renewables (vis-a-vis electricity substitutes for end-users). Moreover, 7 cases, accounting for 33% of the total selected (see Table 5), add a further factor by implementing an (iv) integrated business to boost local development or to support the techno-economic sustainability of the project, whereas only 4 propose a (v) multi-utility structure supplying electricity and

Analysis of business models for decentralised RE solutions
47
water-related services, thus applying the WEF nexus approach. On the other hand, the common factors defining the value propositions for target market are (i) the affordability and (ii) the reliability (even if such service quality is not properly performed in some cases, as reported in section 4.1), (iii) user friendly systems, (iv) tailored solutions for different type of customers. As mentioned above, 7 cases also add a (v) multi-service offer.
■ A crosscutting added value, included in value propositions for both access to finance and target market, is the productive use of electricity. The PRODUSE manual defined productive use of electricity (PUE) as agricultural, commercial and industrial activities involving electricity services as a direct input to the production of goods or provision of services100. PUE can be described as the driver to boost local economy, reduce investment risk and enable customer willingness of more sustainable and advanced business activities. However, beyond such added value, as usually presented by developers in the business’ value proposition, one should distinguish the actual compatibility and services provided to support PUE, since they are strictly correlated to the mini-grid business model. The level of PUE compatibility & integration can be outlined as follows:
i) Restricted compatibility with PUE: the use of electric-ity to feed limited equipment and appliances in terms of technical specifications or time of use, which are often not compatible with productive uses in rural ar-eas. E.g. DC supply which implies specific DC devices for PUE and/or low thresholds per customer in terms of power peak and electricity consumption.
ii) Full compatibility with PUE: the use of electricity to feed equipment and appliances for productive uses carried out by off-takers, allowing AC and DC supply, power peaks of machineries commonly used by business off-takers in rural areas and time of use for PUE.
iii) Full compatibility with integration of PUE in the business: the use of electricity for productive uses as part of a single integrated business case. It pow-
ers PUE carried out by off-takers, as defined in II, as well as by mini-grid developer, which adds revenue streams to the sole provision of electricity.
In this perspective, the first type characterizes projects with small size installed capacity or DC distribution and it is only represented by 19% of cases analysed in this study (this data has to be evaluated considering that the selection criteria ex-cluded power plants smaller than 10 kW). The second type of projects represents the majority of the case studies analysed, accounting for 62% of the total: the PUE is included as pro-ject’s result since it is widely recognized that access to reliable and affordable electricity supports the local development. In order to boost PUE, these projects carry out supporting activ-ities as well (see section 3.3.). The third type of projects, still a market niche, represents the core of this study and accounts for 19% of the total case studies analysed.
As shown in Table 7, the correlation between the level of PUE compatibility & integration and the BM classifications based on criteria of services provided, operating methods and ownership highlights that, firstly, almost all public mini-grids are fully compatible with PUE (II level), which could reflect public policies to foster rural development. Secondly, there are no public and private mini-grids that have full compatibility with integration of PUE in the busi-ness (III level), which could reveal the challenges beyond such approach as well as the innovation it represents in the rural electrification sector. Lastly, 3 out of 4 cases having full compatibility with integration of PUE in the business (III lev-el) and providing electricity supply and WEF nexus-related services (as per BM classification on services provided) are owned by community entities. This factor could suggest that partnership with local cooperatives and associations structured or empowered during the project development phase is key to successfully carried out high-impact and viable rural electrification projects.
Productive use of electricity is a driver to boost local economy and reduce investment risk

RE-thinking Access to Energy Business Models
48
Table 7 – Correlation between level of PUE compatibility & integration and BM classifications
Level of PUE compatibility & integration
N° of cases BM based on services provided BM based on operating method
BM based on ownership
Restricted compatibility with PUE 4 (19%) 2 cases electricity 2 cases electricity & energy-related products/services
1 case E.71 case B.72 cases A.1
1 case public1 case hybrid2 cases private
Full compatibility with PUE 13 (62%) 1 case electricity & energy-related products/services12 cases electricity
1 case E.54 cases A.78 cases B.7
1 case community4 cases private8 cases public
Full compatibility with integration of PUE in the business
4 (19%) 4 cases electricity & WEF nexus-related services
1 case A.13 cases E.5
1 case hybrid3 cases community
Total 21(100%) 21 21 21
■ After being underestimated for too long, the role of marketing strategy in driving rural projects’ success has been recently relaunched thanks to the private sector involvement in the rural electrification, particularly by SHS providers. However, current mini-grid projects’ value propositions for access to finance are not usually focused on this aspect, probably due to the belief that need for electricity is sufficient to ensure expected market penetration. It is proven instead that a weak marketing campaign and customer care services, often coupled with poor complementary activities (see section 3.3), considerably affect the start-up phase of the business. The analysis reveals a clear correlation between connection rate and marketing activity carried out at the early stage of the operational phase: all the projects that have implemented a structured marketing activity, such as connection and awareness campaigns, have recorded the best connection and consumptions results among the case studies analysed.
Marketing and customer engagement strategy are crucial to boost value propositions also for target market. Keeping in mind that it is important to differentiate offers to customers while maintaining a clear and simple value proposition, customization of products/services to customer clusters and tailoring solutions to best fit the consumer’s preference is a common strategy in most of analysed projects.
■ Another key factor is the pricing strategy, even if the approach varies in terms of value proposition for access to finance and for target market. In the first case, the scope is to
prove the investment viability and reassure financing entities on the potential customers’ ability to pay. In the second case, the scope is to adopt models of pricing to favour a reduction of customers’ expenditure in electricity substitutes or fuel-based power sources.
The pricing strategy is very much connected to the payment systems in formulating the value proposition. It should take into consideration not only the willingness and ability to pay, which should be properly estimated through an energy need assessment, but also the customers’ perception of ex-ante costs and consumptions for electricity substitutes in a time dimension they are familiar with, in order to design expenditure-reducing measures that are positively perceived (e.g. weekly or monthly flat tariff, consumption tariff with economic or energy units - see section 3.2).
Among case studies analysed, 3 developers have applied a pricing strategy which clearly reflects this customer-based approach. Redavia, a private company operating in East Afri-ca, was smart and flexible to change a standard flat tariff into flat regressive tariff in the early start-up phase to get a better customer response: it is based on consumption thresholds at a decreasing flat tariff without differentiating into customer clusters. CEFA and ACRA, Italian NGOs with proven track record in the mini-grid sector, applied a similar tariff plan composed of flat and consumption tariff differentiated per customer cluster. Economic thresholds are fixed to meet both the ability to pay of the poorest part of population and the financial sustainability of the projects. It is important to

Analysis of business models for decentralised RE solutions
49
highlight that an increasing market penetration rate in a rural area implies that the bottom of the socio-economic pyramid always exists, and it is assumed to remain under flat tariff threshold, also in terms of electricity consumption.
■ The value propositions for both access to finance and target market should take into consideration the service level performance. Depending on how the proposal is formulated, different service level performance could represent a strength: lower service level performance should mean lower capital investment per connection, whereas higher service level performance should mean a broader impact on development dimensions and long-term project sustainability. Focus should instead be on delivering a quality service: the analysis reveals that in several cases the quality of the service was lower than expected, and that the installed asset did not run at full capacity mainly because of poor O&M management. The number of cases recording unmet service level performance on both off-taker side and technical performance of generation assets are 5, and all of them are owned by public entities: 4 applying a public ownership model, 1 a hybrid private-public model (data on service level performance are not available for 7 cases out of 21). Data on electricity consumption per customer as well as on number of connections show that rural customers prefer not to be connected at all than have access to an unreliable service. A case in Zambia recorded a 45% loss of connected users in the first two years of operation.
■ To complete this overview on value proposition of mini-grid projects, another key factor is the risk reduction strategy. In the value proposition for access to finance, risk reduction is mainly focused on mitigation measures to reduce the investment risks. In the value proposition for target market, it is focused on the products/services reliability in term of warranties, customer care services, technical assistance, quality of components, etc. to stress the message that the lower the risks associated with purchasing a product or service, the higher its value for customers.
2.3. Financial analysis results
Availability of detailed and aggregated data on mini-grid projects in developing countries is quite limited, particularly if compared to off-grid solar solutions. The financial analysis of the 21 projects sample here collected provides a picture of developers’ strategy, and can help to assess the maturity of the market and the financial needs to accelerate private sec-tor investments. The analysis confirms that existing mini-grids have been mostly relying on grants to fund their investment (Figure 21), and that it is fundamental to make the investment feasible in a piloting phase and support the scaling-up phase to reach the business’ financial sustainability. Out of 21 case studies analysed, 16 have CAPEX funded by grants. Among them, 11 have a grant component at 90% or more, whereas 2 at a percentage between 75% and 90% and 3 under 35%. 3 other projects have been fully funded by governmental agencies (public funds or energy funds at the national level), which maintain the ownership, as part of energy access policies in remote areas. Only 2 projects did not receive grants, but they apply a very peculiar business model based on DC distributed nano-grids in South Africa.
Figure 21 – Projects’ financial structure
1152%
210%
314%
314%
210%
Grant > 90%
Grant > 75%
Grant < 35%
100% fundend by local Government
No Grant
Firstly, this shows how grants are necessary to reach an accept-able ROI in pilot and scaling-up projects in order to enable the involvement of the private sector, and secondly that business

RE-thinking Access to Energy Business Models
50
models must be able to over-come a strong incentive-based approach to foster the large-scale replicability of mini-grids.Another interesting evidence is related to the developers‘ as-sumption for the financial plan: 6
projects operate for profit and 15 operate not-for-profit, in-cluding all the cases providing WEF nexus-related services.The 6 that are working with a kind of commercial purpose, employing a tariff that is designed for profit, at least in principle, declare to be able to achieve a pay-back period during the commercial operation of the plant. However, the financial analysis reveals that 2 of the 6 projects do not reach a payback period within 20 years of operation. In the other 15 projects, accounting for 71% of the total, the developer designed a financial plan that does not intend to recover the CAPEX. Among them, only 4 cases work with operating cost-reflective tariffs that are meant to compensate for OPEX, which means that they adopt at least an operational sustainability (Figure 22). Remarkably, all of them are developed by NGOs, showing how such grant-funded projects can serve as pilots to demonstrate, albeit partially, the financial sustainability of energy access
initiatives. It is relevant to report that all the 15 projects were commissioned within 2016, before the political and financial framework started to encourage the private de-velopers and hampered non-profit actions in the energy sector, as discussed in section 2.1.3.The remaining 11 projects (52% of the selected cases), oper-ate at a steady loss, meaning that the revenue streams are not able to cover the OPEX, mainly given by fuel expenditures or simply by staff and other O&M costs (Figure 21). In such cases, the choice of adopting a national electricity tariff plan, giving up on cost-reflective tariffs or subsidized tariffs, denotes the acceptance of economic losses from local utilities. Moreover, such projects unable to cover running expenses were almost fully funded either from grants or public funds. It is relevant to highlight that 9 out of 11 in steady loss are owned by public entities, while the remaining by a hybrid public-private own-ership. The inverse correlation is also true: all the mini-grids with a public ownership model operate in steady loss.This analysis reveals a clear correlation between the (i) financing structure, (ii) the operational strategy and (iii) the type of developer: projects with a strong grant-based structure apply a financially unsustainable O&M plan, ex-cept those developed by non-profit actors, and are mostly developed by public entities.
Figure 22 – Developers’ assumption for the financial plan
629%
419%
1152%
1571%
For pro�t
Not for pro�t
With operation sustainability
Insteady loss
The analysis confirms that existing mini-grids have been mostly relying on grants

Analysis of business models for decentralised RE solutions
51
Another common factor of all the projects operating in steady loss is that they are mini-grids with a prevalent diesel generation component that have confirmed to be unsustainable with a uniform national tariff plan not able to cover the fuel expenditure.
The analysis provided results on the project profitability and its relation to the business model applied. The Internal Rate of Return (IRR) is used to rank project profitability and it is calculated by using local currencies while the Net Present Value (NPV) is converted in USD in order to gain comparable results among projects from different countries. The analysis provides evidence that local currency should be used to properly assess a business case (see chapter 7): this is particu-larly relevant for foreign investors who, operating through local companies, should take into consideration the issue of financial recovery and local regulations they are subjected to.Results of the financial analysis of the selected case studies should carefully be read taking into consideration several factors, which are discussed in detail hereafter.3 out of 4 WEF projects fall in the top-10. Thus, firstly it is im-portant to compare them with the other 7 non-WEF projects and, secondly, explain the reason why one WEF project does not fall in the top-10.The 2 cases on top of the ranking are developed by the same private entity and differ from the others because of the very high tariff plan applied, since they run in peri-urban areas of South Africa. These projects successfully apply a business model based on electricity supply and other energy-related products/services (see Table 2). However, they would face serious challenges if they were replicated in remote areas with a low-income level due to logistic constraints and tariff affordability.4 cases are developed by private entities in Zambia and Tanzania and apply higher tariff plans than the national ones, even if they are not purely cost-reflective since CAPEX were partially subsidized. All of them successfully apply a business model only based on sole electricity supply (see Table 2). It is relevant to highlight that the regulation in these countries allows for a special tariff for private developers, and that this practice is not permitted in other countries, such as in Ghana
where the same technical advisor was working on five similar projects included in this analysis and resulted to be in steady loss. Moreover, to draw a comparison between the 2 case studies in Zambia analysed in this study, which are similar from a technical point of view: one falls in the top-10 and is developed by a private actor that applies an electricity tariff three times higher than the other one, that is developed by a public actor and operates in steady loss. However, field studies done by local academics reveal that the tariff applied by the private actor is the maximum that the local population can afford, and this demonstrates that a viable project can be socio-economically sustainable as well.The last case falling in the top-10 is a project developed by an NGO in Tanzania which has strongly supported the pro-ductive use of electricity over the time and implemented a very well-designed complementary activity programme and effectively shadowed the start-up phase of the business. As the projects mentioned above, it applies a business model based on electricity supply & other energy-related products/services as well.Considering the ranking from the point of view of the business model classification based on services provided, the top-10 present a balanced mix of the three classes (see Table 2), however another notable result is that all the pro-jects applying a business model based on electricity supply & other energy-related products/services (3 out of 3) and all the projects applying a business model based on electricity supply & other WEF nexus-related services, except one (3 out of 4), are ranked in the top-10. These results suggest that business models applying integrated services should be further investigated.The reason why one WEF project does not fall in the top-10 depends on three main aspects: (i) it is developed in Cape Verde, where the regulation does not allow for a tariff different
from the national one, (ii) the WEF related activity (ice production) is not-for-profit which means that no additional revenue stream supports the mini-grid business even if the asset and operational costs of an ice machine are con-
Projects operating in steady loss are mini-grids with a prevalent diesel generation component

RE-thinking Access to Energy Business Models
52
sistent, (iii) the usage of diesel in support of the renewable power plant increases the OPEX and causes the steady loss of the business plan. However, apart from the success in terms of financial profitability, the project can be considered successful by looking at the overall results: the electricity demand currently exceeds the forecasts made during the design phase (explaining the need for diesel generation), even if the photovoltaics (PV) generation plant has been already expanded once. Moreover, there is another ongoing project to increase the ice-generation capability and build a separate generation facility dedicated to ice production (see section 4.2.3 for further details on this case study). Despite being in steady loss, it still seems a virtuous example of pro-ject implementation compared to other projects outside the top-10 list, such as a plant in Zambia which lost about 50% of its customers after the two first years of operation due to generation curtailment, lack of community involvement and of a clear and coherent tariff plan.
Looking at the ranking based on IRR, there is a clear correlation with the business model classification based on operating method: the top-10 apply a type A (build-own-operate) or E (build-short operate-transfer). Moreover, considering that 4 out of 5 cases classified with E code are developed by NGOs and that they all ranked in the top-10 while the fifth is a hy-brid public-private initiative, the type A (build-own-operate) results as the most viable business model for private actors. The case studies do not provide many examples of invest-ments that could be replicated by private actors as bankable. In fact, grants or highly subsidized loans are as of now still mandatory in the finance structure of a mini-grid project, as
commercial loan rates in Sub-Sa-haran Africa have been reported to be at 15%–20% interest rate, which is unfeasible for this type of investment101.However, it is relevant to report that some recent projects and start-up companies are adopting less capital-intensive technologies
to engage in the rural electrification process, even if they represent a minority. The following types of systems are the most common ones: (i) DC distributed nano-grid, (ii) a mix of off-grid power plants for anchor loads and SHS for house-holds and (iii) small power capacity for powerbank recharge, coupled with water purification and 4G connectivity. In particular, this study analysed a private company that pro-vides DC distributed nano-grids in peri-urban areas of South African cities. The 2 projects built, owned and operated by this developer are ranked as the best in terms of profitability, even if the replicability of their model in other countries in Sub-Saharan Africa has to be analysed, especially considering the comparatively high tariffs charged for the various mul-ti-service packages that the company offers to customers, as mentioned above.Beyond the case studies analysed, two firms have been iden-tified for their successful business model: Devergy is one of the companies cited by USAID as an example of ones funded by equity102 that features modular installations below 10 kWp providing DC services, and Gham Power that is a RE-focused social enterprise based in Nepal. Their approaches are de-scribed in Box 2 at page 58.
recent projects and start-up companies are adopting less capital-intensive technologies to engage in the rural electrification


Lack of power for food conservation facilities forces fishermen to sell their catch by the lakeside – Kasenyi, Uganda

55
3. Integrated strategies to foster deployment of rural electrification projects
3.1. Productive use of electricity and water-energy-food nexus: links and opportunities
Access to modern energy is a necessary requirement for sustainable development and can be an enabler for poverty alleviation since it does not represent an end-good itself: it acts as an input factor to a large set of activities that can improve welfare, increase productivity and generate income. In developing countries energy is mainly required to pro-duce, transport, distribute and prepare food, as well as to pump, transport and treat water. Cities, industry and other commercial and residential users claim increasingly more water, energy and land resources and, at the same time, face problems of environmental degradation and, in some cases, resource scarcity.
For Sub-Saharan Africa’s poorest households, food can ac-count for 50% to 80% of total expenditure, compared with 7% to 15% in the average household in developed countries103. Where affordable energy can be provided, increases in pro-ductivity can be seen along with reduced food losses from better preservation and hence livelihoods improvement is enabled. Affordable energy access can also improve food processing and storage as well as increase value addition. Many small, remote rural communities remain without access to modern energy services due to poor road infrastructure and the national grid not yet having reached the area. Even where electricity distribution lines have been constructed, energy supply may be very unreliable due to frequent outages and unstable power quality. In such locations, diesel-generators are often employed to produce electricity, but since the cost
of the delivered fuel is relatively high, food production has become increasingly vulnerable to energy price fluctuations.
Reducing the dependence of the agri-food system on fossil fuels by utilizing renewable energy is feasible for on-farm ac-tivities such as irrigation, milking, cooling, vegetable grading, aquaculture production, food processing, packaging, dis-tributing finished food products, and cooking. Reduction of post-harvest losses by investing in dryers, cooling equipment, storage facilities etc., can have a large impact on the agricul-ture value chain. Access to electricity is needed to heat the air for drying, power the fans, run the refrigeration plants etc., and electricity is not always available on islands or in remote regions that distribution lines cannot reach.
Figure 23 – Opportunities for clean energy technology throughout agricultural value chains. Source: FAO 104.
Direct energy (electricity; mechanical power; solid, liquid and gaseous fuels) and Indirect energy (manufacturing of fertilizers, pesticides, machinery)
TRANSPORT & LOGISTICS- Warehouse- Road, railand maritimetransport
MARKETING & DISTRIBUTION- Packaging- Retail(supermarkets)
- Refrigeration
END-USER- Cooking- Transport- Householdappliances
Food (energy) losses
INPUTS- Seed- Irrigation/Pumping
- Livestockfeed
- Fertilizer
PRODUCTION- On-farmMechanization
- Reduction inHuman LaborRequirements
- IncreasedOperationalEf�ciencies
TRANSPORT- Farm toCollectionCentre
- CollectionCentre toProcessingFacility/Market
STORAGE AND HANDLING- Cold storage- Moisturecontrol
- Mechanizedsorting/packaging
VALUE ADDED PROCESSING- Drying- Grinding- Milling- etc.
Food
Energy
ENERGY OUTSIDE THE AGRI-FOOD
SYSTEM

RE-thinking Access to Energy Business Models
56
In such contexts, dedicated RE generation for the de-scribed productive uses presents an additional opportu-nity to provide much needed basic energy services to the local population. The land area required for RE mini-grid projects is usually relatively small, with the exception of biomass energy crops. Wind farms typically use a smaller portion of the total dedicated land area; small hydro run-of-the-river projects usually need only a small area of land for the turbine power house, canal and penstock, whereas small scale PV arrays can use building rooftops or roof shelters or PV ground systems which require around 1.500 square meters for 100 kW or could be installed floating solar-PV solutions combining energy generation with agri-culture to make land more productive.
RE based mini-grids can be a cheaper alternative in locations where the resources are widely available, although high up-front investment costs and low expected consumption can be major barriers: new electricity users in rural areas are the most unattractive market segment, due to low demand densities and a relatively higher fraction
of low-income households compared to connected areas. A detailed market assessment has to be carried out to properly ad-dress the energy needs related to any productive opportunities.
Peri-urban and rural areas are mostly dedicated to primary economic activities such as farming, which historically did not need electricity. In order to enhance the economic per-formance of a mini-grid investment, one should understand how crucial energy access is for agricultural value chains. For all agri-food chains, the value of the products tends to increase as more processing occurs and more inputs (elec-tricity, water, packaging materials) are consumed. Taking milk as an example, the energy used for producing, pasteurizing, and bottling fresh milk is around one-tenth of the total ener-gy used for cheese making105.
The electricity then can be used by businesses in the production, storage, handling, and processing of food products. Such “sustainable agriculture production systems” and “climate-smart food systems” can become pragmatic solutions for sustainable development and can also bring significant structural changes, improved livelihoods, and enhanced food security to rural communities in many coun-tries (Figure 24).
Figure 24 – Correlation between economic development and energy. Source: Kooijman-van Dijk, quoted by GIZ 106.
ECO
NO
MIC
DEV
ELO
PMEN
TEN
ERG
Y (E
LECT
RICI
TY)
Poverty reduction
Energy supply (adequate quality and quantity)
Generation of income or Gross Domestic Product (GDP);
other benefits (comfort of operation)
Energy consumption/use;adoption of appliances
(i) Changes in enterprise: Changes in productivity, quality, cost of production, prices, volumes of products, operating hours, employment; creation of new products or services
(ii) Creation of new enterprises
Incr
ease
in e
nerg
y de
man
dDespite the higher power capacity requested to run machin-ery and productive appliances, commercial loads perfectly integrate with photovoltaic-based generation plants since most of the demand can be satisfied through direct solar production during daytime. Irradiation is abundant almost everywhere in Sub-Saharan Africa, and this is also combined with water seasonal demand. In fact, water for irrigation is
“sustainable agriculture production systems” and “climate-smart food systems” can bring improved livelihoods, and enhanced food security

Integrated strategies to foster deployment of rural electrification projects
57
mainly necessary during the dry season, when solar availability is abundant.Consequently, there is no need to size systems with large batter-ies, since water can be pumped up during sun hours and stored in tanks until irrigation is neces-sarily deemed, usually in early morning or late evening. Since
plastic water tanks are cheaper than electrochemical batter-ies, they would be the preferred storage option. Drip irrigation systems are usually combined with solar mini-grid for water and energy efficiency (less water lost in the soil and therefore less energy required to move water).
Besides food processing machinery, for many small business-es in rural areas it does not make sense to operate at night, if there is no specific demand for their products/services during evening hours and the market cannot absorb an in-creased output. However, batteries cannot be completely avoided, since there is still night demand for public lighting as well domestic and commercial activities that rely on better lighting system to attract more customers107.
Although water pumping and food processing can be smartly combined with solar power, there are many other productive activities that can take place in an enabling environment, such as an electrified rural village. Motive power is arguably the most important one, since mechanisation and automa-tion typically allow achieving higher outputs at constant inputs (welding, carpentry, tailoring, etc.)
Quality and reliability of electricity supply is an important factor both for the decision to connect and for the impact on small scale businesses performance. In some countries the reliability is so low that electricity-reliant businesses have no choice but to invest in private diesel generators if they want to maintain business operations at a minimum level of steadiness. The resulting workflow interruptions and the damage of sensitive electrical equipment such
as computers caused by voltage fluctuations can curtail profits significantly. Therefore, a battery storage is nec-essary within a productive mini-grid to stabilize the grid voltage and frequency and to ensure power quality to income-generating appliances.Mini-grid projects and electrification can give a boost to the local business environment, opening opportunities for start-ups and new firms as well as partnerships across sectors. Value added processing activities and services, as well as manufactoring activities, previously not availbale in the local market, can be developed, generating additional income and socio-economic impact. A good example of this is given by the oldest mini-grid anal-ysed in this study, which was commissioned in 1986 in Tanza-nia, is the one that best applies an integrated business model based on the WEF nexus, in which the electricity supply is coupled with forestry, livestock and animal feed production as well as with water supply for domestic and productive uses; and it has been successfully operating for 33 years (see Box 5 at page 87).
All these effects lead directly or indirectly to higher produc-tivity, as less input is needed to produce the same output. This increased productivity might either lead to higher profits for business owners or higher incomes for workers. Electricity usage, thus, ultimately leads to income generation in the form of higher firm owner’s income, employment or wages. At the same time, higher incomes lead to better ability to pay and growing energy demand.
Besides productive uses, other activities can play a crucial role in the RE dissemination process. For example, public lighting can prevent crimes and enhance the perceived security level within a community, leading to a shared vision about the importance of the energy service. Public institutions also benefit from affordable and clean energy mainly in health and education sectors, contributing to improve livelihood. Having said that, productive uses and social institutions are both relevant to ensure a growing development of energy projects and finally to help customers becoming actively engaged with the role of energy for development.
The oldest mini-grid analysed in this study, which was commissioned in 1986 in Tanzania, is the one that best applies an integrated business model based on the WEF nexus

RE-thinking Access to Energy Business Models
58
Integrated business models based on WEF nexus-related services: a successful story from the Asian mini-grid sector
BOX 2
58
Organization profile
Gham Power Nepal Private Limited is a re-newable-energy focused social enterprise based in Nepal. Founded in 2010, Gham Power’s initial goal was urban electrifica-tion by providing rooftop solar to replace diesel backup systems in Kathmandu. Gham Power installed over 2500 solar-PV systems for a total capacity of 2.5 MWp, and soon after shifted its focus to under-served rural markets by 2013 to pioneer products that increase energy uptake among the rural population. In order to face the chal-lenge of responding to the varied impacts of climate change more daunting in Nepal (drought, forest fires, flooding), Gham Pow-er mainly focuses on rural agricultural areas where crop yields are limited due to lack of irrigation and agro-processing.
Partnerships and financing
Gham Power has been partnering with local government entities since it was launched, and with various multinational agencies in the start-up phase, such as microfinancial co-operatives, UNCDF, GIZ and ADB.Gham Power also activated an innovative financing tool, the Off Grid Bazaar (OGB). It is an interactive online platform to scale the implementation of off-grid solar-based projects in rural Nepal by blending debt and grants. It lists pre-qualified projects that investors can directly fund, and mon-itor their results online. It is therefore based
on the crowdfunding concept, and it is able to align incentives of key stakehold-ers in a fragmented market: beneficiaries (farmers), solution providers (contractors, equipment/service providers), financiers (commercial banks, MFIs, private investors), policy makers (institutions and internation-al agencies).To date, OGB is used to endorse produc-tive-end-use agro-processing systems, which are customized solutions for rural smallhold-ers joined to benefit of a common service (e.g. solar irrigation). However, the tool is planned to be extended to other types of projects such as mini-grids.
Mini-grid business model
Gham Power’s portfolio comprises products and services based on the productive use of electricity in the rural agro-business sector, and also includes the first solar micro-grid in rural Nepal, commissioned in 2015 after two years of project development. So far, 7 solar micro-grids for farming communities have been activated and they represent one of the core business activities of the company. The micro-grids Gham has installed to date fall in the range between 15 kWp and 31 kWp solar-PV power installed, except one of 5 kWp.The project applies a hybrid private-commu-nity ownership model, in which Gham is the majority owner but individuals from target villages have the possibility to become
shareholders based on either cash or in-kind contributions. The business model foresees to install a power generation plant and its distribution grid to activate both a rural economic hub and off-taker connections. The hub is a kind of a multi-service station, where agro-business and commercial activ-ities are enabled thanks to service provision, such as food processing and conservation, water irrigation, laundry and internet café. However, since the demand management strategy gives priority to the rural economic hubs and anchor loads, if any, such as BTS tower, other potential off-takers requiring PUE have a restricted service availability, meaning that maximum power or time of use may be limited. In conclusion, it is an integrated business model based on WEF nexus-related services, where there are both revenue streams from multi-service hubs and revenue streams from electricity sale to off-takers (mainly domestic or commercial customers). Gham Power de-velops such projects through a built-own-op-erate (BOO) operating model and manages the O&M activities through its local staff that is properly trained during the project imple-mentation, and a regional manager.It is relevant to highlight that the Gham Power’s action is strongly based on data collection and monitoring: evidences from the field are crucial in driving the business planning, just as they provided inputs to inspire the business model evolution over the time. Energy demand assessment and consumption monitoring are coupled with agri-advisory services, which are provided pro bono to local farmers as part of Research&Development activities of the company, even if they could be a potential new business in the future.
Lessons learned
■ Multinational agencies played a key role in supporting business model piloting and

Integrated strategies to foster deployment of rural electrification projects
59
Integrated business models based on WEF nexus-related services: a successful story from the Asian mini-grid sector
59
the company start-up phase through grant financing. But why are grants so vital in rural electrification projects? Firstly, Gham Power understands that they are particu-larly needed up to the first scaling-up phase in order to generate success based on real operational metrics and repayment data. This will create confidence, reduce perceived risk, and catalyze further private investment for future projects. Secondly, grants allow to diversify the projects, de-risk investments, increase Gham Power’s decision making and enable the selection of farmers with different farming tech-niques, location, socio-economic status, etc. which give broader understanding of the market risks and opportunities.
■ Even if the mini-grid financial sustainability is mainly based on the multi-service station, providing access to electricity to domestic and commercial off-takers living in the target area is crucial to ensure the project acceptance and pursue a community par-ticipatory approach.
■ O&M activities carried out through local staff supported by a regional manager result to be suitable for a small number of mini-grids (7 operating). However, an increased number may become challenging and, depending on the context of intervention, alternative solutions should be taken into considera-
tion, such as stocking up on spare parts in the micro-grid itself and/or conducting capacity building trainings to increase the capacity within the technical staff.
■ With regard to complementary activities to support the project sustainability, Gham Power usually carries out only trainings during the project implementation to po-tential technicians to be hired as local staff and agri-advisory services to local farmers. However, it recognizes that the project impacts would benefit from additional complementary activities, such as support to local entrepreneurs and awareness campaign for target communities. These activities have not yet been included representing an unsustainable extra-cost in piloting small-size mini-grids but they are planned to be added in the scaling-up.
■ Bundling three or more villages (mi-cro-grids) together under a single commer-cial entity has lowered transaction costs, business registration costs, and filing of business tax documents. It also helped to create a relatively larger portfolio, potential-ly attractive for future institutional investors.
■ The special purpose vehicle (SPV) also had community investors as partners in the project, which was crucial in engendering a sense of ownership amongst each com-munity.
■ The idea of bundling three villages and sharing the ownership between three dif-ferent villages was a complicated process to manage due to not balanced generating revenues among villages and future invest-ment related decisions.
■ Community investment as shareholder might be vital in engendering a sense of ownership among the villages, but from Gham’s prior experiences managing com-munity ownership in the decision-making process has been difficult, at least in Nepal where community representatives so often represent interests of political institutions.
■ Strong anchor loads such as mobile towers are vital in generating a significant revenue. Their reliable operation also in-centivize the adoption rate of mobile data by the local users: people are very keen to use internet services after the installation of the mobile tower and the percentage of mobile internet users has grown from 3% in the baseline survey to 37% in one of the projects.
■ The smart meters’ results were very helpful in collecting operational data, and it would have been difficult to collect data without them. Despite their high commercial price in the past, they have become more affordable, and their performance justifies the higher costs than standard meters.

RE-thinking Access to Energy Business Models
60
3.2. Customer management and payment systems
Global System for Mobile communication (GSM) coverage in Sub-Saharan Africa boomed in the last years, experiencing a very rapid growth that shortly outpaced the development rate of other infrastructural services, such as access to electricity and to improved water and sanitation. It is estimated that in 2017, 2G coverage reached over 90% of the population in the area, whereas broadband network access is still lacking for around 400 million people108. Data from 2014 suggests how 59% of the off-grid population in Sub-Saharan Africa is covered by mobile networks but lacks access to electricity 109. It is important to note the interconnection between energy and connectivity access, since power is involved in all the steps of the connectivity value chains, from powering telecom towers to recharging the phones of the end-users. Therefore, the spread of connectivity is ham-pered by lack of power, whereas, when present, it can greatly facilitate energy access initiatives, for instance by enabling mo-bile money payments. In fact, Sub-Saharan Africa is the leading region in the world in terms of mobile money customers, even if it’s very uneven across its region: in 2017 the total number of mobile money accounts was distributed for 56.4% in East Africa, for 30.9% in Western Africa, 9.7% in Central Africa and 3% in Southern Africa110. This scenario has to be clear to developers of decentralised RE systems as it can have multiple repercussions on the business model they adopt. Lack of internet coverage can be seen as an opportunity in the provision of connectivity services (e.g. with temporary 4G vouchers) since it can consti-tute another revenue stream integrated in the off-grid business model. On the other hand, connectivity unlocks the possibility of PAYG (with the meaning of pre-paid systems allowing cus-tomers to pay only for the electricity they consume, as used by World Bank111) or second-generation prepaid systems that can be operated entirely via mobile and it doesn’t need magnetic or scratch cards. In conclusion, mobile money payments are an op-portunity but should be carefully employed by considering the effective penetration in a given area. Also, their adoption might rise issues about affordability, considering that the operator can apply to a transaction a significant additional component of the incurred cost112. Even if a prepaid electricity system comes at a higher investment cost, the operator has the benefit of eliminat-
ing the risk of non-payment and the cost associated with meter reading whereas it helps the users to better monitor his expenditure, and typically avoids or reduces the need of an initial deposit113.Having access to internet also has an impact on the technical solutions that can be adopted in a RE system; real time com-munication between the various components of the system can enable the adoption of advanced dispatching strategy and advanced demand side management techniques in-volved (see section 4.1). The mini-grid sector as a whole is currently taken aback also by the lack of data collection and management done on the operating system, and when pres-ent it is often fragmented and unreliable. A remote monitoring system of a mini-grid should be considered a must for new and existing projects, so that operators can check the status of the various assets and continuously monitor customer data. Data on actual energy consumptions, adoption of appliances, issues with payments, customer satisfaction and so on should be readily available and cross-referenced with baseline data obtained in the preliminary development stages to fine-tune the parameters of the business model adopted.With reference to the results of the analysis conducted in this study, the most common payment systems are PAYG systems and monthly payments, accounting for 53% and 47% of total cases analysed respectively. Among those ap-plying PAYG systems, only 27% use mobile payments, and among those applying monthly payments there are 2 cases with special customer-based solutions which allow tailored payment deadlines and periods. Furthermore, the customer management of the mini-grids analysed can be described in brief through the following key aspects: operational structure, supporting equipment and tools as well as technical and management constraints.On one side, the operational structure foresees local mainte-nance staff for all the case studies, even if technical expertise of local personnel differs case-by-case and they are usually supported in case of extraordinary maintenance. On the other hand, remote management, which consists of software and
59% of the off-grid population in Sub-Saharan Africa is covered by mobile networks but lacks access to electricity

Integrated strategies to foster deployment of rural electrification projects
61
hardware to monitor and manage data electricity generation, supply and payments, is applied by 48% of the total cases, which includes all the private initiatives and all the cases that apply the most promising business model, build-own-operate (type A), as discussed in section 2.3. Despite the expectations, there is no a clear correlation between remote management and payment systems, but it must be underlined that their application mainly depends on the developer or technical ad-visor’s choice and less on the project ownership. In fact, PAYG systems are used in all the mini-grids in West Africa having Trama TecnoAmbiental (TTA) as technical advisor but all of them have a local O&M, except for one, and a public or hy-brid ownership model. Similarly, the non-profit organization ACRA installed PAYG systems (as defined in section 3.2.) in a very remote mini-grid, which is fully owned, maintained and managed by a local company, properly shadowed during the start-up phase.Among PAYG systems, installing a mobile pre-paid payment system, despite having a higher investment cost due to the use of smart meters instead of (cheaper) traditional meters, has three main advantages from the management point of view: (i) to eliminate costs associated with meter reading and billing, (ii) to avoid missed payments and efforts to deal with users’ arrears (iii) to improve customer assistance and control, reducing risks of electricity theft. Furthermore, smart meters allow to create a well-structured data management, which plays a crucial role for access to finance, optimization of the mini-grid design and scaling-up strategy (see section 3.3).
Whereas first-generation prepaid systems require a local ven-dor to top-up the credit of the magnetic card that is used to activate the meter, using mobile payment allows to disinter-mediate completely the purchase of “credit”, while also giving access to very granular user data made available by the service provider. Evidence from this study shows how the user base that regularly purchases electricity is a subset of all the con-nected users, meaning that not all of them purchase electricity every month depending, for instance, on the seasonality of their income. This requires a customer risk-reduction allowing them to sustain an expenditure for electricity consistent with their ability to pay and, on the other side, it opens up possibility
of employing tailored customer care strategies to keep the user base engaged and active. For instance, among the case studies analysed, those developed by DCGO in South Africa allow users to schedule payments according to their income cycle (e.g. users with salary pay at the end of the month, while those receiving governmental grants pay at mid-month). The company also found a way to adapt mobile PAYG systems to a local market which is not familiar with mobile solutions, by establishing vendor agreements with existing trading stores that awarded a commission on an electronic wallet at each sale of DCGO service to users.
3.3. Complementary activities: investing in local communities to enhance project bankability and sustainability
In the development process of a mini-grid, several factors and data contribute to design a technical solution that is consid-ered financially viable. The electricity demand pattern is nec-essarily affected by several factors including socio economic and environmental factors by which the pattern forms diverse complex variations. Keeping in mind that every target com-munity differs from one another in terms of needs and context conditions114, complementary activities represent a means for engaging local communities, promoting community inclu-sion and pursuing the project sustainability. In fact, access to energy by using off-grid systems results in favourable solutions when coupled with targeted support to local potential capac-ities and opportunities through capacity building115 and other type of supporting initiatives.
They mainly consist of activities not strictly necessary to activate the electricity supply services. However, even if the project could technically achieve its objective to install the infrastructures and activate the electricity sale service, it is barely able by itself to mitigate relevant implementation and
Complementary activities represent a means for engaging local communities, promoting community inclusion and pursuing the project sustainability

RE-thinking Access to Energy Business Models
62
investment risks as well as to achieve other project objectives related to socio-economic aspects.In order to provide an overview of complementary activities in rural electrification projects, with reference to the analysis’ results conducted in this study, the most common ones are: businesses incubation, awareness campaigns, technical trainings, other ca-pacity building activities, microcredit support as well as knowl-edge and data management, which differs from others being an activity directly targeting the developer’s benefits instead of local beneficiaries, indirectly affected by related effects.
17 case studies analysed include complementary activities, representing 81% of the total. The remaining 19% is only com-posed of cases which apply a business model classified as B.7 in section 2.1.2 (build-own-outsource, with only electricity supply). The activities carried out are the following: 5 projects carried out business incubation programmes, 13 awareness campaigns, 14 technical trainings, 11 other capacity building activities, 1 data management and 0 microcredit support and knowledge man-agement programmes, which would, instead, strongly support existing and potential local entrepreneurs (Figure 25).
Figure 25 - Complementary activities in mini-grid projects.
1413
11
5
1
5
0
7
14
21
Technical training
Awareness campaign
Other capacity
building act.
Business incubation
Data management
None
N° o
f cas
e st
udie
s
Type of complementary activities
Once the terms of the discussion have been clarified, the crucial question is: what kind of outcomes are expected in a mini-grid project by implementing complementary activities? The purchasing power of the potential market is expected to increase thanks to the promotion of income-generating activities focusing on energy consuming businesses as well as business and employment opportunities. Such approach empowers the targeted communities while boosting de-mand for electricity, resulting in a mutual positive effect for off takers and utilities. This is particularly relevant for local economies based on agricultural activities, where there is typically an unexploited potential in food processing busi-nesses. A set of impact indicators are usually developed at
the beginning of the project to monitor the effect of such activities and provide economic evidence of the added value from a business perspective. An upgrade of the standard M&E activities is represented by the Social Return on Investment (SROI) analysis (see section 3.4).The study carried out reveals evidence of economic and financial effects of complementary activities. Looking at the ranking based on IRR, the top-12 have implemented comple-mentary activities. Among the rest, the last 5 have also im-plemented complementary activities, but their low financial performance is strongly hampered by the national electricity tariff plan adopted, despite of contrary technical advisory, and they operate in steady loss (see section 2.3).

Integrated strategies to foster deployment of rural electrification projects
63
In order to implement an effective complementary activities programme, the key aspects to take into account are the following:
i) identification of expected outcomes and impacts during the project design as well as indicators to be monitored;
ii) accurate selection of actors involved and related responsi-bility that can be summed up in a project operation chart;
iii) accurate activities’ scheduling since timing strongly af-fects their effectiveness. Complementary activities have to be coordinated with construction of the infrastructures and activation of the services, as a wrong timing could hamper the start-up phase by reducing customer en-gagement and the economics;
iv) distinction between activities to be carried out during the implementation phase and those to be carried out dur-ing the start-up phase, since evidence from the analysis strongly advise follow-up activities to reinforce both the market and O&M management of mini-grid, particularly in the first year of operation;
v) identification of challenges and external conditions that may affect the expected outcomes. In addition, a risk analysis on the correlation between complementary activities and response of potential market to such supporting programmes is recommended.
Complementary activities come with a cost, but the devel-oper should consider them a positive investment and clearly identify what kind of benefits they could entail. From one side, by investing in the final off-taker the project aims to grow the energy demand in the mid-term, so as to increase energy sale and foster the mid-long term commercial sustainability of the business. On the other side, it is an additional financial risk as it increases CAPEX (usually of about 5-15%). However, complementary activities may represent a project’s strength for access to financing sources, which pay particular attention to SDGs achievement and impact indicators at mid-long term, since the value propositions could include effective marketing campaigns and customer care services, which considerably affect the start-up phase of the business (see section 2.2). In fact, in recent years, the majority of fund-
ing programmes promoted by international cooperation agen-cies, development banks, foun-dations and public institutions have recognized energy and its productive uses as key drivers for local development and have required and promoted the integration of complementary activities to support access
to energy. In this perspective, the more a developer is able to prove the effectiveness of its strategy to both ensure the business sustainability and achieve a notable impact on the ground, the more it increases its competitiveness in accessing finance. Therefore, in order to justify the capital extra-costs due to complementary activities, on one side the project’s financial plan should show their added value in terms of economic ef-fects such as increased revenues or reduced operational costs and, on the other side, impact indicators should reflect bene-fits ascribed to such activities. As mentioned before, the SROI analysis aims at supporting this approach (see section 3.4).
With a view of sustaining access to finance and encouraging the involvement of other sectors such as microfinance entities and ICT companies, the study reveals that the crucial role of a well-structured knowledge and data management is underes-timated. This is a weakness of most of the projects whereas it should represent a must in the rural electrification sector, where different levels of uncertainty are the key barrier for access to finance and to ensure projects’ sustainability and viability.
3.4. Social Return on Investment: monetizing socio-economic and environmental benefits
The traditional method to estimate the financial returns of a mini-grid project is to use a financial model and outline main metrics such IRR and ROI. Both can serve to represent the average annual return of an investment and can be used ei-ther as a forward-looking estimate of performance or a back-ward-looking evaluation of a completed investment116. When used together, both metrics can provide valuable insights into
The more a developer is able to ensure the business sustainability and achieve a notable impact the more it increases its competitiveness in accessing finance

RE-thinking Access to Energy Business Models
64
an investment’s past or potential future performance: while IRR is better suited for evaluating potential long-term invest-ments, ROI may provide a sufficient “back of the envelope” picture for shorter term investments. From the energy point of view, the indicator Energy Return On Investment (EROI) is widely used to estimate the energy flows linked to an initiative. EROI can be defined as the of the amount of usable energy (the exergy) delivered from a particular energy resource to the amount of exergy used to obtain that energy resource; for example, distributed mini-grids with proportions of solar-PV up to 50% of annual generation can exceed the EROI of some fossil-based traditional centralized grid systems117.
IRR, ROI and EROI metrics can be of limited use when evalu-ating mini-grids for rural electrification since they fail to take into account impacts on social, environmental and economic factors. Social return on investment (SROI) is a systematic ap-proach that attempts to holistically define whether investing in a mini-grid is beneficial and profitable not only to the devel-opers but also to the community of interest. Though it has its own complexities, SROI for mini-grids can be used to design a business plan, better understand the target group, enhance the customer value proposition and assess to what extent impacts are realized or changes need to be incorporated in the business plan.
The SROI method helps to build on the existing financial model of a mini-grid project by introducing social, environmental and economic indicators and monetizing them to arrive at an enhanced overall return that includes financial with the other aforementioned parameters. This perspective ideally opens new opportunities and will form the basis for innovative invest-ments that will genuinely contribute to a positive social change.
Behind the overall “access to energy” goal, there are more impacts from renewable mini-grid projects, such as business stimulation, environmental protection, job placements, and enhanced know-how. Impacts can be looked at and situated at different levels. They can be differentiated, for instance, on a content level (economic, social, political, environmental, cultural), a structural level (micro, meso and macro) and a tem-
poral level (short-term, mid-term and long term). The model design must be structured enough to be able to verify the strategic objectives of an intervention, but simple enough so it can be performed with acceptable costs and methodolog-ical rigour. An example of expected outcomes in a mini-grid project applying the SROI approach is given in Table 8.
Table 8 - Example of expected outcomes in a mini-grid project applying the SROI approach.
Aspect Outcomes
Social Direct job creationEnhanced gender equality and empowermentEnhanced literacy and earning potentialImproved public healthcare, safety and securityTime saving (cooking, washing, collecting fuelwood)Improved access to informationStrengthened food security
Environmental Reduced dependence on fossil fuelReduced waste disposalReduced air pollutionResponsible use of natural resources (land, water)
Economic Value creation through productive use, also increased productivity in home businessesAccess to creditIncreased savingsLivelihood enhancementIncreased consumption of electricitySaving on governmental subsidiesSaving on main-grid extension
The complex interactions and synergies between multiple de-velopment factors, including other infrastructure investments close to electricity, as well as enabling political, socio-economic and cultural conditions, pose major methodological challeng-es to isolating and quantifying the impact of electrification.
Finally, the SROI stands as a powerful tool for an in-depth analysis of the overall impacts of given mini-grid projects, bringing an innovative outlook to highlight hidden impacts and therefore involve other stakeholders.

BOX 3
65
Small-size micro-grids for low-income rural people: a successful low-risk approach from the Tanzanian energy sector
Organization profileDevergy is an energy service company that provides affordable and reliable energy to low-income people in rural villages not connected to the power grid. Founded in 2010, operations began in 2012 with the aim to empower people in developing countries by selling electricity and making modern and aspirational appliances accessible and available through lease-to-own arrange-ments. To date, Devergy is fully dedicated to the Tanzanian rural market and is proud to be at the forefront of innovation in solar micro-grid technology by delivering energy in an easily scalable, efficient and affordable way.
Partnerships and financingDevergy, thanks also to its holistic model including technical, financial and social impact goals, has been financed by several investors and donors that comprise impact funds, international cooperation agencies and funds, charity entities and private inves-tors, such as USAID, EEP, Vulcan, Persistent, Acumen, Opes, Heri Africa, AECF, DOEN Foundation, GSMA.
Mini-grid business modelDevergy’s portfolio is composed of small-size solar micro-grids in a range of 5 to10 kWp per site for a total of about 100 kWp in-stalled and 1000 connections. Even if modu-larity and scalability is an inherent feature of solar-PV plants, Devergy actually manages its assets in a dynamic way, upgrading the main plant’s components following the energy demand of each site with a short-term horizon in order to optimize the total assets installed. It managed to overcome the problem of over/undersizing the power plant by keeping the capacity of the grids at the minimum necessary to provide exactly the energy its customers need. Solar panels are installed on top of solar towers and DC energy is stored in a battery
within the towers, which are distributed along the village to serve customers through a distribution grid of maximum 1km length. Such a small-size plant is possible because of the use of DC electricity supply travelling for a short distance and coupled with high-effi-ciency DC electrical appliances. So the tech-nical solution, as well as the business model, is based on the energy efficiency both in the power generation plant and in the electrical appliances provided to customers. As per the business model classification based on services provided, Devergy applies an integrated business model providing electricity supply & other energy-related products/services, where there are both revenue streams for electricity sale to off-takers and for sale of DC electrical appliances. However, the latter does not represent a relevant source of profit due to logistic concerns in remote areas, but it is necessary because of the technical solution adopted. Business is developed through a built-own-operate (BOO) operating model, in which the very simplified O&M activities are managed through local technicians monitored and remotely supported by technical experts based in Dar es Salaam, where the headquarters’ staff is exclusively local.Thus, the focus has not been on the produc-tive use of electricity for the last years, even if Devergy has been recently exploring the introduction of DC refrigeration systems,
mainly in but not limited to villages already served by their micro-grids. Water-energy-food related services are not part of the business and are not a nexus integrated in the value proposition even if the company is analysing such aspects and is willing to work on them in the future.
Lessons learned
■ The keys of the Devergy’s business success reside in energy efficiency and advanced energy demand monitoring. As smart me-ters result to be crucial to effectively moni-tor the energy demand, Devergy decided to invest in the product development, which is currently installed in all the customers’ houses.
■ The recent business activity on DC refriger-ation systems has emerged following the electrification of about 20 villages and due to increasing regulatory and political risks in Tanzania in the last year. Thus, a focus on fostering anchor loads to strengthen existing micro-grids is both an opportunity for piloting a new business line for the company and to waiting for a clearer polit-ical framework before investing in further assets.
■ Customer satisfaction is recorded at 94%, however it is not considered as a goal from the national authorities, which give priority to the installed capacity instead of commu-nity acceptance of Devergy’s projects. Since this approach has been emerging more in

Small-size micro-grids for low-income rural people: a successful low-risk approach from the Tanzanian energy sector
66
the last year, it may reflect a new political strategy.
■ It must be specified that, on one hand, such small-size micro-grids provide a restricted compatibility with PUE since only high-efficiency DC equipment can be powered; on the other hand, the most common activities in low-income com-munities based on agriculture economy are feasible by using ad hoc machineries provided by Devergy. However, an accu-rate field work to technically enable such
activities as well as to properly meet cus-tomers’ expectation is required.
■ The pricing strategy is similar to mobile phone airtime. It is based on combined tariff plans, in which a bundle allows for an amount of kWh within a given time (e.g. 10 kWh in 1 week) and additional kWh are consumption-based. There are different bundles per each consumption tier (1,2,3). Since Devergy’ energy services comprised both electricity and devices’ supply, sup-porting each customer to select the best
bundle to meet the energy requirements according to devices used is fundamental. A remote customer care service has been activated to support all the Devergy’ cus-tomers.
■ Since it is quite peculiar with respect to the most of projects, the pricing strategy does not distinguish among domestic and business use of electricity. In the small-size systems applied, each customer adopts a customized solution by selecting electrical devices and tariff bundles accordingly.


Micro-Grid Academy’s practical training on small-scale PV systems held at St.Kizito VTI – Nairobi, Kenya

69
4. Technical analysis of RE mini-grids and productive use of electricity
In this section a general introduction to technical aspects of mini-grids is given, followed by more detailed technical requirements for mini-grid design with a focus on mini-grids with added PUE services portrayed on selected case studies among the ones included in the study.A mini-grid system is defined by the World Bank as an isolated, small-scale distribution network typically operating below 11 kilovolts (kV) that provides power to a localized group of customers and generates electricity from small generators, potentially coupled with energy storage systems. It consists of three sub-systems, namely (i) generation, (ii) distribution, (iii) end-user.
i) The generation part is composed of energy generation components, a management system, and potentially battery storage and inverters. The most common power generation sources are solar-PV, biomass, wind, hydro-power, diesel, or hybrid systems using a combination of the above. Inverters need to be used whenever the generator produces direct current (DC) and alternating current (AC) is preferred for the distribution system and appliances. An inverter therefore may not always be present in a mini-grid system if DC distribution and appliances are the preferred option. On the other hand, a management system is an essential part of any mi-ni-grid and has the function of measuring, monitoring and controlling the electrical load together with the generator and energy storage. The information gathered is also useful for decision makers on how to manage the system and/or if there is any need of expanding it. Smart metering will be an increasingly common component of a management system as it allows more detailed analysis of the load profiles as well as remote metering. Storage will be needed whenever intermittent (or non-dispatch-
able) generation sources are used such as wind or solar that produce only when the resource is available and not when there is demand for electricity. The most common types of storage seen in these applications are pumped hydro or battery storage. In such cases, storage will be es-sential to “time shift” electricity dispatch in order to make sure it meets user demand. When a diesel generator is part of the mini-grid system, then battery storage is often not employed, although co-location of diesel generators and energy storage can be advantageous, as it allows for higher utilisation of the solar-PV generator and for smaller diesel generator capacities, which is an environmentally improved solution and can be cost-optimal, specifically where diesel supply is more expensive such as on islands.
ii) The distribution part is composed of the distribution network as well as step-up and step-down transformers where a medium voltage (MV) line is needed and is used to connect the generation plant to the consumers. Distri-bution systems can use a range of different voltages (low or medium voltage lines in mini-grids), can be AC or DC, and can be single or three-phase. The choice between all the options available will depend on the specific project such as size of the mini-grid, distance from generation to consumers, type of consumers (residential or commer-cial/industrial) and will ultimately aim at minimising cost while also keeping in mind potential future expansion or potential connection to any existing electrical grid (“fu-ture proofing”).
iii) The end-user system is composed of the “last-mile” connections to consumers to use and monitor the pro-vided energy. Metering is one of the basic functions of this system, together with protections to ensure health and safety (H&S) conditions to users and that hard and software components are not damaged. End-user sys-

RE-thinking Access to Energy Business Models
70
tems may differ substantially depending on the specific use of electricity and type of end-user (e.g. industrial or residential).
There are a number of technical benefits associated with independent mini-grids as compared to grid connected solutions:
■ mini-grids are often quicker and easier to deploy in remote rural areas compared to transmission infrastructure originating from central power plants;
■ localized deployment of energy dispatching equipment, such as battery storage or diesel generators, allows for a more flexible control of the energy provision for small independent power producers (IPPs) and reduces inefficiencies of central baseload power plants running on part-load during the night;
■ avoiding the need of long transmission lines and infrastructures also typically reduces line losses due to the proximity between generation and end use of the electricity;
■ mini-grids can provide more reliable services than those provided through national grids, which recorded 8.9 power outages in a typical month of 2017 in Sub-Saharan African countries, which is a high value if compared to 2.2 recorded in Latin American & Caribbean countries or 0.6 recorded in European countries118;
■ mini-grids allow to implement tailored technical solutions to meet customer needs and better technical assistance to customers with respect to national utilities.
As well as advantages, a number of challenges can be identi-fied in relation to mini-grids:
■ the correct evaluation of current energy needs, predicting their potential increase in electricity demand over time, is crucial to adequately design the infrastructure as well as the business case;
■ it is essential in this respect to consider future expansions of the mini-grid to keep up with the increase in demand (some mini-grids may end up being connected to a centralized network at some point in the future as well, hence it would be prudent to consider this scenario from the very beginning);
■ because of their size it is likely that there will be limited redundancies on the system, meaning that a single failure could have a significant impact on the reliable supply of electricity;
■ limited storage sizes lead to intermittencies of supply if another means of generation, like a diesel generator, is not integrated as well;
■ the lead time to procure spare parts, in case of major breakdowns, is an issue to be taken into account given the remote location;
■ local skilled labor, specifically trained to manage the asset, may be another issue that has to be considered at early stage to avoid incurring in significant problems with operation and maintenance of the systems.
4.1. Technical requirements
The technical design is a challenging task that must take financial, regulatory, socio-economic and environmental issues into account. Preliminary activities usually deal with regulation in force, potential sources of finance and so-cio-economic and energy need assessments of the specific site by means of well-structured survey methodologies119. Based on that and the type of business model, the energy demand can be estimated and used as input for the systems engineering, which enables to verify the financial viability of the project with a view to pursue the techno-economical optimum design. The estimation of the total demand requested by end-users over the years is an essential task for developing a successful mini-grid, but very challenging due to the socio-economic and geographical characteristics of the specific commu-nity. In particular, load growth can be even much higher than 6-20%/y in the first years, according to the collected case studies, and this can seriously affect the design and profitability of the system. In fact, an overestimation of the demand can easily lead to financial underperformance of the project, while an underestimation can affect the quality of the service, problems within the community, difficulties with upgrades at later stage and failure of the project120. Aiming at estimating the load profile and its growth,

Technical analysis of RE mini-grids and productive use of electricity
71
proven methodologies based on bottom-up approaches should be applied. They should assess socio-economic and environmental factors such as demography, occupation characteristics, income, geographic location, proximity to key locations as well as current behavior on energy con-sumption and expenditure, related unsatisfied needs and potential growth. In particular, since surveys alone often do not provide an accurate estimate as people may not answer precisely enough121, methodologies combining multiple data collection methods are recommended to input reliable results into the technical design. Lastly, considering that commercial and PUE activities are main drivers both to load growth and economic empowerment of rural communities, approaches fostering local development, such as the WEF nexus, aimed at promoting additional income-generating activities that increase the profitability of the project, should be taken into high consideration and thus be included in the technical design of the mini-grid.In this chapter, the main challenges related to the technical design are treated.
4.1.1. Generation systems
The power generation plant should be tailored according to the energy sources locally available in order to optimize investments, the operating costs and the technical perfor-mance. All RE sources require high capital expenditure but enable strong reductions in operating costs with respect to standard fuel-fired generators. Such fossil fuel generators have polluting emissions, low efficiency especially if op-erated in part load (maximum efficiencies about 30%122), a hardly foreseeable OPEX dependent on the fuel price, and overall higher operating costs (about 0.3 USD/kWh with a fuel price of 1 USD/l at maximum efficiency 123). Figure 26 shows the levelized cost of electricity (LCOE) for different RE technologies. As can be seen, these are already in the range or below values of fossil fuel generators. In particular, small-hydro plants usually have the lowest LCOE, followed by wind turbines where average wind speed is higher than 4-5m/s 124, but both sources are very site-specific and require on-site measurements for several months at least
and ideally over one full year. Instead, photovoltaic source is largely abundant in Sub-Saharan Africa with average global irradiance levels usually well above 1500kWh/m2
125, but the variability is higher in rainy seasons of equatorial regions. Biomass sources can be another suitable option in the prox-imity of food processing activities126, but the technology is more efficient to provide thermal energy, requires higher maintenance and is still expensive compared to other RE technologies.
Figure 26 - LCOE of different technologies. Source: IRENA.127
Battery storage is often coupled to the power systems to defer the electricity generation from renewable sources or to increase the efficiency of fuel-based generators in hybrid power systems are generally sized to provide 1-3 days of au-tonomy128. In the technical design, a trade-off between instal-lation costs and the battery lifetime must be performed to improve optimal lifetime and techno-economic performance of the generation plant as a whole. That is why sometimes cheaper batteries with limited lifetime are preferred to more expensive but long-lasting batteries to reduce project risks by decreasing CAPEX, as shown in Figure 27. Therefore, all sound technical system design tools should be informed by an overarching lifetime cost model that includes component degradation, lifetime, specific OPEX and future cost projec-tions for the technical equipment.

RE-thinking Access to Energy Business Models
72
Figure 27 - Battery costs by technology. Source: IRENA 129.
Therefore, given the estimation of the demand and the energy resources available locally, developers should use design techniques to identify the optimal solution of the system that minimizes the cost of the energy sold or, in other words, the best option aiming at getting the lower ratio USD/kWh sold. For this purpose, software suites such as HOMER, RETScreen and Hybrid2 are commonly used in sizing rural mini-grids130 and especially HOMER also allows to simulate the multi-year performance of the system, but without considering future upgrades131. Instead, recent research approaches accounted for uncertainties in de-mand and renewable sources whilst others also proposed the multi-year planning of the system including possible upgrades or extensions of the generating assets, as the de-mand grows and as uncertainties in the load become clear-er132. Furthermore, other methods like REM133 can provide the full design of the network and the generation plant, using GIS data and the technical characteristics of a range of possible components to install. This model however is not yet a commercialized product and it only considers a 1-year horizon. Finally, another design option to consider could be that the distribution system only covers a portion of the village, while other more remotely located house-holds could be better served by home systems or a central recharging station134.
4.1.2. Distribution systems
The type of power distribution technology, Alternating Cur-rent (AC) versus Direct Current (DC), affects system safety, the type of appliances customers can use, electrical losses and the readiness of the mini-grid to be interconnected to the national grid. The choice between AC or DC distribution mainly relates to the loads to be served. If the main uses of the mini-grid are lighting and charging and the energy source is mainly DC like solar, DC distribution can be most suitable. DC systems are simple to manage and usually safe, if the distribution voltage is kept low (e.g. lower than 60V135). Furthermore, the maximum transfer capability can be more than double with respect to comparable AC distribution sys-tems136. However, protection devices are more expensive and any future connection to the national grid will be more com-plex. Without additional inverter technology, a DC system further prevents the use of standard AC appliances, which are usually much cheaper thanks to the large amount of units sold137. The potential higher cost of DC end-user equipment can result in barriers to consumption. The business model should thus be tailored accordingly to mitigate or overcome these constraints. For instance, the private company DCGO also provides specific DC appliances and inverters in addition to the electricity sale in South Africa,

Technical analysis of RE mini-grids and productive use of electricity
73
as better explained in section 4.2.3, with a view to favour PUE and the use of some appliances for domestic purposes. Even though they come at a higher cost than commercial AC equipment, potential customers have been assessed to be able to pay for all-inclusive service packages (electricity plus DC devices provision). At current market conditions, DC sys-tems can be competitive with AC systems for small mini-grids with a peak demand of few kWp, mainly based on solar and battery storage. The design of AC mini-grids can be either with a single-phase or three-phases. Three-phase distribu-tion is particularly suggested when there are a number of heavy loads for PUE or other energy-intensive loads for other commercial or public services, that can be revealed by the ex-ante assessment where diesel generators are already used. Moreover, three-phase systems are easier to expand and bet-ter prepared for a future connection to the national grid. On the other hand, single-phase distribution is simpler as it does not require any balancing of the load between the phases, but it’s usually not convenient for large mini-grids because of notable energy losses due to overheating of electrical cables. Typical mini-grids distribute only on low voltage lines, but in case of dispersed communities or large target population, MV lines can be used, usually operating at 10-11 kV, as for the case studies of Matembwe and Ikondo in Tanzania, where MV lines 19 and 48 km in length respectively were interconnected and LV lines being supplied by 15 step-down transformers. Of the 21 case studies collected, only 4 installed MV distribution line and have the following common features: (i) all apply the business model type E, build-short operate-transfer (as per classification in section 2.1), (ii) all apply an integrated busi-ness model supplying other services in addition to electricity, (iii) all apply a community ownership model and (iv) 3 out of 4 apply the nexus approach.
4.1.3. End-user systems
In the last-mile connection, customers are connected to the distribution system, managed and monitored. When smart-meters are installed, demand-side management can be used to promote an efficient use of the generated energy as well as protecting against detrimental modes of operation
and wearing out of the com-ponents, especially batteries. Demand-side management (DSM) and demand-response (DR) capabilities should be encouraged to shape the actual daily load profile with the actual renewable generation and shift consumption to increase the efficiency of the system138. Both mini-grids where electricity feeds equipment and appliances for productive uses on the off-taker side and those where PUEs are integrat-ed in the business model (see level of PUE compatibility & integration in section 2.2) could be managed, even if in differ-ent ways, so to shift the electricity consumption in hours with higher energy availability. A couple of examples can be the water storage management during sun hours and food-pro-cessing activities; the latter has been successfully done by ACRA in a mini-grid in Tanzania, where several mills usually operate in successive turns. The use of remotely controlled load limiters and smart meters can enhance the system con-trol capabilities by restricting the demand as the available energy is limited and giving priority to critical loads, such as public offices, hospitals, schools or selected customers, as advanced customer management strategies (see also section 3.3). Furthermore, the remote control and monitoring allows to track the system dynamics, inform demand side manage-ment, detect malfunctions and energy losses and provide large dataset to improve the mini-grid design and optimized the generation systems to follow the actual energy demand. Additionally, they allow to facilitate ordinary and extra-ordi-nary operation and maintenance (O&M), and thus to reduce operational costs and increase revenues: firstly, such activities can be planned and customized according to the specific aging of components thanks to detailed data monitoring, secondly corrective measures can benefit of high-quality assistance from components’ manufacturers and several adjustments can be remotely solved, with related saving of time and expenses. Lastly, a timely intervention on end-user systems allows to better perform the customer care services and minimize economic losses due to unsold electricity or electricity theft.
The estimation of the total demand is an essential task for developing a successful mini-grid

RE-thinking Access to Energy Business Models
74
BOX 4
Demand management strategy
■ Demand Side Management (DSM) can be defined as the application of a combina-tion of strategies and technologies to mod-ify the shape and amplitude of the load profile of a given power system. The overall goal of DSM is to reduce the cost of energy supply by optimizing the usage of available assets and deferring further investments in generation capacity. Further benefits may include lower energy bills, environmental benefits achieved by efficient energy use and reduction in usage of polluting backup diesel generators, and increased durability of energy storage devices. The main effects that DSM actions can produce on the load curve are visible in Figure 28 below.Peak clipping aims at directly reducing the maximum load that happens at the corresponding peak time (usually in the evening), effectively “shaving” the max-imum power that the generation plant has to provide; valley filling is directed at building an off-peak demand by employ-ing productive or alternative uses of energy (e.g. to power the provision of an additional service); load shifting is a technique to re-schedule loads that are time-independent to off-peak hours; conservation is a general reduction of the overall load by intervening directly on the customer side, for instance by enforcing the usage of efficient appli-ances139.In practice, to achieve these effects, DSM actions can be divided into strategies and technologies, as proposed in the seminal work done by Meg Harper for Lawrence Berkeley National Laboratory for isolated micro-grids140, as reported in the following table:
Table 9 - Demand Side Management Classification. Source: Harper, M.141.DSM Strategies DSM Technologies
Efficient appliances and lights
Current limiters
Commercial load scheduling
GridShare
Restricting residential use
Distributed Intelligent Load Controllers
Price incentives Conventional meters
Community involvement, consumer education, and village committees
Prepaid meters
Advanced metering systems with centralized communication
Demand side management is an important yet overlooked element of a mini-grid pro-ject. One of the main issues in the design of mini-grids is the prediction of the load curve of a community and its evolution with time. Since, it is an input data for the sizing of a plant, defining beforehand DSM strategies and technologies to be adopted will help in making the load characteristics of the plant much more predictable.Academic research shows how DSM can be incorporated in the design of a mini-grid, for example by classifying user loads as critical and non-critical and assigning to them a different reliability threshold for the system to comply with142. That is, certain loads are given priority (e.g. evening lights) over others (e.g. fans) which may not be served in case of sup-ply constraint, but both type of loads have by design an assigned reliability rate that limits the possible curtailments that can incur over a year. Simulation results compared with
real scenarios show how this approach can provide an optimized least-cost option for generation and storage that provides the same reliability rate for high priority loads as the actual, oversized system does, compro-mising on reliability for low priority loads in exchange of significant CAPEX savings.Another study shows how an optimal com-bination of peak clipping, load shifting and valley filling can result in a reduction of the LCOE by 18% in a reference case study, while also decreasing usage of diesel and increas-ing the lifetime of batteries143.These figures are encouraging, but putting them into practice, especially in an ongo-ing project, can be extremely challenging since any measure adopted would have a repercussion on the business model of the mini-grid as a whole. Applying DSM in existing projects would also need holistic actions beyond technical measures and it would affect the satisfaction and the engagement of the community. The cost of such an intervention should be measured in a wider cost-benefit analysis that considers the tangible costs for planning and coordi-nation, along with the cost of installation of the necessary physical devices. The possible drawbacks in terms of user dissatisfaction if the DSM programme alters their habits too radically or limits their willingness to use energy in an unacceptable way also needs to be taken into consideration.Therefore, DSM actions should be embed-ded in the planning and design phase of a mini-grid, and be part of the business model itself. Especially employing a valley filling strategy requires the presence or the devel-opment of some productive use of energy, or the provision of additional services, which can be a source of additional revenue streams for the operator and can have a broader impact on the community. The specific economic advantage of having a more “business heavy” load profile in comparison with a “residential heavy” one has been quantitatively shown in

Technical analysis of RE mini-grids and productive use of electricity
75
Demand management strategy
4.2. RE mini-grid systems for productive use of electricity
4.2.1. Integrated water, agricultural and farming services
When water, agricultural and farming services are provided locally to a community, further improved local development can be achieved. When the mini-grid operator manages these additional services through an integrated business model, a more coordinated management of the power system
and these productive activities is possible to increase the efficiency and profitability of the system, optimally aligning generation and load by using DSM and DR techniques. In particular, some productive activities like food processing and water pumping/purification have intrinsic storages (e.g. water tank and food storage), whose management can improve the efficiency of the overall system (e.g. by reducing any curtailed RE, conversion losses in converters and storages, as well as fuel consumption). In the case of pumping water, excess of production can be used to pump water into a water storage
Figure 28 – Effects of DSM on load profile. Source: Saengprajak, A. 146.a study conducted in partnership by the Na-tional Renewable Energy Laboratory (NREL) with the U.S. Agency for International De-velopment (USAID), where it demonstrates that the first kind of load can be served with a lower LCOE for various configuration of generation assets compared to the second kind (supposing they have the same overall yearly energy requirement)144. Load-shifting and peak-shaving can be obtained by adopting a differentiated tariff scheme or with hardware devices. Either way the community needs to be involved and tooled to understand, accept and exploit such model, which may be challenging espe-cially for greenfield projects that are usually unfamiliar with energy availability.The usage of high efficiency appliances and energy conservation can be promoted, but it would require awareness campaigns to discourage users from adopting cheap-er technologies such as incandescent lightbulbs. The business model for a mi-ni-grid can include the initial provision of high-efficiency lightbulbs as a part of their connection package, but also the sale of electrical appliances in general. Not only would it constitute an additional revenue stream for the company operating the plant, but it would also stimulate energy take off, especially if incentives or the possibility to pay for appliances’ instalments existed. This
is a strategy that can be borrowed from the sector of individual solar systems, and is being adopted, among the companies featured in the case studies, by DCGO, and is in the future plans of Redavia.Advanced metering systems with central-ized communication can allow for a more structured control of demand. Among the selected case studies, 7 feature meters based on the energy daily allowance (EDA) concept, which limits the available power
rating for a user, and has a daily energy limit that works as a “virtual individual storage” that gets recharged in case of low consump-tion or depleted otherwise 145. Moreover, it encourages energy consumption by sig-naling to the user when there is an excess of PV production, which favours the EDA, or discourages energy consumption when batteries have a low state of charge, which penalizes the EDA (e.g. energy is recorded at a double rate).

RE-thinking Access to Energy Business Models
76
located in proximity to the village and at an adequate elevation so that water can later flow back with gravity. Furthermore, the daily working schedule involving electricity-intensive devices in farming activities could be organized in hours with high RE availability, like daytime for photovoltaic systems. Domestic demand usually requires power peaks during the evening, while nocturnal hours have typically the lowest demand. However, a control system with proper data communication and signaling toward end-users to increase their engagement (e.g. simple LED indicators) or automatic control is required to schedule the integrated productive activities.The case study in the village of Matembwe (see Box 5 at page 87), Tanzania, firstly electrified in 1986 with a 120-kW hydro-power system, is an example of a successful operating business model applying the WEFnexus. The Matembwe mini-grid was recently interconnected to the other one placed in the village of Ikondo, which was first electrified in 2004 with an 83-kW hydro system and then expanded up to 430 kW in 2016, with a similar integrated business model. Matembwe and Ikondo projects suggest that the agricultural and farming activities strengthen the business model, diversifying revenue streams and thus sustaining the financial sustainability. Considering the domestic use of electricity in the Ikondo project, even if the connected households grew slowly from about 3% of potential market in 2005 up to 20% in 2015, the yearly energy consumption grew notably from 111kWh/HH in 2005 up to 411kWh/HH in 2015. On one hand, such increased consump-tions are particularly relevant considering that the project is developed in a very low-income rural area and. On the other hand, a further analysis would be required to assess if and how they are influenced by the integrated WEFnexus approach.In these two mini-grid systems the technical design was chosen to include a medium voltage (MV) AC distribution systems. The Kaplan-type hydropower generator built in 1986 is already of significant capacity and produces AC power which then only needed a 100-kVA step-up transformer in order to reach MV. Due to the MV-choice of the distribution system, the line losses are kept low across the 19 km of power transmission from the Matembwe generator to the off-takers. This choice proved to be further beneficial as it facilitated the regional interconnection with the two other Francis-type
hydropower generators installed in the Ikondo power house, requiring an additional 48km of MV lines and 400 kVA of trans-former capacity. This MV AC design choice enabled to benefit from RE resources located at a distance from the consumers, while keeping losses low and allowing future regional integra-tion with other generators and finally in 2017 also enabled an easy connection to the national grid via 630 kVA transformers, stepping the 10 kV MV up to 33 kV national grid voltage.
4.2.2. Integrated refrigeration and ice supply services
Integrating cooling services or ice production can be a reve-nue stream serving various industries with beneficial effects on the broader development of e.g. the agricultural or ani-mal feed economy. The generated electricity can be used to provide a central cooling area with insulated facilities where the local community is offered cooled storage space for their agricultural produce. Depending on the dimensioning of this storage space and the demand for either cooling or electric-ity, peaks in electricity generation of e.g. solar energy where demand may not suffice can be used in order to decrease the storage temperatures when also the ambient temperatures are highest during the day. Care should then be given to maintain sufficient battery levels in order to ensure nighttime loads for e.g. lighting and charging are still served.
Similarly, the production of ice can be performed as an added value to the community, so that the operator can either pro-cure refreshments or customers can take ice home to have cooled storage there. Essentially for these cooling purposes, refrigeration units are required and are available in both AC and DC variants. At power classes of only 120 – 200 W freezers can be operated, whereas machines in the kW range are likely more suitable for ice production and cooling storage rooms.. These will have to be sized with the potential demand in mind, taking into account demand uptake once early adopters have demonstrated the utility of the service. One case study where the integration of such added service is performed is located in Monte Trigo, Cape Verde. There, a hybrid PV-diesel power plant is installed with 39 kWp of solar-PV capacity and 16 kW of genset capacity, that are complemented by battery storage
147

77
to provide electricity supply as well as ice cubes, together with public lighting. Here the approach of extending the gen-eration capacity of the project at a later stage was successfully applied: the initial configuration commissioned in 2012 and able to generate 27 MWh/year was repowered in 2014 to reach up to 40 MWh of electricity per year.
In order to briefly discuss different design approaches relat-ed to AC versus DC distribution systems and related factors influencing such technical choice, the mini-grid developed in Sinda, Zambia, is reported hereafter, being one of the 21 case studies analysed. A 30 kWp solar array is connected to a 20-kW inverter, which converts the electricity into AC and it features 140 kWh of battery storage and four 100 A charge controllers, managing the load and generation interface with the batteries and protecting the batteries from overcharging and deep charging, among other functions. A diesel genera-tor of 48 kW capacity is also connected, ensuring stability of supply. This however again required the generation facility to be connected via an AC low voltage overhead distribution network running at of 230V in each of the three phases for a total distance of 2,5km. The system is being successfully oper-ated since 2016 under a Build-Own-Operate (BOO) modality. The solar system generates 38,434 kWh of energy per year: with the current 60 households and 5 businesses connected to it, it provides each customer with an average 591 kWh of electricity per year or 1.62 kWh per day. The system has been designed in order to allow for a maximum of 120 customers to be connected to it without requiring additional upgrades. Business customers are estimated to consume in average 34 kWh/month and households about 13 kWh/month. The operator is charging a flat rate tariff for the connection to the generator, independent of the actual energy consumption, which saves expenses for additional metering equipment and more complex billing processes.
An alternative technical design could have been an increased solar-PV generator and battery storage capacity and the elim-ination of the diesel generator. This would have potentially al-lowed power distribution via a DC network without the need of inverters, likely yielding CAPEX savings on the distribution
system, as well as OPEX reductions, e.g. such related to the die-sel fuel. However, CAPEX for the generating and storage units would likely be higher, even if it could be compensated by the remarkable environmental benefits of a cleaner electricity generation. In conclusion, with a sole solar-PV power plant which is financially reasonable (a system oversizing would not be financially justified in this case), the electricity availability at any time as well as high peak loads cannot be guaranteed and it would have mainly affected business customers, which may have been desired reliable and AC electricity supply. Thus, the design choice was likely to ensure security of supply at a viable CAPEX and sustainable OPEX. However, the market price trend of renewables and storage systems always must be taken into account. In fact, since 2016, the year of commissioning of the Sinda mini-grid, the cost of solar modules and batteries has fallen considerably while their efficiency and fossil fuel prices increased. A design based on today’s environment would potentially be different and technical choices for each mini-grid have to be continu-ously revisited as the environment changes. In other words, it should be always kept in mind that each engineering design usually balances techno-economic considerations: each proj-ect pursues the best option for a given context of intervention at a specific time of development.
4.2.3. Integrated end-user appliance sale
One further potential added service to electricity generation is the sale of electrical appliances. Especially when imple-menting new micro-grid projects, this service delivery could be part of the business plan to ensure the demand is there and that customers use the correct equipment compatible with the mini-grid design. This would also reduce the risk of unsuitable equipment causing issues, as second-hand equipment is widely used in Sub-Saharan Africa. Economies of scale procuring large amounts of end-user appliances may also be yielded to benefit the customer with lower pricing, while the CAPEX requirement of the generation and distribu-tion system can be reduced via profits from initial appliance sales. Passing on from economies-of-scale yielded through bulk procurement of appliances could improve the adoption
Technical analysis of RE mini-grids and productive use of electricity

RE-thinking Access to Energy Business Models
78 78
of the energy service while at the same time still provide an additional revenue stream to the IPP. Especially with DC sys-tems that are mainly used for lighting and charging purposes, the provision of adequate equipment may be more beneficial as these appliances are generally less available in the market and less variety in the customers’ demands on their applianc-es exists. However, this integrated business model should be carefully assessed to assure that the market is big enough to justify the logistical effort in setting up this business stream. Additionally, to take into account external factors, this spe-cific service provision would bring out existent or potential competitors in local communities and therefore could rise the risk of social tension.Evidence from the field shows that only 2 case studies out of 21 selected, and both developed by the same private entity, include such services: this is mainly because their DC supply only fits with DC devices, which are less common in commer-cial market.1 of the 2 case studies mentioned above, where the added revenue stream from appliance sales is successfully executed, is located in Nkaneng, South Africa. There, 28 solar PV genera-tor units are connected via a 24V DC mini-grid to 179 custom-ers, with the potential to enhance the number of connections to 4,000. Each unit comprises 700 Wp of DC solar capacity with 800 Ah of lead-acid battery storage each. The batteries are each capable of discharging 4 kWh of electricity over a period of 24h. The system is connected 24/7 to a cloud-based system where the status of the PV generator and of each household connection can be monitored. The DC appliances that are sold together with their electricity supply service range from TV sets, decoders, fridges and freezers to lighting, fans, radios, inverters and charging stations. The project has operated since 2017 under a BOO modality in a commercially sustainable manner.
The design was chosen in such modular fashion so that it can be implemented successively in segments, maintaining the same capital cost per house per segment. Future upgrades can thus be performed in a simple and quick manner as the demand increases, without the risk of excessive initial capital outlay and degradation of idle equipment. As can further be
seen, the DC supply is a crucial part of the business value proposition. It does not directly supply electricity to heavy loads requiring AC line and it does not use a diesel generator in the power generation mix and inverters, allowing for cost savings in the distribution grid and operating costs. As power distribution at low voltages entails high specific line losses, the solar PV generation capacity has been distributed in order to keep the connection line lengths to each household below 60m from the generator. The project design reduced the de-velopment risk as the CAPEX was held low and provided for optimal adaptability to future demand growth. The technical downside, however, is that any customer that wishes to run AC equipment would be required to purchase an additional inverter. Also, the future connection of the mini-grid to a centralized network will require a substation interface with inverters that converts the DC system to the centralized AC system, while also requiring transformers to accommodate the different voltage levels.The challenge for systems installed by DCGO is to have the ability to manage various set points between the supply from solar PV panels, the useful storage value in the batteries and most importantly the ability to manage all output loads according to the different packages connected to any one substation.By constantly metering these packages, the data required for the algorithm to manage energy available for supply to load requirements at all time is provided. This metering needs to run in real time and constantly communicate with the control of the complete system. In other words, all meters require to communicate with the control system at all times in order to allow the utility to efficiently balance the systems. Further-more, data analysis reveals that the systems often maintain an excess of supply at generation points: its means that energy is being generated by the PV panels but is not needed at a specific time for battery charging or customer load. Thanks to such data, techno-economic improvements can be performed in order to optimize the capacity of panels and batteries. This is a learning process to consistently improve the service and it highlights the relevance of data management for business and impact purposes, as mentioned in other parts of the study (see section 3.3).


Highly power-consuming activities in a furniture factory – Nairobi, Kenya

81
5. Sustainability analysis5.1. Sustainable Development Goals and shared value
In 2015, the United Nations promulgated 17 SDGs to be reached by 2030. The SDGs offer a framework to help Afri-ca’s RE industry grow sustainably while addressing the con-tinent’s energy challenge. As outlined in the United Nations 2030 Agenda for Sustainable Development, the SDGs are a set of integrated priorities, which means that many of the goals interact and influence each other. These interlinkages are important to understand, so that progress for one SDG does not occur at the expense of others’ (Figure 29).
Figure 29 – Sustainable Development Goals. Source: United Nations 148.
Sustainable energy interacts with several SDGs through the SDG 7, which aims to “Ensure access to affordable, reliable, sustainable and modern energy for all”, and specifically focuses on ensuring universal access to affordable, reliable and mod-ern energy services (7.1), increasing substantially the share of renewable energy in the global energy mix (7.2), and doubling the global rate of improvement in energy efficiency (7.3).First, SDG 7 ties in with SDG 1, “Poverty Reduction”, as energy is necessary for poverty alleviation. Replacing fossil fuels with clean energy leads to savings on fuel expenditure such as for fuel wood, charcoal, kerosene and diesel149 and thus, with a view to maximize the socioeconomic and environmental impact, energy supply should enable income-generating opportunities. Moreover, powering productive uses of ener-gy – such as in agriculture, industry and commercial activities – can lead to increased income through greater productivity, new income-generating opportunities, and improved access to markets150.
The SDG 7 ‘s targets related to clean and universal energy access are also directly linked with SDG 2 “Food production and security”, SDG 3 “The functioning of essential healthcare services”, SDG 4 “Quality Education”, SDG 6 “Clean water and sanitation”, SDG 8 “Economic growth and employment” as well as SDG 11 “Climate Action”.
Studies analyzing the interactions of SDG 7 with other SDGs have generally indicated positive influences, but there are po-tential negative or neutral impacts that should be noted. For example, the International Council for Science report151 shows that there are many positive interactions between portions of SDG 7 and SDGs 1, 2, 3, 6, 8 and 13, but it also highlights some potential negative interactions associated with targets 7.2 and 7.3. Awareness of the possible positive and negative in-teractions is important to ensure that collectively the greatest benefits are generated and negative impacts are minimized when developing and deploying mini-grids. In order to track

RE-thinking Access to Energy Business Models
82
and understand these changes, impact assessment systems, that include good baseline data, should be designed and im-plemented so that lessons will be learned and passed on as the rate of deployment of mini-grids expands. In particular, being aware of these interactions and utilising them as deployment models for integrated water-energy-food nexus is important to maximize the benefits across SDGs.
Figure 30 – Interlinkages SDG 7 and other SDGs. Source: UNECE, quoted by RES4Africa Foundation. 152
SDG 7:A�ordable and
clean energy
SDG 1:No
poverty
SDG 2:Zero hunger
SDG 6:Clean
water &sanitation
SDG 8:Decent
work andeconomic
growth
SDG 9:Industry,
innovation &infrastructure
SDG 10:Reduce
inequities
SDG 12:Responsible
consumption andproduction
SDG 13:Climate action
SDG 15:Life on land
With regard to Sub-Saharan Africa, this study focusses on the lack of access that seriously hinders economic growth and sustainable development within the region. As discussed in chapter 1, the study explores how decentralised renewables, together with the reliability of energy supply, which is the defining issue in achieving electrification’s economic benefits, could offer a solution to that problem153. The SDGs offer a compelling growth strategy for business leaders across Africa. Achieving the goals are anticipated to open at least USD 1.1 trillion by 2030 for the private sector in
Africa154. Rapid economic growth and changing demograph-ics are driving an unprecedented need for greater access to affordable, reliable and modern energy services across the continent. Although there are positive trends in the pace of electrification in Africa, progress is uneven155. This presents a great opportunity for both developers and financiers in the energy sector to use the SDGs to set strategies and imple-ment programmes in order to maximise positive impact and minimise the negative while creating business value.In recent years, businesses have been increasing their focus on sustainability as a whole, looking not only at the economic but also at the social and environmental sustainability. Thus, even if profitability still remains a key driver for RE investment in Sub-Saharan Africa, business actors are aware that funding renewables in developing countries could create a wider opportunity to increase revenues if coupled with promotion of access to modern energy as per the SDGs. This approach leads not only to direct economic and social benefits for local development, but clean energy access also raises human security and builds resilience in states and communities in order to help limit the risks of large-scale migration across the African continent156. From another perspective, the RE sector through the ‘shared value’ approach has the potential to create positive envi-ronmental and social growth, in addition to economic one. Shared value is a modern strategy in which companies find business opportunities in solving social issues. While the most traditional corporate philanthropy focuses efforts on “giving back”, which often results in expenses for the company, shared value focuses on maximizing the competitive value of finding solutions to social and environmental problems157. It is vital for businesses to understand the economic benefit of creating shared value in projects in Sub-Saharan Africa by turning sustainability into a business strategy. It is not enough to promote renewables: projects should be sustainable too.In conclusion, a focus on electrification alone is not enough to sustain socio-economic development in Sub-Saharan Africa. The integration of food, water and energy security through a holistic approach could assist in reducing costs as well as negative environmental and social impacts, while enhancing investment benefits.

Sustainability analysis
83
5.2. Environmental impacts
As the International Bank for Reconstruction and Develop-ment (IBRD) claimed, decentralised energy systems are at the forefront in the fight against poverty and climate change158. Electricity services monopolized by large, state-owned or privately-owned utilities fail to meet the needs of most rural and peri-urban populations. This has created opportunities for the private sector to enter the energy field as independent power producers and service providers. Businesses can pro-vide alternative energy supply in remote and rural areas while also providing jobs, lowering energy costs, and reducing greenhouse gas emissions159 160.
Recent advancements in decentralised RE systems allow for renewable energy to outcompete the traditional decentral-ised solutions based on fossil fuel and to be a feasible alter-native to the centralised energy system model, also reducing greenhouse gas emissions161. An estimated 2.5 billion people are reliant on fossil and biomass fuels. Black carbon, which is produced by incomplete combustion of these fuels, is the sec-ond largest man-made substance driving global warming after CO2, and is linked to a high degree of atmospheric heating162.
Climate change has the potential to seriously affect human lives, livelihoods and health, and this is particularly true in the case of poor and vulnerable people. Direct effects include injury or death related to floods or heat waves, the magnitude and occurrence of which become more severe and frequent as the climate changes. Indirect effects include changes in the distribution or impacts of some infectious diseases related to altered agricultural productivity: for example, higher temper-atures, humidity and an increase in the melting of permafrost is thought to have led to the release of dormant pathogens in the Arctic. Animal carcasses carrying these pathogens be-come exposed after thawing of the ice163, and in some cases, this has led to mortality of livestock and humans.
Decentralised renewable resources, such as small-scale solar and wind generation units, are more environmentally sustain-able as they use locally available and RE sources and generally
employ less water, thus resulting in a reduced environmental impact compared to the extraction, transformation and distribution of fossil fuels164. In addition to the reduction of greenhouse gas pollution and the resultant climate change, there are a range of additional benefits of producing and distributing RE in a decentralised manner.
In Sub-Saharan Africa, many low-income and off-grid households rely on traditional biomass165, which may lead to school dropout, health hazards from indoor air pollution, deforestation, soil erosion, loss of biodiversity and related negative impacts on ecology and food security. Providing communities with energy would improve the quality of life, including productivity, health and safety, gender equality, and education, as well as reducing greenhouse gas emissions and costs of the extension of centralized power supply lines over vast distances. 5.3. Social impacts and population resilience
Decentralised RE systems offer an intrinsic resilience to ex-treme events (including natural disasters, acts of terrorism and mechanical breakdowns) that centralised systems op-positely do not. The impact on power supply of a damaged or impaired centralised system is much wider than the one of a decentralised system, as more people are affected. The predicted increase in extreme events due to climate change could have a huge impact on centralised systems in Sub-Sa-haran Africa in the future. Quantifying the benefits of decen-tralised RE systems would help mitigating the effects of such events. RE would also help reducing the occurrence of such extreme events, as there is a direct link between fossil fuel derived energy and global warming, which in turn leads to an increase in extreme events.
Climate change is placing more pressure on water, food and energy sources: this means that applying the WEF nexus ap-proach is more vital than ever. The rising energy needs of the growing world population are in tension with the urgency of the challenge to decarbonise and reduce the water intensity of our energy systems. Resilient economies require a coherent

RE-thinking Access to Energy Business Models
84
and effective planning of water, energy and food that balanc-es consumption, production and trade requirements against the country’s natural resource endowments. That planning also needs to mitigate and manage the risks of climate-related variability and disasters.
The priority in a response to these linked trends is to build resilience into national development strategies. It is not pos-sible to predict in detail what the consequences of popula-tion pressures, changes in consumption patterns and climate change will be. A resilience-driven approach acknowledges this factor, recognising that there are multiple complemen-tary reasons for building flexibility into our design and man-agement of food, water and energy systems, including the infrastructure and institutions linked to them. They need to build in the capacity to absorb climate- and population-driv-en shocks of many kinds in order to reduce their impact on people and on the natural systems on which we depend, and to mitigate their likelihood, depth and frequency.
In addition to its impact on climate change, burning fossil fuels for energy has a higher accident risk than other forms of energy production. According to the Intergovernmental Panel on Climate Change (IPCC)166, the safest form of fossil fuel (natural gas) is four times more dangerous than the least safe form of RE (biomass in a combined heat and power plant). These figures relate to deaths and serious injury from accidents, and do not include the health impacts of everyday emissions from fossil fuels. In addition to being safer and re-ducing health risks, decentralised RE provides the foundation for ‘energy independence’, as countries can supply their own energy instead of relying on foreign energy sources.
As an effect on social macro-data, the obvious benefit is that, renewables will not run out, making them the logical long-term option. Fossil fuel resources will become increas-ingly costly, which, in turn, will drive up the fuel prices at a household level, marginalising the poor. As populations grow, the demand for electrification increases simultaneously. In general, rural communities have lower population densities and a larger proportion of poor households, making it costlier
to connect them. Rural grid extension involves investments and therefore risks: heavy subsidisation from governments167 should be compared with decentralised RE solutions (individ-ual systems or mini-grids) as they can be the best options in some contexts (see section 1.2).Over a total of 21 cases analysed in this study, mini-grids with a prevalent diesel generation component are financially unsustainable, with a uniform national tariff plan not able to cover even the fuel expenditure. Furthermore, they often feature poor technical design choices, with an underperform-ing or faulty renewable component generation while diesel generators result oversized and work at idling speed at a low efficiency rate, thus increasing operational costs. On the other hand, case studies applying the WEF nexus approach are through to be the most environmentally sustainable.
The introduction of reliable and affordable electricity provides opportunities to increase production in small rural business by replacing manual tasks with electric tools and equipment. This increases the productivity per worker, which may result in increased sales and revenue. A case study in Kenya from literature168 found that worker productivity increased by 100-200% depending on the type of work and that income levels can increase by 20-70% depending on the product. However, the supply of renewable electricity alone is not enough to generate this kind of impact, since it should be part of a broader integrated rural development strategy, such as an integrated package of complementary infrastructure, which contributes to strengthen local economy, including better exploitation of the agricultural potential. Another example where electricity can have positive im-pacts in a community is the opportunity to develop systems that will reduce storage losses of agricultural products, especially perishable horticultural products, while increas-ing access to markets over a longer period. Food products that are harvested from a farmer’s field but are lost in the supply systems before they are consumed are considered post-harvest losses. These losses can occur at different stages along the supply chain, and while there are some general patterns, these losses vary by region, crops grown,

Sustainability analysis
85
and markets. Estimates of post-harvest losses are variable, but up to 37% of the mass of all food is lost in Sub-Saharan Africa or 120 – 170 kg/person – year169. Electricity supply will be most beneficial for the portion of the perishable food supplies, such as horticultural crops, and have less impact on post-harvest losses for items like grains, where other im-provements are needed. Refrigerated storage is especially important in rural areas where mini-grids will be deployed because people often rely on income from food production and spend a significant amount of their income to purchase food. Refrigeration services are also important for other sectors, such as health, where proper storage of medicines and vaccines can contribute to the provision of improved and timelier health care at a lower cost to the community because of reduced travel and lost time.
Small scale energy systems have the potential to generate a range of direct and indirect jobs and contribute to local eco-nomic development. Some of these benefits, such as people directly employed with the establishment and operation of the micro-grid, are immediately apparent and easy to mea-sure; however, the number of people directly impacted tends to be small. Indirect economic benefit is created as workers spend a portion of their salaries in the local economy, which subsequently leads to new jobs in the community. The job creation benefits are greater in the community when PUE is boosted by enabling more value-added activities such as processing and manufacturing 170. Other studies of rural electrification in Sub-Saharan Africa have shown that the associated economic development benefits are often hard to measure in the first few years. There are changes in the community that can be observed but it can take longer for this to translate into measurable economic development in a community171. This suggests that there is a need for good impact analysis that includes baseline data before systems are installed and a commitment in at least some communities to track the impacts and changes over a number of years.
These benefits could be multiplied by the use of the water energy food (WEF) nexus model.
With reference to the analysis conducted in this study, all case studies providing “electricity supply & other energy-re-lated products/services” and “electricity supply & other WEF nexus-related services” are included in the top-10 ranked models. This suggests that business models applying in-tegrated services could represent an added value for the developer since they sustain local development and ulti-mately may lead to an improvement in the quality of life for the customers.Interestingly, all cases applying the WEF nexus approach showed encouraging financial results. 3 out of 4 cases ap-plying the WEF nexus approach are implemented through a “build, short operate, transfer” business model, which identifies projects developed in this classification by non-profit actors. All of them ran water-related services as not for profit public services – such as water supply – at a social tariff just to cover maintenance costs. This highlights that developers focused on the socio-economic benefits of the beneficiaries have exploited innovative solutions to integrate food and water-related services into their energy supply business models, demonstrating their actual feasi-bility.
5.4. Environmental and social impact assessment: a strength for project bankability
It is vital for developers to identify and understand not only the technical and financial risks, but the environmental and social (E&S) ones too. These risks are often overlooked, and as such, many projects in Sub-Saharan Africa experience significant delays or never reach completion because social, cultural heritage and biodiversity issues are identi-fied too late in the development lifecycle and cannot be overcome172. Developers need to take their social and en-vironmental responsibilities seriously to avoid unnecessary risks and unforeseen costs, and to improve the potential for long-term profit and enhanced investor value. Therefore, to be successful, developers need to look at the long-term impacts and benefits of their projects from the conception phase all the way to the operational phase. RE projects are no exception.

RE-thinking Access to Energy Business Models
86
The positive environmental impacts of RE projects, due to the reduction of greenhouse gas emissions, are often con-sidered enough to avoid the identification and management of environmental and social risks as well. This perception is misplaced, as all RE developments have some negative impacts that need to be identified upfront, managed and mitigated. These impacts are experienced locally, through the construction and operation of the power plant and asso-ciated infrastructure, and impact both ecological and social aspects of the surrounding environment or region. Failure to implement effective E&S risk management strategies can have wide ranging and significant negative implications, including negative media attention and a poor reputation, project delays which could result in negative impacts on credit risk or loan terms, as well as an increased liability risk when a financial institution faces legal complications or fines in rectifying environmental and social damage.
To successfully secure funds and access credit, project devel-opers need to be able to demonstrate that they are able to manage E&S issues throughout the life of a project, yet the Environmental and Social Impact Assessment (ESIA) is typically the first step developers take in demonstrating how they have identified and will be managing environmental and social risks, and possibly resulting opportunities. It is at this stage that many projects fail because of the assumption that the assessment required by regulators (usually named Environmental Impact Assessment – EIA) to secure a permit through the national pro-cess will be enough to meet the lender’s needs. International sustainability standards are typically more stringent than local permitting requirements, so both an international ESIA and a local EIA are often required.
The following actions should be considered to identify and manage E&S risks, and ensure that a project achieves bank-ability:
■ Perform early screening of potential high-risk E&S issues: an initial screening assessment to identify ‘red flags’ should be integrated into site selection and design decisions to avoid or minimize E&S impacts where feasible.
■ Engage with lenders and government as early as possible: social issues can often present some of the highest risks to a project and make or break a development. Therefore, liaising early with governmental stakeholders to discuss differences between national requirements and lender requirements and to agree on an approach to bridge these gaps and discuss potential red flags.
■ Identify and engage early with project affected stakeholders: work to build trust with stakeholders, and understand the potential impacts on their livelihoods.
■ Identifying opportunities to create shared value to maximise beneficial project outcomes for affected communities: by focusing corporate policies on external aspects, such as local hiring/procurement policies, and community investment programs, a project reduces the risk of poor E&S performance and potential delay of achieving bankability.
■ Consider associated facilities early: evaluate the impact of the installation of supporting infrastructure, such as transmission lines, substations, access roads and pipelines needed for a power development.
■ Consider an integrated business model: a business model that applies the WEF nexus could result in a practical approach to mitigate E&S risks.
An effective corporate level Environmental and Social Manage-ment System (ESMS), aimed at mitigating environmental and social risks, should be endorsed by the project’s management team and become an integral part of the company’s proce-dures and day-to-day business operations. It is important to establish a culture for E&S awareness within the organisation. From a social perspective, it is essential that this system also includes procedures and resources to manage social impacts, labour working condition issues and community grievances on an on-going basis for the life of the project.
One example of effective mitigation of these risks is investment in complementary activities. As discussed in section 3.3, they mainly consist of activities not strictly necessary to activate the electricity supply services while they favour project imple-mentation and mitigate investment risks to smoothly run the business and achieve a higher socio-economic impact.

BOX 5
WEF nexus integrated business model: impact assessment of a successful case study from Tanzania
Sustainability analysis
87
In terms of the case studies analysed, the top-12 (as rated based on IRR) have implemented such activities. Even if they come at a cost, the developer should consider this approach as an advantageous investment. For example, by investing in the final off-taker, the project aims to grow demand in the mid-term, so as to increase energy sale and foster the mid-long-term commercial sustainability of the business.
To manage E&S risks throughout the project lifecycle, a com-pany needs to commit to the appropriate level of human resources to implement the necessary risk mitigation meas-ures during both the construction and operational phases of the project. Developers must appoint E&S specialists with the correct experience and skills to implement the required management plans and company E&S policies. ESIA and ESMS, even if prepared in line with international standards, make no material impact if not implemented by personnel with specific environmental and social skills. This implies that a dedicated organizational structure with adequate skills, resources, agreed upon strategy as well as a good monitoring
system is necessary to ensure good environmental and social implementation and performance.
From the financial institution point of view, the implementation of an ESMS is key to confirming that E&S risks and opportunities are being managed as intended through ongoing monitoring of Key Performance Indicators (KPIs). The monitoring of KPIs in turn verifies compliance with international sustainability standards to minimise risks and enhance opportunities. It also provides assurance that the ESMS is appropriate to implement the management measures identified in the ESIA.
With so many power projects in Africa competing to secure financing, managing one’s environmental, social and govern-ance (ESG) risks properly can make the difference between a successful development and one that never gets off the ground. By following the approaches in this paper, project developers can de-risk their projects, making them ‘fit for finance’ from an ESG perspective. This will increase the likelihood of securing international financing and receiving the funds more quickly.
■ The WEF Nexus’ holistic approach can provide access to essential resources for an appropriate human sustainable development.Access to clean water, modern and un-pol-luting energy services, nutrient and sufficient food is at the very core of the fight against global poverty and the efficient implementa-tion of the Sustainable Development Goals. This integrated approach generates added value thanks to the multi-sectoral shock induced by an activity specifically designed to transform the traditional environment and operating mode. It aims to enhance and secure the three most important natural re-sources, energy, water and food, and manage them in an integrated way. Most importantly, it is crucial to ensure the accessibility and
affordability of basic resources to all sections of the population.In order to advocate actions to drive Africa’s sustainable transition, it is fundamental to evaluate what kind of positive effects can be achieved through a WEF approach. In doing this, it is crucial to build up an impact assess-ment of the benefits and challenges that
might arise from this specific designed activi-ty, in order to further and promote sustainable institutional programmes and policies.The main aim and core element of the impact assessment here summed up (for further details see the full RES4Africa and OpenE-conomics publication173) is to predict the economic effects at an early stage of an

WEF nexus integrated business model: impact assessment of a successful case study from Tanzania
88
investment planning and design, in order to find ways and means to reduce adverse impacts, shape investments to suit the local needs, and present the predictions and op-tions to decision-makers. Impact can there-fore be defined as a measure of the changes, and its assessment seeks to establish a causal connection between inputs and changes in terms of magnitude or scale or both. The evaluation here presented is based on a CEFA’s hydro-powered mini-grid “Ikon-do-Matembwe” project in rural Tanzania, where a local company distributes and sells electricity and water to the surrounding pop-ulation of around 20.000 residents, as well as to a number of agro-forestry and livestock activities managed by the same company as part of an integrated business model, thus representing both the anchor load and additional revenue streams. The total investment project cost is USD 3,781,131split in its components of energy, water and food (including livestock):
■ Energy: USD 2,950,472 (78%)
■ Water: USD 337,232 (9%)
■ Food: USD 493,427 (13%)In order to evaluate the benefits of the inte-grated WEF nexus approach, two different scenarios have been considered: (i) sole energy implementation and, (ii) integrated WEF nexus approach.The sole energy implementation scenario has therefore been compared with an alternative case where all components are implemented together, as in the case of a WEF nexus ap-proach. The rationale for this comparison is that energy is the activating component for the water supplied to the village, bringing about crucial economic benefits to the target population. In addition, energy is also the activating component of the livestock factor, as farmers need energy to improve their abil-ity to use enhanced cultivation techniques. As per the livestock subcomponent, energy gives the opportunity to increase production
through hatchery activities, through the use of electric equipment. This boosts produc-tivity through an enhanced value chain and also improves the animals’ environment and welfare.In terms of project results, the Energy project’s Economic Net Present Value (ENPV) turns out to be USD 5.940.652, while the project’s highest ENPV is the integrated WEF nexus scenario with more than double ENPV for USD 12.479.239. Simultaneous implementation of the three WEF components of the project thus produces the largest impact in economic terms. These results are linked to the benefits that a sole energy project will produce on local population in comparison with those en-hanced by a WEF nexus integrated approach. Table 10 represents the ben-efits of the WEF nexus project compared to those of the sole energy project. Further indicators of project performance are the Internal Rate of Return (IRR) of 16% with a Benefit cost ratio (BCR) of 3,1 for the Energy project, and an IRR of 22,57% project and a BCR of 4,5 for the Energy, water and food integrated project.The evaluation suggests that the success of the project depends on: (i) the interde-pendence built in the project
structure, (ii) the complementarity of water, energy and food components, and (iii) the mechanisms of adoption and diffusion that would support the replication and the scaling up of the initial, local based project. The results suggest the following policy recommendations:
■ Promote community participation ■ Increase policy synergies among key
sectors ■ Improving information on the project ■ Promote trans-boundary activities ■ Create a favourable environment for
investment ■ Create a gender and children-equality
environment
Table 10 – Comparison between nexus and energy benefits. Source: OpenEconomics174. Benefit Clusters Nexus Project (Usd) Energy Project (Usd)
Avoided Time Loss 3,307,379.52 1,537,276.08 Health Improvements 24,670.84 24,670.84 Reduced Emission 47,363.10 47,363.10 Improved Productivity 2,680,364.20 883,864.04 Access to Education 4,958,692.70 4,958,692.70 Access to Water 3,724,297.33 - Access to Food 1,902,890.99 - Total 16,645,658.67 7,451,866.76
Figure 31 – Nexus performance indicators. Source: OpenEconomics175


Demonstration on electrical circuits at St.Kizito VTI – Nairobi, Kenya

91
6. Policies and Regulations for decentralised RE solutions
6.1. Key challenges for the regulatory framework to enable up-to-scale development of the decentralized RE sector
The success of universal electrification strategies in Sub-Sa-haran Africa requires a multi-faceted approach comprising different technologies suited for the singular needs of a het-erogeneous customer base (domestic, public or productive uses), diverse geographical characteristics (isolated rural, peri-urban or urban areas), local availability of socio-econom-ic and environmental resources, as well as specific circum-stances of each initiative. All these aspects should be inte-grated into a regional and national institutional framework, which must provide for the new realities of the decentralised energy supply in developing areas, and especially enable the successful implementation of isolated micro-grids for a significant share of customers at national scale. The first fundamental elements of this institutional frame-work are an integrated electrification plan for all the supply modes (which include grid extension and off-grid supply technologies, either with mini-grids or individual solar sys-tems) and secondly a sound regulatory framework. Without these two elements it will not be feasible to rapidly escalate and set in motion all the required resources needed to have a measurable impact in the lives of millions of people. Regulation will help mitigate the risks of the electrification process, especially considering the difficulty of extending the universal service to low- or very low-income population, to remote and isolated zones and generally to segments of the national customer base where the cost of service is higher than what the population can afford. Regulation will facilitate the attraction of private capital and the bankability of the electrification projects. On the other hand, an adequate plan that will minimize the total cost of supply, in compliance with
the electricity access targets defined by the government, will help policymakers, donors, electrification agencies, compa-nies, entrepreneurs and other actors to determine and plan themselves the best use of their (usually scarce) resources, thus establishing a comprehensive and stable framework for investments and sustainable business models associated with each electrification supply mode.As for regulation, the first challenge for rural electrification worldwide, in developing countries as well as in developed economies, is imposed by the fact that rural electrification, especially in isolated and disperse areas, is significantly more expensive than the electrification of high-density, well-connected urban areas. This is called the “iron law of rural electrification” and applies to grid extension, micro-grid electrification and isolated systems implementation. Grid extension customers, and sometimes policy makers, can be unaware of the difference in the cost of service, where rural electrification can be 10 times more costly than urban connections, or higher. When it comes to deciding whether a specific group of clients (a village or an optimized cluster of clients) should be better off-grid or connected to the central network, it is important to establish the precise impact of this law. It is also imperative to compare the actual cost of service of the grid extension system that would supply this specific group (and not the average network connection cost, or the average cost per km of distribution network) with the best combination of off-grid choices (mini-grids and individual solar systems), including also the social cost of non-reliability and low-quality access. When it comes to tariffs or retribution of centralized distribution network supply companies, the particularities of this iron law are taken into account in most of the grid supply regulatory designs worldwide (establishing de facto implicit crossed subsidies between urban low-cost and rural high-cost customers). However, the extension of these

RE-thinking Access to Energy Business Models
92
cross subsidies to off-grid technologies are usually neglected by the regulation. Considering this iron law in the allocation of funding, achieving universal access service by 2030 requires resources and subsidies by
governments and electrification agencies to off-grid systems, with an adequate calculation of the cost of service of mini-grids and stand-alone supply least-cost alternatives. A second distinctive fact shared by most of the impoverished population (not only in developing countries) is the lack of means to afford the cost of service of electricity supply. The difference between this affordability and the cost of service adds to the total viability gap between what the business models can collect from the customers and the total cost of supplying the electricity service.The impact of both the iron law and the viability gap indicates how deep the power divide between the cost of service and affordability in urban grid and rural off-grid areas is. It also confirms the need to find solutions to close this gap, especially for a successful mini-grid strategy, in order to offer a universal service at a fair price to the most impoverished population in isolated off-grid rural areas (possibly in a similar way as it is implicitly cross-subsidized for grid-connected customers, wherever they are located). Tariffs can also take into account the existence of additional funding, as additional direct subsi-dies from the national budget or electrification funds (generic or for specific technologies and energy sources) or as grants or loans from international development banks and agencies. Mini-grids can be a permanent or a transitory solution for the electrification of islanded areas. In the event of national grid’s arrival, the regulation should also ascertain the characteristics of grid-compatible mini-grids and determine an adequate support associated to them. This support is justified by two factors: (i) grid-compatible mini-grids are usually more expensive than other types of mini-grids (e.g., DC networks that supply small loads only for a few hours a day) and (ii) on the other side, enabling standard levels and quality of service similar to the ones of the grid itself in an isolated villages far
from the central network can come at a much lower cost in comparison to the grid extension cost to that village. The reg-ulation should also establish when and how these mini-grids could be connected to the national grid. Furthermore, it should determine, first, what compensation should apply to the entrepreneurs that developed the mini-grid network in order to integrate the actives with the national grid, second, and what retribution regime should apply to the distributed generation in place, once connected to the grid. This regu-lation will mitigate the risk for this type of grid-compatible mini-grids and attract private investment in areas where the grid will take time to arrive (or might not arrive at all), thus reducing the pressure on the incumbent distribution com-pany to extend the grid everywhere and accelerating the electrification rate to achieve universal access. The electrification process is also part of the national energy policy, coexisting with other objectives such as quality and security of supply, energy efficiency, a cost-efficient gener-ation mix, promotion of RE sources, reduction of the energy dependency, or resilience of the power system in the event of natural catastrophes. All these concerns have their impact in the mini-grid regulatory and policy frameworks. For in-stance, on the one hand, mini-grids in isolated areas, mostly powered by solar or other renewable sources, will contribute to the improvement of the overall generation mix and to the reduction of carbon emissions. On the other hand, the use of off-grid diesel gensets might impact the energy dependency for those countries that need to import fuel, with a negative impact on country’s climate change targets. As a final point, it is important to stress that the universal electrification strategy is linked to the achievement of several sustainable development goals (see section 5.1). The consid-eration of the WEF nexus and of the resilience of the power supply is particularly important. When determining their electrification goals, decision-makers should always consider the needs not only of domestic customers but of essential services and development policies such as zero hunger, clean water and sanitation, education, no poverty or good health. An adequate supply of clean water or the irrigation of crops might require water pumping, which in some isolated rural areas might be one of the most energy demanding services,
The extension of cross subsidies to off-grid technologies are usually neglected

Policies and Regulations for decentralised RE solutions
93
and therefore have a very significant impact on the planning process. Other anchor loads such as agro-industries and oth-er food processing or income-generating activities will also need to be integrated with the electrification strategy (see section 3.1). In this regard, mini-grids are especially suited to power larger loads in isolated areas, where clustering many of these demands will lead to economies of scale as compared to supplying them with stand-alone systems.Policy-makers should also take into account the resilience of electrification systems, which have an impact on the selection of technologies and business models (see section 5.3). Some developing regions are especially vulnerable for different reasons: natural disasters, climate or adverse weather condi-tions, humanitarian or security risks (e.g. refugee camps and conflict zones) or just because of the uncertainty associated to the power sector governance (e.g. unexpected changes in the policy-makers’ strategy). In these scenarios, distributed RE systems will be much more resilient and flexible.
6.2. Five country-cases in off-grid and RE sector
This section examines the off-grid subsector in Kenya, Ethio-pia, Zambia, Ghana and South Africa, pointing out the regula-tory framework models of the five countries, covering the key regulations, subsidies, agreements and financing overview. The challenges and opportunities in the off-grid space cannot be dealt separately from the existing link between
electricity supply and socio-economic development, and, mostly, the regulatory and policy uncertainty. While some of these countries are experiencing real growth in small scale, commercial and industrial, solar projects (South Africa, Kenya and Ghana), the structure of power markets in most countries makes the execution of decentralised RE projects noticeably more difficult.Despite the profusion of initiatives in favour of decentralised solutions, the real scale of implementation remains limited and, above all, very poorly documented in most of the ana-lysed countries.The regulatory frameworks in many Sub-Saharan African countries are obsolete and need to be amended to keep up with the changing nature of the power sector. Creating barriers to entry for the adoption of corporate PPAs, they restrict the sale of energy without a licence. Since a licence is required in many countries to either operate a power asset or sell power (or both), most markets have a thresh-old where a licence is required, and where projects exceed them, the PPA will frequently be structured in an alterna-tive way.Nevertheless, besides unpleasant tax consequences, these solutions carry enforceability risk and may not pass a lender’s bankability requirements.Therefore, a consistent regulatory framework for decentral-ised RE systems represents a key element for an effective energy policy within emerging economies.
South Africa
Overview on energy policies
With 84.4% of the population with access to electricity176, South Africa’s electrification rate is notably higher than most of other Sub-Saharan African countries. Even though the crucial need
of the improvement of off-grid projects has become clear, it is essential to out-line an enabling framework to scale up the use of decentralised systems as a suitable approach of facing the electri-fication challenge.As highlighted in the National Develop-ment Plan (NDP), South Africa seeks to eliminate poverty, deliver environmen-tal protection and promote economic
development by 2030. The NDP’s vision for the future, perfectly embracing the WEF nexus approach, must face the lim-ited water and fertile land resources, the degradation of the environment, the population growth and urbanisation processes that are increasing pressure on food, water and energy supplies.Energy transformation indicates the adequate moment for policymakers to

RE-thinking Access to Energy Business Models
94
reappraise their approach to energy access. This confirms the importance of a supporting environment for off-grid development, which includes clearer criteria for mini-grid development, support for skills and training as well as more supportive regulation allowing private players to unlock the off-grid market potential. There is need for the Government of South Africa to formulate and imple-ment policies and regulations that protect private investors against the risks posed from the arrival of the grid. It is fundamental to set up an exit clause in advance, identifying duties and rights of the parties involved. However, the most efficient way to mitigate such risk would be the diffusion of official and reliable governmental plans providing more certainty on grid extension in the long term.
Main stakeholders and authorities
The Department of Energy (DoE) is responsible for the formulation of policies and regulatory frameworks. Through the Integrated National Elec-trification Programme (INEP), the DoE is responsible for assisting municipalities with funding for the implementation of electrification projects. These pro-jects include a non-grid electrification policy and implementation of an off-grid solar-PV programme to remote rural areas in order to reach universal access to electricity by 2025 (with 90% of the population being connected through the grid and 10% through off-grid solutions).
Electricity generation capacity is cur-rently dominated by the state-owned utility supplier Eskom, which holds 91% of the country’s nominal generation capacity. Remaining generation capacity is held by municipalities (1.77%) as well as IPPs that sell power to Eskom (7.21%). South Africa is home to Africa’s biggest IPP market, which is envisioned to con-tribute to 30% of the country’s future generation capacity.Eskom, the DoE and the National Energy Regulator of South Africa (NERSA) work together to regulate as well as monitor the provision of power supply through the use of RE systems. They are also the major stakeholders alongside private sector developers and investors.
Key regulations, subsidies and agreements South Africa’s energy sector is regulated by NERSA under the National Energy Act 34 of 2008, National Energy Regulator Act No.40 of 2004 and Electricity Regu-lation Act No.4 of 2006. To achieve the 100% electrification rate, South Africa provides subsidies for grid connections, off-grid systems and grid network infrastructure such as substations and high voltage (HV) inter-connections through an annual budget of USD 400 million. To benefit from this subsidy, investors in individual solar systems (e.g. solar home systems - SHS) can tender to become concessionaires. A single tendered concessionaire is appointed to a designated area within which it has, first, the exclusive right to supply SHS services for five years and, second, the responsibility of maintain-
ing installed systems per the terms of a 20-year contract where government subsidizes about 80% of the capital costs of the systems and 100% for those households that are classified as indigent, using the free basic services grant.South Africa launched a competitive procurement programme for RE in 2011 called the Renewable Energy Inde-pendent Power Producer Procurement Programme (REIPPPP), which has since reduced the tariff rates for solar-PV and wind over a short period. REIPPPP has been highlighted as a significant policy for enabling the achievement of the country’s climate change mitigation goals. RE generators are increasingly entering into corporate PPAs with lo-cally operating businesses. PPAs ensure that these off takers have access to consistent power and price certainty, while providing stable revenue streams for RE generators. Corporate PPAs are a solution that can potentially lead to more off-grid energy developments in Africa, as long as the agreements are carefully drawn up.
Rural electrification masterplan and off-grid system integration
The state-owned utility supplier Eskom has a 10-year Transmission Develop-ment Plan ( TDP) which is updated annually. There is also a Grid Connec-tion Code for Renewable Power Plants (RPPs) connected to the electricity transmission system or the distribution system which specifies the minimum technical and design grid connection

Policies and Regulations for decentralised RE solutions
95
requirements for RPPs connected to or seeking connection to the South African transmission and distribution systems. South Africa currently has a draft Inte-grated Resource Plan 2018 (IRP) which serves as the national electricity plan and policy blueprint for the power sec-tor (both main grid and off-grid). Over the last several years, the DoE has been attempting to update the IRP, and draft updates to the IRP were circulated for comment in 2013 and between 2016 and 2018. The latest integration of the IRP is now subject to stakeholder engagement at the National Economic Development and Labour Council (NEDLAC) before being presented to Cabinet for signature. The NEDLAC IRP contains an allocation to distributed generation in the 1 to 10 MW range of 500 MW per annum, except for the first 3 years (2019 to 2021) where the allocation will be to the extent of the electricity supply deficit. It is important to remember that the NEDLAC IRP is still the subject of intense debate between the NEDLAC stakeholders, government, business, labour and communities and the IRP to be submit-ted to Cabinet may change following this engagement process. The importance of the distributed gen-eration allocation in the NEDLAC IRP is that the difficulty experienced in ap-plying for generation licences, namely showing compliance to the IRP, will be overcome and the application process, whilst still cumbersome, will become easier for those qualifying facilities of the 500 MW allocation.
In the interim and pending finalisation of the IRP, the former Minister of Energy advised NERSA his consent to the devi-ation from the IRP of 500 MW capacity in the 1 to 10 MW range. This will enable licence applications to be processed for distributed generation whilst the IRP is being finalised.It is important to note that there are no clear exit options in case off-grid arrival.
Licence and permit procedures
Regulation in South Africa stipulates that projects above 10MW require a licence from NERSA and ministerial approval. The local municipality needs to provide a general operating licence to the project developer. For projects below 10MW, there was a ministerial announcement that no approval is required. However, a licence will need to be obtained with NERSA.South African electricity generation is regulated in terms of the Electricity Reg-ulation Act of 2006 (ERA). The ERA pro-vides that no generation facility may be operated without a generation licence unless it is exempted from licensing. The Regulator, NERSA, follows a rigorous and lengthy process in considering whether or not to grant a licence, during which the public is consulted, and a great deal of documents and information are assessed.
The ERA provides that NERSA is allowed 120 days to finalise a licence application, but the 120 day period only begins when NERSA have received answers to all their outstanding queries (which they may
make piecemeal, with no time constraint) or the public consultation process is finalised, whichever is the latest.A difficulty with the process is that a licence may only be applied once the project is at a fairly advanced stage and a number of agreements have been con-cluded (including the power purchase agreement and the distributor connec-tion agreement). This creates project risk because if the licence is not granted, the project will not be able to proceed. It also means that a considerable amount of money must be spent in getting the project documents ready for submission to NERSA. One of the greatest hurdles to obtain a generation licence is that in applying for the licence, the ERA provides that the applicant must show compliance with the current Integrated Resource Plan (IRP) or give reasons for deviation for the consent of the Minister. NERSA’s view is that if the proposed generation is not in terms of a national procurement plan, then it is automatically not compliant with the IRP and a ministerial consent to deviation must be obtained. Ministerial consent to deviation from the IRP is very difficult to obtain. There are very few cases where independent power producers (large or small) have managed to obtain generation licences when they were not participating in a national procurement programme. Be-cause of the difficulties, length of time and uncertainty inherent in the licence application process, prospective gen-erators prefer to rely on the exemption and registration provisions in the ERA, if at all possible.

RE-thinking Access to Energy Business Models
96
The current exemption schedule (Sched-ule 2) to the ERA includes 10 categories of exempt activities, all of which require registration with NERSA. The 10 exemptions are, briefly, (1) gen-eration facilities of up to 1 MW where there is no wheeling through the na-tional grid, (2) generation facilities of up to 1 MW where there is wheeling using the national grid, (3) generation facilities of up to 1 MW which are off-grid and 7 other exemptions relating to demon-stration plants, cogeneration facilities, private distribution lines, previously exempt facilities, previously non-com-pliant facilities, standby or back up generation and reseller activities.Only 4 of the new exemptions are relied on by small scale generators, namely the 3 “1 MW exemptions” referred to above, and the cogeneration exemp-tion (which has no capacity limit). Thus, off-grid mini-grids up to 1 MW would be eligible for licence exemp-tions. However, there are issues with the conditions relating to the exemptions, not least of which are the limited cate-gories of customers which can be sup-plied, and the difficulties experienced in getting necessary approvals and agree-ments from Eskom and municipalities.Problems were previously experienced in registering exempt activities with NERSA because NERSA had not developed the prescribed registration procedure, nor the prescribed fee as required by the ERA and numerous delays were experienced. After the first batch of registrations took place, the process was halted in July 2018 and further registrations have only taken place in the third quarter of 2019.
NERSA recently published a consul-tation paper for public comment on further proposed amendments to the exemption schedule and although the comments period has closed a further exemption schedule has not been promulgated yet. The format of the schedule is unknown, given the fact that in the past final gazetted schedules have little or no resemblance to the draft circulated for public comment. However, it has to be underlined that the NERSA draft is considerably different to the current exemption schedule. A few of the changes are that facilities of under 100 kW and off-grid facilities will be exempted and will not have to reg-ister. This implies that off-grid facilities will have no capacity constraints. Facil-ities of up to 1 MW will still have to be registered, but the limitations on which off-takers may be supplied appear to have been removed. This will be done although Code compliance conditions have been inserted, meaning that it will be difficult for small scale generators to comply with. In conclusion, if the draft-ed exemption schedule is approved, a notable step to encourage the mini-grid sector will be done.Environmental permits are also crucial for the development of a renewable project. They often require ad hoc studies and therefore entail a higher cost for the developers. However, an off-grid will most likely not require an Environmental Impact Assessment (EIA), based on the following stand-ards for the development of facilities or infrastructure for the generation of electricity. No EIA is required when the
electricity output is less than 10 MW and the facility covers an area of less than 1 hectare. This will most likely be the case for a mini-grid. Alternatively, when the electricity output is between 10 and 2 MW, or less than 10 MW and the facility covers an area exceeding 1 hectare, a Basic Assessment is required; apart from the case where such infrastructure is for photovoltaic installations and takes place within an urban area. Full EIA is required in case the electricity output is 20 MW or more.
Financing overview
Most energy projects are financed by the South African government, State-Owned Enterprises (SOEs) as well as DFIs, including the World Bank, African Development Bank and the European Investment Bank. Commercial debt financing directed to-wards greenfield assets is available from local and foreign banks. The PPA regime in South Africa is in local currency and is supported by the debt of the South African banking sector, which enables to raise the long-term capital needed for infrastructure development.Off-grid electrification is also mostly funded through concessionaires and municipalities.
Challenges and Opportunities
Challenges affecting the off-grid sub-sector include:
■ No clear regulation governing the off-grid sub sector;

Policies and Regulations for decentralised RE solutions
97
■ Long procurement and decision-making process of municipalities;
■ Lack of practical tailored guidance to local government, municipalities, project developers and communities in South Africa on how mini-grids can easily be adapted in different locations, and the best ownership models and financial models to use;
■ Perceived threats to the public sector revenue model, whereby the introduction of new models, especially those moving away from local government ownership could threaten much needed revenues.
Opportunities available in the off-grid sub-sector include:
■ Deteriorating Eskom plant perfor-mance, propelled by old generation infrastructure, suggests that there is a need to consider alternative approaches to main grid extension. This has enabled the introduction of different energy sources for electricity generat ion , and decentra l i sed provision that has certainly been more cost-effective than grid connections to remote areas, at least in the short term.
■ With 86% electr if ication, South Africa’s New Household Electrification Strategy, initiated by the DoE in 2011, states that although a 90% electrified target is possible, the rest will have to be off-grid
Ghana
Overview on energy policies
Within Sub-Saharan Africa, Ghana has the second highest electrification rate of 84%.177 Ghana currently has an installed capacity of about 4,399MW.178 The gov-ernment’s plan is to ensure universal access to electricity by 2020.In August 2018, the President of Ghana, Nana Addo Dankwa Akuffo Addo, in-augurated a 20 MW solar power plant in Gomoa Onyaadze, in the central region of Ghana. This solar park is the second largest scale one in the country, established to encourage private sector participation in RE generation. The Government of Ghana has also initiated procurement processes to add a total of 72MW of solar energy to the national grid through the Volta River Authority (VRA) and the Bui Power Authority.179 Ghana’s first operational park, a 20MW facility, was commissioned in April 2016. As part of efforts to increase the access of electricity to the population of Ghana, five mini grids in island communities on the Volta Lake were handed over to the VRA for operation in June 2018. The government also completed and com-missioned 26 micro grids for remote health facilities in the Brong Ahafo, Northern and Western Regions.3
Main stakeholders and authorities
The Ministry of Energy and Petroleum is responsible for formulating and mon-itoring policies and projects in Ghana’s energy sector. This is done through
funds provided by the Ministry of Fi-nance and Economic Planning. The Energy Commission regulates the development and utilisation of energy resources in Ghana. The mandate of the Commission includes licensing companies in the energy sector and providing advice to the Ministry of Ener-gy on policy making. The Public Utilities Regulatory Commission (PURC) is an independent regulatory agency that approves the rates of electricity sold by distribution companies to the public. The Volta River Authority (VRA) handles the generation of hydropower from the Volta River in Ghana. The generated electricity is then transmitted to Ghana Grid Company Limited (GRIDCo) by bulk customers such as Electricity Company of Ghana (ECG) for onward distribution in the southern part of the country, whereas the Northern Electricity Distri-bution Company (NEDCo) is responsible for the northern belt of the country. Until March 2019, ECG was responsible for the nationwide distribution of electricity to households and industries. As of March 2019, Power Distribution Services Ghana Limited (PDS) has been assigned a 20 year concession right to manage the electricity distribution affairs on behalf of ECG. There have been recent issues in the electricity industry which have led to the suspension of the PDS concession agreement.
Key regulations, subsidies and agreements
The power sector is regulated by the Energy Commission and the Public and Regulatory Commission. The National

RE-thinking Access to Energy Business Models
98
Energy Policy 2010 is the underlying policy document that states the govern-ment’s strategies in the energy sector. The Renewable Energy Act 2011 provides the legal and regulatory framework for the creation of an enabling environment within the sector. In addition to this, there are other policy instruments towards the promotion of RE in Ghana. These include the National Electricity Grid Code 2009 and RE Feed-in Tariffs (FiTs).The following sub-codes state the rules, guidelines as well as the connec-tion and performance requirements that a Variable Renewable Power Plant must comply with in order to be added to the National Interconnected Trans-mission System:
■ Renewable Energy Grid Sub-Codes ■ Renewable Energy Sub-Code for
Transmiss ion and Dist r ibut ion Networks
The Net Metering Sub-Code for Con-necting Renewable Energy Generating Systems to the Distribution System states the technical condition guidelines for the connection of RE power plants to low voltage distribution systems under the net metering.The Budget Statement and Economic Policy of the Government of Ghana for the 2019 Financial Year stated that, as part of the government’s strategy to increase the percentage of RE in the energy mix, about 24,770 solar lanterns were to be sold to poor off–grid house-holds at a 70% subsidy in 2018 to re-place kerosene lamps in non–electrified households.180
In order to reduce electricity costs and the dependence on the national grid while promoting the use of solar power, the Government of Ghana implemented the Solar Rooftop Programme. The pro-gramme was set up to provide public institutions with solar energy. Under the programme, a contract was awarded for the installation of 65 kW solar energy to the Ministry of Energy.181
Rural electrification masterplan and off-grid system integration
Currently not available in Ghana.
Licence and permit procedures
An individual or company seeking to engage in commercial activities in the RE sector must acquire a wholesale li-cence under the Renewable Energy Act (Act 832). Commercial activities include the production, transportation, storage, distribution, sale and marketing, impor-tation, exportation and re-exportation of renewable energy as well as the installation and maintenance thereof. A wholesale licence permits the holder to manufacture and assemble RE prod-ucts. It also permits the holder to install, generate, and supply electrical energy. Wholesale licences are mainly intended for generators who wish to make use of the national grid to supply electricity to licenced distribution utilities or bulk customers182. The procedure to acquire a licence is detailed in the Licence Manual for Service Providers in the Renewable Energy Industry established by the
Energy Commission. It sets out the procedures for licensing institutions in the RE sector subject to the Renewable Energy Act.
Financing overview
Projects in the renewable sector are usu-ally financed through consortia made of various actors such as the government, financial institutions and companies us-ing debt and equity instruments. Most of the financing for renewable energy is from the private sector.
Challenges and Opportunities
Challenges affecting the off-grid sub-sector include:
■ Low level of creditworthiness of utilities ■ Lack of transparency in procurement
framework ■ Inadequacy or, in most cases, absence
of strong, transparent regulatory precedents to encourage competition
■ Limited availability of know-how and skilled labour to implement the technology
■ Relatively high cost of investment and installation of technology, as most of the machinery is imported into the country and skilled labour is involved in the installation of the technology
Opportunities available in the off-grid sub-sector include:
■ Unreliable supply of electricity by ECG nationwide creates a market for renewable energy in households and companies

Policies and Regulations for decentralised RE solutions
99
Kenya
Overview on energy policies
According to the World Bank, Kenya’s power sector is one of the most de-veloped in Sub-Saharan Africa with an installed capacity of 2,712 MW, as at 31 December 2018, and electrification rate of c. 75% for both grid and off-grid con-nections183. By 2022, the Government of Kenya (GoK) plans to achieve universal electricity access in the country. Off-grid solar and mini-grids are expected to contribute with over 2.1 million new connections and private sector investors to play a crucial role in the achievement of this goal.
Main stakeholders and authorities
The Ministry of Energy formulates the energy policy in Kenya. The Energy and Petroleum Regulatory Authority (EPRA), established in 2019 under the Energy Act to replace the Energy Regulatory Commission (ERC), regulates the sector. The Rural Electrification and Renewa-ble Energy Corporation (REREC), also established in 2019, is mandated to de-velop Rural Electrification Master Plans, promote RE technologies (excluding geothermal) and implement rural elec-trification through grid extension and off-grid systems. Another key player is the state-owned Kenya Power and Electricity Company (KPLC), the main distributor of electricity in Kenya.
Key regulations, subsidies and agreements
Regulations governing the off-grid sub-sector in Kenya are stipulated under the Energy Act, 2019. The Act provides for the regulations governing the licensing, development and gener-ation of off-grid power. In addition, the Act introduces the net metering con-cept where power generators will be allowed to sell their unused power to the main off-taker (the national utility KPLC). The Act further incorporates FiTs for RE projects into law. The GoK is implementing measures to increase investments through private sector investors in the off-grid sub-sec-tors, which include zero-rating import duty and removal of Value Added Tax (VAT) on renewable energy, equipment as well as accessories. This has led to the off-grid sub-sector in Kenya to be one of the most established in Africa.Furthermore, GoK is also implementing the Kenya Off-grid Solar Access Pro-gramme (KOSAP). Funded by the World Bank, the programme counts four com-ponents: (i) mini-grids for entire commu-nity needs, (ii) stand-alone solar systems and clean cooking for households, (iii) stand-alone solar systems and solar wa-ter pumps for community facilities and (iv) implementation support and capac-ity building. The private sector investors are expected to participate in KOSAP through PPP arrangements for the de-velopment of mini-grids and through incentives to solar off-grid companies for an expansion into the underserved counties. The incentives include:
■ Results-Based Financing (RBF) facilities (competitively awarded incentives) to compensate solar companies for initial, ongoing incremental and opportunity costs associated with an expansion of operations in underserved counties.
■ Debt facilities to support up-front costs associated with getting hardware inventory into the market and medium-term consumer financing to enable households to acquire off-grid technologies.
Further, the PPP Act details the laws gov-erning partnership projects between state and private entities and specifies the procedures for preparation, tender process, approval, and implementation. With private sector investors expected to develop mini-grid projects in Kenya under the PPP model, the regulations outlined under the PPP Act, 2013 will be applied in the implementation of these projects.
Rural electrification masterplan and off-grid system integration
In December 2018, GoK launched the Electricity Sector Investment Prospec-tus which presents the investment op-portunities in the energy sector over the next 5 years valued at about USD 14.8 billion. The Prospectus covers oppor-tunities in power generation, transmis-sion, distribution, off-grid electrification, mini-grids and solar systems for homes and institutions. A map for existing, planned and potential mini-grids loca-tion is included.

RE-thinking Access to Energy Business Models
100
It is important to note that the current regulations in Kenya do not protect pri-vate off-grid investors from risks posed by the arrival of the grid.
Licence and permit procedures
The Energy Act, 2019 stipulates reg-ulations governing the development, licensing and generation of power by mini-grids. The Act outlines that no authorization is needed to generate electrical energy for personal use of a capacity not exceeding 1 MW. The Act also states that a consumer who owns an electric generator with a capacity of less than 1 MW may apply to enter into a net-metering system. Furthermore, the Act introduces new regulations that govern the distribu-tion of electricity by other players other than KPLC. The solar-PV Systems Regulations 2012, provides for licensing of manufactur-ers, importers, vendors, technicians and contractors involved in solar-PV systems. However, GoK is currently drafting new regulations to govern the solar-PV systems.
The National Environmental and Man-agement Authority (NEMA) formulates environmental regulations which power producers are expected to comply with, as it is a requirement that must be fulfilled in order to receive a licence/permit.
Financing overview
Off-grid projects in the renewable sector are usually financed using debt
and capital. Debt is typically sourced from DFIs, local units of foreign lenders, as local commercial banks generally charge higher interest rates due to their higher cost of funding and higher risk perception towards these projects. According to the Kenya Electricity Sector Investment Prospectus (2018-2022), Kenya requires approximately USD 0.9 billion for off-grid electrification: USD 690 million is expected to come from the Government and DFIs, while USD 200 million will be from private sector players.Off-grid and mini-grid developers use various digital platforms to collect payments from consumers. This has not only made the collection process seam-less but also reduced default cases.
Challenges and Opportunities
Challenges affecting the off-grid sub-sector include:
■ Relatively high cost of investment and installation for RE technology.
■ Limited availability of technical know-how to implement the technology.
■ Lack of adequate local financing from local commercial banks in Kenya.
Opportunities available in the off-grid sub-sector include:
■ Abundance of RE sources and limitations of the main grid supply of power provide a favourable environment for the development of off-grid solutions.
■ With about 25% of total population without access to electricity, Kenya
provide a relevant market for off-grid solutions.
■ The set regulations and policies governing the energy sector in Kenya provide an enabling environment for private developers to invest in the sector.

Policies and Regulations for decentralised RE solutions
101
Ethiopia
Overview on energy policies
Despite having the third highest gener-ation capacity (c. 4,300 MW)184 in Africa, Ethiopia’s electrification rate stands at 44%, with 33% of the population con-nected to the grid and the remaining 11% utilising various off-grid solutions. Nonetheless, the Government of Ethi-opia (GoE) plans to achieve universal electricity access by 2025; 65% of the population is expected to be connected to the main grid, while the remaining 35% will be connected through off-grid technologies185. By the end of 2018, 2.2 million off-grid connections were made through Government-supported initia-tives and private sector involvement.
Main stakeholders and authorities
The Ethiopian Energy Authority (EEA), Ethiopian Electric Power (EEP) and the Ethiopian Electric Utility (EEU) were all established under the Energy Proclamation No. 810/2013 which was enacted in 2013. EEA is an independent sector regula-tor whose mandates include issuing licences and providing regulatory over-sight. Further, EEA is responsible for establishing standards and regulations required for the implementation of the grid and off-grid projects, including environmental safeguards, guidelines for off-grid tariffs as well as licensing off-grid energy generation, distribution and sale.
EEP was incorporated with the main mandate of generating and transmitting electricity, while EEU undertakes the distribution of electricity to consumers.
Key regulations, subsidies and agreements
The energy sector in Ethiopia is currently regulated under the Council of Ministers Energy Regulation no. 447/2019, which was enacted in 2019 and the Energy Proclamation No. 810/2013. The Proclamation stipulates the roles and responsibility of EEA as well as reg-ulations guiding the issuance, renewal, transfer and revocations of licences and permits that are needed in the energy sector, whilst the Regulation outlines the licence approval process for off-grid projects and provides EEA with the authority to approve off-grid tariffs. In 2012, Ethiopia developed a draft FiT Proclamation. However, this is yet to be enacted and in August 2019 the GoE announced that it was working on developing a formula to calculate tariffs for mini-grid projects.
Rural electrification masterplan and off-grid system integration
In March 2019, GoE launched the Na-tional Electrification Program (NEP) 2.0 which contains a detailed framework for the integration of both on-grid and off-grid technologies to enable Ethiopia to achieve the universal energy access goal by 2025. Moreover, the current reg-ulations in Ethiopia provides protection to off-grid investors from the arrival of the grid.
Licence and permit procedures
The EEA is mandated to determine guidelines for off-grid tariffs as well as award licences for off-grid energy gen-eration, distribution and sale.Licences are required for mini-grid projects above and below 50 kW and the recently published draft directive by EEA outlines the requirements for issuing these licences.
Financing overview
The Development Bank of Ethiopia (DBE) provides loans to micro financial institu-tions and private sector enterprises to enable them to provide solar lighting and charging products and solar home systems. DBE utilizes the credit line it receives from the World Bank to provide loans to the aforementioned institutions. According to NEP, Ethiopia requires USD 2.5 billion in off-grid investments to reach 35% electrification through off-grid tech-nologies by 2025.The GoE is expected to contribute USD 1 billion, while the pri-vate sector will contribute by investing the remaining USD 1.5 billion.
Challenges and Opportunities
Challenges affecting the off-grid sub-sector include:
■ Relatively high cost of investment a n d i n s t a l l a t i o n o f o f f - g r i d technology, which makes it difficult for majority of Ethiopians who earn low income to purchase the off-grid technologies.

RE-thinking Access to Energy Business Models
102
■ Bureaucratic approval processes, which slow down the development process.
■ Limited availability of financial resources, including delays in foreign currency exchange while purchasing off-grid power infrastructure products as well as inadequate consumer financing coupled with high interest rates.
■ Inadequate technical know-how to implement the technology in the market.
■ Country security risk.
Opportunities available in the off-grid sub-sector include:
■ Vast availability of RE sources that can be harnessed to generate power.
■ Untapped market as the majority of the Ethiopian population does not have access to electricity.
Zambia
Overview on energy policies
In Zambia, the close connection between economic growth and access to modern energy services is well understood, as the lack of modern energy services is a serious limitation to economic and social growth. However, Zambia’s electrification rates still remain among the lowest in comparison other Sub-Saharan African countries. The energy sector in Zambia was liberalized in 1995, enabling the Gov-ernment of Zambia to attract private investment into the sector. Despite having burgeoning agriculture, man-ufacturing and tourism sectors, the Zambian economy is essentially based on mining. According to Power Africa, access to electricity in Zambia averages 31%, with 67% of the urban and 4% of the rural population having access to electricity186. With the majority of population lacking access to electricity, the development of the RE sector offers many prospects of mitigating energy deficits in a country that has vast RE re-sources in hydro, solar, wind, bioenergy and geothermal forms.Utilisation of RE technologies in Zambia began in the 1930s with the construction of the first hydropower infrastructure that provided electricity in the mining and urban areas. Until the introduction of rural electrification programs, the provision of electricity was concentrated along the rail lines (e.g. from the south-ern to the Copperbelt province) and
in various urban centres. An enabling framework is therefore needed to scale up decentralised systems as a suitable approach to face the electrification challenge.
Main stakeholders and authorities
The energy sector in Zambia is gov-erned by the Energy Regulation Act which outlines various SoEs that reg-ulate, develop, transmit and distribute electricity. On one hand, the Energy Regulation Board (ERB) regulates the energy sector in Zambia and is responsible for issuing licences to operators/utilities, setting tariffs and monitoring competition in the market. Zambia also has a Rural Electrification Authority (REA) which implements rural electrification mech-anisms to extend the energy access to rural areas. REA also provides subsidies for capital costs on projects designed to supply energy in rural areas.
On the other hand, the Office for Promoting Private Power Investment (OPPPI) is a unit in the Ministry of En-ergy that represents the Government’s interests and provides a focal point for coordination with other governmental agencies to promote private-sector involvement in electricity generation and transmission.
Key regulations, subsidies and agreements Zambia’s power sector activities are regulated by the following regulatory policies: Energy Act no. 14 of 1995; Na-

Policies and Regulations for decentralised RE solutions
103
tional Energy Policy (2008); Rural Elec-trification Master Plan (2009); the draft Renewable Energy Strategy (2010); Climate Change Policy (2016); Zambia’s Nationally Determined Contribution (NDC) to the Agreement on Climate Change UNFCCC (2015).
The Electricity (Grid Code) Regulations of 2013, the Zambian Distribution Grid Code of 2016, the Electricity (Supply) Regulations of 1995 and the Power Quality Management Framework for the Electricity Supply Industry in Zambia of 2014 lay out technical requirements to which a mini-grid project must adhere in accordance to the standards set by the Zambian Bureau of Standards (ZABS).
Zambia has not yet enacted regulations specific to off-grid projects. As such, off-grid projects abide by the general regulation of the energy sector which is regulated by the Energy Act and the Electricity Act as well as regulations and codes made thereunder, such as the Grid Code and the Distribution Code. However, in October 2018, ERB approved a regulatory framework for mini-grids in Zambia, with pilot studies commencing in November 2018. The results are expected to be incorporat-ed in regulations to be gazetted. The regulatory framework was developed by a mini-grid team of EU supported consultants and ERB officials, in consul-tation with key stakeholders, including government, private sector, civil society and development partners. It must be noted that this regulatory framework has not been issued through a statuto-
ry instrument, so a regulation specific to off-grid projects doesn’t exist yet.
There is no clear policy on how the electrification of a site may be allocated between Zambia Electricity Supply Corporation Limited (ZESCO), REA and the private sector. However, the Zambia Development Agency Act provides investment promotion and protections measures for investors in terms of ac-quisition of property, but it is silent on the protection against competition.
The Rural Electrification Fund (REF) managed by REA may subsidize up to 50% of the capital costs with remaining funds to be secured by the developer with a minimum level of 20% of equity, and a minimum internal rate of return of 10% before subsidies. However, only one private mini grid has received funding from REF so far.
Rural electrification masterplan and off-grid system integration
Zambia has currently developed a Pow-er System Development Master Plan, the objective of which is to provide a blueprint for Power System Devel-opment in the country up to the year 2030. A Rural Electrification Master Plan is also available..There is currently no regulation or policy in Zambia for the eventual arrival of the national grid at the mini grid location. As a result, there is a regulatory gap regarding the procedure for mini grid interconnection on the arrival of the national grid, and hence a lack of com-
pensation mechanism if this were to happen. On the other hand, in the case of mini grid integration into the main grid, regulations such as the 2016 Zam-bia Distribution Grid Code (intended for individual customers and embedded generators), the 2016 Grid Connection Guidelines (intended for individual cus-tomers and IPPs) and the 2016 Model Grid Connection Agreement (intended for IPPs) would provide guidelines on what would likely apply to mini-grid interconnection or integration.
Licence and permit procedures
Mini-grids are categorised in three ways in the Electricity Act and in the Electricity Regulatory Act: category I (<100kW), category II (between 100kW and 1MW ) and category III (>1MW ). Therefore, mini-grids are categorised by size and complexity. The ERB also requires all mini-grids to be licenced as there is differentiation in the manner they are regulated.
Mini-grid operators also need envi-ronmental licences from the Zambia Environmental Management Agency (ZEMA) which is the independent environmental regulator and coordi-nating agency. The ZEMA approval is a prerequisite for various permits such as the energy permit, water permit (for mini-hydro projects) and the Environ-mental Impact Assessment regulation.
Financing overviewThe local financial intermediation facilities for mini-grid projects are in-

adequate. As such, the majority of the mini-grids are financed by a mix of sub-sidies, grants, long-term debt from DFIs and international financing programs, as well as equity. Furthermore, in February 2018, the Green Climate Fund (GCF) approved a USD 50 million loan and a USD 2.5 million grant funding proposal of the African Development Bank for Zambia’s Renewable Energy Feed-in Tariff (REFIT) policy to finance 100 MW of renewable projects, mostly solar power, through long-tenor project loans. GCF is also ex-pected to provide technical assistance
to build capacity for rural electrification, currently at 4%, and help local financial institutions invest in off-grid and mi-ni-grid RE projects.
Challenges and Opportunities
Challenges affecting the off-grid sub-sector include:
■ Relatively high cost and specialized knowledge required for off-grid solutions.
■ Rural settlement structures tend to be relatively scattered and the low
population density makes it expensive for mini-grids.
Opportunities available in the off-grid sub-sector include:
■ Opportunity for investment in solar PV technology, for which Zambia is suitable given its abundance in irradiation levels.
■ With only 31% of the population with access to electricity and with the national supplier not being able to meet national demand, there are relevant opportunities for off-grid solutions and investments.


A technician working on smart meters during min-grid construction – Lake Victoria, Uganda

107
7. Financing the deployment of off-grid solutions
The chapter presents the different financial instruments available to finance the capital cost associated with the identified off-grid mini-grids solutions in Sub-Saharan Africa (section 7.1), the risks typically associated with these invest-ments for project developers and the potential mitigation measures (section 7.2), before concluding on the type of finance and payment mechanisms available for energy customers (section 7.3).
7.1. Type of finance available for the mini-grid sector
As any other energy systems, such as grid connected ones, mini-grid systems based on renewable energies require upfront capital investments, which should theoretically be borne by the beneficiary. However, the present situation in most Sub-Saharan African countries is that applied electricity tariffs are usually too low to recover mini-grid investment costs due to the customers’ low purchasing power in rural ar-eas. As a result, mini-grids are currently not financially viable in this context. Still, given the decrease in the price of renew-able-related equipment, mini-grids utilising solar-PV are seen as an increasingly attractive option for electrification. The total installation costs of mini-grids in Africa varies by system size, technology applied as well as choice of energy access tier and soft costs. The median value of the solar-PV mini-grid cost is USD 2.9/W, with little difference for the on- and off-grid projects. The average values are higher for off-grid systems, compared with on-grid systems. Larger systems have a lower cost variance, whereas the cost variation is the largest for off-grid systems under 125 kW 187 (Figure 32).
IRENA also highlights regional differences, with PV mini-grids in North Africa and East Africa having a lower cost per watt compared to systems in West Africa. Several factors impact
the installation cost of a mini-grid, such as the equipment costs (PV module, inverter, battery if needed, and other hard-ware), and soft costs as project development, permit, financ-ing and contract fees, interconnection, mark-up, training and capacity building.
Figure 32 – PV mini-grid system costs by system size in Africa, 2011-2015. Source: IRENA 188.
Nowadays, the majority of rural energy projects in Africa involve the private sector which usually engages through a concession scheme. In this case, broadly speaking, two types of financing approaches exist189:
■ Project Finance, based on income from individual large asset projects with finance tied to that specific asset and financial incomes from one specific customer. This approach requires regular and predictable revenues from reliable sources (e.g. government or private businesses such as tourist resorts,

RE-thinking Access to Energy Business Models
108
agro-industries or telecom towers). It corresponds to the Anchor-Business-Community customer model (hence mini-grids usually over 1MW) and is currently not frequent in Sub-Saharan Africa.
■ Corporate Finance, based on multiple assets shared among different customers, with finance tied to a business that invests in assets which generate financial incomes. This is the model that will mainly be treated in this chapter as it’s the most frequently used one in Sub-Saharan Africa (e.g. mini-grids below 1 MW).
In order to turn a project concept into reality, a sustainable financial structure must be defined, which highly depends on the type of developer, country of intervention and type of business model. With this premise in mind, in theory there are indirect financing forms of support, such as guarantees, and direct ones. The three main types of direct financing mecha-nisms for mini-grid developers are grant/subsidy, equity, debt and a mix of these, which can be summarized as follows.
■ Grant aims to reduce high upfront and capital risks, to allow for higher socio-economic impact or to provide technical assistance, mainly to pilot or scale-up projects. In order to avoid later energy market distortions, which are very often linked to this financial mechanism, such instruments are normally only applied in early stage market phases where market players are fully aware when such support will be reduced or ended. Grants can be results-based or upfront. Upfront grants can be used for capital intensive and high risks operations to reduce the capital exposure of the project’s initiator. Results-based grants provide payments at certain milestones190 (start of operation, specific amount of electricity produced, number of customers connected). The main disadvantages of grants/subsidies concern transaction costs and the fact that the more projects rely on grants, the more difficult it is to expand and/or scale them up. Additionally, considering rural customers’ low ability to pay, grants/subsidies are crucial even in very successful pilot or scale-up projects. As illustrated by a recent study on two mini-grids in Tanzania conducted by the Next Billion initiative191, the tariff reduction led to a significant increase in energy consumption. Interestingly, the loss of revenue due
to lower tariffs was almost entirely compensated by the increased revenues from higher consumption. But higher consumptions entail costs for the energy developer (higher OPEX for fuel-based plants or higher CAPEX or revamping for renewable-based plants). Therefore, the developer needed tariff subsidies to be able to lower tariffs.
However, relying on grants is risky due to potential discontinuity caused by unforeseeable changes in support mechanisms by governments or donors. Limiting grant supporting capital expenditures is therefore recommended. As evidenced by the cases presented in this study, most mini-grids in Sub-Saharan Africa currently need grants and subsidies, accordingly for at least 30% of investment costs to reach the financial sustainability192.
■ Sources of equity can be impact investors, angel investors, venture capital, investment firms and multilateral or bilateral clean energy funds, which give funds in return for the company’s partial ownership. For instance, the EU ElectriFI is an impact investment facility established by 15 European DFIs that invests in RE companies aiming at improving energy access through equity, debt or guarantee193. In the case of public financing, equity is usually limited to a minor share to ensure that the ownership remains with the private sector.
■ Commercial banks are the most common source of debt, but the World Bank and other development institutions may use clean energy funds to provide commercial banks with lines of credit for loans to finance mini-grid projects194.
In developing countries, given mini-grids’ small size, there is often a lack of suitable financing options from the national commercial banking system, and high transaction costs for project finance. In this context, the involvement of the public sector and DFIs in fi-nancing can have a positive risk mitigation effect. Donors via their DFIs and related facilities195, governments, or local commercial banks can provide direct loans for mini-grid projects.
Direct financing can include hybrid mechanisms, such as mezzanine capital196. Mezzanine financing is a hybrid of debt
There is often a lack of suitable financing options from the national commercial banking system, and high transaction costs for project finance

Financing the deployment of off-grid solutions
109
and equity financing that gives the lender the right to convert to an equity interest in the company in case of default. Senior debt is secured for a given interest rate and time period. The private company provides regular principal and interest payments to the lenders based on a set schedule. This makes the debt less risky, but gives a lower return to lenders. The provision of capital at more attractive interest rates can help to improve the financial viability of mini-grids.In practice though, access to finance is often lacking in terms of quantity and quality. To date, and as confirmed by the cas-es considered in this study, RE mini-grids in rural Africa have not been financially viable without a grant component. Nei-ther equity nor debt mechanisms have been able to recover capital investment with acceptable IRR or payback.
The above-mentioned mechanisms can be used in sequence through layered funds. These can be seen as both a source of financing and a mechanism of public support to private investment in mini-grids. These funds allow for different share classes, which absorb different levels of risk exposure. With this instrument, the public sector or donor absorbs the first loss investments and creates a safety cushion for private sector investors. Public finance for mini-grid projects can also take the form of subsidies, concessionary loans, and the development of new, inclusive financial instruments such as credit guarantee programmes and blended finance struc-tures. Examples include197:
■ in Bangladesh, the Infrastructure Development Company Limited (IDCOL) is blending public finance they receive with commercial equity from energy companies;
■ in Nepal, the government provides subsidies to the off-grid sector to specific communities based on gender, remoteness and social group. Donors and the government channel their support to the Central Renewable Energy Fund which transfers the funds to commercial banks and microfinance institutions (MFIs) for investments in off-grid appliances.
A combination of debt, equity and grants (or mezzanine financing and other hybrid mechanism) can be a positive solution for mini-grid projects. The lender has access to
cash flow from existing and new operations, as well as to as-set-based creditworthiness. The debt/equity share probably depends on the operating method (and associated risk) and from the expected results/impacts of the mini-grid project. The share also depends on the percentage of renewables in the energy mix (more renewables means more intensive capital costs and fewer operational costs compared to con-ventional sources). The recommended model is to have the OPEX and the debt principal and interest payments covered by revenues from the energy supply. The grant and equity share of the remaining CAPEX depends on the level of grant which can be leveraged by the mini-grid developer.
Energy services built around PUE can attract funds from blended finance, impact funds, development banks, international financial institutions (IFIs), etc. due to the WEF nexus and the positive spill-overs of the PUE. To stim-ulate PUE, governments and donors should establish credit schemes and concessional loans, as well as test innovative finance instruments such as results-based financing and targeted subsidies198. Some of these instruments target end-users and will be described in section 7.3. Blended finance structures with local currency funds have the po-tential to stimulate the PUE market. For instance, African Development Bank, Nordic Development Fund and Part-ners launched an Off-Grid Energy Access Fund with USD 58 million199 in 2018.
7.2. Mitigation of financial risks for mini-grid developers
Uncertainty is a core notion of the RE business since most often the electricity generation depends on climate and weather conditions. Mini-grid developers also face the issue of system complexity: multi-actors, multi-customer types, multi-technical solutions, multi-sources of financing and multi-project dimensions (cross-cutting actions in the rural development sector). They have to understand the cause-ef-fect relationships and, since mini-grid projects concern sev-eral sectors, it often results in a lack of knowledge on some aspects beyond the mini-grid technology200.

RE-thinking Access to Energy Business Models
110
As mentioned in chapter 4, mini-grid power plants use different tech-nologies, the most common being biomass gasification, diesel, hydro-power, solar PV and wind; these technologies can be used alone or in combination, with or without energy storage (usually through the
use of batteries). In this study, 21 cases were analysed covering the following typology: hydropower, solar-PV, solar-PV and diesel without battery, solar-PV and diesel with battery.In addition to asset costs, project development costs account for about 11% of total CAPEX201 and they should include risk assessment and risk management planning to mitigate exist-ing and perceived risks, as this can influence the viability of a project to a large extent202. The risk profile of the case studies depends on local con-ditions, operating methods and the technology employed. Hydropower and solar mini-grids are characterized by relatively high investment costs and low operational costs. At a global level, the LCOE is favourable to hydropower (0.05 USD/kWh) compared to solar (0.1 USD/kWh)203, even if the data refers to all size of hydropower and solar plants. In the future, the gap between the two technologies is ex-pected to narrow as the best sites for hydropower will be al-ready developed and PV technology costs should continue to decrease. Hybrid solar-diesel mini-grids are characterized by relatively lower investment costs in the technology but higher operational costs, which increase according to the percentage of electricity generated from diesel component. Adding batteries to the system means the diesel generation could be decreased in favour of solar generation, even if replacement costs during the lifetime of the system will be added according to the battery technology (usually in a range between 4 and 20 years). For mini-grids with a high renewable component in the energy power mix, the risk is high during the construction (capital intensity) and start of the operation phases (usually low energy consumption per customer and related low cash flow in newly electrified communities), whereas hybrid sys-tems have lower risks during the capital intensive phase but
higher during the lifetime of the system (fuel delivery, fossil fuel price instability). In the electricity sector, mini-grids are still a niche in terms of MW produced. However, according to IEA204 and World Bank205 they are expected to play a major role for electrify-ing rural and remote areas in Africa in the coming decade. They represent a different model of development compared to national grid creation or extension with its power plants, transmission lines, transformation stations and connections to the different type of customers. National grids are usually developed by public electricity utilities with financial support from the State, whereas so far mini-grids are rarely developed by national states or state-sponsored bodies.
The development risk is the risk entailed by an early investor that its money invested in site identification, feasibility studies and impact assessments, fund raising, permitting procedures, legal agreements will be lost or paid back with significant de-lays. The drivers of this risk include lack of financial viability, ab-sence of technical feasibility, no or time consuming and costly administrative procedures (e.g. for licensing to operate). Thus, mini-grid developers may strategically decide to develop a large portfolio of projects or stay focused on highly-selected ones:
■ in the first case, they should be aware that only a few will be realized and will therefore have to cover for the risk of the non-developed ones with higher development costs and higher opportunities of scaling-up the business;
■ in the second case, they should be aware that a project may take longer time than expected to turn into reality but development costs are likely to lower.
The selected strategic approach drives to a higher or lower development risk and is often linked to the value proposition of the business model. As mentioned in section 2.2, a large portfolio of projects usually reflects a business model aimed at defining the community profile in advance (and its pre-se-lected energy needs) in order to guide the identification of eligible target markets (e.g. minimum market size, minimum ability to pay, minimum size/type of anchor loads, etc.). On
Mini-grids are still a niche in terms of MW produced but are expected to play a major role in the coming decade

Financing the deployment of off-grid solutions
111
the other side, a highly-selected portfolio of projects is typi-cal of a business model aimed at addressing the needs of a pre-selected target market, which reflects strong ties with a geographic area or context of intervention (e.g. a given region or type of environment, such as islands).
In any project type, development risk may include waste of time (e.g. due to long procedures), waste of economic re-source (e.g. due to extra personnel and logistic costs) and a loss in terms of credibility vis-à-vis sponsors or partners. These factors can affect any type of project developers, including profit and non-profit actors. However, while non-profit actors are highly exposed to development risks, others may explore alternative solutions, even challenging ones.
One option to mitigate development risk is, indeed, to con-sider recovering only the OPEX through cash flow whereas the CAPEX and associated development costs are financed through grants. Based on the cases considered in this study, 15 out of 21 business-models function to recover the OPEX only. Moreover, projects operated by NGOs are more finan-cially viable than those operated by public entities and all of them consider energy-related products/services, including WEF-related ones as part of their business plan. These expe-riences point out (i) the possibility that grant-funded projects can serve as pilot programs to demonstrate, albeit partially, the financial sustainability of energy access initiatives, (ii) the opportunity of supporting viable productive use of energy and local business activities as a mean to improve the busi-ness case of the energy supplier, and (iii) the effectiveness of a bottom-up approach applied by NGOs well-rooted in local context in mitigating development risk and positively affect business operations.
Off-taker risk is when the buyer of electricity does not pay or delays the payments for energy to the supplier. The buyers could be either the grid operator, in case the mini-grid also inputs extra-power into the national grid, or final end-users. The risk of delay or non-payment of electricity by end-users can be mitigated by adapted financial instruments (see section 7.3.) and payment systems (see section 3.2). To date,
payment of FiT often does not concern mini-grids since they rarely feed renewable energy to the grid (as the hydropower project of Matembwe-Ikondo analysed in this study, which is the first case in Tanzania). Still, it can be a way to support rural electrification. Two countries covered by this study, Kenya and Tanzania, have a FiT for renewable energy produced by mini-grids206. In Tanzania the draft Electricity Systems Oper-ations Act 2016, under approval, gives priority for dispatch to the electricity generated from RE sources and indigenous sources. However, this act does not specify guidelines regard-ing the power forecast period. Despite the existence of FiT and small power purchase agreements (SPPAs) for grid-con-nected projects, renewables-based power generation is unattractive to private investors due to the weak financial position of TANESCO, the sole off-taker, and the government’s inability to guarantee payment if TANESCO defaults. In Kenya, the standard FiT is 0.10 USD/kWh for solar off-grid projects of 0.5 to 1 MW with 8% scalable portion of the tariff207. The Kenyan case studies have not benefited from the FiT since the capacity of the mini-grids were under the legal threshold (less than 0.5 MW). In Tanzania, the off-grid FiT is 0.25 USD/kWh208. However, in this case, the duration of the FiT under the PPA is not guaranteed by the law: this means that the regulatory entity can revise the PPA without prior negotiation with the operator and apply a lower FiT.
Market risk is a major risk faced by mini-grid developers and is related to the amount of electricity that is produced and sold. Uncertainty regarding electricity generation from renewables can be properly mitigated by an adequate engi-neering design, while uncertainty regarding energy demand actually represents a significant risk for investors, even if this too can be mitigated. A reliable energy need assessment is particularly important since it allows for developing reliable
load profiling. It follows that the accuracy of inputs provided by the energy need assessment is crucial in business modelling and mini-grid design, and reduces the investment risk209. Therefore, if the consumption and asso-
Uncertainty regarding energy demand represents a significant risk for investors

RE-thinking Access to Energy Business Models
112
ciated revenues do not match with the estimated load profiled, the risk of financial failure for the grid developer is high. The potential market is very seldom satisfied in the first years of operation. Whereas the number of potential household customers varies little over time, according to the demographic growth (migration phenomena within the surrounding area may occur to due attractiveness of the electricity supply), the penetration rate of such domestic market usually increases in the first 3-5 years of operation and then remains quite stable. However, the connection trend in mini-grid projects as well as the market penetration achieved over the time depends on several factors, such as pricing strategy, community ownership of the project, quality of service, external conditions affecting the ability to pay, complementary activities to support local develop-ment (including financial tools such as microcredit). The number of commercial/PUE-related customers is likely to increase during the duration of the project and the process can be accelerated by business support programmes, such as local business incubation, carried out during the project implementation and start-up phases as complementary ac-tivities of the project. The increase of commercial activities improves the household purchasing power, and therefore also the appetite for home appliances, hence energy needs.
The above means that market risks can be mitigated by stimulating the demand for electricity and new productive uses of electricity to ensure cash flow. Based on the cases analysed in this study, the most successful model to achieve this is where mini-grid operator includes the supply of ap-pliances to energy users, usually through a leasing system including the possibility to ultimately own the appliances. This is a good motivation for consumers to duly pay the
lease fee. However, this solution is challenging in low-income communities. In fact, increased consumption also means higher costs in increased energy gener-ation and storage in the case of solar energy, as the increase of consumption often starts with
household uses in the evening. Shifting consumption to daytime (e.g. to productive uses of energy) is therefore quite profitable. Consequently, there is an interest in focusing on the financing of daytime energy appliances, such as those used in food chains and other local small businesses. The ACRA case study in Tanzania is an example of a successful demand management strategy to allow for a higher number of businesses and anchor loads to be connected and boost economic empowerment of local communities without hampering domestic electricity demand (see section 4.1.3).
Mini-grids are developed in isolated locations where analys-ing the potential electricity consumption is key to success. Off-grid areas in Sub-Saharan Africa are usually rural areas where agriculture is the main activity. Therefore, it is key to carefully evaluate the different local productive value chains and their potential needs for energy210 as well as the sea-sonality of revenues. Indeed, the financial viability of these value chains directly influences the possibility for energy consumers to pay for electricity – hence the business case of the energy supplier.
Food production is usually the most relevant production chain in rural areas of Sub-Saharan Africa, and therefore a WEF perspective is likely to enhance the financial viability of energy investments. However, at least regarding food production, this can be challenging. Indeed, revenues of farmers and/or small and medium agri-food businesses are seasonal – e.g. highest after harvest and the lowest during plantation. This represents another risk for mini-grid oper-ators running in rural areas. The liquidity risk is when the timing of an investment does not match with that of cash flows. There are different ways to mitigate liquidity risk. At end-user level, leasing energy appliances for productive uses constitutes a good strategy. It will allow the consumer to improve its own liquidity profile to make regular payments to the mini-grid utility for the energy consumed. Another way of potentially mitigating this risk is to ask customers to make fixed payments per number of appliances when used at a household level (based on the power of each appliances) and not per energy consumed. This is usually the business-model
market risks can be mitigated by stimulating the demand for electricity and new productive uses

Financing the deployment of off-grid solutions
113
of PAYG companies providing indi-vidual systems like SHS. However, such payment strategy should be evaluated carefully in the case of a mini-grid depending on how stable the population is in the area
during the year. For instance, villages with a vibrant economy are sometimes composed of people from surrounding areas who prefer a consumption-based tariff. Otherwise, as it hap-pened at the case study analysed in Zambia, the quality of service does not meet the customers’ expectation at a given flat tariff and 46% of users of the first year of operation turn out to be disconnected in the third year. Energy companies building and operating the mini-grid can also establish a Debt Service Reserve Account (DSRA) to cover the debt prin-cipal and interests before paying dividends to shareholders. This is an interesting instrument in projects with high capital intensity and low maintenance costs such as RE projects. The DSRA is built up in the company balance sheet based on the number of months this buffer could be used to pay for projected debt service obligations.
Generating adequate revenues from tariffs is an obvious way to recoup OPEX. But finding the right level of tariffs is easier said than done in rural areas of Sub-Saharan Africa. The challenge lies in combining affordability of energy access in areas where people have a very low purchasing power (low tariffs) with ensuring adequate revenues for the private sector to invest in energy supply (tariffs high enough to cover OPEX and at least part of principal and interest payments). Ways to address this challenge include:
■ a combination of regulated tariffs, often tailored to the consumers’ purchasing power – hence sometimes involving communities in the decision-making process (e.g. in Tanzania) – and the size of the energy supply, with financial support to the energy supplier (e.g. subsidies and financial incentives). For the private operator, this bears the risk of vulnerability to reduction of the tariffs by the regulator. This is a reality and is usually not associated with an increase in financial support. Increasingly, small mini-grids (<100 kW) are
exempted from regulatory tariff approval (e.g. Tanzania and Nigeria), which leaves it to the energy operator to negotiate tariffs with energy users and communities. In this case, cross-subsidisation, whereby a group of customers is charged higher tariffs to subsidise lower prices for another group, is sometimes applied;
■ support to improve the financial viability of productive use of energy – in particular regarding food production – as a mean to improve the affordability of and willingness to pay for energy, which is a kind of incentive not sufficiently considered so far. European Union Energy Initiative - Partnership Dialogue Facility (EUEI PDF) and GIZ 211 propose a stepwise approach to promote PUE that can be summarised as follows:
– Step 1: Feasibility and early planning to decide whether or not to get involved in PUE;
– Step 2: Analysis of local economic structures and po-tentials for productive uses;
– Step 3: Planning of productive use promotion activities; – Step 4: Implementation; – Step 5: Monitoring and evaluation.
The currency risk occurs when the income and financing currencies do not match or when the value of the financing currency increased compared to the value of the income stream. In other words, this risk happens when the financing currency is more expensive than the income currency. There are three options to mitigate this risk, which all increase capi-tal costs: currency hedging, currency risk guarantee fund and local currency lending:
■ Currency hedging is a contract between a finance intermediary and a company to lock the exchange rate on the same day for a transaction occurring in the future. The company loses any right to the profit in the currency exchange movement;
■ A currency risk guarantee fund can be established to cover the difference of value between hard and local currencies. Project developers are charged a fee that is transferred in an account which can be unlocked to cover for currency depreciation212;
■ Development finance investors have created local currency lending structures such as The Currency Exchange (TCX)
Finding the right level of tariffs is easier said than done

RE-thinking Access to Energy Business Models
114
fund and GuarantCo to lend money in local currencies. For borrowers, it reduces the currency mismatch. Lenders benefit from the portfolio of the currencies they offer and the number of projects to reduce their risk exposure.
The last category of risks includes tax risks, political risks and regulatory risks. Tax risks occur when the taxation regime changes over the lifetime of the project. This could be the case when solar products are exempted from import duties and the duties are re-established during the lifetime of the project, put-ting the grid operator in a critical position if it happens during the mini-grid refurbishment. Political risks include loss of assets due to violence, expropriation and limitation of money transfer outside of a country. The latter prevents the company to use the cash flows to pay investors. Regulatory risks in renewable energy happen when the authority modifies the PPA to a low-er FiT during the project period. For off-grid developers, this could happen if the FiT concerns mini-grids and if the duration of the FiT is changed during the project (20 years guarantee from the date of the first commissioning in Kenya for instance). Political risks and an unconducive economic environment could be reduced by risk guarantees, interest rate softening and burden sharing. The World Bank IDA Partial Risk Guarantee covers private investors against the risk of public entities not respecting their contractual obligations in a private project. Interest rate softening is when a bank receives donor funds to cover part of their lending risk in a specific sector, resulting in interest rates below the market for the local bank. Beyond awareness raising and capacity-building, another way of supporting an enabling environment for risk mitigation in mini-grid business is burden sharing. Burden sharing implies a split between local revenues and international donor grants to a RE project. Considering the cases here analysed, only 4 of the 19 projects not reaching the financial viability, would have reached an IRR higher than 12% in case an 80 to 85% of the CAPEX was covered by grant funds.
7.3. Type of finance available for energy end-users
Electricity systems should match supply to demand, so both aspects must be addressed. If the demand for electricity from mini-grids is overestimated, it will lead to mini-grid oversizing and financial losses (see section 4.1). Estimating the demand for PUE is particularly challenging, and requires an analysis of the local context and economic activities, and the engagement of the local communities to identify needs and opportunities. Still, PUE activities are crucial to boost demand for off-grid energy systems, while generating valuable income for remote communities and, ultimately, reducing poverty. Customer financing is only one of the actions that can boost local demand for electricity, other factors being capacity building, long-term support services, and provision of equip-ment and appliances. Both awareness of electricity benefits and potential PUE, and empowering activities for end-users should be envisaged to ensure the success of mini-grid projects. Capacity building should focus on the technical and business skills needed by the local entrepreneurs, and can build on existing vocational training. In some contexts, fe-male-only training courses should be considered to address gender issues213. Still, proper financial instruments for end-users are key to sus-tain the electricity demand from mini-grids. Unfortunately, in rural Sub-Saharan Africa, access to financing that meets end-user needs is currently rare. However, some countries have innovative technological solutions, particularly mobile money, which can contribute to empower energy consum-ers, particularly by reducing upfront costs and facilitating payments214.The two main financial channels that can be used to facilitate energy access are: working with MFIs to get loans to mini-grid customers, and adopting and optimizing PAYG systems as an end-user financing option for clean energy solutions (see chapters 3 and 4). MFI-led models can help deliver energy access. Indeed, microcredit can help the end-user to finance his business, which in turn would help him/her to pay for energy. Howev-er, MFIs are often reluctant to take on energy lending on their
There are three options to mitigate currency risk, and all increase capital costs

Financing the deployment of off-grid solutions
115
own, as they need technical support to better understand clean energy technologies215. Therefore, in SHS MFIs and en-ergy enterprises work in synergy to offer the most affordable credit options to end-users. This option could be extended to mini-grid operations.
Another pre-pay model is the Fee-For-Service (FFS), whereby the consumer pays a lump sum for the service and then makes regular payments to access energy. FFS and PAYG systems allow energy companies to independently provide credit to consumers, without relying on partnerships with MFIs or other financial institutions216. PAYG systems can be costly for enterprises to set up and operate, but as men-tioned in section 3.2, they eliminate costs associated with meter reading and billing, they avoid missed payments and efforts to deal with users’ arrears, and they improve customer assistance and control. In some cases, energy enterprises may look for MFI partners which can provide local currency capital and service loans, and develop hybrid PAYG and MFI partnership models. Interesting examples that combine mi-cro-credit and PAYG exist. For instance, Next Billion mentions a Ugandan energy company that offers its own PAYG options, while also building up MFI partnerships that has improved/expanded upon financing options to a wider base of clients217. Many energy enterprises – even some that already offer PAYG – request support to help them broker partnerships with local MFIs to provide energy credit to existing MFI customers, or to new customers they bring in. This has the advantage that the energy company can focus on installations, servicing products and after-sales services, while the MFI takes care of credit management, repayments and providing customers with further financing opportunities once they have paid for the products in full218.
Tariffs and subsidies also affect end-user energy demand. Pricing strategies, cost-reflective tariffs and subsidized tariffs have already been discussed in chapters 2, 4, 6 and earlier in this chapter and, therefore, will not be further discussed here. However, it seems worth mentioning an interesting form of subsidised tariff experimented successfully in India concerning “energy coupons” provided by the government
that can be redeemed for the purchase of electricity. Since they are given directly to customers, this form of subsidy gives policy makers the possibility to target the most vulner-able while requiring wealthier consumers to make greater financial contributions. Moreover, these subsidies allow the energy operator to broaden its consumer base and increase its revenues219.
In Sub-Saharan Africa, innovative business models such as mobile payment and micro-credit access have good poten-tial for improving access to energy. For instance, in Kenya the synergy between energy and mobile technology has al-ready enabled innovative business models that have made off-grid solutions more affordable. Development finance and international investors have also shown interest in the PAYG sector, and this may help scaling up this business model220.
New technology has opened new possibilities regarding en-ergy access in Sub-Saharan Africa, even beyond the “mobile revolution” allowing PAYG. For instance, crowdfunding cam-paigns are becoming increasingly popular among energy access companies, and even the developing community be-gins to consider crowdfunding as a serious vehicle for energy access finance221. Also emerging technologies such as block chain and cryptocurrency technologies are being considered innovative means of raising capital for energy access, despite the current lack of evidence to support this hypothesis222.
Furthermore, as mentioned in section 3.2, smart meters allow to feed well-structured data management, which plays a cru-cial role for access to finance, optimization of the mini-grid design and scaling-up strategy.
Financing options can target not only the provision of en-ergy from mini-grid, but also the financing for energy-intensive equipment: this will promote PUE that can increase customer pro-ductivity and income. Facilitating access to energy technologies strengthens the mini-grid chance
Mobile payment and micro-credit access have good potential for improving access to energy

RE-thinking Access to Energy Business Models
116
of success and has positive impacts on population and the local economy. For instance, the FAO Investing in Sustainable Energy Technologies in the Agrifood Sector (INVESTA) project shows that development partners, governments, the private sector and financial institutions should work together to ensure the financing, regulatory framework and training needed to enable end-users. This allows to identify and afford energy-efficient and productivity-enhancing energy technologies in the agri-food sector, which, in turn, have very positive socio-economic and environmental benefits223. The study also highlights that opportunities to increase adoption of clean energy solutions exist both in terms of financial innovative instruments, but also beyond financial aspects. For instance, the public sector can intervene on target setting and regulatory schemes, and collaborate with private and financial stakeholders to identify and develop
appropriate knowledge and education schemes, and busi-ness models224.
All the financing options discussed above contribute to increasing households’ energy consumption, which usually happens quite fast in the first 3-5 years of operations, and then slows down. From a financial point of view, this means that (i) the electricity developer has to choose between planning the initial increase from the onset of the operation, or to revamp the energy system in a second phase; (ii) once customers reach a minimum consumptions threshold (in rural areas it’s often within Tier 2, meaning access to basic lighting, mobile charge, TV, radio and small appliances), their ability to pay for further devices and electricity bills plays a crucial role, and (iii) com-bining household consumption with PUE helps addressing the challenges related to household consumption habits.


Group technical survey on off-grid plants in Lake Victoria’s islands – Kalangala, Uganda

119
8. RE-thinking Access to Energy Business Models
In order to seize opportunity of investing in rural electrifica-tion sector, it is necessary to analyse mature business models as well as explore emerging ones. As discussed in previous chapters, integrated projects, if properly designed, can contribute both to business viability and local development which, in turn, further support the sustainability of the project, in a sort of virtuous cycle. This chapter is aimed at encourag-ing developers, investors and decision-makers to explore and support integrated business models in mini-grid projects for rural electrification. Process for identification of the recommended business mod-els has gone through the analysis of case studies’ results, which are classified on the basis of three criteria: (i) services provided, (ii) operating methods and (iii) ownership (see chapter 2). The most promising models have emerged by using a multi-layer approach which has also taken into account the key features raised in the study: (iv) ways to apply a WEF nexus in the pro-ject, (v) community categorization in terms of local economy, type of PUE and ability to pay, (vi) type of mini-grid operator(s), (vii) the required regulatory framework and (viii) the correlation between investment size, profitability and impact.The above mentioned key features can shape the best busi-ness model for a given developer, in a given country, with a given investment ticket or capability of fundraising.
On this basis, four business models have been selected with a view to provide viable options:
■ Electricity supply & appliances provision: a private oper-ator owns and operate small RE power units providing DC electricity and small appliances to customer clusters.
■ Electricity supply & agri-food production: a Special
Purpose Vehicle (SPV) owns and operates a WEF nexus inte-grated business that provide electricity and water to both the local customer base and its own agri-food production and processing activities.
■ Electricity supply & water-related services: a public-pri-vate-partnership is established, with a hybrid ownership where the public entity usually owns energy distribution network and/or water supply system. The private entity man-ages electricity and water supply as well as ice production and retail.
■ WEF multi-service supply: a private entity operates the electricity supply, along with other energy-related services: retailing of small electrical appliances, microcredit services, and technical assistance. The energy investment is tied and anchored to an agribusiness company which offers rental space equipped or storage and processing services.
The Table 11 highlights main features and trade-offs between business models. Hybrid ownership and partnerships are often included, whereas the private entity usually maintain a leading role both in the development and operation phases. Each model brings its peculiar strengths and weaknesses, as well as opportunities and risks. Electricity supply & agri-food production model focuses more on horizontal integration and faces higher capital and regulatory risks as well as higher development impact and revenue expectation. On the other side, Electricity supply & appliances provision model brings lower risk related to capital investment and leaner ownership. While most of the models address similar customer base, from low-medium to medium income people, each model pres-ents different ownership model and level of WEF integration in the business.

RE-thinking Access to Energy Business Models
120
Table 11 – Key features and trade-offs of business models
Electricity supply & appliances provision
Electricity supply & agri-food production
Electricity supply & water-related services
WEF multi-service supply
Ownership private private-community or private-private
private-public private-private
WEF nexus integrated in the business
low high medium high
Type of supported PUE low-energy intensive high-energy intensive high-energy intensive high-energy intensive
Customer ability to pay medium low-medium low-medium low-medium
Development impact low high high high
Capital intensity low high medium medium
Regulatory complexity low high high medium
RE sources solar solar, biomass or hydropower
solar, biomass or hydropower
solar, biomass or hydropower
8.1. Business Model 1: Electricity supply & appliances provision
OverviewThe BM1 features a single private owner which operates the mini-grid. Generation is distributed through several small renewable power units providing DC electricity to custom-er clusters. PUE are restricted to relatively small appliances, such as fridges/freezers or little electric mills. Likewise, only basic level of service can be provided to public institutions such as schools or rural health centers. There are only two revenue streams (electricity sales and provision of applianc-es), but at the same time minimal assets are needed, with low capital investment per connection, which is appealing for accessing finance. Furthermore, the operating cost structure is limited to local sale and ordinary maintenance, easily managed remotely.
How it worksThe small power units, which serve 10-12 customers each, allow for high flexibility in terms of load management and distribution: they can operate independently or be inter-connected where needed (e.g. PUE requiring a peak power
not available from a single power unit) and thus allows for inexpensive coverage of isolated customer clusters. Expansion of the plant is also easy to perform, given the ‘plug-and-play’ nature of the generation units, the installa-tion of which can be phased based on financing availability and the market’s demand evolution. The customer base, limited to households, small productive activities and basic public services can be segmented in “tiers” of power avail-able depending on the type of subscription. Provision of DC appliances (through leasing, rental or sale mechanisms) is relevant to sustain electricity consumption and thus the viability of such small-scale mini-grid business model.
Key partnersKey partners include (i) a provider of DC electrical appli-ances, which the operator can either resell, rent or lease - depending on this commercial partnership they can be considered as part of the assets of the operator or not, (ii) a mobile money integrator to manage electricity and appli-ances payments.

RE-thinking Access to Energy Business Models
121
BUSINESS MODEL 1: ELECTRICITY SUPPLY & ENERGY-RELATED PRODUCTS
LOW POWER
MED POWER
HIGH POWER
small appliances (TV, fan…)
entry level appliances (lights, radio…)
fridges/freezer, small mills or other small productive use devices
Mini-grid operator
CUSTOMER BASETIERS
Revenues
Retailing of DC appliances
SMALL generation capacity
Electricity generation / DC distribution
Schemi a Blocchi BUSMO VISTI.indd 1 02/12/19 17:33

RE-thinking Access to Energy Business Models
122
8.2. Business Model 2: Electricity supply & agri-food production
OverviewThe BM2 fully embraces the WEF nexus approach. A Special Purpose Vehicle (SPV) is created between a private energy player and an agribusiness entity, that could be either a private company or a community-based organization, as sharehold-ing company. The SPV operates with a WEF nexus integrated business that relies on a large generation capacity to provide electricity and water to the local customer base of connected users, and to power its own agri-food production and pro-cessing facilities. In this scenario, the agribusiness shareholder contributes with the know-how needed to acquire or produce raw materials as well as process and retail agri-food products. Selling products not only to the local market but also to the regional and national ones allows the SPV to enlarge the market segment by sector and geographic scope. Investing through this model expects to gain relevant profit share from the agri-food business, as well as high development impact at the local level.
How it worksA multi-utility structure is established, supplying electricity and water-related services, which also produces and sells agri-food products. On the one hand, the business devel-opment involves a high level of complexity: the SPV with hybrid ownership, a high CAPEX due to multiple assets in energy and agri-food sectors, an O&M structure that requires a multi-skilled staffing with local management and remote supervision. On the other hand, the BM2 can result in an interesting business since the SPV directly manages both energy supply and anchor load (agri-food) activities, reducing off-taker risks. In this BM, the energy supplied to the agri-food activities directly managed by SPV does not provide cash flow, whereas it enables revenues from agri-food product sales. Thus, BM2 allows for various and differentiated revenue streams coming from electricity and water supply as well as the sale of agriproducts on a local and regional scale. The local customer base can include a wide array of local businesses,
since the plant can power high-energy intensive PUE such as large mills and other agri-food factories in the target area, and irrigation systems for local farmer associations. Thus, it has a broad impact on the development dimensions and long-term sustainability, which is a peculiar value proposition for access to finance.However, the water supply management can be implement-ed only if permitted by the country’s regulations. If the water management cannot be privatized, a partnership with the authorized local entity (e.g. water users association) could be promoted.
Key partnersKey partners include (i) local agribusiness association(s)/cooperative(s), which can be the suppliers of the agricultural raw materials which the SPV will process and retail, (ii) a distributor for the processed agri-food products to reach the regional/national market, (iii) a water users association if water management by private entities is not admitted by law, (iv) a mobile money integrator to manage electricity and applianc-es payments.

RE-thinking Access to Energy Business Models
123
BUSINESS MODEL 2: ELECTRICITY SUPPLY & AGRI-FOOD PRODUCTION
Shareholding
WEF integrated operator (SPV)
Domestic customers
Public services
Businesses
COMMERCIAL ACTIVITIES
AGRI-FOOD ACTIVITIES
ARTISAN ACTIVITIES
CUSTOMER BASE
Revenues Revenues
Agri-food activities
Raw material production/acquisition
LARGE generation capacity
Raw material processing
Electricity generation / AC distribution
Water supply
Agribusiness player
Energy player +
Regional market
Local market
Schemi a Blocchi BUSMO VISTI.indd 2 02/12/19 17:33

RE-thinking Access to Energy Business Models
124
8.3. Business Model 3: Electricity supply & water-related services
OverviewThe BM3 emphasizes the water component of the WEF nexus approach, and it is particularly suitable for specific contexts in which there is a vibrant fishing-based local economy along with an enabling regulatory framework which allows a private water supply management or a partnership with the author-ized local entity (e.g. water user association).A public-private-partnership is established between a private energy player and a public entity (e.g. national energy distri-bution company, water user association), with a hybrid own-ership where the latter maintains a separate asset property, usually the energy distribution network and/or water supply system. In this scenario, the private energy player operates with a WEF nexus integrated business that relies on a generation capacity large enough to support ice production, and manag-es electricity and water supply as well as ice production and retail. Microcredit services are a key financial tool to mitigate off-taker risk by sustaining customers in purchasing electrical appliances and in developing local business activities. This, in turn, also allows to achieve a higher project impact.
How it worksIn the BM3 a multi-utility structure that supplies electricity and water-related services, and also manages to produce and sell ice, is established. This means a lower level of complexity compared to the BM2, due to the ice business instead of agri-food ones, and a single operator – which can use or not an SPV – instead of a shareholding company. Consequently, on the one hand, CAPEX are lower and the investment risk is therefore reduced – since distribution assets are owned by the public entity – and the O&M structure is slimmer com-pared to BM2. On the other hand, the BM3 can result in an interesting business since the operator directly manages both the energy supply and the anchor load (ice factory), reducing off-taker risk. As in the previous model, BM3 allows for various revenue streams coming from electricity and water supply as well as ice sale in the local market. The local customer base can include a wide array of local businesses, since the plant
can power high-energy intensive PUE such as large mills and other fish-related activities as well as agri-food factories in the target area, if any. Additionally, offering dedicated microcredit finance services can help the spread of domestic appliances –without having the operator engaged in appliance retailing – and sustain the development of local business activities. This will also lead to (i) an additional revenue stream thanks to microcredit interests and (ii) increased electricity sales thanks to the use of electrical appliances. The project impact is notable and attractive for access to finance, and can be further increased if the water service also supplies irrigation systems.
Key partnersKey partners include (i) local fishermen association(s)/coop-erative(s), which would be the main customer for the ice sale, (ii) a microcredit operator in order to offer tailored microcredit services through a commercial partnership, (iii) a water user association if water management by private entities is not admitted by law, (iv) a mobile money integrator to manage electricity and appliances payments.

RE-thinking Access to Energy Business Models
125
BUSINESS MODEL 3: ELECTRICITY SUPPLY & WATER-RELATED SERVICES
Public services
LARGE generation capacity
Electricity generation / AC distribution
Water supply
Microcredit services
Ice Production
WEF integrated operator (Energy Player)
Public entity
Public-Private Partnership
Hybrid Ownership
Energy player
Domestic customers
CUSTOMER BASE
Revenues
Local market
+
Businesses
COMMERCIAL ACTIVITIES
AGRI-FOOD ACTIVITIES
ARTISAN ACTIVITIES
Schemi a Blocchi BUSMO VISTI.indd 3 02/12/19 17:33

RE-thinking Access to Energy Business Models
126
8.4. Business Model 4: WEF multi-service supply
OverviewThe BM4 fully embraces the WEF nexus approach as BM2 but it is focused on a multi-service approach: electricity and water supply along with agri-food processing services devoted to the same customer base. It is particularly suitable for contexts where there is a variety of running agricultural activities, with production volumes high enough to justify the installation of dedicated processing facilities.In this case, two private entities operate a WEF nexus integrat-ed business in partnership, without creating a joint SPV and maintaining the energy asset separated from the agri-food asset in a hybrid ownership model. The energy player oper-ates the electricity supply, along with other energy-related services: retailing of small electrical appliances, microcredit services and technical assistance thanks to a skilled technical team. As in BM3, the microcredit services are key financial tools to sustain the development of local business activities and acquisition of PUE equipment, such as welding machines or laundry-related ones, which are not included in retailing of the small electrical appliances (e.g. TV, radio, shaver, fridge) mentioned above. The agribusiness company provides agri-food facilities instead, offering equipped rental space or storage and pro-cessing services (depending on the context: milling or drying unit, cold storage services for dairy products, fruits, meat, etc.). The two partners operate interlinked businesses since the mini-grid operator sells electricity through a private-PPA to the agri-food facilities, which sells services to a common customer base. This model allows the sharing of investment risks between two players as well as mutual benefit of specialized expertise. Even if it integrates WEF components, this BM allows players to operate in their core business only. Optionally, the water supply management can be added by applying conditions described in BM3.
How it worksIn the BM4, the joint value proposition covers for a wide range of needs of the customer base, while keeping asset
ownership, CAPEX, OPEX and revenue streams separated. The energy player can make a broad-impact project without the need of in-house agri-business know-how and investment in local staff and assets, but benefits from its business partner that operates in this complementary sector, representing a re-liable anchor load for the energy business. On the other hand, the agribusiness company can penetrate markets otherwise not accessible without power supply, without being directly involved in the production and distribution of agriproducts, but only offering the processing facilities as a service. While this aspect maintains its activities simpler, it also limits its market to the local one.In this case, the mini-grid operator differentiates its revenue streams by providing additional services, such as the provision of small electrical appliances, which is not a specific trait of BM1. Microcredit services can be present at the same time to stimulate electricity consumption for business, offering assis-tance for PUE equipment purchase. The novelty, as observed in real case studies, is the provision of technical assistance services by its skilled staff as a way to monetize the diverse expertise of the technical staff, already trained to operate the other services. The local customer base can include a wide ar-ray of local businesses, since the plant can power high-energy intensive PUE beyond the agri-food facilities.
Key partnersKey partners include (i) a provider of AC and DC electrical appliances, which the operator can either resell, rent or lease – depending on this commercial partnership they can be considered as part of the assets of the operator or not, (ii) a microcredit operator in order to offer tailored microcredit ser-vices through a commercial partnership, (iii) local agribusiness association(s)/cooperative(s), which can affect the productiv-ity of local farmers – who are key users of agri-food facilities, (iv) a distributor for the processed agri-food products to reach the regional/national market with a view to favour agricultural activities, (v) a water user association (if water management is included), (vi) a mobile money integrator to manage electrici-ty and appliances payments.

RE-thinking Access to Energy Business Models
127
BUSINESS MODEL 4: WEF MULTI-SERVICE SUPPLY
Agribusiness player
Energy player
Public services
Domestic customers
CUSTOMER BASE
Revenues Revenues
Cold Storage
Food processing
Irrigation system
Microcredit services
Retailing of appliances
Technical assistance
LARGE generation capacity
Electricity generation / AC distribution
Local market
Business partnership
+
Businesses
COMMERCIAL ACTIVITIES
AGRI-FOOD ACTIVITIES
ARTISAN ACTIVITIES
Schemi a Blocchi BUSMO VISTI.indd 4 02/12/19 17:33

RES4Africa’s Micro-Grid Academy: moment from a field trip to visit a rural mini-grid in Maasai Mara – Nairobi, Kenya

129
9. Highlights and recommendations
Chapter 1
■ Universal access to electricity remains mostly a rural issue. Despite the fact that rural electrification is rising more rapidly than urban electrification due to lower population growth225, in Sub-Saharan Africa over 80% of the people without elec-tricity live in rural areas with an electrification rate for urban households estimated at 71%226.
■ Rural electrification should be on top of the priority list. From a development point of view, rural areas have the lowest proportion of access to modern energy services while, from a business point of view, they represent a huge and currently untapped market of about 600 million people in Sub-Saharan Africa.
■ To meet the SDGs, more than a five-fold cumulative invest-ment will be needed compared to the scenario which con-siders the policies and implementing measures adopted and announced as of mid-2018. Decentralised RE solutions are key in pursuing this goal in rural areas, where lack of access to electricity goes along with lack of access to safe water and unmet food security needs.
■ Designing a combination of grid extension, mini-grid and in-dividual systems is essential to ensure access to energy for all. The use of specialized software can greatly help governments in the definition of national electricity plans as well as devel-opers in scoping market opportunities. In line with this, grid extension and individual systems have traditionally received greater attention. On the other hand, mini-grid systems have been left behind, even if they can offer a collective solution at a relatively lower cost to facilitate basic needs as well as pro-ductive use of electricity, thereby promoting local economic development.
■ Solutions should be assessed on a case-by-case basis, given that sustainability of rural energy systems is context-specific. Even if the complexity of the rural electrification process and the variety of the African rural areas exclude univocal solu-tions in terms of technologies, business plans and financial support mechanisms, reference business models for viable projects can be identified.
Chapter 2
■ Integrating electricity supply with PUE and other energy-related or WEF nexus-related services/products, particularly in the agri-food chains, can both promote local development – on which public finance institutions often put significant emphasis – and improve the financial viability of decentralised renewable energy solutions.
■ With reference to this study, 6 out of 7 projects that integrate energy-related or WEF nexus-related services/products (the one exception is justified in section 2.3), are ranked among the top-10 most financially sustainable projects. Integrated projects usually bring the following key benefits: (i) direct financial benefits in terms of IRR, (ii) indirect financial benefits in terms of customers’ income and related higher ability to pay for electricity (e.g. electricity supply for PUE enable long-term savings of business activities), and (iii) social benefits (e.g. regarding health and education services as well as knowledge economy).
■ The present study defines different levels of compatibility & integration of PUE in mini-grid systems: (I level) restricted compatibility with PUE, (II level) full compatibility with PUE and (III level) full compatibility with integration of PUE in the business. The I level, which typically includes small size

RE-thinking Access to Energy Business Models
130
installed capacity or DC distribution, is only represented by 19% of cases. The II level represents the majority of the analysed cases (62%): PUE is included as a result of the project and boosted by supporting activities. The III level, where developers also invest in WEF related services (e.g. water supply, food production/processing), represents the minority as well (19%): it is still a niche market and represents an interesting innovation in this sector.
■ 3 out of 4 cases that are fully compatible with the integration of PUE in the business (III level) are owned by community entities. This factor could suggest that partnerships with local cooperatives/associations structured or empowered during the project development phase is key to successfully carry out high-impact and viable rural electrification projects.
■ Investing both in energy and in other complementary sectors allows developers to cover the whole chain – energy supply and its productive use – with revenues from both types of activities. However, this model brings additional challenges, as it (i) increases capital expenditure, (ii) requires knowledge on other business sectors, and (iii) could lead to conflict with local communities (e.g. on land issues). Partnerships between private companies and local communities are suggested to mitigate these risks.
■ Mini-grids with a full equity structure are not viable so far, with the exception of few cases that supply electricity and other energy-related products/services (provision of electrical appliances) in peri-urban South Africa. Public financial support in the form of subsidies, subsidized tariffs or loans, with the idea of bringing down the investment cost and subsidise operations, are usually needed to achieve financial viability.
■ The NGO/community model (build-short operate-transfer), which often includes PUE and a WEF nexus approach, is not financially viable but can fill this gap if economic benefits are factored-in, as proven by the impact analysis conducted on the case of Matembwe-Ikondo (see Box 5 at page 87). Such local economy development aspects are likely to attract funding more easily.
■ Publicly-owned projects show low level of performance. Examples of good government-led programs usually involve the local community in hybrid public entity-community partnership (e.g. in Nigeria).
■ Public private partnerships (PPPs) can be a stepping stone to private sector investments as they reduce investment risks. Experience shows that this kind of model (class F in this study) is more sustainable when the private actor is in charge of operation and maintenance. Among PPP options, the concession model, whereby a private operator gets a concession from a government, is the most frequent arrangement in Sub-Saharan Africa. Its main advantage is a guarantee for the private sector to address the risk of grid arrival.
Chapter 3
■ Agri-food chains play a crucial role in the development of rural areas throughout Africa, and they probably represent the most relevant and widespread PUE in these areas, from which integrated projects and innovative partnership could be built.
■ There is a positive correlation between the agri-food and energy business: reliable and affordable electricity supply allows to improve food production and makes the agri-food business more profitable, thus strengthening energy demand.
■ Giving due consideration to complementary activities to energy supply, in particular those related to a productive use of energy, significantly enhances the financial and overall sustainability of the project, as well as local people’s livelihoods and project acceptance.
■ PUE and other WEF-related services can be a source of additional revenue streams for the energy operator, and the resulting integrated projects can have a broader impact on local development.
■ The water component in a WEF project is responsible for important indirect benefits, as its adequate quantity and quality is crucial for good health as well as agri-food activities, and can therefore indirectly contribute to jobs and income generation.
■ Enabling viable water projects by integrating the water component in wider programmes is key: water alone, especially in rural areas of Sub-Saharan Africa, is a “risky” sector

Highlights and recommendations
131
because it encompasses the right of all people to access to an essential good like safe water, with related issues such as scarcity, low quality and political interests.
■ The social, environmental and economic impacts when evaluating investments in the decentralised RE sector can be monetized through the Social Return of Investment (SROI) analysis, which is a systematic approach to holistically include them in the existing financial model. SROI stands as a powerful tool for an in-depth analysis of the overall impacts of projects, bringing an innovative outlook to highlight hidden impacts and therefore involve other stakeholders and sources of finance.
Chapter 4
■ It is crucial to ensure an adequate energy supply to the energy demand through:
– energy need assessment, to properly estimate the current demand and foresee how it will evolve over the opera-tional period. It is crucial to verify the financial viability of the project with a view to pursue the techno-economic optimum design;
– multi-year planning of the mini-grid, including possible upgrade or extension of the power generation and distri-bution systems, as the demand grows and uncertainties in the load become clearer;
– demand side management (DSM), which combines strategies and technologies in order to reduce the cost of energy supply by optimizing the usage of available assets and deferring further investments in generation capacity. DMS should be embedded in the planning and design phase, and be part of the business model itself, since it allows to achieve a higher efficiency and profit-ability of the systems by optimally aligning generation and load.
■ Hybrid diesel-RE systems help to reduce investment costs and address the intermittency of some types of RE (solar and wind). However, two issues are key regarding such systems:
– taking into account the continuing reduction of the costs of renewables and storage systems, a technical design with increased solar-PV generator and battery storage capacity, without diesel generator in the energy generation mix but only as backup system, could be a potential solution;
– the diesel generation component should be carefully balanced, considering that fuel expenditure can highly affect the economic and environmental sustainability of the electricity supply service, as this study reveals that all the mini-grids operating in steady loss have a major diesel generation component.
■ Mini-grid systems should be compatible with the grid system in order to be interconnected with the national grid, if needed.
■ A trade-off analysis between installation costs and the battery lifetime must be carried out in the technical design, in order to improve optimal lifetime and techno-economic performance of the generation plant as a whole.
■ A remote management system is an essential part of any mini-grid project. It is used to measure, monitor and control the electrical load together with the generator and energy storage system, as well as to track the system’s dynamics through advanced smart metering systems.
■ With a focus on the WEF nexus approach, it is key to co-locate food, water and energy infrastructure, where possible, to allow the waste stream of one to be utilised by the other(s), thus reducing by-products, minimising transportation costs, and lowering energy and water requirements.
■ PUE and other WEF-related services, in particular regarding agri-food chains, help managing supply and demand of energy by shifting part of the demand for energy to daytime.
■ It’s important to promote well-proven technologies in all the WEF sectors. Social acceptance, risks, workloads and opportunity costs have to be sufficiently taken into account when promoting these technologies.
■ Adding provision of electrical appliances to electricity supply ensures their compatibility with the installed energy systems and promotes energy efficiency (in particular in case of DC distribution). However, this requires a careful assessment of the ability and willingness to pay for such appliances from the users’ side.

RE-thinking Access to Energy Business Models
132
Chapter 5
■ Ensuring adequate access to modern energy services, in particular from renewable sources, has a positive influence on several SDGs, in particular those related to poverty, food security, water, health and climate change. However, while renewable energy has significant advantages in terms of sustainability, in particular in relation to climate change, the production and use of renewable energy are not sustainable per se. Awareness on the possible positive, synergistic interactions, as well as the negative ones, is important to ensure that collectively the greatest benefits are generated and negative impacts are minimized when developing and deploying mini-grids from renewable sources.
■ The assessment of the sustainability of mini-grids associated with PUE is both complex and multifaceted, and different aspects in both supply and demand/use sides have to be considered. As a result, beyond sustainability principles, conclusions about the sustainability of mini-grids cannot be generalised. The assessment of their sustainability should rather be context-specific and integrate all social, environmental and economic aspects related to their implementation.
■ Trade-offs and synergies, especially when it comes to the use of water and energy to produce food, should be considered: (i) solar irrigation bears the risk of over-pumping; (ii) biogas production requires quite some water; (iii) land-based energy (in particular bioenergy) can lead to inadequate land use and/or competition between different uses of the biomass, (iv) the disposal of the materials used in solar and wind energy systems can pose significant environmental risks.
■ Linking energy supply to the enhancement of local livelihoods is key for the financial viability of the energy business model as well as for local development. This requires a shift from a focus on energy supply objectives (supply side goal) towards objectives related to support to local services and livelihoods (demand side goal).
■ It is crucial to adequately involve energy users (in particular local communities and farmers, if appropriate) in the decisions related to the planning and implementation of project development. This allows for bottom-up solutions,
knowledge sharing and conflict mitigation, which, in turn, facilitates collaboration and commitment from user communities in handling O&M activities.
■ Complementary activities (e.g. businesses incubation, capacity building, microcredit support, etc.) strongly contribute to ensure the sustainability in a mini-grid project: they represent a means for engaging local communities, promoting community inclusion and ownership as well as supporting the electricity demand pattern.
■ Gender considerations should permeate decisions throughout the project cycle. Women have a key role to play in the energy supply as well as in PUE, particularly when related to food production and food value chain.
■ Sustainability requires that potential environmental and social (E&S) risks and opportunities are identified through an initial screening analysis and an in-depth Environmental and Social Impact Assessment (ESIA) to be conducted in the early-stage project design. ESIA is essential to secure both local permits and project bankability, since developers are required to be able to demonstrate their capability in managing E&S issues throughout the life of a project.
Chapter 6
■ The rural electrification process faces two main challenges: (i) it is significantly more expensive than the electrification of high-density and well-communicated urban areas, and (ii) it serves the lowest income people in developing countries with related lower ability to pay for electricity. The combination of these facts leads to a gap between possible revenues from off-takers and the costs of rural electrification systems. This, in turn, creates a major challenge for governments: they need to strike a balance between ensuring affordable and equitable access to energy to rural people, and ensuring profitability and low risk investments. Policies and regulations can help to address this challenge in different guises.
■ An integrated electrification plan for all the supply modes (grid extension, mini-grid and individual systems), a sound regulatory framework, and an effective institutional organization chart to avoid overlapping of responsibilities

Highlights and recommendations
133
between government agencies, are the backbone of an effective institutional framework to foster access to energy.
■ An enabling regulatory framework to accelerate rural electrification and private sector investments should:
– provide regulations that facilitate the bankability of elec-trification projects;
– ensure a comprehensive and stable framework with a segmented approach, according to the size of energy projects, the type of energy source and the supply modes;
– consider the impact of both the iron law (the fact that rural electrification is significantly more expensive than the electrification of high-density urban areas) and the vi-ability gap (difference between what the business models can collect from the customers and the total cost of sup-plying the electricity service) in the allocation of funding, resources and subsidies, with an adequate calculation of the cost of service of off-grid least-cost alternatives;
– offer fair electricity price to the most impoverished pop-ulation in isolated off-grid rural areas through cross-sub-sidized tariffs as for grid-connected customers, wherever they are located, also thanks to additional direct subsidies from the national budget or electrification funds from international development banks and agencies.
■ In countries that have specific regulations for mini-grids, the process for obtaining licences is often lengthy, costly and sometimes unclear227. In this context, governments could: (i) provide the possibility to acquire provisional licences, (ii) centralize the procedure in one government organization, such as the AMADER in Mali and (iii) create dedicated portals (e.g. in Tanzania). On the other side, developers could work also on mini grids smaller than the size under which licences are required (when allowed, for instance up to 100 kW in Tanzania and 20 kW in Mali). This latter solution bears the risk of not being able to support productive loads while scaling up might prove rather costly. An existing phenomenon consist in going illegal, especially for small size systems, making informal agreements with community leaders. Governments should oppose this phenomenon by providing clear, transparent and operative regulations.
■ Mini-grids can be a permanent or a transitory solution for the electrification of islanded areas, and therefore grid expansion is a major concern for mini-grid developers. The risk of grid expansion varies across countries: in theory, the shorter the distance between the national grid and the mini-grid, the higher the risk. The review of regulations undertaken in Chapter 6 shows that this risk is often not well-addressed, if at all, in government regulations. Ways to address this risk include:
– master energy plans about planned grid extension should be accurate, available and updated in order to provide guidance to rural electrification projects and plan how investment should be amortised by the time the grid arrives;
– developing mini-grids so that they are technically com-patible with national grids to avoid competition but rather facilitate integration when the grid arrives;
– offering concessions that ensure sufficient time to amor-tize investments (typically 15-25 years) and that foresee compensation or interconnection mechanisms in case the grid arrives earlier than planned, such as228:
• three types of interconnections: (i) the mini-grid oper-ator continues to generate and sells electricity in bulk to the grid as a “small power producer” – this requires PPAs, special FiT for mini-grid projects, and a clear outline on how to implement the interconnection; (ii) mini-grid operators continue to serve retail customers with electricity bought from the national grid as a “small power distributor” – this requires additional legal provisions and tariff regulations; (iii) the mini-grid operates as a “service quality guarantee” by providing power integration and backup component, running as stand-alone system – this requires specific regula-tion on the energy management and proper control systems installed (this model has a good potential in large areas that are connected to the grid but still underserved);
• compensation mechanism for the main-grid oper-ators for the residual value of the assets rendered

RE-thinking Access to Energy Business Models
134
uncompetitive by the main grid – this requires that depreciation times for fixed assets (e.g. distribution grid) are set according to the main-grid connection risk and financial plan. This option is more challenging because often not well-defined, however Rwanda provides an example in Sub-Saharan Africa where compensation for relocation is included in govern-ment regulations.
Chapter 7
■ There is no one-size-fits all financial mechanism for mini-grid development, be it from the supply side (energy operator) or the demand side (energy user). Solutions often depend on conditions related to the energy supplier, energy users, local context and international support.
■ For small-size mini-grids229 in developing countries, there is often a lack of suitable financing options from the national commercial banking system, and high transaction costs for project finance . This means that it is unlikely that mini-grid business models for access to electricity (excluding captive projects with a unique industrial off-taker) can be developed without public finance support in the form of grants or subsidies.
■ Enabling large deployment of mini-grid projects mainly lies in reducing upfront costs for both the energy supplier and the energy user (e.g. connection fee or PUE equipment). In this view, financial mechanisms can allow the energy supplier to de-risk investments and reach financial viability, and the energy user to access electricity and pursue local business activities.
■ Grants to CAPEX or investments should be limited in order to avoid later energy market distortions, and thus only be applied in pilot projects and early stage market phases. That said, most mini-grid cases analysed in this study (76%) have used grants to cover their CAPEX, at least partially; grants to OPEX are risky, because of the likelihood of their discontinuity due to unforeseeable circumstances, and unwise as do not encourage to find the most efficient way to run operations.
■ Grants should be combined with mechanisms to leverage
commercial financing and to buy down the risk with first loss guarantees. Minor contributions should also come from target communities (e.g. in form of in-kind).
■ Not limiting the business plan to energy supply, but rather including PUE and in particular food production, has proven to significantly improve the financial viability of mini-grid in rural areas.
■ A few instruments (some new) exist to ease private sector access to capital, such as equity financing, debt capital or local currency lending structures.
■ Prepaid systems, in the form of pay-as-you-go (PAYG) or fee for service, have been quite successful in making energy from micro-grids more affordable in rural areas. But using these mechanisms also means that the energy operator must have enough capital to withstand segmented/non regular payments.
■ Provision of energy appliances, for instance through a leasing mechanism, promotes energy consumption and therefore positively affects both the cash flows for the mini-grid operator and local productive activities. Bearing in mind that food production is usually the main source of revenue in rural Sub-Saharan Africa, a positive effect on the whole local economy is expected. But, in the case of solar mini-grids, it should mainly concern appliances used during daytime in order to reduce evening use of energy and costs related to energy storage.
■ Regarding the electricity tariff, an approach tailored to the purchasing power of the energy user is effective for catalysing private sector investment in mini-grids. In this case, public finance (e.g. feed-in-tariff ) should be needed to make up for the financial shortfall and enable the project viability.
■ Business plan evaluation from financing entities and governments should allow complementary activities (e.g. businesses incubation, capacity building, microcredit support, etc.), to be eligible in capital and operating costs as they represent a means for engaging local communities, promoting community inclusion and pursuing the project sustainability.

135


137
1 IEA. Energy Access Outlook 2017: From poverty to
prosperity. IEA: Paris, France, 2017.2 World Bank. Access to Electricity. Available online:
https://data.worldbank.org/indicator/eg.elc.accs.zs (accessed on 1 May 2019).
3 IEA. Energy Access Outlook 2017: From poverty to
prosperity. IEA: Paris, France, 2017.4 IEA. Access to Electricity. Available online: https://
www.iea.org/sdg/electricity (accessed on 1 May 2019).
5 IEA, IRENA, UNSD, World Bank Group, WHO.
Tracking SDG7: The Energy Progress Report; World Bank: Washington, DC, 2018.
6 IEA, IRENA, UNSD, World Bank Group, WHO.
Tracking SDG7: The Energy Progress Report. World Bank: Washington, DC, 2018.
7 IEA. World Energy Outlook 2018. IEA: Paris, France,
2018.8 Ibidem.9 SAUBHAGYA. Available online: https://saubhag-
ya.gov.in (accessed on 1 May 2019). 10
IEA. World Energy Outlook 2018. IEA: Paris, France, 2018.11
IEA, IRENA, UNSD, World Bank Group, WHO. Tracking SDG7: The Energy Progress Report. World Bank: Washington, DC, 2018.
12 UNCTAD. Economic Development in Africa, Report
2018. Migration for Structural Transformation. United Nations: New York, New York, 2018
13 Leke A.; Chironga M.; Desvaux G. McKinsey
Quarterly: Africa’s overlooked business revolution. McKinsey&Company, 2018.
14 Ibidem.
15 IEA. World Energy Outlook 2018. IEA: Paris, France,
2018.16
Leke A.; Chironga M.; Desvaux G. McKinsey Quarterly: Africa’s overlooked business revolution. McKinsey&Company, 2018; quoted by RES4Afri-ca Foundation. Africa’s future counts. RES4Africa Foundation: Rome, Italy, 2019.
17 IEA, IRENA, UNSD, World Bank Group, WHO.
Tracking SDG7: The Energy Progress Report. World Bank: Washington, DC, 2018.
18 IEA. Energy Access Outlook 2017: From poverty to
prosperity. IEA: Paris, France, 2017.19
Ibidem.20
IEA. World Energy Outlook 2018. IEA: Paris, France, 2018.
21 Bilotta, N.; Colantoni, L. Financing Energy Access
in Sub-Saharan Africa. IAI Papers. 2018, 22, 20.
22 PwC. Electricity beyond the grid. Accelerating ac-
cess to sustainable power for all. PwC Glob. Power Util. 2018, 24, 1-24.
23 ARE. 5th EAIF: Outcome Report & Recommenda-
tions. In Proceedings of the 5th Energy Access Investment Forum (EAIF), Abidjan, Ivory Coast, 13-14 March 2019.
24 ESMAP. Policy Matters. Regulatory Indicators for
Sustainable Energy. World Bank: Washington, DC, 2018.
25 Authors’ elaboration from RISE data. Available
online: http://rise.worldbank.org/scores (ac-cessed on 1 May 2019).
26 Microgrid Investment Accelerator, Microgrid
Market Analysis and Investment Opportunities for India, Indonesia, and Tanzania. Allotrope Partners: Oakland, California, 2017.
27 REN21. Renewables 2018 Global Status Report.
REN21 Secretariat: Paris, France, 2018.28
Bloomberg NEF. Microgrid Capture More Energy Access Startup Funding. 2018. Available online: https://about.bnef.com/blog/microgrids-cap-ture-energy-access-startup-funding (accessed on 1 May 2019).
29 Dalberg Advisors; Lighting Global. Off-grid Solar
Market Trends Report 2018. International Finance Corporation: Washington, DC, 2017.
30 Ibidem.
31 Ibidem.
32 Ibidem.
33 Ibidem.
34 IEA. Energy Access Outlook 2017: From poverty to
prosperity. IEA: Paris, France, 2017.35
Ibidem.36
SEforALL. Energizing Finance: Understanding the landscape 2018. SEforALL: Vienna, Austria, 2018.
37 Climatescope. 3Q 2018 Off-Grid And Mini-Grid
Market Outlook . Available online: ht tps://medium.com/climatescope/3q-2018-off-grid-and-mini-grid-market-outlook-70ed47656c31 (accessed on 1 May 2019).
38 Oyuke A.; Penar P. H.; Howard B. Off-grid or ‘off-
on’: lack of access, unreliable electricity supply still plagues majority of Africans. Afrobarom. 2016, 75, 1-26.
39 World Bank Group. Africa’s Pulse, No. 15. World
Bank: Washington, DC, 2017.40
Franz M.; Peterschmidt N.; Rohrer M.; Kondev B. Mini-grid Policy Toolkit. Policy and Business Frame-
works for Successful Mini-grid Roll-outs. EUEI PDF: Eschborn, Germany, 2014.
41 Infinergia Consulting. Mini-grid for village elec-
trification: Industry and African & Asian markets. Infinergia: Grenoble, France, 2018.
42 IRENA. Off-Grid Renewable Energy Systems: Status
and Methodological Issues. IRENA: Abu Dhabi, United Arab Emirates, 2015.
43 IRENA. Innovation Outlook: Renewable Mini-Grids.
IRENA: Abu Dhabi, United Arab Emirates, 2016.44
Bloomberg NEF. Powering Last-Mile Connectivity. 2018. Available online: https://about.bnef.com/blog/powering-last-mile-connectivity (accessed on 1 May 2019).
45 GIZ Promotion of Solar-Hybrid Mini-Grids. What
Size Shall It Be?. GIZ Promotion of Solar-Hybrid Mini-Grids: Bonn, Germany, 2016.
46 Ghosh Banerjee S.; Malik K.; Tipping, A.; Besnard, J.;
Nash J. Double Dividend: Power and Agriculture Nexus in Sub-Saharan Africa. World Bank: Washington, DC, 2017.
47 IEA. Energy Access Outlook 2017: From poverty to
prosperity. IEA: Paris, France, 2017.48
Dalberg Advisors; Lighting Global. Off-grid Solar Market Trends Report 2018; International Finance Corporation: Washington, DC, 2017.
49 GOGLA. Standardized Impact Metrics for the Off-
Grid Solar Energy Sector. GOGLA: Utrecht, The Netherlands, 2018.
50 GOGLA. Productive use of off- grid solar: appli-
ances and solar water pumps as drivers of growth. GOGLA: Utrecht, The Netherlands, 2019.
51 Dalberg Advisors; Lighting Global. Off-grid Solar
Market Trends Report 2018. International Finance Corporation: Washington, DC, 2017.
52 Ibidem.
53 OnSSET. Available online: http://www.onsset.org
(accessed on 1 May 2019).54
UNSDG. Open Source Spatial Electrification Toolkit (OnSSET). Available online: https://undg.org/sdg_toolkit/open-source-spatial-electrifica-tion-tool-onsset (accessed on 1 May 2019).
55 Amatya, R. et al. Computer‐Aided Electrification
Planning In Developing Countries: The Reference Electrification Model (REM). IIT Comillas.2018.
56 Ibidem.
57 World Bank ESMAP; KTH. Electrification Pathways
For Nigeria, Tanzania and Zambia. Available online: http://electrification.energydata.info (accessed on 21 November 2019).
References

138
58 Ibidem.
59 Lee, S.J. Adaptive Electricity Access Planning. Mas-
sachusetts Institute of Technology.2018.60
Nerini et al. Mapping Synergies And Trade-Offs Between Energy And The Sustainable Development Goals. Nat. Energy. 2018, 3, 10-15.
61 Angelou N.; Bhatia M. Capturing The Multi-Dimen-
sionality Of Energy Access. World Bank Live Wire knowledge note series. 2014, 16.
62 Bhatia M., & Angelou. Beyond Connections: Energy
Access Redefined. World Bank: Washington, DC, 2015.
63 SEforALL. Global Tracking Framework 2013. World
Bank: Washington, DC, 2013.64
Bhatia M., & Angelou. Beyond Connections: Energy Access Redefined. World Bank: Washington, DC, 2015.
65 Padam, G.; Rysankova, D.; Portale, E.; Koo, B. B.;
Keller, S.; Fleurantin, G. Ethiopia: Beyond Connec-tions. Energy Access Diagnostic Report Based on the Multi-Tier Framework. World Bank: Washington, DC, 2018.
66 World Bank . Access to Electricit y. Available
online: https://data.worldbank.org/indicator/EG.ELC.ACCS.ZS?locations=ET (accessed on 1 May 2019).
67 Padam, G.; Rysankova, D.; Portale, E.; Koo, B. B.;
Keller, S.; Fleurantin, G. Ethiopia: Beyond Connec-tions. Energy Access Diagnostic Report Based on the Multi-Tier Framework. World Bank: Washington, DC, 2018.
68 Ibidem.
69 Ibidem.
70 Bos, K.; Chaplin, D.; Mamun, A. Benefits and
Challenges of Expanding Grid Electricity in Africa: A Review of Rigorous Evidence on Household Impacts in Developing Countries. Energy for Sust. Dev. 2018, 44, 64-77.
71 Ibidem.
72 Lenz, L.; Munyehirwe, A.; Peters, J.; Sievert, M.
Does Large-Scale Infrastructure Investment Allevi-ate Poverty? Impacts of Rwanda’s Electricity Access Roll-Out Program. World Development. 2017, 89, 88-110.
73 Bos, K.; Chaplin, D.; Mamun, A. Benefits and
Challenges of Expanding Grid Electricity in Africa: A Review of Rigorous Evidence on Household Impacts in Developing Countries. Energy for Sust. Dev. 2018, 44, 64–77. Chaplin, D. et al. Grid Electricity Expan-sion in Tanzania by MCC: Findings from a Rigorous Impact Evaluation. Mathematica Policy Research: Washington, DC, 2017. Cook, P. Infrastructure, Rural Electrification and Development. Energy for Sust. Dev. 2011, 15(3), 304-13. Trotter, P. A. Rural Electrification, Electrification Inequality and Demo-cratic Institutions in Sub-Saharan Africa. Energy for Sust. Dev. 2016, 34, 111-29.
74 OpenEconomics, RES4Africa Foundation. Ap-
plying the Water-Energy-Food Nexus Approach
to Catalyse Transformational Change in Africa. RES4Africa Foundation: Rome, Italy, 2019.
75 Almeshqab, F.; Ustun, T. S. Lessons learned from ru-
ral electrification initiatives in developing countries: Insights for technical, social, financial and public policy aspects. Ren. And Sustain. Energy Rev. 2019, 102, 35-53.
76 Panapanaan, V.; Bruce, T.; Virkki-Hatakka, T.; Lin-
nanen, L. Analysis of Shared and Sustainable Value Creation of Companies Providing Energy Solutions at the Base of the Pyramid (BoP). Bus Strateg Envi-ron. 2016, 25(5), 293-309.
77 OpenEconomics, RES4Africa Foundation. Ap-
plying the Water-Energy-Food Nexus Approach to Catalyse Transformational Change in Africa. RES4Africa Foundation: Rome, Italy, 2019.
78 Winther, T.; Matinga, M. N.; Ulsrud, K.; Standal K.
Women’s empowerment through electricity access: scoping study and proposal for a framework of analysis. Journal of Dev. Effect. 2017, 9(3), 389-417.
79 World Bank. Mini-Grids & Gender Equality: Inclusive
Design, Better Development Outcomes. World Bank: Washington, DC, 2017.
80 Ibidem.
81 Winther, T.; Matinga, M. N.; Ulsrud, K.; Standal K.
Women’s empowerment through electricity access: scoping study and proposal for a framework of analysis. Journal of Dev. Effect. 2017, 9(3), 389-417.
82 Ibidem.
83 World Bank. Mini-Grids & Gender Equality: Inclusive
Design, Better Development Outcomes. World Bank: Washington, DC, 2017.
84 WHO; UNICEF. Progress on Drinking Water, Sanita-
tion and Hygiene: 2017 Update and SDG Baselines. WHO; UNICEF: Geneva, Switzerland, 2017.
85 Nhamo, L.; Ndlela, B.; Nhemachena, C.; Mabhau-
dhi, T.; Mpandeli, S.; Matchaya, G. The water-en-ergy-food nexus: climate risks and opportunities in southern Africa. Water. 2018, 10(5), 1-18.
86 Curran, P.; Dougill, A.; Pardoe, J.; Vincent, K. Policy
Brief Policy Coherence for Sustainable Development in Sub-Saharan Africa. Grantham Research Insti-tute on Climate Change and the Environment and Centre for Climate Change Economics and Policy: London, UK, 2018.
87 Golam,R.; Sharma, B. The Nexus Approach to Wa-
ter-energy-food Security: An Option for Adaptation to Climate Change. Climate Policy. 2015, 16(6), 682-702.
88 Lele, U.; Klousia-Marquis, M.; Goswami, S. Good
governance for food, water and energy security. Aquatic Procedia. 2013, 1, 44-63.
89 Trotter, P.A.; McManus, M.C.; Maconachie, R.
Electricity Planning and Implementation in Sub-Sa-haran Africa: A Systematic Review. Renewable and Sustainable Energy Reviews. 2017, 74, 1189-1209.
90 Grimm, M.; Munyehirwe, A.; Peters, J.; Sievert, M.
A First Step up the Energy Ladder? Low Cost Solar Kits and Household’s Welfare in Rural Rwanda.
Policy Research Working Paper 7859. World Bank: Washington, DC, 2016.
91 Lenz, L.; Munyehirwe, A.; Peters, J.; Sievert, M.
Does Large-Scale Infrastructure Investment Allevi-ate Poverty? Impacts of Rwanda’s Electricity Access Roll-Out Program. World Development. 2017, 89, 88-110.
92 Mentis, D. et al. Lighting the World: The First Ap-
plication of an Open Source, Spatial Electrification Tool (OnSSET) on Sub-Saharan Africa. Environ. Res. Lett. 2017, 12(8).
93 Trotter, P.A.; Cooper, N.J.; Wilson, P.R. A Multi-Cri-
teria, Long-Term Energy Planning Optimisation Model with Integrated on-Grid and off-Grid Elec-trification - The Case of Uganda. Applied Energy. 2019, 243, 288-312.
94 IFC. Operational and Financial Performance of
Mini-Grid Descos. World Bank: Washington, DC, 2017.
95 Energy 4 Impact; INENSUS. Green Mini-Grids in
Sub-Saharan Africa: Analysis of Barriers to Growth and the Potential Role of the African Development Bank in Supporting the Sector. GMG MDP Doc. Ser. n°1. AfDB: Abidjan, Ivory Coast, 2016.
96 World Bank. Mini-grid design Manual. ESMAP.
World Bank: Washington, DC, 2000.97
Gambino V.; Del Citto R.; Cherubini P.; Tacconelli C.; Micangeli A.; Giglioli R. Methodology for the Energy Need Assessment to Effectively Design and Deploy Mini-Grids for Rural Electrification. Energies. 2019, 12(3), 574.
98 Franz M.; Peterschmidt N.; Rohrer M.; Kondev B.
Mini-grid Policy Toolkit. Policy and Business Frame-works for Successful Mini-grid Roll-outs. EUEI PDF: Eschborn, Germany, 2014.
99 Alliance For Rural Electrification. Energy Access
From The Bottom Up: Start-Up And SME Showcase 2018. Alliance For Rural Electrification: Brussels, Belgium, 2018.
100 Brüderle A.; Attigah, B.; Bodenbender, M. Produc-tive Use of Energy – PRODUSE. A manual for elec-trification practitioners. GIZ, EUEI PDF: Eschborn, Germany, 2011.
101 Agenbroad J.; Carlin, K.; Ernst, K.; Doig, S. Minigrids
in the Money: Six Ways to Reduce Minigrid Costs by 60% for Rural Electrification. Rocky Mountain Institute: Basalt, CO, 2018.
102 USAID. What Are The Sources Of Capital For Mi-ni-Grid Projects?. Available online: https://www.usaid.gov/energy/mini-grids/financing/capital (accessed on 1 June 2019).
103 Sims, R.; Flammini, A.; Puri, M.; Bracco, S. Oppor-
tunities For Agri-Food Chains To Become Ener-gy-Smart. FAO: Rome, Italy, 2015.
104 Ibidem.
105 Ibidem.
106 Kooijman-van Dijk, A. The Power to Produce - The Role of Energy in Poverty Reduction Through Small Scale Enterprises in the Indian Himalayas.

139
University of Twente. Enschede, Netherlands, 2008; quoted by Brüderle A.; Attigah, B.; Boden-bender, M. Productive Use of Energy – PRODUSE. A manual for electrification practitioners. GIZ, EUEI PDF: Eschborn, Germany, 2011.
107 Mayer-Tasch, L. et al. Productive Use of Energy –
PRODUSE. Measuring Impacts of Electrification on Small and Micro-Enterprises in Sub-Saharan Africa. GIZ: Eschborn, Germany, 2013.
108 GSMA. The Mobile Economy. Sub-Saharan Africa 2018. GSMA: London, UK, 2018.
109 Nique M.; Opala, K. The Synergies between Mobile, Energy and Water Access: Africa. GSMA: London, UK, 2014.
110 GSMA. 2017 State of the Industry Report on
Mobile Money. GSMA: London, UK, 2018.111
Moreno A.; Bareisaite A. Scaling Up Access to Electricity: Pay-as-You-Go Plans in Off-Grid Energy Services. World Bank Live Wire knowledge note series. 2015, 34.
112 Harrison K.; Adams, T. An Evidence Review: How
affordable is off-grid energy access in Africa?. Acu-men. 2017.
113 Tenenbaum, B.; Greacen, C.; Siyambalapitiya, T.;
Knuckles, A. From the Bottom Up. World Bank: Washington, DC, 2014.
114 Gambino V.; Del Citto R.; Cherubini P.; Tacconelli
C.; Micangeli A.; Giglioli R. Methodology for the Energy Need Assessment to Effectively Design and Deploy Mini-Grids for Rural Electrification. Energies. 2019, 12(3), 574.
115 Perez Arriaga I.; Micangeli A.; Sisul M. Unleashing
sustainable human capital through innovative capacity building & vocational training: The Micro Grid Academy to Unlock Micro-Grid’s Potential in East Africa. Unlocking Value From Sustainable Renewa-ble Energy. RES4MED&Africa: Rome, Italy, 2018.
116 Fundrise. The Difference Between IRR & ROI.
Available online: https://fundrise.com/educa-tion/blog-posts/the-difference-between-inter-nal-rate-of-return-irr-return-on-investment-roi (accessed on 1 March 2019).
117 Kittner N.; Gheewala S.H.; Kammen D.M. Energy
return on investment (EROI) of mini-hydro and solar PV systems designed for a mini-grid. Renewable Energy. 2016, 99, 410-419.
118 World Bank. Power outages in firms in a typical
month. Available online: https://data.worldbank.org/indicator/IC.ELC.OUTG (accessed on 1 April 2019).
119 Gambino V.; Del Citto R.; Cherubini P.; Tacconelli
C.; Micangeli A.; Giglioli R. Methodology for the Energy Need Assessment to Effectively Design and Deploy Mini-Grids for Rural Electrification. Energies. 2019, 12(3), 574. Trotter, P.A.; McManus, M.C.; Maconachie, R. Electricity Planning and Implementation in Sub-Saharan Africa: A System-atic Review. Renewable and Sustainable Energy Reviews. 2017, 74, 1189-1209.
120 Franz M.; Peterschmidt N.; Rohrer M.; Kondev B.
Mini-grid Policy Toolkit. Policy and Business Frame-works for Successful Mini-grid Roll-outs. EUEI PDF: Eschborn, Germany, 2014.
121 Blodgett C.; Dauenhauer, P.; Louie, H.; Kickham,
L. Accuracy of energy-use surveys in predicting rural mini-grid user consumption. Energy Sustain. Dev. 2017, 41, pp. 88-105.
122 Fioriti, D.; Giglioli R.; Opli, D.; Lutzemberger
G.; Micangeli, A.; Del Citto, R.; Perez-Arriaga I.; Duenas-Martinez, P. Stochastic sizing of isolated rural mini-grids, including effects of fuel procure-ment and operational strategies. Electr. Power Syst. Res. 2018, 160, pp. 419-428.
123 Ibidem.
124 CanWEA. Small Wind Turbine Purchasing Guide. CanWEA: Ottawa, Ontario, Canada, 2013.
125 Green Rhino Energy. Annual Solar Irradiance.
Available online: http://www.greenrhinoenergy.com/solar/radiation/empiricalevidence.php (accessed on 1 April 2019).
126 EEP Africa. Opportunities And Challenges In The
Mini-Grid Sector In Africa. EEP Africa: Hatfield, South Africa, 2018.
127 IRENA. Renewable Power Generation Costs in 2017.
IRENA: Abu Dhabi, United Arab Emirates, 2018. 128
Ackom, E. K.; Lazopoulou, M.; Moner-Girona, M.; Szabó, S.; Vallve, X.; Solano-Peralta, M. Electrifi-cation Of Sub-Saharan Africa Through PV/Hybrid Mini-Grids: Reducing The Gap Between Current Business Models And On-Site Experience. Renew. Sustain. Energy Rev. 2018, 91, 1148–1161.
129 Taylor, M. Battery Storage Accelerating the Energy
Transition. IRENA Slides. 2017. Available online: https://www.irena.org/costs/Presentations/Slides.
130 Bahramara, S.; Moghaddam, M. P.; Haghifam, M. R. Optimal planning of hybrid renewable energy systems using HOMER: A review. Renew. Sustain. Energy Rev. 2016, 62, 609-620.
131 Homer Energy LLC. HOMER Pro Version 3.7 User
Manual. HOMER Energy. 2016, 416.132
Fioriti, D.; Giglioli R.; Opli, D.; Lutzemberger G.; Micangeli, A.; Del Citto, R.; Perez-Arriaga I.; Duenas-Martinez, P. Stochastic sizing of isolated ru-ral mini-grids, including effects of fuel procurement and operational strategies. Electr. Power Syst. Res. 2018, 160, pp. 419-428. Fioriti D. Mini-grids to foster rural electrification in developing countries: optimal planning, design and operation. Doctoral disserta-tion. University of Pisa, 2019.
133 Borofsky, Y.; Perez-Arriaga I.; Stoner, R. A model
for better electrification planning. ABB Rev. 2017, 2, 23-27.
134 Almeida R. H.; Brito, M. C. A review of technical op-
tions for solar charging stations in Asia and Africa. AIMS Energy. 2015, 3(3), 428-449.
135 Bhattacharyya S. C.; Palit, D. Mini-grid based off-
grid electrification to enhance electricity access in developing countries: What policies may be required?. Energy Policy. 2016, 94, 166-178.
136 Starke, M.; Li, F.; Tolbert, L. M.; Ozpineci, B. AC vs.
DC distribution: Maximum transfer capability. In Proceedings of the IEEE Power and Energy Society 2008 General Meeting: Conversion and Delivery of Electrical Energy in the 21st Century, PES, 2008.
137 Justo, J. J.; Mwasilu, F.; Lee, J.; Jung, J. W. AC-micro-
grids versus DC-microgrids with distributed energy resources: A review. Renew. Sustain. Energy Rev. 2013, 24, 387-405.
138 Harper, M. Review of Strategies and Technologies
for Demand-Side Management on Isolated Mi-ni-Grids. Lawrence Barkeley National Laboratory: Berkeley, CA, 2013.
139 Saengprajak, A. Efficiency of Demand Side Man-
agement Measures in Small Village Electrification Systems. Kassel University Press: Germany, 2007.
140 Harper, M. Review of Strategies and Technologies for Demand-Side Management on Isolated Mi-ni-Grids. Lawrence Barkeley National Laboratory: Berkeley, CA, 2013.
141 Ibidem.
142 Mehra, V.; Amatya, R.; Ram, R. J. Estimating the
value of demand-side management in low-cost, solar micro-grids. Energy. 2018, 163, 74-87.
143 Augusto, C.; Almeida, R. H.; Mandelli, S.; Brito,
M. C. Evaluation of potential of demand side management strategies in isolated microgrid. In Proceedings of the 6th Int. Conf. Clean Electr. Power Renew. Energy Resour. Impact, (ICCEP 2017), 19 June 2017, pp. 359-361.
144 Booth, S.; Li, X.; Baring-Gould, I.; Kollanyi, D.; Bharadwaj, A.; Weston, P. Productive Use Of Energy In African Micro-Grids: Technical and Business Con-siderations. USAID - NREL: Pretoria, South Africa – Golden, CO, 2018.
145 Briganti, M.; Vallvé, X.; Alves, L.; Pujol, D.; Cabral, J.;
Lopes, C. Implementation of a PV rural micro grid in the island of Santo Antão (Cape Verde) with an individual energy allowance scheme for demand control. In Proceedings of the 27th European Photovoltaic Solar Energy Conference and Ex-hibition (EU PVSEC 2012), 24-28 September 2012, pp. 3874-3879.
146 Saengprajak, A. Efficiency of Demand Side Man-
agement Measures in Small Village Electrification Systems. Kassel University Press: Germany, 2007.
147 Quetchenbach T. G.; Harper M. J.; Robinson IV J.;
Hervin K. K.; Chase N. A.; Dorji C.; Jacobson A. E. The Gridshare Solution: A Smart Grid Approach To Improve Service Provision On A Renewable Energy Mini-Grid In Bhutan. Environ. Res. Lett. 2013, 8(1).
148 United Nations SDGs. Available online: https://in-.one.un.org/sdg-wheel/ (accessed on 1 April 2019).
149 IRENA. Renewable Energy benefits: Decentralised
Solutions in the Agri-food Chain. IRENA: Abu Dha-bi, United Arab Emirates, 2016.

140
150 Brüderle A.; Attigah, B.; Bodenbender, M. Produc-tive Use of Energy – PRODUSE. A manual for elec-trification practitioners. GIZ, EUEI PDF: Eschborn, Germany, 2011.
151 McCollum D. et al. A guide to SDG interactions:
from science to Implementation. ICSU: Paris, France, 2017.
McCollum D. et al. Mapping Interaction Between Sustainable Development Goals: Lesson Learned And Ways Forward. Sustain Sci. 2018, 13(6), 1489–1503.
152 UNECE. Deployment of Renewable Energy: The
Water-Energy-Food-Ecosystem Nexus Approach to Support the Sustainable Development Goals. UNECE, 2017; quoted by RES4Africa Foundation. Africa’s future counts. RES4Africa Foundation: Rome, Italy, 2019.
153 World Bank, 2018. Access to Energy is at the Heart
Of Development. Available online: https://www.worldbank.org/en/news/feature/2018/04/18/access-energy-sustainable-development-goal-7 (accessed on 1 May 2019).
154 BSDC. Better Business Better World. BSDC: London, UK, 2017.
155 IEA. Energy And The Sustainable Development
Goals. 2017. Available online: https://www.iea.org/access2017/. (accessed on 29 March 2019).
156 IEA. World Energy Outlook 2018. IEA: Paris, France, 2018.
157 Santilli, A. Renewable energies, sustainability,
and human development a multifaced relation. Enel: Rome, Italy, 2018.
158 World Bank. Fighting Poverty through Decentral-
ized Renewable Energy. In Proceedings of the Energy SME Conference, Cambodia. ESMAP. World Bank: Washington, DC, 2010.
159 Coote, D. The benefits of decentralised energy. Business Spectator, 2011. Available online: https://www.theaustralian.com.au/business/business-spec tator/news-stor y/the-bene -fits-of-decentralised-energy/cb371b416e3930f-3d8ee7683ea2f3fe1 (accessed on 1 April 2019).
160 World Bank. Fighting Poverty through Decentral-ized Renewable Energy. In Proceedings of the Energy SME Conference, Cambodia. ESMAP. World Bank: Washington, DC, 2010.
161 World Bank, 2018. Access to Energy is at the Heart
Of Development. Available online: https://www.worldbank.org/en/news/feature/2018/04/18/access-energy-sustainable-development-goal-7 (accessed on 1 May 2019).
162 Gustafsson, Ö.; Kruså, M.; Zencak, Z.; Sheesley, R. J.; Granat, L.; Engström, E.; Praveen, P. S.; Rao, P. S. P.; Leck, C.; Rodhe, H. Brown clouds over South Asia: Biomass or fossil fuel combustion? Science. 2019, 323, 495-498.
163 Fox-Skelly, J. There are diseases hidden in ice, and
they are waking up. 2017. Available online: http://www.bbc.com/earth/story/20170504-there-are-
diseases-hidden-in-ice-and-they-are-waking-up (accessed on 26 March 2019).
164 Vezzoli, C.; Ceschin, F.; Osanio, L.; M’Rithaa M. K.; Moalosi, R.; Nakazibwe, V.; Diehl, J.C. Distributed/Decentralised Renewable Energy Systems. Green Energy and Technology. Designing Sustainable Energy for All. 2019, 23-39.
165 IEA. Africa Energy Outlook – A Focus On Energy
Prospects In Sub-Saharan Africa. IEA: Paris, France, 2014.
166 IPCC. Special Report On Renewable Energy And
Climate Change Mitigation. Cambridge Universi-ty Press: Cambridge, United Kingdom and New York, NY, USA, 2011.
167 World Bank. Reducing The Cost Of Grid Extension
For Rural Electrification. ESMAP. World Bank: Washington, DC, 2000.
168 Kirubi, C.; Jacobson, A.; Kammen, D.M.; Mills, A.
Community-based electric micro-grids can con-tribute to rural development: Evidence from Kenya. World Development. 2008, 37(7), 1208-1221.
169 Sheahan, M.; Barrett, C.B. Review: Food Loss And
Waste In Sub-Sharan Africa. Food Policy. 2017, 70 (C), 1-12.
170 Booth, S.; Li, X.; Baring-Gould, I.; Kollanyi, D.; Bharad-waj, A.; Weston, P. Productive Use Of Energy In African Micro-Grids: Technical and Business Considerations. USAID – NREL: Pretoria, South Africa – Golden, CO, 2018.
171 Toman, M.; Peters, J. Rural electrification: How
much does Sub-Sharan Africa need the grid?. 2017. Let’s Talk Development. Available online: https://blogs.worldbank.org/developmenttalk/rural-electrification-how-much-does-sub-saha-ran-africa-need-grid
172 ERM. Effective management of ESG risks in major infra-
structure projects. Chapter published in Managing Risk in Infrastructure Investments. PEI Infrastructure Investor, 2015.
173 OpenEconomics, RES4Africa Foundation. Ap-
plying the Water-Energy-Food Nexus Approach to Catalyse Transformational Change in Africa. RES4Africa Foundation: Rome, Italy, 2019.
174 Ibidem.
175 Ibidem.
176 World Bank. Access to electricity. Available online:
https://data.worldbank.org/indicator/eg.elc.accs.zs (accessed on 31 October 2019).
177 Oxford Business Group. Will Renewables Expand
Ghana’s economy? Available online: https://oxfordbusinessgroup.com/news/will-renew-ables-expand-ghana%E2%80%99s-economy (accessed on 1 July 2019)
178 Energy Commission. 2018 Energy Outlook for
Ghana. Energy Commission; Accra, Ghana, 2018.179
Minister of Finance. The Budget Statement and Eco-nomic Policy of the Government of Ghana for the 2019 Financial Year. Government of Ghana: Accra, Ghana, 2019.
180 Ibidem.
181 Ibidem.
182 Baker McKenzie. Opportunities for Corporate
Procurement of Power in Sub-Saharan Africa. Baker McKenzie: 2019.
183 World Bank. Kenya Electricity System Improvement
Project. World Bank: Washington, DC, 2018.184
Ministry of Water, Irrigation, and Energy. National Electrification Program 2.0. Integrated Planning For Universal Access. Federal Democratic Republic of Ethiopia: Addis Abeba, Ethiopia, 2019
185 Ibidem.
186 World Bank. Energy and Extractives Global Practice
Africa Region. Report PAD2303. World Bank: Wash-ington, DC, 2017.
187 IRENA. Solar PV in Africa: Costs and Markets. IRENA:
Abu Dhabi, United Arab Emirates, 2016.188
Ibidem.189
ECA. Green Mini- Grid Market Development Program: Access to Finance Business Line – Track 2 Training of Financiers. GMG MDP Doc. ECA: London, UK, 2018.
190 Power for All. Investor Position Paper: Unlocking Private Capital for Mini-Grids in Africa. 2019. Available online: https://www.powerforall.org/resources/calls-to-action/investor-position-paper-unlock-ing-private-capital-mini-grids-africa (accessed on 1 July 2019).
191 NextBillion. Are Rural Customers Ready to Con-
sume More Energy at the Right Price? New Mini-Grid Research Offers Intriguing Results. 2019. Available online: https://nextbillion.net/mini-grid-innova-tion-lab (accessed on 1 July 2019).
192 ECA. Green Mini- Grid Market Development
Program: Access to Finance Business Line – Track 2 Training of Financiers. GMG MDP Doc. ECA: London, UK, 2018.
193 ElectriFI. Fact Sheet. 2019. Available online:
https://www.electrifi.eu/wp/wp-content/up-loads/2019/06/ElectriFI-2pager.pdf (accessed on 1 July 2019).
194 USAID. What are the sources of capital for mini-grid
projects? Available online: https://www.usaid.gov/energy/mini-grids/financing/capital (ac-cessed on 1 July 2019).
195 Green Mini Grid Facility Kenya. About GMG Facil-ity. Available online: https://www.gmgfacilityken-ya.org/index.php/about-gmg (accessed on 1 July 2019).
196 Frankfurt School. Online Course – Unit 9. Public Support Instruments to Facilitate Climate Friendly Investments. 2018.
197 Perera, N.; Garside, B. Bridging the gap: how inclu-
sive finance boosts access to off-grid energy. IIED Briefing Papers. 2019, February.
198 Johnstone K. Off-grid productivity: powering
universal energy access. IIED Briefing Papers. 2019, January.

141
199 AfDB. African Development Bank, Nordic Devel-
opment Fund and Partners launch Off-Grid Energy Access Fund with US$58 million. 2018. Available online: https://www.afdb.org/fr/news-and-events/african-development-bank-nordic-de-velopment-fund-and-partners-launch-off-grid-energy-access-fund-with-us-58-million-18432 (accessed on 1 July 2019).
200 Manetsgruber, D.; Wagemann, B.; Kondev, B.; Dzi-ergwa, K. Risk Management For Mini-Grids. A New Approach To Guide Mini-Grid Deployment. Alliance For Rural Electrification: Brussels, Belgium, 2018.
201 TTA. Benchmarking Study Of Solar Pv Mini Grids Investment Costs. ESMAP. World Bank: Washington, DC, 2017.
202 Manetsgruber, D.; Wagemann, B.; Kondev, B.; Dzi-ergwa, K. Risk Management For Mini-Grids. A New Approach To Guide Mini-Grid Deployment. Alliance For Rural Electrification: Brussels, Belgium, 2018.
203 IRENA. Global Levelised costs of electricity (LCOE) from utility-scale renewable power generation technologies: 2010 – 2017. Available online: http://resourceirena.irena.org/gateway/dashboard/?topic=3&subTopic=1065 (accessed on 1 July 2019).
204 IEA. World Energy Outlook 2018. IEA: Paris, France, 2018.
205 World Bank. Mini Grids for Half a Billion People: Market Outlook and Handbook for Decision Mak-ers. ESMAP Technical Report 014/19. World Bank: Washington, DC, 2019.
206 IRENA. Renewables Readiness Assessment: United Republic of Tanzania. IRENA: Abu Dhabi, United Arab Emirates, 2017.
207 Ministry of Energy. Feed-In-Tariff Policy On Wind, Biomass, Small-Hydro, Geothermal, Biogas And Solar Resource Generated Electricity. Review 2012. Government of Kenya: Nairobi, Kenya, 2012.
208 Moner-Girona, M.; Ghanadan, R.; Solano-Per-alta, R.; Kougias, I.; Bòdis, K.; Huld, T.; Szabó, S. Adaptation of Feed-in Tariff for remote mini-grids: Tanzania as an illustrative case. Ren. And Sustain. Energy Rev. 2016, 53, 306-318.
209 Gambino V.; Del Citto R.; Cherubini P.; Tacconelli C.; Micangeli A.; Giglioli R. Methodology for the Energy Need Assessment to Effectively Design and Deploy Mini-Grids for Rural Electrification. Energies. 2019, 12(3), 574.
210 Flammini, A.; Bracco, S.; Sims, R.; Cooke, J.; Elia, A. Costs and Benefits of Clean Energy Technologies in the Milk, Vegetable and Rice Value Chains. FAO: Rome, Italy, 2018.
211 Brüderle A.; Attigah, B.; Bodenbender, M. Produc-
tive Use of Energy – PRODUSE. A manual for elec-trification practitioners. GIZ, EUEI PDF: Eschborn, Germany, 2011.
212 IRENA. Unlocking Renewable Energy Investment:
The Role Of Risk Mitigation And Structured Finance. IRENA: Abu Dhabi, United Arab Emirates, 2015.
213 Johnstone K. Off-grid productivity: powering univer-
sal energy access. IIED Briefing Papers. 2019, January.214
Bilotta, N.; Colantoni, L. Financing Energy Access in Sub-Saharan Africa. IAI Papers. 2018, 22, 20.
215 NextBillion. PayGo vs. MFIs: What Works Better for
Energy Access Consumer Financing – And Does it Have to Be Either/Or?. 2018. Available online: https://nextbillion.net/paygo-vs-mfi-energy-ac-cess/ (accessed on 1 July 2019).
216 Jones, I. 2018. A Summary of Technology-enabled
Finance for Solar Systems in the Sahel: Burkina Faso. 2018. Available online: https://mei.chatham-house.org/file/2249/download?token=d-mcXR-La (accessed on 1 July 2019).
217 NextBillion. PayGo vs. MFIs: What Works Better for
Energy Access Consumer Financing – And Does it Have to Be Either/Or?. 2018. Available online: https://nextbillion.net/paygo-vs-mfi-energy-ac-cess/ (accessed on 1 July 2019).
218 Ibidem.
219 Williams, N.; Jaramillo, P.; Taneja, J.; Ustun, T.S. Enabling_Private_Sector_Investment_In_Mi-crogrid-Based_Rural_Electrification_In_Devel-oping_Countries: A_Review. Ren. And Sustain. Energy Rev. 2015, 52, 1268-1281.
220 Sanyal, S.; Pinchot, A.; Prins J.; Visco, F. Stimulat-ing Pay-As-You-Go Energy Access in Kenya and Tanzania: the role of development finance. World Resource Institute: Washington, DC, 2016.
221 NextBillion. Financing the Energy Access Revolution:
Three Technologies That Are Driving Africa’s Momen-tum. 2018. Available online: https://nextbillion.net/financing-energy-access-revolution-africa (accessed on 1 July 2019).
222 Ibidem.
223 Flammini, A.; Bracco, S.; Sims, R.; Cooke, J.; Elia, A. Costs and Benefits of Clean Energy Technologies in the Milk, Vegetable and Rice Value Chains. FAO: Rome, Italy, 2018.
224 FAO. Investing In Sustainable Energy Technolo-gies In The Agrifood Sector (Investa). FAO: Rome, Italy, 2018.
225 IEA, IRENA, UNSD, World Bank Group, WHO.
Tracking SDG7: The Energy Progress Report. World Bank: Washington, DC, 2018.
226 IEA. Energy Access Outlook 2017: From poverty to prosperity. IEA: Paris, France, 2017.
227 IRENA. Policies and regulations for private sector renewable energy mini-grids. IRENA: Abu Dhabi, United Arab Emirates, 2016.
228 Ibidem.
229 Power generation of at least 10 kW.

142
Abbreviations(AC) Alternating Current(BM) Business Model (BNEF) Bloomberg New Energy Finance(CAPEX) Capital Expenditure(DBE) Development Bank of Ethiopia (DC) Direct Current (DFI) Development Finance Institution(DoE) Department of Energy (DR) Demand-Response (DSM) Demand-Side Management (DSRA) Debt Service Reserve Account (E&S) Environmental and Social (EARP) Rwanda’s Electricity Access Role-Out Program (ECG) Electricity Company of Ghana (EDA) Energy Daily Allowance (EEA) Ethiopian Energy Authority (EEP) Ethiopian Electric Power (EEU) Ethiopian Electric Utility (EIA) Environmental Impact Assessment (EPRA) Energy and Petroleum Regulatory Authority(ERA) Electricity Regulation Act(ERB) Energy Regulation Board (ERC) Energy Regulatory Commission(EROI) Energy Return On Investment (ESG) Environmental, Social and Governance (ESIA) Environmental and Social Impact Assessment (ESMAP) Energy Sector Management Assistance Program (ESMS) Environmental and Social Management System (EU) European Union(FFS) Fee-For-Service (FiT) Feed-in Tariff (GCF) Green Climate Fund (GIS) Geographic Information Systems (GIZ) Deutsche Gesellschaft für Internationale Zusammenarbeit(GoE) Government of Ethiopia (GoK) Government of Kenya (GRIDCo) Ghana Grid Company Limited(GSM) Global System for Mobile communication (H&S) Health and Safety (HV) High Voltage (IBRD) International Bank for Reconstruction and Development (ICT) Information Communications Technology(IDA) International Development Agency(IDCOL) Infrastructure Development Company Limited (IEA) International Energy Agency (IFI) International Financial Institution (IIT Comillas) Instituto de Investigación Tecnológica Comillas(INEP) Integrated National Electrification Programme (INVESTA) Investing in Sustainable Energy Technologies in the Agrifood Sector (IPCC) Intergovernmental Panel on Climate Change (IPP) Independent Power Producer(IRP) Integrated Resource Plan(IRR) Internal Rate of Return (KOSAP) Kenya Off-grid Solar Access Programme (KPI) Key Performance Indicator(KPLC) Kenya Power and Electricity Company
(KTH) Kungliga Tekniska Högskolan (in Swedish), Royal Institute of Technology (in English) (LCOE) Levelized Cost Of Electricity (LV) Low Voltage (MFI) Microfinance Institution(MIT) Massachusetts Institute of Technology (MTF) Multi-Tier Framework (MV) Medium Voltage (NDP) National Development Plan (NEDCo) Northern Electricity Distribution Company (NEDLAC) National Economic Development and Labour Council (NEMA) National Environmental and Management Authority (NEP) National Electrification Program (NERSA) National Energy Regulator of South Africa (NGO) Non-Governmental Organization(NREL) National Renewable Energy Laboratory (O&M) Operation and Maintenance(OECD) Organisation for Economic Co-operation and Development (OGS) Off-Grid Solar(OnNSSET) OpeN Source Spatial Electrification Toolkit (OPEX) OPerating Expense(OPPPI) Office for Promoting Private Power Investment (PAYG) Pay-as-You-Ggo (PDS) Power Distribution Services Ghana Limited (PnP) Plug and Play (PPA) Power Purchase Agreement (PPP) Public Private Partnership (PUE) Productive Use of Electricity (PURC) Public Utilities Regulatory Commission(PV) Photovoltaics (RBF) Results-Based Financing (RE) Renewable Energy(REA) Rural Electrification Authority(REF) Rural Electrification Fund (REFIT) Renewable Energy Feed-in Tariff (REIPPPP) Renewable Energy Independent Power Producer Procurement Programme (REM) Reference Electrification Model (REREC) Rural Electrification and Renewable Energy Corporation (RISE) Regulatory Indicators for Sustainable Energy (ROI) Return On Investment (RPP) Renewable Power Plant(SDG) Sustainable Development Goal (SHS) Solar Home Systems (SOEs) State-Owned Enterprises (SPPA) Small Power Purchase Agreement(SROI) Social Return on Investment (T&D) Transmission and Distribution (TCX) The Currency Exchange (TDP) Transmission Development Plan (TTA)Trama TecnoAmbiental (USAID) U.S. Agency for International Development (VAT) Value Added Tax (VRA) Volta River Authority (WEF) Water-Energy-Food (ZABS) Zambian Bureau of Standards (ZEMA) Zambia Environmental Management Agency (ZESCO) Zambia Electricity Supply Corporation Limited

PRINTED IN DECEMBER 2019
w w w. g a n g e m i e d i t o r e . i t

RE-thinkingAccess
to Energy Business Models
Ways to Walk the Water-Energy-Food Nexus Talk
in Sub-Saharan Africa
RE-
thin
kin
g A
cces
s to
En
erg
y B
usi
nes
s M
od
els
Foundation
This study aims at exploring business models and innovative approaches, as well as understanding technical, social, regulatory and financial barriers, to foster the growth of decentralized renewable energy solutions in Africa. In this way, RES4Africa Foundation aims to contribute to the achievement of access to energy for all and ultimately, through inclusive growth and sustainable development, to the creation of a prosperous Africa.
Renewable Energy Solutions for Africa (RES4Africa) Foundation promotes the deployment of large scale and decentralized renewable energy in African markets to meet local energy needs for growth. RES4Africa gathers a member network from across the clean energy value chain and supports the creation of an enabling environment for renewable energy investments and strategic partnerships.
www.gangemieditore.it
3804-4 Res4Africa - BM Study 2019 COVER d10.indd 1 03/12/19 09:16