Quarterly General Insurance Performance Statistics - … … · Quarterly General Insurance...
38
Quarterly General Insurance Performance Statistics June 2017 (released 17 August 2017)
-
Upload
duongthien -
Category
Documents
-
view
214 -
download
0
Transcript of Quarterly General Insurance Performance Statistics - … … · Quarterly General Insurance...
Quarterly General Insurance Performance
Statistics
June 2017 (released 17 August 2017)
e-mail [email protected]
or write to Manager, Insurance Statistics
Australian Prudential Regulation Authority
GPO Box 9836
Sydney NSW 2001
Forthcoming issues
Copyright
Disclaimer
While APRA endeavours to ensure the quality of this Publication, APRA does not accept any responsibility
for the accuracy, completeness or currency of the material included in this Publication, and will not be
liable for any loss or damage arising out of any use of, or reliance on, this Publication.
This publication will be released according to the timetable published on the APRA website.
Revisions
This edition of the publication contains revisions to previously published statistics. Significant revisions, if
any, are identified and quantified in the ‘Important notice’.
This publication will include revisions to previously published statistics if better source data becomes
available or if compilation errors are uncovered.
APRA regularly analyses past revisions to identify potential improvements to the source data and statistical
compilation techniques, in order to minimise the frequency and scale of any future revisions.
Notation
Amounts are expressed in Australian dollars.
The symbol ' * ' indicates that the data have been masked to maintain confidentiality.
Explanatory notes and glossary
A set of explanatory notes are provided at the end of the publication to assist the reader in understanding
the source of the data. The notice following the contents page also provides details in relation to the
change in the general insurance reporting framework that took effect on 1 January 2013. A glossary to
assist the reader in understanding the definitions of the data in this publication is available at a link on the
Quarterly General Insurance Performance Statistics internet page.
Enquiries
For more information about the statistics in this publication:
© Australian Prudential Regulation Authority (APRA)
This work is licensed under the Creative Commons Attribution 3.0 Australia Licence (CCBY 3.0).
This licence allows you to copy, distribute and adapt this work, provided you attribute the work and do not suggest that APRA endorses you or your work. To view a full copy of the terms of this licence, visit www.creativecommons.org/licenses/by/3.0/au/.
Australian Prudential Regulation Authority 2

Contents
Important notice Important notice 4
Highlights Highlights 5
Key statistics Key statistics 7
All general insurers' statistics
Financial performance Table 1a 10
Financial position Table 1b 11Performance ratios Table 1c 12Investment performance Table 1d 13
Capital adequacy Table 1e 14Underwriting performance by class of business
Houseowners/householders Table 1f 15Domestic motor vehicle Table 1g 16Fire and ISR Table 1h 17Commercial motor vehicle Table 1i 18CTP motor vehicle Table 1j 19Public and product liability Table 1k 20Professional indemnity Table 1l 21Employers' liability Table 1m 22Mortgage Table 1n 23Other direct classes Table 1o 24Proportional reinsurance Table 1p 25Non-proportional reinsurance Table 1q 26
Direct insurers' statistics
Financial performance Table 2a 27Financial position Table 2b 28
Performance ratios Table 2c 29Investment performance Table 2d 30
Capital adequacy Table 2e 31
Reinsurers' statistics
Financial performance Table 3a 32Financial position Table 3b 33
Performance ratios Table 3c 34Investment performance Table 3d 35
Capital adequacy Table 3e 36
Explanatory notes Explanatory notes 37
Australian Prudential Regulation Authority 3
Important notice
Table and item
Period(s)
impacted* Cause of revision Entity (where applicable)
Previous
figure
($ million)
Revised
figure
($ million)
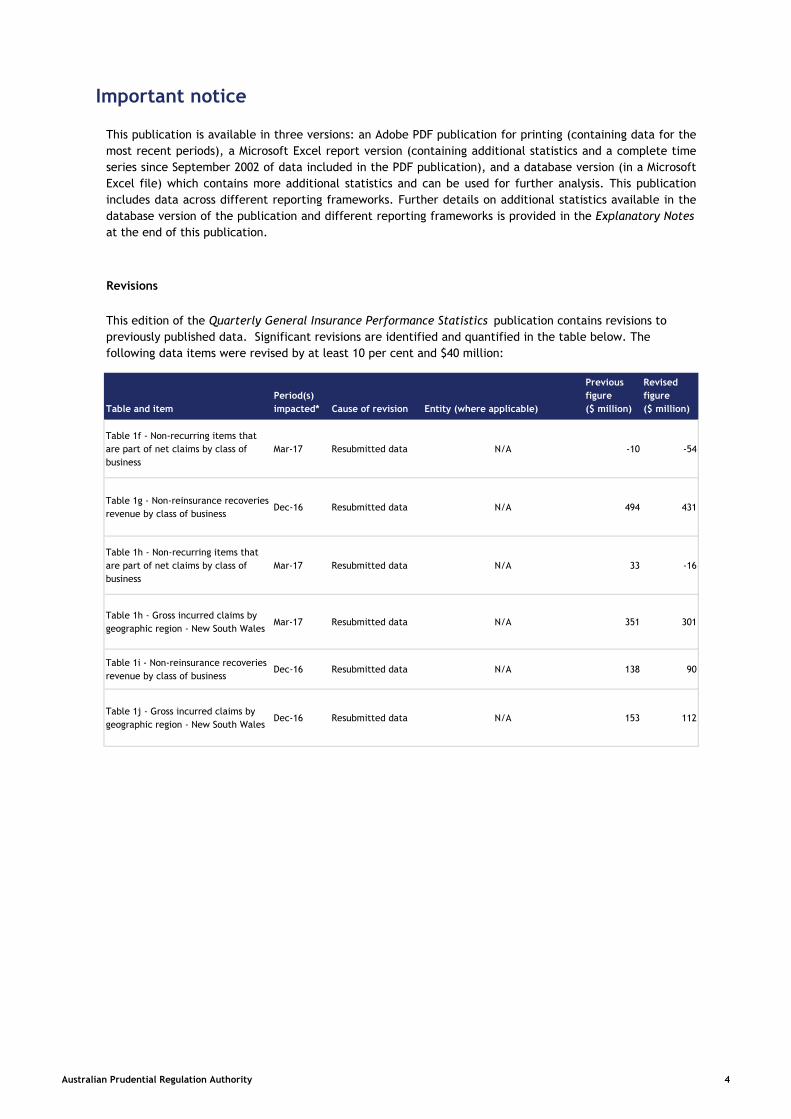
Table 1f - Non-recurring items that
are part of net claims by class of
business
Mar-17 Resubmitted data N/A -10 -54
Table 1g - Non-reinsurance recoveries
revenue by class of businessDec-16 Resubmitted data N/A 494 431
Table 1h - Non-recurring items that
are part of net claims by class of
business
Mar-17 Resubmitted data N/A 33 -16
Table 1h - Gross incurred claims by
geographic region - New South WalesMar-17 Resubmitted data N/A 351 301
Table 1i - Non-reinsurance recoveries
revenue by class of businessDec-16 Resubmitted data N/A 138 90
Table 1j - Gross incurred claims by
geographic region - New South WalesDec-16 Resubmitted data N/A 153 112
This publication is available in three versions: an Adobe PDF publication for printing (containing data for the
most recent periods), a Microsoft Excel report version (containing additional statistics and a complete time
series since September 2002 of data included in the PDF publication), and a database version (in a Microsoft
Excel file) which contains more additional statistics and can be used for further analysis. This publication
includes data across different reporting frameworks. Further details on additional statistics available in the
database version of the publication and different reporting frameworks is provided in the Explanatory Notes
at the end of this publication.
Revisions
This edition of the Quarterly General Insurance Performance Statistics publication contains revisions to
previously published data. Significant revisions are identified and quantified in the table below. The
following data items were revised by at least 10 per cent and $40 million:
Australian Prudential Regulation Authority 4
Highlights
Main features
•
•
•
•
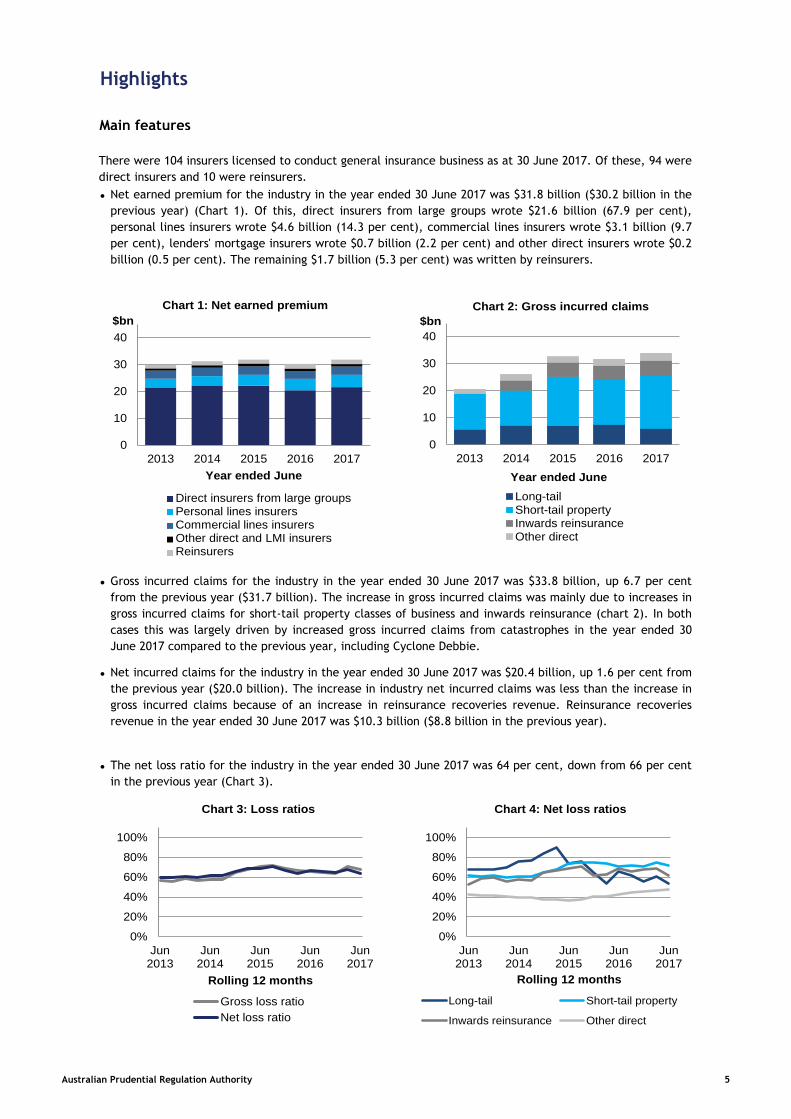
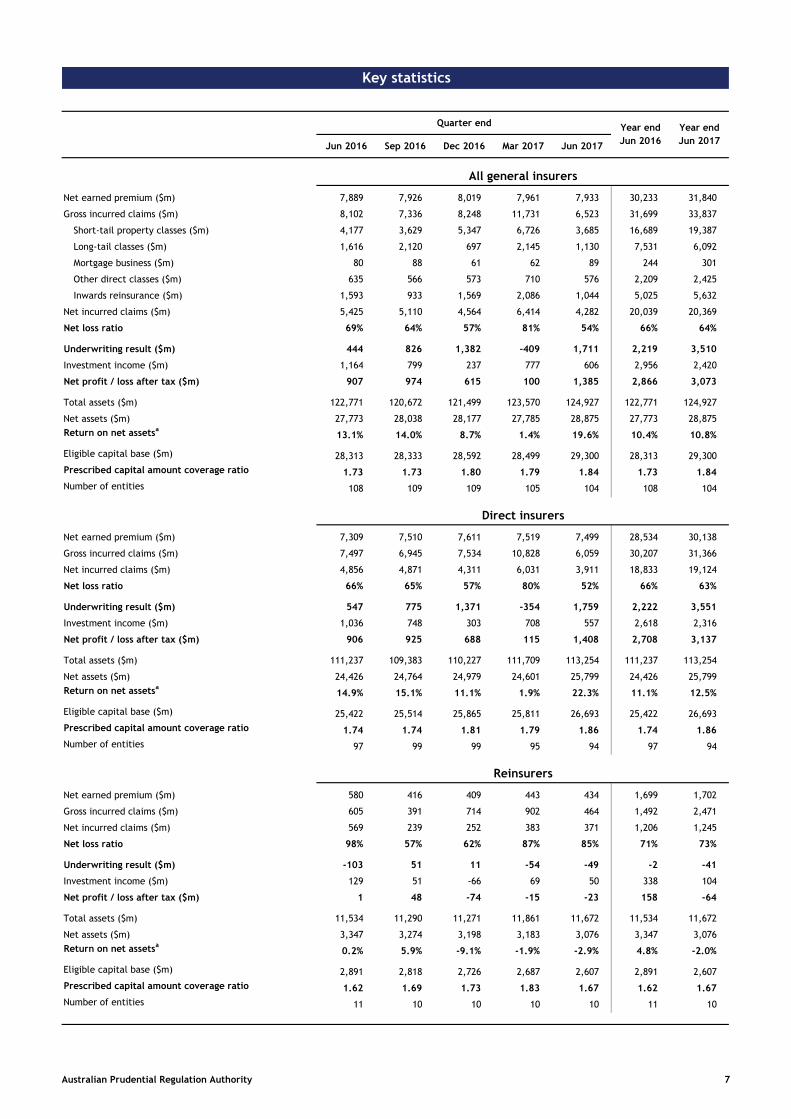
There were 104 insurers licensed to conduct general insurance business as at 30 June 2017. Of these, 94 were
direct insurers and 10 were reinsurers.
Net earned premium for the industry in the year ended 30 June 2017 was $31.8 billion ($30.2 billion in the
previous year) (Chart 1). Of this, direct insurers from large groups wrote $21.6 billion (67.9 per cent),
personal lines insurers wrote $4.6 billion (14.3 per cent), commercial lines insurers wrote $3.1 billion (9.7
per cent), lenders' mortgage insurers wrote $0.7 billion (2.2 per cent) and other direct insurers wrote $0.2
billion (0.5 per cent). The remaining $1.7 billion (5.3 per cent) was written by reinsurers.
Gross incurred claims for the industry in the year ended 30 June 2017 was $33.8 billion, up 6.7 per cent
from the previous year ($31.7 billion). The increase in gross incurred claims was mainly due to increases in
gross incurred claims for short-tail property classes of business and inwards reinsurance (chart 2). In both
cases this was largely driven by increased gross incurred claims from catastrophes in the year ended 30
June 2017 compared to the previous year, including Cyclone Debbie.
Net incurred claims for the industry in the year ended 30 June 2017 was $20.4 billion, up 1.6 per cent from
the previous year ($20.0 billion). The increase in industry net incurred claims was less than the increase in
gross incurred claims because of an increase in reinsurance recoveries revenue. Reinsurance recoveries
revenue in the year ended 30 June 2017 was $10.3 billion ($8.8 billion in the previous year).
The net loss ratio for the industry in the year ended 30 June 2017 was 64 per cent, down from 66 per cent
in the previous year (Chart 3).
0
10
20
30
40
2013 2014 2015 2016 2017
$bn
Year ended June
Chart 1: Net earned premium
Reinsurers
Other direct and LMI insurers
Commercial lines insurers
Personal lines insurers
Direct insurers from large groups
Direct insurers from large groupsPersonal lines insurersCommercial lines insurersOther direct and LMI insurersReinsurers
0
10
20
30
40
2013 2014 2015 2016 2017
$bn
Year ended June
Chart 2: Gross incurred claims
Long-tailShort-tail propertyInwards reinsuranceOther direct
0%
20%
40%
60%
80%
100%
Jun2013
Jun2014
Jun2015
Jun2016
Jun2017
Rolling 12 months
Chart 3: Loss ratios
Gross loss ratio
Net loss ratio
0%
20%
40%
60%
80%
100%
Jun2013
Jun2014
Jun2015
Jun2016
Jun2017
Rolling 12 months
Chart 4: Net loss ratios
Long-tail Short-tail property
Inwards reinsurance Other direct
Australian Prudential Regulation Authority 5

•
•
•
•
•
•
The net loss ratio for the short-tail property classes of business in the year ended 30 June 2017 was 72 per
cent, up from 71 per cent in the previous year. The net loss ratio for the long-tail classes of business in the
year ended 30 June 2017 was 54 per cent, down from 66 per cent in the previous year (Chart 4).
The underwriting expense ratio for the industry in the year ended 30 June 2017 was 25 per cent, down
from 26 per cent in the previous year. Total industry underwriting expenses were $8.0 billion in the year
ended 30 June 2017, unchanged from the previous year.
The industry underwriting result in the year ended 30 June 2017 was a profit of $3.5 billion, compared to a
profit of $2.2 billion in the previous year. The higher underwriting result was mainly related to the
increase in reserve releases across long-tail classes of business.
Investment income for the industry in the year ended 30 June 2017 was $2,420 million, down $536 million
from the previous year ($2,956 million) (Chart 6). The decrease in investment income was primarily related
to unrealised gains/losses from changes in net market value, which was a loss of $712 million in the year
ended 30 June 2017, compared to a loss of $25 million in the previous year.
Total industry net profit after tax in the year ended 30 June 2017 was a profit of $3.1 billion, up from $2.9
billion in the previous year. This represented a return on net assets of 10.8 per cent in the year ended 30
June 2017, up from 10.4 per cent in the previous year (see returns in the glossary) (Chart 7). Industry net
assets were $28.9 billion as at 30 June 2017, an increase of $1.1 billion (4.0 per cent) from the previous
year ($27.8 billion).
The prescribed capital amount coverage ratio for the industry was 1.84 times the prescribed capital
amount as at 30 June 2017, up from 1.73 times as at 30 June 2016. The eligible capital base for the
industry was $29.3 billion as at 30 June 2017, up 3.5 per cent from the previous year ($28.3 billion). The
prescribed capital amount was $15.9 billion as at 30 June 2017, down 3.1 per cent from the previous year
($16.4 billion) (Chart 8).
-2
-1
0
1
2
Jun2013
Jun2014
Jun2015
Jun2016
Jun2017
$bn
Rolling 12 months
Chart 5: Underwriting result
Long-tail Short-tail property
Inwards reinsurance Other direct
0%
5%
10%
15%
0
2
4
6
2013 2014 2015 2016 2017
$bn
Year ended June
Chart 6: Investment returns
Investment income (left)
Return on investments (right)
0%
10%
20%
30%
0
2
4
6
2013 2014 2015 2016 2017
$bn
Year ended June
Chart 7: Profitability
Net profit after tax (left)
Return on net assets (right)
0%
50%
100%
150%
200%
0
10
20
30
40
2013 2014 2015 2016 2017
$bn
As at June
Chart 8: Capital coverage
Capital in excess of PCA (left)
PCA (left)
PCA coverage ratio (right)
Australian Prudential Regulation Authority 6
Key statistics
Quarter end
Jun 2016 Sep 2016 Dec 2016 Mar 2017 Jun 2017
All general insurers
Net earned premium ($m) 7,889 7,926 8,019 7,961 7,933 30,233 31,840
Gross incurred claims ($m) 8,102 7,336 8,248 11,731 6,523 31,699 33,837
Short-tail property classes ($m) 4,177 3,629 5,347 6,726 3,685 16,689 19,387
Long-tail classes ($m) 1,616 2,120 697 2,145 1,130 7,531 6,092
Mortgage business ($m) 80 88 61 62 89 244 301
Other direct classes ($m) 635 566 573 710 576 2,209 2,425
Inwards reinsurance ($m) 1,593 933 1,569 2,086 1,044 5,025 5,632
Net incurred claims ($m) 5,425 5,110 4,564 6,414 4,282 20,039 20,369
Net loss ratio 69% 64% 57% 81% 54% 66% 64%
Underwriting result ($m) 444 826 1,382 -409 1,711 2,219 3,510
Investment income ($m) 1,164 799 237 777 606 2,956 2,420
Net profit / loss after tax ($m) 907 974 615 100 1,385 2,866 3,073
Total assets ($m) 122,771 120,672 121,499 123,570 124,927 122,771 124,927
Net assets ($m) 27,773 28,038 28,177 27,785 28,875 27,773 28,875
Return on net assetsa
13.1% 14.0% 8.7% 1.4% 19.6% 10.4% 10.8%
Eligible capital base ($m) 28,313 28,333 28,592 28,499 29,300 28,313 29,300
Prescribed capital amount coverage ratio 1.73 1.73 1.80 1.79 1.84 1.73 1.84
Number of entities 108 109 109 105 104 108 104
Direct insurers
Net earned premium ($m) 7,309 7,510 7,611 7,519 7,499 28,534 30,138
Gross incurred claims ($m) 7,497 6,945 7,534 10,828 6,059 30,207 31,366
Net incurred claims ($m) 4,856 4,871 4,311 6,031 3,911 18,833 19,124
Net loss ratio 66% 65% 57% 80% 52% 66% 63%
Underwriting result ($m) 547 775 1,371 -354 1,759 2,222 3,551
Investment income ($m) 1,036 748 303 708 557 2,618 2,316
Net profit / loss after tax ($m) 906 925 688 115 1,408 2,708 3,137
Total assets ($m) 111,237 109,383 110,227 111,709 113,254 111,237 113,254
Net assets ($m) 24,426 24,764 24,979 24,601 25,799 24,426 25,799
Return on net assetsa
14.9% 15.1% 11.1% 1.9% 22.3% 11.1% 12.5%
Eligible capital base ($m) 25,422 25,514 25,865 25,811 26,693 25,422 26,693
Prescribed capital amount coverage ratio 1.74 1.74 1.81 1.79 1.86 1.74 1.86
Number of entities 97 99 99 95 94 97 94
Reinsurers
Net earned premium ($m) 580 416 409 443 434 1,699 1,702
Gross incurred claims ($m) 605 391 714 902 464 1,492 2,471
Net incurred claims ($m) 569 239 252 383 371 1,206 1,245
Net loss ratio 98% 57% 62% 87% 85% 71% 73%
Underwriting result ($m) -103 51 11 -54 -49 -2 -41
Investment income ($m) 129 51 -66 69 50 338 104
Net profit / loss after tax ($m) 1 48 -74 -15 -23 158 -64
Total assets ($m) 11,534 11,290 11,271 11,861 11,672 11,534 11,672
Net assets ($m) 3,347 3,274 3,198 3,183 3,076 3,347 3,076
Return on net assetsa
0.2% 5.9% -9.1% -1.9% -2.9% 4.8% -2.0%
Eligible capital base ($m) 2,891 2,818 2,726 2,687 2,607 2,891 2,607
Prescribed capital amount coverage ratio 1.62 1.69 1.73 1.83 1.67 1.62 1.67
Number of entities 11 10 10 10 10 11 10
Year end
Jun 2016
Year end
Jun 2017
Australian Prudential Regulation Authority 7
Key statistics (continued)
Quarter end
Jun 2016 Sep 2016 Dec 2016 Mar 2017 Jun 2017
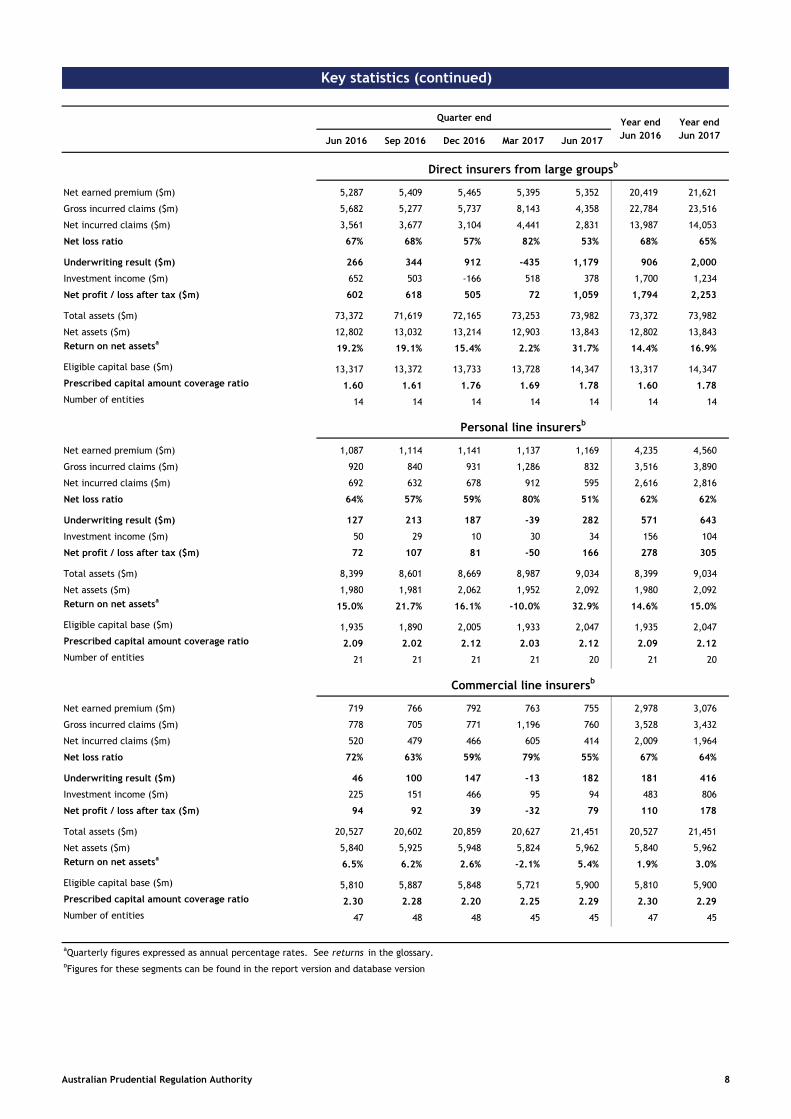
Direct insurers from large groupsb
Net earned premium ($m) 5,287 5,409 5,465 5,395 5,352 20,419 21,621
Gross incurred claims ($m) 5,682 5,277 5,737 8,143 4,358 22,784 23,516
Net incurred claims ($m) 3,561 3,677 3,104 4,441 2,831 13,987 14,053
Net loss ratio 67% 68% 57% 82% 53% 68% 65%
Underwriting result ($m) 266 344 912 -435 1,179 906 2,000
Investment income ($m) 652 503 -166 518 378 1,700 1,234
Net profit / loss after tax ($m) 602 618 505 72 1,059 1,794 2,253
Total assets ($m) 73,372 71,619 72,165 73,253 73,982 73,372 73,982
Net assets ($m) 12,802 13,032 13,214 12,903 13,843 12,802 13,843
Return on net assetsa
19.2% 19.1% 15.4% 2.2% 31.7% 14.4% 16.9%
Eligible capital base ($m) 13,317 13,372 13,733 13,728 14,347 13,317 14,347
Prescribed capital amount coverage ratio 1.60 1.61 1.76 1.69 1.78 1.60 1.78
Number of entities 14 14 14 14 14 14 14
Personal line insurersb
Net earned premium ($m) 1,087 1,114 1,141 1,137 1,169 4,235 4,560
Gross incurred claims ($m) 920 840 931 1,286 832 3,516 3,890
Net incurred claims ($m) 692 632 678 912 595 2,616 2,816
Net loss ratio 64% 57% 59% 80% 51% 62% 62%
Underwriting result ($m) 127 213 187 -39 282 571 643
Investment income ($m) 50 29 10 30 34 156 104
Net profit / loss after tax ($m) 72 107 81 -50 166 278 305
Total assets ($m) 8,399 8,601 8,669 8,987 9,034 8,399 9,034
Net assets ($m) 1,980 1,981 2,062 1,952 2,092 1,980 2,092
Return on net assetsa
15.0% 21.7% 16.1% -10.0% 32.9% 14.6% 15.0%
Eligible capital base ($m) 1,935 1,890 2,005 1,933 2,047 1,935 2,047
Prescribed capital amount coverage ratio 2.09 2.02 2.12 2.03 2.12 2.09 2.12
Number of entities 21 21 21 21 20 21 20
Commercial line insurersb
Net earned premium ($m) 719 766 792 763 755 2,978 3,076
Gross incurred claims ($m) 778 705 771 1,196 760 3,528 3,432
Net incurred claims ($m) 520 479 466 605 414 2,009 1,964
Net loss ratio 72% 63% 59% 79% 55% 67% 64%
Underwriting result ($m) 46 100 147 -13 182 181 416
Investment income ($m) 225 151 466 95 94 483 806
Net profit / loss after tax ($m) 94 92 39 -32 79 110 178
Total assets ($m) 20,527 20,602 20,859 20,627 21,451 20,527 21,451
Net assets ($m) 5,840 5,925 5,948 5,824 5,962 5,840 5,962
Return on net assetsa
6.5% 6.2% 2.6% -2.1% 5.4% 1.9% 3.0%
Eligible capital base ($m) 5,810 5,887 5,848 5,721 5,900 5,810 5,900
Prescribed capital amount coverage ratio 2.30 2.28 2.20 2.25 2.29 2.30 2.29
Number of entities 47 48 48 45 45 47 45
aQuarterly figures expressed as annual percentage rates. See returns in the glossary.
bFigures for these segments can be found in the report version and database version
Year end
Jun 2016
Year end
Jun 2017
Australian Prudential Regulation Authority 8
Key statistics (continued)
Quarter end
Jun 2016 Sep 2016 Dec 2016 Mar 2017 Jun 2017
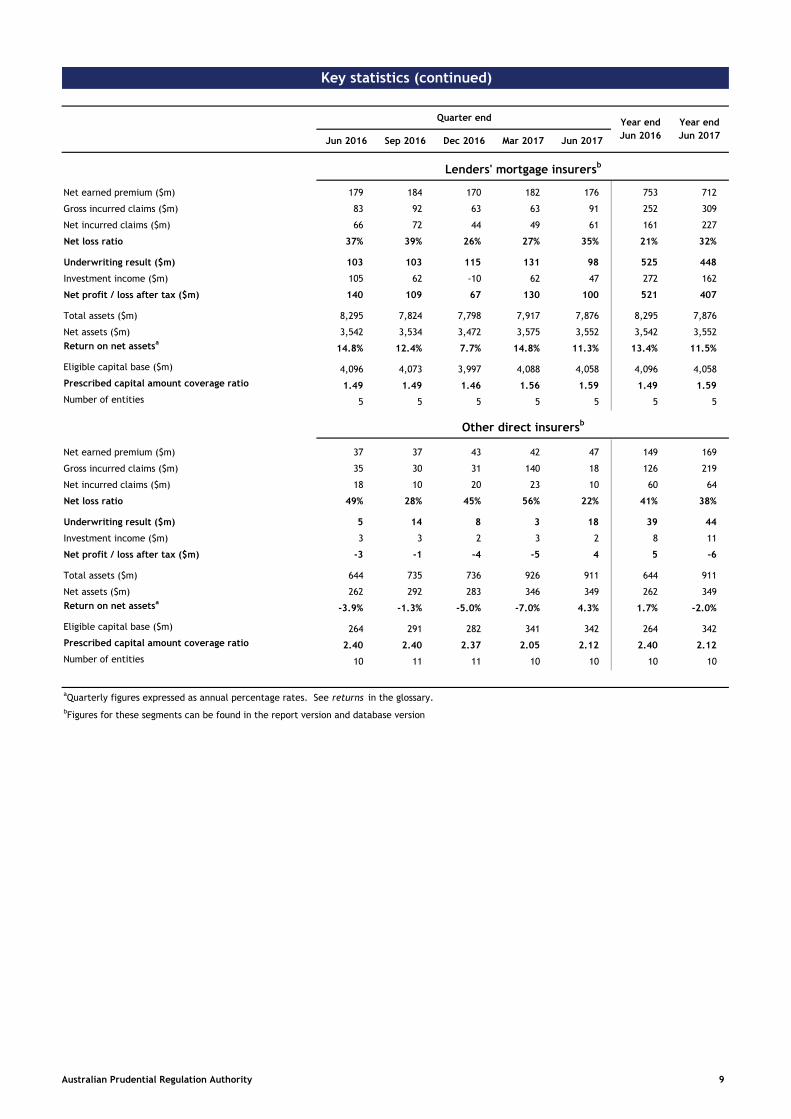
Lenders' mortgage insurersb
Net earned premium ($m) 179 184 170 182 176 753 712
Gross incurred claims ($m) 83 92 63 63 91 252 309
Net incurred claims ($m) 66 72 44 49 61 161 227
Net loss ratio 37% 39% 26% 27% 35% 21% 32%
Underwriting result ($m) 103 103 115 131 98 525 448
Investment income ($m) 105 62 -10 62 47 272 162
Net profit / loss after tax ($m) 140 109 67 130 100 521 407
Total assets ($m) 8,295 7,824 7,798 7,917 7,876 8,295 7,876
Net assets ($m) 3,542 3,534 3,472 3,575 3,552 3,542 3,552
Return on net assetsa
14.8% 12.4% 7.7% 14.8% 11.3% 13.4% 11.5%
Eligible capital base ($m) 4,096 4,073 3,997 4,088 4,058 4,096 4,058
Prescribed capital amount coverage ratio 1.49 1.49 1.46 1.56 1.59 1.49 1.59
Number of entities 5 5 5 5 5 5 5
Other direct insurersb
Jun 2016 Sep 2016 Dec 2016 Mar 2017 Jun 2017Year End Jun 2016Year End Jun 2017
Net earned premium ($m) 37 37 43 42 47 149 169
Gross incurred claims ($m) 35 30 31 140 18 126 219
Net incurred claims ($m) 18 10 20 23 10 60 64
Net loss ratio 49% 28% 45% 56% 22% 41% 38%
Underwriting result ($m) 5 14 8 3 18 39 44
Investment income ($m) 3 3 2 3 2 8 11
Net profit / loss after tax ($m) -3 -1 -4 -5 4 5 -6
Total assets ($m) 644 735 736 926 911 644 911
Net assets ($m) 262 292 283 346 349 262 349
Return on net assetsa
-3.9% -1.3% -5.0% -7.0% 4.3% 1.7% -2.0%
Eligible capital base ($m) 264 291 282 341 342 264 342
Prescribed capital amount coverage ratio 2.40 2.40 2.37 2.05 2.12 2.40 2.12
Number of entities 10 11 11 10 10 10 10
aQuarterly figures expressed as annual percentage rates. See returns in the glossary.
bFigures for these segments can be found in the report version and database version
Year end
Jun 2016
Year end
Jun 2017
Australian Prudential Regulation Authority 9
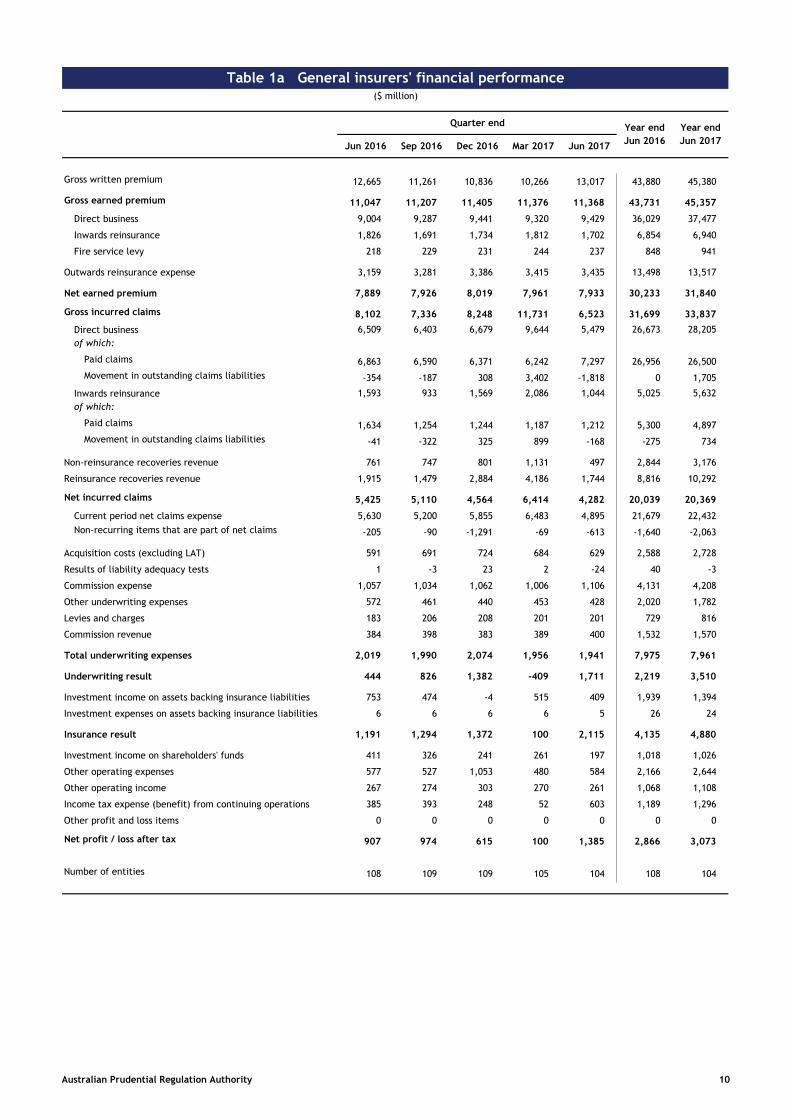
Table 1a General insurers' financial performance($ million)
Quarter end
Jun 2016 Sep 2016 Dec 2016 Mar 2017 Jun 2017
Gross written premium 12,665 11,261 10,836 10,266 13,017 43,880 45,380
Gross earned premium 11,047 11,207 11,405 11,376 11,368 43,731 45,357
Direct business 9,004 9,287 9,441 9,320 9,429 36,029 37,477
Inwards reinsurance 1,826 1,691 1,734 1,812 1,702 6,854 6,940
Fire service levy 218 229 231 244 237 848 941
Outwards reinsurance expense 3,159 3,281 3,386 3,415 3,435 13,498 13,517
Net earned premium 7,889 7,926 8,019 7,961 7,933 30,233 31,840
Gross incurred claims 8,102 7,336 8,248 11,731 6,523 31,699 33,837
Direct business
of which:
6,509 6,403 6,679 9,644 5,479 26,673 28,205
Paid claims 6,863 6,590 6,371 6,242 7,297 26,956 26,500
Movement in outstanding claims liabilities -354 -187 308 3,402 -1,818 0 1,705
Inwards reinsurance
of which:
1,593 933 1,569 2,086 1,044 5,025 5,632
Paid claims 1,634 1,254 1,244 1,187 1,212 5,300 4,897
Movement in outstanding claims liabilities -41 -322 325 899 -168 -275 734
Non-reinsurance recoveries revenue 761 747 801 1,131 497 2,844 3,176
Reinsurance recoveries revenue 1,915 1,479 2,884 4,186 1,744 8,816 10,292
Net incurred claims 5,425 5,110 4,564 6,414 4,282 20,039 20,369
Current period net claims expense 5,630 5,200 5,855 6,483 4,895 21,679 22,432
Non-recurring items that are part of net claims -205 -90 -1,291 -69 -613 -1,640 -2,063
Acquisition costs (excluding LAT) 591 691 724 684 629 2,588 2,728
Results of liability adequacy tests 1 -3 23 2 -24 40 -3
Commission expense 1,057 1,034 1,062 1,006 1,106 4,131 4,208
Other underwriting expenses 572 461 440 453 428 2,020 1,782
Levies and charges 183 206 208 201 201 729 816
Commission revenue 384 398 383 389 400 1,532 1,570
Total underwriting expenses 2,019 1,990 2,074 1,956 1,941 7,975 7,961
Underwriting result 444 826 1,382 -409 1,711 2,219 3,510
Investment income on assets backing insurance liabilities 753 474 -4 515 409 1,939 1,394
Investment expenses on assets backing insurance liabilities 6 6 6 6 5 26 24
Insurance result 1,191 1,294 1,372 100 2,115 4,135 4,880
Investment income on shareholders' funds 411 326 241 261 197 1,018 1,026
Other operating expenses 577 527 1,053 480 584 2,166 2,644
Other operating income 267 274 303 270 261 1,068 1,108
Income tax expense (benefit) from continuing operations 385 393 248 52 603 1,189 1,296
Other profit and loss items 0 0 0 0 0 0 0
Net profit / loss after tax 907 974 615 100 1,385 2,866 3,073
Number of entities 108 109 109 105 104 108 104
Year end
Jun 2016
Year end
Jun 2017
Australian Prudential Regulation Authority 10
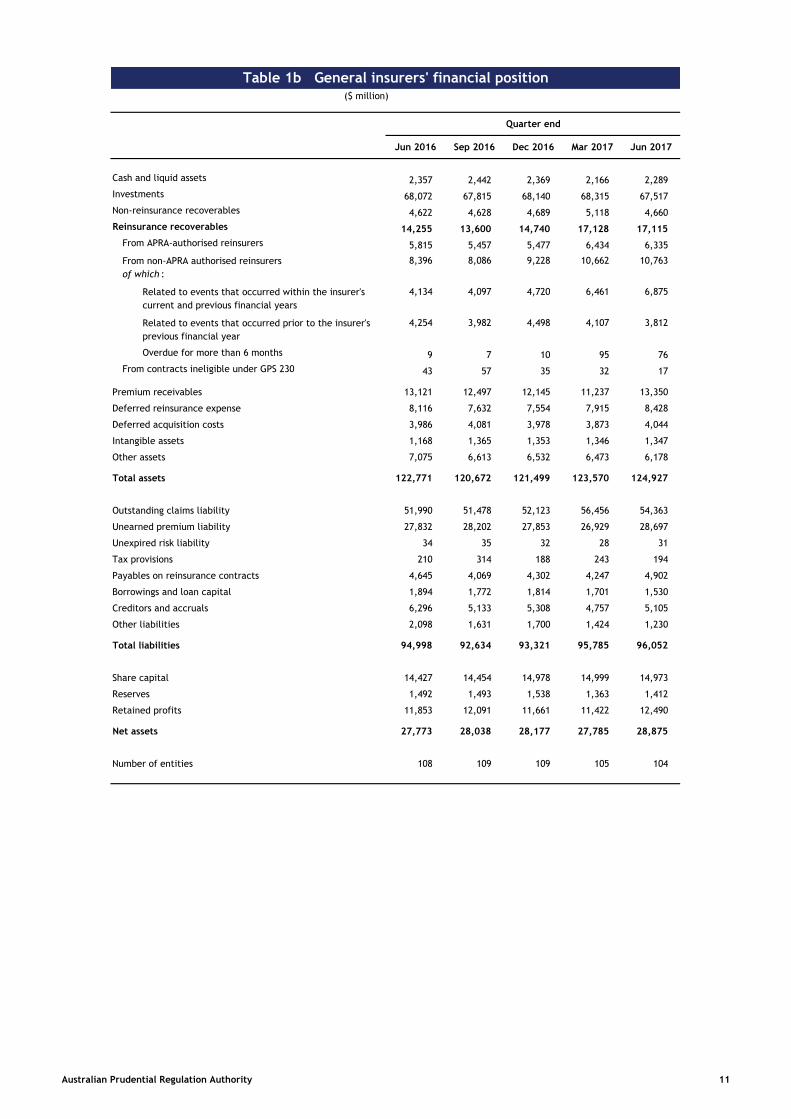
Table 1b General insurers' financial position($ million)
Quarter end
Jun 2016 Sep 2016 Dec 2016 Mar 2017 Jun 2017
Cash and liquid assets 2,357 2,442 2,369 2,166 2,289
Investments 68,072 67,815 68,140 68,315 67,517
Non-reinsurance recoverables 4,622 4,628 4,689 5,118 4,660
Reinsurance recoverables 14,255 13,600 14,740 17,128 17,115
From APRA-authorised reinsurers 5,815 5,457 5,477 6,434 6,335
From non-APRA authorised reinsurers
of which :
8,396 8,086 9,228 10,662 10,763
Related to events that occurred within the insurer's
current and previous financial years
4,134 4,097 4,720 6,461 6,875
Related to events that occurred prior to the insurer's
previous financial year
4,254 3,982 4,498 4,107 3,812
Overdue for more than 6 months 9 7 10 95 76
From contracts ineligible under GPS 230 43 57 35 32 17
Premium receivables 13,121 12,497 12,145 11,237 13,350
Deferred reinsurance expense 8,116 7,632 7,554 7,915 8,428
Deferred acquisition costs 3,986 4,081 3,978 3,873 4,044
Intangible assets 1,168 1,365 1,353 1,346 1,347
Other assets 7,075 6,613 6,532 6,473 6,178
Total assets 122,771 120,672 121,499 123,570 124,927
Outstanding claims liability 51,990 51,478 52,123 56,456 54,363
Unearned premium liability 27,832 28,202 27,853 26,929 28,697
Unexpired risk liability 34 35 32 28 31
Tax provisions 210 314 188 243 194
Payables on reinsurance contracts 4,645 4,069 4,302 4,247 4,902
Borrowings and loan capital 1,894 1,772 1,814 1,701 1,530
Creditors and accruals 6,296 5,133 5,308 4,757 5,105
Other liabilities 2,098 1,631 1,700 1,424 1,230
Total liabilities 94,998 92,634 93,321 95,785 96,052
Share capital 14,427 14,454 14,978 14,999 14,973
Reserves 1,492 1,493 1,538 1,363 1,412
Retained profits 11,853 12,091 11,661 11,422 12,490
Net assets 27,773 28,038 28,177 27,785 28,875
Number of entities 108 109 109 105 104
Australian Prudential Regulation Authority 11
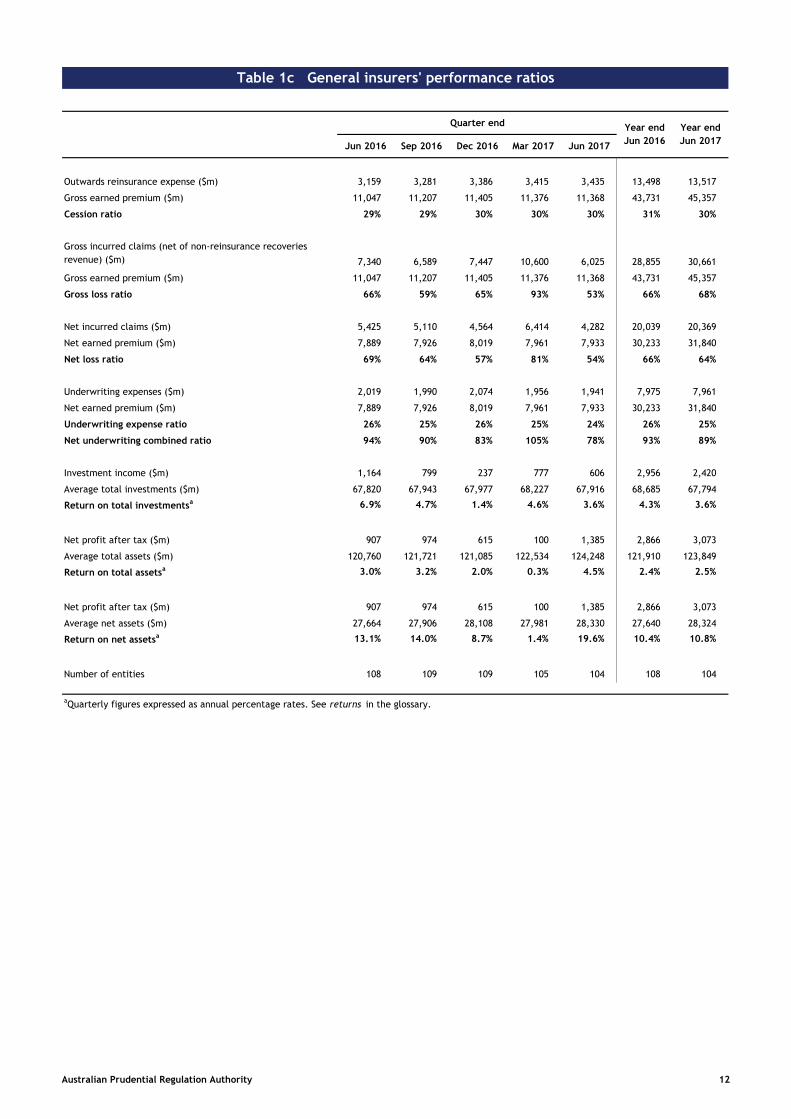
Table 1c General insurers' performance ratios
Quarter end
Jun 2016 Sep 2016 Dec 2016 Mar 2017 Jun 2017
Outwards reinsurance expense ($m) 3,159 3,281 3,386 3,415 3,435 13,498 13,517
Gross earned premium ($m) 11,047 11,207 11,405 11,376 11,368 43,731 45,357
Cession ratio 29% 29% 30% 30% 30% 31% 30%
Gross incurred claims (net of non-reinsurance recoveries
revenue) ($m) 7,340 6,589 7,447 10,600 6,025 28,855 30,661
Gross earned premium ($m) 11,047 11,207 11,405 11,376 11,368 43,731 45,357
Gross loss ratio 66% 59% 65% 93% 53% 66% 68%
Net incurred claims ($m) 5,425 5,110 4,564 6,414 4,282 20,039 20,369
Net earned premium ($m) 7,889 7,926 8,019 7,961 7,933 30,233 31,840
Net loss ratio 69% 64% 57% 81% 54% 66% 64%
Underwriting expenses ($m) 2,019 1,990 2,074 1,956 1,941 7,975 7,961
Net earned premium ($m) 7,889 7,926 8,019 7,961 7,933 30,233 31,840
Underwriting expense ratio 26% 25% 26% 25% 24% 26% 25%
Net underwriting combined ratio 94% 90% 83% 105% 78% 93% 89%
Investment income ($m) 1,164 799 237 777 606 2,956 2,420
Average total investments ($m) 67,820 67,943 67,977 68,227 67,916 68,685 67,794
Return on total investmentsa 6.9% 4.7% 1.4% 4.6% 3.6% 4.3% 3.6%
Net profit after tax ($m) 907 974 615 100 1,385 2,866 3,073
Average total assets ($m) 120,760 121,721 121,085 122,534 124,248 121,910 123,849
Return on total assetsa 3.0% 3.2% 2.0% 0.3% 4.5% 2.4% 2.5%
Net profit after tax ($m) 907 974 615 100 1,385 2,866 3,073
Average net assets ($m) 27,664 27,906 28,108 27,981 28,330 27,640 28,324
Return on net assetsa 13.1% 14.0% 8.7% 1.4% 19.6% 10.4% 10.8%
Number of entities 108 109 109 105 104 108 104
aQuarterly figures expressed as annual percentage rates. See returns in the glossary.
Year end
Jun 2016
Year end
Jun 2017
Australian Prudential Regulation Authority 12
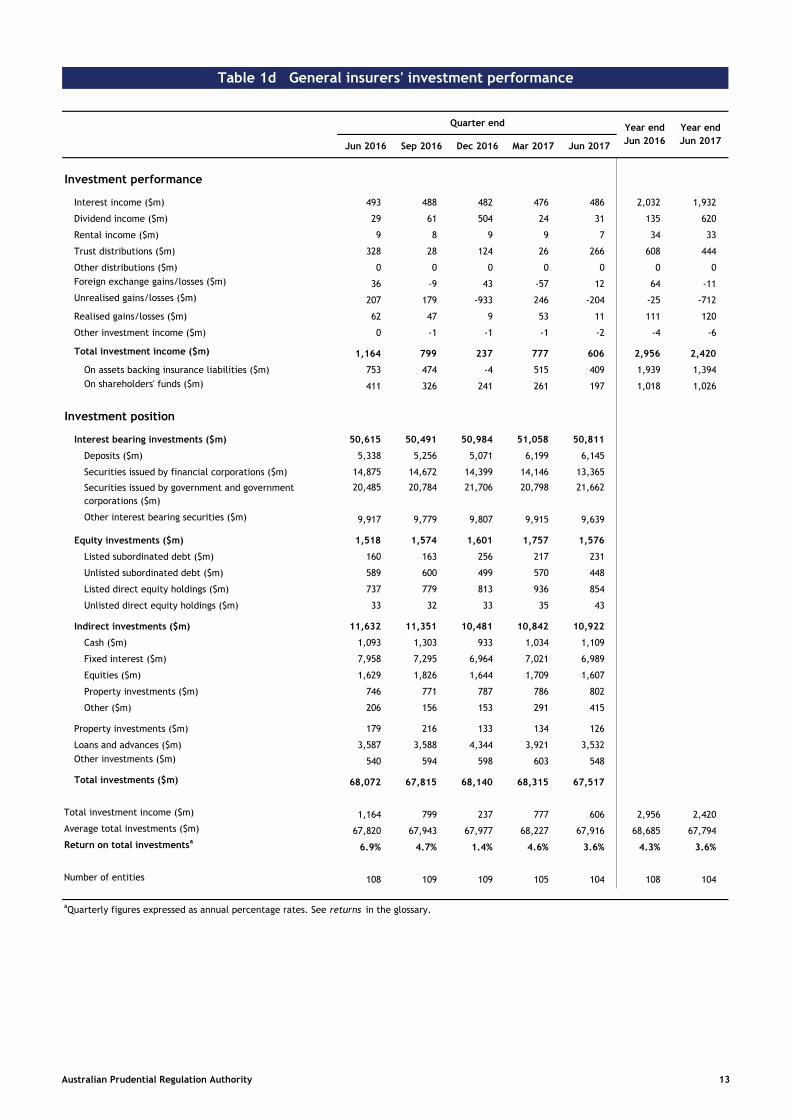
Table 1d General insurers' investment performance
Quarter end
Jun 2016 Sep 2016 Dec 2016 Mar 2017 Jun 2017
Investment performance
Interest income ($m) 493 488 482 476 486 2,032 1,932
Dividend income ($m) 29 61 504 24 31 135 620
Rental income ($m) 9 8 9 9 7 34 33
Trust distributions ($m) 328 28 124 26 266 608 444
Other distributions ($m) 0 0 0 0 0 0 0
Foreign exchange gains/losses ($m) 36 -9 43 -57 12 64 -11
Unrealised gains/losses ($m) 207 179 -933 246 -204 -25 -712
Realised gains/losses ($m) 62 47 9 53 11 111 120
Other investment income ($m) 0 -1 -1 -1 -2 -4 -6
Total investment income ($m) 1,164 799 237 777 606 2,956 2,420
On assets backing insurance liabilities ($m) 753 474 -4 515 409 1,939 1,394
On shareholders' funds ($m) 411 326 241 261 197 1,018 1,026
Investment position
Interest bearing investments ($m) 50,615 50,491 50,984 51,058 50,811
Deposits ($m) 5,338 5,256 5,071 6,199 6,145
Securities issued by financial corporations ($m) 14,875 14,672 14,399 14,146 13,365
Securities issued by government and government
corporations ($m)
20,485 20,784 21,706 20,798 21,662
Other interest bearing securities ($m) 9,917 9,779 9,807 9,915 9,639
Equity investments ($m) 1,518 1,574 1,601 1,757 1,576
Listed subordinated debt ($m) 160 163 256 217 231
Unlisted subordinated debt ($m) 589 600 499 570 448
Listed direct equity holdings ($m) 737 779 813 936 854
Unlisted direct equity holdings ($m) 33 32 33 35 43
Indirect investments ($m) 11,632 11,351 10,481 10,842 10,922
Cash ($m) 1,093 1,303 933 1,034 1,109
Fixed interest ($m) 7,958 7,295 6,964 7,021 6,989
Equities ($m) 1,629 1,826 1,644 1,709 1,607
Property investments ($m) 746 771 787 786 802
Other ($m) 206 156 153 291 415
Property investments ($m) 179 216 133 134 126
Loans and advances ($m) 3,587 3,588 4,344 3,921 3,532
Other investments ($m) 540 594 598 603 548
Total investments ($m) 68,072 67,815 68,140 68,315 67,517
Total investment income ($m) 1,164 799 237 777 606 2,956 2,420
Average total investments ($m) 67,820 67,943 67,977 68,227 67,916 68,685 67,794
Return on total investmentsa
6.9% 4.7% 1.4% 4.6% 3.6% 4.3% 3.6%
Number of entities 108 109 109 105 104 108 104
aQuarterly figures expressed as annual percentage rates. See returns in the glossary.
Year end
Jun 2016
Year end
Jun 2017
Australian Prudential Regulation Authority 13
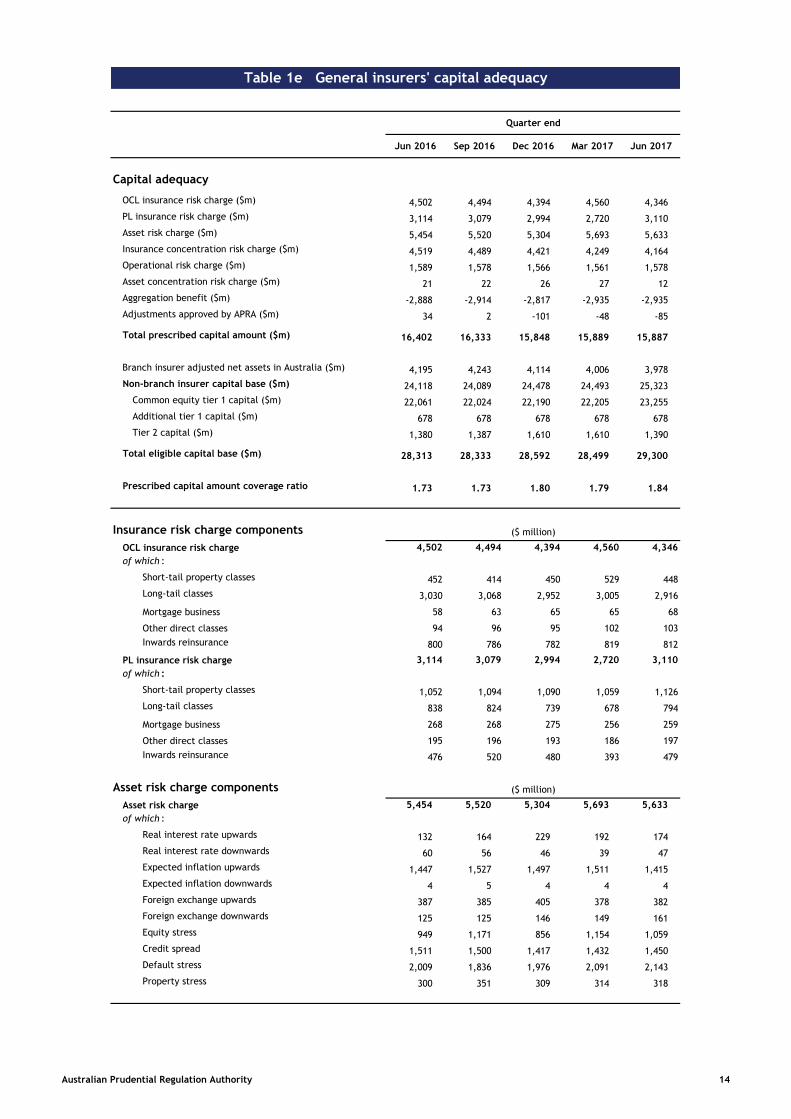
Table 1e General insurers' capital adequacy
Quarter end
Jun 2016 Sep 2016 Dec 2016 Mar 2017 Jun 2017
Capital adequacy
OCL insurance risk charge ($m) 4,502 4,494 4,394 4,560 4,346
PL insurance risk charge ($m) 3,114 3,079 2,994 2,720 3,110
Asset risk charge ($m) 5,454 5,520 5,304 5,693 5,633
Insurance concentration risk charge ($m) 4,519 4,489 4,421 4,249 4,164
Operational risk charge ($m) 1,589 1,578 1,566 1,561 1,578
Asset concentration risk charge ($m) 21 22 26 27 12
Aggregation benefit ($m) -2,888 -2,914 -2,817 -2,935 -2,935
Adjustments approved by APRA ($m) 34 2 -101 -48 -85
Total prescribed capital amount ($m) 16,402 16,333 15,848 15,889 15,887
Branch insurer adjusted net assets in Australia ($m) 4,195 4,243 4,114 4,006 3,978
Non-branch insurer capital base ($m) 24,118 24,089 24,478 24,493 25,323
Common equity tier 1 capital ($m) 22,061 22,024 22,190 22,205 23,255
Additional tier 1 capital ($m) 678 678 678 678 678
Tier 2 capital ($m) 1,380 1,387 1,610 1,610 1,390
Total eligible capital base ($m) 28,313 28,333 28,592 28,499 29,300
Prescribed capital amount coverage ratio 1.73 1.73 1.80 1.79 1.84
Insurance risk charge components ($ million)
OCL insurance risk charge
of which :
4,502 4,494 4,394 4,560 4,346
Short-tail property classes 452 414 450 529 448
Long-tail classes 3,030 3,068 2,952 3,005 2,916
Mortgage business 58 63 65 65 68
Other direct classes 94 96 95 102 103
Inwards reinsurance 800 786 782 819 812
PL insurance risk charge
of which :
3,114 3,079 2,994 2,720 3,110
Short-tail property classes 1,052 1,094 1,090 1,059 1,126
Long-tail classes 838 824 739 678 794
Mortgage business 268 268 275 256 259
Other direct classes 195 196 193 186 197
Inwards reinsurance 476 520 480 393 479
Asset risk charge components ($ million)
Asset risk charge
of which :
5,454 5,520 5,304 5,693 5,633
Real interest rate upwards 132 164 229 192 174
Real interest rate downwards 60 56 46 39 47
Expected inflation upwards 1,447 1,527 1,497 1,511 1,415
Expected inflation downwards 4 5 4 4 4
Foreign exchange upwards 387 385 405 378 382
Foreign exchange downwards 125 125 146 149 161
Equity stress 949 1,171 856 1,154 1,059
Credit spread 1,511 1,500 1,417 1,432 1,450
Default stress 2,009 1,836 1,976 2,091 2,143
Property stress 300 351 309 314 318
Australian Prudential Regulation Authority 14
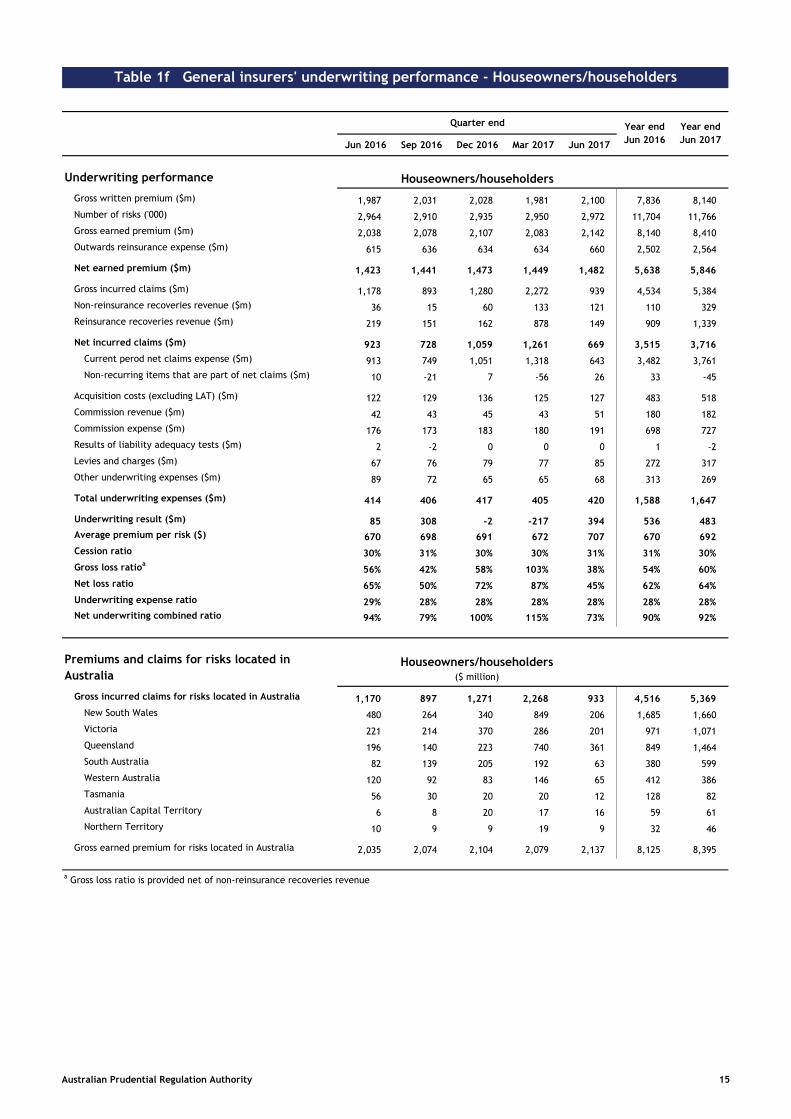
Table 1f General insurers' underwriting performance - Houseowners/householders
Quarter end
Jun 2016 Sep 2016 Dec 2016 Mar 2017 Jun 2017
Underwriting performance Houseowners/householders
Gross written premium ($m) 1,987 2,031 2,028 1,981 2,100 7,836 8,140
Number of risks ('000) 2,964 2,910 2,935 2,950 2,972 11,704 11,766
Gross earned premium ($m) 2,038 2,078 2,107 2,083 2,142 8,140 8,410
Outwards reinsurance expense ($m) 615 636 634 634 660 2,502 2,564
Net earned premium ($m) 1,423 1,441 1,473 1,449 1,482 5,638 5,846
Gross incurred claims ($m) 1,178 893 1,280 2,272 939 4,534 5,384
Non-reinsurance recoveries revenue ($m) 36 15 60 133 121 110 329
Reinsurance recoveries revenue ($m) 219 151 162 878 149 909 1,339
Net incurred claims ($m) 923 728 1,059 1,261 669 3,515 3,716
Current perod net claims expense ($m) 913 749 1,051 1,318 643 3,482 3,761
Non-recurring items that are part of net claims ($m) 10 -21 7 -56 26 33 -45
Acquisition costs (excluding LAT) ($m) 122 129 136 125 127 483 518
Commission revenue ($m) 42 43 45 43 51 180 182
Commission expense ($m) 176 173 183 180 191 698 727
Results of liability adequacy tests ($m) 2 -2 0 0 0 1 -2
Levies and charges ($m) 67 76 79 77 85 272 317
Other underwriting expenses ($m) 89 72 65 65 68 313 269
Total underwriting expenses ($m) 414 406 417 405 420 1,588 1,647
Underwriting result ($m) 85 308 -2 -217 394 536 483
Average premium per risk ($) 670 698 691 672 707 670 692
Cession ratio 30% 31% 30% 30% 31% 31% 30%
Gross loss ratioa
56% 42% 58% 103% 38% 54% 60%
Net loss ratio 65% 50% 72% 87% 45% 62% 64%
Underwriting expense ratio 29% 28% 28% 28% 28% 28% 28%
Net underwriting combined ratio 94% 79% 100% 115% 73% 90% 92%
Premiums and claims for risks located in
Australia
Gross incurred claims for risks located in Australia 1,170 897 1,271 2,268 933 4,516 5,369
New South Wales 480 264 340 849 206 1,685 1,660
Victoria 221 214 370 286 201 971 1,071
Queensland 196 140 223 740 361 849 1,464
South Australia 82 139 205 192 63 380 599
Western Australia 120 92 83 146 65 412 386
Tasmania 56 30 20 20 12 128 82
Australian Capital Territory 6 8 20 17 16 59 61
Northern Territory 10 9 9 19 9 32 46
Gross earned premium for risks located in Australia 2,035 2,074 2,104 2,079 2,137 8,125 8,395
a Gross loss ratio is provided net of non-reinsurance recoveries revenue
Houseowners/householders($ million)
Year end
Jun 2016
Year end
Jun 2017
Australian Prudential Regulation Authority 15
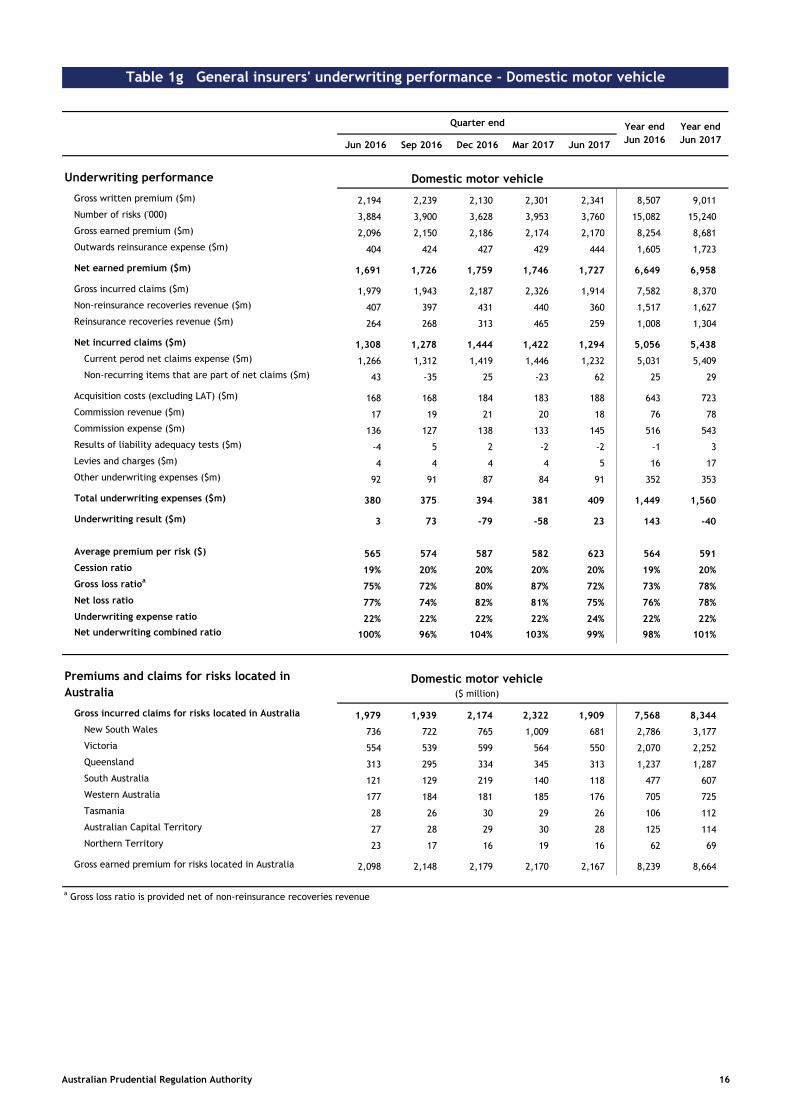
Table 1g General insurers' underwriting performance - Domestic motor vehicle
Quarter end
Jun 2016 Sep 2016 Dec 2016 Mar 2017 Jun 2017
Underwriting performance Domestic motor vehicle
Gross written premium ($m) 2,194 2,239 2,130 2,301 2,341 8,507 9,011
Number of risks ('000) 3,884 3,900 3,628 3,953 3,760 15,082 15,240
Gross earned premium ($m) 2,096 2,150 2,186 2,174 2,170 8,254 8,681
Outwards reinsurance expense ($m) 404 424 427 429 444 1,605 1,723
Net earned premium ($m) 1,691 1,726 1,759 1,746 1,727 6,649 6,958
Gross incurred claims ($m) 1,979 1,943 2,187 2,326 1,914 7,582 8,370
Non-reinsurance recoveries revenue ($m) 407 397 431 440 360 1,517 1,627
Reinsurance recoveries revenue ($m) 264 268 313 465 259 1,008 1,304
Net incurred claims ($m) 1,308 1,278 1,444 1,422 1,294 5,056 5,438
Current perod net claims expense ($m) 1,266 1,312 1,419 1,446 1,232 5,031 5,409
Non-recurring items that are part of net claims ($m) 43 -35 25 -23 62 25 29
Acquisition costs (excluding LAT) ($m) 168 168 184 183 188 643 723
Commission revenue ($m) 17 19 21 20 18 76 78
Commission expense ($m) 136 127 138 133 145 516 543
Results of liability adequacy tests ($m) -4 5 2 -2 -2 -1 3
Levies and charges ($m) 4 4 4 4 5 16 17
Other underwriting expenses ($m) 92 91 87 84 91 352 353
Total underwriting expenses ($m) 380 375 394 381 409 1,449 1,560
Underwriting result ($m) 3 73 -79 -58 23 143 -40
Average premium per risk ($) 565 574 587 582 623 564 591
Cession ratio 19% 20% 20% 20% 20% 19% 20%
Gross loss ratioa
75% 72% 80% 87% 72% 73% 78%
Net loss ratio 77% 74% 82% 81% 75% 76% 78%
Underwriting expense ratio 22% 22% 22% 22% 24% 22% 22%
Net underwriting combined ratio 100% 96% 104% 103% 99% 98% 101%
Premiums and claims for risks located in
Australia
Gross incurred claims for risks located in Australia 1,979 1,939 2,174 2,322 1,909 7,568 8,344
New South Wales 736 722 765 1,009 681 2,786 3,177
Victoria 554 539 599 564 550 2,070 2,252
Queensland 313 295 334 345 313 1,237 1,287
South Australia 121 129 219 140 118 477 607
Western Australia 177 184 181 185 176 705 725
Tasmania 28 26 30 29 26 106 112
Australian Capital Territory 27 28 29 30 28 125 114
Northern Territory 23 17 16 19 16 62 69
Gross earned premium for risks located in Australia 2,098 2,148 2,179 2,170 2,167 8,239 8,664
a Gross loss ratio is provided net of non-reinsurance recoveries revenue
Year end
Jun 2016
Year end
Jun 2017
Domestic motor vehicle($ million)
Australian Prudential Regulation Authority 16
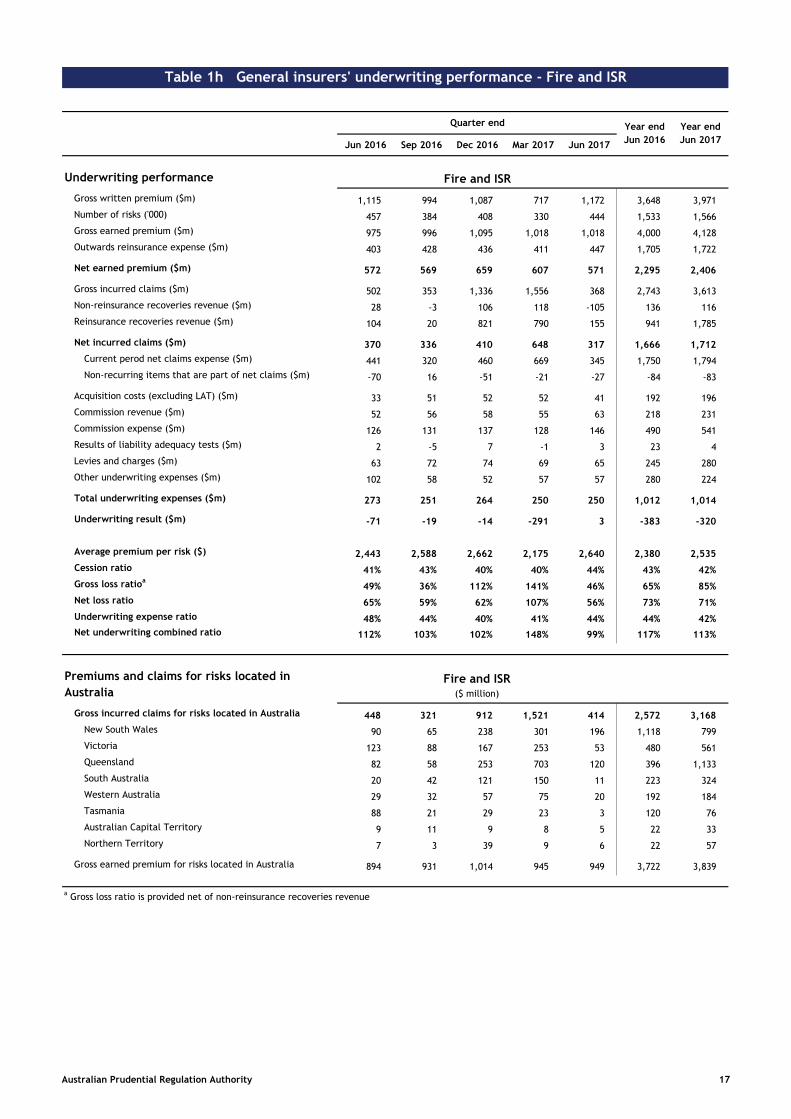
Table 1h General insurers' underwriting performance - Fire and ISR
Quarter end
Jun 2016 Sep 2016 Dec 2016 Mar 2017 Jun 2017
Underwriting performance Fire and ISR
Gross written premium ($m) 1,115 994 1,087 717 1,172 3,648 3,971
Number of risks ('000) 457 384 408 330 444 1,533 1,566
Gross earned premium ($m) 975 996 1,095 1,018 1,018 4,000 4,128
Outwards reinsurance expense ($m) 403 428 436 411 447 1,705 1,722
Net earned premium ($m) 572 569 659 607 571 2,295 2,406
Gross incurred claims ($m) 502 353 1,336 1,556 368 2,743 3,613
Non-reinsurance recoveries revenue ($m) 28 -3 106 118 -105 136 116
Reinsurance recoveries revenue ($m) 104 20 821 790 155 941 1,785
Net incurred claims ($m) 370 336 410 648 317 1,666 1,712
Current perod net claims expense ($m) 441 320 460 669 345 1,750 1,794
Non-recurring items that are part of net claims ($m) -70 16 -51 -21 -27 -84 -83
Acquisition costs (excluding LAT) ($m) 33 51 52 52 41 192 196
Commission revenue ($m) 52 56 58 55 63 218 231
Commission expense ($m) 126 131 137 128 146 490 541
Results of liability adequacy tests ($m) 2 -5 7 -1 3 23 4
Levies and charges ($m) 63 72 74 69 65 245 280
Other underwriting expenses ($m) 102 58 52 57 57 280 224
Total underwriting expenses ($m) 273 251 264 250 250 1,012 1,014
Underwriting result ($m) -71 -19 -14 -291 3 -383 -320
Average premium per risk ($) 2,443 2,588 2,662 2,175 2,640 2,380 2,535
Cession ratio 41% 43% 40% 40% 44% 43% 42%
Gross loss ratioa
49% 36% 112% 141% 46% 65% 85%
Net loss ratio 65% 59% 62% 107% 56% 73% 71%
Underwriting expense ratio 48% 44% 40% 41% 44% 44% 42%
Net underwriting combined ratio 112% 103% 102% 148% 99% 117% 113%
Premiums and claims for risks located in
Australia
Gross incurred claims for risks located in Australia 448 321 912 1,521 414 2,572 3,168
New South Wales 90 65 238 301 196 1,118 799
Victoria 123 88 167 253 53 480 561
Queensland 82 58 253 703 120 396 1,133
South Australia 20 42 121 150 11 223 324
Western Australia 29 32 57 75 20 192 184
Tasmania 88 21 29 23 3 120 76
Australian Capital Territory 9 11 9 8 5 22 33
Northern Territory 7 3 39 9 6 22 57
Gross earned premium for risks located in Australia 894 931 1,014 945 949 3,722 3,839
a Gross loss ratio is provided net of non-reinsurance recoveries revenue
Year end
Jun 2016
Year end
Jun 2017
Fire and ISR($ million)
Australian Prudential Regulation Authority 17

Table 1i General insurers' underwriting performance - Commercial motor vehicle
Quarter end
Jun 2016 Sep 2016 Dec 2016 Mar 2017 Jun 2017
Underwriting performance Commercial motor vehicle
Gross written premium ($m) 690 536 524 490 729 2,098 2,278
Number of risks ('000) 437 365 410 452 441 1,598 1,668
Gross earned premium ($m) 532 538 544 544 556 2,074 2,184
Outwards reinsurance expense ($m) 73 74 77 78 81 268 310
Net earned premium ($m) 459 465 468 466 475 1,807 1,874
Gross incurred claims ($m) 518 440 543 572 464 1,831 2,020
Non-reinsurance recoveries revenue ($m) 83 70 90 112 82 238 354
Reinsurance recoveries revenue ($m) 50 43 69 75 37 181 224
Net incurred claims ($m) 385 328 384 385 345 1,412 1,442
Current perod net claims expense ($m) 366 337 392 375 330 1,382 1,433
Non-recurring items that are part of net claims ($m) 19 -9 -8 10 15 30 8
Acquisition costs (excluding LAT) ($m) 10 26 21 27 0 65 74
Commission revenue ($m) 9 11 14 12 14 48 52
Commission expense ($m) 64 68 66 66 72 250 272
Results of liability adequacy tests ($m) 3 -9 7 -5 -5 24 -11
Levies and charges ($m) 1 1 1 1 1 5 5
Other underwriting expenses ($m) 72 44 40 43 66 212 192
Total underwriting expenses ($m) 141 119 121 121 120 508 481
Underwriting result ($m) -67 18 -37 -40 10 -113 -49
Average premium per risk ($) 1,578 1,470 1,276 1,084 1,653 1,313 1,366
Cession ratio 14% 14% 14% 14% 15% 13% 14%
Gross loss ratioa
82% 69% 83% 84% 69% 77% 76%
Net loss ratio 84% 70% 82% 83% 73% 78% 77%
Underwriting expense ratio 31% 26% 26% 26% 25% 28% 26%
Net underwriting combined ratio 115% 96% 108% 108% 98% 106% 103%
Premiums and claims for risks located in
Australia
Gross incurred claims for risks located in Australia 481 404 494 545 427 1,712 1,870
New South Wales 176 133 156 184 180 600 653
Victoria 141 104 142 121 145 439 512
Queensland 57 62 61 92 35 230 251
South Australia 39 40 77 81 16 175 213
Western Australia 50 45 41 49 35 191 170
Tasmania 9 8 8 9 6 30 30
Australian Capital Territory 5 6 4 5 3 23 18
Northern Territory 5 6 5 5 7 24 23
Gross earned premium for risks located in Australia 498 505 510 509 522 1,960 2,046
a Gross loss ratio is provided net of non-reinsurance recoveries revenue
Year end
Jun 2016
Year end
Jun 2017
Commercial motor vehicle($ million)
Australian Prudential Regulation Authority 18
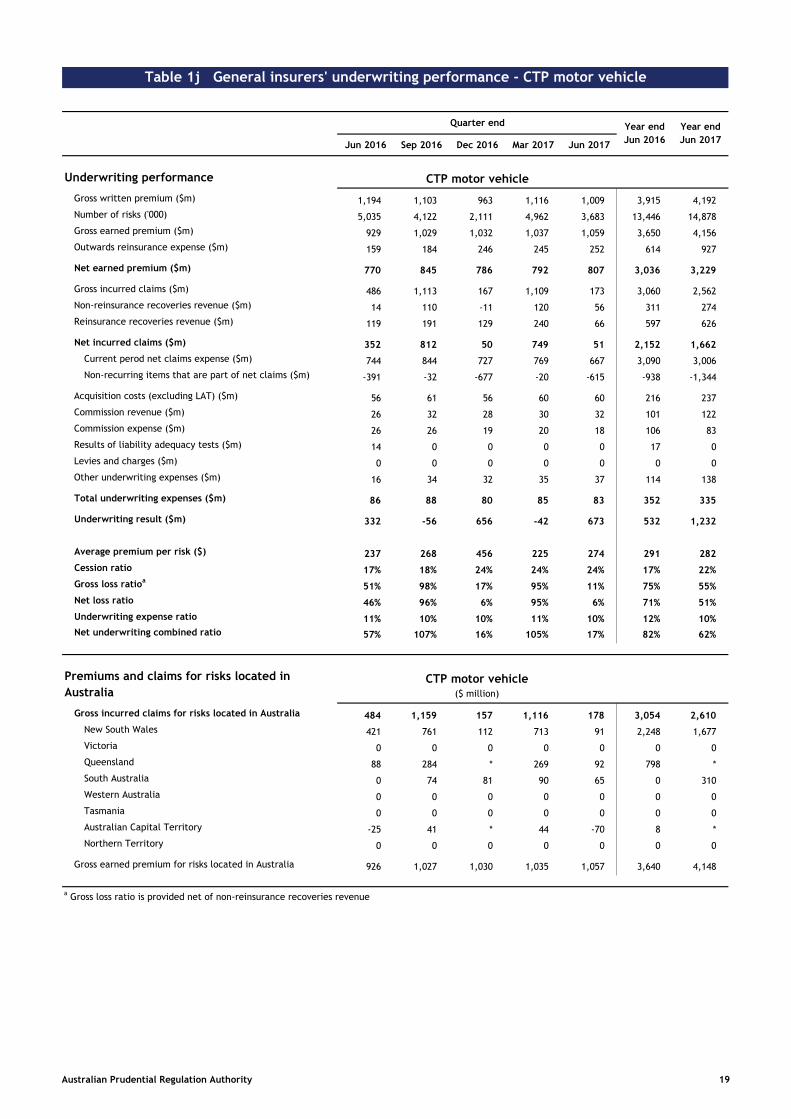
Table 1j General insurers' underwriting performance - CTP motor vehicle
Quarter end
Jun 2016 Sep 2016 Dec 2016 Mar 2017 Jun 2017
Underwriting performance CTP motor vehicle
Gross written premium ($m) 1,194 1,103 963 1,116 1,009 3,915 4,192
Number of risks ('000) 5,035 4,122 2,111 4,962 3,683 13,446 14,878
Gross earned premium ($m) 929 1,029 1,032 1,037 1,059 3,650 4,156
Outwards reinsurance expense ($m) 159 184 246 245 252 614 927
Net earned premium ($m) 770 845 786 792 807 3,036 3,229
Gross incurred claims ($m) 486 1,113 167 1,109 173 3,060 2,562
Non-reinsurance recoveries revenue ($m) 14 110 -11 120 56 311 274
Reinsurance recoveries revenue ($m) 119 191 129 240 66 597 626
Net incurred claims ($m) 352 812 50 749 51 2,152 1,662
Current perod net claims expense ($m) 744 844 727 769 667 3,090 3,006
Non-recurring items that are part of net claims ($m) -391 -32 -677 -20 -615 -938 -1,344
Acquisition costs (excluding LAT) ($m) 56 61 56 60 60 216 237
Commission revenue ($m) 26 32 28 30 32 101 122
Commission expense ($m) 26 26 19 20 18 106 83
Results of liability adequacy tests ($m) 14 0 0 0 0 17 0
Levies and charges ($m) 0 0 0 0 0 0 0
Other underwriting expenses ($m) 16 34 32 35 37 114 138
Total underwriting expenses ($m) 86 88 80 85 83 352 335
Underwriting result ($m) 332 -56 656 -42 673 532 1,232
Average premium per risk ($) 237 268 456 225 274 291 282
Cession ratio 17% 18% 24% 24% 24% 17% 22%
Gross loss ratioa
51% 98% 17% 95% 11% 75% 55%
Net loss ratio 46% 96% 6% 95% 6% 71% 51%
Underwriting expense ratio 11% 10% 10% 11% 10% 12% 10%
Net underwriting combined ratio 57% 107% 16% 105% 17% 82% 62%
Premiums and claims for risks located in
Australia
Gross incurred claims for risks located in Australia 484 1,159 157 1,116 178 3,054 2,610
New South Wales 421 761 112 713 91 2,248 1,677
Victoria 0 0 0 0 0 0 0
Queensland 88 284 * 269 92 798 *
South Australia 0 74 81 90 65 0 310
Western Australia 0 0 0 0 0 0 0
Tasmania 0 0 0 0 0 0 0
Australian Capital Territory -25 41 * 44 -70 8 *
Northern Territory 0 0 0 0 0 0 0
Gross earned premium for risks located in Australia 926 1,027 1,030 1,035 1,057 3,640 4,148
a Gross loss ratio is provided net of non-reinsurance recoveries revenue
Year end
Jun 2016
Year end
Jun 2017
CTP motor vehicle($ million)
Australian Prudential Regulation Authority 19
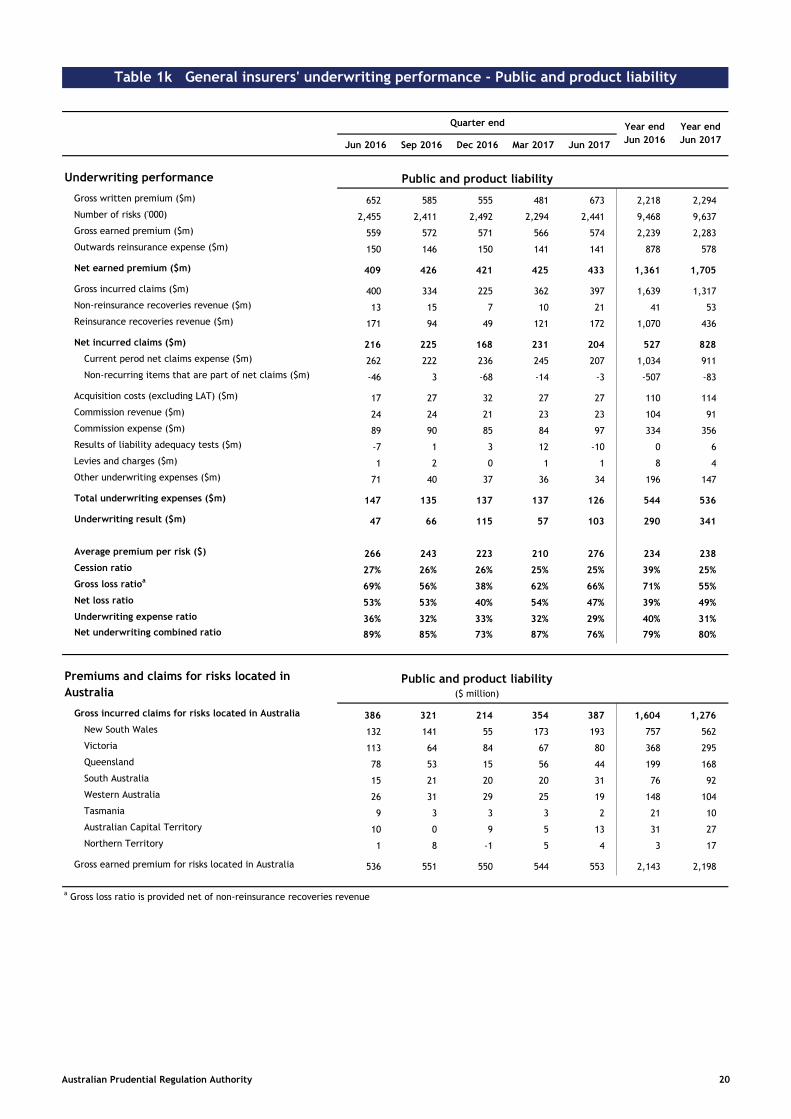
Table 1k General insurers' underwriting performance - Public and product liability
Quarter end
Jun 2016 Sep 2016 Dec 2016 Mar 2017 Jun 2017
Underwriting performance Public and product liability
Gross written premium ($m) 652 585 555 481 673 2,218 2,294
Number of risks ('000) 2,455 2,411 2,492 2,294 2,441 9,468 9,637
Gross earned premium ($m) 559 572 571 566 574 2,239 2,283
Outwards reinsurance expense ($m) 150 146 150 141 141 878 578
Net earned premium ($m) 409 426 421 425 433 1,361 1,705
Gross incurred claims ($m) 400 334 225 362 397 1,639 1,317
Non-reinsurance recoveries revenue ($m) 13 15 7 10 21 41 53
Reinsurance recoveries revenue ($m) 171 94 49 121 172 1,070 436
Net incurred claims ($m) 216 225 168 231 204 527 828
Current perod net claims expense ($m) 262 222 236 245 207 1,034 911
Non-recurring items that are part of net claims ($m) -46 3 -68 -14 -3 -507 -83
Acquisition costs (excluding LAT) ($m) 17 27 32 27 27 110 114
Commission revenue ($m) 24 24 21 23 23 104 91
Commission expense ($m) 89 90 85 84 97 334 356
Results of liability adequacy tests ($m) -7 1 3 12 -10 0 6
Levies and charges ($m) 1 2 0 1 1 8 4
Other underwriting expenses ($m) 71 40 37 36 34 196 147
Total underwriting expenses ($m) 147 135 137 137 126 544 536
Underwriting result ($m) 47 66 115 57 103 290 341
Average premium per risk ($) 266 243 223 210 276 234 238
Cession ratio 27% 26% 26% 25% 25% 39% 25%
Gross loss ratioa
69% 56% 38% 62% 66% 71% 55%
Net loss ratio 53% 53% 40% 54% 47% 39% 49%
Underwriting expense ratio 36% 32% 33% 32% 29% 40% 31%
Net underwriting combined ratio 89% 85% 73% 87% 76% 79% 80%
Premiums and claims for risks located in
Australia
Gross incurred claims for risks located in Australia 386 321 214 354 387 1,604 1,276
New South Wales 132 141 55 173 193 757 562
Victoria 113 64 84 67 80 368 295
Queensland 78 53 15 56 44 199 168
South Australia 15 21 20 20 31 76 92
Western Australia 26 31 29 25 19 148 104
Tasmania 9 3 3 3 2 21 10
Australian Capital Territory 10 0 9 5 13 31 27
Northern Territory 1 8 -1 5 4 3 17
Gross earned premium for risks located in Australia 536 551 550 544 553 2,143 2,198
a Gross loss ratio is provided net of non-reinsurance recoveries revenue
Year end
Jun 2016
Year end
Jun 2017
Public and product liability($ million)
Australian Prudential Regulation Authority 20
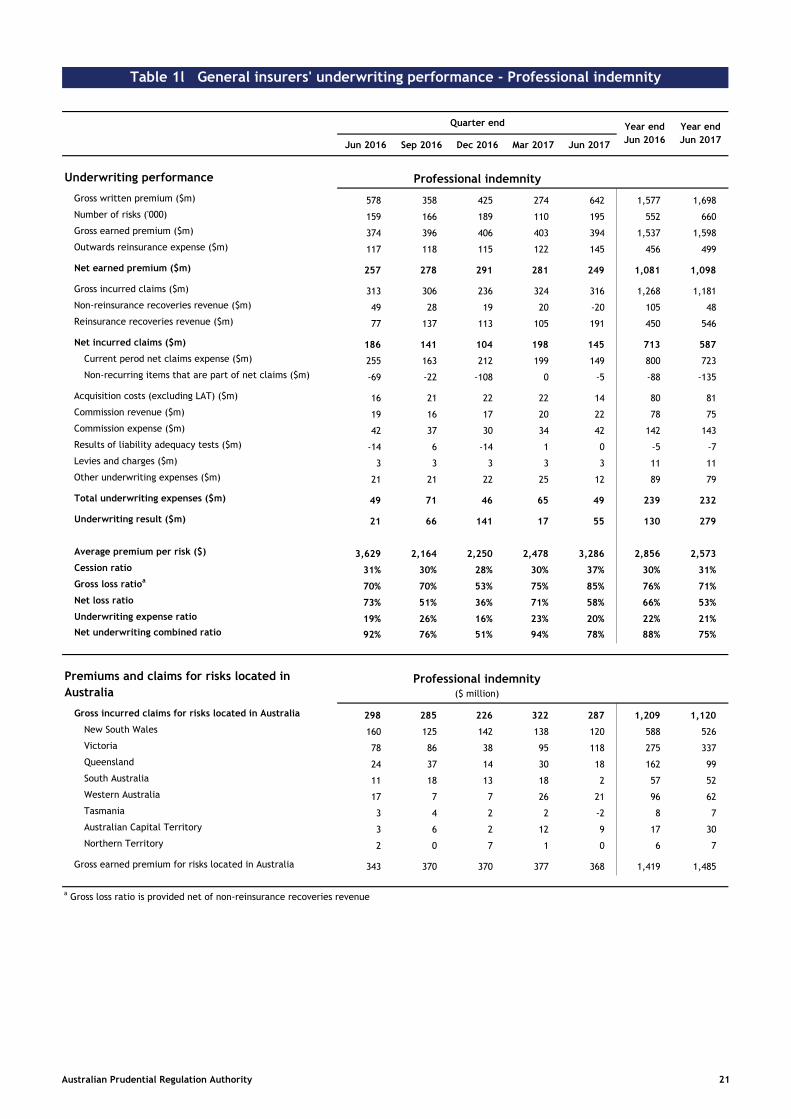
Table 1l General insurers' underwriting performance - Professional indemnity
Quarter end
Jun 2016 Sep 2016 Dec 2016 Mar 2017 Jun 2017
Underwriting performance Professional indemnity
Gross written premium ($m) 578 358 425 274 642 1,577 1,698
Number of risks ('000) 159 166 189 110 195 552 660
Gross earned premium ($m) 374 396 406 403 394 1,537 1,598
Outwards reinsurance expense ($m) 117 118 115 122 145 456 499
Net earned premium ($m) 257 278 291 281 249 1,081 1,098
Gross incurred claims ($m) 313 306 236 324 316 1,268 1,181
Non-reinsurance recoveries revenue ($m) 49 28 19 20 -20 105 48
Reinsurance recoveries revenue ($m) 77 137 113 105 191 450 546
Net incurred claims ($m) 186 141 104 198 145 713 587
Current perod net claims expense ($m) 255 163 212 199 149 800 723
Non-recurring items that are part of net claims ($m) -69 -22 -108 0 -5 -88 -135
Acquisition costs (excluding LAT) ($m) 16 21 22 22 14 80 81
Commission revenue ($m) 19 16 17 20 22 78 75
Commission expense ($m) 42 37 30 34 42 142 143
Results of liability adequacy tests ($m) -14 6 -14 1 0 -5 -7
Levies and charges ($m) 3 3 3 3 3 11 11
Other underwriting expenses ($m) 21 21 22 25 12 89 79
Total underwriting expenses ($m) 49 71 46 65 49 239 232
Underwriting result ($m) 21 66 141 17 55 130 279
Average premium per risk ($) 3,629 2,164 2,250 2,478 3,286 2,856 2,573
Cession ratio 31% 30% 28% 30% 37% 30% 31%
Gross loss ratioa
70% 70% 53% 75% 85% 76% 71%
Net loss ratio 73% 51% 36% 71% 58% 66% 53%
Underwriting expense ratio 19% 26% 16% 23% 20% 22% 21%
Net underwriting combined ratio 92% 76% 51% 94% 78% 88% 75%
Premiums and claims for risks located in
Australia
Gross incurred claims for risks located in Australia 298 285 226 322 287 1,209 1,120
New South Wales 160 125 142 138 120 588 526
Victoria 78 86 38 95 118 275 337
Queensland 24 37 14 30 18 162 99
South Australia 11 18 13 18 2 57 52
Western Australia 17 7 7 26 21 96 62
Tasmania 3 4 2 2 -2 8 7
Australian Capital Territory 3 6 2 12 9 17 30
Northern Territory 2 0 7 1 0 6 7
Gross earned premium for risks located in Australia 343 370 370 377 368 1,419 1,485
a Gross loss ratio is provided net of non-reinsurance recoveries revenue
Year end
Jun 2016
Year end
Jun 2017
Professional indemnity($ million)
Australian Prudential Regulation Authority 21
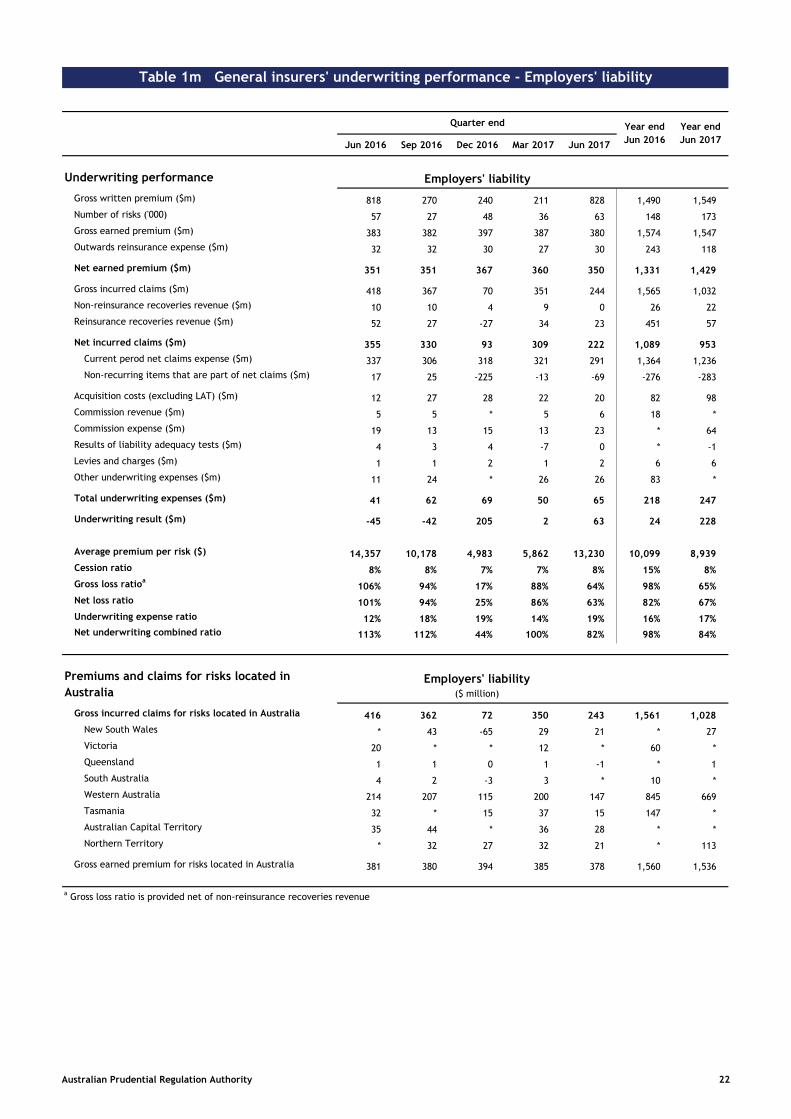
Table 1m General insurers' underwriting performance - Employers' liability
Quarter end
Jun 2016 Sep 2016 Dec 2016 Mar 2017 Jun 2017
Underwriting performance Employers' liability
Gross written premium ($m) 818 270 240 211 828 1,490 1,549
Number of risks ('000) 57 27 48 36 63 148 173
Gross earned premium ($m) 383 382 397 387 380 1,574 1,547
Outwards reinsurance expense ($m) 32 32 30 27 30 243 118
Net earned premium ($m) 351 351 367 360 350 1,331 1,429
Gross incurred claims ($m) 418 367 70 351 244 1,565 1,032
Non-reinsurance recoveries revenue ($m) 10 10 4 9 0 26 22
Reinsurance recoveries revenue ($m) 52 27 -27 34 23 451 57
Net incurred claims ($m) 355 330 93 309 222 1,089 953
Current perod net claims expense ($m) 337 306 318 321 291 1,364 1,236
Non-recurring items that are part of net claims ($m) 17 25 -225 -13 -69 -276 -283
Acquisition costs (excluding LAT) ($m) 12 27 28 22 20 82 98
Commission revenue ($m) 5 5 * 5 6 18 *
Commission expense ($m) 19 13 15 13 23 * 64
Results of liability adequacy tests ($m) 4 3 4 -7 0 * -1
Levies and charges ($m) 1 1 2 1 2 6 6
Other underwriting expenses ($m) 11 24 * 26 26 83 *
Total underwriting expenses ($m) 41 62 69 50 65 218 247
Underwriting result ($m) -45 -42 205 2 63 24 228
Average premium per risk ($) 14,357 10,178 4,983 5,862 13,230 10,099 8,939
Cession ratio 8% 8% 7% 7% 8% 15% 8%
Gross loss ratioa
106% 94% 17% 88% 64% 98% 65%
Net loss ratio 101% 94% 25% 86% 63% 82% 67%
Underwriting expense ratio 12% 18% 19% 14% 19% 16% 17%
Net underwriting combined ratio 113% 112% 44% 100% 82% 98% 84%
Premiums and claims for risks located in
Australia
Gross incurred claims for risks located in Australia 416 362 72 350 243 1,561 1,028
New South Wales * 43 -65 29 21 * 27
Victoria 20 * * 12 * 60 *
Queensland 1 1 0 1 -1 * 1
South Australia 4 2 -3 3 * 10 *
Western Australia 214 207 115 200 147 845 669
Tasmania 32 * 15 37 15 147 *
Australian Capital Territory 35 44 * 36 28 * *
Northern Territory * 32 27 32 21 * 113
Gross earned premium for risks located in Australia 381 380 394 385 378 1,560 1,536
a Gross loss ratio is provided net of non-reinsurance recoveries revenue
Year end
Jun 2016
Year end
Jun 2017
Employers' liability($ million)
Australian Prudential Regulation Authority 22
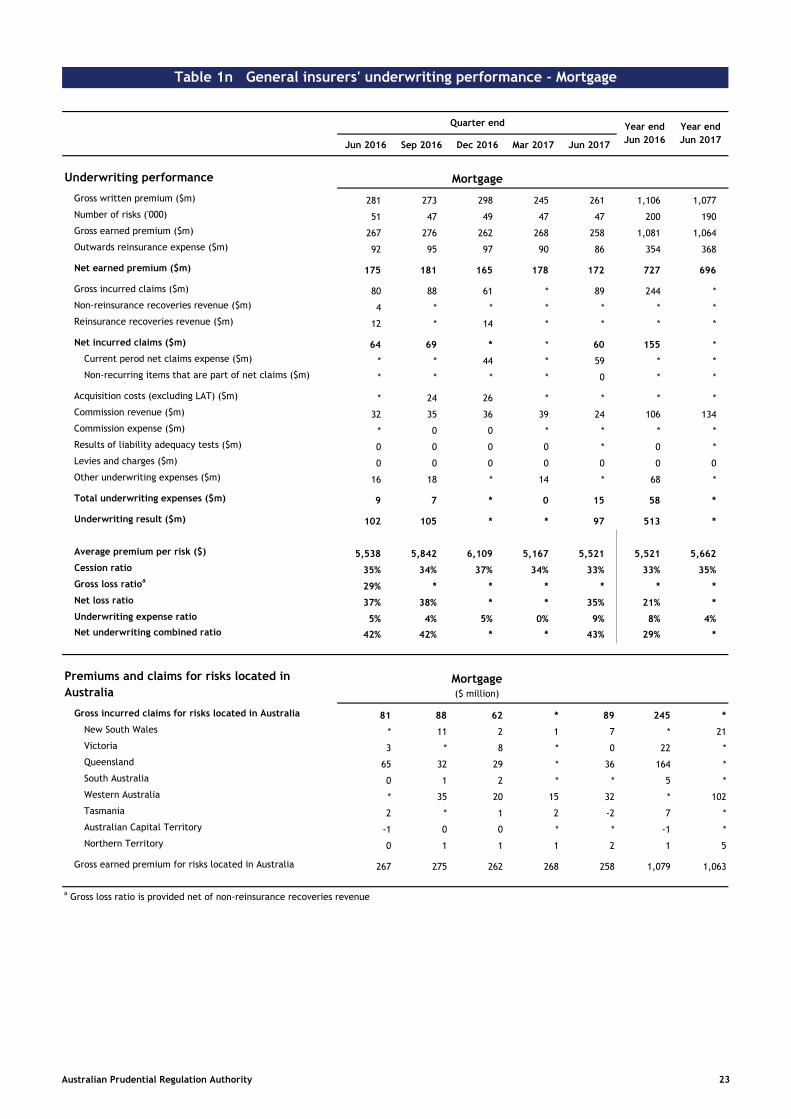
Table 1n General insurers' underwriting performance - Mortgage
Quarter end
Jun 2016 Sep 2016 Dec 2016 Mar 2017 Jun 2017
Underwriting performance Mortgage
Gross written premium ($m) 281 273 298 245 261 1,106 1,077
Number of risks ('000) 51 47 49 47 47 200 190
Gross earned premium ($m) 267 276 262 268 258 1,081 1,064
Outwards reinsurance expense ($m) 92 95 97 90 86 354 368
Net earned premium ($m) 175 181 165 178 172 727 696
Gross incurred claims ($m) 80 88 61 * 89 244 *
Non-reinsurance recoveries revenue ($m) 4 * * * * * *
Reinsurance recoveries revenue ($m) 12 * 14 * * * *
Net incurred claims ($m) 64 69 * * 60 155 *
Current perod net claims expense ($m) * * 44 * 59 * *
Non-recurring items that are part of net claims ($m) * * * * 0 * *
Acquisition costs (excluding LAT) ($m) * 24 26 * * * *
Commission revenue ($m) 32 35 36 39 24 106 134
Commission expense ($m) * 0 0 * * * *
Results of liability adequacy tests ($m) 0 0 0 0 * 0 *
Levies and charges ($m) 0 0 0 0 0 0 0
Other underwriting expenses ($m) 16 18 * 14 * 68 *
Total underwriting expenses ($m) 9 7 * 0 15 58 *
Underwriting result ($m) 102 105 * * 97 513 *
Average premium per risk ($) 5,538 5,842 6,109 5,167 5,521 5,521 5,662
Cession ratio 35% 34% 37% 34% 33% 33% 35%
Gross loss ratioa
29% * * * * * *
Net loss ratio 37% 38% * * 35% 21% *
Underwriting expense ratio 5% 4% 5% 0% 9% 8% 4%
Net underwriting combined ratio 42% 42% * * 43% 29% *
Premiums and claims for risks located in
Australia
Gross incurred claims for risks located in Australia 81 88 62 * 89 245 *
New South Wales * 11 2 1 7 * 21
Victoria 3 * 8 * 0 22 *
Queensland 65 32 29 * 36 164 *
South Australia 0 1 2 * * 5 *
Western Australia * 35 20 15 32 * 102
Tasmania 2 * 1 2 -2 7 *
Australian Capital Territory -1 0 0 * * -1 *
Northern Territory 0 1 1 1 2 1 5
Gross earned premium for risks located in Australia 267 275 262 268 258 1,079 1,063
a Gross loss ratio is provided net of non-reinsurance recoveries revenue
Year end
Jun 2016
Year end
Jun 2017
Mortgage($ million)
Australian Prudential Regulation Authority 23
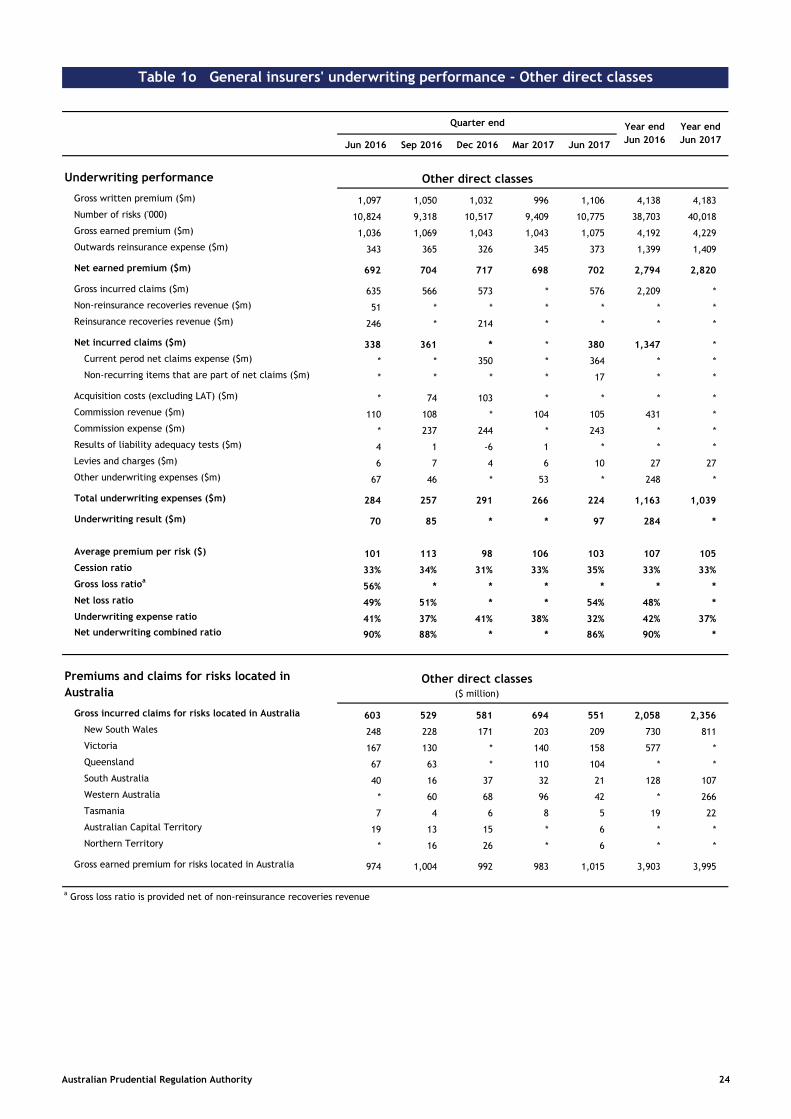
Table 1o General insurers' underwriting performance - Other direct classes
Quarter end
Jun 2016 Sep 2016 Dec 2016 Mar 2017 Jun 2017
Underwriting performance Other direct classes
Gross written premium ($m) 1,097 1,050 1,032 996 1,106 4,138 4,183
Number of risks ('000) 10,824 9,318 10,517 9,409 10,775 38,703 40,018
Gross earned premium ($m) 1,036 1,069 1,043 1,043 1,075 4,192 4,229
Outwards reinsurance expense ($m) 343 365 326 345 373 1,399 1,409
Net earned premium ($m) 692 704 717 698 702 2,794 2,820
Gross incurred claims ($m) 635 566 573 * 576 2,209 *
Non-reinsurance recoveries revenue ($m) 51 * * * * * *
Reinsurance recoveries revenue ($m) 246 * 214 * * * *
Net incurred claims ($m) 338 361 * * 380 1,347 *
Current perod net claims expense ($m) * * 350 * 364 * *
Non-recurring items that are part of net claims ($m) * * * * 17 * *
Acquisition costs (excluding LAT) ($m) * 74 103 * * * *
Commission revenue ($m) 110 108 * 104 105 431 *
Commission expense ($m) * 237 244 * 243 * *
Results of liability adequacy tests ($m) 4 1 -6 1 * * *
Levies and charges ($m) 6 7 4 6 10 27 27
Other underwriting expenses ($m) 67 46 * 53 * 248 *
Total underwriting expenses ($m) 284 257 291 266 224 1,163 1,039
Underwriting result ($m) 70 85 * * 97 284 *
Average premium per risk ($) 101 113 98 106 103 107 105
Cession ratio 33% 34% 31% 33% 35% 33% 33%
Gross loss ratioa
56% * * * * * *
Net loss ratio 49% 51% * * 54% 48% *
Underwriting expense ratio 41% 37% 41% 38% 32% 42% 37%
Net underwriting combined ratio 90% 88% * * 86% 90% *
Premiums and claims for risks located in
Australia
Gross incurred claims for risks located in Australia 603 529 581 694 551 2,058 2,356
New South Wales 248 228 171 203 209 730 811
Victoria 167 130 * 140 158 577 *
Queensland 67 63 * 110 104 * *
South Australia 40 16 37 32 21 128 107
Western Australia * 60 68 96 42 * 266
Tasmania 7 4 6 8 5 19 22
Australian Capital Territory 19 13 15 * 6 * *
Northern Territory * 16 26 * 6 * *
Gross earned premium for risks located in Australia 974 1,004 992 983 1,015 3,903 3,995
a Gross loss ratio is provided net of non-reinsurance recoveries revenue
Year end
Jun 2016
Year end
Jun 2017
Other direct classes($ million)
Australian Prudential Regulation Authority 24
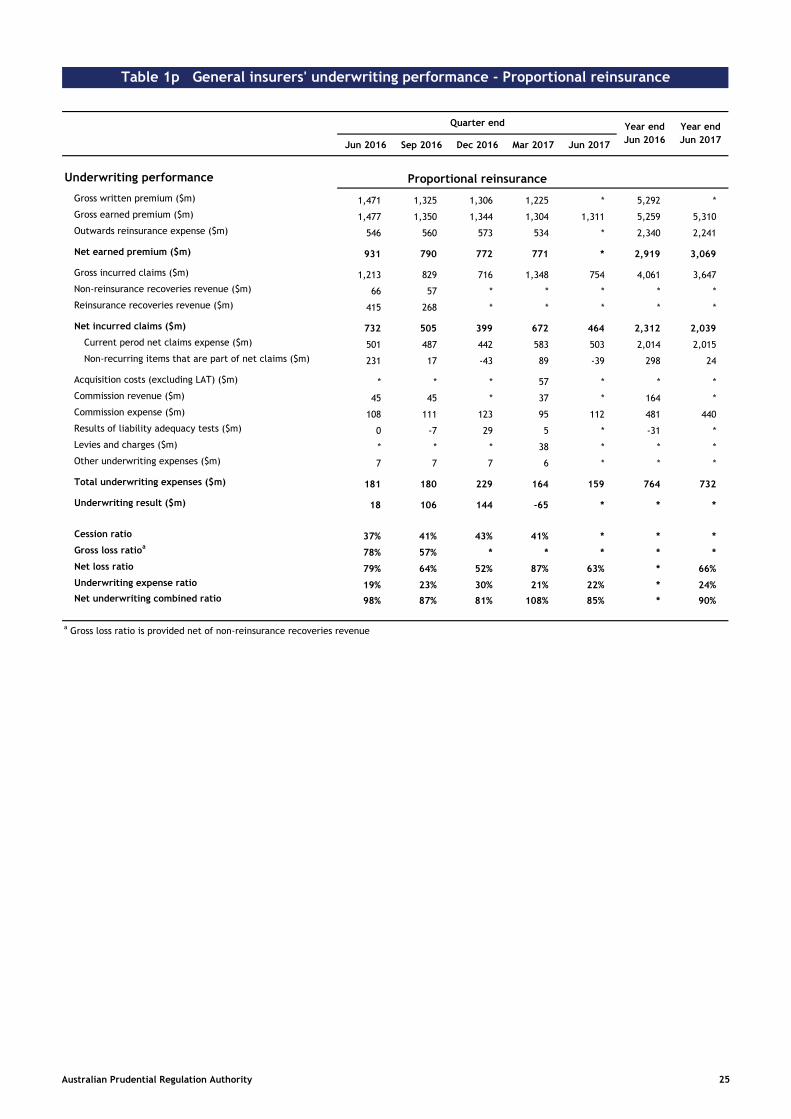
Table 1p General insurers' underwriting performance - Proportional reinsurance
Quarter end
Jun 2016 Sep 2016 Dec 2016 Mar 2017 Jun 2017
Underwriting performance Proportional reinsurance
Gross written premium ($m) 1,471 1,325 1,306 1,225 * 5,292 *
Gross earned premium ($m) 1,477 1,350 1,344 1,304 1,311 5,259 5,310
Outwards reinsurance expense ($m) 546 560 573 534 * 2,340 2,241
Net earned premium ($m) 931 790 772 771 * 2,919 3,069
Gross incurred claims ($m) 1,213 829 716 1,348 754 4,061 3,647
Non-reinsurance recoveries revenue ($m) 66 57 * * * * *
Reinsurance recoveries revenue ($m) 415 268 * * * * *
Net incurred claims ($m) 732 505 399 672 464 2,312 2,039
Current perod net claims expense ($m) 501 487 442 583 503 2,014 2,015
Non-recurring items that are part of net claims ($m) 231 17 -43 89 -39 298 24
Acquisition costs (excluding LAT) ($m) * * * 57 * * *
Commission revenue ($m) 45 45 * 37 * 164 *
Commission expense ($m) 108 111 123 95 112 481 440
Results of liability adequacy tests ($m) 0 -7 29 5 * -31 *
Levies and charges ($m) * * * 38 * * *
Other underwriting expenses ($m) 7 7 7 6 * * *
Total underwriting expenses ($m) 181 180 229 164 159 764 732
Underwriting result ($m) 18 106 144 -65 * * *
Cession ratio 37% 41% 43% 41% * * *
Gross loss ratioa
78% 57% * * * * *
Net loss ratio 79% 64% 52% 87% 63% * 66%
Underwriting expense ratio 19% 23% 30% 21% 22% * 24%
Net underwriting combined ratio 98% 87% 81% 108% 85% * 90%
a Gross loss ratio is provided net of non-reinsurance recoveries revenue
Year end
Jun 2016
Year end
Jun 2017
Australian Prudential Regulation Authority 25
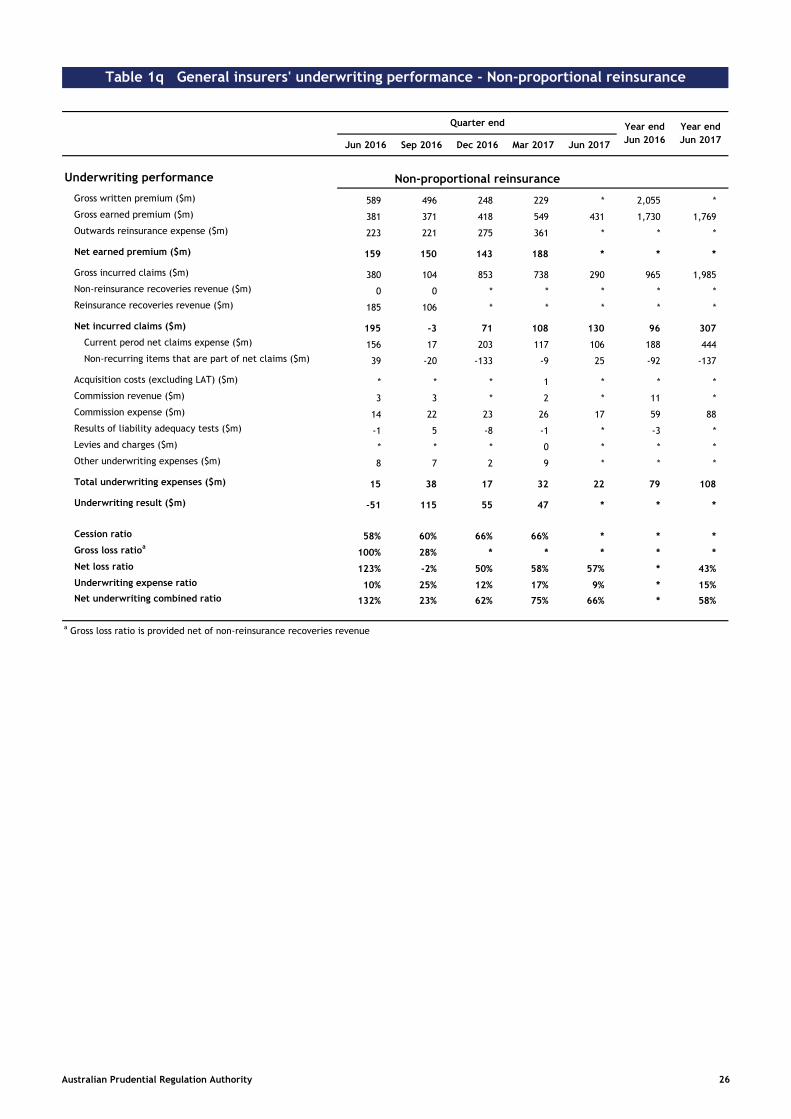
Table 1q General insurers' underwriting performance - Non-proportional reinsurance
Quarter end
Jun 2016 Sep 2016 Dec 2016 Mar 2017 Jun 2017
Underwriting performance Non-proportional reinsurance
Gross written premium ($m) 589 496 248 229 * 2,055 *
Gross earned premium ($m) 381 371 418 549 431 1,730 1,769
Outwards reinsurance expense ($m) 223 221 275 361 * * *
Net earned premium ($m) 159 150 143 188 * * *
Gross incurred claims ($m) 380 104 853 738 290 965 1,985
Non-reinsurance recoveries revenue ($m) 0 0 * * * * *
Reinsurance recoveries revenue ($m) 185 106 * * * * *
Net incurred claims ($m) 195 -3 71 108 130 96 307
Current perod net claims expense ($m) 156 17 203 117 106 188 444
Non-recurring items that are part of net claims ($m) 39 -20 -133 -9 25 -92 -137
Acquisition costs (excluding LAT) ($m) * * * 1 * * *
Commission revenue ($m) 3 3 * 2 * 11 *
Commission expense ($m) 14 22 23 26 17 59 88
Results of liability adequacy tests ($m) -1 5 -8 -1 * -3 *
Levies and charges ($m) * * * 0 * * *
Other underwriting expenses ($m) 8 7 2 9 * * *
Total underwriting expenses ($m) 15 38 17 32 22 79 108
Underwriting result ($m) -51 115 55 47 * * *
Cession ratio 58% 60% 66% 66% * * *
Gross loss ratioa
100% 28% * * * * *
Net loss ratio 123% -2% 50% 58% 57% * 43%
Underwriting expense ratio 10% 25% 12% 17% 9% * 15%
Net underwriting combined ratio 132% 23% 62% 75% 66% * 58%
a Gross loss ratio is provided net of non-reinsurance recoveries revenue
Year end
Jun 2016
Year end
Jun 2017
Australian Prudential Regulation Authority 26
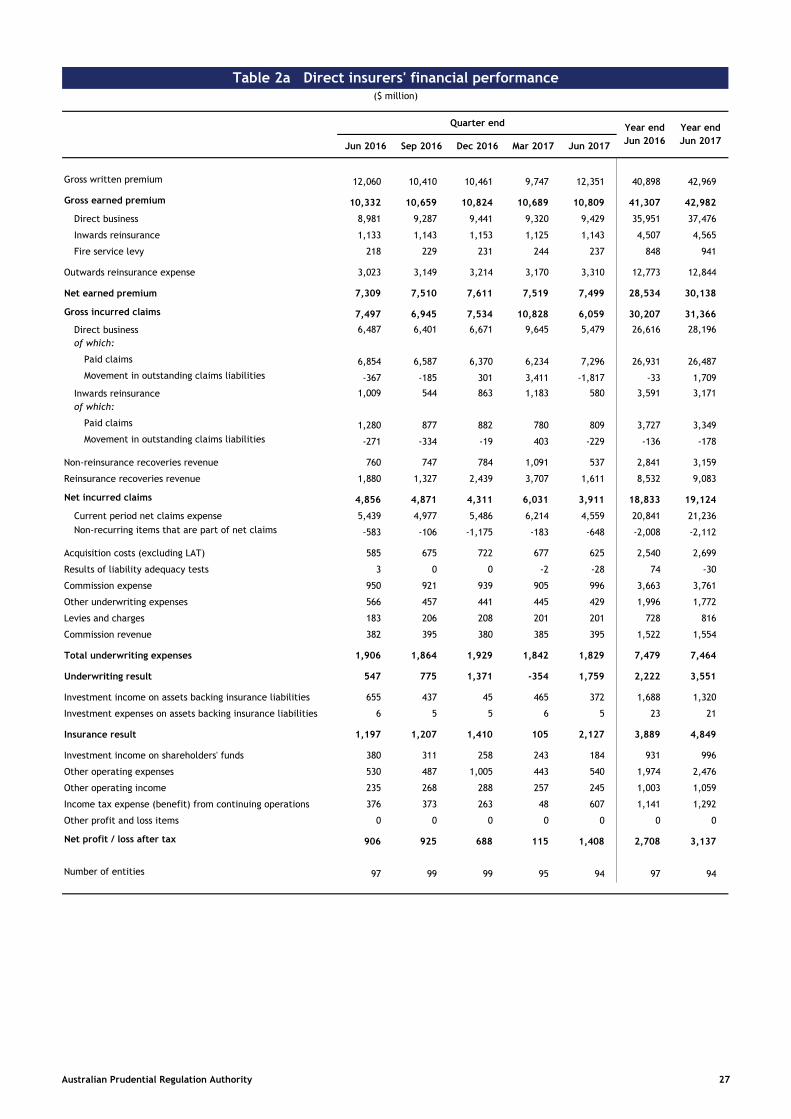
Table 2a Direct insurers' financial performance($ million)
Quarter end
Jun 2016 Sep 2016 Dec 2016 Mar 2017 Jun 2017
Gross written premium 12,060 10,410 10,461 9,747 12,351 40,898 42,969
Gross earned premium 10,332 10,659 10,824 10,689 10,809 41,307 42,982
Direct business 8,981 9,287 9,441 9,320 9,429 35,951 37,476
Inwards reinsurance 1,133 1,143 1,153 1,125 1,143 4,507 4,565
Fire service levy 218 229 231 244 237 848 941
Outwards reinsurance expense 3,023 3,149 3,214 3,170 3,310 12,773 12,844
Net earned premium 7,309 7,510 7,611 7,519 7,499 28,534 30,138
Gross incurred claims 7,497 6,945 7,534 10,828 6,059 30,207 31,366
Direct business
of which:
6,487 6,401 6,671 9,645 5,479 26,616 28,196
Paid claims 6,854 6,587 6,370 6,234 7,296 26,931 26,487
Movement in outstanding claims liabilities -367 -185 301 3,411 -1,817 -33 1,709
Inwards reinsurance
of which:
1,009 544 863 1,183 580 3,591 3,171
Paid claims 1,280 877 882 780 809 3,727 3,349
Movement in outstanding claims liabilities -271 -334 -19 403 -229 -136 -178
Non-reinsurance recoveries revenue 760 747 784 1,091 537 2,841 3,159
Reinsurance recoveries revenue 1,880 1,327 2,439 3,707 1,611 8,532 9,083
Net incurred claims 4,856 4,871 4,311 6,031 3,911 18,833 19,124
Current period net claims expense 5,439 4,977 5,486 6,214 4,559 20,841 21,236
Non-recurring items that are part of net claims -583 -106 -1,175 -183 -648 -2,008 -2,112
Acquisition costs (excluding LAT) 585 675 722 677 625 2,540 2,699
Results of liability adequacy tests 3 0 0 -2 -28 74 -30
Commission expense 950 921 939 905 996 3,663 3,761
Other underwriting expenses 566 457 441 445 429 1,996 1,772
Levies and charges 183 206 208 201 201 728 816
Commission revenue 382 395 380 385 395 1,522 1,554
Total underwriting expenses 1,906 1,864 1,929 1,842 1,829 7,479 7,464
Underwriting result 547 775 1,371 -354 1,759 2,222 3,551
Investment income on assets backing insurance liabilities 655 437 45 465 372 1,688 1,320
Investment expenses on assets backing insurance liabilities 6 5 5 6 5 23 21
Insurance result 1,197 1,207 1,410 105 2,127 3,889 4,849
Investment income on shareholders' funds 380 311 258 243 184 931 996
Other operating expenses 530 487 1,005 443 540 1,974 2,476
Other operating income 235 268 288 257 245 1,003 1,059
Income tax expense (benefit) from continuing operations 376 373 263 48 607 1,141 1,292
Other profit and loss items 0 0 0 0 0 0 0
Net profit / loss after tax 906 925 688 115 1,408 2,708 3,137
Number of entities 97 99 99 95 94 97 94
Year end
Jun 2016
Year end
Jun 2017
Australian Prudential Regulation Authority 27

Table 2b Direct insurers' financial position($ million)
Quarter end
Jun 2016 Sep 2016 Dec 2016 Mar 2017 Jun 2017
Cash and liquid assets 2,160 2,259 2,122 1,949 2,103
Investments 60,049 60,123 60,397 60,589 59,806
Non-reinsurance recoverables 4,616 4,624 4,671 5,061 4,643
Reinsurance recoverables 12,760 12,083 12,955 15,013 14,983
From APRA-authorised reinsurers 5,807 5,453 5,472 6,428 6,329
From non-APRA authorised reinsurers
of which :
6,923 6,587 7,454 8,561 8,641
Related to events that occurred within the insurer's
current and previous financial years
3,856 3,777 4,051 5,321 5,657
Related to events that occurred prior to the insurer's
previous financial year
3,058 2,803 3,394 3,146 2,909
Overdue for more than 6 months 9 7 10 94 75
From contracts ineligible under GPS 230 31 44 28 24 14
Premium receivables 12,141 11,283 11,169 10,334 12,500
Deferred reinsurance expense 7,817 7,441 7,519 7,556 8,139
Deferred acquisition costs 3,726 3,775 3,725 3,636 3,802
Intangible assets 1,168 1,365 1,353 1,346 1,347
Other assets 6,800 6,429 6,317 6,226 5,932
Total assets 111,237 109,383 110,227 111,709 113,254
Outstanding claims liability 46,414 46,151 46,445 50,292 48,139
Unearned premium liability 26,272 26,414 26,272 25,516 27,176
Unexpired risk liability 20 17 22 18 22
Tax provisions 190 301 170 203 161
Payables on reinsurance contracts 4,320 3,838 4,113 3,783 4,590
Borrowings and loan capital 1,894 1,772 1,814 1,701 1,530
Creditors and accruals 6,217 5,073 5,255 4,668 5,032
Other liabilities 1,483 1,052 1,157 927 806
Total liabilities 86,811 84,619 85,248 87,108 87,455
Share capital 12,832 12,859 13,383 13,403 13,377
Reserves 936 1,043 1,090 915 962
Retained profits 10,658 10,862 10,507 10,283 11,459
Net assets 24,426 24,764 24,979 24,601 25,799
Number of entities 97 99 99 95 94
Australian Prudential Regulation Authority 28
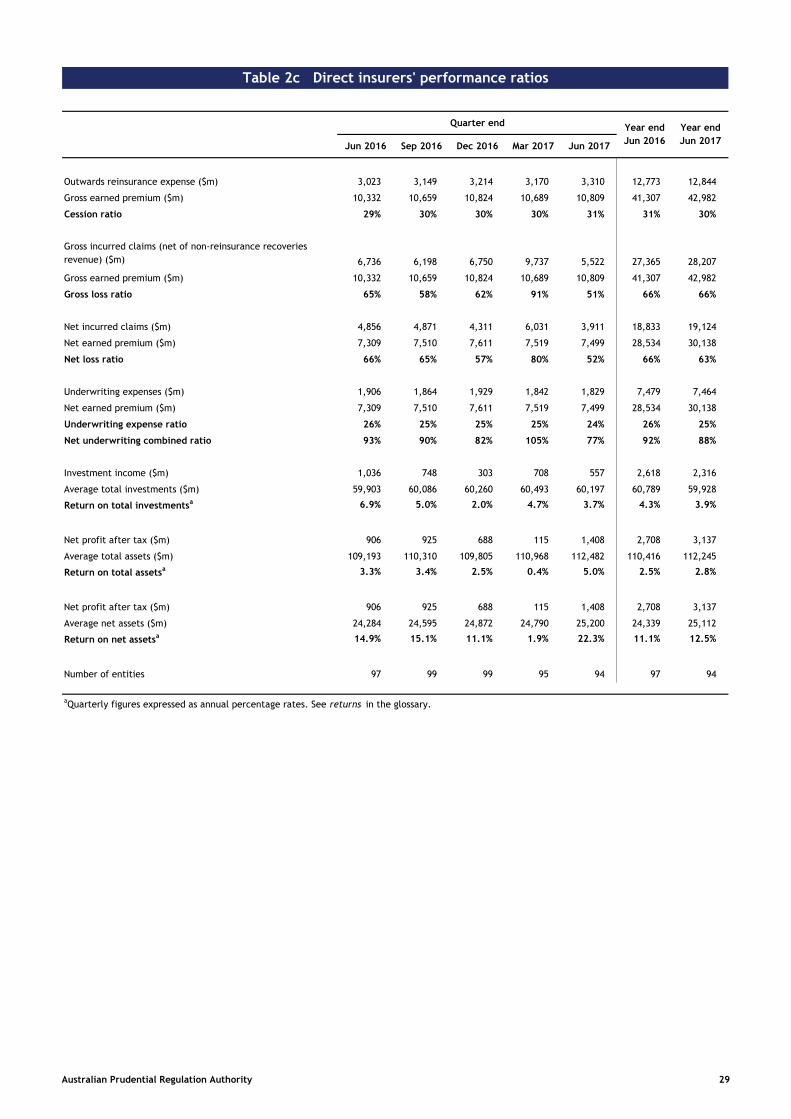
Table 2c Direct insurers' performance ratios
Quarter end
Jun 2016 Sep 2016 Dec 2016 Mar 2017 Jun 2017
Outwards reinsurance expense ($m) 3,023 3,149 3,214 3,170 3,310 12,773 12,844
Gross earned premium ($m) 10,332 10,659 10,824 10,689 10,809 41,307 42,982
Cession ratio 29% 30% 30% 30% 31% 31% 30%
Gross incurred claims (net of non-reinsurance recoveries
revenue) ($m) 6,736 6,198 6,750 9,737 5,522 27,365 28,207
Gross earned premium ($m) 10,332 10,659 10,824 10,689 10,809 41,307 42,982
Gross loss ratio 65% 58% 62% 91% 51% 66% 66%
Net incurred claims ($m) 4,856 4,871 4,311 6,031 3,911 18,833 19,124
Net earned premium ($m) 7,309 7,510 7,611 7,519 7,499 28,534 30,138
Net loss ratio 66% 65% 57% 80% 52% 66% 63%
Underwriting expenses ($m) 1,906 1,864 1,929 1,842 1,829 7,479 7,464
Net earned premium ($m) 7,309 7,510 7,611 7,519 7,499 28,534 30,138
Underwriting expense ratio 26% 25% 25% 25% 24% 26% 25%
Net underwriting combined ratio 93% 90% 82% 105% 77% 92% 88%
Investment income ($m) 1,036 748 303 708 557 2,618 2,316
Average total investments ($m) 59,903 60,086 60,260 60,493 60,197 60,789 59,928
Return on total investmentsa 6.9% 5.0% 2.0% 4.7% 3.7% 4.3% 3.9%
Net profit after tax ($m) 906 925 688 115 1,408 2,708 3,137
Average total assets ($m) 109,193 110,310 109,805 110,968 112,482 110,416 112,245
Return on total assetsa 3.3% 3.4% 2.5% 0.4% 5.0% 2.5% 2.8%
Net profit after tax ($m) 906 925 688 115 1,408 2,708 3,137
Average net assets ($m) 24,284 24,595 24,872 24,790 25,200 24,339 25,112
Return on net assetsa 14.9% 15.1% 11.1% 1.9% 22.3% 11.1% 12.5%
Number of entities 97 99 99 95 94 97 94
aQuarterly figures expressed as annual percentage rates. See returns in the glossary.
Year end
Jun 2016
Year end
Jun 2017
Australian Prudential Regulation Authority 29

Table 2d Direct insurers' investment performance
Quarter end
Jun 2016 Sep 2016 Dec 2016 Mar 2017 Jun 2017
Investment performance
Interest income ($m) 420 419 411 406 419 1,729 1,655
Dividend income ($m) 29 61 504 24 31 135 620
Rental income ($m) 9 8 9 9 7 34 33
Trust distributions ($m) 328 26 124 24 260 604 435
Other distributions ($m) 0 0 0 0 0 0 0
Foreign exchange gains/losses ($m) 30 -8 41 -55 14 55 -8
Unrealised gains/losses ($m) 156 197 -791 245 -185 -52 -535
Realised gains/losses ($m) 63 46 7 56 12 117 121
Other investment income ($m) 0 -1 -1 -1 -2 -4 -6
Total investment income ($m) 1,036 748 303 708 557 2,618 2,316
On assets backing insurance liabilities ($m) 655 437 45 465 372 1,688 1,320
On shareholders' funds ($m) 380 311 258 243 184 931 996
Investment position
Interest bearing investments ($m) 42,998 43,206 43,636 43,737 43,500 172,570 174,079
Deposits ($m) 5,022 4,984 4,899 6,031 5,950 19,435 21,864
Securities issued by financial corporations ($m) 13,823 13,679 13,448 13,147 12,325 57,023 52,598
Securities issued by government and government
corporations ($m)
15,430 15,984 16,799 15,902 16,834
62,386 65,518
Other interest bearing securities ($m) 8,723 8,560 8,490 8,658 8,392 33,726 34,099
Equity investments ($m) 1,518 1,574 1,601 1,757 1,576 5,749 6,508
Listed subordinated debt ($m) 160 163 256 217 231 335 866
Unlisted subordinated debt ($m) 589 600 499 570 448 2,393 2,117
Listed direct equity holdings ($m) 737 779 813 936 854 2,837 3,382
Unlisted direct equity holdings ($m) 33 32 33 35 43 184 143
Indirect investments ($m) 11,602 11,321 10,462 10,812 10,898 46,987 43,492
Cash ($m) 1,078 1,287 933 1,024 1,099 4,742 4,342
Fixed interest ($m) 7,958 7,295 6,964 7,021 6,989 33,694 28,269
Equities ($m) 1,615 1,812 1,625 1,690 1,593 5,298 6,720
Property investments ($m) 746 771 787 786 802 2,832 3,146
Other ($m) 206 156 153 291 415 421 1,016
Property investments ($m) 179 216 133 134 126 708 609
Loans and advances ($m) 3,212 3,212 3,968 3,545 3,157 12,812 13,883
Other investments ($m) 540 594 598 603 548 2,249 2,343
Total investments ($m) 60,049 60,123 60,397 60,589 59,806 241,074 240,915
Total investment income ($m) 1,036 748 303 708 557 2,618 2,316
Average total investments ($m) 59,903 60,086 60,260 60,493 60,197 60,789 59,928
Return on total investmentsa
6.9% 5.0% 2.0% 4.7% 3.7% 4.3% 3.9%
Number of entities 97 99 99 95 94 97 94
aQuarterly figures expressed as annual percentage rates. See returns in the glossary.
Year end
Jun 2016
Year end
Jun 2017
Australian Prudential Regulation Authority 30
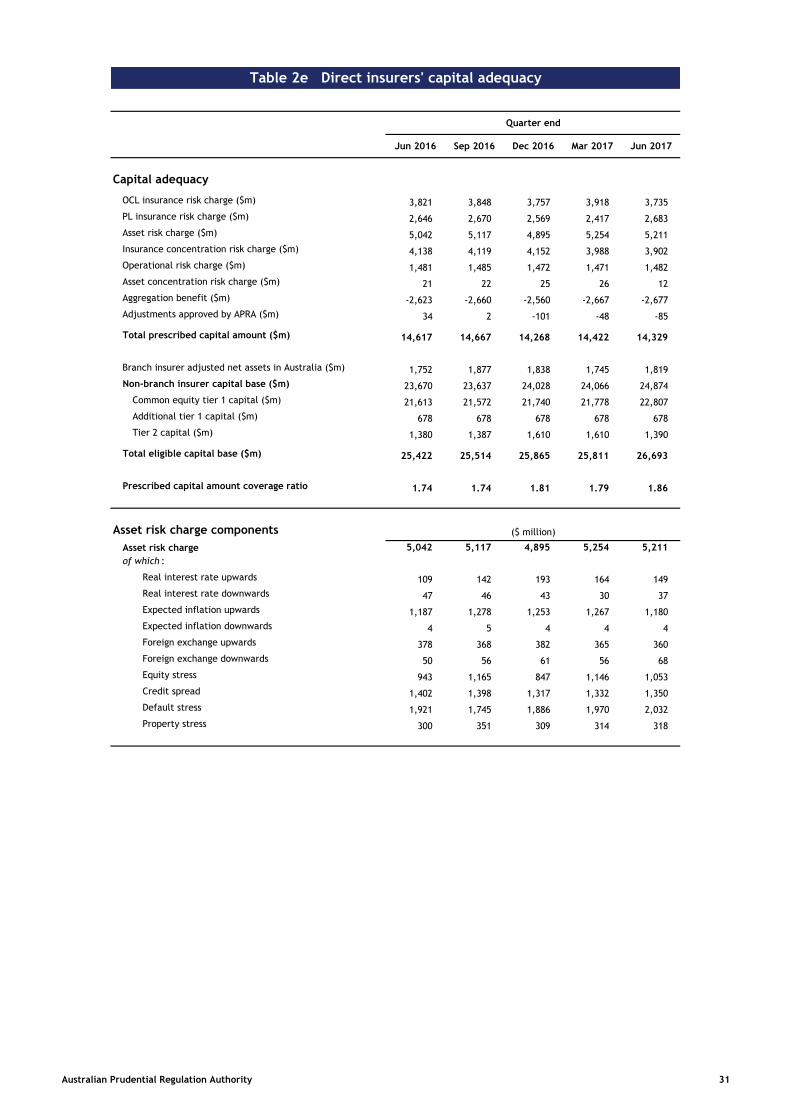
Table 2e Direct insurers' capital adequacy
Quarter end
Jun 2016 Sep 2016 Dec 2016 Mar 2017 Jun 2017
Capital adequacy
OCL insurance risk charge ($m) 3,821 3,848 3,757 3,918 3,735
PL insurance risk charge ($m) 2,646 2,670 2,569 2,417 2,683
Asset risk charge ($m) 5,042 5,117 4,895 5,254 5,211
Insurance concentration risk charge ($m) 4,138 4,119 4,152 3,988 3,902
Operational risk charge ($m) 1,481 1,485 1,472 1,471 1,482
Asset concentration risk charge ($m) 21 22 25 26 12
Aggregation benefit ($m) -2,623 -2,660 -2,560 -2,667 -2,677
Adjustments approved by APRA ($m) 34 2 -101 -48 -85
Total prescribed capital amount ($m) 14,617 14,667 14,268 14,422 14,329
Branch insurer adjusted net assets in Australia ($m) 1,752 1,877 1,838 1,745 1,819
Non-branch insurer capital base ($m) 23,670 23,637 24,028 24,066 24,874
Common equity tier 1 capital ($m) 21,613 21,572 21,740 21,778 22,807
Additional tier 1 capital ($m) 678 678 678 678 678
Tier 2 capital ($m) 1,380 1,387 1,610 1,610 1,390
Total eligible capital base ($m) 25,422 25,514 25,865 25,811 26,693
Prescribed capital amount coverage ratio 1.74 1.74 1.81 1.79 1.86
Asset risk charge components ($ million)
Asset risk charge
of which :
5,042 5,117 4,895 5,254 5,211
Real interest rate upwards 109 142 193 164 149
Real interest rate downwards 47 46 43 30 37
Expected inflation upwards 1,187 1,278 1,253 1,267 1,180
Expected inflation downwards 4 5 4 4 4
Foreign exchange upwards 378 368 382 365 360
Foreign exchange downwards 50 56 61 56 68
Equity stress 943 1,165 847 1,146 1,053
Credit spread 1,402 1,398 1,317 1,332 1,350
Default stress 1,921 1,745 1,886 1,970 2,032
Property stress 300 351 309 314 318
Australian Prudential Regulation Authority 31
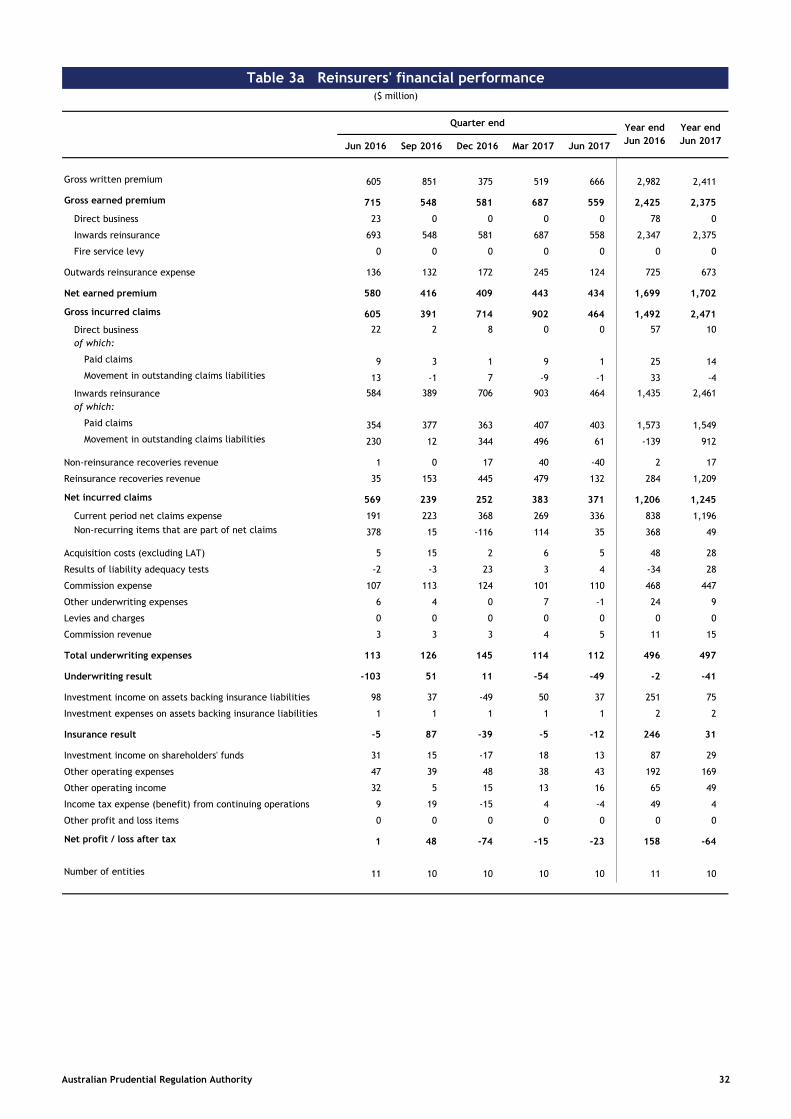
Table 3a Reinsurers' financial performance($ million)
Quarter end
Jun 2016 Sep 2016 Dec 2016 Mar 2017 Jun 2017
Gross written premium 605 851 375 519 666 2,982 2,411
Gross earned premium 715 548 581 687 559 2,425 2,375
Direct business 23 0 0 0 0 78 0
Inwards reinsurance 693 548 581 687 558 2,347 2,375
Fire service levy 0 0 0 0 0 0 0
Outwards reinsurance expense 136 132 172 245 124 725 673
Net earned premium 580 416 409 443 434 1,699 1,702
Gross incurred claims 605 391 714 902 464 1,492 2,471
Direct business
of which:
22 2 8 0 0 57 10
Paid claims 9 3 1 9 1 25 14
Movement in outstanding claims liabilities 13 -1 7 -9 -1 33 -4
Inwards reinsurance
of which:
584 389 706 903 464 1,435 2,461
Paid claims 354 377 363 407 403 1,573 1,549
Movement in outstanding claims liabilities 230 12 344 496 61 -139 912
Non-reinsurance recoveries revenue 1 0 17 40 -40 2 17
Reinsurance recoveries revenue 35 153 445 479 132 284 1,209
Net incurred claims 569 239 252 383 371 1,206 1,245
Current period net claims expense 191 223 368 269 336 838 1,196
Non-recurring items that are part of net claims 378 15 -116 114 35 368 49
Acquisition costs (excluding LAT) 5 15 2 6 5 48 28
Results of liability adequacy tests -2 -3 23 3 4 -34 28
Commission expense 107 113 124 101 110 468 447
Other underwriting expenses 6 4 0 7 -1 24 9
Levies and charges 0 0 0 0 0 0 0
Commission revenue 3 3 3 4 5 11 15
Total underwriting expenses 113 126 145 114 112 496 497
Underwriting result -103 51 11 -54 -49 -2 -41
Investment income on assets backing insurance liabilities 98 37 -49 50 37 251 75
Investment expenses on assets backing insurance liabilities 1 1 1 1 1 2 2
Insurance result -5 87 -39 -5 -12 246 31
Investment income on shareholders' funds 31 15 -17 18 13 87 29
Other operating expenses 47 39 48 38 43 192 169
Other operating income 32 5 15 13 16 65 49
Income tax expense (benefit) from continuing operations 9 19 -15 4 -4 49 4
Other profit and loss items 0 0 0 0 0 0 0
Net profit / loss after tax 1 48 -74 -15 -23 158 -64
Number of entities 11 10 10 10 10 11 10
Year end
Jun 2016
Year end
Jun 2017
Australian Prudential Regulation Authority 32
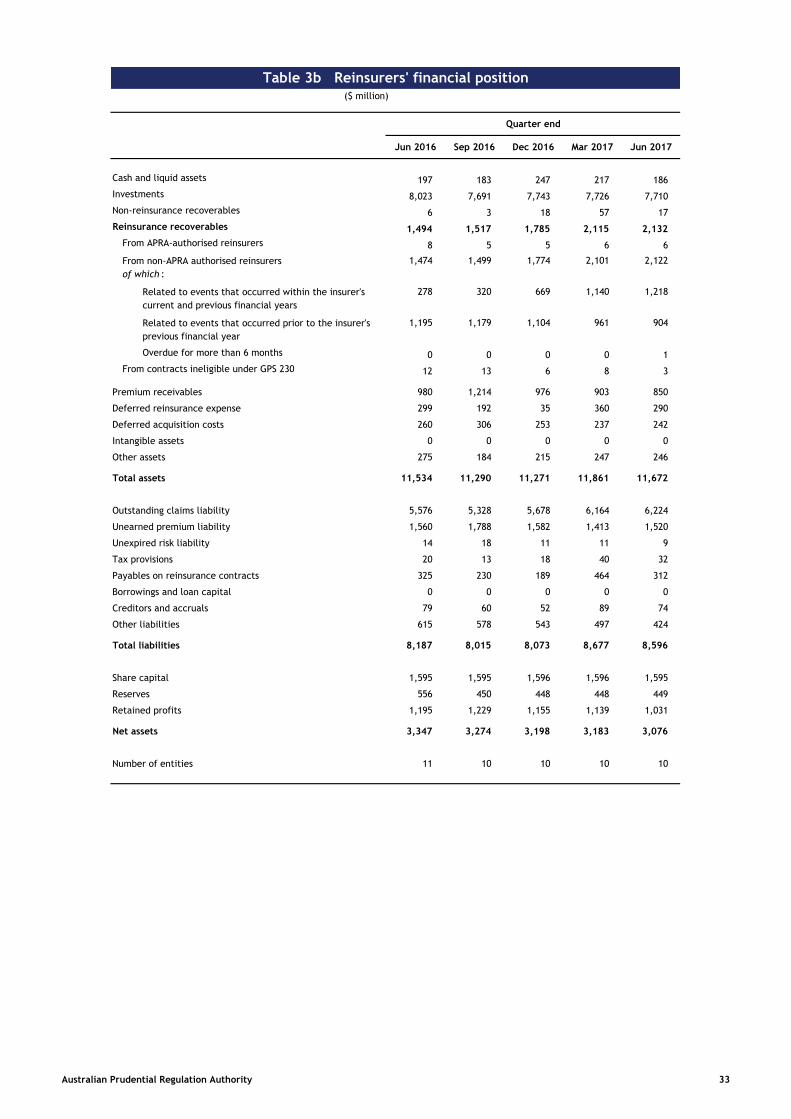
Table 3b Reinsurers' financial position($ million)
Quarter end
Jun 2016 Sep 2016 Dec 2016 Mar 2017 Jun 2017
Cash and liquid assets 197 183 247 217 186
Investments 8,023 7,691 7,743 7,726 7,710
Non-reinsurance recoverables 6 3 18 57 17
Reinsurance recoverables 1,494 1,517 1,785 2,115 2,132
From APRA-authorised reinsurers 8 5 5 6 6
From non-APRA authorised reinsurers
of which :
1,474 1,499 1,774 2,101 2,122
Related to events that occurred within the insurer's
current and previous financial years
278 320 669 1,140 1,218
Related to events that occurred prior to the insurer's
previous financial year
1,195 1,179 1,104 961 904
Overdue for more than 6 months 0 0 0 0 1
From contracts ineligible under GPS 230 12 13 6 8 3
Premium receivables 980 1,214 976 903 850
Deferred reinsurance expense 299 192 35 360 290
Deferred acquisition costs 260 306 253 237 242
Intangible assets 0 0 0 0 0
Other assets 275 184 215 247 246
Total assets 11,534 11,290 11,271 11,861 11,672
Outstanding claims liability 5,576 5,328 5,678 6,164 6,224
Unearned premium liability 1,560 1,788 1,582 1,413 1,520
Unexpired risk liability 14 18 11 11 9
Tax provisions 20 13 18 40 32
Payables on reinsurance contracts 325 230 189 464 312
Borrowings and loan capital 0 0 0 0 0
Creditors and accruals 79 60 52 89 74
Other liabilities 615 578 543 497 424
Total liabilities 8,187 8,015 8,073 8,677 8,596
Share capital 1,595 1,595 1,596 1,596 1,595
Reserves 556 450 448 448 449
Retained profits 1,195 1,229 1,155 1,139 1,031
Net assets 3,347 3,274 3,198 3,183 3,076
Number of entities 11 10 10 10 10
Australian Prudential Regulation Authority 33
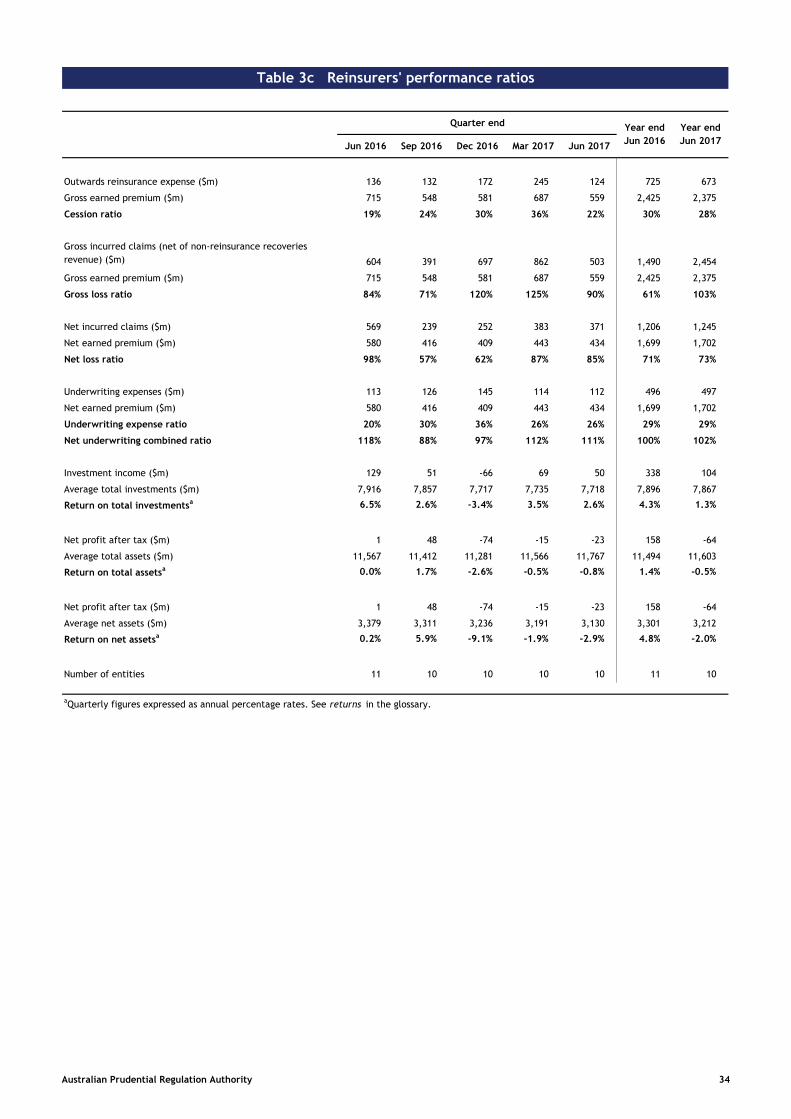
Table 3c Reinsurers' performance ratios
Quarter end
Jun 2016 Sep 2016 Dec 2016 Mar 2017 Jun 2017
Outwards reinsurance expense ($m) 136 132 172 245 124 725 673
Gross earned premium ($m) 715 548 581 687 559 2,425 2,375
Cession ratio 19% 24% 30% 36% 22% 30% 28%
Gross incurred claims (net of non-reinsurance recoveries
revenue) ($m) 604 391 697 862 503 1,490 2,454
Gross earned premium ($m) 715 548 581 687 559 2,425 2,375
Gross loss ratio 84% 71% 120% 125% 90% 61% 103%
Net incurred claims ($m) 569 239 252 383 371 1,206 1,245
Net earned premium ($m) 580 416 409 443 434 1,699 1,702
Net loss ratio 98% 57% 62% 87% 85% 71% 73%
Underwriting expenses ($m) 113 126 145 114 112 496 497
Net earned premium ($m) 580 416 409 443 434 1,699 1,702
Underwriting expense ratio 20% 30% 36% 26% 26% 29% 29%
Net underwriting combined ratio 118% 88% 97% 112% 111% 100% 102%
Investment income ($m) 129 51 -66 69 50 338 104
Average total investments ($m) 7,916 7,857 7,717 7,735 7,718 7,896 7,867
Return on total investmentsa 6.5% 2.6% -3.4% 3.5% 2.6% 4.3% 1.3%
Net profit after tax ($m) 1 48 -74 -15 -23 158 -64
Average total assets ($m) 11,567 11,412 11,281 11,566 11,767 11,494 11,603
Return on total assetsa 0.0% 1.7% -2.6% -0.5% -0.8% 1.4% -0.5%
Net profit after tax ($m) 1 48 -74 -15 -23 158 -64
Average net assets ($m) 3,379 3,311 3,236 3,191 3,130 3,301 3,212
Return on net assetsa 0.2% 5.9% -9.1% -1.9% -2.9% 4.8% -2.0%
Number of entities 11 10 10 10 10 11 10
aQuarterly figures expressed as annual percentage rates. See returns in the glossary.
Year end
Jun 2016
Year end
Jun 2017
Australian Prudential Regulation Authority 34
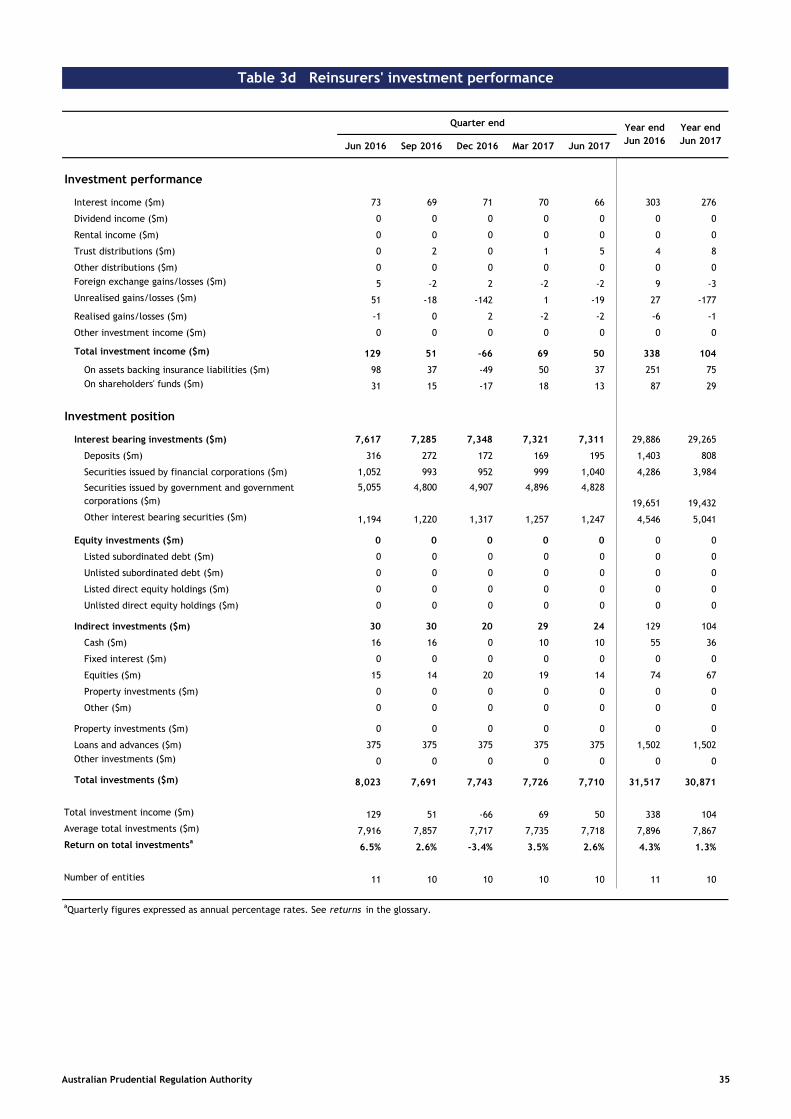
Table 3d Reinsurers' investment performance
Quarter end
Jun 2016 Sep 2016 Dec 2016 Mar 2017 Jun 2017
Investment performance
Interest income ($m) 73 69 71 70 66 303 276
Dividend income ($m) 0 0 0 0 0 0 0
Rental income ($m) 0 0 0 0 0 0 0
Trust distributions ($m) 0 2 0 1 5 4 8
Other distributions ($m) 0 0 0 0 0 0 0
Foreign exchange gains/losses ($m) 5 -2 2 -2 -2 9 -3
Unrealised gains/losses ($m) 51 -18 -142 1 -19 27 -177
Realised gains/losses ($m) -1 0 2 -2 -2 -6 -1
Other investment income ($m) 0 0 0 0 0 0 0
Total investment income ($m) 129 51 -66 69 50 338 104
On assets backing insurance liabilities ($m) 98 37 -49 50 37 251 75
On shareholders' funds ($m) 31 15 -17 18 13 87 29
Investment position
Interest bearing investments ($m) 7,617 7,285 7,348 7,321 7,311 29,886 29,265
Deposits ($m) 316 272 172 169 195 1,403 808
Securities issued by financial corporations ($m) 1,052 993 952 999 1,040 4,286 3,984
Securities issued by government and government
corporations ($m)
5,055 4,800 4,907 4,896 4,828
19,651 19,432
Other interest bearing securities ($m) 1,194 1,220 1,317 1,257 1,247 4,546 5,041
Equity investments ($m) 0 0 0 0 0 0 0
Listed subordinated debt ($m) 0 0 0 0 0 0 0
Unlisted subordinated debt ($m) 0 0 0 0 0 0 0
Listed direct equity holdings ($m) 0 0 0 0 0 0 0
Unlisted direct equity holdings ($m) 0 0 0 0 0 0 0
Indirect investments ($m) 30 30 20 29 24 129 104
Cash ($m) 16 16 0 10 10 55 36
Fixed interest ($m) 0 0 0 0 0 0 0
Equities ($m) 15 14 20 19 14 74 67
Property investments ($m) 0 0 0 0 0 0 0
Other ($m) 0 0 0 0 0 0 0
Property investments ($m) 0 0 0 0 0 0 0
Loans and advances ($m) 375 375 375 375 375 1,502 1,502
Other investments ($m) 0 0 0 0 0 0 0
Total investments ($m) 8,023 7,691 7,743 7,726 7,710 31,517 30,871
Total investment income ($m) 129 51 -66 69 50 338 104
Average total investments ($m) 7,916 7,857 7,717 7,735 7,718 7,896 7,867
Return on total investmentsa
6.5% 2.6% -3.4% 3.5% 2.6% 4.3% 1.3%
Number of entities 11 10 10 10 10 11 10
aQuarterly figures expressed as annual percentage rates. See returns in the glossary.
Year end
Jun 2016
Year end
Jun 2017
Australian Prudential Regulation Authority 35
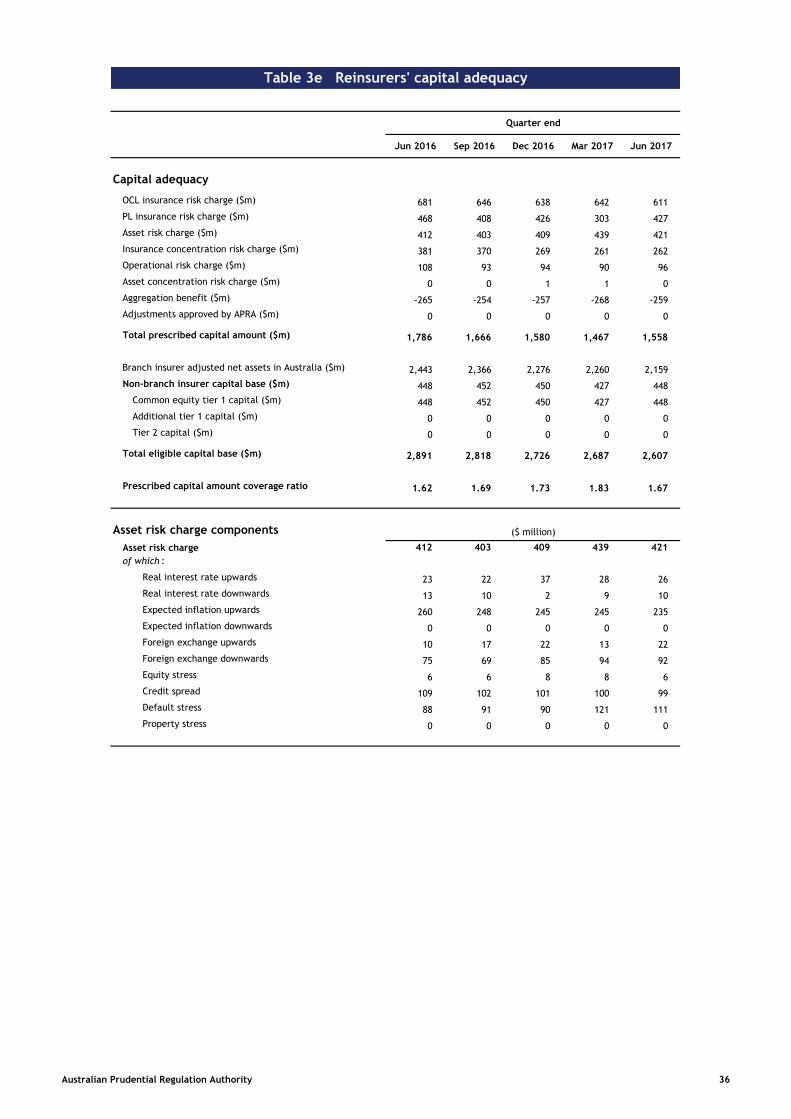
Table 3e Reinsurers' capital adequacy
Quarter end
Jun 2016 Sep 2016 Dec 2016 Mar 2017 Jun 2017
Capital adequacy
OCL insurance risk charge ($m) 681 646 638 642 611
PL insurance risk charge ($m) 468 408 426 303 427
Asset risk charge ($m) 412 403 409 439 421
Insurance concentration risk charge ($m) 381 370 269 261 262
Operational risk charge ($m) 108 93 94 90 96
Asset concentration risk charge ($m) 0 0 1 1 0
Aggregation benefit ($m) -265 -254 -257 -268 -259
Adjustments approved by APRA ($m) 0 0 0 0 0
Total prescribed capital amount ($m) 1,786 1,666 1,580 1,467 1,558
Branch insurer adjusted net assets in Australia ($m) 2,443 2,366 2,276 2,260 2,159
Non-branch insurer capital base ($m) 448 452 450 427 448
Common equity tier 1 capital ($m) 448 452 450 427 448
Additional tier 1 capital ($m) 0 0 0 0 0
Tier 2 capital ($m) 0 0 0 0 0
Total eligible capital base ($m) 2,891 2,818 2,726 2,687 2,607
Prescribed capital amount coverage ratio 1.62 1.69 1.73 1.83 1.67
Asset risk charge components ($ million)
Asset risk charge
of which :
412 403 409 439 421
Real interest rate upwards 23 22 37 28 26
Real interest rate downwards 13 10 2 9 10
Expected inflation upwards 260 248 245 245 235
Expected inflation downwards 0 0 0 0 0
Foreign exchange upwards 10 17 22 13 22
Foreign exchange downwards 75 69 85 94 92
Equity stress 6 6 8 8 6
Credit spread 109 102 101 100 99
Default stress 88 91 90 121 111
Property stress 0 0 0 0 0
Australian Prudential Regulation Authority 36
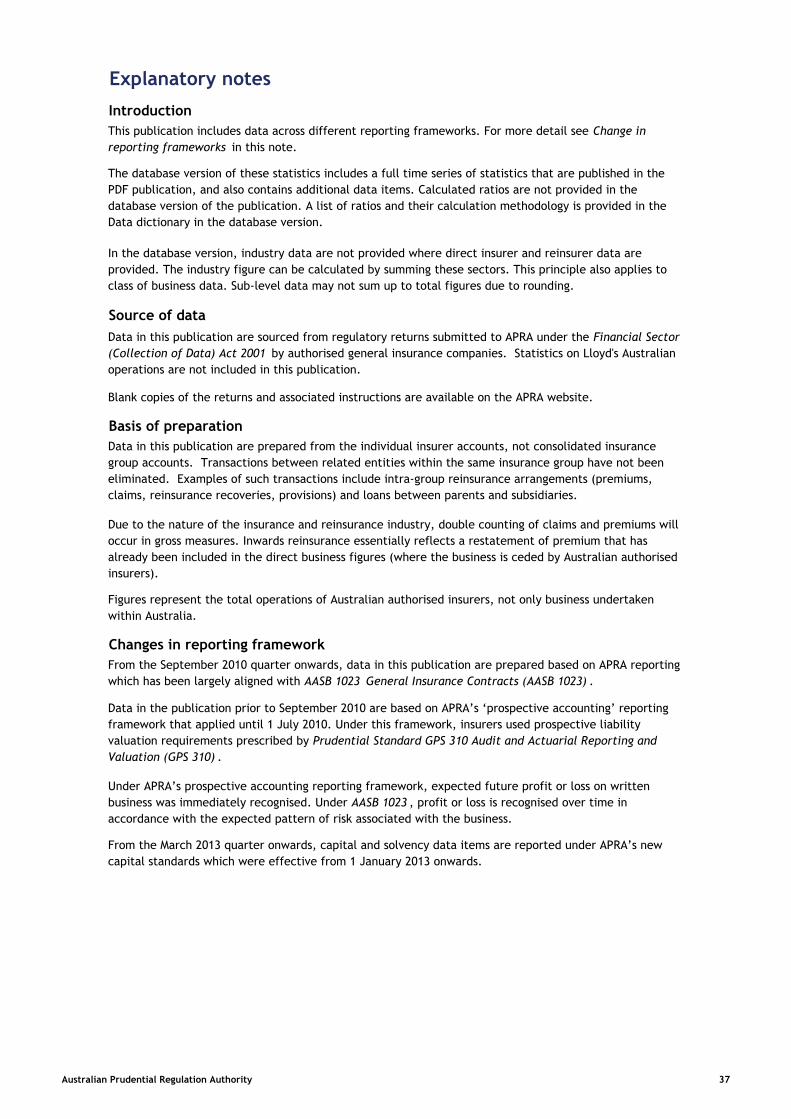
Explanatory notes
From the March 2013 quarter onwards, capital and solvency data items are reported under APRA’s new
capital standards which were effective from 1 January 2013 onwards.
From the September 2010 quarter onwards, data in this publication are prepared based on APRA reporting
which has been largely aligned with AASB 1023 General Insurance Contracts (AASB 1023) .
Data in the publication prior to September 2010 are based on APRA’s ‘prospective accounting’ reporting
framework that applied until 1 July 2010. Under this framework, insurers used prospective liability
valuation requirements prescribed by Prudential Standard GPS 310 Audit and Actuarial Reporting and
Valuation (GPS 310) .
Under APRA’s prospective accounting reporting framework, expected future profit or loss on written
business was immediately recognised. Under AASB 1023 , profit or loss is recognised over time in
accordance with the expected pattern of risk associated with the business.
Changes in reporting framework
In the database version, industry data are not provided where direct insurer and reinsurer data are
provided. The industry figure can be calculated by summing these sectors. This principle also applies to
class of business data. Sub-level data may not sum up to total figures due to rounding.
Source of data
Data in this publication are sourced from regulatory returns submitted to APRA under the Financial Sector
(Collection of Data) Act 2001 by authorised general insurance companies. Statistics on Lloyd's Australian
operations are not included in this publication.
Blank copies of the returns and associated instructions are available on the APRA website.
Basis of preparation
Data in this publication are prepared from the individual insurer accounts, not consolidated insurance
group accounts. Transactions between related entities within the same insurance group have not been
eliminated. Examples of such transactions include intra-group reinsurance arrangements (premiums,
claims, reinsurance recoveries, provisions) and loans between parents and subsidiaries.
Due to the nature of the insurance and reinsurance industry, double counting of claims and premiums will
occur in gross measures. Inwards reinsurance essentially reflects a restatement of premium that has
already been included in the direct business figures (where the business is ceded by Australian authorised
insurers).
Figures represent the total operations of Australian authorised insurers, not only business undertaken
within Australia.
Introduction
This publication includes data across different reporting frameworks. For more detail see Change in
reporting frameworks in this note.
The database version of these statistics includes a full time series of statistics that are published in the
PDF publication, and also contains additional data items. Calculated ratios are not provided in the
database version of the publication. A list of ratios and their calculation methodology is provided in the
Data dictionary in the database version.
Australian Prudential Regulation Authority 37

AUSTRALIAN PRUDENTIAL REGULATION AUTHORITY 3