Quarterly employment statistics - Statistics South Africa · Statistics South Africa P0277 ......
30
www.statssa.gov.za [email protected] T +27 12 310 8911 F +27 12 310 8500 Private Bag X44, Pretoria, 0001, South Africa ISIbalo House, Koch Street, Salvokop, Pretoria, 0002 STATISTICAL RELEASE P0277 Quarterly employment statistics June 2016 Embargoed until: 7 October 2016 13:30 ENQUIRIES: FORTHCOMING ISSUE: EXPECTED RELEASE DATE User information Services September 2016 13 December 2016 Tel:(012) 310 8600/4892/8390
-
Upload
nguyencong -
Category
Documents
-
view
223 -
download
0
Transcript of Quarterly employment statistics - Statistics South Africa · Statistics South Africa P0277 ......

www.statssa.gov.za
T +27 12 310 8911
F +27 12 310 8500
Private Bag X44, Pretoria, 0001, South Africa
ISIbalo House, Koch Street, Salvokop, Pretoria, 0002
STATISTICAL RELEASE P0277
Quarterly employment statistics
June 2016
Embargoed until: 7 October 2016
13:30 ENQUIRIES: FORTHCOMING ISSUE: EXPECTED RELEASE DATE User information Services September 2016 13 December 2016 Tel:(012) 310 8600/4892/8390

Statistics South Africa P0277
Quarterly employment statistics
2
Contents
Introduction ........................................................................................................................................................................ 3
Key findings: employment and earnings for the quarter ending June 2016 .................................................................. 3
Figure A: Employment in the non-agricultural formal sector, June 2015 – June 2016. ................................................. 3
Table A: Employment by industry ............................................................................................................................. 3
Figure B: Gross earnings (R’000) of employees in the formal non-agricultural sector, June 2015 – June 2016 ........... 4
Table B: Gross earnings by industry ......................................................................................................................... 4
Average monthly earnings ................................................................................................................................................ 5
Key differences between the Quarterly labour force survey (QLFS) and the Quarterly employment survey
(QES) ................................................................................................................................................................................... 5
Table C: Average monthly earnings paid to employees in the formal non-agricultural sector ................................... 5
Profile of formal sector employees. ................................................................................................................................. 6
Figure C: Formal sector employees by sex .................................................................................................................. 6
Figure D: Formal sector employees by age .................................................................................................................. 7
Figure E: Formal sector employees by education. ........................................................................................................ 7
Figure F: Median weekly hours of work. ....................................................................................................................... 7
Part 1 – Estimation of number of employees and their earnings ................................................................................ 10
Table 1 - Total (all formal non-agricultural industries) ................................................................................................. 10
Table 2 - Mining and quarrying industry ...................................................................................................................... 10
Table 3 - Manufacturing industry ................................................................................................................................ 11
Table 4 - Electricity, gas and water supply industry .................................................................................................... 11
Table 5 - Construction industry ................................................................................................................................... 12
Table 6 - Wholesale and retail trade; repair of motor vehicles, motor cycles and personal and household goods;
hotels and restaurants industry ................................................................................................................ 12
Table 7 - Transport, storage and communication industry .......................................................................................... 13
Table 8 - Financial intermediation, insurance, real estate and business services industry ......................................... 13
Table 9 - Community, social and personal services industry ...................................................................................... 14
Part 2 – Estimation of average monthly earnings ......................................................................................................... 15
Table 1 – Average monthly earnings at current prices, by industry ............................................................................ 15
Table 2 – Average monthly earnings at constant prices, by industry .......................................................................... 18
Additional information ..................................................................................................................................................... 21
Technical notes........................................................................................................................................................... 21
Table D: Estimates of number of employees by industry within 95% confidence limits .......................................... 22
Table E: Estimates of gross earnings (R' 000) by industry within 95% confidence limits ........................................ 22
Table F: Estimates of average monthly earnings, including bonuses and overtime payments, at current prices,
by industry within 95% confidence limits .................................................................................................. 23
Table G: Estimates of average monthly earnings, excluding bonuses and overtime payments, at current prices,
by industry within 95% confidence limits .................................................................................................. 23
Glossary ........................................................................................................................................................................... 27
General information ......................................................................................................................................................... 30

Statistics South Africa P0277
Quarterly employment statistics
3
Introduction
The Quarterly employment statistics (QES) is an enterprise-based sample survey conducted by Statistics South Africa (Stats SA). The samples are drawn from private non-agricultural businesses such as factories, firms, offices, and stores, as well as from national, provincial and local government entities. The definition of industries is based on the System of National Accounts (SNA) and is in line with that in the Standard Industrial Classification of all Economic Activities (SIC), Fifth Edition, and Report No. 09-09-02 of January 1993. This survey covers employment statistics of the following industries:
mining and quarrying;
manufacturing;
electricity, gas and water supply;
construction;
wholesale and retail trade; repair of motor vehicles, motor cycles and personal and household goods; and hotels and restaurants;
transport, storage and communication;
financial intermediation, insurance, real estate and business services; and
community, social and personal services.
Key findings: employment and earnings for the quarter ending June 2016
Figure A: Employment in the non-agricultural formal sector, June 2015 – June 2016.
Table A: Employment by industry
Industry Jun 2015 Mar* 2016 Jun 2016 Q/Q Change Y/Y Change Q/Q Change Y/Y Change
Thousand %
Mining 489 458 457 -1 -32 -0,2 -6,5
Manufacturing 1 152 1 143 1 136 -7 -16 -0,6 -1,4
Electricity 60 61 61 0 1 0,0 1,7
Construction 538 544 545 1 7 0,2 1,3
Trade 1 891 1 915 1 911 -4 20 -0,2 1,1
Transport 460 459 452 -7 -8 -1,5 -1,7
Business services 2 069 2 110 2 109 -1 40 0,0 1,9
Community services 2 529 2 595 2 547 -48 18 -1,8 0,7
Total 9 188 9 285 9 218 -67 30 -0,7 0,3
*Revised estimates.
9 120 000
9 140 000
9 160 000
9 180 000
9 200 000
9 220 000
9 240 000
9 260 000
9 280 000
9 300 000
J U N S E P D E C M A R * J U N
2 0 1 5 2 0 1 6
NU
MB
ER O
F EM
PLO
YEES
EMPLOYMENT

Statistics South Africa P0277
Quarterly employment statistics
4
Table A shows that employment decreased by 67 000 quarter-on-quarter, from 9 285 000 in March 2016 to 9 218 000 in June 2016. This was largely due to decreases in the following industries: community services (48 000 or -1,8%); manufacturing (-7 000 or -0,6%); transport (-7 000 or -1,5%); trade (-4 000 or -0,2%); mining and quarrying (-1 000 or -0,2%) and business services (-1 000 or 0,0%). However there was an increase of 1000 employees or (+0,2%) by construction industry. The electricity industry remained unchanged. Employment increased by 30 000 or 0,3% year-on-year between June 2015 and June 2016. These increases were reported by; business services (40 000 or 1,9%); trade (20 000 or 1,1%); community services (18 000 or 0,7%); construction (7 000 or 1,3%) and Electricity (1 000 or 1,7%). The following industries reported annual decreases: transport (-8 000 or -1,7%); manufacturing (-16 000 or -1,4%); and mining and quarrying (-32 000 or -6,5%). Besides mining, manufacturing and transport which declined both quarter-quarter and year-on year, employment in other industries was still higher in June 2016 compared to the same period last year.
Figure B: Gross earnings (R’000) of employees in the formal non-agricultural sector, June 2015 – June 2016
Table B: Gross earnings by industry
Industry Jun 2015 Mar* 2016 Jun 2016 Q/Q Change Y/Y Change Q/Q Change Y/Y Change
Rands (Million) %
Mining 27 465 28 248 29 075 827 1 610 2,9 5,9
Manufacturing 54 698 56 224 57 095 871 2 397 1,5 4,4
Electricity 6 039 6 517 6 562 45 523 0,7 8,7
Construction 22 060 21 306 22 476 1 170 416 5,5 1,9
Trade 68 961 71 912 72 246 334 3 285 0,5 4,8
Transport 31 344 30 436 31 970 1 534 626 5,0 2,0
Business services 123 188 140 970 128 450 -12 520 5 262 -8,9 4,3
Community services 158 926 167 698 175 469 7 771 16 543 4,6 10,4
Total 492 681 523 311 523 343 32 30 662 0,0 6,2
*Revised estimates.
R 460 000
R 470 000
R 480 000
R 490 000
R 500 000
R 510 000
R 520 000
R 530 000
R 540 000
R 550 000
J U N S E P D E C M A R * J U N
2 0 1 5 2 0 1 6
MIL
LIO
NS
GROSS EARNINGS

Statistics South Africa P0277
Quarterly employment statistics
5
Table B shows that gross earnings paid to employees increased by R32 million (0,01%) from R523 311 million in March 2016 to R523 343 million in June 2016. The increase was mainly due to increases in the community services; transport; construction; manufacturing; mining and quarrying; trade and electricity industries.
There was a decrease reported by the business services industry.
Year-on-year, gross earnings increased by R30 662 million (6,2%).
Average monthly earnings
Table C: Average monthly earnings paid to employees in the formal non-agricultural sector
Average monthly earnings (including bonuses and overtime payments)
May 2015 Feb* 2016 May 2016 Q/Q Change Y/Y Change
Rands %
16 787 17 396 18 045 3,7 7,5
*Revised estimates.
Table C shows a quarter-on-quarter increase of 3,7% in average monthly earnings paid to employees in the formal non-agricultural sector from R17 396 in February 2016 to R18 045 in May 2016. On an annual basis, average monthly earnings paid to employees increased by 7,5% from R16 787 in May 2015 to R18 045 in May 2016.
Key differences between the Quarterly labour force survey (QLFS) and the Quarterly employment survey (QES)
There are two official sources of employment statistics, the QES which is establishment based and the QLFS which is household based. Each survey has its strengths and limitations. For example, the QES cannot provide information on the following;
Description of the employed e.g their demographic profile, education level, hours of work etc
Unemployment and descriptors of the unemployed.
For the first time this release will include information from the QLFS quarter 2:2016 to supplement the QES. This will provide the profile of the formal sector employees in terms of demographic, level of education and their hours of work etc. This will be provided in proportions rather than absolute numbers because at times QES and QLFS produce different totals because of the difference discussed below.
The Quarterly labour force survey (QLFS) is a survey of households which collects information from approximately 30 000 dwelling units, and collects data on the labour market activities of individuals; whereas Quarterly employment statistics (QES) is an enterprise based survey that collects information from non-agricultural businesses and organisations from approximately 20 000 units. The numerous conceptual and methodological differences between the household and enterprise based surveys result in important distinctions in the employment estimates derived from the surveys. Among these are:
The household survey includes agricultural workers, self-employed workers whose businesses are unincorporated, unpaid family workers, and private household workers among the employed. These groups are excluded from the enterprise based survey.
The household survey is limited to workers 15 years of age and older. The enterprise based survey is not limited by age.
The household survey has no duplication of individuals, because individuals are counted only once, even if they hold more than one job. In the enterprise based survey, employees working at more than one job and thus appearing on more than one payroll are counted separately for each appearance.
QLFS includes income tax, VAT and number of employees in determining the formal sector while QES use only VAT with annual turnover greater than 300 000.

Statistics South Africa P0277
Quarterly employment statistics
6
QLFS allows proxy respondents, this can introduce misclassification of items e.g formal/informal classification.
QLFS QES
Coverage
Private households and worker’s hostels
Payroll of VAT registered businesses
Non-institutional population (15 years and older)
Employees only
Employment (including the informal sector; private households; agriculture and small businesses)
Formal sector (excluding agriculture)
Sample size 30 000 dwelling units in which households reside
20 000 VAT registered businesses
Reference period One week prior to the interview
Payroll at the end of the reference quarter
Formal sector definition (excluding Agriculture & Private households)
Employers and own-account workers registered for VAT or income tax
Excludes agriculture and private households
Employees paying income tax and those not paying tax but working for firms with five or more workers
Employees on the payroll of VAT registered businesses.
Statistics based on sample surveys are subject to both sampling and nonsampling error. When a sample, rather than the entire population, is surveyed, there is a chance that the sample estimates may differ from the true population values they represent. The component of this difference that occurs because samples differ by chance is known as sampling error, and its variability is measured by the standard error of the estimate. The household and enterprise based surveys are also affected by nonsampling error, which can occur for many reasons, including the failure to sample a segment of the population, inability to obtain information for all respondents in the sample, inability or unwillingness of respondents to provide correct information on a timely basis, mistakes made by respondents, and errors made in the collection or processing of the data.
Profile of formal sector employees.
Employees in the non-agricultural formal sector can be identified in the QLFS notwithstanding the differences in definition of formal sector. The definition in QLFS is wider than that of QES and usually QLFS reports approximately 10% more than the QES. However, the distribution in terms of demographic profile, education, hours work is likely to be maintained between the two sources. This section provides the profile of non-agricultural formal sector employees from the QLFS.
Figure C: Formal sector employees by sex
43,0
57,0
0,0
10,0
20,0
30,0
40,0
50,0
60,0
Women Men
%

Statistics South Africa P0277
Quarterly employment statistics
7
Figures C show that 43% of non-agricultural formal sector employees are women. Young people aged 15-34 constitute approximately 40,9% of employees in the formal sector as shown in Figure D. Education do matter, in that those who completed secondary education constitute 37,5% of the formal sector employees, those with tertiary education contribute 25,2 % of the employee in the sector.
Figure D: Formal sector employees by age
Figure E: Formal sector employees by education.
Figure F: Median weekly hours of work.
Employees in the non-agricultural formal sector work 44 hours per week. Employees in mining, trade, transport and finance work longer hours per week compared to the national average with those in transport working the longest at 48 hours per week.
PJ Lehohla Statistician-General
8,0
32,9 31,4
19,5
8,2
0,0
5,0
10,0
15,0
20,0
25,0
30,0
35,0
40,0
15
-24
yr
25
-34
yr
35
-44
yr
45
-54
yr
55
-64
yr
%
1,0 4,0 2,6 28,7 37,5 25,2 1,0 0,0
5,0
10,0
15,0
20,0
25,0
30,0
35,0
40,0
No
scho
olin
g
Prim
ary no
tco
mp
leted
Prim
aryco
mp
leted
Secon
dary n
ot
com
pleted
Secon
dary
com
pleted
Tertiary
Oth
er
%
46 43 43 42 46 48 46 40 44 36
38
40
42
44
46
48
50hours

Statistics South Africa P0277
Quarterly employment statistics
8
Detailed employment changes by industry
The mining and quarrying industry reported an annual decrease of 32 000 employees (-6,5%) in June 2016 compared with June 2015. There was quarterly decrease of 1 000 employees (-0,2%) in June 2016 compared with March 2016.
See explanatory note on page 26. The manufacturing industry reported an annual decrease of 16 000 employees (-1,4%) in June 2016 compared with June 2015. There was quarterly decrease of 7 000 employees (-0,6%) in June 2016 compared with March 2016. This was mainly due to decreases in employment in the food, beverages and tobacco; textiles, clothing and leather and furniture, manufacturing n.e.c, recycling. The electricity, gas and water supply industry reported an annual increase of 1 000 employees (1,7%) in June 2016 compared with June 2015. There was no quarterly change in June 2016 compared to with March 2016. The construction industry reported an annual increase of 7 000 employees (1,3%) in June 2016 compared with June 2015. There was a quarterly increase of 1 000 employees (0,2%) in June 2016 compared with March 2016. This was mainly due to increases in employment in the building completion and building installation. The wholesale and retail trade; repair of motor vehicles, motor cycles and personal and household goods; hotels and restaurants industry reported an annual increase of 20 000 employees (1,1%) in June 2016 compared with June 2015. There was a quarterly decrease of 4 000 employees (-0,2%) in June 2016 compared with March 2016. This was mainly due to decreases in employment in hotels and restaurants; and motor trade. The transport, storage and communication industry reported an annual decrease of 8 000 employees (-1,7%) in June 2016 compared with June 2015. There was a quarterly decrease of 7 000 employees (-1,5%) in June 2016 compared with March 2016. This was mainly due to decreases in employment in supporting and auxiliary transport activities and post and telecommunications. The financial intermediation, insurance, real estate and business services industry reported an annual increase of 40 000 employees (1,9%) in June 2016 compared with June 2015. There was a quarterly decrease of 1 000 employees (-0,05%) in June 2016 compared with March 2016. This was mainly due to decreases in financial intermediation (i.e. Banks) except insurance and pension funding; architectural, engineering and other technical activities and real estate activities. The community, social and personal services industry reported an annual increase of 18 000 employees (0,7%) in June 2016 compared with June 2015. There was a quarterly decrease of 48 000 employees (-1,8%) in June 2016 compared with March 2016. This was mainly due to decreases in employment in extra budgetary institutions; national departments and recreational, cultural and sporting activities.

Statistics South Africa P0277
Quarterly employment statistics
9
Detailed changes in gross earnings paid to employees
Gross earnings paid to employees in the mining and quarrying industry reflected an annual increase of R1 610 million (5,9%) in June 2016 compared with June 2015. There was a quarterly increase of R827 million (2,9%) in June 2016 compared with March 2016. See explanatory note on page 26. Gross earnings paid to employees in the manufacturing industry reflected an annual increase of R2 397 million (4,4%) in June 2016 compared with June 2015. There was a quarterly increase of R871 million (1,5%) in June 2016 compared with March 2016. This was mainly due to the increases in gross earnings of basic metals, fabricated metal products, machinery and equipment and office, accounting and computing machinery; electrical machinery and apparatus n.e.c; non-metallic mineral products and transport equipment. Gross earnings paid to employees in the electricity, gas and water supply industry reflected an annual increase of R523 million (8,7%) in June 2016 compared with June 2015. There was a quarterly increase of R45 million (0,7%) in June 2016 compared with March 2016. This was mainly due to the increases in gross earnings of electricity, gas, steam and water supply. Gross earnings paid to employees in the construction industry reflected an annual increase of R416 million (1,9%) in June 2016 compared with June 2015. There was a quarterly increase of R1 170 million (5,5%) in June 2016 compared with March 2016. This was mainly due to the increases in gross earnings of building of complete constructions or parts thereof, civil engineering; building installation and building completion. Gross earnings paid to employees in the wholesale and retail trade; repair of motor vehicles, motor cycles and personal and household goods; hotels and restaurants industry reflected an annual increase of R3 285 million (4,8%) in June 2016 compared with June 2015. There was a quarterly increase of R334 million (0,5%) in June 2016 compared with March 2016. This was mainly due to the increases in gross earnings of retail trade; hotels and restaurants. Gross earnings paid to employees in the transport, storage and communication industry reflected an annual increase of R626 million (2,0%) in June 2016 compared with June 2015. There was a quarterly increase of R1 534 million (5,0%) in June 2016 compared with March 2016. This was mainly due to the increases in gross earnings of post and telecommunications; supporting and auxiliary transport activities; and land transport and transport via pipelines. Gross earnings paid to employees in the financial intermediation, insurance, real estate and business services industry reflected an annual increase of R5 262 (4,3%) in June 2016 compared with June 2015. There was a quarterly decrease of R12 520 million (-8,9%) in June 2016 compared with March 2016. This was mainly due to the decreases in gross earnings of financial intermediation (i.e. Banks) except insurance and pension funding; activities auxiliary to financial intermediation; insurance and pension funding and business activities n.e.c. Gross earnings paid to employees in the community, social and personal services industry reflected an annual increase of R16 543 (10,4%) in June 2016 compared with June 2015. There was a quarterly increase of R7 771 million (4,6%) in June 2016 compared with March 2016. This was mainly due to the increases in gross earnings of provincial departments; national departments; health and social work.

Statistics South Africa P0277
Quarterly employment statistics
10
Part 1 – Estimation of number of employees and their earnings
Table 1 - Total (all formal non-agricultural industries)
1.1 Number of employees
Year and quarter
Number of employees
Change in number of employees
% change in number
of employees
Change in number of employees
% change in number of employees
Quarterly Annual
2015 Jun 9 188 000 - - - - Sep 9 202 000 14 000 0,2 - - Dec 9 288 000 86 000 0,9 - - 2016 Mar* 9 285 000 -3 000 0,0 - -
Jun 9 218 000 -67 000 -0,7 30 000 0,3
*Revised estimates.
1.2 Gross earnings (R'000)
Year and quarter
Gross earnings
Change in gross
earnings
% change in gross earnings
Change in gross
earnings
% change in gross
earnings
Quarterly Annual
2015 Jun 492 681 000 - - - -
Sep 508 738 000 16 057 000 3,3 - -
Dec 545 027 000 36 289 000 7,1 - -
2016 Mar* 523 311 000 -21 716 000 -4,0 - -
Jun 523 343 000 32 000 0,0 30 662 000 6,2
*Revised estimates.
Table 2 - Mining and quarrying industry
2.1 Number of employees
Year and quarter
Number of employees
Change in number of employees
% change in number
of employees
Change in number of employees
% change in number of employees
Quarterly Annual
2015 Jun 489 000 - - - - Sep 476 000 -13 000 -2,7 - - Dec 459 000 -17 000 -3,6 - - 2016 Mar* 458 000 -1 000 -0,2 - -
Jun 457 000 -1 000 -0,2 -32 000 -6,5
*Revised estimates.
2.2 Gross earnings (R'000)
Year and quarter
Gross earnings
Change in gross
earnings
% change in gross earnings
Change in gross
earnings
% change in gross
earnings
Quarterly Annual
2015 Jun 27 465 000 - - - -
Sep 28 908 000 1 443 000 5,3 - -
Dec 29 168 000 260 000 0,9 - -
2016 Mar* 28 248 000 -920 000 -3,2 - -
Jun 29 075 000 827 000 2,9 1 610 000 5,9
*Revised estimates.

Statistics South Africa P0277
Quarterly employment statistics
11
Table 3 - Manufacturing industry
3.1 Number of employees
Year and quarter
Number of employees
Change in number of employees
% change in number of employees
Change in number of employees
% change in number of employees
Quarterly Annual
2015 Jun 1 152 000 - - - - Sep 1 153 000 1 000 0,1 - - Dec 1 149 000 -4 000 -0,3 - - 2016 Mar* 1 143 000 -6 000 -0,5 - -
Jun 1 136 000 -7 000 -0,6 -16 000 -1,4
*Revised estimates.
3.2 Gross earnings (R'000)
Year and quarter
Gross earnings
Change in gross
earnings
% change in gross earnings
Change in gross earnings
% change in gross earnings
Quarterly Annual
2015 Jun 54 698 000 - - - -
Sep 56 527 000 1 829 000 3,3 - -
Dec 62 460 000 5 933 000 10,5 - -
2016 Mar* 56 224 000 -6 236 000 -10,0 - -
Jun 57 095 000 871 000 1,5 2 397 000 4,4
*Revised estimates.
Table 4 - Electricity, gas and water supply industry
4.1 Number of employees
Year and quarter
Number of employees
Change in number of employees
% change in number
of employees
Change in number of employees
% change in number
of employees
Quarterly Annual
2015 Jun 60 000 - - - - Sep 59 000 -1 000 -1,7 - - Dec 60 000 1 000 1,7 - - 2016 Mar* 61 000 1 000 1,7 - -
Jun 61 000 0 0,0 1 000 1,7
*Revised estimates.
4.2 Gross earnings (R'000)
Year and quarter
Gross earnings
Change in gross
earnings
% change in gross earnings
Change in gross
earnings
% change in gross earnings
Quarterly Annual
2015 Jun 6 039 000 - - - -
Sep 6 247 000 208 000 3,4 - -
Dec 7 584 000 1 337 000 21,4 - -
2016 Mar 6 517 000 -1 067 000 -14,1 - -
Jun 6 562 000 45 000 0,7 523 000 8,7

Statistics South Africa P0277
Quarterly employment statistics
12
Table 5 - Construction industry
5.1 Number of employees
Year and quarter
Number of employees
Change in number of employees
% change in number
of employees
Change in number of employees
% change in number of employees
Quarterly Annual
2015 Jun 538 000 - - - - Sep 541 000 3 000 0,6 - - Dec 533 000 -8 000 -1,5 - - 2016 Mar* 544 000 11 000 2,1 - -
Jun 545 000 1 000 0,2 7 000 1,3
*Revised estimates.
5.2 Gross earnings (R'000)
Year and quarter
Gross earnings
Change in gross
earnings
% change in gross earnings
Change in gross
earnings
% change in gross
earnings
Quarterly Annual
2015 Jun 22 060 000 - - - -
Sep 22 423 000 363 000 1,6 - -
Dec 25 221 000 2 798 000 12,5 - -
2016 Mar* 21 306 000 -3 915 000 -15,5 - -
Jun 22 476 000 1 170 000 5,5 416 000 1,9
*Revised estimates.
Table 6 - Wholesale and retail trade; repair of motor vehicles, motor cycles and personal and household goods; hotels and restaurants industry
6.1 Number of employees
Year and quarter
Number of employees
Change in number of employees
% change in number of employees
Change in number of employees
% change in number of employees
Quarterly Annual
2015 Jun 1 891 000 - - - - Sep 1 896 000 5 000 0,3 - - Dec 1 954 000 58 000 3,1 - - 2016 Mar* 1 915 000 -39 000 -2,0 - -
Jun 1 911 000 -4 000 -0,2 20 000 1,1
*Revised estimates.
6.2 Gross earnings (R'000)
Year and quarter
Gross earnings
Change in gross
earnings
% change in gross earnings
Change in gross
earnings
% change in gross earnings
Quarterly Annual
2015 Jun 68 961 000 - - - -
Sep 69 509 000 548 000 0,8 - -
Dec 78 930 000 9 421 000 13,6 - -
2016 Mar* 71 912 000 -7 018 000 -8,9 - -
Jun 72 246 000 334 000 0,5 3 285 000 4,8
*Revised estimates.

Statistics South Africa P0277
Quarterly employment statistics
13
Table 7 - Transport, storage and communication industry
7.1 Number of employees
Year and quarter
Number of employees
Change in number of employees
% change in number
of employees
Change in number of employees
% change in number
of employees
Quarterly Annual
2015 Jun 460 000 - - - - Sep 460 000 0 0,0 - - Dec 461 000 1 000 0,2 - - 2016 Mar* 459 000 -2 000 -0,4 - -
Jun 452 000 -7 000 -1,5 -8 000 -1,7
*Revised estimates.
7.2 Gross earnings (R'000)
Year and quarter
Gross earnings
Change in gross
earnings
% change in gross earnings
Change in gross earnings
% change in gross earnings
Quarterly Annual
2015 Jun 31 344 000 - - - -
Sep 31 647 000 303 000 1,0 - -
Dec 34 003 000 2 356 000 7,4 - -
2016 Mar* 30 436 000 -3 567 000 -10,5 - -
Jun 31 970 000 1 534 000 5,0 626 000 2,0
*Revised estimates.
Table 8 - Financial intermediation, insurance, real estate and business services industry
8.1 Number of employees
Year and quarter
Number of employees
Change in number of employees
% change in number
of employees
Change in number of employees
% change in number of employees
Quarterly Annual
2015 Jun 2 069 000 - - - - Sep 2 083 000 14 000 0,7 - - Dec 2 125 000 42 000 2,0 - - 2016 Mar* 2 110 000 -15 000 -0,7 - -
Jun 2 109 000 -1 000 0,0 40 000 1,9
*Revised estimates.
8.2 Gross earnings (R'000)
Year and quarter
Gross earnings
Change in gross
earnings
% change in gross earnings
Change in gross earnings
% change in gross
earnings
Quarterly Annual
2015 Jun 123 188 000 - - - -
Sep 128 738 000 5 550 000 4,5 - -
Dec 137 372 000 8 634 000 6,7 - -
2016 Mar* 140 970 000 3 598 000 2,6 - -
Jun 128 450 000 -12 520 000 -8,9 5 262 000 4,3
*Revised estimates.

Statistics South Africa P0277
Quarterly employment statistics
14
Table 9 - Community, social and personal services industry
9.1 Number of employees
Year and quarter
Number of employees
Change in number of employees
% change in number of employees
Change in number of employees
% change in number of employees
Quarterly Annual
2015 Jun 2 529 000 - - - - Sep 2 534 000 5 000 0,2 - - Dec 2 547 000 13 000 0,5 - - 2016 Mar* 2 595 000 48 000 1,9 - -
Jun 2 547 000 -48 000 -1,8 18 000 0,7
*Revised estimates.
9.2 Gross earnings (R'000)
Year and quarter
Gross earnings
Change in gross
earnings
% change in gross
earnings
Change in gross
earnings
% change in gross
earnings
Quarterly Annual
2015 Jun 158 926 000 - - - -
Sep 164 739 000 5 813 000 3,7 - -
Dec 170 289 000 5 550 000 3,4 - -
2016 Mar* 167 698 000 -2 591 000 -1,5 - -
Jun 175 469 000 7 771 000 4,6 16 543 000 10,4
*Revised estimates.

Statistics South Africa P0277
Quarterly employment statistics
15
Part 2 – Estimation of average monthly earnings
Table 1 – Average monthly earnings at current prices, by industry
1.1 Total (all formal non-agricultural industries)
Year and month
Including bonuses and overtime
Average monthly earnings (Rand)
Quarterly changes (%) q/q
Annual changes (%) y/y
2015 May 16 787 - - Aug 17 344 3,3 - Nov 17 422 0,4 -
2016 Feb* 17 396 -0,1 - May 18 045 3,7 7,5
*Revised estimates.
1.2 Mining and quarrying industry**
Year and month
Including bonuses and overtime
Average monthly earnings (Rand)
Quarterly changes (%) q/q
Annual changes (%) y/y
2015 May 18 601 - - Aug 20 089 8,0 - Nov 21 009 4,6 -
2016 Feb* 20 212 -3,8 - May 21 954 8,6 18,0
*Revised estimates. **Data obtained from the Department of Mineral Resources (See explanatory notes on page 26). At this stage the Department of Mineral Resources is unable to provide data items with regard to bonuses and overtime payments separately.
1.3 Manufacturing industry
Year and month
Including bonuses and overtime Excluding bonuses and overtime
Average monthly earnings (Rand)
Quarterly changes (%) q/q
Annual changes (%) y/y
Average monthly earnings (Rand)
Quarterly changes (%) q/q
Annual changes (%)
y/y
2015 May 15 302 - - 14 109 - - Aug 15 401 0,6 - 14 448 2,4 - Nov 15 692 1,9 - 14 513 0,4 -
2016 Feb* 15 474 -1,4 - 14 537 0,2 - May 15 920 2,9 4,0 14 857 2,2 5,3
*Revised estimates.
1.4 Electricity, gas and water supply industry
Year and month
Including bonuses and overtime Excluding bonuses and overtime
Average monthly earnings (Rand)
Quarterly changes (%) q/q
Annual changes (%) y/y
Average monthly earnings (Rand)
Quarterly changes (%) q/q
Annual changes (%)
y/y
2015 May 33 382 - - 30 645 - - Aug 34 112 2,2 - 31 828 3,9 - Nov 36 753 7,7 - 34 031 6,9 -
2016 Feb 35 399 -3,7 - 32 711 -3,9 - May 35 695 0,8 6,9 32 926 0,7 7,4

Statistics South Africa P0277
Quarterly employment statistics
16
1.5 Construction industry
Year and month
Including bonuses and overtime Excluding bonuses and overtime
Average monthly earnings (Rand)
Quarterly changes (%) q/q
Annual changes (%) y/y
Average monthly earnings (Rand)
Quarterly changes (%) q/q
Annual changes (%)
y/y
2015 May 13 274 - - 12 674 - - Aug 13 372 0,7 - 12 723 0,4 - Nov 13 529 1,2 - 12 778 0,4 -
2016 Feb* 12 938 -4,4 - 12 297 -3,8 - May 13 215 2,1 -0,4 12 545 2,0 -1,0
*Revised estimates.
1.6 Wholesale and retail trade; repair of motor vehicles, motor cycles, and
personal and household goods; hotels and restaurants industry
Year and month
Including bonuses and overtime Excluding bonuses and overtime
Average monthly earnings (Rand)
Quarterly changes (%) q/q
Annual changes (%) y/y
Average monthly earnings (Rand)
Quarterly changes (%) q/q
Annual changes (%)
y/y
2015 May 11 577 - - 11 245 - - Aug 11 686 0,9 - 11 397 1,4 - Nov 11 591 -0,8 - 11 298 -0,9 -
2016 Feb* 11 681 0,8 - 11 373 0,7 - May 12 058 3,2 4,2 11 696 2,8 4,0
*Revised estimates.
1.7 Transport, storage and communication industry
Year and month
Including bonuses and overtime Excluding bonuses and overtime
Average monthly earnings (Rand)
Quarterly changes (%) q/q
Annual changes (%) y/y
Average monthly earnings (Rand)
Quarterly changes (%) q/q
Annual changes (%)
y/y
2015 May 21 032 - - 19 882 - - Aug 21 402 1,8 - 20 178 1,5 - Nov 21 355 -0,2 - 20 101 -0,4 -
2016 Feb* 21 122 -1,1 - 19 908 -1,0 - May 21 814 3,3 3,7 20 572 3,3 3,5
*Revised estimates.
1.8 Financial intermediation, insurance, real estate and business services industry
Year and month
Including bonuses and overtime Excluding bonuses and overtime
Average monthly earnings (Rand)
Quarterly changes (%) q/q
Annual changes (%) y/y
Average monthly earnings (Rand)
Quarterly changes (%) q/q
Annual changes (%)
y/y
2015 May 18 227 - - 17 802 - - Aug 18 433 1,1 - 18 086 1,6 - Nov 18 485 0,3 - 18 078 0,0 -
2016 Feb* 18 792 1,7 - 18 383 1,7 - May 18 982 1,0 4,1 18 588 1,1 4,4
*Revised estimates.

Statistics South Africa P0277
Quarterly employment statistics
17
1.9 Community, social and personal services industry
Year and month
Including bonuses and overtime Excluding bonuses and overtime
Average monthly earnings (Rand)
Quarterly changes (%) q/q
Annual changes (%) y/y
Average monthly earnings (Rand)
Quarterly changes (%) q/q
Annual changes (%)
y/y
2015 May 19 419 - - 19 028 - - Aug 20 799 7,1 - 20 461 7,5 - Nov 20 777 -0,1 - 20 398 -0,3 -
2016 Feb* 20 759 -0,1 - 20 369 -0,1 - May 22 000 6,0 13,3 21 580 5,9 13,4
*Revised estimates.

Statistics South Africa P0277
Quarterly employment statistics
18
Table 2 – Average monthly earnings at constant prices, by industry
2.1 Total (all formal non-agricultural industries)
Year and month
Including bonuses and overtime
Average monthly earnings (Rand)
Quarterly changes (%)
q/q
Annual changes (%)
y/y
2015 May 14 674 - -
Aug 14 939 1,8 -
Nov 14 955 0,1 -
2016 Feb* 14 582 -2,5 -
May 14 864 1,9 1,3
*Revised estimates.
2.2 Mining and quarrying industry**
Year and month
Including bonuses and overtime
Average monthly earnings (Rand)
Quarterly changes (%)
q/q
Annual changes (%)
y/y
2015 May 16 260 - -
Aug 17 303 6,4 -
Nov 18 033 4,2 -
2016 Feb* 16 942 -6,1 -
May 18 084 6,7 11,2
*Revised estimates. **Data obtained from the Department of Mineral Resources (See explanatory notes on page 26). At this stage the Department of Mineral Resources is unable to provide data items with regard to bonuses and overtime payments separately.
2.3 Manufacturing industry
Year and month
Including bonuses and overtime Excluding bonuses and overtime
Average monthly earnings (Rand)
Quarterly changes (%) q/q
Annual changes (%) y/y
Average monthly earnings (Rand)
Quarterly changes (%) q/q
Annual changes (%) y/y
2015 May 13 376 - - 12 333 - -
Aug 13 265 -0,8 - 12 444 0,9 -
Nov 13 470 1,5 - 12 458 0,1 -
2016 Feb* 12 971 -3,7 - 12 185 -2,2 -
May 13 114 1,1 -2,0 12 238 0,4 -0,8
*Revised estimates.
2.4 Electricity, gas and water supply industry
Year and month
Including bonuses and overtime Excluding bonuses and overtime
Average monthly earnings (Rand)
Quarterly changes (%) q/q
Annual changes (%) y/y
Average monthly earnings (Rand)
Quarterly changes (%) q/q
Annual changes (%) y/y
2015 May 29 180 - - 26 788 - -
Aug 29 382 0,7 - 27 414 2,3 -
Nov 31 548 7,4 - 29 211 6,6 -
2016 Feb 29 672 -5,9 - 27 419 -6,1 -
May 29 403 -0,9 0,8 27 122 -1,1 1,2

Statistics South Africa P0277
Quarterly employment statistics
19
2.5 Construction industry
Year and month
Including bonuses and overtime Excluding bonuses and overtime
Average monthly earnings (Rand)
Quarterly changes (%) q/q
Annual changes (%) y/y
Average monthly earnings (Rand)
Quarterly changes (%) q/q
Annual changes (%) y/y
2015 May 11 603 - - 11 079 - -
Aug 11 518 -0,7 - 10 959 -1,1 -
Nov 11 613 0,8 - 10 968 0,1 -
2016 Feb* 10 845 -6,6 - 10 308 -6,0 -
May 10 886 0,4 -6,2 10 334 0,3 -6,7
*Revised estimates.
2.6 Wholesale and retail trade; repair of motor vehicles, motor cycles and personal
and household goods; hotels and restaurants industry
Year and month
Including bonuses and overtime Excluding bonuses and overtime
Average monthly earnings (Rand)
Quarterly changes (%) q/q
Annual changes (%) y/y
Average monthly earnings (Rand)
Quarterly changes (%) q/q
Annual changes (%) y/y
2015 May 10 120 - - 9 830 - -
Aug 10 065 -0,5 - 9 817 -0,1 -
Nov 9 949 -1,2 - 9 698 -1,2 -
2016 Feb* 9 791 -1,6 - 9 533 -1,7 -
May 9 932 1,4 -1,9 9 634 1,1 -2,0
*Revised estimates.
2.7 Transport, storage and communication industry
Year and month
Including bonuses and overtime Excluding bonuses and overtime
Average monthly earnings (Rand)
Quarterly changes (%) q/q
Annual changes (%) y/y
Average monthly earnings (Rand)
Quarterly changes (%) q/q
Annual changes (%)
y/y
2015 May 18 385 - - 17 379 - -
Aug 18 434 0,3 - 17 380 0,0 -
Nov 18 330 -0,6 - 17 254 -0,7 -
2016 Feb* 17 705 -3,4 - 16 687 -3,3 -
May 17 969 1,5 -2,3 16 946 1,6 -2,5
*Revised estimates.
2.8 Financial intermediation, insurance, real estate and business services industry
Year and month
Including bonuses and overtime Excluding bonuses and overtime
Average monthly earnings (Rand)
Quarterly changes (%) q/q
Annual changes (%) y/y
Average monthly earnings (Rand)
Quarterly changes (%) q/q
Annual changes (%)
y/y
2015 May 15 933 - - 15 561 - -
Aug 15 877 -0,4 - 15 578 0,1 -
Nov 15 867 -0,1 - 15 518 -0,4 -
2016 Feb* 15 752 -0,7 - 15 409 -0,7 -
May 15 636 -0,7 -1,9 15 311 -0,6 -1,6
*Revised estimates.
Statistics South Africa P0277
Quarterly employment statistics
20
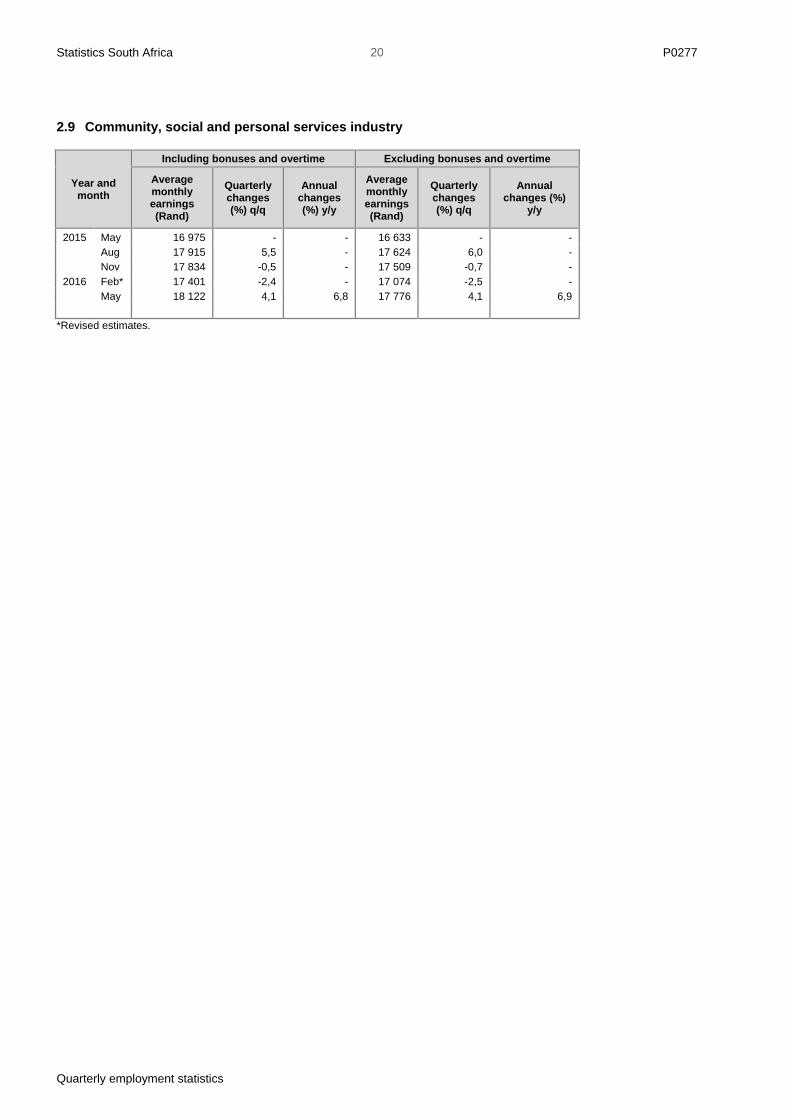
2.9 Community, social and personal services industry
Year and month
Including bonuses and overtime Excluding bonuses and overtime
Average monthly earnings (Rand)
Quarterly changes (%) q/q
Annual changes (%) y/y
Average monthly earnings (Rand)
Quarterly changes (%) q/q
Annual changes (%)
y/y
2015 May 16 975 - - 16 633 - -
Aug 17 915 5,5 - 17 624 6,0 -
Nov 17 834 -0,5 - 17 509 -0,7 -
2016 Feb* 17 401 -2,4 - 17 074 -2,5 -
May 18 122 4,1 6,8 17 776 4,1 6,9
*Revised estimates.

Statistics South Africa P0277
Quarterly employment statistics
21
Additional information
Technical notes
1. Confidence
intervals The estimated population value will be contained within the interval between the lower and upper 95% confidence limits. The 95% confidence intervals of a population parameter (gross salaries and wages) are obtained as follows: Lower limit = lower 95% confidence limit of a population parameter = estimate – 1,96*Standard Error (estimate) and Upper limit = upper 95% confidence limit of a population parameter = estimate + 1,96*Standard Error (estimate)
1.1 Standard Error (SE) = 𝑢𝑝𝑝𝑒𝑟 𝑙𝑖𝑚𝑖𝑡−𝑙𝑜𝑤𝑒𝑟 𝑙𝑖𝑚𝑖𝑡
2 𝑥 1,96
1.2 Relative Standard Error (RSE) = 𝑆𝐸 (𝑒𝑠𝑡𝑖𝑚𝑎𝑡𝑒)
𝑒𝑠𝑡𝑖𝑚𝑎𝑡𝑒× 100

Statistics South Africa P0277
Quarterly employment statistics
22
Table D: Estimates of number of employees by industry within 95% confidence limits
Industry
Quarter ended March* 2016 Quarter ended June 2016
RSE Lower limit Estimate Upper limit RSE
Lower limit Estimate Upper limit
Mining and quarrying** 0,0 457 860 457 860 457 860 0,0 457 309 457 309 457 309
Manufacturing 0,4 1 133 091 1 143 165 1 153 239 0,5 1 125 358 1 136 463 1 147 567
Electricity, gas and water supply 0,6 60 200 60 900 61 599 0,6 59 912 60 616 61 320
Construction 1,6 527 171 543 850 560 529 1,5 528 436 544 970 561 504
Wholesale and retail; repair of motor vehicles, motor cycles and personal and household goods; hotels and restaurants 0,6 1 890 814 1 914 909 1 939 003 0,7 1 885 133 1 910 878 1 936 622
Transport, storage and communication 1,1 449 059 458 760 468 460 1,2 441 236 452 002 462 768
Financial intermediation, insurance, real estate and business services 1,1 2 065 258 2 109 724 2 154 189 1,1 2 062 548 2 108 726 2 154 905
Community, social and personal services 0,3 2 581 756 2 595 079 2 608 402 0,3 2 533 003 2 546 833 2 560 664
Total 0,3 9 229 284 9 284 246 9 339 208 0,3 9 160 054 9 217 797 9 275 541
*Revised estimates. **Data obtained from the Department of Mineral Resources (See explanatory notes on page 26).
Table E: Estimates of gross earnings (R' 000) by industry within 95% confidence limits
Industry
Quarter ended March* 2016 Quarter ended June 2016
RSE Lower limit Estimate Upper limit RSE Lower limit Estimate Upper limit
Mining and quarrying** 0,0 28 248 205 28 248 205 28 248 205 0,0 29 074 573 29 074 573 29 074 573
Manufacturing 0,6 55 556 622 56 223 883 56 891 145 0,6 56 403 777 57 094 489 57 785 201
Electricity, gas and water supply 0,5 6 450 702 6 517 207 6 583 712 0,7 6 473 774 6 561 727 6 649 681
Construction 2,0 20 460 680 21 306 421 22 152 163 2,0 21 573 265 22 475 802 23 378 339
Wholesale and retail; repair of motor vehicles, motor cycles and personal and household goods; hotels and restaurants 1,4 69 966 631 71 912 364 73 858 097 1,2 70 496 626 72 245 539 73 994 452
Transport, storage and communication 1,6 29 489 449 30 435 544 31 381 639 1,5 31 031 973 31 969 491 32 907 010
Financial intermediation, insurance, real estate and business services 2,4 134 357 512 140 969 584 147 581 656 1,9 123 752 715 128 449 149 133 145 582
Community, social and personal services 0,7 165 357 206 167 697 860 170 038 514 0,7 173 024 682 175 468 977 177 913 271
Total 0,7 515 927 944 523 311 068 530 694 192 0,6 517 605 555 523 339 747 529 073 938
*Revised estimates. **Data obtained from the Department of Mineral Resources (See explanatory notes on page 26).

Statistics South Africa P0277
Quarterly employment statistics
23
Table F: Estimates of average monthly earnings, including bonuses and overtime payments, at current prices, by industry within 95% confidence limits
Industry Feb* 2016 May 2016
RSE Lower limit Estimate Upper limit RSE Lower limit Estimate Upper limit
Mining and quarrying** 0,0 20 212 20 212 20 212 0,0 21 954 21 954 21 954
Manufacturing 0,7 15 262 15 474 15 682 0,8 15 661 15 920 16 179
Electricity, gas and water supply 0,6 34 968 35 399 35 830 0,7 35 213 35 695 36 177
Construction 2,4 12 322 12 938 13 554 2,5 12 579 13 215 13 851
Wholesale and retail; repair of motor vehicles, motor cycles and personal and household goods; hotels and restaurants 1,3 11 378 11 681 11 983 1,4 11 728 12 058 12 388
Transport, storage and communication 1,7 20 425 21 122 21 819 1,7 21 082 21 814 22 546
Financial intermediation, insurance, real estate and business services 1,9 18 083 18 792 19 501 1,9 18 262 18 982 19 702
Community, social and personal services 0,8 20 443 20 759 21 075 0,8 21 668 22 000 22 332
Total 0,6 17 193 17 396 17 598 0,6 17 834 18 045 18 256
*Revised estimates. **Data obtained from the Department of Mineral Resources (See explanatory notes on page 26).
Table G: Estimates of average monthly earnings, excluding bonuses and overtime payments, at current prices, by industry within 95% confidence limits
Industry Feb* 2016 May 2016
RSE Lower limit Estimate Upper limit RSE Lower limit Estimate Upper limit
Mining and quarrying - - - - - - - - Manufacturing 0,7 14 332 14 537 14 742 0,8 14 612 14 857 15 102
Electricity, gas and water supply 0,6 32 312 32 711 33 110 0,7 32 473 32 926 33 379
Construction 2,5 11 703 12 297 12 891 2,5 11 931 12 545 13 159
Wholesale and retail; repair of motor vehicles, motor cycles and personal and household goods; hotels and restaurants 1,3 11 075 11 373 11 671 1,4 11 371 11 696 12 021
Transport, storage and communication 1,7 19 235 19 908 20 581 1,7 19 882 20 572 21 262
Financial intermediation, insurance, real estate and business services 1,9 17 688 18 383 19 078 2,0 17 873 18 588 19 303
Community, social and personal services 0,7 20 071 20 369 20 667 0,8 21 261 21 580 21 899
*Revised estimates. **Data obtained from the Department of Mineral Resources (See explanatory notes on page 26). At this stage the Department of Mineral Resources is unable to provide data items with regard to bonuses and overtime payments separately.
STATISTICS SOUTH AFRICA 24 P0277
Quarterly employment statistics
Explanatory notes
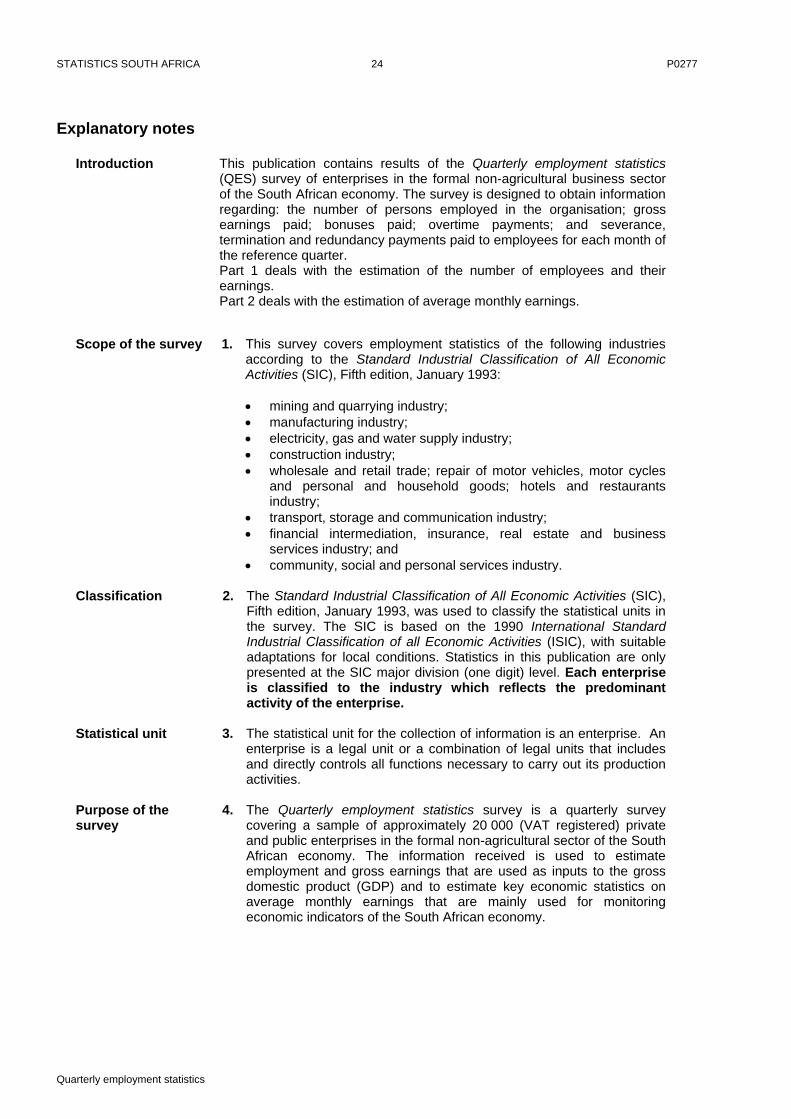
Introduction This publication contains results of the Quarterly employment statistics (QES) survey of enterprises in the formal non-agricultural business sector of the South African economy. The survey is designed to obtain information regarding: the number of persons employed in the organisation; gross earnings paid; bonuses paid; overtime payments; and severance, termination and redundancy payments paid to employees for each month of the reference quarter. Part 1 deals with the estimation of the number of employees and their earnings. Part 2 deals with the estimation of average monthly earnings.
Scope of the survey 1. This survey covers employment statistics of the following industries according to the Standard Industrial Classification of All Economic Activities (SIC), Fifth edition, January 1993:
mining and quarrying industry;
manufacturing industry;
electricity, gas and water supply industry;
construction industry;
wholesale and retail trade; repair of motor vehicles, motor cycles and personal and household goods; hotels and restaurants industry;
transport, storage and communication industry;
financial intermediation, insurance, real estate and business services industry; and
community, social and personal services industry.
Classification 2. The Standard Industrial Classification of All Economic Activities (SIC), Fifth edition, January 1993, was used to classify the statistical units in the survey. The SIC is based on the 1990 International Standard Industrial Classification of all Economic Activities (ISIC), with suitable adaptations for local conditions. Statistics in this publication are only presented at the SIC major division (one digit) level. Each enterprise is classified to the industry which reflects the predominant activity of the enterprise.
Statistical unit 3. The statistical unit for the collection of information is an enterprise. An
enterprise is a legal unit or a combination of legal units that includes and directly controls all functions necessary to carry out its production activities.
Purpose of the survey
4. The Quarterly employment statistics survey is a quarterly survey covering a sample of approximately 20 000 (VAT registered) private and public enterprises in the formal non-agricultural sector of the South African economy. The information received is used to estimate employment and gross earnings that are used as inputs to the gross domestic product (GDP) and to estimate key economic statistics on average monthly earnings that are mainly used for monitoring economic indicators of the South African economy.

STATISTICS SOUTH AFRICA 25 P0277
Quarterly employment statistics
Mining 5. Stats SA receives information regarding the mining and quarrying industry from the Department of Mineral Resources. The information for the latest quarter is preliminary and will be revised by the Minerals Bureau as soon as they receive more information from the different mines. Users must take note that gross earnings estimates based on the 2015 sample exclude severance, termination and redundancy payments paid during the reference quarter.
Notes on estimates 6. Average monthly earnings statistics represent average gross (before tax) earnings of employees and do not relate to the earnings of the ‘average’ person. Estimates of average monthly earnings are derived by dividing estimates of monthly total earnings by estimates of number of employees. Changes in the average may be affected not only by changes in the level of earnings of employees but also by changes in the overall composition of the wage and salary earner segment of the labour force. There are several aspects which can contribute to compositional changes, including variations over time in the proportions of full-time, part-time and casual employees.
Reliability of estimates
7. Inaccuracies may occur because of imperfections in reporting by enterprises and errors made with the collection and processing of the data. Inaccuracies of this kind are referred to as non-sampling errors. Every effort is made to reduce non-sampling errors to a minimum by designing the questionnaire carefully, undertaking pilot studies, editing the data and efficient operating procedures. Fluctuations may occur in consecutive quarters as a result of seasonal and economic factors.
Standard errors 8. The estimates in this publication are based on a sample drawn from
units in the surveyed population. As a result of the entire population not being surveyed, the published estimates are subject to sampling error. The most common way of quantifying such sampling error is to calculate the standard error for the published estimates or statistics.
Effects of rounding
9. (a) Estimates of average monthly earnings are rounded to the nearest rand. Percentage changes are calculated on the actual values and may differ from calculations on rounded estimates. The sum of the rounded industry estimates do not necessarily add up to the total.
(b) Estimates of employment are rounded to the nearest thousand, while earnings are rounded to the nearest million. Percentage changes are calculated on the actual values and may differ from calculations on rounded estimates. The sum of the rounded industry estimates do not necessarily add to the total.
Revised figures 10. Figures for the quarters published in this release are preliminary and
may be revised in subsequent publications.

STATISTICS SOUTH AFRICA 26 P0277
Quarterly employment statistics
Related publications 11. Users may also wish to refer to the following publications which are available from Stats SA:
Bulletin of Statistics(discontinued)
Quarterly Labour Force Survey
South African Statistics (discontinued).
Pre-release policy
12. Stats SA’s pre-release policy may be inspected at its website, www.statssa.gov.za
Response rate 13. The response rate for the quarter ended June 2016 was 91,1%.
Abbreviations and symbols
BSF DMR GDP IBR ILO IT QLFS QES RSE SARS SE SEE SIC SNA Stats SA VAT n.e.c -
Business Sampling Frame Department of Mineral Resources Gross Domestic Product Integrated Business Register International Labour Organisation Income Tax Quarterly Labour Force Survey Quarterly Employment Statistics Relative Standard Error South African Revenue Service Standard Error Survey of Employment and Earnings Standard Industrial Classification of all Economic Activities System of National Accounts Statistics South Africa Value added-Tax Not elsewhere classified Not available

STATISTICS SOUTH AFRICA 27 P0277
Quarterly employment statistics
Glossary
Annual percentage change An annual percentage change is the change in the employment, the gross earnings or the average monthly earnings of the given period compared with the employment, the gross earnings or the average monthly earnings of the corresponding period of the previous year expressed as a percentage.
Average monthly earnings at constant 2012 prices
Average monthly earnings at constant 2012 prices measure average monthly earnings after the direct effects of inflation have been eliminated. The deflator used to deflate the current average earnings is the consumer price index (December 2012=100).
Average monthly earnings at current prices
Average monthly earnings at current prices are calculated by dividing the total gross earnings, excluding severance, termination and redundancy payments, for the reference month by the number of employees as at the end of the reference month.
Casual employees Casual employees are employees who fall neither within the
‘permanent employee’ category nor within that of a ‘temporary employee’. Such employees are typically working daily or hourly. Employers can dispense with their services at a very short notice, usually not exceeding a period of one week. Casual employees are not entitled to benefits such as paid leave and medical aid contributions paid by employers. Casual employees can be part-time or full time.
Enterprises Enterprises are legal units, or a combination of legal units, that
include and directly control all functions necessary to carry out their production activities.
Formal sector The formal sector includes all businesses that are registered in any
way.
Full-time employees Full-time employees are those permanent, temporary and casual employees who normally work the agreed number of hours in their particular occupation or, if the agreed number of hours does not apply, who normally work 40 hours or more per week. This excludes the self-employed and working proprietors. (Refer to notes on number of employees below.)
Gross earnings Gross earnings are payments for ordinary-time, standard or agreed
hours during the reference period for all permanent, temporary, casual, managerial and executive employees before taxation and other deductions for the reference period. This includes salaries and wages; commission if a retainer, wage or salary was also paid; employer’s contribution to pension, provident, medical aid, sick pay and other funds; allowances; etc., but excludes earnings of sole proprietors or partners of unincorporated businesses; commission where a retainer, wage or salary was not paid; payments to subcontractors and consultants who are not part of the enterprise; and severance, termination and redundancy payments. Gross earnings are the total sum of the earnings including performance and others bonuses; overtime payments for the three months of the reference quarter (e.g. gross earnings of quarter ended September is the sum of total earnings of July, August and September).

STATISTICS SOUTH AFRICA 28 P0277
Quarterly employment statistics
Industries Industries consist of groups of enterprises engaged in the same or similar kind of activity. The definition of industries is based on the System of National Accounts (SNA) and is in line with that in the Standard Industrial Classification of all Economic Activities (SIC), Fifth Edition, and Report No. 09-09-02 of January 1993.
Informal sector The informal sector consists of those organisations that are not
registered in any way. They are generally small in nature, and are seldom run from business premises. Instead, they are generally run from homes, street pavements and other informal arrangements.
Number of employees
The number of employees is the number of people employed by the organisation who received payment (in salaries; wages; commission, in addition to a retainer, salary or wage; piece rates; or payments in kind) for any part of the reference period. This excludes independent contractors and consultants; working proprietors; sole and joint owners; and employees paid on a commission basis where a retainer, salary or wage was not paid. The number of employees refers to the number of people employed at the end of the reference period (see Reference quarter/month/period below).
Ordinary-time hours Ordinary-time hours are those hours actually worked during normal
periods of work. These hours include hours of paid leave taken during the reference period (e.g. sick leave, annual leave) and hours of normal shift work. Ordinary-time hours paid for exclude overtime hours worked, hours relating to payment in advance and hours relating to back pay.
Overtime hours paid for Overtime hours paid for are those hours worked in excess of
ordinary-time hours, standard or agreed hours of work that were paid for in the reference period.
Overtime payments Overtime payments refer to payment for hours worked and paid for in
excess of ordinary-time hours, standard or agreed hours worked for the reference period. Penalty payments that relate to overtime are also included.
Part-time employees Part-time employees are those permanent, temporary or casual
employees who are not full-time employees as defined above or who normally work less than 40 hours per week. This excludes the self-employed at work or with an enterprise but temporarily not at work.
Performance and other bonuses
Performance and other bonuses cover seasonal, end-of-year and one-time bonuses and additional payments supplementary to normal payments. Performance and other bonuses include profit-sharing bonuses, merit bonuses, incentive bonuses, total amounts of payments that were paid during the reference period but relate to other pay periods, e.g. annual leave, thirteenth cheques. Performance and other bonuses exclude reimbursements for expenses incurred whilst conducting employer’s business; severance, termination and redundancy payments.
Permanent employees Permanent employees are employees appointed on an open-ended
contract with no stipulated termination date, and who are entitled to benefits such as paid leave and medical aid contributions paid by employers. This excludes the self-employed at work.

STATISTICS SOUTH AFRICA 29 P0277
Quarterly employment statistics
Quarterly percentage change
A quarterly percentage change is the change in the employment, the gross earnings or the average monthly earnings of the given quarter/month compared with the employment, the gross earnings or the average monthly earnings of the previous quarter/month expressed as a percentage.
Reference quarter/month/period
Reference quarter/period in part 1 of this publication refers to the three months up to the end of March, June, September or December. Reference month/period in part 2 of this publication refers to the months of February, May, August or November.
Severance, termination and redundancy payments
Severance, termination and redundancy payments include payments of accumulated leave made to employees who finished work during the reference period as well as payments intended to compensate for loss of employment.
Temporary employees Temporary employees are employees appointed on a short-term
contract basis for periods normally not exceeding one year. Such contracts would typically stipulate a termination date, but could be renewed by mutual agreement between the employer and the employee. This excludes the self-employed with an enterprise but temporarily not at work.

STATISTICS SOUTH AFRICA 30 P0277
Quarterly employment statistics
General information
Stats SA publishes approximately 300 different releases each year. It is not economically viable to produce them in more than one of South Africa’s eleven official languages. Since the releases are used extensively, not only locally but also by international economic and social- scientific communities, Stats SA releases are published in English only. Stats SA has copyright on this publication. Users may apply the information as they wish, provided that they acknowledge Stats SA as the source of the basic data wherever they process, apply, utilise, publish or distribute the data; and also that they specify that the relevant application and analysis (where applicable), result from their own processing of the data. Stats SA products A complete set of Stats SA publications is available at the Stats SA Library and the following public libraries: National Library of South Africa, Pretoria Division National Library of South Africa, Cape Town Division Natal Society Library, Pietermaritzburg Library of Parliament, Cape Town Bloemfontein Public Library Johannesburg Public Library Eastern Cape Library Services, King William’s Town Central Regional Library, Polokwane Central Reference Library, Mbombela Central Reference Collection,Kimberly Central Reference Library, Mmabatho Stats SA also provides a subscription service Electronic services A large range of data is available via online services, CD and computer printouts. For more details about our electronic data services, contact (012) 310 8600 /8390 /8351 /4892 /8496 /8095. You can visit us on the Internet at: www.statssa.gov.za
Enquiries Telephone number:
(012) 310 8095 /8390 /8351 /8600 /8496 /4892 (user information services) (012) 310 2153 /8278 (survey areas) (012) 310 2153 (technical enquiries) (012) 310 8161 (orders) (012) 310 4883 /4885 / 8018 (library)
Fax number:
(012) 310 8648 (technical enquiries)
Email:
[email protected] (technical enquiries) [email protected] (user information services)
Postal address: Private Bag X44, Pretoria, 0001
Produced by Statistics South Africa