Dunia Wahyu World_ Spektroskopi S erapan Atom (Atomic Absorption Spectroscopy _ AAS).pdf
Upload
dallas-stanageCategory
view
224download
3
qu
an
tum
p
hysi
cs
le
sso
n 2
Th
e A
tom

spectroscopy1860 - 1900

All objects emit electromagnetic waves. For a solid object, such as the hot filament of a light bulb, these
waves have a continuous range of wavelengths, some of which are in the visible spectrum. The continuous
range of wavelengths is a result of the entire collection of atoms that make up the solid.

In contrast, individual atoms, free of the strong interactions that are present in a solid, emit only certain
specific wavelengths that are unique to those atoms.
Li Na K

Absorption Spectrum• To study the behaviour of individual atoms, low-pressure
gases are used in which the atoms are relatively far apart. • A source of radiation that contains all wavelengths is
passed through the sample of gas and the resultant spectrum is examined .
• The gas absorbs some of the wavelengths of the light source. The observed spectrum, therefore, has lines missing which correspond to the absorbed wavelengths.
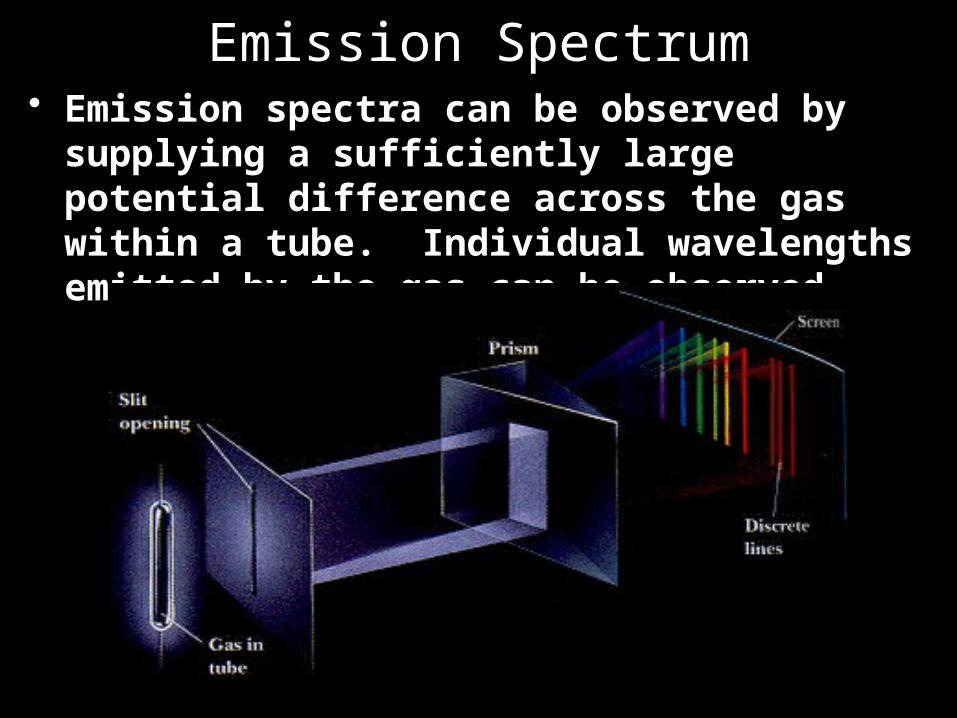
Emission Spectrum• Emission spectra can be observed by
supplying a sufficiently large potential difference across the gas within a tube. Individual wavelengths emitted by the gas can be observed.

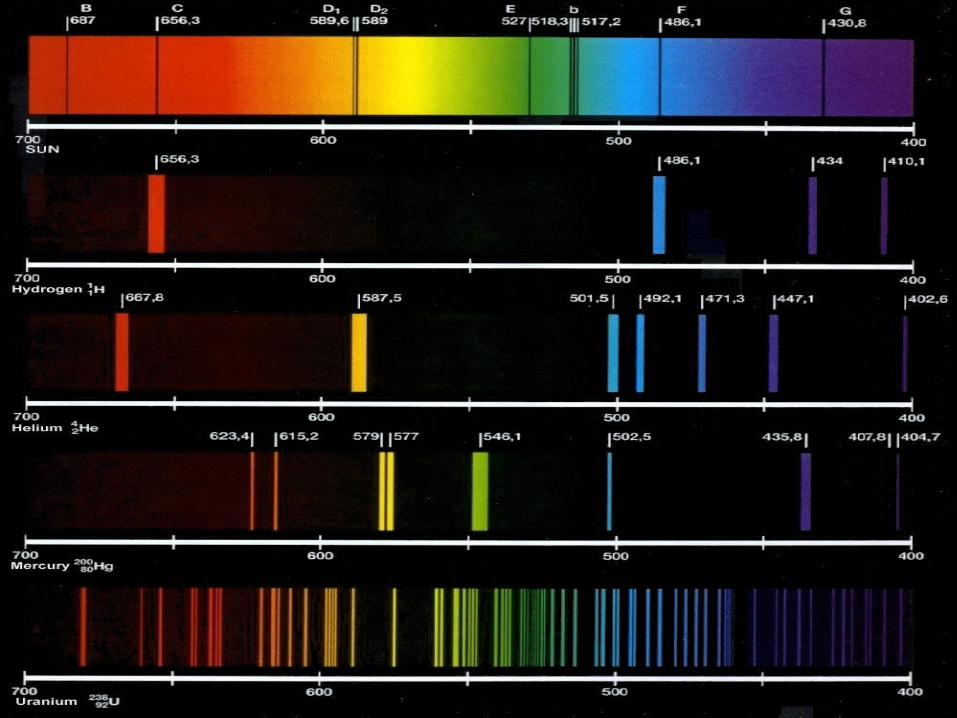
Absorption and emission spectra for the same gas
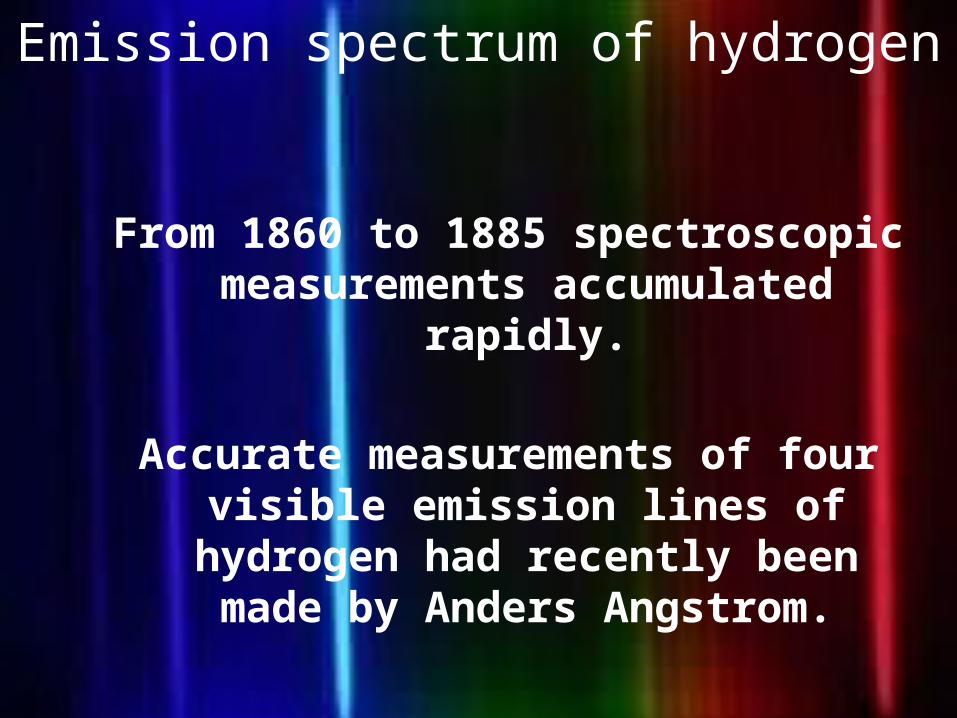
Emission spectrum of hydrogen
From 1860 to 1885 spectroscopic measurements accumulated rapidly.
Accurate measurements of four visible emission lines of hydrogen had recently been made by Anders
Angstrom.
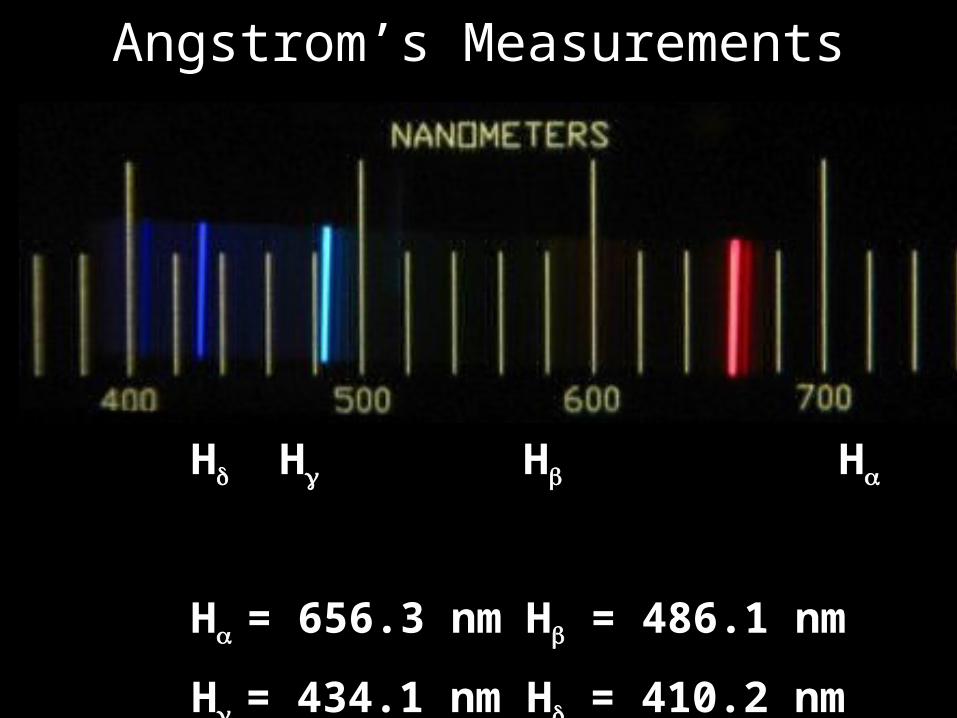
Angstrom’s MeasurementsH
H H H H
H = 656.3 nm H = 486.1 nm
H = 434.1 nm H = 410.2 nm

Balmer Series
• By trial and error a Swiss
school teacher, Johann Balmer,
found a formula which correctly
predicted the wavelengths of
Angstrom’s four visible lines.• Balmer gave his formula in the form:
• Where C2 = 3645.6 x 108 cm and is known as the convergence limit.
2
2 2 2 (cm) n = 3, 4, 5, ...
2
nC
n
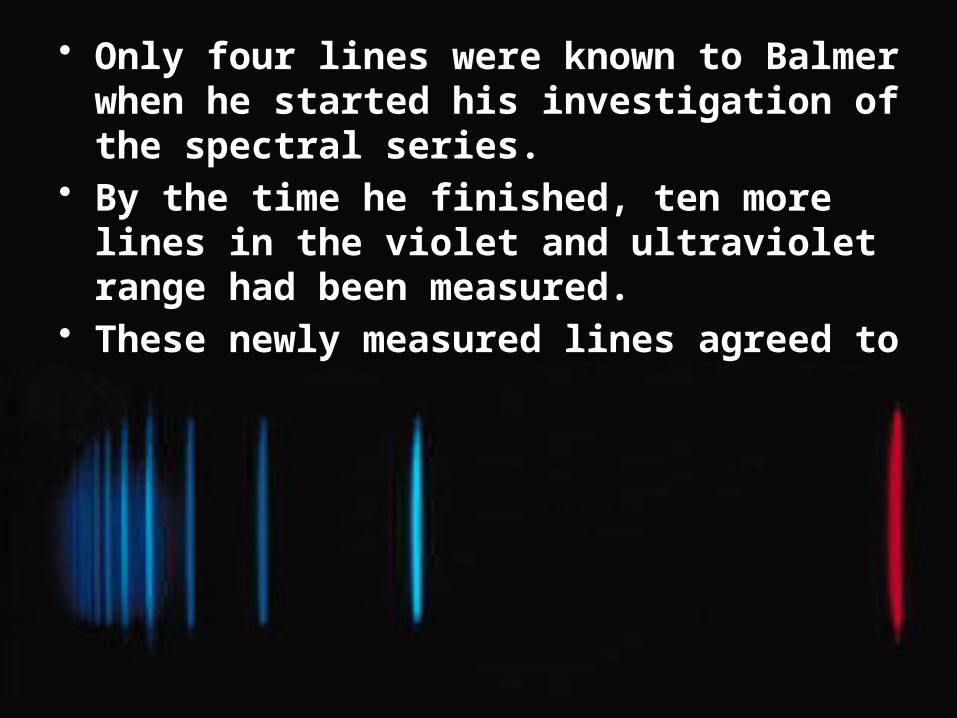
• Only four lines were known to Balmer when he started his investigation of the spectral series.
• By the time he finished, ten more lines in the violet and ultraviolet range had been measured.
• These newly measured lines agreed to the empirical formula to within 0.1%!

Encouraged by his success, Balmer speculated that other hydrogen series might exist of the form:
2
2 2 2 (cm)
3
nC
n
2
2 2 2 (cm)
4
nC
n
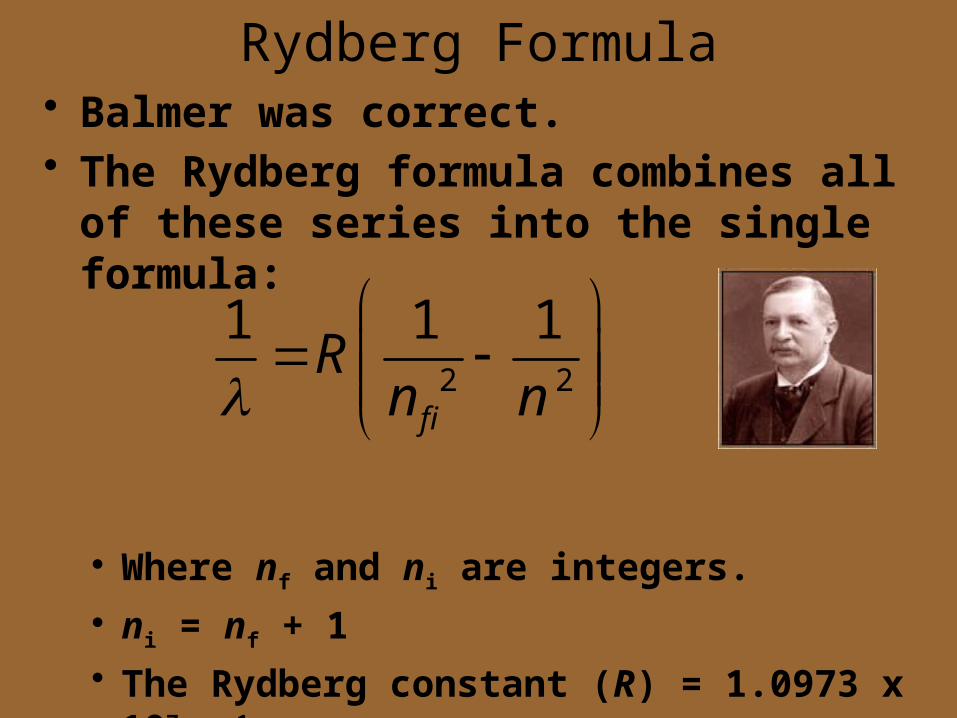
Rydberg Formula• Balmer was correct.• The Rydberg formula combines all of
these series into the single formula:
• Where nf and ni are integers.
• ni = nf + 1
• The Rydberg constant (R) = 1.0973 x 10⁷ m-1
2 2
1 1 1
f i
Rn n

Spectral series for Hydrogen

Limitations of Rutherford’s Model1913

1. Only accounts for half of the nuclear mass.
Rutherford had no precise answer to this question. He speculated that the difference between the mass of the protons and the mass of the nucleus could be accounted for by groupings of neutral particles, each consisting of a bound electron-proton pair.
This theory held appeal as it built the atom out of the known fundamental particles at the time.

2. What keeps the protons confined in such a small space.
Rutherford thought that “The nucleus although of minute dimensions, is in itself a very complex system consisting of positively and negatively charged bodies bound closely by intense electrical forces.”
It was not until 1921 that it was clearly recognised that the electrostatic force did not hold the nucleus together and that a totally new force, the strong nuclear force, bound the protons together.
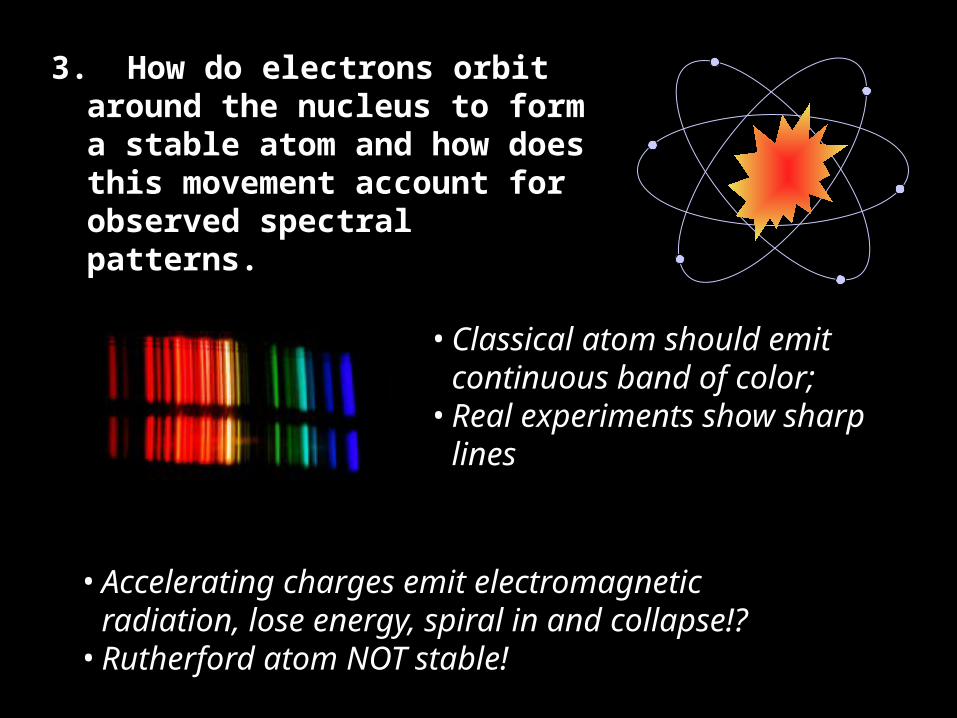
3. How do electrons orbit around the nucleus to form a stable atom and how does this movement account for observed spectral patterns.
• Accelerating charges emit electromagnetic radiation, lose energy, spiral in and collapse!?
• Rutherford atom NOT stable!
• Classical atom should emit continuous band of color;
• Real experiments show sharp lines
Bohr’s Model1913
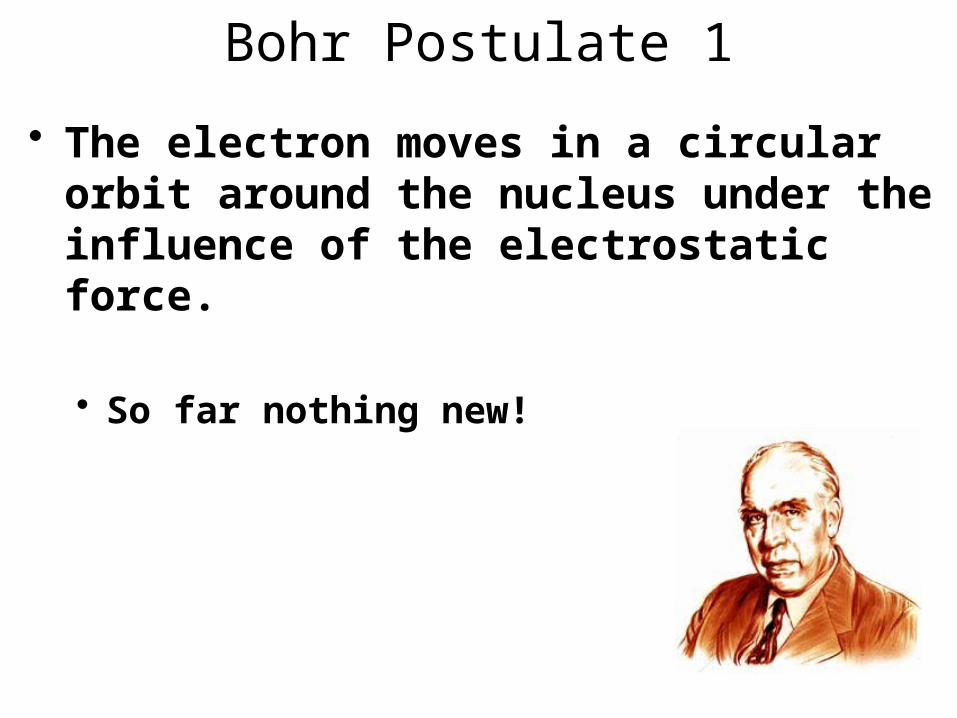
Bohr Postulate 1
• The electron moves in a circular orbit around the nucleus under the influence of the electrostatic force.
• So far nothing new!

Bohr Postulate 2• Only certain orbits are stable.
• These are the orbits in which the electron does not radiate.
• Energy is fixed and stationary.• Classical mechanics may be used to describe
the electron’s motion in these
stable orbits.

Bohr Postulate 3
Radiation is emitted or absorbed if an electron moves between energy levels.
Radiation is released in the form of a photon. The frequency of the photon emitted is related to the difference in the energy levels according to the Planck-Einstein formula:
i fE E hf

Bohr Postulate 4• The size of the stable orbits are determined
by imposing a further quantum constraint on the angular momentum of the electrons.
where 2
eL m vr n
h

Allowed energy orbits
The total energy of the orbit it a combination of the electron’s kinetic energy and electric potential energy.
221
2
K P
e
E E E
kem v
r
(1)
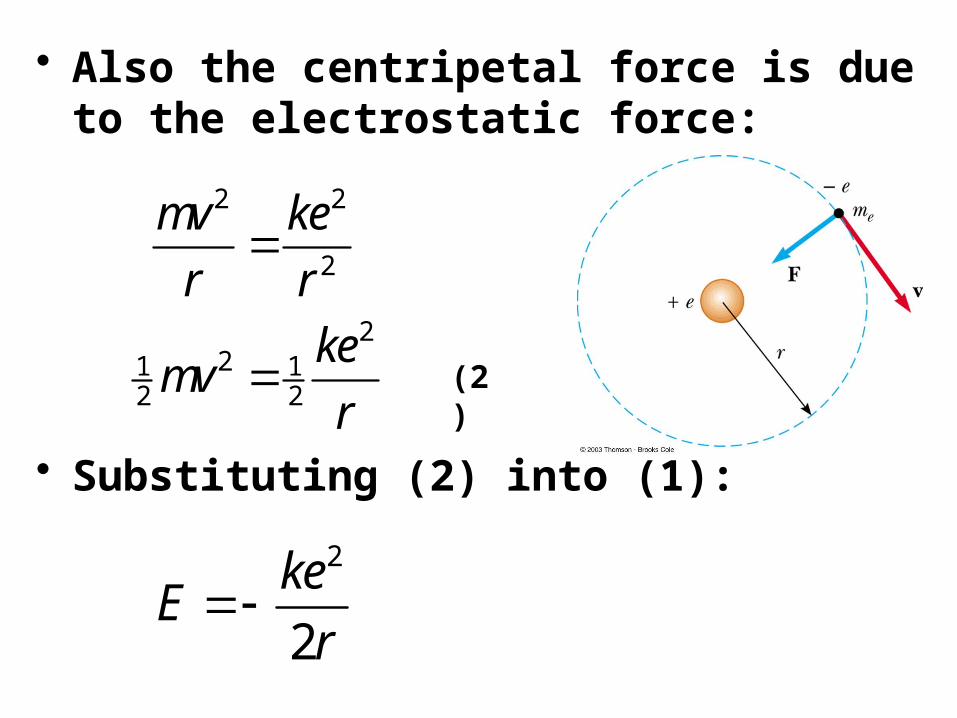
• Also the centripetal force is due to the electrostatic force:
• Substituting (2) into (1):
2 2
2
221 1
2 2
mv ke
r r
kemv
r
(2)
2
2
keE
r

Radius of electron orbit• Take postulate 4, solve for v, and square.
• Take (2) and solve for v2.
2 22
2 2
e
e
nvm r
nv
m r
22
e
kev
m r (4)
(3)

• Equating (3) and (4) gives:
• The smallest radius, when n = 1, is known as the Bohr radius (a0).
2 2
2 = 1, 2, 3, ...n
e
nr n
m ke
2
0 20.0529 nm
e
am ke
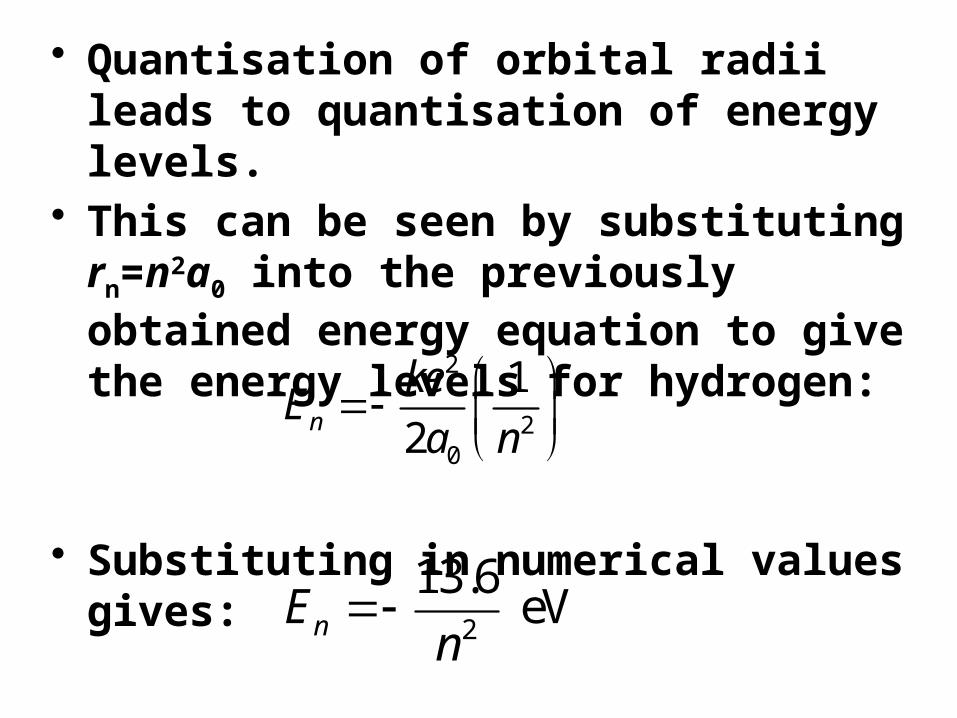
• Quantisation of orbital radii leads to quantisation of energy levels.
• This can be seen by substituting rn=n2a0 into the previously obtained energy equation to give the energy levels for hydrogen:
• Substituting in numerical values gives:
2
20
1
2n
keE
a n
2
13.6 eVnE n

Quantum Numbers• The integers n are called quantum numbers.• The lowest stable state has quantum number n =
1, with energy E1 = -13.6 eV
• The next state, or first excited state, has quantum number n = 2, with energy E2 = -3.4 eV
• At r = infinity, n = infinity and E = 0. This is the point at which the electron has been removed from the atom and is motionless. The energy required to do this is known as the ionization energy and is equal to 13.6 eV for Hydrogen.
• This was a major achievement for the Bohr model as the ionization energy for Hydrogen was already known to be exactly 13.6 eV.

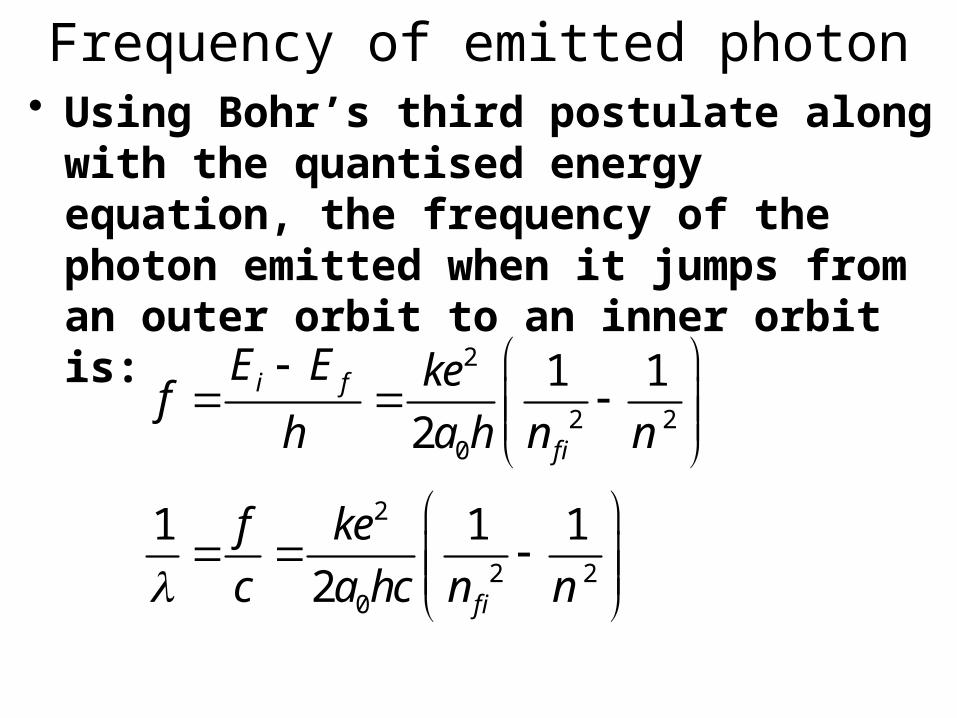
Frequency of emitted photon• Using Bohr’s third postulate along with the
quantised energy equation, the frequency of the photon emitted when it jumps from an outer orbit to an inner orbit is:
2
2 20
2
2 20
1 1
2
1 1 1
2
i f
f i
f i
E E kef
h a h n n
f ke
c a hc n n

Comparison to Rydberg equation• The theoretical equation just derived is in
fact identical to the empirical Rydberg equation, provided that:
• Bohr demonstrated agreement of these two quantities to a precision of about 1% and regarded the crowning achievement of his quantum theory of hydrogen.
2
02
keR
a hc
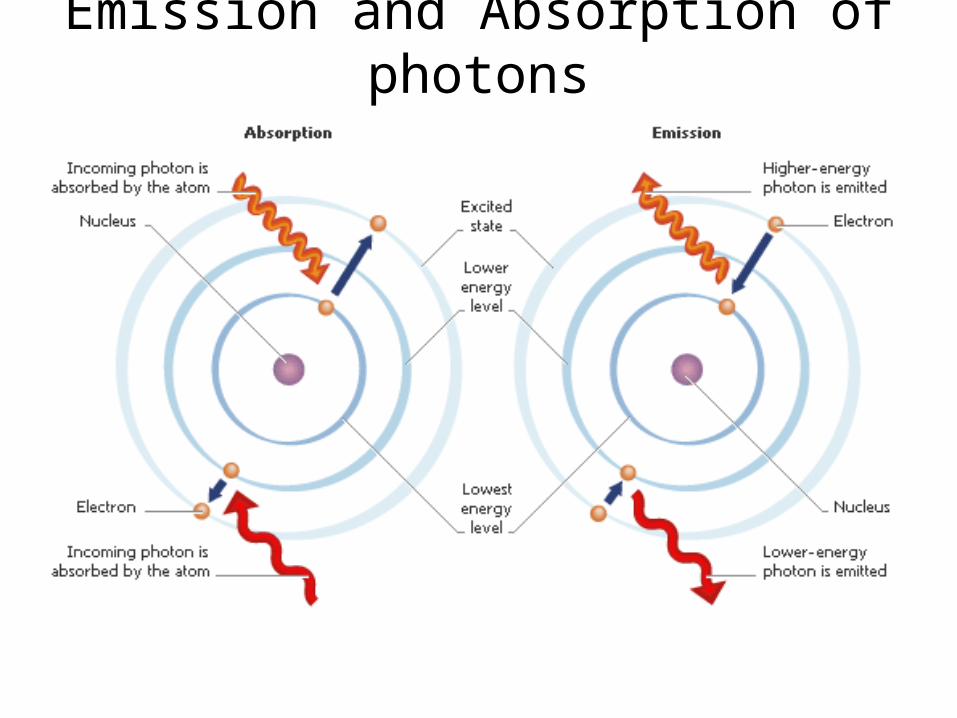
Emission and Absorption of photons


Energy Level Diagram for Hydrogen
Emission
Absorption
Ionisation

This explains why some nebulae are red or pink in colour
One of the possible photon emissionscorresponds to the emission of red light
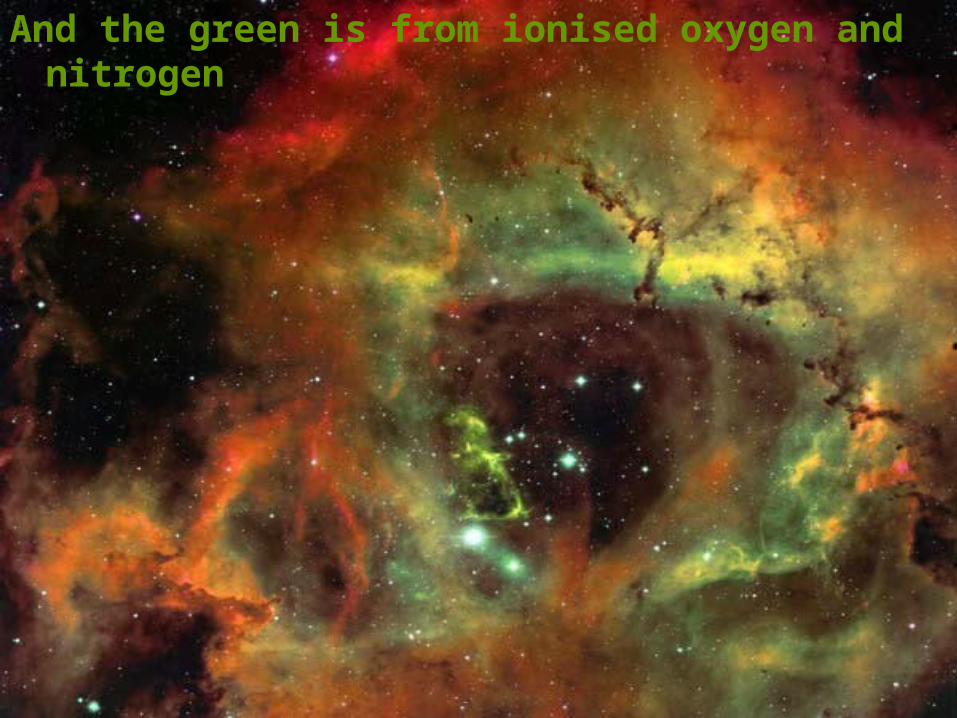
And the green is from ionised oxygen and nitrogen


Ions• Bohr immediately extended his theory to
elements in which all but one electron had been removed such as He+, Li2+ and Be3+.
• This is achieved as follows:
2 0
2 2
202
n
n
ar n
Z
ke ZE
a n

Bohr showed that several mysterious spectral lines from the Sun and stars were not due to Hydrogen but in fact singly ionized Helium.


![Structure, spectroscopy and cold collisions of the (SrNa ......ies [5] of atom-ion cold collisions have been carried out in recent times. It is proposed that controlled ion-atom cold](https://static.fdocuments.net/doc/165x107/60de8d38eaee05209e62e797/structure-spectroscopy-and-cold-collisions-of-the-srna-ies-5-of-atom-ion.jpg)