X-ray Photoelectron Spectroscopy · X-ray photoelectron spectroscopy (XPS) is based on the...
9
1 X-ray Photoelectron Spectroscopy MAE 649 Microscopy and Spectroscopy Chapter 3 Chapter 3 - XPS • Basic principle of XPS • XPS instrumentation • XPS peak characteristics • Quantification of XPS • Inelastic mean free path and surface sensitivity • Angle-resolved non-destructive depth profiling and destructive depth profiling • UPS Contents: What is XPS? X-ray photoelectron spectroscopy (XPS) is based on the photoelectric effect. Each atom in the surface has core electron with the characteristic binding energy that is conceptually, not strictly, equal to the ionization energy of that electron. When an X- ray beam directs to the sample surface, the energy of the X-ray photon is adsorbed completely by the core electron of an atom. If the photon energy, hν, is large enough, the core electron will then escape from the atom and emit out of the surface. The emitted electron with the kinetic energy of E k is referred to as the photoelectron. The binding energy of the core electron is give by the Einstein relationship: hν = E b +E k +φ E b = hν -E k -φ Where hν is the X-ray photon energy (for Al Ka, hν =1486.6eV); E k is the kinetic energy of photoelectron, which can be measured by the energy analyzer; and φ is the work function induced by the analyzer, about 4~5eV. Since the work function, φ, can be compensated artificially, it is eliminated, giving the binding energy as follows: E b = hν -E k X-ray photoelectron ~ 10nm Eb =hγ – KE – φ hγ KE Instrumentation of XPS X-ray source: Mg Kα radiation : hν = 1253.6 eV Al Kα radiation : hν = 1486.6 eV X-ray beam energy: 10~15kV Filament current: 5-30mA source power (X-ray flux): beam energy * filament current X-ray source Generation of X-ray 15Kv Kα X-ray source Bragg diffraction nλ=dsinθ X-ray Monochromator Kα1, Kα2, Kα3 Kα1
Transcript of X-ray Photoelectron Spectroscopy · X-ray photoelectron spectroscopy (XPS) is based on the...

1
X-ray Photoelectron Spectroscopy
MAE 649 Microscopy and Spectroscopy
Chapter 3
Chapter 3 - XPS
• Basic principle of XPS
• XPS instrumentation
• XPS peak characteristics
• Quantification of XPS
• Inelastic mean free path and surface sensitivity
• Angle-resolved non-destructive depth profilingand destructive depth profiling
• UPS
Contents:
What is XPS?X-ray photoelectron spectroscopy (XPS) is based on the photoelectric effect. Each atom in the surface has core electron with the characteristic binding energy that is conceptually, not strictly, equal to the ionization energy of that electron. When an X-ray beam directs to the sample surface, the energy of the X-ray photon is adsorbed completely by the core electron of an atom. If the photon energy, hν, is large enough, the core electron will then escape from the atom and emit out of the surface. The emitted electron with the kinetic energy of Ek is referred to as the photoelectron. The binding energy of the core electron is give by the Einstein relationship:
hν = Eb + Ek +φEb = hν - Ek -φ
Where hν is the X-ray photon energy (for Al Ka, hν =1486.6eV); Ek is the kinetic energy of photoelectron, which can be measured by the energy analyzer; and φ is the work function induced by the analyzer, about 4~5eV.
Since the work function, φ, can be compensated artificially, it is eliminated, giving the binding energy as follows:
Eb = hν - Ek
X-rayphotoelectron
~ 10nm
Eb =hγ – KE – φ
hγKE
Instrumentation of XPSX-ray source:
Mg Kα radiation : hν = 1253.6 eVAl Kα radiation : hν = 1486.6 eV
X-ray beam energy: 10~15kVFilament current: 5-30mAsource power (X-ray flux): beam energy * filament current
X-ray source
Generation of X-ray
15Kv
Kα
X-ray source
Bragg diffractionnλ=dsinθ
X-ray MonochromatorKα1, Kα2, Kα3 Kα1

2
Energy analyzer
hv
Because the Fermi levels of the sample and spectrometer are aligned, we only need to know the spectrometer work function, Φsp, to calculate Eb.
EE1s1s
SampleSample SpectrometerSpectrometer
ee--
Free Electron EnergyFree Electron Energy
Fermi LevelFermi Level, , EEff
Vacuum Level,Vacuum Level, EEvv
Φs
EK
Φsp
Eb
Energy level diagram- conducting sample
Eb=hv – Ek - Φsp
The binding energy Eb of XPS spectra is referenced to Fermi level, Ef
Interpretation of XPS spectraThese peak assignments are as follows:• The valence band (4d,5s) emission occurs at a binding energy of 0~8 eV(measured with respect to the Fermi level). • The emission from the 4p and 4s levels gives rise to very weak peaks at 54 eV and 88 eV respectively • The most intense peak at 335 eV is due to emission from the 3d levels of the Pd atoms, whilst the 3p and 3s levels give rise to the peaks at 534/561 eVand 673 eV respectively. • The remaining peak is not an XPS peak at all ! - it is an Auger peak arising from x-ray induced Auger emission.
4p. 4s
Auger electrons
K.E. is independent of the x-ray photon energy. However, in the B.E. scale, Auger peak positions depend on the x-ray source.
Point Charge Model:
EB = Ei0 + kqi + Σ qi/rij
Eio in atom i in given
reference state. It considered to Eb for the neutral atom
Weighted charge of i Potential at i due to surrounding charges
XPS peak -chemical shift
Related to electro-negativitySuch as valence change
Relaxation in the final state, lattice change
The photoelectron’s binding energy is based on the element’s final-state configuration.
Therefore, XPS is also called ESCA (Electron Spectroscopy for Chemical Analysis). The term ESCA was coined by Kai Siegbahn, Uppsala University, Sweden during his seminal studies of this methodology. He was awarded the Nobel Prize in Chemistry for his efforts.
The Concept of Chemical Shift
� Photoelectron core level peaks in elemental samples occur at the same binding, for example, a gold surface.
� In compounds, where ionic or covalent bonding occurs, the peak position may shift.
For example, Si in pure Si wafer, the binding energy of Si 2p is 99 eV,In contrast, Si in SiO2, the binding energy of Si 2p is 102.3 eV

3
Chemical Shift due to Electronegativity Effects
XPS peak -chemical shift
Core binding energies are determined by electrostatic interaction between it and the nucleus, and change with:
• the electrostatic shielding of the nuclear charge from all other electrons in the atom (including valence electrons)
• removal or addition of electronic charge as a result of changes in bonding will alter the shielding
Withdrawal of valence electron charge increase in BE(oxidation)
Addition of valence electron charge decrease in BE
Chemical shift: change in binding energy of a core electron of an element due to a change in the chemical bonding of that element.
FunctionalGroup
Binding Energy(eV)
hydrocarbon C-H, C -C 285.0
amine C-N 286.0
alcohol, ether C-O-H, C -O-C 286.5
Cl bound to C C-Cl 286.5
F bound to C C-F 287.8
carbonyl C=O 288.0
Chemical Shift due to Electronegativity Effects
XPS peak -chemical shift
Atoms of a higher positive oxidation state exhibit a higher binding energy due to the extra coulombic interaction between the photo-emitted electron and the ion core. This ability to discriminate between different oxidation states and chemical environments is one of the major strengths of the XPS technique
C
N
O
F
Cl
Double-bond
ElectronegativityIncrease
Binding energyincrease
XPS peak – chemical shift
Polyethylene Terephthalate (PET).
XPS peak-electronic effect: spin-orbit couplingXPS peak is originated from the photoelectrons in the core-levels and valence band. For example, The inner core electronic configuration of the initial state of the Pd is :
In the quantum mechanics, the nonmenclature for a core level is nlj:n is the principle quantum number;l is the orbit angular momentum quantum number;j is the total angular momentum quantum number;j = l + s
s is the spin angular momentum quantum number, s=+1/2If l=0, giving a singlet XPS peak;
if l>0 giving a doublet peak-- spin orbit (l-s) coupling
3:45/2, 7/22, 3f
2:33/2, 5/21, 2d
1:21/2, 3/20, 1p
--1/20s
Peak
area ratio
j valuesl valuesSubshell
965 955 945 935 925
19.8
Binding Energy (eV)
Cu 2p
2p1/2
2p3/2
Peak Area 1 : 2
Orbital=p ls=1/2,3/2
l=1s=+/-1/2
XPS peak-electronic effect: spin-orbit coupling XPS peak-Final State Effects: Shake-up/ Shake-off
• Monopole transition: Only the principle quantum number changes. Spin and angular momentum cannot change.
• Shake-up: Relaxation energy used to excite electrons in valence levels to bound states (monopole excitation).
• Shake-off: Relaxation energy (kinetic energy loss of the outgoing photoelectrons) used to excite electrons in valence levels to unbound states (monopole ionization).
Results from energy made available in the relaxation of the final state configuration (due to a loss of the screening effect of the core level electron which underwent photoemission).

4
XPS peak-Final State Effects- Shake-up/ Shake-off
Ni MetalNi Metal Ni OxideNi Oxide
XPS peak -electron scattering effects
Photoelectrons travelling through the solid can interact with other
electrons in the material. These interactions can result in the
photoelectron exciting an electronic transition, thus losing some of its
energy (plasmon loss peak).
eph + esolid e*ph + e**solid
a
A=15.3 eV
a a a
Al 2s
Metal
Insulate sample- surface charge effecthv
surfacecharge
For conductive sample, the sample is grounded, and no surface charge is built on the sample surface
For insulate sample, the sample can not be grounded, and surface charge is built on the sample surface
Surface charge lead to kinetic energy loss of emitted electrons, leading to shift of XPS peak position
C1s
Green: no surface charge
White: surface charge, leading to C1s peak shift form 284.8 to 302. 9 eV hv
A relative build-up of electrons at the spectrometer raises the Fermi level of the spectrometer relative to the sample. A potential Ech will develop.
EE1s1s
SampleSample SpectrometerSpectrometer
ee--
Free Electron EnergyFree Electron Energy
Eb
Fermi Level,Fermi Level, EEff
Vacuum Level,Vacuum Level, EEvv
Ek
Φsp
Ech
Energy Level Diagram- Insulating Sample
Eb=hv – Ek – Φsp- Ech
For insulate sample, the surface charge potential is built:
Surface charge compensation by flood gun Surface charge compensation by flood gun

5
XPS peak widthFWHM: full-width at half-maximum of a peak
FWHM
2/12222 )⋅⋅⋅++++= chaxntot FWHMFWHMFWHMFWHMFWHM
FWHMn is determined by the lifetime of the core level
FWHMx is determined by the lifetime of the core level,
FWHMx is determined by width of X-ray line, monocharamtor used for this
FWHMa is determined by analyzer,
FWHMch is determined by the surface charge on the insulate sample
FWHMn = h/τ , where h is Plank’s constant, τ is the core hole lifetime
FWHMn is calculated from Heisenberg’s uncertainty relationship:
Generally, the peak width in the order: 4f<4d<4p<4s
XPS peak intensityQuantitative Element AnalysisIntensity of XPS peaks (=peak area) contains information on chemical stoichiometry
Iij is the peak area of the peak j from Element i, which is expressed by:
Iij = ni K T(KE) Lij σij λ(kE) cosθ
The atomic concentration of element
Instrument constant
The transmission function of the analyzer
The angular asymmetry factor of orbital j of element i
The photoionization cross-section of peak j of element i
Inelastic mean free path length
Emission angle
XPS peak intensity- quantificationThe atomic concentration ni of Element i can be calculated:
ni = ni /Σni
Combine the above equation with
∑=
)(/
)(/
kEIn
ijij
kEI
i
ijij
λσ
λσThen yield:
We define )(KES iji λσ=Si is called sensitivity factor of the core level j of element i
Hence, ni is dependent on the peak area and sensitivity factor
∑=
ii
SI
isI
niij
/
/
Quantification of elemental concentrationFor example, a sample with unknown composition
acquire survey scan to check what elements are present in the sample Step 1:
Step 2:
Si2p Si2sC1s
N1s
O1s
acquire details of each element and calculate the peak area
Si2p C1s
N1s
O1sArea: 1663 Area: 2944
Area: 12745
Area: 457
Quantification of elemental concentrationStep3: to calculate the concentration
1.77N1s
2.85O1s
1.00C 1s
0.83Si 2p
SiElements
NNOOCCSiSi
SiSi
ii
SI
SiSISISISI
SI
sIn iij
////
/
/
/
+++==
∑
77.1/45785.2/127450.1/294483.0/1663
83.0/1663
/
/
+++==
∑ ii
SI
SisI
niij
=0.21
Capability of XPSIdentification of the elements contained in the sample
Analysis of chemical status of elements.
Quantification of chemical composition.
Destructive depth profiling with an ion gun.
Non-destructive depth profiling by the angle-resolved analysis.
Neutralization of surface charging with the electron flood gun.
Chemical Imaging

6
XPS characterization of surface-modified carbon nanotubes, by courtesy of T. Ramanathan
XPS analysis of carbon nanotubes XPS-surface analytical technique
Trajectories of emitted electron form the sample surface : 1) If it were "captured" before reaching the surface, or emitted in the wrong
direction and never reached the surface.---route (1)2) The electrons reaches the detectors without any energy loss. Theses electrons
contribute to XPS peak ---- route (2)3) If it lost energy before reaching the surface, i.e. if it escaped from the solid and
reached the detector, but with E < Eo. These electrons contribute to backgroundof the XPS spectrum. ------ inelastic scattering---route (3)
(1)(2)
(3)
Each inelastic scattering event leads to : (i) a reduction in the electron energy (ii) a change in the direction of travel.
http://www.chem.qmul.ac.uk/surfaces/scc/
Inelastic effect on the peak shape XPS-surface analytical technique
The intensity removed (-dI) per length traveled (dx)
Inelastic scattering of photoelectrons
-dI = σ N’ I dx
(σ: cross section for inelastic process)(N’: Scattering centers per cm3)
I(x) = Ioe-σN’x = Ioe
-x/λ
where λ= (σN’)-1 is the inelastic mean free path length
Angle-resolved XPS for depth profiling
By L. Jurgerns
XPS-surface analytical technique
I(x) = Ioe-x/λ
We can now consider a situation where a substrate (or thick film) of one material, B , is covered by a thin film of a different material, A .
The XPS signal from the underlying substrate will be attenuated (i.e. reduced in intensity) due to inelastic scattering of some of the photoelectrons as they traverse through the layer of material A:
The probability of such a scattering event for any single photoelectron passing through this layer is simply given by
P(x) =I/Io= e-x/λ
http://www.chem.qmul.ac.uk/surfaces/scc/

7
XPS-surface analytical techniqueit is clear that the probability of escape decays very rapidly and is essentially zero for a distance x> 5λ. It is therefore useful to re-plot the function for a range of (x/λ) from 0-5
When x = λ, P = exp(-1) = 0.368 , i.e. escape of the electron in a direction normal to the surface and without inelastic scattering occurs with a 37% probability.
When x = 2λ , P = exp(-2) = 0.135 , i.e. escape of the electron in a direction normal to the surface and without inelastic scattering occurs with a probability of ca. 14%.
When x = 3λ , P = exp(-3) = 0.050 , i.e. escape of the electron in a direction normal to the surface and without inelastic scattering occurs with a probability of 5%
In summary, we can conclude from the answer to this question that ... the majority of electrons detected come from within one " λ " of the surface. Virtually all ( > 95% ) of the electrons detected come from within 3 λ of the surface.
Hence, we define the sampling depth of XPS: d=3 λhttp://www.chem.qmul.ac.uk/surfaces/scc/
XPS-surface analytical techniqueAngle-resolved XPS: How to change the degree of surface sensitivity ?
the distance that the electrons have to travel through the solid (rather than the distance of the emitting atom below the surface) that is crucial in determining their probability of escape without inelastic scattering
x = d cosθ
Once again 95% of the electrons will originate from atoms located such that the electrons have to travel a distance, d =3λ.
Hence, the XPS sampling depth is determined by:
x = 3λ cosθ
Information depth = dcosθθθθd = Escape depth ~3λλλλθ θ θ θ = emission angle
λ λ λ λ = Inelastic Mean Free Path
λ is typically 1-3.5 nm
the XPS sampling depth 3-10 nm
Angle-resolved XPS for depth profiling
θθθθ
θθθθθθθθ
Tilt sample to change the emission angle, θ
By L. Jeurgens
θθθθ
A
B
An overlayer of material A on the substrate of material B
d
IA0 and IB0 are the intensities form the bulk A and B measured under the same condition, λA and λB are the IMFPs for the core electrons representing A and B traveling through material A
θλ COSd
BBBeII
/
0
−=
)1(/
0
θλ COSd
AAAeII
−−=
Destructive depth profiling X-ray
X-ray
photoelectrons
photoelectrons
Ar+atoms
Acquire XPS
Sputter surface
Acquire XPS
Acquire XPS spectrum
Acquire XPS spectrum
Acquire XPS spectrum
Ar ion sputtering
Ar ion sputtering
d
Destructive depth profilingEffect of sample rotation on the depth profiling data
XPS imaging
http://www.uwo.ca/ssw/services/xps/xpsexcorrosion.html
8
Ultraviolet Photoelectron Spectroscopy(UPS)
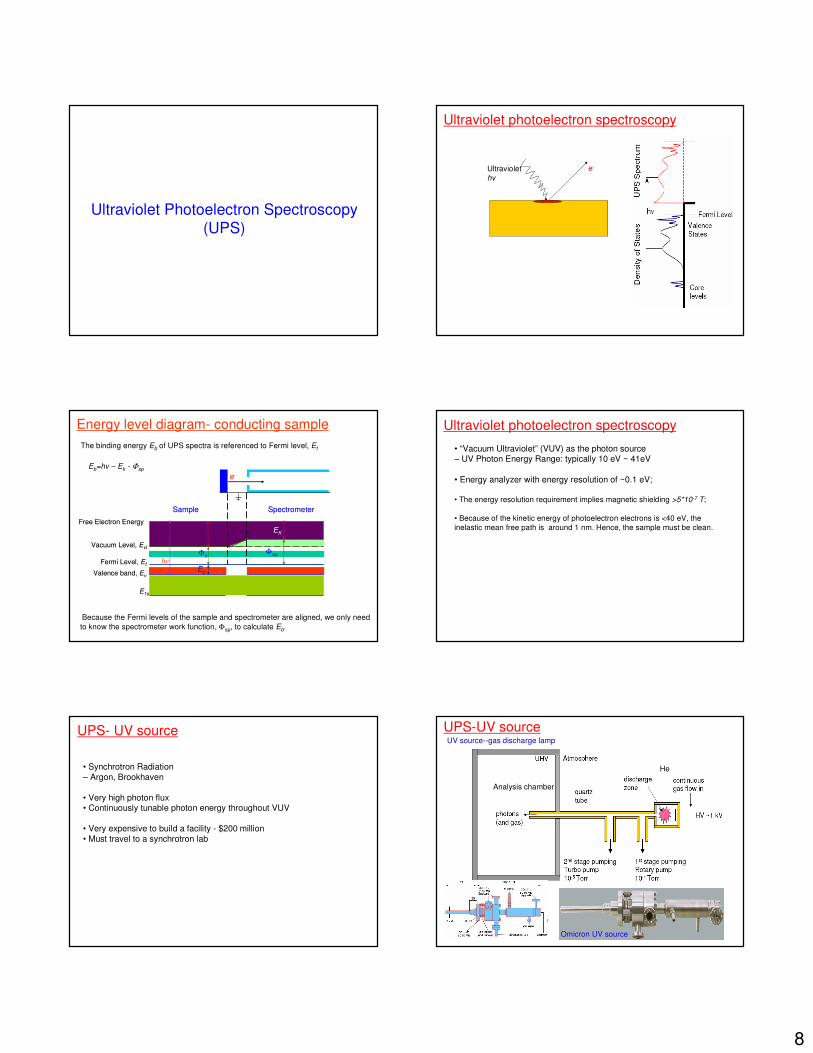
Ultraviolet photoelectron spectroscopy
e-Ultraviolethv
hv
Because the Fermi levels of the sample and spectrometer are aligned, we only need to know the spectrometer work function, Φsp, to calculate Eb.
EE1s1s
SampleSample SpectrometerSpectrometer
ee--
Free Electron EnergyFree Electron Energy
Fermi LevelFermi Level, , EEff
Vacuum Level,Vacuum Level, EEvlvl
Φs
EK
Φsp
Eb
Energy level diagram- conducting sample
Eb=hv – Ek - Φsp
The binding energy Eb of UPS spectra is referenced to Fermi level, Ef
Valence band,Valence band, EEvv
Ultraviolet photoelectron spectroscopy
• “Vacuum Ultraviolet” (VUV) as the photon source– UV Photon Energy Range: typically 10 eV ~ 41eV
• Energy analyzer with energy resolution of ~0.1 eV;
• The energy resolution requirement implies magnetic shielding >5*10-7 T;
• Because of the kinetic energy of photoelectron electrons is <40 eV, the inelastic mean free path is around 1 nm. Hence, the sample must be clean.
UPS- UV source
• Synchrotron Radiation– Argon, Brookhaven
• Very high photon flux• Continuously tunable photon energy throughout VUV
• Very expensive to build a facility - $200 million• Must travel to a synchrotron lab
UPS-UV source
Analysis chamber
He
UV source--gas discharge lamp
Omicron UV source

9
UPS-UV source
• Ultraviolet photons are emitted by gas plasmas;Photon energy: He (I) 21.22eV; He (II) 40.81He (I) is generated at relatively high gas pressureHe (II) is generated at relatively low gas pressure
• Plasma is most easily generated at ~1 Torr
• No materials are transparent to these photons. We can’t make a VUV window
• UV photons and gas enter the analysis chamber at the same time.
• Because the gas enters from UV source to the analysis chamber, Inert gases (He, Ne, Xe) are used. Inert gasses will not react with the sample.
•Differentially pumped discharge lamps
Gas discharge lamp
UPS
• For a given element, Core levels stay in the inner energy level, the electron density distribution less dependent on neighboring atoms. No hybridization.
Core level shifts, depending on chemical environment
• Valence states hybridize with those of neighbouring atoms due to wave function overlap
1) A hybridized orbital is, by definition, a combination of orbitals of different atoms, not necessarily of the same species
2) Large energy shifts occur due to hybridization, so binding energy cannot unambiguously identify a spectral feature.
3) Delocalized energy bands disperse with momentum; Binding energy depends on the momentum of the state; Bandwidths vary (near zero to 10 eV or more)
4) Detailed analysis of valence spectra typically require theoretical modeling of the material being studied
Comparison in photoemission spectroscopy between valence band and core level
UPS
Capability of UPS:
• To measure the valence band structure of materials
• To measure the work function of materials
UPS spectra of Valence band
A. D. McLaxhlan, et al, J. Phys. F, 5 (1975), 2415
He (I) excitation He (II) excitation
Under the He (I) excitation, the spectrum represents a mixture of initial and final states;
Under the He (II) excitation, the spectrum mainly represents initial states; and show less structure in the unoccuppied density of states.
UPS spectra of Ag-Pd alloy
The figure shows that the emission form d bands states is much stronger relative to that from s states at He (II) 40.81 eV than He (I)21.22 eV
Ag: 4d5sPad: 4d5s
Measurement of work function by UPSHow to calculate work function from UPS spectrum:Based upon Einstein equation (he won Nobel Prize due to this equation)Ek, maxim = hνννν - ΦΦΦΦΦΦΦΦ = hνννν - Ek
You can see the following two illustration
XPS-surface analytical techniquePractical Surface Analysis: Auger and X-Ray Photoelectron Spectroscopy by D. Briggs, M.P. Seah, Second Edition (1990)Modern ESCA The Principles and Practice of X-Ray Photoelectron Spectroscopyby T. L. Barr, CRC Press, Inc. (1994) An introduction to surface analysis by XPS and AES by J. F. Watts and J. Wolstenholme (John Wiley & Sons Chichester England 2003)Practical Surface Analysis: By Auger and X-Ray Photoelectron Spectroscopy
by D. Briggs (1983)X-Ray Photoelectron Spectroscopyby T. A. Carlson (1978)Handbook of X Ray Photoelectron Spectroscopy: A Reference Book of Standard Spectra for Identification and
Interpretation of XPS Databy John F. Moulder, William F. Stickle, Peter E. Sobol, Kenneth D. Bomben (1995)Angle-resolved X-ray photoelectron spectroscopy (Progress in surface science)
by Charles S Fadley Progress in Surface Science (1984)Physical Chemistry of Surfaces
By A. W. Adamson, Wiley Interscience, 1990 (5th edition) Handbook of Monochromatic XPS Spectra, Polymers and Polymers Damaged by X-Rays by B. Vincent Crist, John Wiley & Sons; 2 edition (October 2, 2000) Fundamentals of Surface and Thin Film Analysis by L. Feldman and J. Mayer, Prentice-Hall (1986)
Web Pages:http://srdata.nist.gov/xpshttp://www.lasurface.comhttp://www.chemres.hu/aki/XMQpages/XMQhome.htmhttp://www.npl.co.uk/nanoanalysis/index.htmlhttp://www.iac.bris.ac.uk/scripts/tech1.htmhttp://www.chem.qmw.ac.uk/surfaces/scc/sccinfo.htmhttp://www.xpsdata.com/fundxps.pdfhttp://www.chembio.uoguelph.ca/educmat/chm729/tutorial.htm