PT Mega Manunggal Property...
71
PT Mega Manunggal Property Tbk 1 March 2019
Transcript of PT Mega Manunggal Property...

PT Mega Manunggal Property Tbk
1March 2019
PT Mega Manunggal Property Tbk
2

PT Mega Manunggal Property Tbk
3
PT Mega Manunggal Property Tbk
4

PT Mega Manunggal Property Tbk
5
PT Mega Manunggal Property Tbk
Section 1
Who We Are
6

PT Mega Manunggal Property Tbk
7

PT Mega Manunggal Property Tbk
8
(MMLP effective ownerships)

PT Mega Manunggal Property Tbk
9
Bonny Budi SetiawanPresident Director
Has has been the Company’s Director since 2015 and appointed as the President Director in January 2017. Earneda Bachelor of Business Administration in Accounting and Finance from Simon Fraser University, Canada (1997).Previously served as Executive Director of PT UBS Securities Indonesia (2011-2015); Senior Vice President of PTDanareksa Sekuritas, Jakarta (2010 - 2011); Vice President of Research Division of PT Danareksa Sekuritas in Jakarta(2009 - 2010); Vice President of Research Division of Merrill Lynch, Jakarta (2007 - 2009); Vice President ofResearch Division of PT CIMB-GK Securities, Assistant Vice President of research division of PT Danareksa Sekuritas(2005 - 2007); Supervisor Consultant Financial Advisory Services (FAS) of Prijohandojo Boentoro & Co. (2003 -2005); Research Analyst of PT Panin Sekuritas (2002 - 2003) and Export Supervisor of PT Pabrik Kertas Tjiwi Kimia(1998-2000).
Loa Siong LieDirector
Has been appointed as the Independent Director since 2017. He is in charge of technical and construction. Heearned Civil Engineering Bachelor’s degree from University of Tarumanegara, Jakarta in 1996. He was ProjectManager for PT Sinar Menara Deli (2016 – 2017), Project Manager for PT Supra Megah Utama ( 2012 - 2016), SiteManager for PT Pradani Sukses Abadi (2010 – 2012), Site Manager for PT Intersatria Budi Karya Pratama (2007 –2010). Construction Manager for PT Praga Artamida ( 1996 – 2007).
PT Mega Manunggal Property Tbk
PT Mega Manunggal Property Tbk
11

PT Mega Manunggal Property Tbk
12

PT Mega Manunggal Property Tbk
13
24 x 18 and
32 x 18 18x30m 18x24m

PT Mega Manunggal Property Tbk
118,199 139,811 163,911 163,911
230,370
300,680 300,680
2013 2014 2015 2016 2017 2018 1Q 2019
14

PT Mega Manunggal Property Tbk
15

PT Mega Manunggal Property Tbk
BEST
DKI
Jakarta
(Cimanggis)
Jawa Barat
(Jatiwarana)
Operational
In construction
Negotiation/tender
Contract signed
16

PT Mega Manunggal Property Tbk
37%
38%
16%
9%
Manufacture Logistics E-commerce Others
17

PT Mega Manunggal Property Tbk
Section 2
Growth Strategy
17

PT Mega Manunggal Property Tbk
19

PT Mega Manunggal Property Tbk
20

PT Mega Manunggal Property Tbk
21

PT Mega Manunggal Property Tbk
22

PT Mega Manunggal Property Tbk
23

PT Mega Manunggal Property Tbk
Section 3
On The Right Track
23

PT Mega Manunggal Property Tbk
25
Location : Delta Silicon III, Cikarang, Bekasi
Land area : 100,000 m2
Net leasable area : 67,000 m2
Tenant : DHL
Lease period : 10 years
Estimated full completion : 4Q 2020

PT Mega Manunggal Property Tbk
26
71k 103k 130k
230k
301k
403k
122k
k
100k
200k
300k
400k
500k
600k
700k
2017 2018 2019
Under construction Completed Pipelines

PT Mega Manunggal Property Tbk
27
15.2%
17.1%17.6%
13.3%
12.4% 13.8%
7.8%8.7% 8.4%
7.5% 7.5%
8.3%
0.0%
2.0%
4.0%
6.0%
8.0%
10.0%
12.0%
14.0%
16.0%
18.0%
20.0%
-
500
1,000
1,500
2,000
2,500
3,000
3,500
4,000
2014 2015 2016 2017 2018 Q1 2019
IP at cost IP at fair value Yield to cost Yield to fair value

PT Mega Manunggal Property Tbk
Section 4
28
Strong Growth Opportunity
PT Mega Manunggal Property Tbk
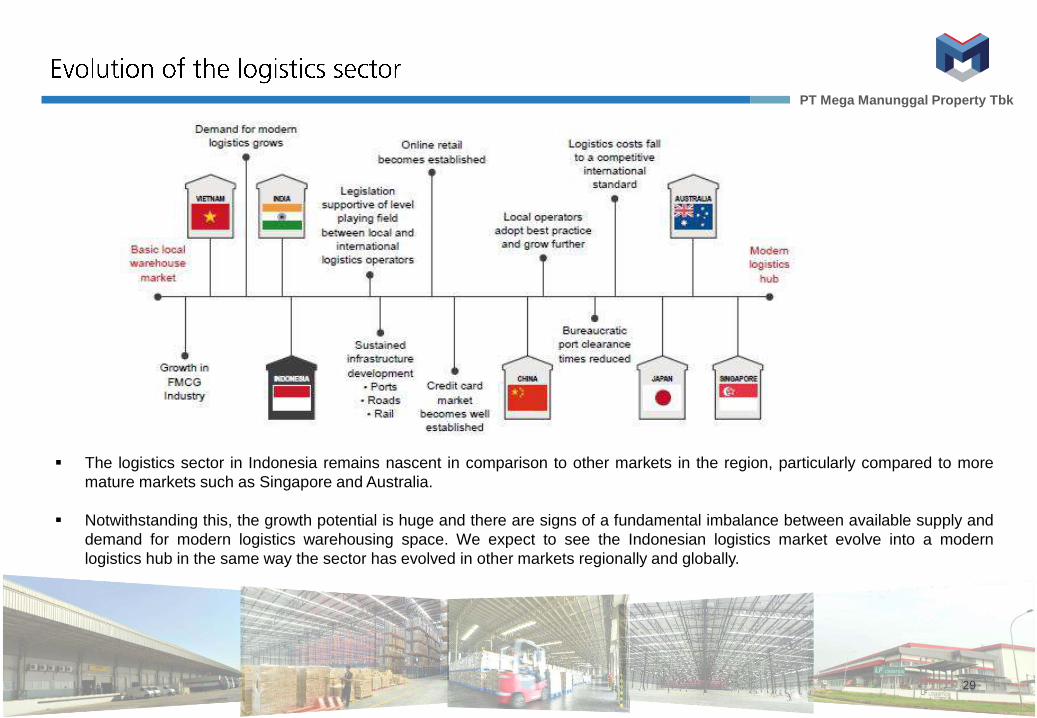
The logistics sector in Indonesia remains nascent in comparison to other markets in the region, particularly compared to more
mature markets such as Singapore and Australia.
Notwithstanding this, the growth potential is huge and there are signs of a fundamental imbalance between available supply and
demand for modern logistics warehousing space. We expect to see the Indonesian logistics market evolve into a modern
logistics hub in the same way the sector has evolved in other markets regionally and globally.
29

PT Mega Manunggal Property Tbk
•
•
•
30

PT Mega Manunggal Property Tbk
31

PT Mega Manunggal Property Tbk
Economic Growth and Scale
Recent disruptions in the commodities markets hit
the Indonesian economy hard, but government
spending began to pick up in 2015, economic growth
started to improve and Indonesia remains the largest
economy in Southeast Asia or 16th globally.
Annual GDP growth has averaged 5.8% over the
past 10 years and historically, domestic consumption
has driven the national economy. Indonesia
weathered the global economic turmoil in 2008 better
than most neighboring countries due to domestic
demand. The current administration is now
spearheading a shift to further stimulate growth
through investment.
32

PT Mega Manunggal Property Tbk
33

PT Mega Manunggal Property Tbk
34

PT Mega Manunggal Property Tbk
“”
“ ’”
35

PT Mega Manunggal Property Tbk
36
MERAK
-TANGERANG
TOLLROAD
TELUK NAGA -SEDYATMO
KUNCIRAN
- SERPONG
TOLLROAD
SERPONG
-CINERE
TOLLROAD
CIBITUNG -CILINCING
TJ. PRIOK ACCESS
BOGOR
RINGROAD
PASAR MINGGU
TANAH ABANG
TMII
KP. MELAYU
PULO GEBANG
1
ULUJAMI
- DEPOK TOLLROAD
JAKARTA
- CIKAMPEK
TOLLROAD
2
3
4CINERE
- JAGORAWI TOLLROAD
5CIMANGGIS
- CIBITUNG
TOLLROAD
6
ANTASARI 7
8
9
10
RAWA 1BUAYA
23 4
5
6
11
JabodetabekToll Road
Number Link Length(Km)
1 Semanan - Sunter 20,23
2 Sunter –PuloGebang 9,44
3 DuriPulo –KampungMelayu 12,65
4 Kemayoran –KampungMelayu 9,60
5 Ulujami –TanahAbang 8,70
6 Pasar Minggu –Casablanca 9,16
TOTAL 69,77
6 LINKS OF DKI JAKARTA TOLLROAD
Number Link Length(Km)
1 Cengkareng – Batu– Ceper– Kunciran 14.19
2 Sunter–PuloGebang 11.19
3 Serpong –Cinere 10.14
4 Cinere – jagorawi 14.84
5 Cimanggis – Cibitung 25.39
6 Cibitung – Cilincing 34.02
7 Depok – Antasari 21.54
8 Bekasi – Cawang – Kp Melayu 21.04
9 Bogor Ring Road 11.00
10 6 Project Tol DKI Jakarta 69.77
11 Serpong – Balaraja 30
TOTAL 263.12

PT Mega Manunggal Property Tbk
36
BANDAACEH
MEDAN
PEKANBARU
BANDAR LAMPUNG
JAMBIPADANG
PALEMBANG
PANGKAL PINANG
BENGKULU
BANDUNG
SEMARANG
SURABAYA
DENPASAR
MATARAM
UJUNGPANDANG
KENDARIBANJARMASIN
MAMUJ U
PALU
SAMARINDA
PALANGKARAYA
PONTIANAK
AMBON
MENADO
SORONG MANOKWARI
W AMENA
JAYAPURA
MERAUKE
KENDARI
KUPAN
G
BALIKPAPAN
1
2
56
3JAKAR4TA
87
YOGYAKARTA
LinkNumber 1 2 3 4 5 6 7 8
LinkName Semarang-Demak
Probolinggo-Banyuwangi
Serang-Panimbang (Segment Cileles-
Panimbang)
Jakarta Cikampek 2 Selatan*
Jembatan Suramadu
Cileunyi-Tasik-Cilacap*)
Cilacap-Jogja-Solo*)
Jogja-Bawen
PT Mega Manunggal Property Tbk
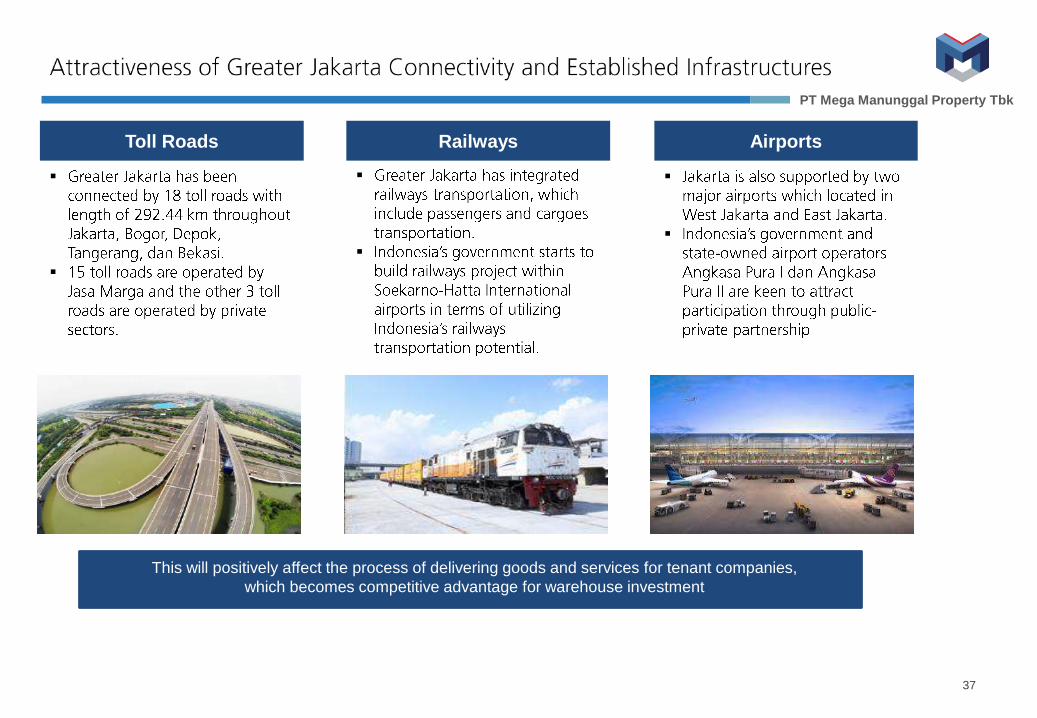
Toll Roads AirportsRailways
This will positively affect the process of delivering goods and services for tenant companies,
which becomes competitive advantage for warehouse investment
37

PT Mega Manunggal Property Tbk
Tanjung Perak Port
Juanda air Port
In the near future, Gresik, Sidoarjo, and Surabaya will become our expansion target
21 Km
22 Km
In terms of land prices and availability, Gresik and Sidoarjo seem potential for warehouse location. It offers
effective route to airport and port which could be added value for our future tenant.
35 Km
6 Km
Key Industry Served :FMCG, FnB, Electronic,
Chemicals
Greater Surabaya
38

PT Mega Manunggal Property Tbk
Healthy Growth in FMCGs and Retail
Urbanisation and growing wealth is already translating into
growth in the FMCG sector and retail sales. This will
increase the appeal of the logistics real estate market to a
broader spectrum of modern international logistics players.
Indonesia has a robust manufacturing sector
Indonesia has a large manufacturing base driven by a large
domestic consumer market and low labour costs. The robust
manufacturing sector is another major driver of demand for
logistics services and associated real estate. In 2015,
manufacturing accounted for 22% of GDP.
39

PT Mega Manunggal Property Tbk
Indonesia Manufacturing Industry Snapshot
647 725812
9101,020
1,143
2015 2016 2017 2018 2019 2020
9.00%
Food and Beverage Manufacturing Sector
GDP Value, 2015-2020, IDR Trillions
2,405 2,622 2,858 3,115 3,3953,700
2015 2016 2017 2018 2019 2020
1. Positive demographics profile
2. Robust economic growth
3. Large number of middle income class
4. High degree of consumption
Growth Drivers Market Restraints
1. Slowing in global economy
2. Poor logistics infrastructure
3. High logistics cost
4. Regulation
Manufacturing Industry GDP Value,
2015-2020, IDR Trillions
The growing economy will further amplify the manufacturing industry,
especially food & beverages that will create bigger demand of warehousing
40

PT Mega Manunggal Property Tbk
1. Positive demographics profile
2. Robust economic growth
3. High ICT adoption
4. Large number of local players
Growth Drivers Market Restraints
1. Poor logistics infrastructure
2. Large unbanked population
3. Low adoption of cashless payment
4. Limited ICT competency
7501,100
1,350
1,850
2,400
2,950
3,800
2013 2014 2015 2016 2017 2018 2019
31.1%
Indonesia e-Commerce Market Size, 2015-2019, USD Millions
41

PT Mega Manunggal Property Tbk
IDR 257.64
Tn
Construction13%
Mining & quarrying,
7.6%
Wholesale,Retail17%
Processing Industry
14%
Financial Service and Insurance
10%
Communication, 3.5%
Other Services , 39%
• Wholesale, retail, and automotive sector was 17.0 percent of 2015 GDRP equivalent to IDR 304.65 Trillion
• Investment in existing infrastructure, mainly on toll roads, will further amplify logistics efficiency for wholesale and
retail companies in Indonesia, which include time and cost reducing
Greater Jakarta GDRP by Key Industries, 2015
(% of GDRP)
42

PT Mega Manunggal Property Tbk
Government investment plan and initiatives on
infrastructure sector are expected to reach IDR 313
trillion in 2016, approximately 8.0% increase from
2015.
GDP’s share for transport, storage and courier is
estimated grow around 38.0 percent in 2016 at
IDR 798 trillion. where 23 share percent accounts for
warehousing
0.0%
5.0%
10.0%
15.0%
20.0%
25.0%
30.0%
35.0%
40.0%
2011 2012 2013 2014 2015 2016(e)
Services Transportation, storage and courier
Source: World Bank, Indonesian Statistical Agency, Frost & Sullivan
Growth of Service Segment 2011- 2016 (f)
43

PT Mega Manunggal Property Tbk
High growth, large domestic
market
Low growth, small
domestic market
Low growth, small domestic
market
Low growth, large domestic market
Indonesia continues to be an attractive target for FDI
Competitive wages and large domestic market makes Indonesia to be an attractive target for FDI in ASEAN
• Jakarta minimum wage increased 17.9% per year on average,
which will imply in higher labour cost due to higher inflation rate.
Productivity issue is assumed to be constant.
• Abundant amount of working-age population will increase labour
availability in the long-term. The composition also shows that
male workers are dominating in working-age population.
Resilient economy growth and large domestic market are expected to boost investment in Indonesia
0
500,000
1,000,000
1,500,000
2,000,000
2,500,000
3,000,000
0.00%
10.00%
20.00%
30.00%
40.00%
50.00%
2011 2012 2013 2014 2015Minimum Wage Increase in PMW
Rp
Jakarta’s Historical Minimum Wage 2011 - 2015
Source: JLL
2012 2020
Indonesian population is becoming wealthier and consumption is
expected to increase. By 2020, more than half of the population
is expected to be middle class or above
30%Middle and above
70%Below middle 53%
Middle and above
47%Below middle
44

PT Mega Manunggal Property Tbk
This shows that demand for warehouse complex in Jabodetabek area is still growing, which this will be great opportunity to invest in the area.
Stable land prices over the year encourages acquisition of new lands to satisfy the growing demand in the industry property.
Source: Central Bank of Indonesia; Frost & Sullivan Analysis
94.00
96.00
98.00
100.00
102.00
104.00
106.00
108.00
110.00
Q1 Q2 Q3 Q4 Q1 Q2 Q3 Q4 Q1 Q2 Q3 Q4e
2014 2015 2016
Warehouse Demand Index, 2014-2016
(Quarterly)
0
50
100
150
200
250
2011 2012 2013 2014 2015U
SD/s
qm
Greater Jakarta Industrial Land Price
Bogor Bekasi Tangerang Karawang
Increase 9% in
Q4 2016 from
Q1 2014
Source: Analysis by Frost & Sullivan
45

PT Mega Manunggal Property Tbk
While the e-commerce phenomenon has taken hold in many
other markets in the region, the sector is still in its infancy in
Indonesia and the potential future growth also presents an
opportunity.
The Indonesian population has a large online presence.
Internet and mobile internet traffic has increased significantly.
46

PT Mega Manunggal Property Tbk
Section 5
Key Financial
47

PT Mega Manunggal Property Tbk
48
139,811 158,137 163,911 163,911
230,370
300,680 300,680
96.8%
97.8%
97.2%
100.0% 99.9%
99.4% 99.2%
95.0%
96.0%
97.0%
98.0%
99.0%
100.0%
101.0%
2013 2014 2015 2016 2017 2018 3M19
-
50,000
100,000
150,000
200,000
250,000
300,000
350,000

PT Mega Manunggal Property Tbk
(Rp bn) 2015 2016 2017 2018 Q1 ‘19 Q1 ‘18 YoY (%)
Revenues 163.5 175.3 208.8 299.2 81.1 68.0
Operating profit 121.7 117.7 142.4216.3
63.8 49.5
Finance Costs (51.8) (46.8) (52.3) (47.5) (12.7) (10.5)
Forex gain / loss – net (28.9) 3.3 (0.8) (9.2) 1.7 (2.1)
Changes of IP fair value 64.8 323.0 217.2 144.3 - -
Profit before tax 131.0 416.6 314.1 281.3 52.4 40.9
Income tax (16.3) (17.6) (20.9) (30.0) (8.1) (6.6)
Net income (loss) 114.4 342.2 293.1 251.3 44.2 34.1
49
IDR
mili
ar
15.2%17.1% 17.6%
13.3%12.4% 13.8%
7.8% 8.7% 8.4% 7.5% 7.5%8.3%
0.0%
2.0%
4.0%
6.0%
8.0%
10.0%
12.0%
14.0%
16.0%
18.0%
20.0%
-
500
1,000
1,500
2,000
2,500
3,000
3,500
4,000
2014 2015 2016 2017 2018 Q1 2019
IP at cost IP at fair value Yield to cost Yield to fair value
PT Mega Manunggal Property Tbk
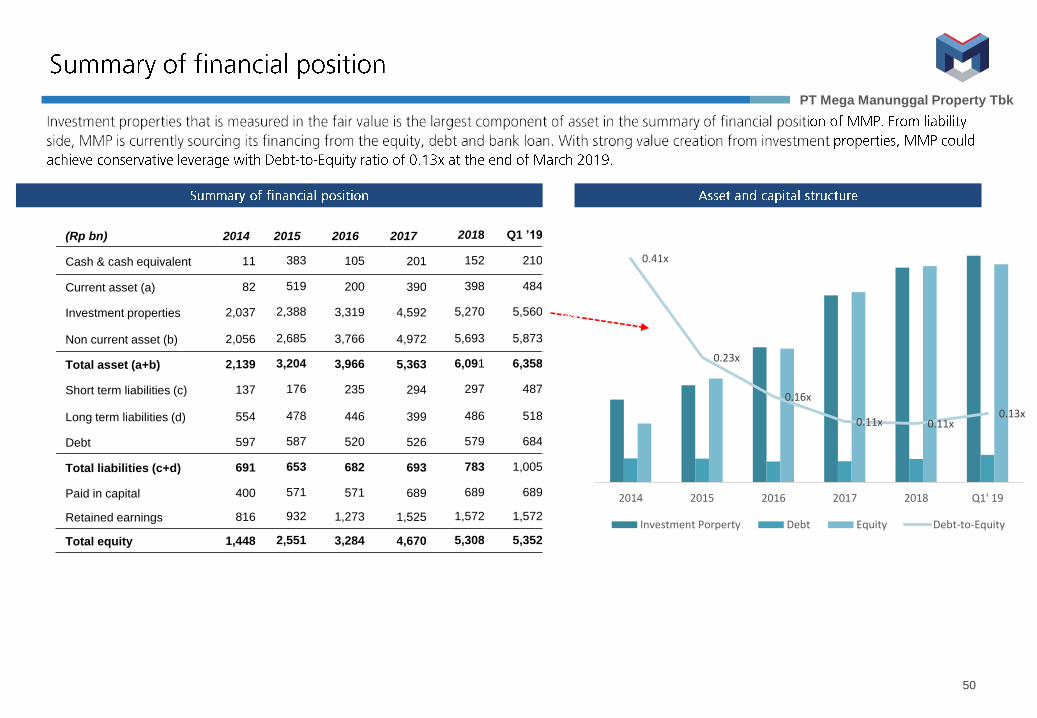
(Rp bn) 2014 2015 2016 2017 2018 Q1 ’19
Cash & cash equivalent 11 383 105 201 152 210
Current asset (a) 82 519 200 390 398 484
Investment properties 2,037 2,388 3,319 4,592 5,270 5,560
Non current asset (b) 2,056 2,685 3,766 4,972 5,693 5,873
Total asset (a+b) 2,139 3,204 3,966 5,363 6,091 6,358
Short term liabilities (c) 137 176 235 294 297 487
Long term liabilities (d) 554 478 446 399 486 518
Debt 597 587 520 526 579 684
Total liabilities (c+d) 691 653 682 693 783 1,005
Paid in capital 400 571 571 689 689 689
Retained earnings 816 932 1,273 1,525 1,572 1,572
Total equity 1,448 2,551 3,284 4,670 5,308 5,352
50
0.41x
0.23x
0.16x
0.11x 0.11x0.13x
0.00x
0.05x
0.10x
0.15x
0.20x
0.25x
0.30x
0.35x
0.40x
0.45x
-
1,000
2,000
3,000
4,000
5,000
6,000
2014 2015 2016 2017 2018 Q1' 19
Investment Porperty Debt Equity Debt-to-Equity

PT Mega Manunggal Property Tbk
51
141.9 163.5 175.3
208.8
299.2
81.1 68.0
2014 2015 2016 2017 2018 Q1 19 Q1 18
Revenues
115.1 122.9 120.8 145.9
220.2
63.2 68.0
-
50.0
100.0
150.0
200.0
250.0
2014 2015 2016 2017 2018 Q1 19 Q1 18
EBITDA
1,447.50
2,551
3,284
4,670
5,308 5,352 5,308
0.00
1,000.00
2,000.00
3,000.00
4,000.00
5,000.00
6,000.00
2014 2015 2016 2017 2018 Q1' 19 Q1 '18
Equity
(Rp bn)
753
986
527
172
307
2016 2017 2018 Q1 '19 Q1 '18
Capex

2014 2015 2016 2017 2018 1Q 19
Operational metric
Net Leasable Area, m2
Built to suit 111,900 117,520 117,520 185,355 185,355 185,355
Multi tenants 46,237 52,011 46,391 45,015 115,325 115,325
Total, m2 158,137 163,911 163,911 230,370 300,680 300,680
Occupancy rate, %
Built to suit 98% 97% 100% 100% 100% 100%
Multi tenants 98% 97% 100% 99% 99% 98%
Average occupancy rate, % 98.0% 97.0% 99.9% 99.9% 99.4% 99.2%
Average remaining lease term, years 6.5 6.0 5.4 5.4 4.4 4.1
Revenue by segment
Revenue, Rp bn
Rental built to suit 99,160 99,922 106,313 137,015 188.718 48,063
Rental multi tenants 42,758 63,570 69,006 72,452 110.516 23,191
Total revenues, Rp bn 141,918 163,492 175,320 209,467 299,234 71,254
52
Built To Suit62%
Multi Tenant38%

PT Mega Manunggal Property Tbk
Section 6
53
Assets in Details

PT Mega Manunggal Property Tbk
54
Tanjung Priok
Seaport Industrial Estate
Ex pansion Area
Halim PK Airport
Pondok Ungu warehouse
Lazada Warehouse
Cileungsi Warehouse
Intirub Business Park
JababekaMM2100Cibatu Warehouse
Block AE Warehouse
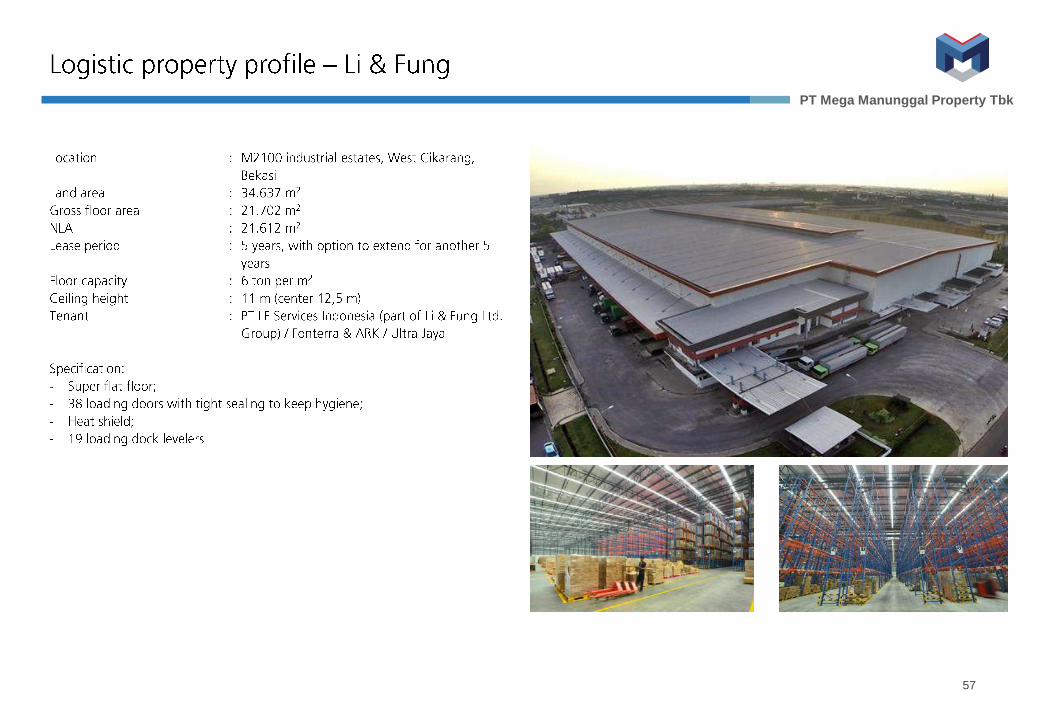
LF WarehouseSelayar Warehouse
Unilever WarehouseBlock H Warehouse
Delta Silicon
Airport warehouse
Soekarno-Hatta
Int’ l Airport
Toll Road in operation Toll Road under construction

PT Mega Manunggal Property Tbk
Tanjung Perak Port
Juanda Air Port
Toll RoadsIn Operation
Under construction
Planning
In (Km) Manyar Warehouse
Distance to Surabaya 31
Distance to Airport 52
Distance to Tanjung Perak Port 29
MMP properties
55

PT Mega Manunggal Property Tbk
56
PT Mega Manunggal Property Tbk
57

PT Mega Manunggal Property Tbk
58

PT Mega Manunggal Property Tbk
59

PT Mega Manunggal Property Tbk
60

PT Mega Manunggal Property Tbk
61

PT Mega Manunggal Property Tbk
Building value delivering result
63

PT Mega Manunggal Property Tbk
Cawang
Intersection Cikunir
Intersection
MM2100
Industrial Estate
63

PT Mega Manunggal Property Tbk
64

PT Mega Manunggal Property Tbk
Section 7
65
Other Financial Info

PT Mega Manunggal Property Tbk
Year to Mar 31, Rp mn 2014 2015 2016 2017
Cash and Equivalents 11,311 382,973 104,683 201,516 152,175 37.8%
Other current assets 57,381 127,100 92,962 189,163 245,981 11.5%
Property & equipment 2,107 13,483 13,342 12,327 11,917 -6.2%
Investment properties 2,036,806 2,388,400 3,318,776 4,592,009 411,671
Other non-current assets 17,183 283,590 433,700 368,645 5,693,167 -26.5%
Total assets 2,138,502 3,204,321 3,965,769 5,363,669 6,091,323
ST unearned revenue 23,528 25,281 42,641 25,398 47,993 237.1%
Bank loans - short term 35,636 124,911 89,859 164,117 159,905 30.0%
Other current liabilities 77,433 25,276 102,648 104,997 88,742 32.3%
Bank loan 541,288 460,646 427,901 361,161 419,068
LT unearned revenue - - 2,743 10,725 35,656
Other long term liabilities 12,762 17,180 15,717 27,081 31,731
Total Liabilities 690,647 653,294 681,509 693,479 783,096
Minority interest 2,673 2,916 393,675 885,106 1,302,443
Equity (exc. Minority) 1,445,182 2,548,111 2,890,585 3,785,083 4,005,784
66
*) : Unaudited

PT Mega Manunggal Property Tbk
Year to Dec 31, Rp mn 2014 2015 2016 2017
Revenue 141,918 163,492 175,320 208,794
Cost of revenue 13,084 16,059 18,444 20,146
Gross profit 128,834 147,432 156,875 188,647
G&A 14,616 25,754 39,143 46,202
Operating profit 114,218 121,677 117,732 142,445
EBITDA 115,031 122,852 120,756 145,984
Net interest income (expense) (42,818) (23,640) (29,262) (47,363)
Increase in fair value Invt Prop 261,127 64,787 323,288 217,211
Other items (23,165) 31,822 5,073 (1,272)
Profit before tax 309,363 131,003 416,831 314,051
Tax (14,192) (16,349) (17,624) (20,986)
Proforma adjustment (8,482) - -
Net income (after NCI) 286,404 114,415 342,166 252,262
67*) : Unaudited

PT Mega Manunggal Property Tbk
Rp mn 2016 2017
Cash flow from operating activities
Cash Receipt from Customer
Payment to Supplier and Others
Tax paid
Interest paid
Net cash provided by operating activities
Cash flow from investing activities
Acquisition of Investment Properties
Other investment activities
Net Cash Used in Investing Activities
Cash flow from financing activities
Loan Receipts from Bank
Payment to Bank Loan
Receipt from Paid in Capital
Others
Net Cash provided by Financing Activities
Net increase (decrease) in cash and cash equivalents
Effect of foreign exchange, net (4)
Cash and cash equivalent of subsidiaries - before acquisition
Cash and cash equivalent, beginning balance
Cash and cash equivalent ending balance
68*) : Unaudited

PT Mega Manunggal Property Tbk
Thank you

PT Mega Manunggal Property Tbk