prr.hec.gov.pkprr.hec.gov.pk/.../9399/1/Raza_Ullah_Agronomy_2018_UAF_HSR_18.0… · Web...
238
i
Transcript of prr.hec.gov.pkprr.hec.gov.pk/.../9399/1/Raza_Ullah_Agronomy_2018_UAF_HSR_18.0… · Web...

i
Allelopathic effects of crops (sorghum, sunflower and brassica) on
weeds, productivity and rhizosphere of mung bean (Vigna radiata L.)
By
RAZA ULLAH
M.Sc. (Hons.) Agronomy
2006-ag-1838
A thesis submitted in partial fulfilment of the requirements for the degree
DOCTOR OF PHILOSOPHY
I N A G R O N O M Y
DEPARTMENT OF AGRONOMY,FACULTY OF AGRICULTURE,
UNIVERSITY OF AGRICULTURE,FAISALABAD, PAKISTAN
2018
ii

iii

iv

Oh, Allah Almighty open our eyes,To see what is beautiful,
Our minds to know what is true,Our heart to love what is Allah
My Respected
PARENTS AND SUPERVISOR
Whose encouragement, spiritual inspiration, well wishes, sincere prayers and an atmosphere that initiate me to achieve high academic goals
ACKNOWLEDGEMENT
v

On the accomplishment of the present study, I would like to take this opportunity to extend
my deepest sense of gratitude and words of appreciation towards those, who helped me during the
pursuit of study. I deem it a proud privilege and feel immense pleasure to acknowledge all those who
are directly or indirectly involved.
I am thankful to the most Gracious, Merciful and Almighty ALLAH who gave me the health,
thoughts and opportunity to complete this work, I bow before my compassionate endowments to
HOLY PROPHET (SAW), who I sever a torch of guidance and knowledge for humanity as a whole.
Firstly, I would like to express my sincere gratitude to my supervisor Dr. Zubair Aslam,
Assistant Professor, Department of Agronomy, University of Agriculture, Faisalabad, for the
continuous support of my Ph.D. study and related research, for his patience, motivation, and immense
knowledge. His guidance helped me in all the time of research and writing of this thesis. I could not
have imagined having a better advisor and mentor for my Ph.D. study.
Besides my supervisor, I would like to thank the rest of my thesis committee: Dr. Abdul
Khaliq, Professor, Department of Agronomy, University of Agriculture, Faisalabad and Dr. Zahir
Ahmad Zahir, Professor, Institute of soil and Environmental Science, University of Agriculture,
Faisalabad, for their insightful comments and encouragement, but also for the hard question which
incented me to widen my research from various perspectives.
My vocabulary utterly fails in expressing my accolade to my father, Ghulam Muhammad
who brought me to this stage, who dreamed me to perform best in life by manifesting eternal
characters and they prayed for my success every time.
Cordial love and thanks to my loving brothers viz. Atta Ullah, Sana Ullah, Zaka Ullah, Zia
Ullah, Sakha Ullah, sweet Sisters, loving nice viz. Atta-ul-Mohsin, Atta-ul-Momin, Muhammad
Hanzala, Muhammad Musabe, Qari Ameer Moavia and Ameer Abdullah who exhibited a
prolong patience for my studies and whose support always energized me to perform the best.
Last but not the least, I pay my cardinal and sincere feelings for my (Late) Mother, whose
prayers are accompanied in the journey of my life. May Allah rest her soul in peace for ever
(Aameen).
The financial support from Higher Education Commission Pakistan (HEC) under project no.
20-2014/NRPU/R&D/12/4188 in titled with “Influence of crop allelopathy on microbial diversity of
rhizosphere” is highly acknowledged. I owe my gratitude to all those who have extended the help and
support in a way or other, in completion of this task.
(Raza Ullah)
vi

vii

Chapter-IV RESULTS AND DISCUSSION 424.1 Experiment-I: Effect of sorghum crop water extracts and residues on
weeds, productivity and rhizosphere of mung bean (Vigna radiata L.) 42
4.1.1 Weed dynamics 424.1.2 Crop data 454.1.2.1 Emergence and morphological traits 454.1.2.2 Yield and yield components 484.1.3 Rhizosphere soil analysis 484.1.3.1 Rhizosphere soil properties and nutrients dynamics 484.1.3.2 Rhizosphere soil microbial population, activity and enzymes 534.1.4 Economic and marginal analysis 564.1.5 Discussion 584.1.6 Conclusion 61
4.2 Experiment-II: Effect of sunflower crop water extracts and residues on weeds, productivity and rhizosphere of mung bean (Vigna radiata L.) 62
4.2.1 Weed dynamics 624.2.2 Crop data 654.2.2.1 Emergence and morphological traits 654.2.2.2 Yield and yield components 654.2.3 Rhizosphere soil analysis 704.2.3.1 Rhizosphere soil properties and nutrients dynamics 704.2.3.2 Rhizosphere soil microbial population, activity and enzymes 734.2.4 Economic and marginal analysis 764.2.5 Discussion 784.2.6 Conclusion 81
4.3 Experiment-III: Effect of brassica crop water extracts and residues on weeds, productivity and rhizosphere of mung bean (Vigna radiata L.) 82
4.3.1 Weed dynamics 824.3.2 Crop data 854.3.2.1 Emergence and morphological traits 854.3.2.2 Yield and yield components 854.3.3 Rhizosphere soil analysis 904.3.3.1 Rhizosphere soil properties and nutrients dynamics 904.3.3.2 Rhizosphere soil microbial population, activity and enzymes 934.3.4 Economic and marginal analysis 964.3.5 Discussion 984.3.6 Conclusion 100
4.4 Experiment-IV: Isolation of allelochemical resistant strains of bacteria and determination of their active role in rhizosphere 102
4.4.1 Isolation and purification of bacterial strains 102
4.4.2 Test resistance of bacterial against synthetic allelochemicals and allelopathic crops water extracts 102
4.4.3 Biochemical characterization 1054.4.4 Bioassays for plant growth promoting traits 1054.4.5 Discussion 1114.4.6 Conclusion 112
Chapter-V SUMMERY 1135.1 Experiment-I: Effect of sorghum crop water extracts and residues on
weeds, productivity and rhizosphere of mung bean (Vigna radiata L.) 113
5.2 Experiment-II: Effect of sunflower crop water extracts and residues on weeds, productivity and rhizosphere of mung bean (Vigna radiata L.) 114
5.3 Experiment-III: Effect of brassica crop water extracts and residues on weeds, productivity and rhizosphere of mung bean (Vigna radiata L.) 115
5.4 Experiment-IV: Isolation of allelochemical resistant strains of bacteria and determination of their active role in rhizosphere 115
viii

5.5 Conclusion 1165.6 Future research priorities 116
BIBLIOGRAPHY 117APPENDICES 138
ix

LIST OF TABLES
SR.NO. TITLE PAGE NO.
3.1Response of soil properties, nutrient dynamics, soil enzyme activities and microbial populations of the experimental soil before sowing (2014 and 2015)
29
4.1 Mean square of weed dynamics affected by sorghum crop water extracts and residues 43
4.2 Effect of sorghum crop water extracts and residues on weed dynamics in mung bean 44
4.3 Mean square of final emergence and morphological traits of mung bean affected by sorghum crop water extracts and residues 46
4.4 Effect of sorghum crop water extracts and residues on final emergence and morphological traits of mung bean 47
4.5 Mean square of yield and yield components of mung bean affected sorghum crop water extracts and residues 49
4.6 Effect of sorghum crop water extracts and residues on yield and components of mung bean 50
4.7 Mean square of soil properties in the rhizosphere of mung bean affected by sorghum crop water extracts and residues 51
4.8 Effect of sorghum crop water extracts and residues on soil properties and nutrient dynamics in the rhizosphere of mung bean at harvest 52
4.9Mean square of microbial population, microbial activity and soil enzymatic activity in the rhizosphere of mung bean affected by sorghum crop water extracts and residues
54
4.10Effect of sorghum crop water extracts and residues on microbial population, microbial activity and soil enzymatic activity in the rhizosphere of mung bean
55
4.11 Economics of mung bean grown in various allelopathic weed management strategies during 2014 and 2015 57
4.12 Marginal analysis for two years (2014-2015) 57
4.13 Mean square of weed dynamics affected by sunflower crop water extracts and residues 63
4.14 Effect of sunflower crop water extracts and residues on weed dynamics in mung bean 64
4.15 Mean square of final emergence and morphological traits of mung bean affected by sunflower crop water extracts and residues 66
4.16 Effect of sunflower crop water extracts and residues on final emergence and morphological traits of mung bean 67
4.17 Mean square of yield and yield components of mung bean affected by sunflower crop water extracts and residues 68
4.18 Effect of sunflower crop water extracts and residues on yield and components of mung bean 69
4.19 Mean square of soil properties in the rhizosphere of mung bean affected by sunflower crop water extracts and residues 71
4.20 Effect of sunflower crop water extracts and residues on soil properties and nutrient dynamics in the rhizosphere of mung bean at harvest 72
4.21Mean square of microbial population, microbial activity and soil enzymatic activity in the rhizosphere of mung bean affected by sunflower crop water extracts and residues
74
4.22Effect of sunflower crop water extracts and residues on microbial population, microbial activity and soil enzymatic activity in the rhizosphere of mung bean
75
4.23 Economics of mung bean grown in various allelopathic weed management strategies during 2014 and 2015 77
x

4.24 Marginal analysis for two years (2014-2015) 77
4.25 Mean square of weed dynamics affected by brassica crop water extracts and residues 83
4.26 Effect of brassica crop water extracts and residues on weed dynamics in mung bean 84
4.27 Mean square of final emergence and morphological traits of mung bean affected by brassica crop water extracts and residues 86
4.28 Effect of brassica crop water extracts and residues on final emergence and morphological traits of mung bean 87
4.29 Mean square of yield and yield components of mung bean affected by brassica crop water extracts and residues 88
4.30 Effect of brassica crop water extracts and residues on yield and components of mung bean 89
4.31 Mean square of soil properties in the rhizosphere of mung bean affected by brassica crop water extracts and residues 91
4.32 Effect of brassica crop water extracts and residues on soil properties and nutrient dynamics in the rhizosphere of mung bean at harvest 92
4.33Mean square of microbial population, microbial activity and soil enzymatic activity in the rhizosphere of mung bean affected by brassica crop water extracts and residues
94
4.34Effect of brassica crop water extracts and residues on microbial population, microbial activity and soil enzymatic activity in the rhizosphere of mung bean
95
4.35 Economics of mung bean grown in various allelopathic weed management strategies during 2014 and 2015 97
4.36 Marginal analysis for two years (2014-2015) 97
4.37 Test the resistance of bacterial isolates from mung bean rhizosphere against synthetic allelochemicals and allelopathic crop water extracts 103
4.38 Morphological characteristics of allelochemical resistant bacterial isolates from mung bean rhizosphere 106
4.39 Assessment of zinc activity of allelochemical resistant bacterial isolates from mung bean rhizosphere 107
4.40Assessment of cellulase enzyme, nitrogen fixation and phosphate solubilization activity of allelochemical resistant bacterial isolates from mung bean rhizosphere
109
xi

LIST OF FIGURES
SR.NO. TITLE PAGE NO.3.1 Weather data during the period of study (2014 and 2015) 29
xii

LIST OF ABBREVIATIONS AND SYMBOLS
ABBREVIATIONS AND SYMBOLS DESCRIPTIONSWE Sorghum water extractSR Sorghum residueSFWE Sunflower water extractSFR Sunflower residueBWE Brassica water extractBR Brassica residueg-1 Per gramg Gramm2 Meter squarecm Centimetercm-3 Per cubic centimeteroC Degree Celsiuskg Kilogramkg-1 Per kilogramha-1 Per hectare
RCBD Randomized complete block design
dS Deci semenµg Microgrammg MilligramEC Electrical conductivityhrs Hoursh-1 Per hourAK Available potassiumAP Available phosphorusN NitrogenOM Organic matterLSD Least significant differencemL Milli litterµL Micro litterL-1 Per litterL Littermin Minutesmm Millimeterm-2 Per meter squarem-1 Per meterNS Non-significantppm Parts per millionNP Naphthyl phosphateTPF Triphenylformazand-1 Per dayHI Harvest indexNM-92 NIAB MUNG-92T Ton
xiii

W WeightV Volumecfu Colony forming unitmax Maximummin Minimumtemp Temperature@ At the rate of% Percentet al. And othersi.e. That isviz. Namelyd.f Degree of freedomDAS Days after sowingcv. CultivarDAP Diammonium phosphateSOP Sulphate of potashCO2 Carbon dioxideC Carbonnm NanometerM MolarmM Milli molarrpm Revolution per minuteOD Optical densityRs. Rupees$ US dollar
xiv
AbstractThe present research work was conducted to evaluate the effect of allelopathic crops like sorghum (Sorghum bicolor L.), sunflower (Helianthus annuus L.) and brassica (Brassica compestris L.) on weeds, productivity and rhizosphere of mung bean during 2014 and 2015. Laboratory trials were conducted in Plant and Microbial Ecology Lab, Department of Agronomy, University of Agriculture, Faisalabad. Three sets of field experiments were conducted and repeated at Student Research Farm, Department of Agronomy, University of Agriculture, Faisalabad. In all three field experiments, crop water extracts (10 and 20 L ha -1) were foliar applied at 15 DAS and residues incorporation (4 and 6 tons ha -1) was done before sowing. Among all the treatments residue incorporation at 6 tons ha-1 showed the highest suppression of weed density, fresh and dry weight (sorghum; 62, 67, 65%, sunflower; 57, 66, 61% and brassica; 52, 61, 56% respectively). In case of soil properties significant improvement was observed by the application of crop residues at 6 tons ha -1 as compared with control. In all three field experiments maximum mung bean seed yield was improved (37%, 36% and 33%) by the application of sorghum, sunflower and brassica crop residues, respectively at 6 tons ha-1 as compared with control. Sorghum, sunflower and brassica residues incorporation at 6 tons ha-1 had higher net benefits (306, 339 and 347 $ ha-1, respectively) followed by 4 tons ha-1 during both years. In the fourth experiment the bacterial strains 4-17HM, C-14HM, C-17HM and 10-10M isolated from rhizosphere soil of mung bean which was amended by allelopathic crop water extracts and residues, showed the highest resistance against synthetic allelochemicals and allelopathic crop water extracts and the maximum nitrogen fixing, zinc and phosphate solubilization activity. So, the whole study was concluded that the residues incorporation of different allelopathic crops (sorghum, sunflower and brassica) was more effective than their water extracts application in weed suppression, improvement in soil health and productivity of mung bean. Application of crop residues at 6 tons ha-1 was the most effective and economical treatment with highest net benefit and marginal rate of returns. Due to their resistance and active role of bacterial strains in the rhizosphere, as nitrogen fixer, zinc and phosphate solubilizer, they could be applied with the allelopathic crop water extracts and residues to manage weeds and improve soil health.
xv

Chapter-I
INTRODUCTION
In the pulse industry, the term ‘mung bean’ refers to mainly green-seeded types with
pods borne toward the top of the plant. Mung bean (Vigna radiata L.) is an important pulse
crop and in developing countries it is the best alternative to meet the need of food for
increasing population. Among pulse crops, V. radiata L. is a good source of vegetable
protein and can play vital role in the national economy. Mung bean seeds contain 51%
carbohydrate, 26% protein, 3% minerals, 10% moisture and 3% vitamins (Ali et al., 2010).
In spite of short duration, nitrogen fixing character and nutritional superiority, mung
bean faces the weeds as main competitor when cultivated in spring and autumn seasons.
Long season weed-crop competition reduces the green pod yield by 45.60% (Pandey and
Mishra, 2003). There are several methods for controlling weeds like cultural, manual and
chemical methods. Although hand weeding and herbicide application are considered
effective weed management practices (Cheema et al., 2003). The shair of herbicides is 15%
in the total pesticides used globally, (Gupta, 2004). In Pakistan, herbicide use was increasing
day by day due to the intry of mechanical tools in agriculture system. In underdeveloped
countries, the misuse of agro-chemicals are high as compared to developed one due to less
awareness about the safety measures of agrochemicals; low literacy rate and lack of skill to
handle and apply farm chemicals as per recommendations (Tariq et al., 2007). The misuse of
agro-chemicals caused degradation in environmental quality, tolerance in pests and
disturbance in human health. In agri industry worldwide 3 million tons of herbicides are
currently used annually. Due to the judicious use of herbicide, resistant weeds have become
more prolific (Shibayama, 2001). To overcome these problems, it is a need of the time to
think about alternatives for sustainable weed management that may help in improving quality
and production of crops by reducing herbicides use and burden of manual weeding (Farooq et
al., 2011a).
Improving in quality and yield of crops is an urgent task for agri-scientists of recent
era, to meet the need of food requirement of increasing global population that is projected to
exceed 9 billion by 2050 (Khanh et al., 2005; World Resources Institute, USA, 2014). To
1

provide food for this increasing population it must be possible through agronomic approaches
which improve crop yield and friendly for ecosystem. Crop allelopathy is an agronomic
approach for managing weeds which may improve yield without environmental risk, the
important concept for world younger scientists to work and secure the world’s food supply
for future generations.
Inhibition due to chemical compounds is well documented and it was the known
aspect of allelopathy. Directly or indirectly the inhibitory character of chemical compounds
has been used for managing weeds. In case of crop allelopathy, a lot of work has been done
to explore their inhibitory potential for managing weeds (Cheema et al., 2004; Farooq et al.,
2011b). Water extracts of sorghum and sunflower crop has ability to control weeds by 50%
and 40%, respectively (Naseem et al., 2010). Tawaha and Turk (2003) found a water soluble
allelochemicals in black mustard which cause inhibition in germination and growth of other
plants. Allelopathic crop residues have also ability to suppress weeds, improve soil health
and harvest better yield (Khaliq et al., 2015). Cheema and Khaliq (2000) stated that sorghum
residues incorporation after chopped into small pieces suppressed dry weight of weeds from
26 to 56% which increase yield from 6-17%. Khaliq et al. (2011) told that the dried residues
of crops (sorghum, sunflower and brassica) showed phytotoxicity against weeds.
Crop allelopathy has an important concern in weed research and accepted as an
important eco-logical phenomenon very recently. It has been studied exten-sively in recent
past as a possible tool to manage weeds in agro eco-systems. Many works has shown the
water spray of allelo-pathic crops can be used to reduce the dose of herbicides and by adding
in crop rotation or residue icorporation of such crops aslo help in weeds suppression. Release
of organic compounds (secondary metabolites) in rhizosphere is an important aspect of such
allelopathic crops but has not been investigated. Root exudation, residue degradation and
volatilization through allelopathic crops modifyied the soil rhizosphere and to significant
extant biotic transformations take place. High allelopathic nature of such crops (sorghum-
sunflower-brassica) and their affect on weeds and rhizo-sphere of soil etc. encouraged the
idea to check the feasibility of water extracts and residues of these crops using as bio
herbicides to manage weeds in mung bean crop in comparison with synthetic herbicides.
Bhowmik and Inderjit (2003) opinioned that whether the allelochemicals impact microbial
ecology and physiochemical status of soil or not, must be established before they will be used
2

on large scale to manage weeds in agro-ecosystems. Alternatively, allelochemicals would be
the final products in the market in the future as alternate of commercial herbicides. It is
therefore, hypothesized that to manage weeds in mung bean crop through allelopathic water
extracts and residues of crops may influence physical, chemical and biological traits of
rhizosphere. The main objectives of this work would be
1. To determine the allelopathic effect of water extracts and residues of sorghum, sunflower
and brassica on weed density and mung bean yield.
2. To study the physical, chemical and biological traits of rhizosphere as modified by the
application of allelopathic crop water extracts and residues.
3. To work out the economic efficiency of various treatments.
Chapter-II
3

REVIEW OF LITRATURE
2.1. Allelopathy and allelochemicalsThe word allelopathy is derived from two words “Allelon” and “Pathos”. These both
words are Greek words which mean “each other” and “to suffer i.e. the injurious effects of
one upon another” respectively. Mostly scientists used this term in a restricted sense. They
only describe its harmful effects (one higher plant upon another). It is a complex
phenomenon between phenolic compounds and allelochemicals concentrations. It has both
inhibitory as well as stimulatory effects, which may be decided by the concentration of
allelochemicals present in extract.
Chemical compounds that impose allelopathic effects are called allelochemics or
allelochemicals. These are chemicals produced by secondary metabolism or microbial
decomposition. These are non-nutritive substances and active group of allelopathy. Based on
chemical similarities the allelochemicals are classified into 14 categories (Rice, 1984). Plant
organs like plant roots, plant rhizomes, plant leaves, plant stem, plant bark, plant flowers,
plant fruits and plant seeds are the best source of chemical release in soil through leaching
volatilization, root exudates, and decomposition (Cecile et al., 2003). Crop and soil
researchers, weed experts and natural product chemists are ongoing to study this interesting
area and published data regarding allelopathy are increasing expo-nentially (Macias,` 2002).
`Allelopathy` have significant role in agri-industry to manage weeds by releasing
allelochemicals from plant parts (plant roots, plant leaves, plant flowers, plant stem and plant
seeds) (Uchino et al., 2012).
2.1.1. Concepts of scientific community related to allelopathy
Due to improvements in agri-science, allelopathy has become a well-known scientific
concept. Young scientists of current era got more attention to this interested concept of
allelopathy. In agriculture production system the use of synthetic/manmade chemicals
(insecticides, herbicides) are extensively increased by farmer community. This extensive use
is dangerous for public health as well as for whole environment. So, it is a need of time to
find novel and ecofriendly practices like allelopathy. Many scientists had studied regarding
Allelopathy of field crops. They reported that it is an asso`ciation between crop plants whose
4

affect may be positive or negative it depends on the concentration of allelo-chemicals. This
positive or negative effect is due to the release of bio-chemicals known as allelochemicals.
Firstly the research related allelopathy was started by Rick Willis, (1985). He presented three
evidence related allelopathy study. Firstly, he said that the plant must release chemicals.
Secondly, the accumulation of allelochemicals in soil does not disturb the water and nutrient
uptake. Thirdly, plant activities are not inhibited by biotic or other soil physical factors.
Mostly scientists related to allelo-pathy are working on it, to explore its charactiristics
more and more. Most of organic compounds are water soluble, possessing inhibitory effects.
After extraction in water or any other solvent they can be used as ‘nature’s own herbicides’.
Water extract of allelopathic crops is the best option to manage weeds under sustainable crop
production. The crop water extracts have significant effects in many studies (Shahid et al.,
2007; Iqbal and Cheema 2008; Jamil et al., 2009). Water extracts containing bio-chemicals
called allelochemicals have inhibitory or promotory effects on the growth of target organisms
(Narwal, 1994). The negative or positive effect of organic compounds is totally dependent
upon its concentrations. Its negative effects increased by increasing concentration and
decreased by decreasing concentration (Farooq et al., 2009b).
In agri industry the concept related to allelochemicals “Suppress or inhibit weed
growth at higher concentration” was firstly presented by Putnam and Duke (1974). They said
that this suppressive affect of` field crops can be used to manage weeds as cover crop,
intercropping and rotations in crops (Putnam and Duke, 1978). Crop allelopathy may affect
the growth of weeds, pathogens, insect, and pests (Huerta et al., 2010; Xuan et al., 2005;
Raghavendra et al., 2006; Ren et al., 2008; Jabran et al., 2010; Khanh et al., 2005; Joseph et
al., 2008).
So, that’s the reason why, the concept of allelopathy is gaining more attention by
researchers. At higher concentration it the best alternative of man made/synthetic chemicals
for managing weeds. The strong allelopathic effects of crops have potential which can fulfill
the need of synthetic/manmade agro-chemicals as traditional herbicides for controlling weeds
(Makoi and Ndakidemi, 2012).
2.1.2. Presence, nature, mode of release and action of allelochemicals
Plant parts i.e. leaves, stems, roots, rhizomes, seeds, flowers and pollens have
allelochemicals. Each plant part has different concentrations of allelochemicals (Kruse et al.,
5

2000). Mostly allelopathic crop plants store their protective allelochemicals within their
leaves, especially during fall. When the leaves separate from plant and come to the ground,
they decompose and release toxins which can affect neighbor plants. Maple, pine and
eucalyptus trees are great examples of release of allelopathins through their leaves. Some
crop plants also release their toxins by roots, which are then absorbed by other plants.
Due to hydrophobic nature these bio chemicals recognized as phenolics, alkaloides,
flavonoids and glyccosides e.t.c. in various environments (`Lu,`2011). Few decades past the
scientists have been concentrating to iso-late and iden-tify these bio chemicals. Gu-enzi and
Mc Calla (`1966`) isolated and identified bio chemicals (p-coumaric, ferulic, vannillic, p-
hydroxy-benzoic and syringic acids) in different crop residues (maize-wheat-sorghum). Chlo-
rogenic, iso-chlorogenic acid, scopolin and a--naphthol derivatives were isolated and
identified by Wilson and Rice (1968) in sunflower. From Oryza sativa L. coumaric, p-
hydroxybenzoic, ferulic and vanillic acids were isolated and identified (Ch-ou and Lin, 1976;
Man-dava, 1985). Ein-hellig et al. (1982) reported possɨble dervatіves like trans-cinnamic,
caffeic, p-coumarіc and ferulіc acіds. Bio chemicals (ferulіc and coumerіc acіds) secreted
from wheat has in-hibitory pro-perties against the weed plants (prіckly-sіda and mornіng-
glory) (Wor-sham, 1984). Sorghum root exudate (sorgoleone) was found to be phyto-toxіc to
several weed plants (Nctzyl and Butler, 1986).
Bio chemicals or met-abolites released through vola-tilization, leaching, exu-dation
and decom-position processes. Vola-tіlіzatіon, leachіng, adsor-ptіon and mіcrobіal-actіon
depends upon persis-tence of bio chemicals іn soіl. Releasing pathway of allelochemicals into
the environment varies from one plant species to another. The following are known
pathways: (1) Leachate and chemical runoff from plant stem and leaf by washing off by
rainfall. (2) Exudates from different parts of plants (Halligan, 1973); (3) Release of toxic
material by decomposition of material such as rye mulch. (4) Release of toxic compounds
from the plant roots. Living rice plants suppressed weed growth (Olofsdotter et al., 2002;
Chon et al., 2006). Allelopathins are very strong chemicals agents which target crucial
processes in plants to alter various physiological and biochemical processes like respiration,
transpiration, mineral uptakes, photosynthesis, etc. that result in plant growth inhibition,
stomata closure, alteration of mineral uptake, alteration in enzyme activities, induction of
moisture stress and hormonal imbalance (Gniazdowska and Bogatek, 2005). In case of
6
respiration, juglone disrupt the uptake of oxygen. Uncoupling of oxidative phosphorylation
and inhibition of electron transformation was caused by Alphapinene. Camphor, limonene
and other monoterpenes significantly affect the radicle and hypocotyl. They also inhibit
production of mitochondrial ATP, decreases mitochondrial transmembrane potential and
impairs mitochondrial energy metabolism (Hejl and Koster, 2004). During photosynthesis
allelochemicals mainly damage synthesis machinery and acceleration of decomposition
photosynthetic pigments. Due to this damage, photosynthetic pigment contents are decreased
consequently, block electron energy transfer, reduce activity of ATP synthesis enzymes, and
inhibit ATP synthesis, and stomatal conductance, which inhibit the process of photosynthesis
(Meazza et al., 2002; Yu et al., 2006; Wu et al., 2004). Further, allelochemicals are also
involved in altering the micro and ultra-structure of cells, altering protein and nucleic acid
biosynthesis, imbalance of antioxidant enzymes and influence on plant growth regulators.
Moreover, the effect of allelopathins on microbial community and ecological environment is
equally effective (Cheng and Cheng, 2015).
2.2. Factors affecting allelopathic compoundsAllelochemicals release, its types and amount into environment depends on plant as
well as environmental factors (Albuquerque et al., 2010). The plant factors consist of plant
species, variety, growth stages and various tissue organs (Iannucci et al., 2013). Zhang et al.
(2010) was conducted an experiment to check allelopathic effect of eucalyptus roots and its
associated rhizosphere soil on weed growth and germination. Their results show that water
extract of roots suppressed growth and emergence of Raphanus sativus plants. Plants of same
environment do not have similar production of secondary metabolites, and they may not
secrete same quantity and quality (Imatomi et al., 2013). Furness et al. (2008) reported that
Hounds tongue plants under high ultraviolet-B radiation increased their allelopathic
influence.
Soil properties and micro flora could influence allelopathy phenomenon in soil.
Under nutrient deficiency debris from Helianthus annuus L. plants showed to be more
effective than debris from control. Soil microbes greatly influence bio-activity and
availability of allelochemicals in soil environment (Inderjit, 2005). Accumulation of
allelopathins at phytotoxic levels in soil is largely determined by the presence of
microorganisms. Soil microbes commonly use allelopathic compounds as carbon sources
7

(Sene, 2000). Soil pH also affects adsorption, desorption and transport in soil and the
metabolism of allelochemicals which in turn could result in modification of expressed
response on growth of receiver plants (Kobayashi, 2004). Pramanil et al. (2000) reported that
synthesis of allelochemicals depends on light intensity, photoperiod and temperature. In
general, longer photoperiod and high temperature is favorable for the releasing of
allelochemicals.
2.3. Classification of potential allelopathic effectsA potential allelopathic effect was classified in two parts by Inderjit and Weiner
(2001). In-direct plant to plant allelopathic interference, A plant produce X compound, which
interfere with B plant. In-direct soil interactions can be further divided into three parts. First
part is indirect-allelopathy, A plant produces X compound which is degraded/transformed by
C microbes into Y compound, which interfere B plant. In induced-allelopathy A plant
produces X compound which released and induced D organism to produce Z compound
which interferes with B plant. Second part is indirect-toxicity X compound interacts with soil
and produces Z compound, which interferes with B plant. The third part is effect of indirect-
environment X compound causing a change in soil-environment, which affects soil nutrients.
It also reduces growth and reproductive output of B plant, without toxic effects.
2.4. Types of allelopathy2.4.1. Weed on crop
Weeds as they have very high allelopathic potential may affect growth and emergenc
of recipient plants. El-Khatib et al. (2004) stated that allelopathy has a major role in deciding
patterns and succession in any eco-systems. Firstly, human activities affect on dominance,
substitution or extinction of species, and secondly, allelopathy. The interactions exhibited
through allelopathy of weeds and play a vital role in normal as well as manipulated eco-
systems. The nature of any plants depends on the presence of various allelochemicals in it.
Since, agriculture origin, weeds are linked with field crops and reduced their yield. Many
scientists have described allelopathic potential of weeds on field crops. Inderjit (2004a,b) had
given a comprehensive biology and ecology of weeds in agricultural systems. These weeds
have evolved with indigenous or traditional agriculture e.g. Echinochloa evolved with rice
cultivation in Japan. Plant residues, root exudates; leaf and seed leachates/extracts of weeds
had inhibitory allelopathic effects on different crops (Ambika and Smitha, 2005; Batish et al.,
8

2005 and Tajuddin et al., 2002). Root extract of Parthenium hysterophorus test on cluster
bean, amaranthus and lady finger in lab. Results showed that all extracts inhibited
germination and dry matter in order to cluster bean > amaranthus > lady finger. The
variations in effects might be due to changes in plant composition and allelochmicals during
different stages of plant (Gupta, 2000).
Channappagoudar et al. (2003) check allelopathic potential of Cyperus rotundus,
Commelina bengahalensis, Parthenium hysterophorus, and Prosipus juliflora at two
concentrations (5 and 10%) on sorghum, wheat, green gram, soybean, sunflower and
groundnut. The results revealed that water extracts inhibit seed germination, growth of
seedling length and vigor index. Among the crops tested groundnut and wheat were more
resistant to allelopathic effect to weeds. A lab study was done by Sannigrahi and
chakraborthy (2005) to check allelopathy of different weeds. All these weed plants inhibit
germination of tomato crop. Water extracts of I. sepiania and C. odoratum leaves showed
highest inhibitory effect on tomato germination. Allelopathic activities of weeds were
assessed on vegetable crops. Incorporation of shoot residues reduced the growth of seedling
of all crops. Whereas, residues used as a mulch delayed emergence of seedlings (Obaid and
Qasem, 2005). The bioassay study showed that aqueous leachates of dry plant parts of nut
sedge (Cyperus rotundus) inhibited seedling emergence and growth of okra, bitter gourd and
onion. Perhaps due to the presence of phenolics acids (Ameena and George, 2002).
2.4.2. Weed on weed
Parthenium allelopathy is well documented by many researchers (Batish et al., 2002;
Singh et al., 2003; Singh et al., 2005) and plant parts i.e. pollens and plant tri-chomes have a
number of allelochemicals which are water soluble (Kohli et al., 2006). Kathiresan (2000)
found that parthenium (dry powder) was most effective against Eichhornia crassipes. The
adverse effect foliar spray of parthenium leachates against Ageratum conyzoides, Avena fatua
and Bidens pilosa are well acknowledged (Batish et al., 2002a). High concentration of
parthenium water extract significantly suppressed germination, length of seedlings of Avena
fatua (Batish et al., 2002a). Aslam et al. (2014) studied parthenium allelopathy against Avena
fatua and Phalaris minor germination and growth. They said that leaf extract inhibited
germination of test plant as compared with whole plant and root water extracts at all
concentrations.
9

Sinha and Singh (2004) rported that growth and emergence of Parthenium
hysterophorus was found restricted by 25% leaf extract of Xanthium stromanium. A
significant reduction was also recorded in root/shoot length; seedling vigour and vigour index
of Parthenium by leaf extract treatment of X. stromanium. The water extract of Lantana
camera (fresh and dry leaves) inhibited the growth of water hyacinth (Zhung et al., 2005).
The effects of cogon grass foliage and root residue extracts on emergence, radicle and
coleoptile growth of barnyard grass, brown top millet, Bermuda grass, hemp sesbania, Italian
ryegrass, and prickly sida were investigated in laboratory by Koger and Bryson (2004). The
results showed that cogon grass residues (foliage and root) extract inhibited bermuda grass
and Italian rye grass germination. Germination of Bermuda grass and Italian rye grass was
reduced by as much as 62% and radicle and coleoptile growth by as much as 96% at the
highest extract concentrations. Foliage and root residues extract reduced germination of
barnyard grass, brown top millet, and prickly sida 52 to 64% and seedling growth by as much
as 96%. Mengal et al. (2015) studied water extracts of weeds on weeds of wheat. They
reported that that Convolvulus arvensis at 60% resulted in a positive impact on weed number
and biomass. Penna et al. (2003) stated the suppressive effect of Chenopodium ambrosioides
on Bidens pilosa germination. The research on allelopathic properties of weeds, weed-weed
interactions, characterization of allelochemicals, mechanism of release and weed
management, is well documented.
2.4.3. Crop on weed
Many allelopathic crops have potential to produce various allelochemicals into the
environment which leads to suppress weed growth in their vicinity. Here we discussed only
essential crops which have been documented for their allelopathic effect on weeds. Sor-
ghum, rice-sunflower-brassica and maіze resіdues and extracts contaіn-many allelo-chemіcals
whіch are use-ful and cost-effective to manage weed plants. Cheema and Khalіq (2000)
investigated the impact of water extract and residues of sorghum to manage wheat weeds.
They showed that 2, 4, and 6 Mg ha-1 sorghum stalk incorporation significantly suppressed
weed dry biomass (42, 48, and 56%, respectively). In case of water extract spray of sorgaab
reduced weed dry weight (35 to 38%). Rice exudates and decomposed residues contain a
large number of allelochemicals and reduced growth of plant specіes present іn theіr vіcіnіty
(Rіmando and Duke, 2003).
10

Extracts of sunflower roots, stems and leaves caused sіgnіficant іnhіbіtіon іn dry
biomass of weed (Anjum et al., 2005). Residues of sunflower crop reduced Cyamopsis
tetragonoloba and Pennisetum americanum growth. This reduction was due to the phenolics
released through decomposition of sunflower tissues (Batish et al., 2002). Siemens et al.
(2002) evaluated that cultivated/naturally occurring brassica plants have allelopathic effect
for many years, mustards form comparatively pure stands. Narwal et al. (2004) indicated that
Brassica spp. caused highest decrease (75 to 82%) in germination and 75 to 98% weeds
density. Rape-seed residue incorporation in soil before sowing of cotton crop reduced the
germination of Amaranthus spp. (A. retroflexus and A. theopherasti) whіle germіnatіon of
cotton crop remaіned unaffected; thіs was due to release of secondary metabolites during
decomposition of rape seed (Younesabadi, 2005).
2.5. Allelopathy in crop productionThe chemical nature of bio products confirmed that many crop plants have strong
allelopathic potential. The allelo-chemicals present in those crop plants affect on growth-
promoting strategies to obtain better growth-development and graіn yіeld of crop. The several
crop-plants (sor-ghum, sun-flower, bra-ssіca, rіce, maіze, mul-berry and morіnga) have
maximum allelopathіc potentіal and keep various allelo-chemicals. When these are used as
mulch//cover crop found to be bene-ficial and eco-nomical in im-proving yield of field crops.
It also found that allelochemicals of these crops can be used for increasing crop-production
with good quality food (An et al., 2005). In previous studies, crop allel-opathy in the field of
agri-culture has been debated in detail (Put-nam and Duke, 1978; Weston, 1996; Singh et al.,
2001).
2.6. Allelopathy for managing weed floraWeeds are very problematic, damaging and harmful for field crops. These cause
many pro-blems in cropping systems. De-crease in crop-yields is the most vital and im-
portant features which is due to inter-ference i.e. com-petition and alle-lopathy or both. To get
higher yield farmers are depend upon artificial products to meet problems due to weeds
(Sadeghi et al., 2010). The term “allele-chemicals” originally coined for naturally found bio
chemicals in plant body by Whittakar in 1970, whіch can be used for weed-control. These
allele-chemicals affect plant growth it depends upon their con-centration. At higher con-
centrations these che-micals act as herbicides to manage weed plants (Cousens and Mortimer,
11

1995). In Pakistan, several methods are ad-apted to manage this issue (weed control) like use
of selective herbicides or mechanical control, but all these methods are failed to solve this
threat. Due to high prices of weedicides, gro-wers often want to trust on alternate app-roaches
to manage weeds.
In agri-culture, due to their allelopathic nature more than 250 weed species are
causing ver serious problem (Patterson, 1986). To tackle these issues herbicides are heavily
sprayed. It causes various environmental problems and also increased herbicide resistance in
weeds. Hence, a natural weed controll stratigies may be select in agricultural system. Almost
all parts of crop plants are allelopathic in nature and have inhibitory or positive effect for
weeds of barley and canola (Ashrafi et al., 2009; Asghari and Tewari, 2007; Niakan et al.,
2008; Zaji et al., 2009).
The trust on organic-substances in agri-culture production-systems has increased
manifold all over the world (Jamil et al., 2009). It is the need of time to find an alternative
practice to reduce dependence on traditional practices and synthetic chemicals for managing
weeds. (K-hanh, et al., 2005; Farooq et al., 2011-b). Alle-lopathy of crop plant has a great po-
tential to solve this-issue and used to manage weeds by different ways.
2.6.1. Intercropping of allelopathic crops
Inter-cropping of allelopathic crops has been found to be active and an alternate
method to manage weeds. Grow allelopathic crop at the same time in the same field cause
weeds suppression (Baumann et al., 2000). To prevent competition between both crops tose
crops are cultivated which have same physіo-logіcal, morpho-logіcal features. Vandermeer
(1989, 1992) said that these crops provіde chances to destroy weeds by compeeting for
resources (consume more portіon of present resources). Inter-cropping of allelopathic crops
may be favorable to decrease the use of herbicides and reduce the labor cost to manage
weeds (Chou, 1999). In maize, growing of groundnut and sweet potato as intercrops
suppressed weeds and yield losses was decreased. It also saved time which is compulsory for
managing weeds (Steiner, 1984).
Density of weeds reduced in inter-cropping as compare with sole crop due to releasing
of bio chemicals from the inter-crops (Liebman and Dyck, 1993). Inter-cropping of pea and
barley resulted more competition to weeds and in-organic soil nitrogen re-sultantly used for
the pro-duction of graіns as a subs-tіtute of weed-bіomass, as compare to sole crops (Hau-
12

ggaard-Nielsen et al., 2001). Brainard and Bellinder (2004) said that when crops grown
together as inter-crop it increased fertility of soil. It inhibits weeds but also reduced the іnsect,
pest and dіsease compitiotion. Cotton and black gram also sіgnіficantly improved yield when
grown as іnter-crop by managing weeds (Jayakumar et al., 2008).
2.6.2. Crop allelopathy as cover crop/mulch
Allelopathic crops as cover crop or mulch have an effective role for managing weeds
in sustainable agriculture. Residues of crops are used as cover crop producrd bio-chemicals
which inhibited the weed plants (Barnes and Putman, 1983, 1986). Crop residues as mulches
also produced allele-chemicals and showed greater effect against weed plants (Weston,
1996). Sorghum mulche (3.50, 7.00, and 10.50 tons ha-1) inhibited (22 to 62% and 56%,
respectively) total number of weeds (Cheema et al., 2000). In maize crop, weed reduction
(26-37%) was observed by sor-ghum-residues (10-15 Mg ha-1) used as-surface mulch
(Cheema et al., 2004). Ahmed et al. (2000) also reported 78% inhibition in weight of weed
when sorghum was used as surface mulch. Philarus minor density and biomass was
decreased (45-53%, res-pectively) due to sor-ghum-residues (15 tons ha-1) as surface mulch. It
suppressed 40% weed density and and 50% dry mass (Mahmood and Cheema, 2004).
Similarly, in organic farming system sun-flower mulch is also con-sidered as an
approach to manage weeds. Residues sunflower crop as mulch in legumes or wheat were
found to be very effective to controll weeds (Gr-wronski et al., 2002; Bernat et al., 2004).
Crop-residues (soybean, corn and sunflower) were used as mulch to compare with soy bean,
corn and sunflower grow as cover crop. The results showed that residues as mulch were more
effective than cover crop in controlling weeds (Barker and Bhowmik, 2001)
2.6.3. Water extracts of allelopathic crops
Water extracts of sorghum and sunflower crops have been found to be very-affective
to manage weeds (Cheema et al., 1997). Tri-anthema portula-castrum L. growth was
decreased when water extract of sorghum crop (100%) was used. Its germination was reduced
by 15-20%. At higher concentrations (75 and 100%) root and shoot length of T. portula-
castrum L. was also sig-nificantly reduced (Randhawa et al., 2002). Naseem et al. (2009) also
reported that by applying concentrated sunflower extract it suppressed the growth and
emergence of little seed canary grass (Phalaris minor L.) by 16.30% as compared to distilled
water. Similarly, Irshad and Cheema, (2004) said that fresh biomass inhibition (37-41%) of
13
Echinochloa crusgalli L. was observed by spray of sorghum extrat (sorgaab). Seedling
growth of Physalіs angulata L. inhibited by water extract of Brassіca-spp. (Ure-mіs et al.,
2005) and reductіon (38 to 41%) іn barn--yard grass dry bio-mass was noted by the spray of
sorgaab (sor-ghum water extract) (Irshad and Cheema, 2005).
2.6.4. Applіcatіon of allelopathic crop water extracts as a mixture
Allelopathіc crop water extracts mix wіth organіc materіal can іncrease the all
elopathіc potentіal (Blum, 1999). Allelo-chemical compounds lіke p-coumarіc and ferulіc
acіd have been reported to be more suppressіve. But іn combine application both compounds
reduced seed germination, shoot elongation. It also showed that the combine application is
more effective than individual (Rasmussen and Einhellig, 1977). It also noted that the
іnhіbіtory effect of trans-cіnnamіc acіd was іncreased by 17 times when applied іn combіne
form wіth bіcyclіc-sesquiterpene-dіaldehyde (Fujita and Kubo, 2003).
Chemical (herbicides) and manual weed control methods are more efficient as
compared to allelopathy but allelopathic weed control method is eco-friendly. Further, it was
also reported that combine application of allelo-chemicals and herbicides perform better to
inhibit weeds. Cheema et al. (2003b) described that the use of allopathic crop extracts with
lower dose of herbicide was an eco-nomical method to manage weeds. They noted that by
using sorgaab with herbicide can be reduced up to 67%. In cotton crop sorgaab (10 L ha -1)
with 1/3rd pendi-methaline and s-metolachlor dose may be used to manage weeds (Cheema et
al., 2003a).
2.6.5. Incorporation of allelopathic crops residues
Incorporation of allelopathic crops residues release allele-chemicals which interact
with microbes, generate biotic stresses and affect the growth of plants. These microbes used
minerals, H2O and O2 as energy sources during decomposition process of crop residues and
compete for food with plants (Javaid and Bajwa, 1999). Sorghum crop residues can be used
to manage weeds in field crops (rice, brassica, wheat, maize and mung bean). It is an in-
expensive and recognized practice in agricultural system (Mahmood and Cheema, 2004).
During decomposition sorghum crop residue released a large quantity of phe-nolics which
affected the upcoming crops (Sene et al., 2001).
14

2.7. Allelopathic potential of cropsIdentification of toxicity level of chemicals released from allelopathic plants is
important for controlling weeds. Putnam and Duke (1974) firstly utilized crop plant which ha
allelopathic potential to suppress weeds in agri industry. Later these allelopathic crops were
used in intercropping, cover-crop/mulch, or rotation in crops for managing weeds
(Worthington and Reberg Horton, 2013). Many crops have potential to produce various
allelochemicals in the environment which lead to suppressing the weed growth. In addition,
Farooq et al. (2013) reported that crop allelopathy was also used for mitigation of stress,
managing pests, and enhancement in crop production. Screening for best genotypes which
have high allelochemicals has been used in many studies under exogenous conditions, and
suggest to collected that crop which have different ability to inhibit weeds (Gupta, 2011).
Various attributes i.e. pattern of roots, vigor, size of leaf, and allelopathic potential can make
one cultivar more viable with one weed than other (Andrew et al., 2015).
Today, most secure and eco-friendly strategies to manage weeds are the need of
world. Various practices used in agri industry like minoring, minimum tillage, rotation,
mulch/cover crops, etc., need knowledge for previous allelopathic interactions that can occur
between the plant species involved. Variations in cropping patterns, problems in crop
replantation and fruits on or-chards trees or low production could be a negative indication of
allelopathy (Chon et al., 2006).
Present knowledge of plant bio-chemistry proved such crops which release
allelochemicals they may be manipulate to manage weeds to minimize the use of herbicides.
Allelopathic crops residues and water extracts contain various allele-chemicals which are
useful and cost effective to manage weeds. Many crops have been documented due to their
allelopathic action. This allelopathic action of crops depends on crop variety, fertility status
of soil, climatic conditions, weed competition type, and availability of water. Here, sorghum,
sunflower and brassica have been debated in following parts for their allelopathic potential
against weeds.
2.7.1. Sorghum allelopathy
Among the world’s cereals, sorghum (Sorghum bicolor L.) has 5th position in terms of
acre age. Primarily it is grown in Africa, India, China, South America, and stress prone areas
of the United States. In Asia and Africa, it is a staple food for over three hundred million
15

people (Able et al., 2001; Subudhi and Nguyen, 2000; Able et al., 2001). Due to its
allelopathic ability it is the most extensively studied crop as compared with others. Its
allelopathic potential depends upon age and genotype, location or environment, and cropping
system. All above factors affect the allelochemicals production which impact plant growth in
field, lab, or in greenhouse. In sorghum seven allelopathic compounds viz. p-
hydroxybenzoic, protocateuic, syringic, p-coumaric, gallic, benzoic and vanillic acids have
been identified (Iqbal and Cheema, 2008). Allelopathy of sorghum crop to manage weeds has
been exposed to wide studies with the objective of using this concept for managing weeds.
Various approaches have been used including sorghum water extracts, residue as mulch or
cover crop or incorporation in soil, and in rotations of crops (Weston et al., 2013). In this
part, potential of sorghum water extracts and residues for managing weeds is reviewed.
2.7.1.1. Sorghum crop water extract
Globally, a lot of work has been done to check the allelopathic ability of sorghum
water extracts. In Pakistan, water extracts of mature sorghum plants is known as sorgaab.
The formulation of sorgaab is to put the sorghum chopped residues in water (distilled) with
1:10 ratio of w/v for 24 hours. After that time filtration was done and filtrate was preserved
in clean bottles for further use (Cheema and Khaliq, 2000). The use of sorgaab to manage
weeds in several crops, especially in wheat, maize, mung bean and mustared have been
studied by different researchers i.e. Ahmad et al. (2000), Bahatti et al. (2000), Cheema et al.
(2001) and Cheema et al. (2002). The results showed that a significant increase in crop yield
was observed by foliar spray of sorgaab at different times after sowing which caused highest
weed suppression. The increase in yield was also depending upon both concentration and
number of foliar sprays. For example, one foliar spray of sorgaab resulted in 13.5% more
yield, while two foliar sprays increased 18.6% yield (Cheema and Khaliq, 2000).
Shah et al. (2016) assessed the allelopathic effect of sorghum crop to improve yield
of sunflower. The results showed that 93.7% reduction in weed density was noted by three
foliar sprays. The same reduction rate was observed by applying recommended dos of s-
metolachlor (1.6 L ha-1). In other study, interference of weeds and the role of allelopathic
aqueous extract for effective control of weed in maize were checked by Naeem et al. (2016).
The authors reported that combine application of sorghum and sunflower water extracts have
greater suppression for density, dry biomass and persistence index of weeds. Kandhro et al.
16

(2015) noted the effect of sorghum and sunflower extracts on weed mortality and cotton
yield. The authors reported that sorghum water extracts caused significant reduction of weeds
and increased seed cotton yield as compared to weedy check. The combined application of
sorghum @ 15 L ha-1 + Dual Gold @ 1.25 L ha-1 resulted in weeds mortality up to 66.6%.
Sabahie et al. (2014) also studied the impact of water extracts on germination of red root
pigweed (Amaranthus retroflexus L.). They showed that all sorghum water extract treatments
had a statistically significant effect on pigweed germination percentage and rate but water
extract of shoot at 100% concentration showed the maximum inhibitory effects on pigweed
germination. To compare the allelopathic effects of sorghum plant parts aqueous extracts
with manual weeding and chemical (herbicide) suppression of wheat weeds under rain fed
conditions, an experiment was conducted by Ashraf and Akhlaq (2007). The authors showed
that sorghum stem, leaf and root aqueous extracts was resulted more effective treatments but
leaf and root reduced weed density (20.72 and 22.23%), fresh weight (19.97 and 22.97%)
and dry weight (15.71 and 21.37%), respectively as compared to control. Combination
application of water extracts of sorghum plant parts, stem+root water extract had highest
influence than stem+leaf or root+leaf and decreased weed density (23.42 and 33.42%), fresh
weight (25.64 and 33.78%) and dry weight (21.71 and 33.70%) as compared to control
measured at 80 and 105 DAS, respectively. Sorghum water extracts significantly reduced
population, fresh and dry weight of Anagalis arvensis L., Chenopodium album L., Fumaria
indica L. Mubeen et al. (2012) evaluated the impact of water extracts of crops on emergence
and growth of rice crop and its associated weeds. They showed that when both aqueous
extracts was applied in combine form got highest inhibition on T50, MGT of Eleusine indica.
Elahi et al. (2011) used aqueous extracts of herbage of different crops for managing weeds in
wheat. The author showed that combination of 1/3rd dose of isoproturon with all aqueous
extracts of sorghum, sunflower, rice and brassica spray after twenty five days of sowing,
reduced density and dry biomass of broad leaf weed (94-97% and 96-99%, respectively). It
was same to re-commended dose of iso-proturon with 98-99% reduction in weed density.
2.7.1.2. Sorghum crop residues
The intensive work on weed control by sorghum crop residues was published by
many researchers (Kim et al., 1993; Weston, 1996; Kohli et al., 2001). The researchers
observed the toxicity of sorghum crop residues differs with genotypes, plant parts, age of
17

plants, environmental factors, and target weed species. Sorghum crop residues were reported
either by soil incorporation or by killing the crop chemically or mechanically and leaving the
crop residues as mulch/cover on soil surface. During early stage of sorghum residues
decomposition maximum quantity of allelochemicals were rereleased in field soil (Alsaadawi
et al., 2007). Decomposition of sorghum residues at early stages significantly suppressed the
weeds, but in later stages, it enhanced the growth of crops. Due to their temporal nature of
sorghum residues can successfully be used to manage weeds in agro ecosystems. For
example, the inhibition of wheat germination under field condition by sorghum residues was
avoided by increasing seed rate, delaying plantation of next crop after residue decomposition,
(Al-Bedairy et al., 2012). In another experiment Roth et al. (2000) said that tilled residues
incorporation of sorghum crop in soil delayed subsequent crop growth. Sorghum stover after
no-tilled had little effect on crop growth but decreased yield of wheat crop, because of slow
leaching of allelochemicals. Weston and Czarnota (2001) reported that sorghum crop
residues of spring season reduced 90% weed weight in no-till soybean during summer
season. Under lab condition sorghum crop were used to check the suppression of weed
growth. The result showed that 26-56% total weed dry weight was reduced and increase 6-
17% wheat yield over control (weedy check) (Cheema and Khaliq, 2000). Two field
experiments were conducted by Cheema et al. (2004) for two years during summer of 1997
and 1998. They observed that mature sorghum herbage at 10-15 tons ha-1 was applied as
mulch reduced weed up to 25-36% and maize yield increased (35-42%).
In terms of crop production, competition of weeds, and fit to environment, many
sorghum genotypes were introduced. A field opinion by Al-saadawi et al. (2007) shown that
weed growth and density were changeed among selective genotypes. The result showed that
crop residues largely reduced weed growth. In all test genotypes phytotoxicity are differed.
Another experiment was conducted in field which was infested with different weed plants.
They observed that weed biomass and density were reduced by incorporation of residues in
soil @ 3 and 6 g kg-1 of soil. The residues of Giza 15, Giza 113 and Enqath provided 67, 59,
and 63% reduction in weed density and 58, 66, and 58% reduction weed biomass,
respectively. But the Rabeh cultivars suppressed average weed density and biomass by 41
and 52%, respectively. Weed density were significantly decreased with increasing rate of
incorporation of residues of most allelopathic cultivars in soil. Integration of various crops
18
(sorghum, sunflower, brassica) residues incorporation mixed can get maximum weed
reduction than alone incorporation (Khaliq et al., 2011). In a field of direct seeded rice,
sorghum residue at 8 tons ha-1 incorporation get 50% decrease in weed number and dry
biomass (Riaz, 2010). Aslam (2010) reported that by incorporation of wheat straw maximum
suppression of germination, growth and photosynthesis in horse purslane (broadleaf weed).
Hozayn et al. (2011) studied allelopathic effects of chopped sunflower and sorghum shoots
and roots on growth and emergence of Sakha-69 wheat cultivar and its associated weeds.
The results showed that maximum inhibition of seedling number and dry weight of grassy
weed (canary grass) was observed by sorghum crop residues than sunflower. Shoot residues
of sorghum crop gave maximum reduction in seedling density (43.55% and 72.00%
respectively) and dry biomass (62.90% and 73.08%, respectively) of wild oats and canary
grass.
2.7.2. Sunflower allelopathy
As a member of oil seed family, the value of sunflower crop has increased over the
last few years. It is also a big source of edible oil and protein. Due to its allelopathic effect,
its residue suppresses weeds by releasing allelochemicals (Narwal, 2004). Sunflower
allelopathy was firstly reported in wild species (Leather, 1987). A simple phenolics,
triterpenes, steroids, sesquiterpenes (mainly germacronolides guaianolides), flavonides,
heliannuoles, heliespirones and helikauranoside were isolated and identified by Macias and
his assistants from different cultivars of sunflower (Macias et al., 2008). Different sunflower
plant parts have different allele-chemicals. Ghafar et al. (2001) said that sunflower leaves
water extracts had chlorogenic, caffeic, vanillic, syringic and ferulic acids and in case of
sunflower stem water extracts chlorogenic, ferullic and vanillic acids were present. But in
sunflower root water extracts only ferulic acid was observed. Allelo-chemicals are released
in the form of extracts, exudates and leachates. Pseudo microgravity reduced the synthesis
and release of the allele-chemicals (Tomita-Yokotani et al., 2005). In this part of study,
allelopathic effect of sunflower water extracts and residues on weeds is reviewed.
2.7.2.1. Sunflower crop water extract
Due to high allelopathic potential sunflower crop plants efficiently affect the growth
of neighboring plants. Most of secondary metabolites, which are present in sunflower water
extracts having inhibitory effect and can be used as a ‘nature’s own herbicide’. In such type
19

of formulation, water act as a carrier and medium to show allelopathic activity (Farooq et al.,
2011a). Although there are several studies that make sure that organic solvents are also use
for extraction of secondary compounds besides water (Iqbal, 2007). Chlorogenic, caffeic,
vanillic, syringic and ferulic acids are present in water extracts of sunflower leaves and
chlorogenic acid, ferullic acid and vanillic acid in water extracts of sunflower stem. But only
ferulic acid is present in water extracts of sunflower roots (Ghafar et al., 2001). Naseem et
al., (2009) noted that water extracts of different sunflower plant parts reduced emergence and
seedling growth of Bromus japonicus Cheema et al. (2003) said that sunflower leaf and stem
water extracts showed significant effect on weed germination. However water extracts from
dried leaves and stems completely inhibit weed growth. Wild mustard germination was
inhibited (75%) by undiluted water extracts from leaves.
In another study, Anjum and Bajwa (2008) screened different cultivars of sunflower
crop on the bias of their suppressive effect against different weeds of wheat crop. They
observed a statistically significant interaction in between cultivars of sunflower crop and
weed flora. Suncross-42 showed highest allelopathic effect against all weed flora of wheat
crop. The weed suppression was increased with increase its concentration. Kamal and Bano
(2008) studied that water extracts of sunflower inhibited growth and emergence of seedlings
of crop. Mehboob et al. (2000) pointed out that sunflower water extracts suppressed
emergence and growth of Linum usitatissimum. Water extract of root, stem and leaf of
sunflower showed highest reduction in Medicago polymorpha dry weight (Anjum et al.,
2005). Ghafar et al. (2000) reported that sunflower extracts suppressed both radicle and
shoots growth of wheat. Highest sunflower water extracts concentration (10%) completely
inhibited mustard growth (Bogatek et al., 2006). A significantly reduction in parthenium
growth was observed by water extracts sunflower, sorghum and rice. At 50 and 100%
concentrations a significant reduction of root biomass of Parthenium was noted (Javaid et al.,
2006).
2.7.2.2. Sunflower crop residues
Sunflower residues suppressed growth and emergence of succeeding crops; in this
regard, the crops which are sensitive by sunflower should not be grown after sunflower.
While on the other hand, they inhibit a large number of weeds. Sunflower crop residue
20
inhibited the growth of guvar bean and pearl millet. This was due to phe-nolics released
during decomposition of sunflower tissues (Batish et al., 2002). Kaya et al. (2006) evaluated
the bio-degradation products of sunflower-heads (BPSH) at different concentrations on some
growth and emergence traits of common bean, chick pea and bread wheat. Emergence
gradually increased up to 10% BPSH and decreased at 100%. Soil incorporation both roots
and shoots of sunflower reduced grrmination, height and weight of wild barley. In lab,
sunflower aquous extracts caused high reduction hypocotyl length (44%), weight (57%),
radicle weight (61%), germination (68%), and length (79%) of wild barley.
Sunflower used as cover-crop//mulch reduced groth of weeds upto 85% (Fujii, 2001).
In another study, Khaliq et al. (2010) stated that a combine application of allelopathic crop
residues at 7.5 tons ha-1 gave highest suppression in weed number and biomass of horse
puslane and purpal nutsedge. Adding further, Matloob et al. (2010) conducted a pot study to
investigate the allelopathy of crop residues for the suppression of purple nutsedge. Chopped
crop residues were incorporated @ 12 tons ha-1 into the soil. Incorporation of all crop
residues delayed tuber sprouting. Khaliq et al. (2011) checked the impact of crop residues
(sorghum, sunflower and brassica) on rice crop and jungle rice weed (Echinochloa coloma L.
Link). With a combine application of crop residues final emergence of E. coloma L. Link
was reduced up to 8 to 34%. Alsaadawi et al. (2011) evaluated eight genotypes of sunflower
against weeds and wheat crop which is customarily grown after sunflower in crop rotation in
Iraq. They are revealed that all genotypes significantly suppressed weed number and
biomass. Out of eight genotypes, Sin- Altheeb and Coupan, were the most allelopathic
potential cultivars with the reduction in total weed number by 47.25 and 86.81% of control
and weed biomass by 74.23 and 80.79% of the control respectively. Euroflor and Shumoos
were the least allelopathic potential genotypes with an inhibition in total weed number by
21.50 and 9.59% and weed biomass by 42.28 and 33.67% of the control respectively.
Subsequent field experiment indicated that the residues of sunflower incorporated into the
field soil significantly inhibited total number of weeds grown in wheat field by 24.51-74.52%
of control at low residues rate (3 g kg-1 soil) and by 49.05-75.47% at the high residues rate (7
g kg-1 soil). Weeds biomass significantly reduced with a range of 12.27-64.52% at low
residues rate and 40.33-66.75% at high residues rate.
2.7.3. Brassica allelopathy
21

Brassicaceae family or cruciferous plants have rapid growth, biomass production, and
nutrient ability (Clark, 2007). Crucifers consist 375 genera and 3,200 species. Out of all, 52
genera and 160 species are present in Australia. The genus brassica consists of 100 species
including species i.e brown mustard, black mustard, white mustard, leafy turnip, canola,
abyssinian mustard and broccoliare. Thee are commonly known as major oilseed crop of
winter season and documented as allelopathic or weed suppressive crop (Narwal, 2001).
They synthesize secondary metabolites in considerably high concentrations (Warwick, 2011).
These secondary metabolites can be toxic to pathogens born in soil and crop pests like
nematode, fungus, and weed plants. They produce isothayanates, isoprenoid and benzenoid
(Cheema et al., 2007). Glucosinolates are also produced by intact plants. But at damaging of
plants, myrosinases (β-t hioglucosidases) come in contact with glucosinolates. A cleavage of
the glucose sulfur bond was done by these enzymes, which intern allows to convert
glucosinolates to iso-thiocynate, which cause weed plants and disease inhibition (Norsworthy
et al., 2006). Bressan et al. (2009) stated that a competitive biocidal effect was started when
catabolic products like glucosinolate released to the rhizosphere of soil. The allelopathic
effect of brassica water extracts and residues on weeds is reviewed in the following section.
2.7.3.1. Brassica crop water extract
In agro ecosystems, use of crop water extract is a best way to employ allelopathy for
weed management (Jamil et al., 2009). In many studies, water extracts of brassica crop
showed best results. The impact of mustard crop on wild oat growth and germination was
studied by Turk and Tawaha (2003). The study showed that water extracts of whole mustard
plant and its parts inhibited germination of wild oat. A one more study by Ar-slan et al.
(2005) stated that rape-seed shoot and tur-nip root water extracts reduced the ger-mination of
ground-cherry. D’Abrosca et al. (2004) reported lignans; it showed significant reduction in
germination of lettuce plants. Narwal et al. (2004) reported that few species of Brassica
juncea and Brassica nigra gave maximum suppression (75 to 82%) at 75 DAE (days after
emergence) and 75-98% at harvesting (120 D) in winter weed densities. Mushtaq et al.
(2010) tested the efficacy of mixed water extracts crop plants on horse purslane weed. 100%
mixture of allelopathic crop plant water extracts significantly inhibits emergence and growth
of horse purslane. In pot study, two exogenous spray of water extracts of crop plants like
sorghum, sunflower, brassica and mulberry also reduced weed growth and its dry matter. In
22

another study, Awan et al. (2012) stated that a mixture of concentrated water extracts of
allelopathic crops, gave highest reduction in weeds at 45 and 75 days after sowing.
2.7.3.2. Brassica crop residues
Matloob et al. (2010) stated that crop residues application can pose an allelopathic as
well as a physical effect on the growth of succeeding crop and weed plants. In field
experiment, rapeseed residues incorporation after cotton reduced germination of Amaranthus
spp. while cotton germination remained unaffected; this was due to the release of organic
substances which have inhibitory effect by decomposition of rape seed plants (Younesabadi,
2005). A large amount of isothiocyanates (ITC) was released from surface mulch of Brassica
rapa which has been described by (Fahey et al., 2001). Petersen et al. (2001) check the
allelopathy of isothiocyanates (ITC). From chopped mulch of brassica six different ITCs
were identified. Aryl-ITCs compound showed maximum inhibition. Small seeded weed
floras were more sensitive to ITC than those which have large seeds. At higher concentration
of ITCs compound in chopped mulch caused high weed suppression in the field. Turk and
Tawaha (2003) studied an experiment to check the allelopathic potential of black mustard
against wild barley. They observed that wild barley growth was highly suppressed when
grown in soil which was incorporated with cropped black mustard. Soil incorporation of both
roots and shoots of black mustard reduced emergence, height and weight of wild barley as
compared with control (no residues).
2.8. Allelopathic effect of crop plants on rhizosphereA chemical interaction among plants which is facilitated by release of allelochemicals
in rhizosphere soil is known as allelopathy (Bertin et al., 2003). The ecology of rhizosphere
soil may influenced by root exudates, increasing population of certain micro flora, resulting
in a shifting of nutrients into available form and their uptake by plant community of eco-
system (In-derjit and Weston, 2003).
2.8.1. Allelopathic effects of crops on microbial diversity in rhizosphere soil
Fertility of soil is depended on presence of sufficient nutrients, number and diversity
of soil micro flora. Diversity in microbes is due to the occurrence of defferent types of
organic substrates in the soil. These diverse groups of organisms consist of unicellular
23

prokaryotes or eukaryotes like bacteria, cyano-bacteria, action-mycetes, fungi and algae.
These microbes perform a number of activities required for the proper functioning of the soil
as a dynamic system. The allelo-chemicals are important, but their effect on living organisms
in rhizosphere soil which is known as non-target organisms. The disturbance in non-target
organisms is of great concern because this poses a risk to entire ecosystem. Microbial
community is very diverse, and its composition varies in space and time. Among the soil
biota with relevance to allelopathy are the many free-living and symbiotic bacteria and fungi
that are present in rhizosphere and mycorrhizosphere (Johansson et al., 2004). Plant
allelopathy can be modified by the presence of microbial community, and sometimes
microbes are negatively affected by allelo-chemicals. It is known that plant species will
culture specific microbial communities in their rhizosphere that have consequent responses
on hetero-specific and con-specific individuals grown in same soil. This effect depedes on
the amount and form of carbon and other nutrients that are delivered by plant to the soil, but
direct positive and negative effects on soil microbes are also due to allelo-chemicals
(Reinhardt and Callaway, 2006).
2.8.2. Allelopathic effects of crops on enzymatic activity in rhizosphere soil
Activity of enzymes in rhizosphere soil is an important indicator of nutrient cycling
and fertility status, particularly in long term farming systems (Bohme et al., 2005). Roots of
plants have a various types of secondary metabolites like simple as well as complex
carbohydrate, long and short chain protein, vitamins and amino acids (Bacilio-Jimenez et al.,
2003). Few organic compounds which are exude by plant roots can act as allelochemicals.
They participate in interactions between crop plants and other living organisms in the
rhizosphere of soil (Bais et al., 2006). The soil enzymes activity and allelochemicals
concentration in rice field which was amended with different rice varieties, different growth
stages and moisture percentage. A higher level of soil enzymes like urease, invertase, de-
hydrogenase and polyphenol oxidase activity was observed in paddy field in which
allelopathic rice variety (PI312777) was sown as compared to paddy field with Liaojing-9
which is non-allelopathic rice variety (Gu et al., 2009). Zhang et al. (2000) reported that
poly-phenol oxidase correlate with the accumulation of phenolic acid and had high activity in
re-planted soybean soil than virgin soil, that was because the poly-phenol oxidase activity
was enhanced under the induction of phenolic acid, and the poly-phenol oxidase enhanced
24

the activity of growth hormone oxidase in the plant which could decompose the growth
hormone and affect the plant growth. Benzoic and ferulic acids are ubiquitous allelo-
chemicals responsible for rice allelopathy in paddy eco-system.
2.8.3. Allelopathic effects of crops on physicochemical properties in rhizosphere soil
Exudation of secondary metabolites (allelochemicals) through roots is a main way by
which allelochemicals are released into rhizosphere soil (Kobayashi, 2004). It is the fact that
30% of plant's photo assimilates are consumed in root exudates production, which affect the
environment of local soil (Bertin et al., 2003). A cellular transport system which depends
upon localized soil conditions, especially stress factors cause synthesis and release of
allelochemicals from root cells into the soil (Weston et al., 2012). Soil factors such as
mobility; movement and uptake of allelochemicals in the soil make the phenomenon of
allelopathy in the soil is more complicated because they are strongly linked with soil
properties, as well as soil moisture conditions, which in turn affect their adsorption and
degradation (Kobayashi, 2004). Characteristics (chemical, and biological) of the rhizosphere
soils can be very different from the bulk soils. Secondary metabolites in root exudates and
microorganisms contain various organic compounds which have low molecular weight and
their concentrations in exudates showed greater variations between cultivars. These
variations may be due to physiology of plant, roots growth, metabolism rate, root distribution
and micro flora. In one study, physic-chemical status of rhizosphere soil was analyzed from
the samples which were collected before sowing of sunflower crop and at harvesting of
sunflower as well as wheat crop. Kamal and Bano (2008) commonly observed that electric
conductivity (EC), calcium (Ca), phosphorus (P), lead (Pb) and soil moisture contents were
decreased, while the soil pH, manganese (Mn), iron (Fe), magnesium (Mg), potassium (K)
and zinc (Zn) were increased.
2.9. ConclusionGenerally, allelochemicals are naturally present in all field crops. These chemicals are
released into rhizosphere soil by various mechanisms like crop residues decomposition,
volatilization, and exudation through root. Use of herbicides and pesticides can be reduced
by proper use of crops which have allelopathic potential in agri industry. By application of
such crops can reduce cost, as well as food and environment pollution. It also improves soil
productivity as well as bio-diversity and sustainability in the agro-ecosystem. Sorghum,
25
sunflower and brassica crops have ability to manage weeds by releasing various allelopathic
compounds in the soil of rhizosphere. Crop allelopathy offers a new concept to discover
natural pesticides.
26
Chapter-III
MATERIALS AND METHODS
A series of trials were conducted under lab as well as in field to observe allelopathic
impacts of crops (sorghum, sunflower and brassica) on weed dynamics, rhizospheric
microbial population, enzymatic activities, nutrient dynamics and productivity of spring
planted mung bean (Vigna radiata L.). The detail information of site and materials which are
used during the course of these studies are given below.
3.1. General informationsThe detail of experiments is given in the following sections:
3.1.1. Experimental site, soil, treatments and statistical design
The experiment was con-ducted at Student Research Farm, Department of Agronomy,
University of Agriculture Faisalabad, Pakistan (Latitude = 31o-26' N, Longitude = 73o-06' E,
Altitude = 184.4 m). According to the climate data collected during both years of
experimentation (Figure 1), the total monthly rainfall of the area during experiment duration
ranges from 42 to 58 mm in 2014 and from 68 to 128 mm in 2015. Mean monthly maximum
temperature was 34oC and the minimum being 22oC during experiment duration of both
years. The mean relative humidity was 47% during experiment duration of both years.
The soil belonged to the Lyallpur series. According to USDA (US Department of
Agriculture) classification it was arid sol-fine-silty, hyper thermic Ustalfic, mixed and
Haplargid, but in FAO (Food and Agriculture Organization) classification system, it was
classified as Haplic Yermosols.
The treatments comprised of a control (plots with no crop residues or extract
application), sunflower water extract at 10 L ha-1, sunflower water extract at 20 L ha-1,
sunflower residue incorporation at 4 tons ha-1, and sunflower residue incorporation at 6 tons
ha-1.
The experiment was laid out in a randomized-complete-block-design (RCBD) under
factorial arrangement with 3 replications. The plot size was maintained at 3.0 m × 5.0 m.
27

3.1.2. Crop husbandry
To prepare seed bed two times ploughing with tractor mounted plough followed by
one planking was done. The seed of mung bean cv. “NM-92” was collected from National
Institute of Agriculture and Biology (NIAB), Faisalabad. Sowing was done at 15 th March and
20th March during 2014 and 2015, respectively. A recommended rate of mung bean seed (25
kg ha-1) was used to maintain plant population (350,000 plants ha-1) in 30 cm apart rows. Àll
other field practіces accept those which under study were kept same for all experimental
units.
3.1.3. Source and preparation of experimental treatments materials
The material of various crop plants as sorghum, sunflower and brassica were
collected from Student Research Farm of the Department of Agronomy, University of
Agriculture, Faisalabad and was used in residues and water extract preparation for field as
well as laboratory experiments.
Crop plants residues were prepared and used by following way:
A mature crop plants were harvested, dried under shady conditions and cut into 2-3
cm pieces with electric fodder cutter. These pieces of crop residues were incorporated prior
to sowing as per treatments (4 and 6 tons ha-1).
Crop plant extracts were pre-pared and used by following ways:
Water extracts of different crop plants were prepared and used by following way. The
pieces of crop residues were put in distilled water with 1:10 w/v ratio for twenty four hours.
The filtrate was used as fresh. Crop plant water extracts @ 10 and 20 L ha-1 were sprayed 15
days after sowing. The spray was performed with T-jet nozzle. The volume (300 L ha -1) of
spray which was used for spraying was determined by calibration.
3.1.4. Rhizosphere soil sampling
Soil sampling from mung bean rhizosphere was done after 20 days of crop sowing
and at the time of harvesting. Randomly 10 plants were selected from each plot. The whole
plant was carefully up rooted using a spade. The closely adhering soil was collected in plastic
bags. A representative sample for analysis was made by mixing all these randomly taken
samples from each treatment. Collected soil samples were handled thoroughly by drying,
grounding and sieving with 2 mm sieve and then analyzed for soil properties except
microbial population, alkaline phosphatase and dehydrogenase activity. For detecting
28

Table. 3.1. Response of soil properties, nutrient dynamics, soil enzyme activities and
microbial populations of the experimental soil before sowing (2014 and 2015)
Soil physical, chemical and biological properties 2014 2015Bulk density (BD) (g cm-3) 1.48 1.45Soil porosity (%) 43.1 44.3Soil pH 7.85 7.79Electrical conductivity (EC) (dS m-1) 1.11 1.19Soil organic matter (SOM) (%) 0.53 0.61Available phosphorus (AP) (mg kg-1) 6.74 6.95Available potassium (AK) (mg kg-1) 123 131Soil nitrogen (N) (g kg-1) 0.24 0.29Bacteria (cfu/g x 105) 35 45Fungi (cfu/g x 104) 5 8Microbial activity (mg CO2-C kg-1 d-1) 3.05 3.14Alkaline phosphatase activity (μg NP g-1 soil h-1) 135 143Dehydrogenase activity (μg TPFg-1 soil h-1) 21 25
March April May Jun July March April May Jun July2014 2015
0
20
40
60
80
100
120
140
0
10
20
30
40
50
Rain Fall Relative Humidity Max. Temp. Min. Temp.
Rai
n Fa
ll (m
m) R
elat
ive
Hum
idity
(%)
Max
. and
Min
Tem
pera
ture
oC
Figure. 3.1. Weather data during the period of study (2014 and 2015)
29

alkaline phosphatase, dehydrogenase as well as microbial population, the samples were
preserved at 4oC. Before starting experiment three samples (0-15 cm) were taken from
different places of each experimental unit and then mixed to make a test sample for soil
analysis. The initial properties of original experimental site were tested and were shown in
Table 1.
3.2. Details of experiments The study consists of a number of lab and field experiments. Detail of each experiment is
separately given as under:
3.2.1. Details of field experiments
Crop husbandry: Mung bean cultivar NM-92 was.sown in 30 cm spaced in rows.with the
help of drill on 15th and 20th of March in 2014 and 2015. Nitrogen (N), phosphorus (P) and
potash (K) were used at 23 kg (N), 58 kg (P2O5) and 63 kg (K2O) ha-1 in the form of Urea and
Di-ammonium Pho-sphate (DAP) and Sul-phate of Potash (SOP), res-pectively. Full re-
commended doses of P, K and one third of N in the form of D.A.P., S.O.P. and Urea,
respectively were drilled at sowing. Two third of the N was applied in two equal splits, i.e.
1//3rd at first irrigation and remaining 1//3rd as top dressing at second irrigation.
First irrigation (7.50 cm) was applied after 10 days of crop sowing. While, sub-
sequent irri-gations were applied as and when crop needed. To maintain plant to plant
distance (10 cm) and plant population thinning was done. Manually crop harvesting was
done when evidence of physical maturity appeared. Plants were tied into small piles and kept
it for sunn-drying to mini-mize moi-sture-contents of seeds and easy she-lling. After certain
period of sunn-drying, the pods were-shelled manually to separate seeds from pods.
Pro-cedure for field trials: Field ex-periments were conducted in a randomized-complete-
block-design (RCBD) under factorial arrangement with 3 re-plications having a net plot size
of 3×5 m2. Crop water extract were prepared 1:10 w/v ratio (Cheema.and Khaliq, 2000). For
foliar app-lication volume of spray (300 L ha-1) was calibrated by using or-dinary water.
Crop plant water extracts @ 10 and 20 L ha-1 were sprayed 15 days after sowing and crop
residues were incorporated prior to sowing as per treatments (4 and 6 tons ha-1) to manage
weeds in mung bean crop during 2014 and 2015. Spray was applied in the respective plots by
using the knap sack hand sprayer which was fitted with T-Jet Nozzle.
The experimental detailes are given as under:
30

Experiment-I: Effect of sorghum crop water extract and residues on weeds,
productivity and rhizosphere of mung bean (Vigna radiata L.)
The experiment was comprised of following treatments:
Treatments:
T1= Control (Plots with no crop residues or extract application)
T2= Sorghum water extract @ 20 L ha-1
T3= Sorghum water extract @ 10 L ha-1
T4= Sorghum residue @ 4 tons.ha-1
T5= Sorghum residue @ 6 tons ha-1
Experiment-II: Effect of sunflower crop water extract and residues on weeds,
productivity and rhizosphere of mung bean (Vigna radiata L.)
The experiment was comprised of following treatments:
Treatments:
T1= Control (Plots with no crop residues or extract application)
T2= Sunflower water extract @ 20 L ha-1
T3= Sunflower water extract @ 10 L ha-1
T4= Sunflower residue @ 4 tons ha-1
T5= Sunflower residue @ 6 tons ha-1
Experiment-III: Effect of brassica crop water extract and residues on weeds,
productivity and rhizosphere of mung bean (Vigna radiata L.)
The experiment was comprised of following treatments:Treatments:
T1= Control (Plots with no crop residues or extract application)
T2= Brassica water extract @ 20 L ha-1
T3= Brassica water extract @ 10 L ha-1
T4= Brassica residue @ 4 tons.ha-1
T5= Brassica residue @ 6 tons.ha-1
Observations:
The following observations were recorded during the experimentation:
Weed data:
The following observations on weed studies were recorded after thirty days of sowing:
31

Total weeds density (0.25/m2): Density of weeds (individual and total) was noted from
randomly selected area (0.25/m2). From each plot 2 samples were taken.
Total weed fresh weight (g/0.25 m2): For determining the individual and total fresh weight
of different weeds. Harvesting of weeds was done from ground. Weed plants were cleaned
and then record their weight. Two samples were taken from each experimental unit.
Total weed dry weight (g/0.25 m2): For determining the individual and total dry weight of
different weeds, weeds were harvested at ground level. From each exp-erimental unit 2
samples were taken and thent oven dried at 65oC to recorde their dry weights.
Crop data:
The following observations regarding crop were studied at the time of harvesting:
Emergence and morphological traits: The following observations on emergence and
morphological traits were recorded at the time of harvest:
Final emergence count per plot: On the completion of germination number of emerged
seedlings was counted from individual plots and average was worked out to get final
emergence per plot.
Plant he-ight at mat-urity (cm): Height of five plants was measured from base of the plans
up to growing tip of main stem. The average plant he-ight was cal-culated by taking the
mean of observation of five plants and expressed in cm.
Pod length (cm): Randomly five plants were selected from each plot for measuring pod
length. Pod length of each plant was measured. The average pod length was calculated by
taking the mean of observation of five plants and expressed in cm.
Number of branches per plant: Randomly five plants were selected from each plot for
counting number of branches. The branches of each plant were counted carefully and
averaged to obtain the number of branches per plant.
Number of nodules per plant: Five plants were sampled randomly from each plot. The
whole plant was carefully up rooted using a spade so as to obtain intact roots and nodules.
Uprooting was done by exposing the whole root system to avoid loss of nodules. The
adhering soil was removed by washing the roots with intact nodules gently with water over a
metal sieve. The number of nodules per plant was determined by counting the number of
nodules from all the five uprooted plants per plot and then averaged as per plant.
32
Stalk yield (kg/ha1): Stalk yield was obtained by sub-tracting the grain-yield from bio-
logical yield.
Yield and yield components:
The following observations on yield and yield components were recorded at the time of
harvesting:
Number of pods/plant: Total pods on the ran-domly selected five plants was counted and
averaged to obtain the number of pods per plant.
Number of seeds per pod: The ten randomly selected pods from each randomly selected
five plants per plot were taken out and a total seed was counted. Average number of seeds
was cal-culated and recorded.
Weight of 1000-seeds (g): Randomly selected 1000 seeds from the seed yield samples of
crop were counted from each plot and their combined weight was recorded to get weight of
1000-seeds.
Bіologіcal yіeld (kg ha-1): At maturity plants were harvested, tied into small bundles and left
for drying in their respective plots. After that weighed was done with help of a spring-
balance to determine the total sun dried biomass (biological yield) per plot. This was con-
verted into kg/ha.
Har-vest in-dex (%): Har-vest in-dex was cal-culated by dividing the e-conomic or
economic/seed yield by the bio-logical yield or total biomass and multiplying by 100.
Harvest index (%)=Economic∨seed yield (kg/ha❑)
Bio− logical yield∨total biomass (kg /ha❑)× 100
Yield (kg ha-1): The seed yield of net plot after cleaning and proper drying was recorded in
gram and converted to kg ha-1 by multiplying with appropriate conversion factor.
Rhizosphere soil analysis:
The following analyses were recorded from the samples of rhizosphere soil which were
collected after twenty days of sowing and at the time of harvesting.
Soil physical analysis:
The following traits on soil physical analysis were recorded from the samples of rhizosphere
soil which were collected at the time of harvesting:
Soil bulk density (g cm-3): Soil bulk density (BD) is the ratio of oven-dry weight of soil to
bulk-volume expressed in grams per cubic.cm (g.cm-3). It is an indicator of soil structure and
33

void space. It was determined by the method which was described by Blake and Hartge
(1986). Each bulk density core was split and weighs the cores with their soil. Put the core
with the foil in the drying oven at 105oC to constant weight. After drying, removed the cores
from the drying oven and then oven-dried weight was recorded and then determined the
volume of each cylinder.
The density of soil was calculated as follows:
BD ( g . cm−3 )=Weight of ovendry soil∈grams [ (c )− (a ) ]Volum of core∈cm3
Where (a) is the mass of each empty core and (c) is the mass of each core with its dry soil
Total soil porosity (%): The total soil porosity (TSP) was estimated using the relationship
between bulk density and particle density (Vomocil, 1965).
The total soil porosity was calculated as follows:
Total soil prosity (% )=[1−( BDPD
)]×100 %
Where BD (g cm-3) is bulk density and Pd is particle.density (g.cm-3).
Soil chemical analysis:
The following parameters of soil chemical analysis were recorded from the samples of
rhizosphere soil which were collected at the time of harvesting:
pH of saturated paste (pHs): A saturated.soil paste with 250 g soil and water was prepared
to measure the pH of soil. 1:2 ratio (soil/water) of suspension was used. After one hour
preparation of paste soil pH value was recorded by a pH meter (model Kent Eil 7015, US
Salinity Lab. Staff, 1954).
Electrical conductivity (dS m-1): For determining electrical conductivity (EC), extract of
soil paste with 1:2 ratio (soil/water) of suspension was obtained by using vacuum pump. EC
value was determined using a digital Jen way conductіvіty meter (modell 4,510, U.S. Salіnіty
Lab. Staff, 1954).
Total soil organic.matter (%): Total soil organic.matter was determined by a method which
was described by Walkley and Black, (1934). Add 5 mL of 0.4 N potassium dichromate
solution (K2Cr2O7) followed by 10 mL sulfuric acid (concentrated) in a fully dried samples of
known amount (20-50 mg). Soil solution was swirled and left for 16-18 hrs at room
temperature in a fume hood and then, add 100 mL of distilled water to solution. For di-
34

chromate excess potentio metrically back-titration was done with 0.2 N ferrous.ammonium
sulfate. (Fe(NH4)2(SO4)2 × 6H2O). At the beginning of the batch analysis blank-titration of
acidic di-chromate with ferrous ammonium sulfate was performed by using the same
procedure. One mL of ferrous ammonium sulfate (0.2 N) is equivalent to 9.81 mg of K2
Cr2O7 or 0.6 mg of carbon. Organic carbon content in the sample was calculated as:
M= 10V blank
Oxidizablorganic carbon(%)=[V blank−V sample ] ×0.3 × M
Wt
Total organiccarbon (% )=1.334 × Oxidizable organic carbon(%)
Organic carbon (% )=1.724 Total organic carbon(% )
M= molarity of (NH4)2 SO4 FeSO4 6H2O solution (about 0.5.M)
V= blank is volume of (NH4)2 SO4 FeSO4 6H2O solution required to titrate the blank (mL)
Wt= is weight of air dry soil (g)
0.3= is 3 × 10-3 × 100, where 3 is the equivalent weight of C
Total soil nitrogen (g kg-1): Total soil nitrogen was determined by sulfuric acid digestion
and Kjeldahl distillation (Bremner amd Mulvaney, 1982). Sample of 1 g soil was taken and
placed in K-jeldahl flask. Then copper sulphate (0.7 g), K2 SO4 (1.5 g) and H2 SO4 (30 mL)
were added. Heat the solution til frothing was ceased then boiled briskly until solution
became clear. After that continue digestion was done for 30 min. 50 mL H2O was added and
shifted to dis-tillation flask. In conical flask 20 to 25 mL standard acids (0.1 M HCl or 0.1 M
H2SO4) was taken accurately. Two to three dropes of indicator (methyl-red) was added. Then
30 mL (NaOH-35%) was added in dis-tilling flask. To distill ammonia, contents were heated
for 30-40 min. Receiving-flask removed and washed out-let tubes into re-ceiving flask with
di-stilled water. Excessive acid tit-rated in the dis-tillate with (NaOH-0.1 M). Blank on re-
agents determined using same quantity of standard acid in a r-eceiving flask.
The total soil nitrogen was calculated as follows:
Total soilnitrogen (gkg−1)=1.401 (V 1−V 2 M2 )−(V 3 M3−V 4 M 4 ) ×df
W
Where:
V1= mL of standard acid in r-eceiving flask
V2= mL of Na.OH used in tit-ration
35
V3= mL of stan-dard acid to r-eceiving flask (blank)
V4= mL of Na.OH for tit-rating (blank)
M1= standard-acid mo-larity
M2= NaOH mol-arity
W= sample weigh (1 g)
df= sample di-lution factor (if 1 g the di-lution factor will be 100)
Note= 1000 ml of HCl (0.1 M) or H2SO4 (0.1 M) = 1.401 g N
Available phosphorus (mg kg-1): Firstly we prepared a st-andard curve. A pure dry K-
H2PO4 (0.1916 g) was di-ssolved in 1-L DW (di-stilled water). This solution also con-tained
P2.O5 mL-1 (0.10 mg). Then this solution was preserved as a s-tock sol-ution of pho-sphate.
10-mL of stock sol-ution was taken and dil-uted it with 1-L of DW. This solution contained
1-µg P2O5 mL-1 (0.001 mg P2.O5 mL-1). 5 volumes i.e., 1-2-4-6 and 10 mL of this solution was
taken in separate flasks (25 mL). In each flask, add 5-mL.of extractant solution and 5-mL of
m-olybdate r-eagent. Then dilute it by adding 20-mL DW. 1 mL of SnCl2 (d-ilute solution)
was added and shook again dilute it up to 25 mL mark. After ten minutes, blue color of
solution was read on spectro-photometer (660 nm wave-length). The absorbance reading was
plotted against µg P2O5 and joined the points.
Known amount (5 g) soil was extracted with NaHCO3 (0.5 M) solution having 8.5 pH
8.5. Then 5 mL aliquot of c-lear fil-trate was taken in 25 mL vo-lumetric flasks and added 5
mL of colour de-veloping r-eagent. Volume was made up to mark with DW and reading was
recorded by spectro-photometer model-Nico-let-evo-lution-300, Ther-mo Co. Ltd. (O-lsen
and So-mmers, 1982).
Available potassium (mg kg-1): For s-tandard curve flamephoto-meter was set by the a-
tomizing “0” and “20” µg K/mL solutions a-lternatively to “0” and “100” reading. Inter-
mediate s-tandard solu-tions were atomized and recorde the reading. Reading was plotted
against respective potassium contents. The point connected with s-traight line to obtain a s-
tandard curve. Known amount of soil (5 g) was sat-urated with 50 mL of ammo-nium acetate
(1 M) solution having 7.0 pH. Same solution was used for extraction. Available K was
determined by flame photometer (Sherwood-410) (Helmke and Sparks, 1996).
Soil biological analysis:
36

Microbial populations: Microbial populations were determined by serial dilutions of each
soil sample on agar plates. Total number of culturable bacteria was determined on R2A (half-
strength) agar plates (Janssen et al., 2002; Wu et al., 2004; Aslam et al., 2008) and all
culturable fungi were plated on rose bengal potato dextrose agar (Martin, 1950). Colony
counts were carried out after 48 hours of culturing. Further purification was done by repeated
streaking. Pure bacterial strains were grown on R2A (half-strength) and preserved in 400-µL
glycerol and 600 µL nutrient broth-cultures in 1 mL Eppen-dorf at -40oC.
Microbial activity (mg CO2 C/kg/d): In the present study, microbial respiration of rhi-
zospheric soil was measured as inn-vitro static CO2-evolution. Inoculated soil was incubated
in conical flasks with 5% organic matter amendment. The CO2 evolution was measured by
acid-base titration and expressed as mg CO2-C kg-1 d-1 (Stozky, 1965).
Enzyme studies:
The following parameters on soil enzymes studies were recorded from the samples of
rhizosphere soil which were collected at the time of harvesting:
Phosphatase activity (alkaline) (μg NP g-1 soil h-1): Tabatabai and Bremner (1969) method
was used to estimate rhizosphere phosphatase activity (alkaline). For soil sampling plants
were uprooted and the soil closely attached with roots was collected by shaking roots over a
2 mm sieve and then it was stored at 4oC. Known amount of rhizosphere soil (1 g) was added
in Erlenmeyer flask (50 mL). After that add toluene (0.2 mL) followed by modified universal
buffer “MUB” (4 mL). For the preparation of MUB tris-hydroxymethyl amino methane (12.1
g), maleic acid (11.6.g), citric acid. (14.g) and boric acid. (6.3.g) was added in 488.mL of 1.N
NaOH.and dilute it to 1.L with water. The pH of solution was 11. After adding 1 mL of p-
nitrophenyl phosphate solution (pNPP) it incubated for 1 hr at 37°C in dark. After 1 hr, 1 mL
of CaCl2 (0.5.M) and 4.mL of NaOH (0.5.M) solutions were added. After that contents of
assay mixture were filtered (Whatman No.2). A spectro-photometer (Model at 400 nm) was
used to measure the absorbance of yellow colour of the filtrate. P-.nitrophenol content of
filtrate was calculated by calibration.graph plotted from results obtained with
standards.containing (0, 10, 20, 30, 40 and 50 µg p-nitrophenol). For control, same procedure
was followed, but addition of CaCl2 (0.5 M) and 4 mL of NaOH (0.5 M) (i.e. immediately
before filtration of soil-suspension). Phosphatase-activity was noted by following equation:
37
P−nitrophenol ( μg g−1 dwt h−1 )=C × Vdwt
× SW ×t
Where,
C= known p- nitrophenol (µg mL-1) concentration
Dwt= weight (dry) of 1g moist soil
V= soil suspension volum (mL)
SW= sample weight (1 g)
t= incubation time (1 h)
Dehydrogenase activity (μg TPF/g soil/h): De-hydrogenase activity determined as
described by Min et al. (2001). A 5 g soil was added in Erlenmeyer flask. After that 5 mL
Tri-phenyl Tetr-azolium Chloride (TTC) solution which contained 5 g TTC in Tris-HCl
buffer (0.2 M) having 7.4 pH was added in flask and then put it for incubation for 12 hrs at
37°C. After incubation period 2 drops of sulfuric-acid (concentrated) was added to end the
reaction. Then samples were mixed with 5 mL of toluene and shake them at 250 revolutions
per minuets (rpm) for 30 min, followed by centrifugation (4,500 rpm) for 5 min to extract
Tri-phenyl-forma-zon (TPF). O-ptical density (OD) of super-natant was measured by a
spectro-photometer (492 nm). De-hydrogenase-activity was expressed as μg TPF g-1 soil 12
h-1.
3.2.2. Details of laboratory experiments
Experiment-IV: Isolation of allelochemicals resistant strains of bacteria and
determination of their active role in rhizosphere
Materials and reagents: Soil samples for isolation of bacterial strains were obtained from
rhizosphere soil of mung bean field amended with water extracts and residues of allelopathic
crops (sorghum-sunflower-brassica) at Student Research Farm, Department of Agronomy,
University of Agriculture Faisalabad. Chemical compounds of p-coumaric, ferulic and
syringic acids are Sigma products (Sigma, St Louis, MO). For growth tests the seed of mung
bean cultivar “NM-92” was collected from National Institute of Agriculture and Biology
(NIAB), Faisalabad.
Isolation and purification of bacterial strains from soil samples: For isolation of
culturable bacteria, 1 g of soil was added to 10 mL of 50 mM phosphate buffer (pH 7) and
50% of the soil mixture was treated by sonication with an electronic homo-genizer (Bandelin
38

Sonoplus, Berlin, Germany) at 260 W cm-2 for 15 sec. After mixing both sonicated and non-
sonicated portions, serial dilutions were made. The diluted aliquots were spreaded on half-
strength R2A agar plates (Janssen et al., 2002; Wu et al., 2004; Aslam et al., 2008). A 100
µL aliquot was applied to a large poly-styrene petri-dish (15 cm diameter) for each dilution
of 10-4 and 10-5 and the plates were incubated at 28°C for 3-6 days. The bacterial isolation
media was supplemented with 40% (v/v) of soil extract and Ampho-tericin B at 50 µgmL-1 to
inhibit fungal growth. Six plates were used per dilution. The plates were dried in a laminar
flow cabinet for 1 hrs and then incubated. The colonies were selected on the basis of
morphology and isolates were sub-cultured on half-strength R2A agar. The single selected
colonies were transferred to small polystyrene petri-dishes and checked for their purity.
Further purification was done by repeated streaking. Pure bacterial strains were grown on
half-strength R2A and preserved in 400 µL glycerol and 600 µL half-strength R2A cultures in
1 mL Eppen-dorf at - 40oC.
Tests of bacterial resistance against synthetic allelochemicals and allelopathic crops
water extracts: For testing bacterial resistance against allelochemicals all bacterial isolates
were cultured in sterilized half-strength R2A agar medium in petri plates. 200 µL of each
bacterial isolate was inoculated on agar plates and then spread out on whole plate with help
of sterile glass spreader. Solutions of synthetic allelochemicals viz. p-cumaric, ferulic and
syringic acid were prepared as 1 g L-1 and allelopathic crops (sorghum, sunflower and
brassica) water extracts were prepared as 1:10 (w/v). Disc diffusion method was used to
apply the allelochemicals. 20 µL solution of each allelochemical and crop water extract was
deposited on a sterile paper disc (6 mm in diameter) and the discs were dried in an incubator
at 50oC. Then the discs were placed on the surface of petri plates containing bacterial
isolates. Each plate contained six discs, three containing the synthetic allelochemicals and the
other three containing allelopathic crops water extracts. The plates of bacteria were incubated
at 28oC for 48 hrs, and any zone of inhibition was interpreted as a sensitive and no zone of
inhibition was interpreted as resistant (Cetin, 1973).
Biochemical characterization:
The following observations regarding biochemical characterization were studied during the
experimentation:
39

Colony morphology: Colony morphology viz. size, color and shape were recorded after 24
hrs of growth on half-strength R2A agar plates at 28 ± 2oC (Wu et al., 2004; Aslam et al.,
2008).
Cellulase activity: To check the cellulase activity an aliquot of 100 µL of each bacterial
isolate was spot inoculated on agar plates containing CMC (10 g L-1), K2HPO4 (1 g L-1),
KH2PO4 (1 g L-1), MgSO47H2O (0.2 g L-1), NH4NO3 (1 g L-1), FeCl36H2O (0.05 g L-1), CaCl2
(0.02 g L-1), and agar (20 g L-1) (Atlas, 2004; Lo et al., 2009). The plates were incubated at
28oC for 96 hrs. After incubation period each plate was flooded with 0.1% Congo red for 15
to 20 min and then 2-3 time washed with NaCl (1 M). A clear zone around the colonies
showed there activity.
Bioassays.for plant.growth.promoting.traits:
Following bioassays.for plant growth.promoting traits were studied during the
experimentation:
Zinc solubilizing activity: For zinc (Zn) solubilizing activity 100 µL of each bacterial
isolate was inoculated on agar pates consist of glucose (10 g L-1); (NH4)2SO4 (0.5 g L-1); KCl
(0.2 g L-1); MgSO4 7H2O (0.1 g L-1); trace of MnSO4 and FeSO4, yeast.extract (0.5 g L-1); and
agar (15 g L-1) supplemented with 0.1% Zn (oxide and carbonate). After 7-10 days of
incubation (28 ± 2oC) formation of halo zone around the colonies were observed.
Phosphate solubilizing activity: Each bacterial.culture (100 µL) was spot.inoculated in the
center of agar plates containing tri-calcium phosphate {Ca3 (PO4)2} as insoluble phosphate
source with the following ingredients: glucose (10 g), (NH4)2SO4 (0.5 g), NaCl (30 g), KCl
(0.3 g), FeSO4 7H2O (0.03 g), MnSO4 4H2O (0.03 g), MgSO4 7H2O (0.3 g), Ca3 (PO4)2 (10
g), and agar (20 g), H2O (1000 mL), pH (7.0-7.5) (Pikovskaya, 1948). After 7-10 days of
incubation (28 ± 2oC) formation of halo zone around the colonies were observed.
Nitrogen fixation activity: For media preparation dissolved FeCl3 6H2O (0.05 g) in distilled
water (500 mL). Added K2HPO4 (2 g), MgSO4 7H2O (0.25 g) and glucose (10 g). After that
poured into a bottle containing CaCO3 (1 g) and agar powder (7.5 g). Mixed and autoclave at
121oC for 20 minutes. Before pouring plates, swirled to thoroughly mix the CaCO3 and agar.
100 µL of each pure bacterial culture was inoculated into NFA (Nitrogen Free Agar) plates.
After 7-10 days of.incubation (28 ± 2oC) formation of halo.zone.around the.colonies were
observed.
40
3.3. Statistical analysisA statistical analysis was made to determine significance between treatment means
and to draw valid conclusion. It was done by using Statistix 8.1 (Analytical computer
software, Statistix 8.1; Tallahassee, F.L., U.S.A., 1985-2003) using randomized complete
block design (RCBD) with factorial arrangement by considering year as a factor. Data
obtained from various observations were subjected to statistical analysis by adopting
appropriate method of “Analysis of Variance”. To compare the treatments means least
significance difference (LSD) test at 5% probability was applied (Steel et al., 1997).
3.4. Economics and marrginal analysisBy subtract total cost from total benefits the net benefits were calculated for each
combination of treatments. Cost (in-put and out-put) of each combination was changed
into $/ha. For the analysis of marginal values, marginal net benefit and marginal rate of
returns was calculated. Marginal values were carried out a-ccording to the procedure
used by C.I.M.M.Y.T (1988).
41

Chapter-IV
RESULTS AND DISCUSSION
An attempt has been made to ascertain the degree of variation exhibited by various
weed, crop and rhizosphere soil parameters due to treatments in the experiment entitled
“Allelopathic effects of crops (sorghum, sunflower and brassica) on weeds, productivity and
rhizosphere of mung bean (Vigna radiata L.)”. The data collected during the course of
investigation have been statistically analyzed and presented in Tables. The analysis of
variance calculated for various characters has been given. The treatment effects have been
described in this chapter in light of statistical interpretation.
4.1. Experiment-I: Effect of sorghum crop water extracts and residues on
weeds, productivity and rhizosphere of mung bean (Vigna radiata L.)To assess the effect of different treatments on weed dynamics (density, fresh and dry
weight), crop productivity traits (final emergence count per plot, height of mature plants,
number of seeds/pod, pod length, number of pods/plant, number of nodules/plant, weight of
1000 seeds, biological yield, seed yield, stalk yield and harvest index) and rhizosphere soil
parameters (soil bulk density, total soil porosity, soil pH, soil EC, total soil organic matter,
total soil nitrogen, available phosphorus, available potassium, microbial community,
microbial activity, alkaline phosphatase activity and dehydrogenase activity) were recorded
in this experiment.
Results are presented and discussed below:
Results:
4.1.1. Weed dynamics
Horse purslane (Trianthema portulacastrum) and purpule nut sedge (Cyperus
rotundus) both were dominant in each experimental unit during both years (2014 and 2015)
of study. This study indicated that the density, fresh and dry weight of horse purslane was
significantly differed with various allelopathic weed management strategies. Total weed
42

density, fresh and dry weight were also significantly differed with various allelopathic weed
management strategies. However, fresh and dry weight of purpule nutsedge was non-
significant among
43

Table. 4.1. Mean square values of weed dynamics affected by sorghum crop water extracts and residues
a)SOV b)DF c)HPD d)HPFW e)HPDW f)PND g)PNFW h)PNDW i)TWD j)TWFW k)TWDW
Treatments (T) 4 807.64* 10950.81* 1103.66* 50.36* 92.28NS 116.03NS 1262.21* 12917.41* 1301.86*
Years (Y) 1 215.47* 133.42* 13.44* 4.14* 2.98NS 59.02NS 236.60* 176.35* 17.76*
T×Y 4 35.83 267.70NS 26.98NS 1.49NS 2.98NS 7.26NS 29.27* 238.42NS 24.02NS
Error 18 9.624 136.93 13.80 0.806 6.28 2.642 9.88 141.95 14.30
a)SOV= source of variation, b)DF= degree of freedom, c)HBD= horse purslane density, d)HPFW= horse purslane fresh weight, e)HPDW= horse purslane dry weight, f)PND= purpul nutsedge density, g)PNFW= purpul nutsedge fresh weight, h)PNDW= purpul nutsedge dry weight, i)TWD= total weed density, j)TWFW= total weed fresh weight, k)TWDW= total weed dry weight, *= indicate significant at p ≤ 0.05, NS= non-significant
44
Table. 4.2. Effect of sorghum water extracts and residues on weed dynamics in mung beanTreatments 2014 2015 Mean d)(T) 2014 2015 Mean (T) 2014 2015 Mean (T)
Hors purslan density (0.25/m2) Hors purslan fresh weight (g per 0.25 m2) Hors purslan dry weight (g/0.25 m2)a)Control 41 40 40 A 156 147 152 A 49 47 48 Ab)SWE @ 10 L ha-1 41 32 36 B 135 126 130 B 40 43 41 BSWE @ 20 L ha-1 38 27 32 C 118 99 108 C 37 32 34 Cc)SR @ 4 tons ha-1 22 16 19 D 82 65 73 D 26 21 23 DSR @ 6 tons ha-1 13 12 13 E 48 43 46 E 15 13 14 EMean e)(Y) 31 A 26 B 104 A 100 B 33 A 31 BLSD (p≤0.05) T=3.76; Y=2.38 T=14.19; Y=3.15 T=4.51; Y=1.85
Purpl nutsedg density (0.25/m2) Purpl nutsedg fresh weight (g per 0.25 m2) Purpl nutsedg dry weight (g per 0.25 m2)Control 10 10 10 A 13 13 13 4 4 4SWE @ 10 L ha-1 9 7 8 B 10 6 8 3 2 3SWE @ 20 L ha-1 7 7 7 C 6 6 6 2 2 2SR @ 4 tons ha-1 6 5 5 D 3 3 3 1 1 1SR @ 6 tons ha-1 3 2 3 E 3 3 3 1 1 1Mean (Y) 7 A 6 B 7 6 2 2LSD (p≤0.05) T=1.09; Y=0.68 NS NS
Total weeds density (0.25/m2) Total weeds fresh weight (g per 0.25 m2) Total weeds dry weight (g per 0.25 m2)Control 57.15 a 56.55 a 56.85 A 175.18 165.94 170.56 A 58.05 55.12 56.58 ASWE @ 10 L ha-1 52.93 ab 49.61 bc 51.27 B 147.90 141.61 144.76 B 49.39 47.39 48.39 BSWE @ 20 L ha-1 45.77 c 36.55 d 41.16 C 130.28 112.08 121.18 C 43.79 38.02 40.91 CSR @ 4 tons ha-1 35.98 d 25.78 e 30.88 D 88.16 78.70 83.93 D 31.37 26.15 28.76 DSR @ 6 tons ha-1 24.35 e 18.42 f 21.39 E 59.78 52.68 56.23 E 20.78 19.16 19.97 EMean (Y) 43.12 A 37.50 B 120.26 A 110.20 B 39.69 A 38.15 BLSD (p≤0.05) T=3.81; Y=2.41; T × Y=5.39 T=14.44;Y=8.13 T=4.59;Y=0.55
a)Control= (plots with no crop residues or extract application); b)SWE= sorghum water extract; c)SR= sorghum residues; d)T= treatments; e)Y= year
45

various allelopathic weed management strategies (Table 4.1). The year effect was significant
for all weed parameters except fresh and dry weight of purpul nutsedge (Table 4.1). The
interaction of allelopathic weed management strategies and year was significant for total
weed density but non-significant for total fresh and dry weight and also for density, fresh and
dry weight of horse purslane and purpul nutsedge (Table 4.1).
The lowest horse purslane (13) and purpul nutsedge (3) density were recorded with
sorghum residues at 6 tons ha-1 compared to control (40 and 10, respectively). The lowest
values were observed in control (Table 4.2). Total weed density, fresh and dry weight was
decreased over times and the minimum values were observed during 2nd year (Table 4.2). In
case of horse purslane, minimum fresh (46 g per 0.25 m2) and dry.weight (14 g per 0.25 m2)
was observed with sorghum residues at 6 tons per ha followed by sorghum residues at 4 tons
ha-1 (Table 4.2). The maximum value of fresh (152 g per 0.25 m2) and dry weight (48 g per
0.25 m2) was observed in control (Table 4.2). In case of total weeds density the interactive
affect of allelopathic weed management strategies and year showed statistically significant
effect. The minimum total weed density (18.42) was recorded with sorghum residues at 6
tons ha-1 during 2nd year as compared to control (56.55). The lowest total weed fresh and dry
weight (56.23 and 19.97 g/0.25 m-2 respectively) was noted with sorghum residues at 6 tons
ha-1 and the maximum total weed density (56.85) was recorded in control (Table 4.2).
4.1.2. Crop data
4.1.2.1. Emergence and morphological traits
Final emergence count per plot was non-significant but all morphological traits
(height of mature plants, pod length, numbers of branche/plant, numbers of nodule/ plant and
stalk yield) differed significantly among the various allelopathic weed management strategies
(Table 4.3). Likewise, the year effect was significant for stalk yield but non-significant for
final emergence count per plot, height of mature plants, pod length, numbers of
branche/plant, numbers of nodule/plan (Table 4.3). The interaction of allelopathic weed
management strategies and year was non-significant for all traits (Table 4.3).
The results indicated that the maximum height of mature plants, pod length, numbers
of branche/plant, numbers of nodule/plan and stalk yield (Table 4.4; 48.3 cm, 9.0 cm, 14, 11
and 3087 kg ha-1, respectively) were noted with sorghum residues at 6 tons ha-1 as
46
Table. 4.3. Mean square of final emergence and morphological traits of mung bean affected by sorghum crop water extracts and residues
a)SOV b)DF c)FEC d)PH e)PL f)NB g)NN h)SY
Treatments (T) 4 37.12NS 39.71* 0.58* 23.03* 25.05* 331549*
Years (Y) 1 19.23NS 1.28NS 0.16NS 2.37NS 2.70NS 37827*
T×Y 4 0.55NS 1.36NS 0.004NS 0.03NS 0.45NS 15512NS
Error 18 10409.62 50.06 1.48 2.48 2.19 383338
a)SOV= source of variation, b)DF= degree of freedom, c)FEC= final emergence count, d)PH= plant height, e)PL= pod length, f)NB= number of branches, g)NN= number of nodules, h)SY= stalk yield, *= indicate significant at p ≤ 0.05, NS= non-significant
47
Table. 4.4. Effect of sorghum water extracts and residues on final emergence and morphological traits of mung bean
Treatments 2014 2015 Mean d)(T) 2014 2015 Mean (T)Final emergence count per plot Plant height at maturity (cm)
a)Control 557 558 558 40.7 41.2 40.9 Cb)SWE @ 10 L ha-1 558 560 559 42.5 42.7 42.6 CSWE @ 20 L ha-1 560 562 561 42.6 43.7 43.1 Cc)SR @ 4 tons ha-1 561 562 562 45.5 46.6 46.0 BSR @ 6 tons ha-1 563 565 564 47.7 49.0 48.3 AMean e)(Y) 44.0 44.4LSD (p≤0.05) NS T=2.1
Pod length (cm) No of branches per plantControl 8.3 8.4 8.3 C 9 9 9 CSWE @ 10 L ha-1 8.3 8.4 8.4 C 9 10 10 CSWE @ 20 L ha-1 8.5 8.6 8.5 C 10 11 10 BCSR @ 4 tons ha-1 8.7 8.9 8.8 B 12 12 12 ABSR @ 6 tons ha-1 8.9 9.1 9.0 A 14 14 14 AMean (Y) 8.5 8.7 11 11LSD (p≤0.05) T=0.1 T=1
Number of nodules per plant Stalk yield (kg ha-1)Control 5 5 5 C 2445 2489 2462 CSWE @ 10 L ha-1 7 8 8 B 2545 2589 2580 CSWE @ 20 L ha-1 7 8 8 B 2695 2715 2700 BSR @ 4 tons ha-1 9 9 9 AB 2743 2787 2732 BSR @ 6 tons ha-1 10 11 11 A 2989 3018 3087 AMean (Y) 2677 B 2748 ALSD (p≤0.05) T=1.79 T=119.37; Y=65.45a)Control= (plots with no crop residues or extract application); b)SWE= sorghum water extract; c)SR= sorghum residues; d)T= treatments; e)Y= year
48

compared to control (Table 4.4; 40.9 cm, 8.3 cm, 9, 5, 2462 kg ha -1 respectively). A linear
increase in height of mature plants, pod length, numbers of branche/plant, numbers of
nodule/plan was noted over time and stalk yield had significant increase in values during 2nd
year of study (Table.4.4).
4.1.2.2. Yield and yield components
Yield.and.yield components (no. of pods/plant, no. of seed/pod, weight of 1000 seeds,
biological yielde and harvst indx) differed significantly among the various allelopathic weed
management strategies (Table 4.5). Likewise, the year effect was significant for weight of
1000 seeds, biological yield, harvest index and yield but non-significant for no. of pods per
plant and no. of seeds per pod. The interaction of allelopathic weed management strategies
and year was significant only for yield. However, the interaction was non-significant for no.
of pods/plant, no. of seed/pod, weighte of thousand seeds, biological yield and harvest index
(Table 4.5).
The results indicated that the maximum value of no. of pods per plant (24.63) no. of
seed per pod (9.92), weight of 1000 seeds (55.33 g), biological yield (4106 kg ha -1), harvest
index (26.01%) and yield (1019.3 kg ha-1) were recoded with sorghum residues at 6 tons ha-1.
The minimum value of no. of pods per plant (14.55), no. of seed per pod (5.90), weight of
1000 seeds (50.25 g), biological yield (3206 kg ha-1), harvest index (22.74%) and yield
(744.3 kg ha-1) were observed in control (Table 4.6). A linear increase in no. of pods/plant,
no. of seed/pod, weighte of thousand seeds, biological yield, harvest index and yield was
noted over time and all above observations had significant increase in values during 2nd year
of study (Table 4.6).
4.1.3. Rhizosphere soil analysis
4.1.3.1. Rhizosphere soil properties and nutrients dynamics
At the end of experiment soil physical indicators of soil health like soil porosity and
bulk density were significantly differed among various allelopathic weed management
strategies (Table 4.7). The year effect was also statistically significant for soil physical
indicators but the interaction (allelopathic weed management strategies × year) was non-
significant (Table 4.7). In case of chemical indicators of soil health like EC (electrical
conductivity), SOM (soil organic matter), N (nitrogen), available K (potassium)
49

Table. 4.5. Mean square of yield and yield components of mung bean affected by sorghum crop water extracts and residues
a)SOV b)DF c)NPP d)NSP e)WTS f)BY g)HI h)Y
Treatments (T) 4 88.71* 12.93* 23.62* 696175* 4.85* 70580.21*
Years (Y) 1 114.35NS 13.00NS 15.83* 53679* 0.29* 1383.50*
T×Y 4 6.82NS 0.22NS 0.38NS 17259NS 0.57NS 214.22*
Error 18 4.683 0.943 10.897 386485 18.28 328.111
a)b)DF= degree of freedom, c)NPP= number of pods per plant, d)NSP= number of seed per plant, e)WTS= weight of thousand seed, f)BY= biological yield, g)HI= harvest index, h)Y= yield, *= indicate significant
50

Table. 4.6. Effect of sorghum water extracts and residues on yield and yield components of mung beanTreatments 2014 2015 Mean d)(T) 2014 2015 Mean (T)
No. of pods per plant No. of seed per poda)Control 13.76 15.33 14.55 D 5.43 6.37 5.90 Eb)SWE @ 10 L ha-1 17.00 19.09 18.05 C 6.55 7.80 7.17 DSWE @ 20 L ha-1 19.45 21.19 20.32 BC 6.95 8.02 7.48 Cc)SR @ 4 tons ha-1 20.03 23.99 22.32 AB 7.07 9.01 8.04 BSR @ 6 tons ha-1 23.55 25.72 24.63 A 9.24 10.61 9.92 AMean e)(Y) 17.96 21.86 7.05 8.36LSD (p≤0.05) T=2.62 T=0.25
Weight of 1000-seeds (g) Biological yield (kg ha-1)Control 49.95 50.54 50.25 E 3196 3216 3206 ESWE @ 10 L ha-1 52.58 54.03 53.31 D 3351 3410 3380 DSWE @ 20 L ha-1 53.25 54.90 54.08 C 3525 3587 3556 CSR @ 4 tons ha-1 53.76 55.66 54.71 B 3660 3670 3665 BSR @ 6 tons ha-1 54.49 56.16 55.33 A 3970 4242 4106 AMean (Y) 52.81 B 54.26 A 3540 B 3625 ALSD (p≤0.05) T=0.59; Y=1.45 T=105.07; Y=75.92
Harvest index (%) Yield (kg ha-1)Control 22.62 22.85 22.74 C 741.9 e 746.7 e 744.3 ESWE @ 10 L ha-1 22.48 23.07 22.78 C 789.2 d 811.5 d 800.4 DSWE @ 20 L ha-1 23.95 24.15 24.05 B 844.1 c 867.6 c 855.8 CSR @ 4 tons ha-1 24.26 24.74 24.50 B 931.2 b 934.2 b 932.7 BSR @ 6 tons ha-1 25.67 26.35 26.01 A 1009.1 a 1029.4 a 1019.3 AMean (Y) 23.80 B 24.23 A 863.70 B 877.29 ALSD (p≤0.05) T=0.39; Y=0.41 T=21.97; Y=11.45; T × Y=31.07a)Control= (plots with no crop residues or extract application); b)SWE= sorghum water extract; c)SR= sorghum residues; d)T= treatments; e)Y= year
51

Table. 4.7. Mean square of soil properties and nutrient dynamics in the rhizosphere of mung bean affected by sorghum crop water extracts and residues
a)SOV b)DF c)SBD d)TSP pH e)EC f)SOM g)TN h)AK i)AP
Treatments (T) 4 0.04* 68.96* 0.26* 0.07* 0.44* 0.05* 9264.35* 11.80*
Years (Y) 1 0.03* 13.97* 0.04 NS 0.01* 0.10* 0.004* 171.36NS 1.60*
T×Y 4 0.007NS 2.00NS 0.01NS 0.0001NS 0.03* 0.002* 55.03NS 0.55*
Error 18 0.004 1.447 0.111 0.011 0.007 0.0005 48.310 0.117
a)SOV= source of variation, b)DF= degree of freedom, c)SBD= soil bulk density, d)TSP= total soil porosity, e)EC= soil electric conductivity, f)SOM= soil organic matter, g)TN= total soil nitrogen, h)AK= available potassium, i)AP= available phosphorus, *= indicate significant at p≤ 0.05, NS= non-significant
52
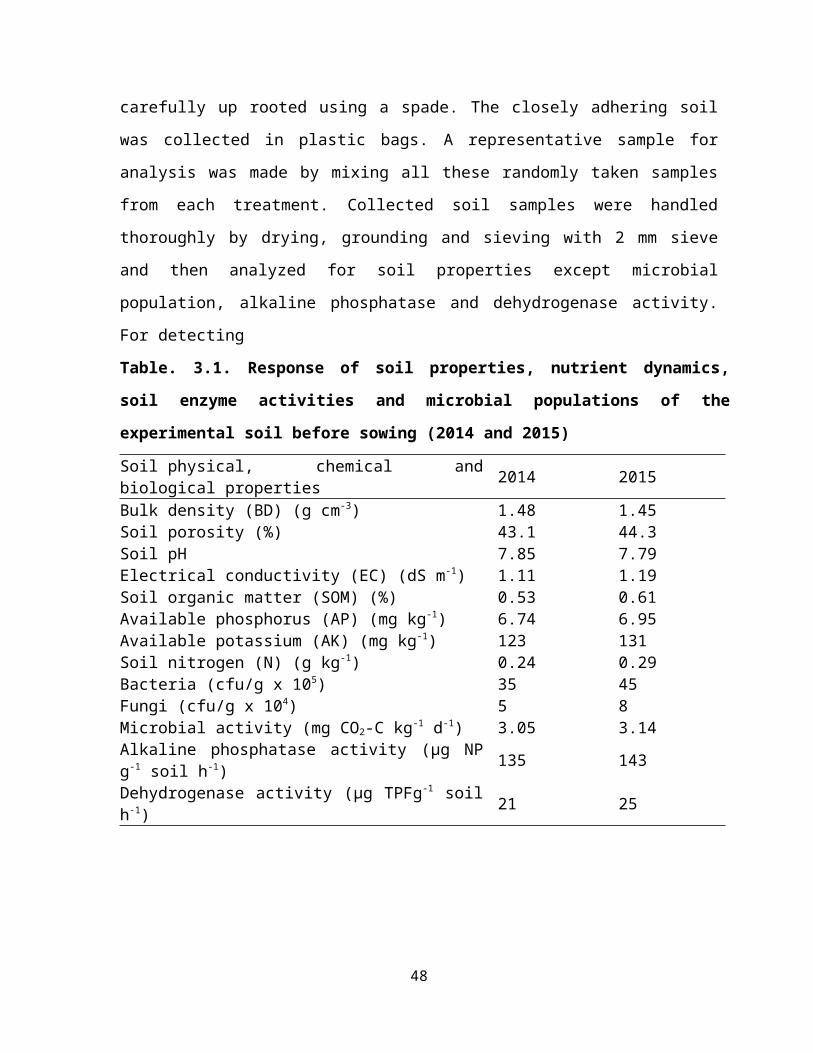
Table. 4.8. Effect of sorghum water extracts and residues on soil properties and nutrient dynamics in the rhizosphere of mung bean at harvest
Treatments 2014 2015 Mean d)(T) 2014 2015 Mean (T)Soil bulk density (g cm-3) Total soil porosity (%)
a)Control 1.48 1.46 1.47 A 42.82 43.73 43.27 Cb)SWE @ 10 L ha-1 1.47 1.46 1.46 A 43.53 44.10 43.82 CSWE @ 20 L ha-1 1.47 1.46 1.46 A 43.80 44.11 43.96 Cc)SR @ 4 tons ha-1 1.41 1.29 1.35 B 48.50 50.39 49.44 BSR @ 6 tons ha-1 1.38 1.23 1.30 C 48.66 51.79 50.22 AMean e)(Y) 1.44 A 1.38 B 45.46 B 46.83 ALSD (p≤0.05) T=0.04; Y=0.06 T=0.75; Y=0.92
Soil pH Soil EC (dS m-1)Control 7.75 7.72 7.73 A 1.07 1.11 1.09 CSWE @ 10 L ha-1 7.75 7.70 7.73 A 1.11 1.14 1.12 CSWE @ 20 L ha-1 7.74 7.69 7.72 A 1.12 1.14 1.13 CSR @ 4 tons ha-1 7.44 7.41 7.43 B 1.23 1.27 1.25 BSR @ 6 tons ha-1 7.38 7.18 7.28 C 1.32 1.36 1.34 AMean (Y) 7.61 A 7.54 B 1.17 B 1.20 ALSD (p≤0.05) T=0.12; Y=0.04 T=0.07; Y=0.02
Total soil organic matter (%) Total soil nitrogen (g kg-1)Control 0.67 d 0.69 d 0.68 C 0.22 d 0.21 d 0.22 CSWE @ 10 L ha-1 0.68 d 0.69 d 0.69 C 0.22 d 0.21 d 0.22 CSWE @ 20 L ha-1 0.69 d 0.71 d 0.70 C 0.22 d 0.21 d 0.22 CSR @ 4 tons ha-1 0.96 c 1.24 ab 1.10 B 0.32 c 0.38 b 0.35 BSR @ 6 tons ha-1 1.12 b 1.37 a 1.25 A 0.38 b 0.45 a 0.42 AMean (Y) 0.82 B 0.94 A 0.27 B 0.29 ALSD (p≤0.05) T=0.10; Y=0.06; T × Y=0.14 T=0.03; Y=0.01; T × Y=0.03
Available potassium (mg kg-1) Available phosphorous (mg kg-1)Control 121.45 121.93 121.69 C 6.74 d 6.77 d 6.76 CSWE @ 10 L ha-1 121.52 121.64 121.58 C 6.77 d 6.77 d 6.78 CSWE @ 20 L ha-1 121.52 122.00 122.76 C 6.77 d 6.80 d 6.79 CSR @ 4 tons ha-1 178.85 190.00 184.43 B 8.09 c 9.28 b 8.69 BSR @ 6 tons ha-1 195.00 206.65 200.83 A 9.25 b 10.31 a 9.78 AMean (Y) 147.67 152.45 7.53 B 7.99 ALSD (p≤0.05) T=8.43 T=0.41; Y=0.26; T × Y=0.58
a)Control= (plots with no crop residues or extract application); b)SWE= sorghum water extract; c)SR= sorghum residues; d)T= treatments; e)Y= year
53
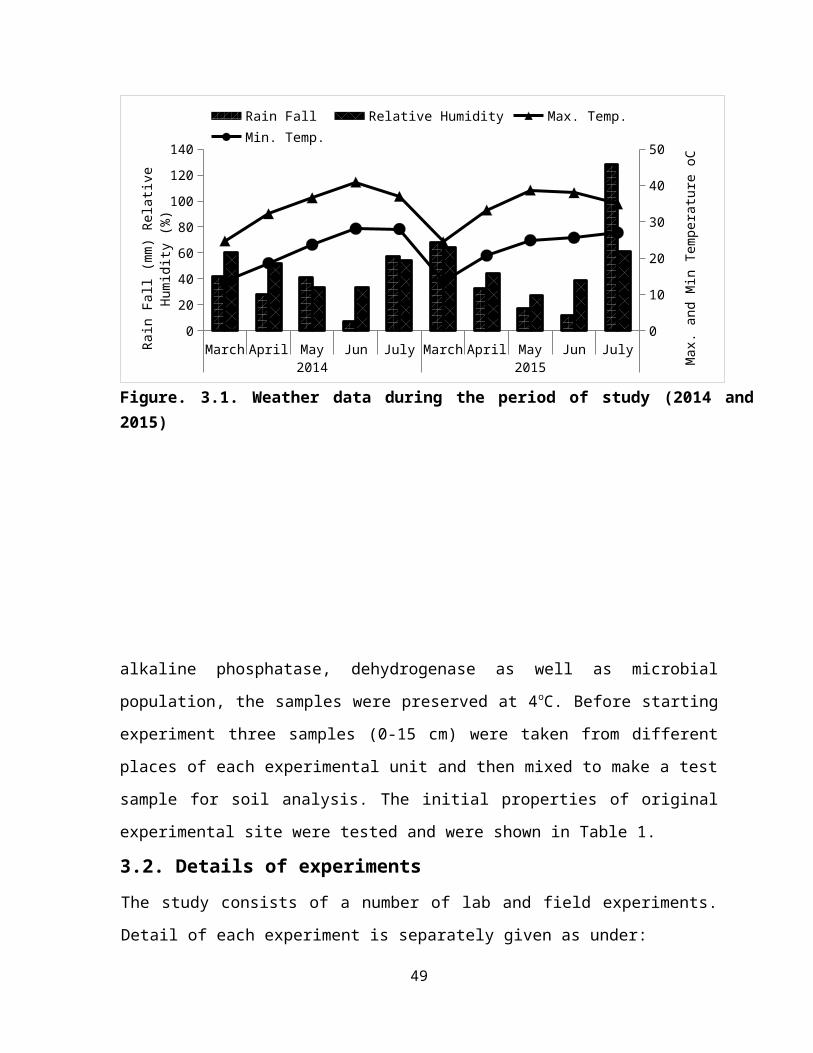
and P (phosphorus) were significantly differed among various allelopathic weed management
strategies (Table 4.7). The year effect was also statistically significant for all soil chemical
indicators except soil pH and available K. The interaction (allelopathic weed management
strategies × year) was statistically significant for SOM, N and available P. But for soil pH,
EC and available K interaction was non-significant (Table 4.7).
The lowest bulk density (1.30 g cm-3) and highest soil porosity (50.22%) were
observed in treatments when sorghum residues @ 6 tons ha-1 were applied as compared to
control while the lowest bulk density (1.23 g cm-3) and highest soil porosity (51.79%) were
observed in 2nd year of experiment (Table 4.8). In case of SOM, N and available P the
highest values (1.37%, 0.45 g kg-1, 10.31 mg kg-1, respectively) were observed during 2nd
year when sorghum residues @ 6 tons ha-1 were applied as compared to control (0.69%, 0.21
g kg-1, 6.77 mg kg-1, respectively). Among all allelopathic weed management strategies the
statistically highest values of soil EC (1.34 dS m-1) and available K (200.83 mg kg-1) were
obtained with the application of sorghum residues @ 6 tons ha-1. The statistically lowest
values for all parameters given above were observed in control which was statistical same
with sorghum water extracts @ 10 and 20 L ha-1 (Table 4.8). A linear increase in soil EC and
available K was observed over time and these parameters (soil EC and available K) had
highest values during the 2nd year of experiment (Table 4.8). In case of soil pH decreasing
trend was observed. Lowest soil pH (7.28) was observed with the application of sorghum
residues @ 6 tons ha-1 and highest soil pH (7.73) was observed in control which was
statistically similar with sorghum.water.extract @ 10 and 20.L ha-1 (Table 4.8).
4.1.3.2. Rhizosphere soil microbial population, activity and enzymes
Microbiological and biochemical indicators are also use full indicators of soil health.
They are more susceptible than physical and chemical attributes to changes imposed to the
environment. Microbiological indicators like population of bacteria, fungi and microbial
activity at 20 days after sowing and at harvesting differed significantly among various
allelopathic weed management strategies (Table 4.9). The year effect was also significant for
all above parameters (Table 4.9). The interactive effect of allelopathic weed management
strategies and year was significant for population of fungi but non-significant for population
of bacteria at 20 days after sowing and at harvesting (Table 4.9). In case of biochemical
54

Table. 4.9. Mean square of microbial population, microbial activity and soil enzymatic activity in the rhizosphere of mung bean affected by sorghum crop water extracts and residues
a)SOV b)DF c)B (20 d)DAS) B (e)AH) f)F (20 DAS) F (AH) g)MA (20 DAS) MA (AH) h)AP i)DG
Treatments (T) 4 1463.92* 504.53* 283.95* 149.20* 4.36* 2.89* 3947.11* 401.11*
Years (Y) 1 158.70* 28.03* 40.83* 76.80* 0.14* 0.11* 90.20* 64.59*
T×Y 4 30.28NS 8.53NS 6.08* 11.80* 0.001NS 0.001NS 37.08* 14.55*
Error 18 15.12 3.344 1.641 0.989 0.03 0.05 10.051 3.235
a)SOV= source of variation, b)DF= degree of freedom, c)B= Bacteria, f)F= fungi, g)MA= microbial activity, d)DAS= days after sowing, e)AH= after harvesting, h)AP= alkaline phosphatase, i)DG= dehydrogenase, *= indicate significant at p≤0.05, NS= non-significant
55
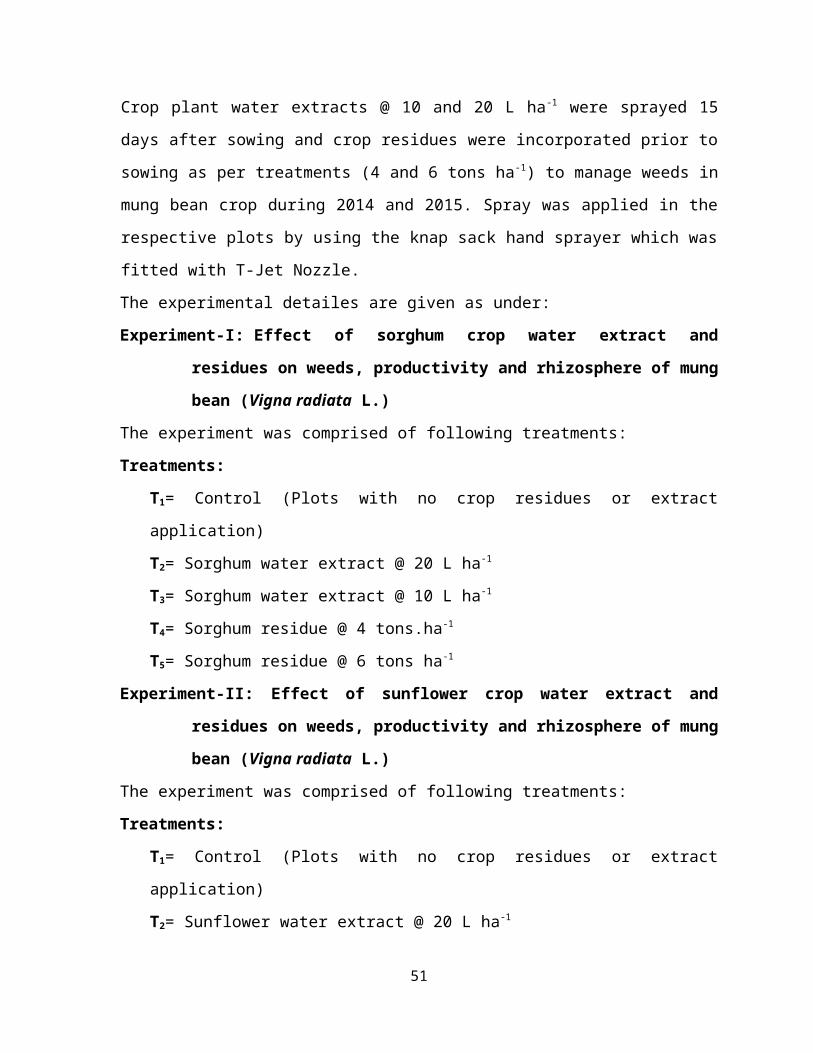
Table. 4.10. Effect of sorghum water extracts and residues on microbial population, microbial activity and soil enzymatic activity in the rhizosphere of mung bean
Treatments 2014 2015 Mean d)(T) 2014 2015 Mean (T)Bacteria (cfu/g x 105) 20 f)DAS Fungi (cfu/g x 104) 20 DAS
a)Control 43 44 43 D 7 d 8 d 8 Cb)SWE @ 10 L ha-1 46 48 47 CD 8 d 8 d 8 CSWE @ 20 L ha-1 48 49 48 C 8 d 9 d 9 Cc)SR @ 4 tons ha-1 64 74 69 B 15 c 20 b 18 BSR @ 6 tons ha-1 74 83 79 A 21 b 25 a 23 AMean e)(Y) 55 B 60 A 12 B 14 ALSD (p≤0.05) T=4.72; Y=2.98 T=1.55; Y=0.98; T × Y=2.20
Bacteria (cfu/g x 105) g)AH Fungi (cfu/g x 104) AHControl 21 22 22 C 5 f 6 f 6 DSWE @ 10 L ha-1 23 24 24 C 6 f 7 f 7 CDSWE @ 20 L ha-1 24 25 25 C 6 f 9 e 8 CSR @ 4 tons ha-1 35 40 38 B 11 d 17 b 14 BSR @ 6 tons ha-1 40 44 42 A 14 c 20 a 17 AMean (Y) 29 B 31 A 9 B 12 ALSD (p≤0.05) T=2.21; Y=1.40 T=1.21; Y=0.76; T × Y=1.71
Microbial activity (mg CO2-C kg-1 d-1) 20 DAS Microbial activity (mg CO2-C kg-1 d-1) AHControl 3.63 3.77 3.70 C 2.99 3.13 3.06 CSWE @ 10 L ha-1 3.65 3.78 3.71 C 3.05 3.15 3.10 CSWE @ 20 L ha-1 3.72 3.81 3.77 C 3.08 3.17 3.13 CSR @ 4 tons ha-1 4.88 5.05 4.97 B 3.99 4.11 4.05 BSR @ 6 tons ha-1 5.45 5.58 5.52 A 4.50 4.65 4.58 AMean (Y) 4.26 B 4.40 A 3.52 B 3.64 ALSD (p≤0.05) T=0.20; Y=0.13 T=0.28; Y=0.10
Alkaline phosphatase (μg NP/g soil/h) Dehydrogenase (μg TPF/g soil/h)Control 135.47 e 135.50 e 135.48 C 22.68 d 23.33 d 23.00 CSWE @ 10 L ha-1 135.48 e 135.55 e 135.52 C 23.09 d 23.59 d 23.34 CSWE @ 20 L ha-1 135.78 e 135.85 e 135.82 C 23.33 d 24.19 d 23.76 CSR @ 4 tons ha-1 167.26 d 173.46 c 170.36 B 32.00 c 38.00 b 35.00 BSR @ 6 tons ha-1 185.24 b 196.22 a 190.73 A 37.33 b 44.00 a 40.67 AMean (Y) 151.85 B 155.32 A 27.69 B 30.62 ALSD (p≤0.05) T=3.85; Y=2.43; T × Y=5.44 T=2.18; Y=1.37; T × Y=3.08
a)Control= (plots with no crop residues or extract application); b)SWE= sorghum water extract; c)SR= sorghum residues; d)T= treatments; e)Y= year; f)DAS= days after sowing; g)AH= after harvesting
indicators like soil enzymes (alkaline phosphatase and dehydrogenase) differed significantly
among various allelopathic weed management strategies at harvest (Table 4.9).
56
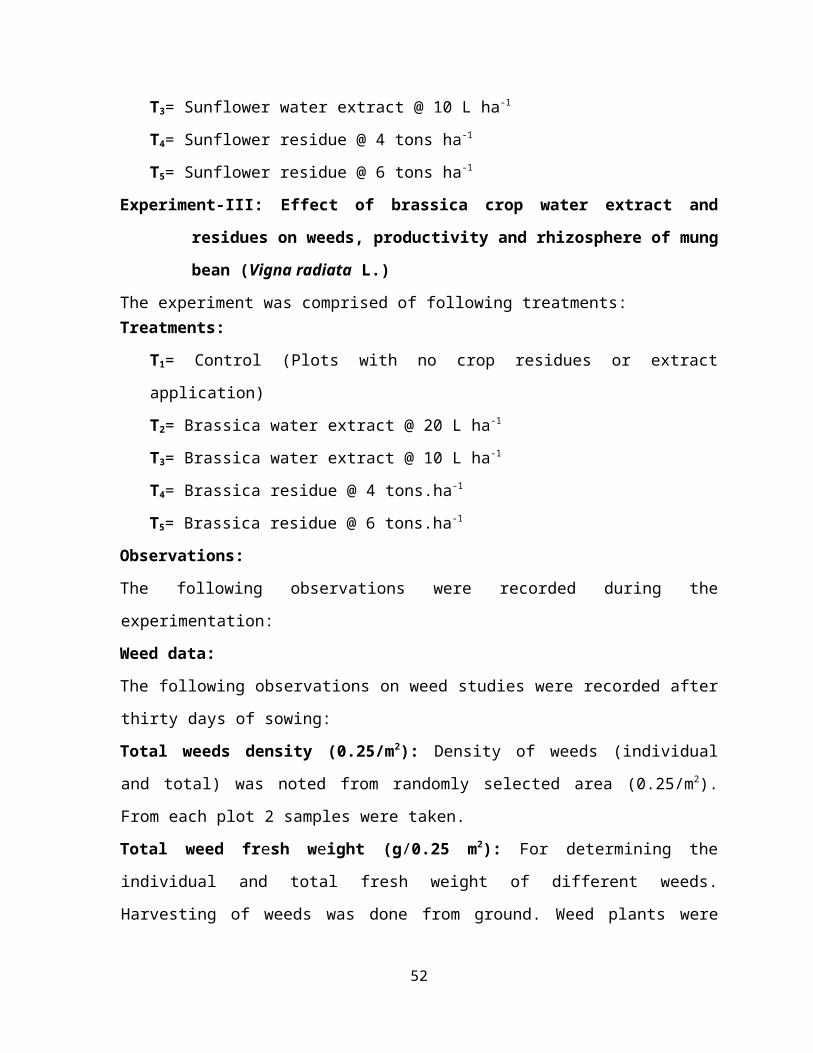
Interaction (allelopathic weed management strategies × year) was significant for
fungal population. The highest fungal population (25 cfu/g × 104 and 20 cfu/g × 104,
respectively) was recorded with the application of sorghum residues @ 6 tons ha -1 at both
stages i.e 20 days after sowing and at harvesting of 2nd year of experiment. But highest
bacterial population (79 cfu/g × 104 and 42 cfu/g × 104, respectively) and microbial activity
(5.52 mg CO2-C kg-1 d-1 and 4.58 mg CO2-C kg-1 d-1, respectively) was recorded with the
application of sorghum residues @ 6 tons ha-1 at both stages i.e 20 days after sowing and at
harvesting. The lowest microbial activity (3.70 mg CO2-C kg-1 d-1) and population of both
bacteria (22 cfu/g × 105) and fungi (6 cfu/g × 104) were observed in control (Table 4.10). A
linear increase in bacterial population at 20 days after sowing and at harvesting was observed
over times and the highest bacterial population was observed during second year (Table
4.10). In case of soil enzymes interactive effect of allelopathic weed management strategies
and year were resulted significant effect on activity of both enzymes like alkaline
phosphatase and dehydrogenase. Highest value (196.22 μg NP/g soil/h and 44.00 μg TPF/g
soil/h, respectively) was observed with the application of sorghum residues @ 6 tons ha -1
during 2nd year which was followed with same treatment in 1st year. The lowest value (135.50
μg NP/g soil/h and 23.33 μg TPF/g soil/h, respectively) was recorded in control (Table 4.10).
4.1.4. Economics and marrginal analysis
By subtract total cost from total benefits the net benefits were calculated for each
combination of treatments. Cost (in-put and out-put) of each combination was changed into
$/ha. Among all treatments sorghum residue at 6 tons ha-1 gave maximum economical returns
(306 $) during both years. While, minimum net benefit was obtained from control.
In case of marginal analysis (Table 4.12), application of sorghum residue at 6 tons ha -
1 had maximum MRR (161 $). However, rest of treatments was dominated due to less benefit
and higher cost that vary and these were uneconomical treatments. So, sorghum residue at 6
tons ha-1 may be the choice to get better economic returns.
Table. 4.11. Economics of mung bean grown in various allelopathic weed management strategies during 2014 and 2015
57

Treatments Yield(kg ha-1)
Adjusted yield(kg ha-1)
Gross incomee)$ ha-1
Total cost$ ha-1
Net benefits$ ha-1 Benefit cost ratio
a)Control 744 670 750 615 135 0.22b)SWE @ 10 L ha-1 800 720 806 628 179 0.29
SWE @ 20 L ha-1 856 770 863 633 230 0.36c)SR @ 4 tons ha-1 933 840 940 688 252 0.37
SR @ 6 tons ha-1 1019 917 1027 721 306 0.42
Remarks $ 44.67/40 kg
a)Control= (plots with no crop residues or extract application); b)SWE= sorghum water extract; c)SR= sorghum residues; d)PKR= Pakistani rupees; e)$= US dollar
Table. 4.12: Marginal analysis for two years (2014-2015)
Treatments
f)Cost that vary
($ ha-1)
Net benefits
($ ha-1)
g)Marginal cost
($ ha-1)
h)Marginal net benefits
($ ha-1)
Marginal rate of returns
(%)
a)Control 0 135 - - -b)SWE @ 10 L ha-1 12 179 12 44 i)D
SWE @ 20 L ha-1 17 230 17 96 Dc)SR @ 4 tons ha-1 73 252 73 117 161
SR @ 6 tons ha-1 106 306 106 171 161
Remarksa)Control= (plots with no crop residues or extract application); b)SWE= sorghum water extract; c)SR= sorghum residues; d)PKR= Pakistani rupees; e)$= US dollar; i)D= Dminated treatment = Treatment which has higher costs but lower net benefits
4.1.5. Discussion
58

Residues incorporation of allelopathic crop is a green approach for improvement of
soil properties and manages weeds in field crops. Our results showed a significant
improvement in soil properties and weed suppression potential of sorghum residues
incorporation and water extract. This approach had maximum reduction in weed density,
fresh weight and dry weight of weed species in mung bean (Table 4.2). This reduction is due
to phenolics (Dhurrin, p-hydroxybenzaldehyde, sorgoleone, vanillic acid, p-hydroxybenzoic
acid, p-hydroxybenzaldehyde, p-coumaric acid, ferulic acid) with wide spectrum of
biological activities including allelopathy (Sene et al., 2001; Czarnota et al., 2003). In case of
field crops, sorghum had highest allelopathic potential which has been reported by many
researchers (Alsaadawi et al., 2007). Inhibitory activity of sorghum allelochemicals on grassy
and broad leaved weeds has been reported (Alsaadawi et al., 2007). Cheema and Khaliq
(2000) investigated that 35-49% weed density and weed biomass was reduced by using water
extract of mature sorghum crop plants as compared with control. The sorghum residues
treatments showed highest suppression of weeds as compared to sorghum water extracts
treatments (Table 4.2) By adding sorghum at 2 too 6 tons ha-1 to soil it r-educed the weeds bi-
omass by 40 too 50%. Crop residues may change the weed frequency, distribution and may
cause the suppression of weeds (Essien et al., 2009; Khaliq et al., 2015). Zaji and Majd
(2011) showed that the fresh weight and dry weight of different weed biota viz. red root pig
weed (Amaranthus retroflexu), palmer amaranth (Amaranthus palmeri), black nightshade or
wonder berry (Solanum nigrum) and curled dock (Rumex crispus) were decreased severely
by the impact of residues of canola crop. The growth suppression of dominant weed biota in
this experiment might have observed due to physical resistance by sorghum residues
incorporation or release of chemicals from these residues. Allelochemicals release through
different parts of plants are depended on many factors i.e. applied crop family, size and dose
of mulching, decomposition rate, moisture contents, texture of soil and soil micro biota
(Kamara et al., 2000; Khaliq et al., 2014). Weed suppression level is directly related to the
dose of allelopathic product (Khanh et al., 2005; Khaliq et al., 2010, 2011). Mostly, by
incorporation of higher amount of crop residues greater weed suppression was observed. A
two year field experiment was conducted by Alsaadawi et al. (2013). They stated that
sorghum residues incorporation significantly reduced weed number and got high yield of
broad bean than weedy check.
59

Incorporation of sorghum residues have positive effect in case of weed population
and biomass reduction, but also improve nodulation and nitrogen fixation processes,
physical, chemical and nutritional status of field soil. Our results indicate that increased
quantities of crop residues have decreased bulk density and increase total porosity of soil
over time (Table 4.8). Shaver (2010) reported that soil porosity is directly related to soil bulk
density because as soil bulk density decreases, soil porosity increases. In case of soil
properties sorghum residues as allelopathic weed management strategy improved the SOM,
N, available K and P in soil (Table 4.8). Crop residues are good sources of nutrients and are
the primary source of organic material added to soil. It increases the nutrient availability and
water holding capacity of the soils (Krishna et al., 2004). Moisture retention is the main
benefit of residues incorporation. It is caused by decrease in runoff and evaporation of water
from soil. (Verhulst et al., 2011). The improvement in nutrient accumulation (especially P
and K) might be attributed to the fact the enhanced moisture retention within the soil due to
residue incorporation increased the solubility of these nutrients within the soil (Zhou et al.,
2002). Improved moisture availability due to residue incorporation also indicated that the soil
water holding capacity was improved and the soil moisture was available for longer times to
support plant growth (Jin et al., 2013). This increase in moisture retention properties might
decrease the irrigational requirement of the crops, which should be investigated in future
studies. In a study, Raut et al. (2010) stated that incorporation of sunflower straw at 4 t ha -1 +
RDF at (125% N + 100% P) in green gram recorded significantly higher soil N, K, and P
content in green gram-sunflower sequence. In another study, Santamarıa et al. (2008) showed
that with the incorporation of sunflower hulls, residues of oil industries, in the upper layer of
soil as organic amendment. In our study a linear decrease in the soil pH was observed by the
application of sorghum residues as allelopathic weed management strategies (Table 4.8).
Gong et al. (2008) reported that crop residue incorporation in soil decreases the soil pH. The
Parthenium hysterophorus residues in soil also changed the chemistry of soil. It revealed that
pH of P. hysterophorus infested soil decreased, whereas the EC of soil increased (Batish et
al., 2002a,b).
Using sorghum residues as allelopathic weed management strategies in mung bean
improved the microbial population and enzymatic activities of soil (Table 4.10). Microbial
abundance and soil enzymes are soil biological activities which are one of the important
60

indicators of soil quality (Dick, 1994). The residues incorporation of different crops in soil
modified the bio-chemical attributes i.e. soil microbial population and soil enzymatic activity
(Doran, 1980; Dick et al., 1983). Soil enzymes and micro biota play a key role in availability
of nutrients. Dehydrogenase enzyme is an important for the oxidation of soil organic matter
(SOM). It transfers the hydrogen and electrons from substrates to acceptors. The activity of
soil enzymes viz. dehydrogenase and phosphatase depends on type of residues incorporated
in soil. It also depends on the moisture contents and temperature of soil. It affects the activity
of dehydrogenase by changing the oxidation reduction status of soil (Brzezinska et al., 1998).
Incorporation of crop residues viz. tobacco and sunflower in soil increased the activities of
most of the soil enzymes, while the residues of tomato crop only increased the activity of
amylase and phosphodiesterase. At Akola, Maharashtra, Ravankar et al. (2000) reported that
incubation of soil with 1% organic residues of cotton stalk, safflower straw, sorghum stubble,
soybean stover, wheat straw, sugar cane trash, ground nut husk, sunflower straw, green gram
stover, parthenium with seed, grass complex with seed, and Xanthium with seed mixed
showed wide variation in the rate of decomposition, C:N ratio and microbial population at
different intervals. Fungal, bacterial, and actinomycetes populations increased at 30 days of
incubation. Bacteria were predominant over fungi and actinomycetes.
In our study, more than 37% increase in mung bean yield was done through effective
allelopathic weed management strategies. This increase in crop yield might be done due to
the improvement of soil properties and reduced weed competition during critical period of
crop growth. The effective reduction of weeds also increases the obtainability of re-sources
such as light, moisture, nutrients and gap (Kruidhof et al., 2008). A recent research on wheat
residues application in Mediterranean environment by Stagnari et al. (2014) resulted that soil
moisture conservation ability was improved especially during critical growth period of test
crop. The residues which are decomposed completely in soil not provide allelochemicals but
also participant in nutrition for crop plants. It provides nitrogen by release in rhizosphere soil
of tested crop plant. By the application of residues as a biological weed management it
immobilizes the nitrogen and it reduce the immediate source of nitrogen (Khaliq et al.,
2015). But, at later stages of crop growth the obtainability of nitrogen was improved by
mineralization, so this sustained supply of nitrogen is a nonstop source of nutrition for test
crop as well as next crops.
61

So, sorghum residues incorporation improve in soil properties viz. moisture retention,
restoring physical properties, enhance nutrient cycling, microbial activity (Alam et al., 2014;
Adugna and Abegaz, 2016; Nawaz et al., 2016) and suppression in weeds due to physical
hindrance by residues, reduced light penetration and suppressing ability of allelochemicals
which released from these plant residues (Kamara et al., 2000; Khaliq et al., 2014) harvested
better seed yield and achieve higher profitability in spring planted mung bean.
4.1.6. Conclusion
Allelopathic crop residues are magical source of nutrition and have efficient role in
controlling weeds, which is essential for sustainable crop production. In our study,
differential ability to suppress weeds was observed among various sorghum residue and
water extract application treatments. A high suppression of weed density, fresh and dry
weight was observed when sorghum residues at 6 tons ha -1 were incorporated into soil.
Apparently, the residues favorably affected the soil properties viz. nutrient dynamics,
microbial populations, soil enzyme activities. The improvement in soil properties and
suppression in weeds harvested better seed yield and achieve higher profitability in spring
planted mung bean. In short, sorghum residue incorporation may provide a better weed
control along with enhancing soil health and seed yield of spring planted mung bean.
4.2. Experiment-II: Effect of sunflower crop water extracts and residues on
weeds, productivity and rhizosphere of mung bean (Vigna radiate L.)
62
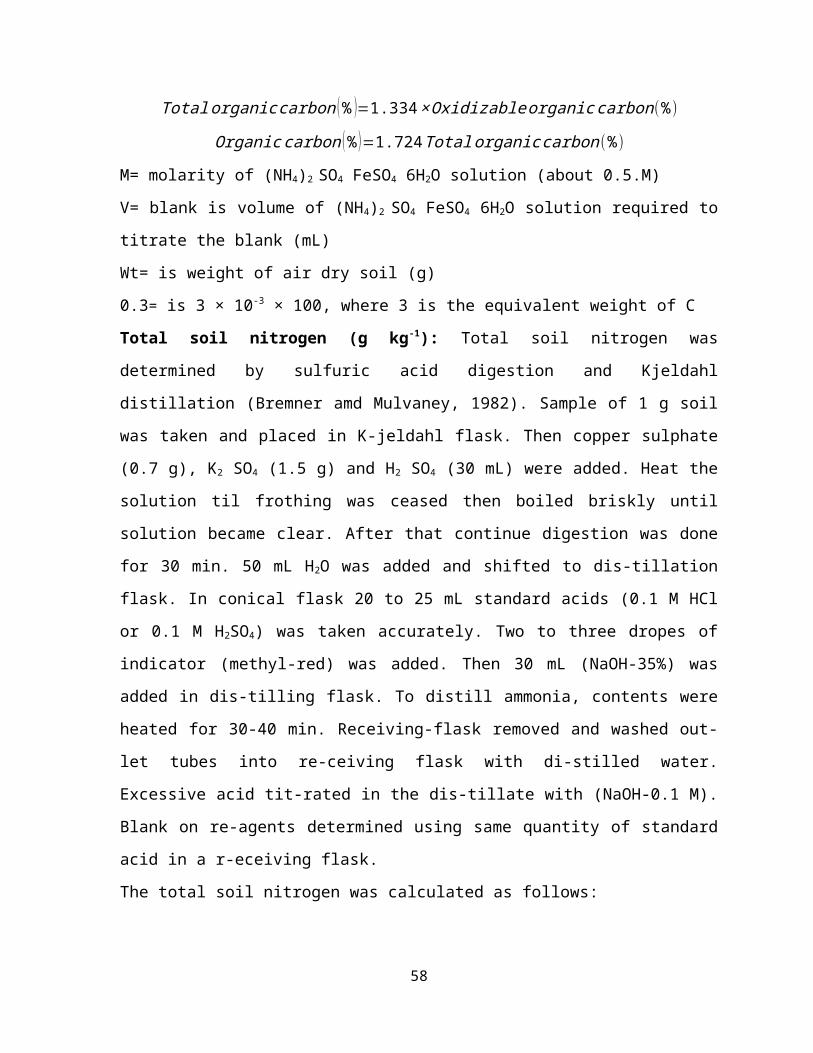
To assess the effect of different treatments on weed dynamics (density, fresh and dry
weight), crop productivity traits (final emergence count per plot, height of mature plants, no.
of seeds/pod, pod length, no. of pods/plant, no. of nodules/plant, weifgt of thousand seeds,
biological yield, seed yield, stalk yield and harvest index) and rhizosphere soil parameters
(bulk density, porosity, soil pH, soil EC, total soil organic matter, total soil nitrogen,
available phosphorus, available potassium, microbial community, microbial activity, alkaline
phosphatase activity and dehydrogenase activity) were recorded in this experiment.
Results are presented and discussed below:
Results
4.2.1. Weed dynamics
Horse purslane (Trianthema portulacastrum) and purpule nut sedge (Cyperus
rotundus) both were dominant in each experimental unit during both year of study. This
study indicated that the density, fresh and dry weight of horse purslane was significantly
differed with various allelopathic weed management strategies. Total.weed.density, fresh and
dry.weight were also significantly differed with various allelopathic weed management
strategies. However, fresh and dry weight of purpule nutsedge was non-significant among
various allelopathic weed management strategies (Table 4.13). The year effect was
significant for all weed parameters except fresh and dry weight of purpul nutsedge (Table
4.1). The interaction of allelopathic weed management strategies and year was significant for
total weed density and density of (horse purslane and purpul nutsedge) but non-significant
for total fresh and dry weight and also for fresh and dry weight of purpul nutsedge (Table
4.13).
The lowest horse purslane (13) and purpul nutsedge (3) density were recorded with
sunflower residues at 6 tons ha-1 in 2nd year as compared to control (42 and 10, respectively).
The lowest values were observed in control which was statistically same with sunflower
water extracts at 10 L ha-1 in 1st year (Table 4.14). Weed density, fresh and dry weight was
decreased over times and the minimum values were observed during 2nd year (Table 4.14). In
63
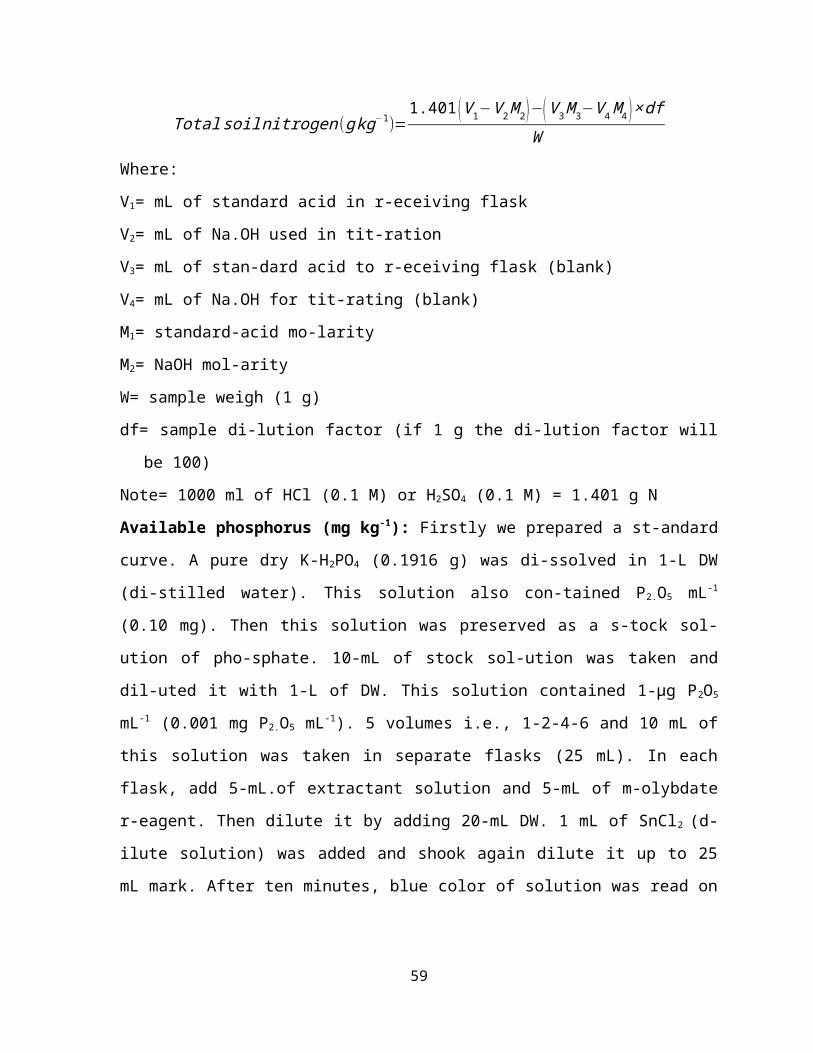
Table. 4.13. Mean square of weed dynamics affected by sunflower crop water extracts and residues
a)SOV b)DF c)HPD d)HPFW e)HPDW f)PND g)PNFW h)PNDW i)TWD j)TWFW k)TWDW
Treatments (T) 4 617.34* 9718.02* 979.38* 33.14* 41.67* 119.20NS 925.80* 10919.45* 812.26*
Years (Y) 1 51.17* 662.70* 66.78* 0.05NS 5.83 NS 56.60NS 61.03* 662.78* 18.49NS
T×Y 4 13.77NS 159.95 NS 16.12NS 0.11NS 1.29 NS 5.50NS 26.77* 159.92 NS 14.77NS
Error 18 9.532 175.97 17.734 0.2297 5.84 0.715 13.772 144.57 8.811
a)SOV= source of variation, b)DF= degree of freedom, c)HBD= horse purslane density, d)HPFW= horse purslane fresh weight, e)HPDW= horse purslane dry weight, f)PND= purpul nutsedge density, g)PNFW= purpul nutsedge fresh weight, h)PNDW= purpul nutsedge dry weight, i)TWD= total weed density, j)TWFW= total weed fresh weight, k)TWDW= total weed dry weight, *= indicate significant at p≤0.05, NS= non-significant
64
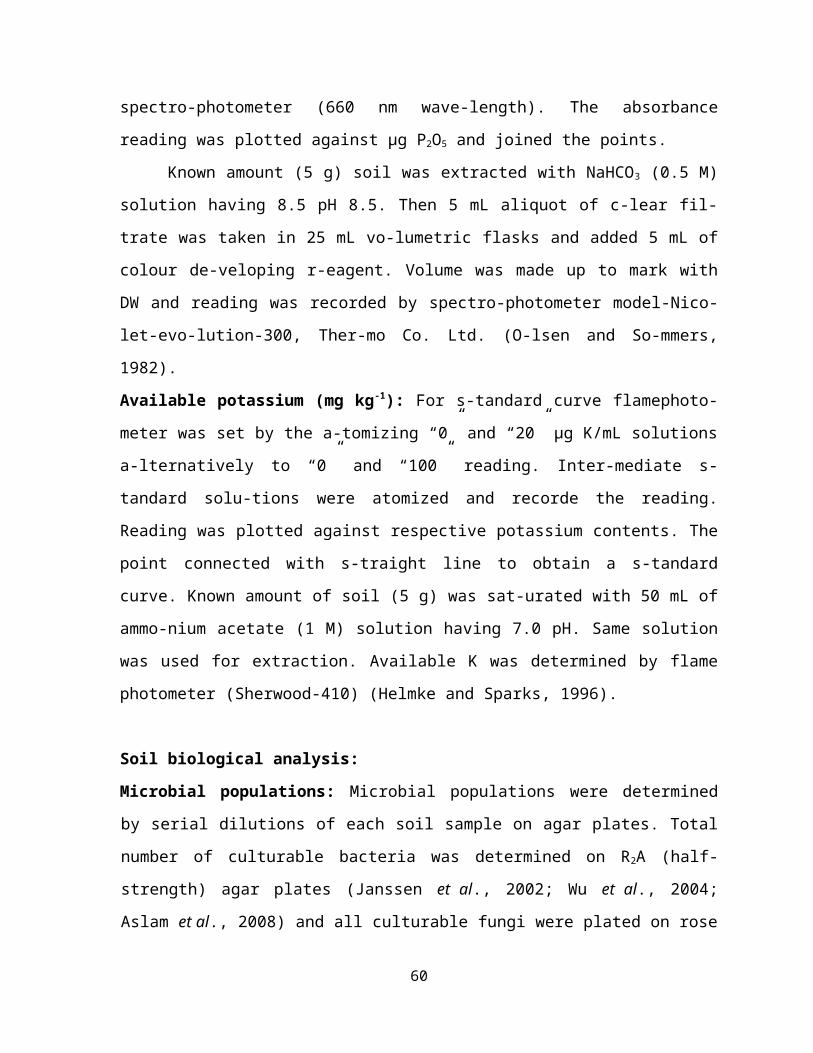
Table. 4.14. Effect of sunflower water extracts and residues on weed dynamics in mung beanTreatments 2014 2015 Mean d)(T) 2014 2015 Mean (T) 2014 2015 Mean (T)
Hors purslan density (0.25/m2) Hors purslan fresh weight (g per 0.25 m2) Hors purslan dry weight (g per 0.25 m2)a)Control 42 a 42 a 42 A 156 152 154 A 48 50 49 Ab)SFWE at 10 L ha-1 38 a-c 37 bc 38 B 149 135 142 B 43 43 43 BSFWE at 20 L ha-1 35 c 33 c 34 C 124 99 112 C 37 37 36 Cc)SFR at 4 tons ha-1 26 d 16 e 21 D 85 60 72 D 29 21 25 DSFR at 6 tons ha-1 17 e 13 e 15 E 56 40 48 E 19 14 16 EMean e)(Y) 32 A 28 B 114 A 97 B 35 A 33 BLSD (p≤0.05) T=3.27; Y=2.07; T × Y=4.62 T=11.59; Y=10.49 T=0.92; Y=1.33
Purpl nutsedg density (0.25/m2) Purpl nutsedg fresh weight (g per 0.25 m2) Purpl nutsedg dry weight (g per 0.25 m2)Control 10 ab 10 a 10 A 6 5 6 3 3 2SFWE at 10 L ha-1 9 ab 9 b 9 A 6 5 5 2 2 2SFWE at 20 L ha-1 8 c 7 d 8 B 5 5 5 2 2 2SFR at 4 tons ha-1 6 e 6 f 6 C 4 4 4 1 1 2SFR at 6 tons ha-1 5 f 3 g 4 D 4 4 4 1 1 2Mean (Y) 8 A 7 B 5 5 2 2LSD (p≤0.05) T=0.59; Y=0.37; T × Y=5.07 NS NS
Total weeds density (0.25/m2) Total weeds fresh weight (g per 0.25 m2) Total weeds dry weight (g per 0.25 m2)Control 57.29 a 57.89 a 57.59 A 167.03 163.36 165.19 A 57.05 55.88 56.48 ASFWE at 10 L ha-1 52.78 b 52.27 b 52.53 B 156.78 142.90 149.84 B 53.79 49.39 51.59 BSFWE at 20 L ha-1 44.10 c 43.88 c 43.99 C 131.49 107.08 119.29 C 45.77 38.02 41.89 CSFR at 4 tons ha-1 37.32 d 27.09 e 32.20 D 94.34 69.70 82.02 D 33.97 26.15 30.06 DSFR at 6 tons ha-1 27.35 e 21.76 f 24.56 E 65.19 47.68 56.44 E 24.72 19.16 21.94 EMean (Y) 43.77 A 40.58 B 122.23 A 106.88 B 42.83 A 37.95 BLSD (p≤0.05) T=3.58; Y=2.27; T × Y=1.63 T=15.33; Y=9.70 T=4.87; Y=3.08
a)Control= (plots with no crop residues or extract application); b)SFWE= sunflower water extract; c)SFR= sunflower residues; d)T= treatments; e)Y= year
65

case of horse purslane, minimum fresh (48 g per 0.25 m2) and drry weight (16 g per 0.25 m2)
was obserrved with sunflower residues at 6 tons/ha followed by sunflower residues at 4 tons
ha-1 (Table 4.14). The maximum value of fresh (154 g per 0.25 m) and drry weight (49 g per
0.25 m) was observed in control (Table 4.14). In case of horse purslane, purple nutsedge and
total weed density the interactive effect of allelopathic weed management strategies and year
showed statistically significant effect. The minimum horse purslane, purple nutsedge and
total weed density (13, 3 and 21.76 respectively) was recorded with sunflower residues at 6
tons ha-1 during 2nd year as compared to control (42, 10 and 57.89 respectively). The lowest
total weed fresh and dry weight (56.44 and 21.94 g/0.25 m-2, respectively) was noted with
residues at 6 tons ha-1 and the maximum total weed density (57.59) was recorded in control
(Table 4.14).
4.2.2. Crop data
4.2.2.1. Emergence and morphological traits
Final emergence count per plot was non-significant but all morphological traits
(height of mature plants, pod length, no. of branche/plant, no. of nodule/plant and stalk yield)
differed significantly among the various allelopathic weed management strategies (Table
4.15). Likewise, the year effect was significant for stalk yield but non-significant for final
emergence count per plot, height of mature plants, pod length, no. of branch/plant, no. of
nodule/plant (Table 4.15). The interaction of allelopathic weed management strategies and
year was non-significant for all traits (Table 4.15).
The results indicated that the maximum height of mature plants, pod length, no of
branche/plant, o of nodule/plant and stalk yield (table 5; 48.6 cm, 8.8 cm, 14, 11 and 3027 kg
ha-1 respectively) were noted with sunflower residues at 6 tons ha-1 as compared to control
(Table 4.16; 41.8 cm, 8.2 cm, 9, 6, 2434 kg ha -1 respectively). A linear increase in height of
matur plants, pod length, no. of branche/plant, no. of nodule/plant was noted over time and
stalk yield had significant increase in values during 2nd year of study (Table 4.16).
4.2.2.2. Yiield and yiield componnents
Yiield and yiield componnents (no. of pod/plant, no. of seed/pod, weight of thousand
seeds, biological yield and harrvest iindex) differed significantly among the various
allelopathic weed management strategies (Table 4.17). Likewise, the year effect was
66

Table. 4.15. Mean square of final emergence and morphological traits of mung bean affected by sunflower crop water extracts and residues
a)SOV b)DF c)FEC d)PH e)PL f)NB g)NN h)SY
Treatments (T) 4 17.55NS 36.18* 0.39* 18.43* 20.55* 294371*
Years (Y) 1 19.20NS 2.08NS 0.08NS 1.51NS 1.20NS 26725*
T×Y 4 0.45NS 0.14NS 0.001NS 0.11NS 0.45NS 8318NS
Error 18 7478.77 53.97 1.58 3.40 1.53 320194
a)SOV= source of variation, b)DF= degree of freedom, c)FEC= final emergence count, d)PH= plant height, e)PL= pod length, f)NB= number of branches, g)NN= number.of nodules, h)SY= stalk yield, *= indicate significant at p≤0.05, NS= non-significant
67

Table. 4.16. Effect of sunflower water extracts and residues on final emergence and morphological traits of mung bean
Treatments 2014 2015 Mean d)(T) 2014 2015 Mean (T)Final emergence count per plot Plant height at maturity (cm)
a)Control 597 599 598 41.7 41.8 41.8 Cb)SFWE @ 10 L ha-1 599 601 600 42.2 42.8 42.5 CSFWE @ 20 L ha-1 600 602 601 44.5 44.9 43.7 Cc)SFR @ 4 tons ha-1 601 602 602 45.8 46.6 46.2 BSFR @ 6 tons ha-1 602 603 603 48.2 49.0 48.6 AMean e)(Y) 600 601 44.5 45.0LSD (p≤0.05) NS T=2.15
Pod length (cm) No of branches per plantControl 8.2 8.3 8.2 C 9 9 9 CSFWE @ 10 L ha-1 8.3 8.4 8.3 C 10 10 10 BCSFWE @ 20 L ha-1 8.4 8.5 8.4 C 11 11 11 BCSFR @ 4 tons ha-1 8.6 8.7 8.6 B 11 12 12 ABSFR @ 6 tons ha-1 8.7 8.8 8.8 A 13 14 14 AMean (Y) 8.4 8.5 11 11LSD (p≤0.05) T=0.1 T=2
Number of nodules per plant Stalk yield (kg ha-1)Control 5 6 6 C 2414 2429 2434 DSFWE @ 10 L ha-1 8 8 8 B 2513 2529 2560 CSFWE @ 20 L ha-1 9 9 9 AB 2655 2712 2685 BSFR @ 4 tons ha-1 9 9 9 AB 2717 2768 2706 BSFR @ 6 tons ha-1 10 11 11 A 2829 2898 3027 AMean (Y) 8 9 2652 B 2712 ALSD (p≤0.05) T=1.50 T=120.37; Y=55.15
a)Control= (plots with no crop residues or extract application); b)SFWE= sunflower water extract; c)SFR= sunflower residues; d)T= treatments; e)Y= year
68

Table. 4.17. Mean square of yield and yield components of mung bean affected by sunflower crop water extracts and residues
a)SOV b)DF c)NPP d)NSP e)WTS f)BY g)HI h)Y
Treatments (T) 4 73.88* 11.07* 17.17* 636090* 5.02* 68569.01*
Years (Y) 1 67.80* 3.09* 1.84* 31493* 0.74* 195.51*
T×Y 4 4.79* 0.05NS 0.23NS 9061NS 0.50NS 117.41*
Error 18 1.804 0.4426 6.903 319373 17.07 147.800
b)DF= degree of freedom, c)NPP= number of pods per plant, d)NSP= number of seed per plant, e)WTS= weight of thousand seed, f)BY= biological yield, g)HI= harvest index, h)Y= yield, *= indicate significant at p≤0.05, NS= non-significant
69
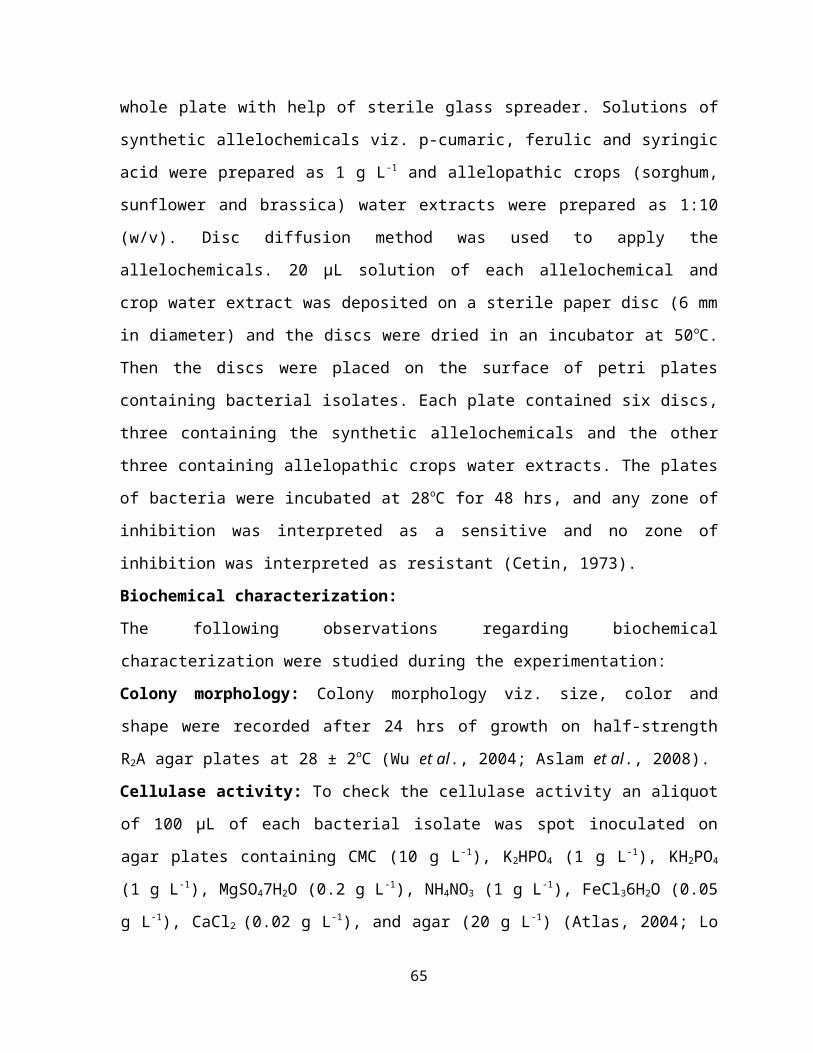
Table. 4.18. Effet of sunflower water extracts and residues on yield and yield components of mung beanTreatments 2014 2015 Mean d)(T) 2014 2015 Mean (T)
No. of pods per plant No. of seed per poda)Control 14.13 f 15.33 ef 14.73 E 5.48 6.37 5.93 Cb)SFWE at 10 L ha-1 17.01 de 18.38 d 17.70 D 6.55 7.13 6.84 BSFWE at 20 L ha-1 18.45 d 21.25 bc 19.85 C 6.95 7.35 7.15 Bc)SFR at 4 tons ha-1 19.03 cd 24.11 a 21.57 B 7.07 7.68 7.38 BSFR at 6 tons ha-1 21.55 b 26.13 a 23.84 A 9.24 9.96 9.60 AMean e)(Y) 18.03 B 21.04 A 7.06 B 7.70 ALSD (p≤0.05) T=1.63; Y=1.03; T × Y=2.30 T=0.81; Y=0.51
Weight of 1000-seeds (g) Biological yield (kg ha-1)Control 50.26 50.54 50.40 D 3155 3205 3180 DSFWE at 10 L ha-1 52.58 53.35 52.97 C 3335 3375 3355 CSFWE at 20 L ha-1 53.25 53.67 53.46 B 3522 3546 3534 BSFR at 4 tons ha-1 53.76 53.76 53.76 B 3631 3640 3636 BSFR at 6 tons ha-1 54.49 55.48 54.99 A 3941 4121 4042 AMean (Y) 52.87 B 53.36 A 3517 B 3582 ALSD (p≤0.05) T=0.35; Y=0.37 T=170.49; Y=60.54
Harvest index (%) Yield (kg ha-1)Control 23.75 24.05 23.90 D 745.3 e 746.7 e 746.0 ESFWE at 10 L ha-1 24.08 24.18 24.13 C 789.2 d 801.5 d 795.4 DSFWE at 20 L ha-1 24.35 24.69 24.52 C 844.1 c 854.4 c 849.3 CSFR at 4 tons ha-1 24.92 26.03 25.48 B 934.2 b 925.4 b 929.8 BSFR at 6 tons ha-1 25.75 26.34 26.05 A 1009.1 a 1019.4 a 1014.3 AMean (Y) 24.57 B 25.06 A 864.38 B 869.49 ALSD (p≤0.05) T=0.41; Y=0.39 T=14.75; Y=4.33; T × Y=20.85
a)Control= (plots with no crop residues or extract application); b)SFWE= sunflower water extract; c)SFR= sunflower residues; d)T= treatments; e)Y= year
70

significant for all yield and yield components (Table 4.17). The interaction of allelopathic
weed management strategies and year was significant for number of pods per plant and yield
(Table 4.17). However, the interaction was non-significant for no. of seed per pod, weight of
1000 seeds, biological yield and harvest index (Table 4.17).
The results indicated that the maximum (26.13) numbers of pods per plant were noted
with sunflower residues at 6 tons ha-1 during 2nd year as compared to control (15.33). Among
allelopathic weed management strategies, the maximum value of no. of seed per pod (9.60),
weight of 1000 seeds (54.99 g), biological yield (4042 kg ha -1), harvest index (26.05%) and
yield (1014.3 kg ha-1) were recoded with sunflower residues at 6 tons ha-1. The minimum
value of no. of seed per pod (5.93), weight of 1000 seeds (50.40 g), biological yield (3180 kg
ha-1), harvest index (23.90%) and yield (746.0 kg ha-1) were observed in control (Table 4.18).
A linear increase in no. of pod/plant, no. of seeds/pod, weight of thousand seeds, biological
yiield, harvest index and yield was noted over time and all above observations had significant
increase in values during 2nd year of study (Table 4.18).
4.2.3. Rhizosphere soil analysis
4.2.3.1. Rhizosphere soil properties and nutrients dynamics
Soil properties and nutrients status are best indication of soil health. This study
showed that soil porosity, bulk density, pH, EC (electrical conductivity), SOM (soil organic
matter), N (nitrogen), available K (potassium) and P (phosphorus) were significantly differed
among various allelopathic weed management strategies (table 2). The year effect was also
statistically significant for soil porosity, bulk density, EC, SOM, N, available K and P (Table
4.19). The interaction (allelopathic weed management strategies × year) was statistically
significant for soil porosity, bulk density, SOM, N and available P. But for soil pH, EC and
available K interaction was non-significant (Table 4.19).
Interaction (allelopathic weed management strategies × year) was significant for soil
porosity, bulk density, SOM, N and available P. The lowest bulk.density (1.26 g cm-3) and
highest soil.porosity (48.49%) were observed during 2nd year when sunflower residues at 6
tons ha-1 were applied as compared to control. The statistically highest soil bulk density (1.48
g cm-3) was observed in control which was statistical same with sunflower water extracts at
10 and 20 L ha-1 (Table 4.20). In case nutrient dynamics the highest value of SOM (1.32%),
N (0.42 g kg-1) and available P (10.18 mg kg-1) was observed during 2nd year when sunflower
71

Table. 4.19. Mean square of soil properties and nutrient dynamics in the rhizosphere of mung bean affected by sunflower crop water extracts and residues
a)SOV b)DF c)SBD d)TSP pH e)EC f)SOM g)TN h)AK i)AP
Treatments (T) 4 0.03* 16.42* 0.27* 0.05* 0.35* 0.04* 7782.47* 10.73*
Years (Y) 1 0.02* 11.87* 0.04 NS 0.02* 0.10* 0.01* 206.88* 1.53*
T×Y 4 0.01* 1.35* 0.01NS 0.01NS 0.03* 0.002* 47.45NS 0.52*
Error 18 0.004 0.871 0.108 0.010 0.007 0.0004 45.251 0.117
a)SOV= source of variation, b)DF= degree of freedom, c)SBD= soil bulk density, d)TSP= total soil porosity, e)EC= soil electric conductivity, f)SOM= soil organic matter, g)TN= total soil nitrogen, h)AK= available potassium, i)AP= available phosphorus, *= indicate significant at p≤0.05, NS= non-significant
72

Table. 4.20. Effect of sunflower water extracts and residues on soil properties and nutrient dynamics in the rhizosphere of mung bean at harvest
Treatments 2014 2015 Mean d)(T) 2014 2015 Mean (T)Soil bulk density (g cm-3) Total soil porosity (%)
a)Control 1.49 a 1.47 a 1.48 A 43.15 c 44.06 c 43.61 Cb)SFWE at 10 L ha-1 1.48 a 1.47 a 1.48 A 43.87 c 44.43 bc 44.15 CSFWE at 20 L ha-1 1.48 a 1.47 a 1.48 A 44.13 c 44.45 bc 44.29 Cc)SFR at 4 tons ha-1 1.44 ab 1.32 bc 1.38 B 45.76 b 47.72 a 46.74 BSFR at 6 tons ha-1 1.41 ab 1.26 c 1.33 C 45.96 b 48.49 a 47.22 AMean e)(Y) 1.46 A 1.40 B 44.57 B 45.83 ALSD (p≤0.05) T=0.04; Y=0.05; T × Y=0.11 T=1.53; Y=0.72; T × Y=1.60
Soil pH Soil EC (dS m-1)Control 7.78 7.75 7.77 A 1.07 1.11 1.09 CSFWE at 10 L ha-1 7.78 7.74 7.76 A 1.11 1.14 1.13 BCSFWE at 20 L ha-1 7.77 7.73 7.75 A 1.13 1.16 1.15 BCSFR at 4 tons ha-1 7.47 7.44 7.46 B 1.21 1.25 1.23 ABSFR at 6 tons ha-1 7.41 7.21 7.31 C 1.30 1.34 1.32 AMean (Y) 7.64 7.57 1.17 B 1.20 ALSD (p≤0.05) T=0.13 T=0.12; Y=0.02
Total soil organic matter (%) Total soil nitrogen (g kg-1)Control 0.68 d 0.69 d 0.69 C 0.21d 0.21d 0.21CSFWE at 10 L ha-1 0.68 d 0.69 d 0.69 C 0.21d 0.21d 0.21CSFWE at 20 L ha-1 0.69 d 0.71 d 0.70 C 0.21d 0.21d 0.21CSFR at 4 tons ha-1 0.91 c 1.19 ab 1.05 B 0.29c 0.35b 0.32BSFR at 6 tons ha-1 1.08 b 1.32 a 1.20 A 0.35b 0.42a 0.39AMean (Y) 0.81 B 0.92 A 0.25B 0.28ALSD (p≤0.05) T=0.09; Y=0.06; T × Y=0.14 T=0.02; Y=0.02; T × Y=0.04
Available potassium (mg kg-1) Available phosphorous (mg kg-1)Control 122.12 123.26 122.69 C 6.75 d 6.78 d 6.77 CSFWE at 10 L ha-1 122.18 123.33 122.76 C 6.78 d 6.80 d 6.79 CSFWE at 20 L ha-1 122.18 123.33 122.76 C 6.79 d 6.81 d 6.80 CSFR at 4 tons ha-1 173.85 185.00 179.43 B 7.99 c 9.15 b 8.57 BSFR at 6 tons ha-1 190.00 201.67 195.83 A 9.15 b 10.18 a 9.67 AMean (Y) 146.07 B 151.32 A 7.46 B 7.95 ALSD (p≤0.05) T=8.16; Y=5.16 T=0.42; Y=0.26; T × Y=0.59
a)Control= (plots with no crop residues or extract application); b)SFWE= sunflower water extract; c)SFR= sunflower residues; d)T= treatments; e)Y= year
73

residues at 6 tons ha-1 were applied as compared to control (0.69%, 0.21 g kg-1 and 6.78 mg
kg-1, respectively). Among all allelopathic weed management strategies the statistically
highest values of soil EC (1.32 ds m-1) and available K (195.83 mg kg-1) were obtained with
the application of sunflower residues at 6 tons ha-1. The statistically lowest (1.09 ds m-1 and
122.69 mg kg-1 ) values for all parameters given above were observed in control which was
statistical same with sunflower water extracts at 10 and 20 L ha -1 (Table 4.20). A linear
increase in soil EC and available K was observed over time and these parameters (soil EC
and available K) had highest values during the 2nd year of experiment (Table 4.20). In case of
soil pH decreasing trend was observed. The lowest soil pH (7.31) was observed with the
application of sunflower residues at 6 tons ha-1 and the highest soil pH (7.77) was observed in
control whiich was statisttically simiilar with sunnflower water exttract at 10 L/ha and 20
L/ha (Table 4.20).
4.2.3.2. Rhizosphere soil microbial population, activity and enzymes
Microbial abundance, activity and soil enzymes are robust indicators of soil fertility.
Microbial populations and activity at 20 days after sowing and at harvesting, soil enzymatic
activities (alkaline phosphatase and dehydrogenase) differed significantly among various
allelopathic weed management strategies (Table 4.21). The year effect was also significant
for all above parameters (Table 4.21). The interactive effect of allelopathic weed
management strategies and year was significant for alkaline phosphatase and dehydrogenase
activity and was non-significant for population and activity of microbes (Table 4.21).
Among the all allelopathic weed management strategies highest bacterial (75 cfu/g ×
105 and 39 cfu/g × 105, respectively), fungal (21 cfu/g × 104 and 15 cfu/g × 104, respectively)
population and microbial activity (5.26 mg CO2-C kg-1 d-1 and 4.37 mg CO2-C kg-1 d-1,
respectively) was recorded with the application of sunflower residues at 6 tons ha-1 at both
stages i.e 20 days after sowing and at harvesting. The lowest population and microbial
activity was observed in control whiich was statisttically simiilar with sunnflower water
extracts at 10 and 20 L/ha (Table 4.22). A linear increase in bacterial, fungal population and
microbial activity at 20 days after sowing and at harvesting was observed over times and the
highest bacterial, fungal population and microbial activity was observed during second year
(Table 4.22). In case of soil enzymes interactive effect of allelopathic weed management
strategies and year resulted significant effect on activity of both alkaline phosphatase and
74

Table. 4.21. Mean square of microbial population, microbial activity and soil enzymatic activity in the rhizosphere of mung bean affected by sunflower crop water extracts and residues of sunflower crop
a)SOV b)DF c)B (20 d)DAS) B (e)AH) f)F (20 DAS) F (AH) g)MA (20 DAS) MA (AH) h)AP i)DG
Treatments (T) 4 1277.70* 454.05* 219.00* 105.30* 3.14* 2.05* 3231.33* 270.13*
Years (Y) 1 145.20* 30.00* 43.20* 67.50* 0.15* 0.21* 90.20* 67.56*
T×Y 4 32.70NS 8.25NS 5.70NS 12.00NS 0.001NS 0.001NS 37.08* 15.51*
Error 18 14.88 2.833 1.033 1.011 0.45 0.34 11.96 3.236
a)SOV= source of variation, b)DF= degree of freedom, c)B= Bacteria, f)F= fungi, g)MA= microbial activity, d)DAS= days after sowing, e)AH= after harvesting, h)AP= alkaline phosphatase, i)DG= dehydrogenase, *= indicate significant at p≤0.05, NS= non-significant
75

Table. 4.22. Effect of sunflower water extracts and residues on microbial population, microbial activity and soil enzymatic activity in the rhizosphere of mung bean
Treatments 2014 2015 Mean d)(T) 2014 2015 Mean (T)Bacteria (cfu/g x 105) 20 f)DAS Fungi (cfu/g x 104) 20 DAS
a)Control 43 44 44 C 7 8 8 Cb)SFWE at 10 L ha-1 43 44 44 C 7 8 8 CSFWE at 20 L ha-1 44 45 45 C 8 9 9 Cc)SFR at 4 tons ha-1 60 70 65 B 13 18 15 BSFR at 6 tons ha-1 70 79 75 A 19 23 21 AMean e)(Y) 52 B 56 A 11 B 13 ALSD (p≤0.05) T=4.68; Y=2.96 T=1.23; Y=0.78
Bacteria (cfu/g x 105) g)AH Fungi (cfu/g x 104) AHControl 20 21 21 C 5 6 6 DSFWE at 10 L ha-1 21 21 21 C 6 6 6 CDSFWE at 20 L ha-1 22 22 22 C 6 8 7 CSFR at 4 tons ha-1 32 37 35 B 9 15 12 BSFR at 6 tons ha-1 37 41 39 A 12 18 15 AMean (Y) 26 B 28 A 8 B 11 ALSD (p≤0.05) T=2.04; Y=1.29 T=1.22; Y=0.77
Microbial activity (mg CO2-C kg-1 d-1) 20 DAS Microbial activity (mg CO2-C kg-1 d-1) AHControl 3.61 3.72 3.67 C 2.95 3.15 3.05 CSFWE at 10 L ha-1 3.65 3.78 3.72 C 3.05 3.17 3.11 CSFWE at 20 L ha-1 3.73 3.85 3.79 C 3.09 3.19 3.14 CSFR at 4 tons ha-1 4.65 4.81 4.73 B 3.78 3.95 3.87 BSFR at 6 tons ha-1 5.18 5.35 5.26 A 4.25 4.48 4.37 AMean (Y) 4.16 B 4.30 A 3.42 B 3.59 ALSD (p≤0.05) T=0.50; Y=0.11 T=0.41; Y=0.15
Alkaline phosphatase (μg NP/g soil/h) Dehydrogenase (μg TPF/g soil/h)Control 135.14 e 135.16 e 135.15 C 22.35 d 23.00 d 22.67 CSFWE at 10 L ha-1 135.15 e 135.22 e 135.18 C 22.76 d 23.26 d 23.01 CSFWE at 20 L ha-1 135.45 e 135.52 e 135.48 C 23.00 d 23.85 d 23.43 CSFR at 4 tons ha-1 162.25 d 168.45 c 165.35 B 29.00 c 35.00 b 32.00 BSFR at 6 tons ha-1 180.25 b 191.23 a 185.74 A 34.00 b 41.00 a 37.50 AMean (Y) 149.65 B 153.12 A 26.22 B 29.22 ALSD (p≤0.05) T=4.20; Y=11.05; T × Y=5.93 T=2.18; Y=1.38; T × Y=3.09
a)Control= (plots with no crop residues or extract application); b)SFWE= sunflower water extract; c)SFR= sunflower residues; d)T= treatments; e)Y= year; f)DAS= days after sowing; g)AH= after harvesting
76
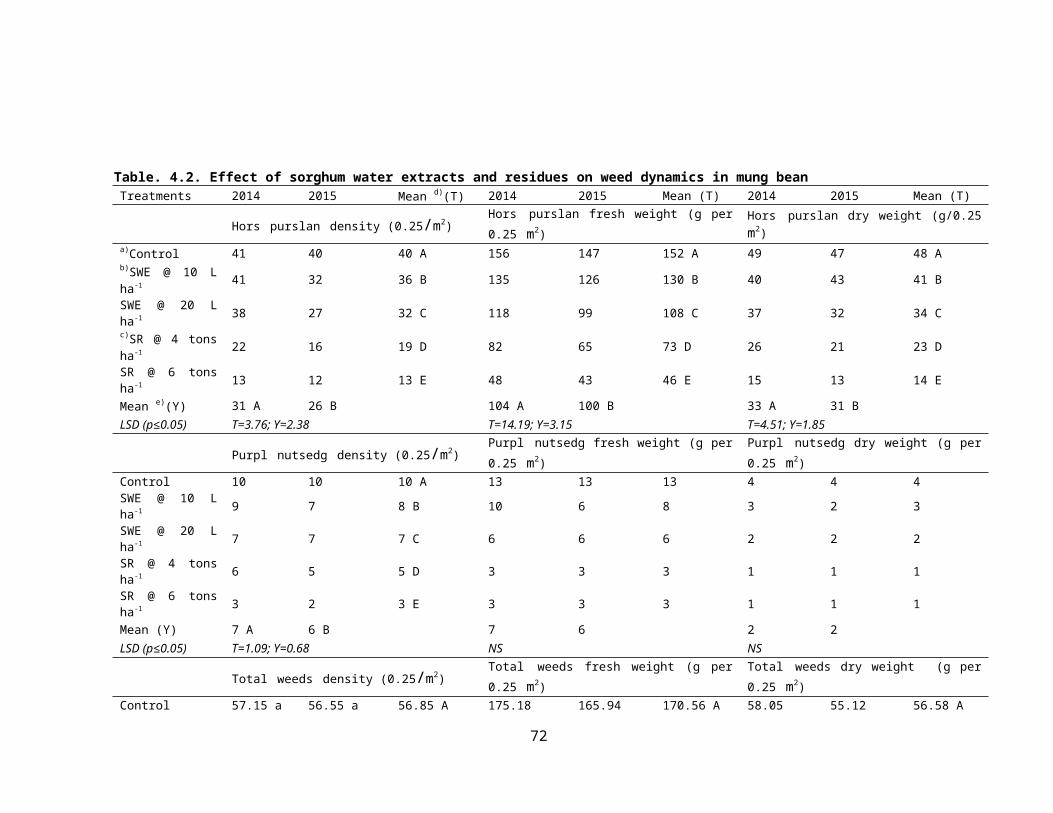
dehydrogenase enzyme. The highest value of alkaline phosphatase (191.23 µg NP g-1 soil h-1)
and dehydrogenase (41.00 µg TPF g-1 soil h-1) was observed with the application of
sunflower.residues at 6 tons ha-1 during 2nd year which was followed with same treatment in
1st year. The lowest value of alkaline phosphatase (135.15 µg NP g -1 soil h-1) and
dehydrogenase (23.00 µg TPF g-1 soil h-1) was recorded in control (Table 4.22).
4.2.4. Economics and marrginal analysis
Economics and margiinal annalyses were per-formed to compaere the net and
margiinal returrns and domiinance of indiividual treatment (Table 4.23). Among all
treatments sunflower residue at 6 tons ha-1 gave maximum economical returns (339 $) during
both years. While, minimum net benefit was obtained from control.
In case of marginal analysis (Table 4.24), application of sunflower residue at 6 tons
ha-1 had maximum MRR (308 $). However, rest of treatments was dominated due to less
benefit and higher cost that vary and these were uneconomical treatments. So, sunflower
residue at 6 tons ha-1 may be the choice to get better economic returns.
Table. 4.23. Economics of mung bean grown in various allelopathic weed management strategies during 2014 and 2015
77
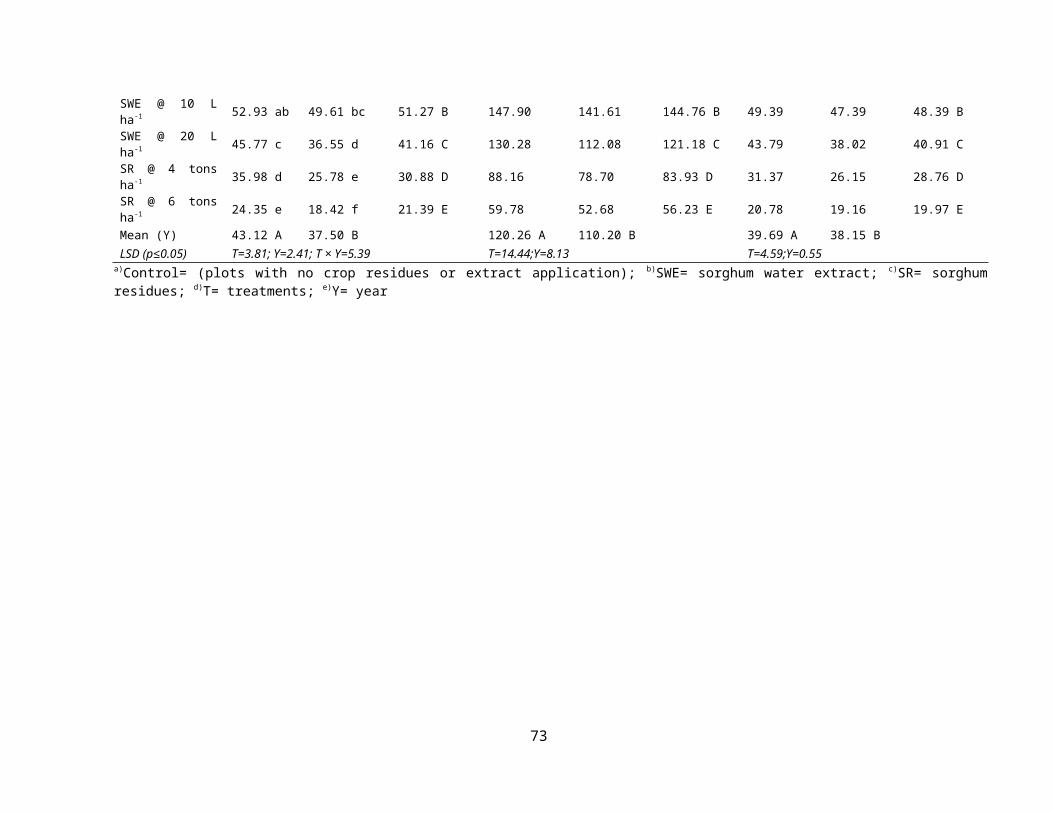
TreatmentYiield(kg/ha)
Adjusted yiield(kg/ha)
Gross iincomee)$/ha
Total cost$/ha
Neet benefits$/ha
Benefit costt ratiio
a)Control 746 671 752 615 137 0.22b)SFWE at 10 L ha-1 795 716 802 625 177 0.28
SFWE at 20 L ha-1 849 764 856 628 229 0.36c)SFR at 4 tons ha-1 930 837 937 663 274 0.41
SFR at 6 tons ha-1 1014 913 1022 683 339 0.50
Remarks $ 44.67/40 kg
a)Control= (plots with no crop residues or extract application); b)SFWE= sunflower water extract; c)SFR= sunflower residues; d)PKR= Pakistani rupees; e)$= US dollar
Table. 4.24: Marginal analysis for two years (2014-2015)
Treatments
f)Cost that vary
($ ha-1)
Net benefits
($ ha-1)
g)Marginal cost
($ ha-1)
h)Marginal net benefits
($ ha-1)
Marginal rate of returns
(%)
a)Control 0 135 - - -b)SFWE @ 10 L ha-1 10 181 10 47 i)D
SFWE @ 20 L ha-1 12 235 12 101 Dc)SFR @ 4 tons ha-1 48 277 48 143 297
SFR @ 6 tons ha-1 68 344 68 209 308
Remarksa)Control= (plots with no crop residues or extract application); b)SFWE= sunflower water extract; c)SFR= sunflower residues; d)PKR= Pakistani rupees; e)$= US dollar
4.2.5. Discussion
Residues incorporation of allelopathic crop is a green approach for improvement of
soil health and managing weeds in field crops. Our results showed a significant improvement
in soil health and weed suppression potential of sunflower residues incorporation and water
extract. This approach had maximum reduction in weed number and dry biomass of weed
78

species in mung bean (Table 4.14) owing to presence of phenolic compounds (cholorogenic,
caffiec, syringic, vanilic and ferulic acid) and terpinoids (sesquiterpene.lactones) with wide
spectrum of biological.activities including.allelopathy (Anjum and Bajwa, 2005; Marsni et
al., 2015). In case of field crops, sunflower had highest allelopathic potential which has been
reported by many.researchers (Alsaadawi et al., 2007). Kandhro et al. (2015) reported
maximum reduction.in weed.density (25.26%) and dry weight (14.60%) due water extract.
The results of Farooq et al. (2011) who observed statistically significant decrease in weed
number by using crop water extract are also supporting our results. The sunflower residues
treatments showed highest suppression of weeds as compared to sunflower water extracts
treatments (Table 4.14). The weed suppression of weeds in the field of wheat due to
sunflower residues by releasing allelochemicals and its effective involvement in nutrient
cycling (Table 4.14 Reberg-Horton et al., 2005; Alsaadawi et al., 2007). Crop residues may
change the weed frequency, distribution and may cause the suppression of weeds (Khaliq et
al., 2015; Essien et al., 2009). Previously, Zaji and Majd (2011) showed that the weight
(fresh and dry) of different weed biota viz. red root pig weed (Amaranthus retroflexu),
palmer amaranth (Amaranthus palmeri), black nightshade or wonder berry (Solanum nigrum)
and curled dock (Rumex crispus) were decreased severely by the impact of residues of canola
crop. The growth suppression of dominant weed biota in this study might have observed due
to physical resistance by sunflower residues incorporation or release of chemicals from these
residues. Allelochemicals release through different parts of plants are depended on many
factors i.e. applied crop family, size and dose of mulching, decomposition rate, moisture
contents, texture of soil and soil micro biota (Kamara et al., 2000; Khaliq et al., 2014).
Our results indicate that increased quantities of crop residues have decreased bulk
density and increase total porosity of soil over time (Table 4.20). Shaver (2010) reported that
soil porosity is directly related to soil bulk density because as soil bulk density decreases, soil
porosity increases. In case of soil properties sunflower residues as allelopathic weed
management strategy improved the SOM, N, available K and P in soil (Table 4.20). Crop
residues are good sources of nutrients and are the primary source of organic material added
to soil. It increases the nutrient availability and water holding capacity of the soils (Krishna et
al., 2004). Moisture retention is the main benefit of residues incorporation. It is caused by
decrease in runoff and evaporation of water from soil (Verhulst et al., 2011). The
79
improvement in nutrient accumulation (especially P and K) might be attributed to the fact the
enhanced moisture retention within the soil due to residue incorporation increased the
solubility of these nutrients within the soil (Zhou et al., 2002). Improved moisture
availability due to residue incorporation also indicated that the soil water holding capacity
was improved and the soil moisture was available for longer times to support plant growth
(Jin et al., 2013). This increase in moisture retention properties might decrease the
irrigational requirement of the crops, which should be investigated in future studies. In a
study, Raut et al. (2010) stated that incorporation of sunflower straw at 4 t ha-1 + RDF at
(125% N + 100% P) in green gram recorded significantly higher soil N, K, and P content in
green gram sunflower sequence. In another study, Santamarıa et al. (2008) showed that with t
he incorporation of sunflower hulls, residues of oil industries, in the upper layer of soil as
organic amendment. In our study a linear decrease in the soil pH was observed by the
application of sunflower residues as allelopathic weed management strategies (Table 4.20).
Gong et al. (2008) reported that sunflower oil residue incorporation in soil decreases the soil
pH. The Parthenium hysterophorus residues in soil also changed the chemistry of soil. It
revealed that pH of P. hysterophorus infested soil decreased, whereas the EC of soil
increased (Batish et al., 2002a,b).
Using sunflower residues as allelopathic weed management strategies in mung bean
improved the microbial population and enzymatic activities of soil (Table 4.22). Microbial
abundance and soil enzymes are soil biological activities which are one of the important
indicators of soil quality (Dick, 1994). The residues incorporation of different crops in soil
modified the bio-chemical attributes i.e. soil microbial population and soil enzymatic activity
(Doran, 1980; Dick et al., 1983). Soil enzymes and micro biota play a key role in availability
of nutrients. Dehydrogenase enzyme is an important for the oxidation of soil organic matter
(SOM). It transfers the hydrogen and electrons from substrates to acceptors. The activity of
soil enzymes viz. dehydrogenase and phosphatase depends on type of residues incorporated
in soil. It also depends on the moisture contents and temperature of soil. It affects the activity
of dehydrogenase by changing the oxidation reduction status of soil (Brzezinska et al., 1998).
Incorporation of crop residues viz. tobacco and sunflower in soil increased the activities of
most of the soil enzymes, while the residues of tomato crop only increased the activity of
amylase and phosphodiesterase. At Akola, Maharashtra, Ravankar et al. (2000) reported that
80

incubation of soil with 1% organic residues of cotton stalk, safflower straw, sorghum stubble,
soybean stover, wheat straw, sugar cane trash, ground nut husk, sunflower straw, green gram
stover, parthenium with seed, grass complex with seed, and Xanthium with seed mixed
showed wide variation in the rate of decomposition, C:N ratio and microbial population at
different intervals. Fungal, bacterial, and actinomycetes populations increased at 30 days of
incubation. Bacteria were predominant over fungi and actinomycetes.
In our study, more than 36% increase in mung bean yield was done through effective
allelopathic weed management strategies (Table 4.18). This increase in crop yield might be
done due to the improvement of soil health and reduction in weed competition during critical
crop growth period. The reduction of weeds also increases the obtainability of resources such
as light, moisture, nutrients and space (Kruidhof et al., 2008). A recent research on wheat
residues application in Mediterranean environment by Stagnari et al. (2014) resulted that soil
moisture conservation ability was improved especially during critical.growth.period of test
crop. The residues which are decomposed completely in soil provide allelo-chemicals but
also contribute in crop.nutrition. It provides nitrogen through release.in.rhizosphere soil of
tested crop plant. By the application of residues as a biological weed management it
immobilizes the nitrogen which causes reduction in supply of nitrogen (Khaliq et al., 2015).
But, at later stages of crop growth the obtainability of nitrogen was improved
through.mineralization, .so this.prolonged.supply of nitrogen is continuous.source of
nutrition for test crop as well as next crops.
So, sunflower residues incorporation improve in soil properties viz. moisture
retention, restoring physical properties, enhance nutrient cycling, microbial activity (Alam et
al., 2014; Adugna and Abegaz, 2016; Nawaz et al., 2016) and suppression in weeds due to
physical hindrance by residues, reduced light penetration and suppressing ability of
allelochemicals which released from these plant residues (Kamara et al., 2000; Khaliq et al.,
2014) harvested better seed yield and achieve higher profitability in spring planted mung
bean.
4.2.6. Conclusion
Allelopathic crop residues are magical source of nutrition and have efficient role in
controlling weeds, which is essential for sustainable crop production. In our study,
differential ability to suppress weeds was observed among various sunflower residue and
81
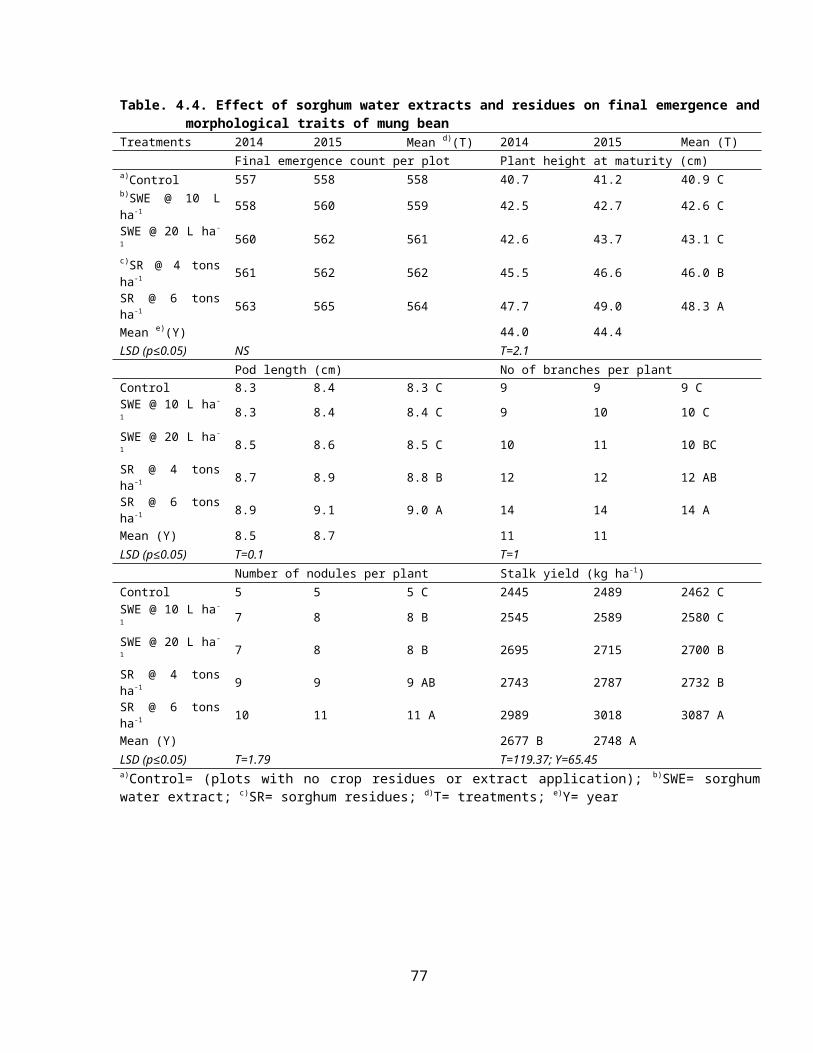
water extract application treatments. A high suppression of weed density fresh and dry
weight was observed when sunflower residues at 6 tons ha-1 were incorporated into soil.
Apparently, the residues favorably affected the soil properties viz. nutrient dynamics,
microbial populations, soil enzyme activities. The improvement in soil properties and
suppression in weeds harvested better seed yield and achieve higher profitability in spring
planted mung bean. In short, sunflower residue incorporation may provide a better weed
control along with enhancing soil health and seed yield of spring planted mungbean.
82
4.3. Experiment-III: Effect of brassica crop water extracts and residues on
weeds, productivity and rhizosphere of mung bean (Vigna radiate L.)To assess the effect of different treatments on weed dynamics (density, fresh and dry
weight), crop productivity traits (final emergence count per plot, height of mature plants, no.
of seed/pod, pod length, no. of pod/plant, no. of nodules/plant, 1000-seed weight, biological
yield, seed yield, stalk yield and harvest index) and rhizosphere soil parameters (bulk density,
porosity, soil pH, soil EC, total soil organic matter, total soil nitrogen, available phosphorus,
available potassium, microbial community, microbial activity, alkaline phosphatase activity
and dehydrogenase activity) were recorded in this experiment.
Results are presented and discussed below:
Results:
4.3.1. Weed dynamics
The dominant weed flora of study site in both years, assessed 30 days after sowing of
spring planted mung bean, consisted primarily of horse purslane (Trianthema portulacastrum
L.) which is broad leaved weed and purple nutsedge (Cyperus rotundus L.) which belongs to
sedges. According to this study horse purslane and purple nut sedge density, fresh and dry
weight showed significant difference with various allelopathic weed management strategies
(Table 4.25) but purple nut sedge fresh and dry weight was non-significant. The year effect
was also significant for all above parameters of horse purslane but non-significant for purple
nutsedge (Table 4.25). The interactive (allelopathic weed management strategies and year)
effect of both weeds was non-significant (Table 4.25). Inn casee of tottal weeds densiity,
fresh and drry weight the study showed significant difference with various allelopathic weed
management strategies (Table 4.25). The year effect was also significant for total weed
density, fresh and dry weight (Table 4.25). The interaction of allelopathic weed management
strategies and year was significant for total weed density but non-significant for total fresh
and dry weight (Table 4.25).
The lowest horse purslane and purple nutsedge density (18 and 5, respectively), fresh
(60 g/0.25 m2 and 3 g/0.25 m2, respectively) and dry weight (49 g/0.25 m2 and 1 g/0.25 m2,
respectively) were recorded with brassica residues @ 6 tons ha-1 as compared to control. The
highest values were observed in control (41, 10, respectively) which was statistically same
83

Table. 4.25. Mean square of weed dynamics affected by brassica crop water extracts and residues
a)SOV b)DF c)HPD d)HPFW e)HPDW f)PND g)PNFW h)PNDW i)TWD j)TWFW k)TWDW
Treatments (T) 4 617.34* 9718.02* 979.38* 33.14* 41.67* 119.20NS 925.80* 10919.45* 812.26*
Years (Y) 1 51.17* 662.70* 66.78* 0.05NS 5.83 NS 56.60NS 61.03* 662.78* 18.49NS
T×Y 4 13.77NS 159.95 NS 16.12NS 0.11NS 1.29 NS 5.50NS 26.77* 159.92 NS 14.77NS
Error 18 9.532 175.97 17.734 0.2297 5.84 0.715 13.772 144.57 8.811
a)SOV= source of variation, b)DF= degree of freedom, c)HBD= horse purslane density, d)HPFW= horse purslane fresh weight, e)HPDW= horse purslane dry weight, f)PND= purpul nutsedge density, g)PNFW= purpul nutsedge fresh weight, h)PNDW= purpul nutsedge dry weight, i)TWD= total weed density, j)TWFW= total weed fresh weight, k)TWDW= total weed dry weight, *= indicate significant at p≤0.05, NS= non-significant
Table. 4.26. Effect of brassica water extracts and residues on weed dynamics in mung beanTreatments 2014 2015 Mean d)(T) 2014 2015 Mean (T) 2014 2015 Mean (T)
Hors purslan density (0.25/m2) Hors purslan fresh weight (g per 0.25 m2) Hors purslan dry weight (g per 0.25 m2)a)Control 41 41 41 A 155 152 153 A 49 48 49 Ab)BWE @ 10 L ha-1 40 39 39 A 146 144 145 A 46 46 46 ABWE @ 20 L ha-1 36 35 35 B 130 128 129 B 41 41 41 B
84

c)BR @ 4 tons ha-1 27 20 24 C 96 74 85 C 31 24 27 CBR @ 6 tons ha-1 20 16 18 D 70 50 60 D 22 16 19 DMean e)(Y) 33 A 30 B 119 A 110 B 38 A 35 BLSD (p≤0.05) T=3.74; Y=2.37 T=16.09; Y=8.35 T=5.11; Y=2.35
Purpl nutsedg density (0.25/m2) Purpl nutsedg fresh weight (g per 0.25 m2) Purpl nutsedg dry weight (g per 0.25 m2)Control 10 10 10 A 9 10 10 3 3 3BWE @ 10 L ha-1 10 10 10 A 9 9 9 2 2 2BWE @ 20 L ha-1 8 8 8 B 7 7 7 2 2 2BR @ 4 tons ha-1 6 7 6 C 5 5 5 1 1 1BR @ 6 tons ha-1 5 4 5 D 3 3 3 1 1 1Mean (Y) 8 8 6 6 2 2LSD (p≤0.05) T=0.59 NS NS
Total weeds density (0.25/m2) Total weeds fresh weight (g per 0.25 m2) Total weeds dry weight (g per 0.25 m2)Control 57.25 a 57.8 a 57.55 A 165.46 163.20 164.33 A 56.55 55.83 56.19 ABWE @ 10 L ha-1 54.19 a 53.93 a 54.06 A 153.50 152.24 152.87 A 52.75 52.35 52.55 BBWE @ 20 L ha-1 45.80 b 45.46 b 45.63 B 137.79 135.65 136.72 B 47.77 47.09 47.43 CBR @ 4 tons ha-1 40.30 b 30.96 c 35.62 C 100.60 78.80 89.70 C 35.96 29.04 32.50 DBR @ 6 tons ha-1 30.35 c 25.42 c 27.89 D 74.54 55.00 64.77 D 27.69 21.48 24.59 EMean (Y) 45.60 A 42.73 B 126.38 A 116.98 B 44.14 A 41.16 BLSD (p≤0.05) T=4.45; Y=2.81; T × Y=6.29 T=14.58;Y=9.22 T=3.60; Y=2.93
a)Control= (plots with no crop residues or extract application); b)BWE= brassica water extract; c)BR= brassica residues; d)T= treatments; e)Y= year
85

with brassica water extracts @ 10 L ha-1 (Table 4.26). In case of total weed density the
interactive effect of allelopathic weed management strategies and year showed statistically
significant effect. The minimum total weed density (25.42) was recorded with brassica
residues @ 6 tons ha-1 during 2nd year as compared to control (Table 4.26). The lowest total
weed fresh and dry weight (64.77 g/0.25 m2 and 24.59 g/0.25 m2, respectively) was noted
with brassica residues @ 6 tons ha-1 and the maximum total weed density (57.55) was
recorded in control (Table 4.26).
4.3.2. Crop data
4.3.2.1. Emergence and morphological traits
Final emergence count per plot was non-significant but all morphological traits
(height of mature plants, pod length, no. of branche/plant, no of nodule/plant and stalk yield)
differed significantly among the various allelopathic weed management strategies (Table
4.27). Likewise, the year effect was significant for stalk yield but non-significant for final
emergence count per plot, height of mature plants, pod length, no. of branche/plant, no. of
nodule/plant (Table 4.27). The interaction of allelopathic weed management strategies and
year was non-significant for all traits (Table 4.27).
The results indicated that the maximum heigh of matur plants, pod length, no. of
branche/plant, no. of nodule/plant and stalk yield (Table 4.28; 48.4 cm, 8.7 cm, 13, 13 and
3111 kg ha-1, respectively) were noted with brassica residues at 6 tons ha-1 as compared to
control (Table 4.28; 41.6 cm, 7.9 cm, 9, 7, 2401 kg ha-1, respectively). A linear increase in
height of mature plants, pod length, no. of branche/plant, no of nodule/plant was noted over
time and stalk yield had significant increase in values during 2nd year of study (Table 4.28).
4.3.2.2. Yield and yield components
Yield and yield components like numbers of pod/plant, no. of seeds/pod, thousand
seeds weight, biological yiield and harrvest iindex differed significantly among the various
allelopathic weed management strategies (Table 4.29). Likewise, the year effect was
significant for all yiield and yiield componnents except 1000-seed weiight, biological yield
and harvest index (Table 4.29). The interaction of allelopathic weed management strategies
and year was significant for yield (Table 4.29). However, the interaction was non-significant
for
86

Table. 4.27. Mean square of final emergence and morphological traits of mung bean affected by brassica crop water extracts and residues
a)SOV b)DF c)FEC d)PH e)PL f)NB g)NN h)SY
Treatments (T) 4 22.25NS 41.22* 0.60* 23.70* 31.95* 419159.1*
Years (Y) 1 19.38NS 1.37NS 0.07NS 1.81NS 2.70NS 19182.3*
T×Y 4 2.78NS 0.26NS 0.006NS 0.33NS 0.45NS 9273.5NS
Error 18 148.05 1.95 1.18 48.45 3.71 320232
a)SOV= source of variation, b)DF= degree of freedom, c)FEC= final emergence count, d)PH= plant height, e)PL= pod length, f)NB= number of branches, g)NN= number of nodules, h)SY= stalk yield, *= indicate significant at p≤0.05, NS= non-significant
87

Table. 4.28. Effect of brassica water extracts and residues on final emergence and morphological traits of mung bean
Treatments 2014 2015 Mean d)(T) 2014 2015 Mean (T)Final emergence count per plot Plant height at maturity (cm)
a)Control 595 599 602 41.4 41.5 41.6 Db)BWE @ 10 L ha-1 597 598 601 44.2 44.4 44.4 CBWE @ 20 L ha-1 599 600 600 45.4 45.6 45.5 BCc)BR @ 4 tons ha-1 600 601 598 46.6 47.7 47.1 ABBR @ 6 tons ha-1 601 602 597 48.1 48.6 48.4 AMean e)(Y) 598 600 45.1 45.6LSD (p≤0.05) NS T=1.69
Pod length (cm) No of branches per plantControl 7.9 7.9 7.9 D 8 9 9 CBWE @ 10 L ha-1 8.1 8.2 8.2 C 10 10 10 BCBWE @ 20 L ha-1 8.3 8.4 8.3 C 11 12 12 ABBR @ 4 tons ha-1 8.4 8.5 8.5 B 13 13 13 ABR @ 6 tons ha-1 8.7 8.8 8.7 A 13 14 13 AMean (Y) 8.3 8.4 11 12LSD (p≤0.05) T=0.1 T=1
Number of nodules per plant Stalk yield (kg ha-1)Control 6 7 7 C 2412 2425 2401 DBWE @ 10 L ha-1 8 8 8 C 2511 2529 2729 CBWE @ 20 L ha-1 9 9 9 C 2653 2675 2781 CBR @ 4 tons ha-1 10 11 11 B 2725 2787 2935 BBR @ 6 tons ha-1 12 13 13 A 2925 2994 3111 AMean (Y) 9 10 2766 B 2817 ALSD (p≤0.05) T=1.50 T=140.97; Y=45.15a)Control= (plots with no crop residues or extract application); b)BWE= brassica water extract; c)BR= brassica residues; d)T= treatments; e)Y= year
88

Table. 4.29. Mean square of yield and yield components of mung bean affected by brassica crop water extracts and residues
a)SOV b)DF c)NPP d)NSP e)WTS f)BY g)HI h)Y
Treatments (T) 4 53.38* 10.77* 17.61* 781917* 3.32* 61461.7*
Years (Y) 1 37.81* 3.18* 1.66NS 29016NS 0.08NS 1014.0*
T×Y 4 2.13NS 0.04NS 0.36NS 8412NS 0.76NS 195.8*
Error 18 0.794 0.1764 3.368 322005 12.40 49.5
b)DF= degree of freedom, c)NPP= number of pods per plant, d)NSP= number of seed per plant, e)WTS= weight of thousand seed, f)BY= biological yield, g)HI= harvest index, h)Y= yield, *= indicate significant at p≤0.05, NS= non-significant
89

Table. 4.30. Effect of brassica water extracts and residues on yield and yield components of mung beanTreatments 2014 2015 Mean d)(T) 2014 2015 Mean (T)
No. of pods per plant No. of seed per poda)Control 14.03 15.17 14.60 E 5.29 6.17 5.73 Db)BWE @ 10 L ha-1 16.92 18.18 17.55 D 6.35 7.03 6.69 CBWE @ 20 L ha-1 17.67 21.27 19.47 C 6.55 7.18 6.87 BCc)BR @ 4 tons ha-1 19.29 22.74 21.01 B 7.04 7.68 7.36 BBR @ 6 tons ha-1 21.25 23.03 22.14 A 9.14 9.56 9.35 AMean e)(Y) 17.83 B 20.08 A 6.87 B 7.53 ALSD (p≤0.05) T=1.08; Y=0.68 T=0.51; Y=0.32
Weight of 1000-seeds (g) Biological yield (kg ha-1)Control 50.14 50.26 50.20 D 3134 3185 3159 EBWE @ 10 L ha-1 52.28 53.19 52.74 C 3514 3526 3520 CBWE @ 20 L ha-1 53.06 53.26 53.16 B 3625 3632 3628 CBR @ 4 tons ha-1 53.66 53.70 53.68 B 3835 3885 3860 BBR @ 6 tons ha-1 54.29 55.38 54.84 A 4023 4214 4118 AMean (Y) 52.69 53.16 3626 3688LSD (p≤0.05) T=0.53 T=353
Harvest index (%) Yield (kg ha-1)Control 22.14 23.05 22.60 D 743.2 f 773.9 e 758.5 EBWE @ 10 L ha-1 22.63 23.10 22.87 D 785.1 de 795.9 d 790.5 DBWE @ 20 L ha-1 23.51 23.84 23.68 C 842.0 c 852.7 c 847.4 CBR @ 4 tons ha-1 24.28 24.07 24.19 B 923.6 b 924.9 b 924.3 BBR @ 6 tons ha-1 25.30 24.34 24.82 A 1005.0 a 1009.7 a 1007.3 AMean (Y) 23.57 23.68 859.78 B 871.41 ALSD (p≤0.05) T=0.53 T=8.53; Y=5.40; T × Y=12.07
a)Control= (plots with no crop residues or extract application); b)BWE= brassica water extract; c)BR= brassica residues; d)T= treatments; e)Y= year
90
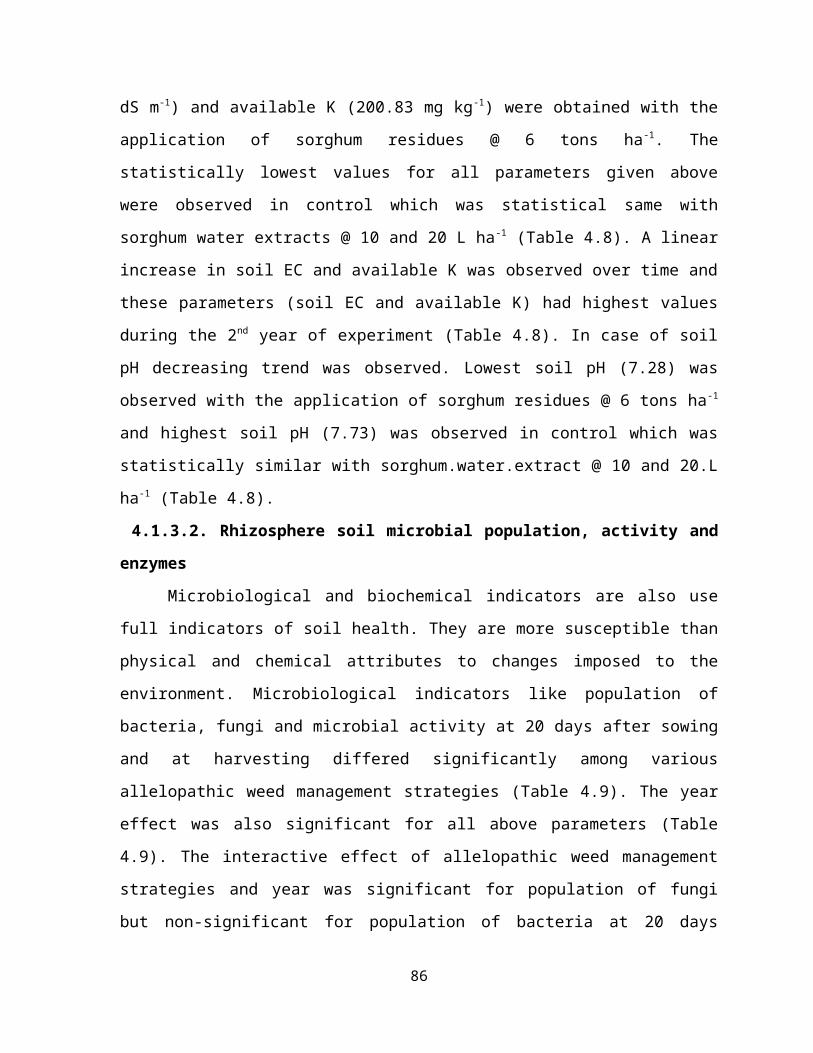
no. of pods/plant, no. of seed/pod, thousand seeds weight, biological yiield and harrvest
iindex (Table 4.29).
The results indicated that the maximum yield (1009.7 kg ha-1) was noted with brassica
residues @ 6 tons ha-1 during 2nd year as compared to control (Table 4.30). Among
allelopathic weed management strategies, the maximum values of no. of pods per plant
(22.14), no. of seed per pod (9.35), 1000-seed weight (54.84), biological yield (4118) and
harvest index (24.82) were recoded with brassica residues @ 6 tons ha -1. The minimum
values of no. of pods per plant (14.60), no. of seed per pod (5.73), 1000-seed weight (50.20),
biological yield (3159) and harvest index (22.60) were observed in control (Table 4.30). A
linear increase in no. of pods/plant, no. of seeds/pod, thousand seeds weight, biological yiield
and harrvest iindex were noted over time and no. of pods per plant, no. of seed per pod, and
yield had significant increase in values during 2nd year of study (Table 4.30).
4.3.3. Rhizosphere soil analysis
4.3.3.1. Rhizosphere soil properties and nutrients dynamics
Soil properties and nutrients status are best indication of soil health. This study
showed that soil porosity, bulk density, pH, EC. (electrical conductivity), SOM. (soil organic
matter), .N (nitrogen), available K (potassium) and P (phosphorus) were significantly
differed among various allelopathic weed management strategies (Table 4.31). The year
effect was also statistically significant for soil porosity, bulk density, EC, SOM and available
P but non-significant for total soil N and available K (Table 4.31). The interaction
(allelopathic weed management strategies × year) was statistically significant for SOM and
available P. But for soil porosity, bulk density, soil pH, EC and available K interaction was
non-significant (Table 4.31).
Interaction (allelopathic weed management strategies × year) was significant for
SOM and available P. The highest value of SOM (1.15%) and available P (9.60 mg kg -1) was
observed during 2nd year when brassica residues at 6 tons ha-1 were applied as compared to
control (0.68% and 6.73 mg kg-1, respectively). Among all allelopathic weed management
strategies the statistically highest values soil EC (1.30 ds m-1) and available K (190.85 mg kg-
1) were obtained with the application of brassica residues at 6 tons ha -1. The statistically
lowest (1.09 ds m-1 and 119.59 mg kg-1) values for all parameters given above were observed
91

Table. 4.31. Mean square of soil properties and nutrient dynamics in the rhizosphere of mung bean modified by brassica crop water extracts and residues
a)SOV b)DF c)SBD d)TSP pH e)EC f)SOM g)TN h)AK i)AP
Treatments (T) 4 0.02* 16.95* 0.32* 0.05* 0.35* 0.04* 7396.51* 10.45*
Years (Y) 1 0.02* 11.76* 0.21 NS 0.02* 0.10* 0.02 NS 293.78 NS 1.44*
T×Y 4 0.01NS 1.20 NS 0.04 NS 0.01NS 0.03* 0.01 NS 61.55 NS 0.55*
Error 18 0.003 1.014 0.110 0.009 0.009 0.002 105.181 0.107
a)SOV= source of variation, b)DF= degree of freedom, c)SBD= soil bulk density, d)TSP= total soil porosity, e)EC= soil electric conductivity, f)SOM= soil organic matter, g)TN= total soil nitrogen, h)AK= available potassium, i)AP= available phosphorus, *= indicate significant at p≤0.05, NS= non-significant
92

Table. 4.32. Effect of brassica water extracts and residues on soil properties and nutrient dynamics in the rhizosphere of mung bean at harvest
Treatments 2014 2015 Mean d)(T) 2014 2015 Mean (T)Soil bulk density (g cm-3) Total soil porosity (%)
a)Control 1.48 1.47 1.47 A 42.82 44.06 43.44 Cb)BWE @ 10 L ha-1 1.47 1.47 1.47 A 43.52 44.10 43.81 CBWE @ 20 L ha-1 1.48 1.47 1.47 A 43.83 44.12 43.97 Cc)BR @ 4 tons ha-1 1.45 1.34 1.41 B 45.40 46.99 46.19 BBR @ 6 tons ha-1 1.42 1.28 1.34 C 45.96 48.51 47.23 AMean e)(Y) 1.46 A 1.40 B 44.30 B 45.56 ALSD (p≤0.05) T=0.06; Y=0.04 T=1.02; Y=0.77
Soil pH Soil EC (dS m-1)Control 7.77 7.74 7.76 A 1.07 1.10 1.09 CBWE @ 10 L ha-1 7.77 7.73 7.75 A 1.09 1.13 1.11 CBWE @ 20 L ha-1 7.77 7.73 7.75 A 1.11 1.14 1.12 CBR @ 4 tons ha-1 7.49 7.46 7.48 B 1.19 1.24 1.21 BBR @ 6 tons ha-1 7.46 7.26 7.36 C 1.29 1.32 1.30 AMean (Y) 7.65 A 7.58 B 1.15 B 1.19 ALSD (p≤0.05) T=0.09; Y=0.06 T=0.05; Y=0.03
Total soil organic matter (%) Total soil nitrogen (g kg-1)Control 0.68 d 0.69 d 0.68 C 0.19 0.20 0.19 CBWE @ 10 L ha-1 0.67 d 0.69 d 0.68 C 0.20 0.20 0.20 CBWE @ 20 L ha-1 0.68 d 0.70 d 0.69 C 0.20 0.20 0.20 CBR @ 4 tons ha-1 0.89 c 1.18 ab 1.03 B 0.28 0.33 0.30 BBR @ 6 tons ha-1 1.04 b 1.26 a 1.15 A 0.30 0.38 0.34 AMean (Y) 0.80 B 0.91 A 0.23 0.26LSD (p≤0.05) T=0.11; Y=0.07; T × Y=0.15 T=0.03
Available potassium (mg kg-1) Available phosphorous (mg kg-1)Control 118.38 121.95 119.59 C 6.72 d 6.75 d 6.73 CBWE @ 10 L ha-1 119.55 120.66 120.66 C 6.75 d 6.76 d 6.76 CBWE @ 20 L ha-1 119.52 121.00 120.76 C 6.77 d 6.78 d 6.77 CBR @ 4 tons ha-1 170.35 181.47 175.95 B 7.93 c 9.09 b 8.51 BBR @ 6 tons ha-1 183.33 198.33 190.85 A 9.09 b 10.12 a 9.60 AMean (Y) 142.22 148.48 7.45 B 7.89 ALSD (p≤0.05) T=12.44 T=0.39; Y=0.25; T × Y=0.56
a)Control= (plots with no crop residues or extract application); b)BWE= brassica water extract; c)BR= brassica residues; d)T= treatments; e)Y= year
93

in control (Table 4.32). A linear increase in soil EC and available K was observed over time
and these parameters (soil EC and available K) had highest values during the 2nd year of
experiment (Table 4.8). In case of soil density and soil pH decreasing trend was observed.
The lowest soil density (1.34 g cm-3) and soil pH (7.36) was observed with the application.of
brassica residues.at 6 tons ha-1 and the highest soil density (1.47 g cm-3) and soil pH (7.76)
was observed in control whiich was stattistically siimilar with brassica water exttract at 10
L/ha and 20 L ha-1 (Table 4.32).
4.3.3.2. Rhizosphere soil microbial population, activity and enzymes
Microbial population, activity and soil enzymes are robust indicators of soil fertility.
Microbial populations and activity at 20 days after sowing and at harvesting, soil enzymatic
activities (alkaline phosphatase and dehydrogenase) differed significantly among various
allelopathic weed management strategies (Table 4.33). The year effect was also significant
for all above parameters (Table 4.33). The interactive effect of allelopathic weed
management strategies and year was significant for fungal population after 20 days of sowing
and at harvesting. Dehydrogenase activity was also significant and was non-significant for
bacterial population and microbial activity after 20 days of sowing and at harvesting (Table
4.33).
Among the all allelopathic weed management strategies highest bacterial (71 cfu/g ×
105 and 35 cfu/g × 105, respectively) and microbial activity (5.09 mg CO2-C kg-1 d-1 and 4.18
mg CO2-C kg-1 d-1, respectively) was recorded with the application of brassica residues at 6
tons ha-1 at both stages i.e. 20 days after sowing and at harvesting. The lowest population and
microbial activity was observed in control whiich was statisttically sitmilar with brtassica
water extracts at 10 and 20 L/ha (Table 4.10). A linear increase in bacterial, fungal
population and microbial activity at 20 days after sowing and at harvesting was observed
over times and the highest bacterial, fungal population and microbial activity was observed
during second year (Table 4.34). In case of soil enzymes effect of allelopathic weed
management strategies resulted significant effect on activity of both alkaline phosphatase and
dehydrogenase enzyme. The highest value of alkaline phosphatase (180.96 µg NP g-1 soil h-1)
and dehydrogenase (35.00 µg TPF g-1 soil h-1) was observed with the application of brassica
residues at 6 tons ha-1. The lowest value of alkaline phosphatase (134.78 µg NP g-1 soil h-1)
94
Table. 4.33. Mean square of microbial population, microbial activity and soil enzymatic activity in the rhizosphere of mung bean affected by brassica crop water extracts and residues
a)SOV b)DF c)B (20 d)DAS) B (e)AH) f)F (20 DAS) F (AH) g)MA (20 DAS) MA (AH) h)AP i)DG
Treatments (T) 4 965.97* 289.92* 66.87* 216.03* 2.67* 1.53* 2648.14* 137.62*
Years (Y) 1 154.13* 19.20* 61.63* 79.02* 0.25* 0.14* 69.98* 43.20*
T×Y 4 31.13NS 5.28NS 9.63* 12.26* 0.01NS 0.004NS 33.93NS 4.78*
Error 18 55.726 29.189 1.4704 4.642 0.45 0.27 28.831 2.400
a)SOV= source of variation, b)DF= degree of freedom, c)B= Bacteria, d)DAS= days after sowing, e)AH= after harvesting, h)AP= alkaline phosphatase, i)DG= dehydrogenase, *= indicate significant at p≤0.05, NS= non-significant
95
Table. 4.34. Effect of brassica water extracts and residues on microbial population, microbial activity and soil enzymatic activity in the rhizosphere of mung bean
Treatments 2014 2015 Mean d)(T) 2014 2015 Mean (T)Bacteria (cfu/g x 105) 20 f)DAS Fungi (cfu/g x 104) 20 DAS
a)Control 42 43 43 C 7 d 8 d 7 Cb)BWE @ 10 L ha-1 42 44 43 C 7 d 8 d 8 CBWE @ 20 L ha-1 44 45 45 C 8 d 9 cd 8 Cc)BR @ 4 tons ha-1 55 65 60 B 11 c 15 b 13 BBR @ 6 tons ha-1 67 78 71 A 16 b 20 a 18 AMean e)(Y) 50 B 55 A 10 B 12 ALSD (p≤0.05) T=9.05; Y=3.95 T=1.88; Y=1.19; T × Y=2.65
Bacteria (cfu/g x 105) g)AH Fungi (cfu/g x 104) AHControl 19 20 20 C 5 e 6 de 5 DBWE @ 10 L ha-1 21 21 21 C 6 de 6 de 6 CDBWE @ 20 L ha-1 21 21 21 C 6 de 8 de 7 CBR @ 4 tons ha-1 30 32 31 B 8 d 13 b 10 BBR @ 6 tons ha-1 33 37 35 A 10 c 16 a 13 AMean (Y) 25 B 27 A 7 B 10 ALSD (p≤0.05) T=3.21; Y=1.65 T=1.47; Y=0.93; T × Y=2.08
Microbial activity (mg CO2-C kg-1 d-1) 20 DAS Microbial activity (mg CO2-C kg-1 d-1) AHControl 3.58 3.70 3.64 C 2.97 3.12 3.04 CBWE @ 10 L ha-1 3.61 3.75 3.68 C 3.07 3.15 3.11 CBWE @ 20 L ha-1 3.65 3.78 3.72 C 3.09 3.18 3.14 CBR @ 4 tons ha-1 4.48 4.75 4.62 B 3.69 3.85 3.77 BBR @ 6 tons ha-1 4.96 5.22 5.09 A 4.08 4.28 4.18 AMean (Y) 4.06 B 4.24 A 3.38 B 3.51 A
LSD. (p≤0.05) T=0.45; Y=0.15 T=0.31; Y=0.11Alkaline phosphatase (μg NP/g soil/h) Dehydrogenase (μg TPF/g soil/h)
Control 134.77 134.80 134.78 C 20.65 d 22.35 d 21.51 CBWE @ 10 L ha-1 134.82 134.91 134.86 C 22.16 d 22.67 d 22.42 CBWE @ 20 L ha-1 135.12 135.18 135.15 C 22.86 d 23.25 d 22.56 CBR @ 4 tons ha-1 159.22 163.35 161.28 B 27.33 c 33.35 b 30.33 BBR @ 6 tons ha-1 175.48 186.44 180.96 A 33.67 b 38.33 a 35.00 AMean (Y) 147.88 B 150.94 A 24.74 B 27.99 ALSD (p≤0.05) T=6.51; Y=2.99 T=2.61; Y=1.65; T × Y=3.69
a)Control= (plots with no crop residues or extract application); b)BWE= brassica water extract; c)BR= brassica residues; d)T= treatments; e)Y= year; f)DAS= days after sowing; g)AH= after harvesting
and dehydrogenase (21.51 µg TPF g-1 soil h-1) was recorded in control (Table 4.34).
Interactive effect allelopathic weed management strategies and year resulted significant
96

effect on fungal population at both time after 20 days of sowing and at harvesting. The
highest fungal population (20 cfu/g × 104 and 16 cfu/g × 104, respectively) was recorded at
both time after 20 days of sowing and at harvesting with the application of brassica residues
at 6 tons ha-1 during 2nd year. The minimum fungal population (8 cfu/g × 104 and 6 cfu/g ×
104, respectively) was recorded at both time after 20 days of sowing and at harvesting with
control.
4.3.4. Economics and margiinal analysis
Economics and marrginal analysses were perrformed to compaere the net and
maerginal reeturns and domiinance of indiividual treatment. Among all treatments brassica
residue at 6 tons ha-1 gave maximum economical returns (347 $) during both years. While,
minimum net benefit was obtained from control.
In case of marginal analysis (Table 4.36), application of brassica residue at 6 tons ha -1
had maximum MRR (372 $). However, rest of treatments was dominated due to less benefit
and higher cost that vary and these were uneconomical treatments. So, brassica residue at 6
tons ha-1 may be the choice to get better economic returns.
97

Table. 4.35. Economics of mung bean grown in various allelopathic weed management strategies during 2014 and 2015
Treatments Yield (kg ha-1)
Adjusted yield (kg ha-1)
Gross income e)$ ha-1
Total cost$ ha-1
Net benefits$ ha-1 Benefit cost ratio
a)Control 759 683 765 615 150 0.24
b)BWE @ 10 L ha-1 791 712 797 624 173 0.28
BWE @ 20 L ha-1 847 762 854 625 228 0.36
c)BR @ 4 tons ha-1 924 832 931 653 278 0.43
BR @ 6 tons ha-1 1007 906 1015 668 347 0.52
Remarks $ 44.67/40 kg
a)Control= (plots with no crop residues or extract application); b)BWE= brassica water extract; c)BR= brassica residues; d)PKR= Pakistani rupees; e)$= US dollar
Table. 4.36. Marginal analysis for two years (2014-2015)
Treatments
f)Cost that vary
($ ha-1)
Net benefits
($ ha-1)
g)Marginal cost
($ ha-1)
h)Marginal net benefits
($ ha-1)
Marginal rate of returns
(%)
a)Control 0 150 - - -b)BWE @ 10 L ha-1 9 173 9 24 274
BWE @ 20 L ha-1 10 228 10 79 i)Dc)BR @ 4 tons ha-1 38 278 38 129 339
BR @ 6 tons ha-1 53 347 53 197 372
Remarksa)Control= (plots with no crop residues or extract application); b)BWE= brassica water extract; c)BR= brassica residues; d)PKR= Pakistani rupees; e)$= US dollar;
98

4.3.5. Discussion
Residues incorporation of allelopathic crops is an alternative and cost effective
method to reduce weed pressure in field crops and it also act as a green approach for
improving soil health. Our study showed a significant improvement in soil health and weeds
suppression potential of brassica residues incorporation and water extract. This approach had
significant reduction in weed number and weight of weed species in mung bean (Table 4.26)
owing to presence of isothiocyanates, isothayanates, isoprenoid and benzenoid with wide
spectrum of biological activities including allelopathy (Petersen et al., 2001; Cheema et al.,
2007). Brassicaceae family produces glucosinolates (GSLs) that are not biologically active.
When the plant tissue is disrupted, the GSLs are hydrolysed to a number of products. The
main breakdown products are Isothiocianates (ITCs) which are phytotoxic (Petersen et al.,
2001). Herebicidal actievity of 5 liquids iso-thiocyanates (ITCcs) (beinzoyl, ootolyl, motolyl,
tertooctyl, and 3-fluoorophenyl) on purrple and yeellow nut-sedge was evaleuated and it was
founds that all ITCcs were more eeffective in supprressing purrple nut-sedge than
yeellow nutseedge (Norsworthy et al., 2006). The rape-seed (Brrassica compeestris L.)
shoots extract and tur-nip (Brrassica compeestris L.) roots extract exhiibited inhibiition of
seeds germiination of cut leafs grounde cheerry (Physaliis angulate L.) by 58.7o% and 54.3o
%, r-espectively (Arslan et al., 2005). Liignans from Brassiica frutiiculosa showed strrong
inhiibition of germiination of Lacttuca satiiva (Cutillo et al., 2003). Narrwal et al. (2002)
statted that some a-ccessions of Brrassica junrcea and Brassirca nigrra caused siginificant
reductiion 75 to 82% at 75 DAG and 75-98% at harvest (120 D) in the densiity of winter
weed. Incorporation of rape-seed resiidues in soil priorr to sowiing of cotton reduceed
germiination of Amaranthus spp. while cotton germiination remaiined unaffeected; this was
prrobably due to releeasing of some grrowth inhiibitor subistance from decompeosed rape-
seed (Youniesabadi, 2005).
Our results indicate that increased quantities of crop residues have decreased bulk
density and increase total porosity of soil over time (Table 4.32). Shaver (2010) reported that
soil porosity is directly related to soil bulk density because as soil bulk density decreases, soil
porosity increases. In case of soil properties brassica residues as allelopathic weed
management strategy improved the SOM, N, available K and P in soil (Table 4.32). Crop
residues incorporation enhanced soil quality and improved the nutrient status of soil (Sidhu
99

and Beri, 2005). Moisture retention is the main benefit of residues incorporation. It is caused
by decrease in runoff and evaporation of water from soil (Verhulst et al., 2011). Improved
moisture availability due to residue incorporation also indicated that the soil water holding
capacity was improved and the soil moisture was available for longer times to support plant
growth (Jin et al., 2013). This increase in moisture retention properties might decrease the
irrigational requirement of the crops, which should be investigated in future studies. The
improvement in nutrient accumulation (especially P and K) might be attributed to the fact the
enhanced moisture retention within the soil due to residue incorporation increased the
solubility of these nutrients within the soil (Zhou et al., 2002). Crop residue amendment also
increases N availability in soil and can reduce the fertilizers usage in soil (Beres and
Kazinczi, 2000). Sharma et al. (2000) also reported that by the addition of crop residues a
significant improvement in soil nitrogen and phosphorus was done. In our study a linear
decrease in the soil pH was observed by the application of brassica residues as allelopathic
weed management strategies (Table 4.32). Gong et al. (2008) reported that oil crop residue
incorporation in soil decreases the soil pH. The Parthenium hysterophorus residues in soil
also changed the chemistry of soil. It revealed that pH of P. hysterophorus infested soil
decreased, whereas the EC of soil increased (Batish et al., 2002a; Batish et al., 2002b).
In case of microbial population and enzymatic activities of soil by using brassica
residues as allelopathic weed management strategies in mung bean the results showed
significant improvement (Table 4.34). Microbial abundance and soil enzymes are soil
biological activities which are one of the important indicators of soil quality (Dick, 1994).
The residues incorporation of different crops in soil modified the bio-chemical attributes i.e.
soil microbial population and soil enzymatic activity (Doran, 1980; Dick et al., 1983). Soil
enzymes are used as important indicators for nutrient cycling processes and soil fertility
status, particularly in long term farming systems (organic and conventional) (Bohme et al.,
2005). Dehydrogenase enzyme is an important for the oxidation of soil organic matter
(SOM). It transfers the hydrogen and electrons from substrates to acceptors. The activity of
soil enzymes viz. dehydrogenase and phosphatase depends on type of residues incorporated
in soil. It also depends on the moisture contents and temperature of soil. It affects the activity
of dehydrogenase by changing the oxidation reduction status of soil (Brzezinska et al., 1998).
Incorporation of tobacco crop residues.in soil increased the activity of amylase and
100

phosphodiesterase. At Akola, Maharashtra, Ravankar et al. (2000) reported that incubation of
soil with 1% organic residues of cotton stalk, safflower straw, sorghum stubble, soybean
stover, wheat straw, sugar cane trash, ground nut husk, sunflower straw, green gram stover,
parthenium with seed, grass complex with seed, and Xanthium with seed mixed showed wide
variation in the rate of decomposition, C:N ratio and microbial population at different
intervals. Fungal, bacterial, and actinomycetes populations increased at 30 days of
incubation. Bacteria were predominant over fungi and actinomycetes.
Various allelopathic weed management strategies used in this work had significant
impact on crop yield. This increase in crop yield might be done due to reduction in weed
competition during critical crop growth period and the improvement of soil health. The
effective reduction in weeds also increases the obtainability of resources such as light,
moisture, nutrients and space (Kruidhof et al., 2008). A recent research on wheat residues
application in Mediterranean environment by Stagnari et al. (2014) resulted that soil moisture
conservation ability was improved especially during critical growth period of test crop. The
residues which are decomposed completely in soil provide allelochemicals but also
contribute in crop nutrition. It provides nitrogen through release in the rhizosphere of tested
crop plant. By the application of residues as a biological weed management it immobilizes
the nitrogen which may reduce the availability of nitrogen (Khaliq et al., 2015). But, at later
stages of crop growth the obtainability of nitrogen was improved through mineralization, so
this prolonged supply of nitrogen is a big source of nutrition for test crop as well as next
crops.
So, brassica residues incorporation improve in soil properties viz. moisture retention,
restoring physical properties, enhance nutrient cycling, microbial activity (Alam et al., 2014;
Adugna and Abegaz, 2016; Nawaz et al., 2016) and suppression in weeds due to physical
hindrance by residues, reduced light penetration and suppressing ability of allelochemicals
which released from these plant residues (Kamara et al., 2000; Khaliq et al., 2014) harvested
better seed yield and achieve higher profitability in spring planted mung bean.
4.3.6. Conclusion
Various allelopathic weed management strategies used in this work had significant
impact on weed, crop yield and soil properties. Allelopathic crop residues are magical source
of nutrition and have efficient role in controlling weeds which is essential for sustainable
101
crop production. A high suppression of weed density, fresh and dry weight was observed
when brassica residues @ 6 tons ha-1 were incorporated into soil. Apparently, the residues
favorably affected the soil properties viz. nutrient dynamics, microbial populations, soil
enzyme activities. The improvement in soil properties and suppression in weeds harvested
better seed yield and achieve higher profitability in spring planted mung bean. This method
may provide a possible.alternative.for.achieving.sustainable.weed.management in spring
planted mung bean with substantial improvement in soil properties.
102

4.4. Experiment-IV: Isolation of allelochemical resistant strains of bacteria
and determination of their active role in rhizosphereFirst the isolation and purification of bacterial strains from mung bean rhizosphere
soil which is amended with allelopathic crops (sorghum, sunflower and brassica) water
extracts and residues was done. Second the resistance of bacterial against synthetic
allelochemicals and allelopathic crops water extracts was checked. Third the biochemical
characterization (colony morphology and cellulase activity), bioassays for plant growth
promoting traits (zinc, phosphate solubilizing and nitrogen fixation activity) were observed.
Fourth tests of seed germination and seedling growth were done.
Results are presented and discussed below:
Results:
4.4.1. Isolation and purification of culturable bacterial strains
Culturable bacterial strains were obtained both from rhizospheric soil samples at 20 DAS as
well as at harvesting of mung bean crop which was amended with allelopathic crops
(sorghum, sunflower and brassica) water extracts and residues. Eleven bacteria were obtained
from rhizosphere soil samples at 20 DAS while fifteen bacteria from rhizosphere soil
samples at harvesting (Table 4.37). From fifth dilution (10-5) of the rhizosphere soil solution
the colonies were selected on the basis of morphology and isolates were sub-cultured on half-
strength R2A agar. The single selected colonies were transferred to small polystyrene petri-
dishes and checked for their purity. After three time colony purification on half-strength R2A
twenty six strains of bacteria with relatively high growth in the medium were isolated and
preserved by pouring 400 µL glycerol and 600 µL half-strength R2A cultures in 1 mL
Eppendorf at -40oC (Table 4.37).
4.4.2. Test of bacterial resistance against synthetic allelochemicals and allelopathic
crops water extracts
For test resistance of bacterial strains against synthetic allelochemicals (p-coumaric,
ferulic and syringic acid) and allelopathic crops (sorghum, sunflower and brassica) water
extracts, the disc diffusion method was used. The zone of inhibition was observed and the
resistance and sensitivity of isolated bacteria towards synthetic allelochemicals and
allelopathic crops water extracts used was determined. It was found that all isolates were
found to be resistant to p-coumaric, ferulic and syringic acid and brassica water extracts
103

Table. 4.37. Test the resistance of bacterial isolates from mung bean rhizosphere against synthetic allelochemicals and allelopathic crop water extracts
Strains ID Source of isolation p-cumaric Ferulic acid Syringic acid a)SWE b)SFWE c)BWEC-14HM Rhizosphere ++ ++ ++ ++ ++ ++C-17HM Rhizosphere ++ ++ ++ ++ ++ ++10-5HM Rhizosphere + + + + + +9-2M Rhizosphere + + + + + +14-5HM Rhizosphere + + + + + +15-15M Rhizosphere + + + + + +10-10M Rhizosphere ++ ++ ++ ++ ++ ++15-13M Rhizosphere + + + + + +4-3M Rhizosphere + + + + + +10-17M Rhizosphere + + + - + +4-21M Rhizosphere + + + + - +10-9M Rhizosphere + + + + + +4-1HM Rhizosphere + + + + + +5-18HM Rhizosphere + + + + + +14-8HM Rhizosphere + + + + + +9-1HM Rhizosphere + + + + + +4-6HM Rhizosphere + + + + + +4-17HM Rhizosphere ++ ++ ++ ++ ++ ++15-12HM Rhizosphere + + + - - +10-11HM Rhizosphere + + + + + +10-9HM Rhizosphere + + + + + +15-21HM Rhizosphere + + + + + +15-23M Rhizosphere + + + + + +15-18M Rhizosphere + + + - - +15-15HM Rhizosphere + + + + + +9-17M Rhizosphere + + + - + +10-5HM Rhizosphere + + + + + +14-17HM Rhizosphere + + + + + +9-2HM Rhizosphere + + + + + +
a)SWE= sorghum water extract, b)SFWE= sunflower water extract, c)BWE= brassica water extract, (++) = stand for highest resistant, (+) = stand for resistant, (-) = stand for susceptible
104

105

(Table 4.37). Bacterial isolates viz. 4-17HM, C-14HM, C-17HM and 10-10M were showed
highest resistant to all synthetic allelochemicals and allelopathic crops water extracts while
10-17M, 9-17M, 15-12HM and 15-18M were showed little bit sensitivity to sorghum water
extract and 4-21M, 15-12HM and 15-18M were showed little bit sensitivity to sunflower
water extract (Table 4.37).
4.4.3. Biochemical characterization
Colony morphology: The bacteria showed white, off white, milky white, yellow, dark
yellow and green colonies with variable sizes (small, medium and large) and shapes (round,
irregular, waxy) on half strength R2A agar plates (Table 4.38).
Cellulase activity: To check the cellulase activity an aliquot of 100 µL of each bacterial
isolate was spot inoculated on agar plates containing CMC (10 g L -1), K2HPO4 (1 g L-1),
KH2PO4 (1 g L-1), MgSO4 7H2O (0.2 g L-1), NH4NO3 (1 g L-1), FeCl3 6H2O (0.05 g L-1), CaCl2
(0.02 g L-1), and agar (20 g L-1). The plates were incubated at 28oC for 96 hrs. After
incubation each plate was flooded with 0.1% Congo red for 15 to 20 minutes and then 2-3
time washed with NaCl (1 M). A clear zone was observed around colonies which showed
cellulase activity (Table 4.3). It was found that the bacterial strains viz. 10-5HM, 15-15M, 4-
21M, 14-8HM, 10-5HM, 10-9HM, 14-17HM showed cellulase activity but the bacterial
strains viz. 10-17M, 4-17HM and 15-18HM showed highest cellulase activity. While the
bacterial strains viz. C-14HM, C-17HM, 9-2M, 14-5HM, 10-10M, 15-13M, 4-3M, 10-9M, 4-
1HM, 5-18 HM, 9-1HM, 4-6HM, 4-7HM, 10-11HM, 15-21HM, 9-17M, 9-2M, 15-23M and
15-12HM showed no hollow zone (Table 4.40).
4.4.4. Bioassays for plant growth promoting traits
Following bioassays for plant growth promoting traits were studied during the
experimentation:
Zinc solubilizing activity: For zinc (Zn) solubilizing activity 100 µL of each bacterial
isolate was inoculated on agar pates consist of glucose (10 g L-1); (NH4)2SO4 (0.5 g L-1); KCl
(0.2 g L-1); MgSO4 7H2O (0.1 g L-1); trace of MnSO4 and FeSO4, yeast extract (0.5 g L-1); and
agar (15 g L-1)
106

Table. 4.38. Morphological characteristics of allelochemical resistant bacterial isolates from mung bean rhizosphere
Strains ID Source of isolation Colony size Colony shape Colony colourC-14HM Rhizosphere Large Round Off whiteC-17HM Rhizosphere Small Round White10-5HM Rhizosphere Large Round Dark yellow9-2M Rhizosphere Medium Irregular Off white14-5HM Rhizosphere Small Wavy Yellow15-15M Rhizosphere Large Round Off white10-10M Rhizosphere Medium Round White15-13M Rhizosphere Medium Round Milky white4-3M Rhizosphere Small Wavy Off white10-17M Rhizosphere Large Irregular White4-21M Rhizosphere Small Round Off white10-9M Rhizosphere Small Irregular Off white4-1HM Rhizosphere Medium Wavy White5-18HM Rhizosphere Medium Round White14-8HM Rhizosphere Small Irregular Milky white9-1HM Rhizosphere Medium Wavy Yellow4-6HM Rhizosphere Medium Irregular Off white4-17HM Rhizosphere Large Round Yellow15-12HM Rhizosphere Medium Round Green10-11HM Rhizosphere Small Round Yellow10-9HM Rhizosphere Large Wavy White15-21HM Rhizosphere Large Irregular Off white15-23M Rhizosphere Small Round Off white15-18M Rhizosphere Medium Round Off white15-15HM Rhizosphere Medium Round White9-17M Rhizosphere Small Irregular Milky white10-5HM Rhizosphere Medium Round White14-17HM Rhizosphere Medium Irregular Off white9-2HM Rhizosphere Small Round Yellow
Table. 4.39. Assessment of zinc activity of allelochemical resistant bacterial isolates from mung bean rhizosphere Strains ID Source of isolation a)ZnO b)ZnCo3
107
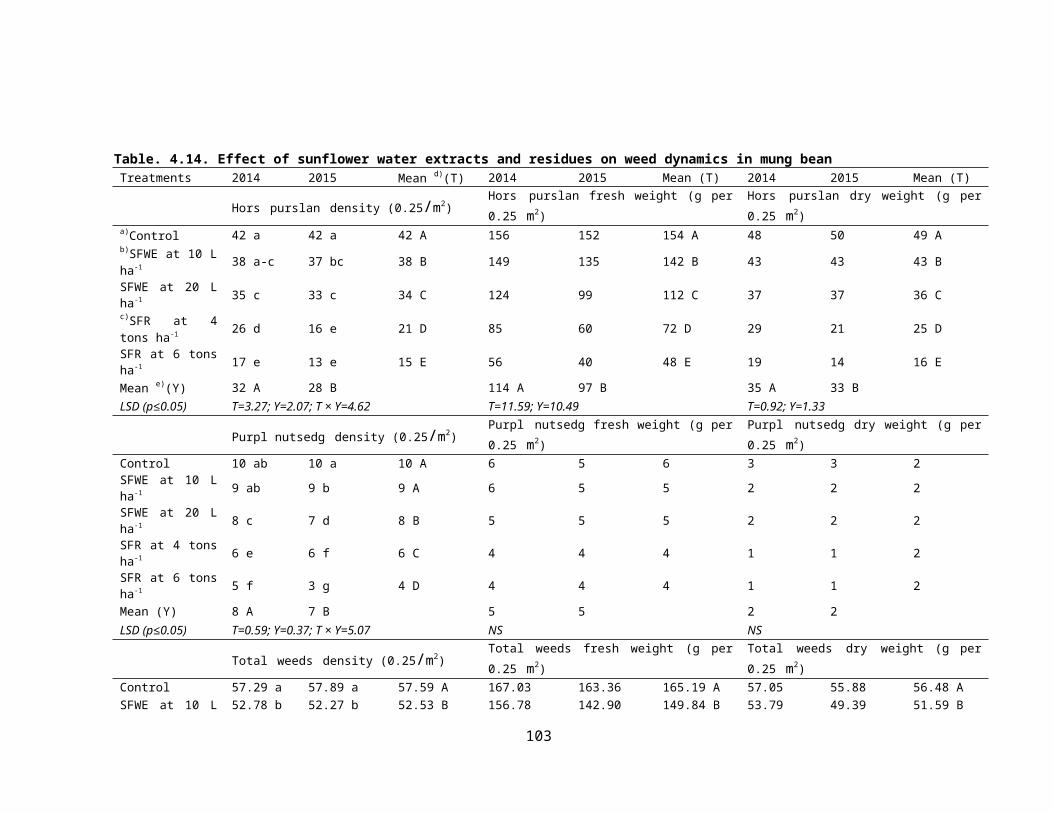
C-14HM Rhizosphere ++ -C-17HM Rhizosphere ++ ++10-5HM Rhizosphere + -9-2M Rhizosphere + -14-5HM Rhizosphere + -15-15M Rhizosphere + -15-13M Rhizosphere + -4-3M Rhizosphere + -10-17M Rhizosphere - -4-21M Rhizosphere + +10-9M Rhizosphere + +4-1HM Rhizosphere + +5-18HM Rhizosphere ++ -14-8HM Rhizosphere + -9-1HM Rhizosphere + +4-17HM Rhizosphere ++ ++15-12HM Rhizosphere + -10-11HM Rhizosphere + +10-9HM Rhizosphere - -10-10M Rhizosphere + +15-21HM Rhizosphere + -15-23M Rhizosphere + -15-18M Rhizosphere + -15-15HM Rhizosphere + +9-17M Rhizosphere + +4-6HM Rhizosphere - -10-5HM Rhizosphere - -14-17HM Rhizosphere - -9-2HM Rhizosphere + -
a)Zno= Zinc oxide, b)ZnCo3= Zinc carbonate, (++) = show highest zinc activity, (+) = show zinc activity, (-) = no zinc activity
supplemented with 0.1% Zn (oxide and carbonate). A holo zone was observed when plates
were incubated (28 ± 2oC) for 7-10 days (Table 4.39). In case of zinc oxide, it was found that
the bacterial strains viz. 10-5HM, 9-2M, 14-5HM, 15-15M, 15-13M, 4-3M, 4-21M, 10-9M,
4-1HM, 14-8HM, 9-1HM,15-12HM, 10-11HM, 10-10M, 15-21HM, 15-23M, 15-18M, 15-
108

15HM and 9-17M showed zinc solubilizing activity but the bacterial strains viz. C-14HM, C-
17HM, 4-17HM and 15-18HM showed highest zinc solubilizing activity. While the bacterial
strains viz. 10-17M, 10-9HM, and 4-6HM showed no clear zone. When the source was zinc
carbonate, it was found that the bacterial strains viz. 4-21M, 10-9M, 4-1HM, 9-1HM, 10-
11HM, 10-10M and 9-17M showed zinc solubilizing activity but the bacterial strains viz. C-
17HM, 15-15HM and 4-17HM showed highest zinc solubilizing activity. While the bacterial
strains viz. C-14HM, 10-2HM, 9-2M, 14-2HM, 12-12M, 4-2M, 10-17M, 2-12HM, 14-2HM,
12-21HM, 12-22M, 15-18M, 4-6HM, 10-5HM, 14-17HM and 9-2HM showed no halo zone
(Table 4.39).
Phosphate solubilizing activity: Each bacterial culture (100 µL) was spot inoculated in the
center of agar plates containing tricalcium phosphate (Ca3 (PO4)2) as insoluble phosphate
source with the following ingredients: (g L-1) glucose (10), (NH4)2SO4 (0.5), NaCl (30), KCl
(0.3), FeSO4 7H2O (0.03), MnSO4 4H2O (0.03), MgSO4 7H2O (0.3), Ca3 (PO4)2 (10), and agar
(20), H2O (1000 mL), pH (7.0-7.5). Formation of halo zone around colonies after incubation
at 28 ± 2oC for 7-10 days was a sign of phosphate solubilizing activity (Table 4.40). It was
found that the bacterial strains viz. C-14HM, 10-5HM, 14-5HM, 10-10M, 4-21M, 5-18HM,
4-6HM, 10-9HM and 15-18HM showed zinc solubilizing activity but the bacterial strains viz.
C-17HM and 4-17HM showed highest zinc solubilizing activity. While the bacterial strains
viz. 10-5HM, 15-15M, 15-13M, 4-3M, 10-17M, 10-9M, 4-1HM 14-8HM, 9-1HM, 10-5HM,
14-17HM, 4-7HM, 10-11HM, 15-21HM, 9-17M, 9-2M, 15-23M and 15-12HM showed no
halo zone (Table 4.40).
Nitrogen fixation activity: 100 µL of each pure bacterial culture was inoculated into NFA
(Nitrogen Free Agar) plates. The plates were incubated at 28 ± 2oC for 7-10 days and
observed for the formation of halo zone around the colonies (Table 4.40). It was found that
the bacterial strains viz. C-14HM, 14-5HM 10-10M, 15-13M, 4-3M, 10-17M,10-9M, 4-
1HM, 4-6HM, 14-17HM and 4-
Table. 4.40. Assessment of cellulase enzyme, nitrogen fixation and phosphate solubilization activity of allelochemical resistant bacterial isolates from mung bean rhizosphere
Strains ID Source of isolation Cellulase enzyme activity
Nitrogen fixation activity
Phosphorus solubilization activity
C-14HM Rhizosphere - + +C-17HM Rhizosphere - ++ ++10-5HM Rhizosphere + - +
109

9-2M Rhizosphere - - -14-5HM Rhizosphere - + +15-15M Rhizosphere + - -10-10M Rhizosphere - + +15-13M Rhizosphere - + -4-3M Rhizosphere - + -10-17M Rhizosphere ++ + -4-21M Rhizosphere + - +10-9M Rhizosphere - + -4-1HM Rhizosphere - + -5-18HM Rhizosphere - - +14-8HM Rhizosphere + - -9-1HM Rhizosphere - - -4-6HM Rhizosphere - + +4-17HM Rhizosphere ++ ++ ++10-5HM Rhizosphere + - -10-9HM Rhizosphere + - +14-17HM Rhizosphere + + -15-18HM Rhizosphere ++ - +4-7HM Rhizosphere - + -10-11HM Rhizosphere - - -15-21HM Rhizosphere - - -9-17M Rhizosphere - - -9-2M Rhizosphere - - -15-23M Rhizosphere - - -15-12HM Rhizosphere - - -
(++) = show highest activity, (+) = show activity, (-) = no activity
110

111

7HM showed zinc solubilizing activity but the bacterial strains viz. C-17HM and 4-17HM
showed highest zinc solubilizing activity. While the bacterial strains viz. 10-5HM, 9-2M, 15-
15M, 4-21M, 5-18HM, 14-8HM, 9-1HM, 10-5HM, 14-17HM, 10-9HM, 15-18HM, 10-
11HM, 15-21HM, 9-17M,9-2M, 15-23M and 15-12HM showed no halo zone (Table 4.40).
4.4.5. Discussion
Allelopathy is a biological phenomenon in which an organism releases one or more
bio-chemicals that influences the other organisms. These biochemical are recognized as
allelochemicals and can have positive or negative effects on the target organisms (Ferguson
and Rathinasabapathi, 2003). These chemicals are released into environment by plant organs
through volatiles, leachates, root exudates, and residues decomposit (Cecile et al., 2003). The
performance of interacting plant species can be affected by the.release.of allelo-chemicals in
the.rhizosphere soil by plants (Inderjet, 2005). Plant allelochemicals can act as selective
agents to drive an adaptation in associated plant species to cope with organic compounds
released by their ‘‘chemical neighbor’’ (Vivanco et al., 2004). In this situation, microbial
community can affect interaction between plants and plant allelochemicals as soil microbes
may degrade the allelochemicals after entering the soil (Kaur et al., 2009). Soil
microorganisms consume organic molecules and therefore chemicals may not accumulate to
phytotoxic levels (Inderjet, 2005). In this contest we isolate twenty six bacterial strains from
the rhizosphere of mung bean which was amended with allelopathic crops (sorghum,
sunflower and brassica) water extracts and residues. We check the resistance of bacterial
strains against three synthetic allelochemicals (p-coumaric, ferulic and syringic acid) and
three allelopathic crops (sorghum, sunflower and brassica) water extracts by disk diffusion
method (Table. 4.3). We observed that most of them were resistant against synthetic
allelochemicals and allelopathic crop water extracts. Our results were correlated with De
Gelder (2006). He said that microorganism adapt to change environmental condition by
horizontal gene transfer which provides them with new traits (pesticides/antibiotics/chemical
resistance) so they can survive and colonize their new environments.
The rhizosphere is a unique ecological niche that shapes microbial community
structure through the interactions of plant species, root exudates, soil properties, and many
other factors (Mendes et al., 2013). Organic acids released from the roots of plants can
support highest microbial biomass and metabolic activity. Due to this reason more active and
112

distinct microbes are present in rhizosphere soil as compared to bulk soil. Interactions
between plants and microbes in rhizosphere soil control important bio-geochemical
processes, such as nutrient cycling and greenhouse gas emissions. The bacterial strains have
beneficial effect on maintenance of satisfactory level of nutrients especially phosphorus
(Saravanan et al., 2007). In our study, four bacterial isolates were found efficient solubilizer
of phosphate (Table 4.3). The ability of bacterial strains to solubilize insoluble phosphorus
and convert it to plant available form is an important characteristic under conditions where
phosphorus is a limiting factor. Phosphate solubilizing strains can increase the availability of
phosphorus to plant by mineralizing organic phosphorus compounds and by converting
inorganic phosphorus into more available form. Phosphate solubilization is mainly due to the
production of microbial metabolites including organic acids which decreases the pH of the
culture media (Shahid et al., 2012). The presence of phosphate solubilizing microbes in soils
might be considered a positive indicator of using these microbes as bio-fertilizers for crop
production and beneficial for soil sustainability. The results of nitrogen fixation by NFA
method indicated that fairly large population of mung bean associated nitrogen fixers are
present in the soils and can be beneficial to improve nitrogen nutrition of mung bean and
other crops.
4.4.6. Conclusion
To sum up, this study identified novel bacterial strains 4-17HM, C-14HM, C-17HM
and 10-10M isolated from rhizosphere soil of mung bean which were amended by
allelopathic crop water extracts and residues, showed the highest resistance against synthetic
allelochemicals and allelopathic crop water extracts and the maximum nitrogen fixing, zinc
and phosphate solubilization activity. Due to their resistance and active role in the
rhizosphere, as nitrogen fixing, zinc and phosphate solubilization they could be applied with
the allelopathic crop water extracts and residues to soil functional and healthy.
113

Chapter-V
SUMMERY
The present research work was.conduccted to evaluaete the effect of allel-opathic
crops (sorrghum, sunflowerr and brrassica) on weeds, productivity and rhizosphere of mung
bean during 2014 and 2015. Laboratory trials were conducted in Plant and Microbial Ecology
Lab, Department of Agronomy, University of Agriculture, Faisalabad. Three sets of field
experiments were conducted and repeated at Student Research Farm, Department of
Agronomy, University of Agriculture, Faisalabad, during 2014 and 2015. In all field
experiments, crop water extracts (10 and 20 L ha-1) were foliar applied at 15 DAS and
residues incorporation (4 and 6 tons ha-1) was done before sowing. All other features were
kept same. Salient results of the studies are summarized below.
5.1. Experiment-I: Effect of sorghum crop water extracts and residues on
weeds, productivity and rhizosphere of mung bean (Vigna radiata L.) Weed data including weed density fresh and dry weight significantly suppressed by
the application of sorghum water extracts (10 and 20 L ha-1) and residues incorporation
(4 and 6 tons ha-1) in mung bean as compared with control.
Foliar application of sorghum water extracts (10 and 20 L ha-1) and residue
incorporation (4 and 6 tons ha-1) significantly influenced different morphological,
yield related traits, seed yield of mung bean as compared with control.
At mung bean harvested the soiil physiical, chemical and biological propertiies were
significantly improved by the application of sorghum residues (4 and 6 tons ha-1) as
compared with control but in case of sorghum water extracts (10 and 20 L ha -1) there
was no significant effect as compared with control.
Among all the treatments sorghum residues incorporation at 6 tons ha-1 showed the
highest suppression of weed density, fresh and dry weight (62, 67, 65%, respectively)
during both study years.
In case of soil properties significant improvement was observed by the application of
sorghum crop residues at 6 tons ha-1 as compared with control during both study
years.
114

Maximum mung bean seed yield was improved (37%) by the application of sorrghum
crop reesidues at 6 tons ha-1 as comparred with contrrol durring both study years.
Sorghum residues incorporation at 6 tons ha-1 had higher net benefits (306 $ ha-1)
followed by 4 tons ha-1 during both years (2014 and 2015). While MRR was
maximum in the appliication of sorrghum residues at 6 tons/ha during both the years as
compared with marginal rate of return of control.
5.2. Experiment-II: Effect of sunflower crop water extracts and residues on
weeds, productivity and rhiizosphere of mung bean (Vigna radiata L.) In this experiment weed data including weed density fresh and dry weight
significantly suppressed by the application of sunflower water extracts (10 and 20 L
ha-1) and residues incorporation (4 and 6 tons ha-1) in mung bean as compared with
control.
Morphological, yield related traits and seed yield of mung bean were significantly
affected by the foliiar appliication of sunflowerr waterr extrracts at 10 and 20 L/ha and
also by the incorporation of sunflower residues at 4 and 6 tons ha -1 as compared with
control.
Soil properties like physical, chemical and biological at the harvesting of mung bean
were significantly promoted by the application of sunflower residues at 4 and 6 tons
ha-1 as compared with control which was statistically at par sunflower water extracts
at 10 and 20 L ha-1.
Among all the treatments sunflower residues incorporation at 6 tons ha-1 showed the
highest suppression of weed density, fresh and dry weight (57, 66, 61%, respectively)
during both study years.
In case of soil properties significant improvement was observed by the application of
sunflower crop residues at 6 tons ha-1 as compared with control during both study
years.
Maximum mung bean seed yield was improved (36%) by the application of sunflower
crop residues at 6 tons ha-1 ass comparred wiith contrrol durring botth study years.
Among all applied treatments sunflower residues incorporation at 6 tons ha -1 gave
higher net benefits (339 $ ha-1) .during both years. .In case of marrginal analysiis
115

sunflower residues incorporation at 6 tons ha-1 gave maximum MRR (Rs.
327723.53%) during both study years.
5.3. Experiment-III: Effect of brassica crop water extracts and residues on
weeds, productivity and rhizosphere of mung bean (Vigna radiata L.) Weed data including weed density fresh and dry weight significantly suppressed by
the application of brassica water extracts (10 and 20 L ha -1) and residues
incorporation (4 and 6 tons ha-1) in mung bean as compared with control.
Foliar.application.of brassica water extracts (10 and 20 L ha-1) and residues
incorporation (4 and 6 tons ha-1) significantly influenced different morphological,
yield related traits, seed yield of mung bean as compared with control.
At mung bean harvested the soil physical, chemical and biological properties were
significantly improved by the application of brassica residues (4 and 6 tons ha -1) as
compared with control but in case of sorghum water extracts (10 and 20 L ha -1) there
was no significant effect as compared with control.
Among all the treatments brassica residues incorporation at 6 tons ha -1 showed the
highest suppression of weed density, fresh and dry weight (52, 61, 56%, respectively)
during both study years.
In case of soil properties significant improvement was observed by the application of
brassica crop residues at 6 tons ha-1 as compared with control during both study years.
Maximum mung bean seed yield was improved (33%) by the application of brassica
crop residues at 6 tons ha-1 as compared with control during both study years.
Brassica residues incorporation at 6 tons ha-1 had higher net benefits (347 $ ha-1)
followed by 4 tons ha-1 during both years (2014 and 2015). While MRR was
maximum in the application of brassica residues at 6 tons ha-1 during both the years as
compared with marginal rate of return of control.
5.4. Experiment-IV: Isolation of allelochemical resistant strains of bacteria
and determination of their active role in rhizosphere To sum up, this study identified bacterial strains 4-17HM, C-14HM, C-17HM and 10-
10M isolated from rhizosphere soil of mung bean which was amended by allelopathic
crop water extracts and residues, showed the highest resistance against synthetic
116

allelochemicals and allelopathic crop water extracts and the maximum nitrogen
fixing, zinc and phosphate solubilization activity.
5.5. Conclusion Residues incorporation of different allelopathic crops (sorghum, sunflower and
brassica) was more effective than their water extracts application in weed
suppression, improvement in soil health and productivity of mung bean.
Application of crop residues at 6 tons/ha was the mostt effeective and economeical
treatments with hiighest net benefit and margiinal rate of returrns. While, other
treatments were uneconomical due to concomiitantly lowerr net returrns associiated
with each of these.
Due to their resistance and active role of bacterial strains 4-17HM, C-14HM, C-
17HM and 10-10M in the rhizosphere, as nitrogen fixir, zinc and phosphate
solubilizer it could be applied with the allelopathic crop water extracts and residues to
manage weeds and improve soil health.
5.6. Future research priorities Combine application.of.allelopathic crop water.extracts, residues, and resistant
bacterial strains to manage weeds under field condition
The roles of allelochemicals produced or induced by AM-fungi or by endophytes and
to understand their effects on microbial and plant communities
Interaction of soil factors and allelopathic activities of crop plants
117
BIBLIOGHRAPHYAble, J.A., C. Rathus and I.D. Godwin. 2001. The investigation of optimal bombardment
parameters for transient and stable transgene expression in sorghum. In Vitro Cellular
and Development Biology Plant, 37: 341-348.
Adugna, A. and A. Abegaz. 2016. Effects of land use changes on the dynamics of selected
soil properties in northeast Wellega, Ethiopia. Soil, 2: 63-70.
Ahmad, A., Z.A., Cheema and R. Ahmad. 2000. Evaluation of sorgaab as natural weed
inhibitor in maize. J. Ani. Pl. Sci., 10: 141-146.
Alam, M.K., M.M. Islam, N. Salahin and M. Hasanuzzaman. 2014. Effect of tillage practices
on soil properties and crop productivity in wheat mungbean rice cropping system
under subtropical climatic conditions. Sci. World J., 1: 1 15.
AL-Bedairy, N.R., I.S. Alsaadawi and R.K. Shati. 2012. Combining effect of allelopathic
Sorghum bicolor L. (Moench) cultivars with planting densities on companion weeds.
Arch. Agron. Soil Sci., In press.
Albuquerque, M.B., R.C. Santos, L.M. Lima, P.D.A. Melo Filho, R.J.M.C. Nogueira and
C.A.G. Câmara. 2010. Allelopathy, an alternative tool to improve cropping systems.
Rev. Agron. Sust. Dev., 31: 379-395.
Ali, M.Z., M.A.A. Khan, A.K.M.M. Rahaman, M. Ahmed and A.F.M.S. Ahsan. 2010. Study
on seed quality and performance of some mungbean varieties in Bangladesh. Int. J.
Expt. Agric., 1: 10-15.
Alsaadawi I.S., M.H.S. Al-Ekeelie, M.K. Al-Hamzawi. 2007. Differential allelopathic
potential of grain sorghum genotypes to weed. Allelopathy J.,19: 153-160.
Alsaadawi, I.S., A. Khaliq, N.R. Lahmod and A. Matloob. 2011. Weed management in broad
bean (Vicia faba L.) through allelopathic Sorghum bicolor (L.) Moench residues and
reduced rate of a pre plant herbicide. Allelopathy J., 32: 203-212.
Ambika, S.R. and G. Smitha. 2005. Induction of stress tolerance in fingermillet by
Chromolaena odorata. Allelopathy J., 15: 247-258.
Ameena, M. and S. George. 2002. Allelopathic influence of purple nutsedge (Cyperus
rotundus L.) on germination and growth of vegetables. Allelopathy J., 10: 147-152.
118

An, M., J. Pratley and T. Haig. 2005. Allelopathy: from concept to reality. Fourth world
congress on allelopathy. Charles Sturt University Wagga Wagga, NSW 2678,
Australia; pp: 21-26.
Andrew, I.K.S., J. Storkey and D.L. Sparkes. 2015. A review of the potential for competitive
cereal cultivars as a tool in integrated weed management. Weed Res., 1: 21-37.
Anjum, T and R. Bajwa. 2008. Screening of sunflower varieties for their herbicidal potential
against common weeds of wheat. J. Sustain. Agri., 32: 213-229.
Anjum, T. and R. Bajwa. 2005. A bioactive annuionone from sunflower leaves. Phytochem.,
66: 1919-1921.
Anjum, T., P. Stevenson, D. Hall and R. Bajwa. 2005. Allelopathic potential of Helianthus
annuus L. (sunflower) as natural herbicide. In: Proceedings of the 4th World,
Congress on Allelopathy: Establishing the Scientific Base, pp: 577-580. Wagga
Wagga, New South Wales, Australia.
Asghari, J. and J.P. Tewari. 2007. Allelopathic potentials of eight barley cultivars on
Brassica jucea (L) Czern. and Setaria viridis (L) p. Beauv. J. Agric. Sci. Technol., 9:
165-176.
Ashrafi, Z.Y., S. Sadeghi and H.R. Mashhadi, 2009. Study of integrate methods chemical and
cultural control of weeds to wheat (Triticum aestivum L.). J. Agric. Sci., 1: 13-19.
Aslam, F. 2010. Studying wheat allelopathy against horse purslane (Trianthema
portulacastrum). M.Sc. Thesis, Department of Agronomy, University of Agriculture,
Faisalabad, Pakistan.
Aslam, F., A. Khaliq. A. Matloob, R.N. Abbas, S. Hussain and F. Rasul. 2014. Differential
allelopathic activity of Parthenium hysterophorus L. against canary grass and wild
oat. J. Anim. Pl. Sci., 24: 234.244.
Aslam, Z., M. Yasir, C.O. Jeon and Y.R. Chung. 2008. Lysobacter oryzae sp. nov., isolated
from the rhizosphere of rice (Oryza sativa L.) managed under no-tillage practice. Int.
J. Syst. Evol. Microb., 59: 675-680.
Awan, F.K., M. Rasheed, M. Ashraf and M.Y. Khurshid. 2012. Efficacy of brassica,
sorghum and sunflower aqueous extracts to control wheat weeds under rainfed
conditions of Pothwar. Pak. J. Anim. Pl. Sci., 22: 715-721.
119

Bacilio-Jimenez, M., S. Aguilar-Flores, E. Ventura-Zapata, E. Perez-Campos, S. Bouquelet
and E. Zenteno. 2003. Chemical characterization of root exudates from rice (Oryza
sativa) and their effects on the chemotactic response of endophytic bacteria. Plant
Soil, 249: 271-277.
Bahatti, M.O.L., Z.A. Cheema and T. Mahmood. 2000. Efficacy of sorgaab as natural weed
inhibitor in raya. Pak. J. Biol. Sci., 3: 1128-1130.
Bais, H.P., T.L. Weir, L.G. Perry, S. Gilroy and J.M. Vivanco. 2006. The role of root
exudates in rhizosphere interactions with plants and other organisms. Ann. Rev. Plant
Biol., 57: 233-266.
Barker A.V. and P.C. Bhowmik. 2001.Weed control with crop residues in vegetable cropping
systems. J. Crop Production, 4: 163-183.
Barnes, J.P. and A.R. Putnam. 1983. Rye residues contribute weed suppression in no-tillage
cropping systems. J. Chem. Ecol., 9: 1045-1057.
Barnes, J.P. and A.R. Putnam. 1986. Evidence for allelopathy by residues and aqueous
extracts of rye (Secale cereale). Weed Sci., 34: 384-390.
Batish, D.R., H.P. Singh, J.K. Pandhar and R.K. Kohli. 2005. Allelopathic interference of
Parthenium hysterophorus residues in soil. Allelopathy J., 15: 267-274.
Batish, D.R., H.P. Singh, J.K. Pandher, V. Arora and R.K. Kohli. 2002a. Phytotoxic effect of
parthenium residues on the selected soil properties and growth of chickpea and
radish. Weed Bio. Management, 2: 73-78.
Batish, D.R., P. Tung, H.P. Singh and R.K. Kohli. 2002b. Phytotoxicity of sunflower
residues against some summer season crops. J. Agron. Crop Sci., 188: 19-24.
Baumann, D.T., M.J. Kropff and L. Bastiaans. 2000. Intercropping leeks to suppress weeds.
Weed Res., 40: 359-374.
Beres, I. and G. Kazinczi. 2000. Allelopathic effects of shoot extracts and residues of weeds
on field crops. Allelopathy J., 7: 93-98.
Bernat, W., H. Gawtonska and S.W. Gawtonski. 2004. Effectiveness of different mulches in
weed management in organic winter wheat production. In: Oleszek W, Burda S, Bialy
Z, Stepien W, Kapusta I, Stepien K (eds.), Abstracts, II European allelopathy
symposium, allelopathy-from understanding to application, 3-5 June 2004 Institute of
Soil Science and Plant Cultivation, Czartoryskich 8, 24=100 Pulawy, p118.
120

Bertin, C., X. Yang and L.A. Weston. 2003. The role of root exudates and allelochemicals in
the rhizosphere. Plant and Soil, 256: 67-83.
Bhowmik, P.C. and Inderjit. 2003. Challenges and opportunities in implementing allelopathy
for natural weed management. Crop Prot., 22: 661-671.
Blake, G.R. and K.H. Hartge. 1986. Bulk density. In: Methods of soil analysis, part 1.
Physical and mineroalogical methods. Agronomy Monograph No. 9, Second edn,
Klute A (ed). American Society of Agronomy: Madison, WI, USA; 363-375.
Blum, U. 1999. Allelopathic interaction involving phenolic acids. J. Nemato, 28: 259-267.
Bogatek, R.A., W. Gniazdowska, K.O. Zakrzewska and S.W. Gawronski. 2006. Allelopathic
effects of sunflower extracts on mustard seed germination and seedling growth.
Biologia Plantarum, 50: 156-158.
Bohme, L., U. Langer and F. Bohme. 2005. Microbial biomass, enzyme activities and
microbial community structure in two European long term field experiment. Agric.
Ecosyst. Environ., 109: 141-152.
Brainard, D.C. and R.R. Bellinder. 2004. Weed suppression in a broccoli winter rye inter
cropping system. Weed Sci., 52: 281-290.
Bremner, J.M. and C.S. Mulvaney. 1982. Total nitrogen. In: Methods of Soil Analysis, Page
AL, Miller RH, Keeny DR (ed). American Society of Agronomy and Soil Science
Society of America, Madison, WI, USA; 1119-1123.
Bressan, M., M.A. Roncato, F. Bellvert, G. Comte, F. el ZaharHaichar, W. Achouak and O.
Berge. 2009. Exogenous glucosinolate produced by Arabidopsis thaliana has an
impact on microbes in the rhizosphere and plant roots. I.S.M.E. J., 3: 1243-1257.
Brzezinska, M., Z. Stepniewska and W. Stepniewski. 1998. Soil oxygen status and
dehydrogenase activity. Soil Biol. Biochem., 30: 1783-1790.
Cecile, B., Y. Xiaohan and A.W. Leslie. 2003. The role of root exudates and allelochemicals
in the rhizosphere. Plant Soil, 256: 67-83.
Cetin, E.T. 1973. General and Practical Microbiology. Sermet Press, Ankara, Turkey.
Channappagoudar, B.B., B.R. Jalageri and N.R. Biradar. 2003. Allelopathic effects of
aqueous extracts of weed species on germination and seedling growth of some crops.
Karnataka J. Agric. Sci., 18: 916-920.
121

Cheema, Z.A., A. Khaliq and S. Saeed. 2004. Weed control in maize (Zea mays L.)
through sorghum allelopathy. J. Sustain. Agric., 23: 73-86.
Cheema, Z.A. and A. Khaliq. 2000. Use of sorghum allelopathic properties to control weeds
in irrigated wheat in a semi arid region of Punjab. Agric. Ecosyst. Environ., 79: 105-
112.
Cheema, Z.A., A. Khaliq and M. Mubeen. 2003. Response of wheat and winter weeds to
foliar application of different plant water extracts of sorghum (Sorghum bicolor).
Pak. J. Weed Sci. Res., 9: 89-97.
Cheema, Z.A., A. Khaliq and M. Mubeen. 2003b. Response of wheat and winter weeds to
foliar application of different plant water extracts. Pakistan J. Weed Res., 9: 89-97.
Cheema, Z.A., A. Khaliq and M. Tariq. 2002. Evaluation of concentrated sorgaab alone and
in combination with three pre-emergence herbicides for weed control in cotton
(Gossypium hirsutum L.). Int. J. Agric. Biol., 4: 549-552.
Cheema, Z.A., A. Khaliq and R. Hussain. 2003a. Reducing herbicide rate in combination
with allelopathic sorgaab for weed control in cotton. Int. J. Agric. Biol., 5: 1-6.
Cheema, Z.A., A. Khaliq and S. Akhtar. 2001. Use of sorghum water extract as a natural
weed inhibitor in spring mung bean. Int. J. Agric. Biol., 3:.515-518.
Cheema, Z.A., A. Khaliq and S. Saeed. 2004. Weed control in maize (Zea mays L.) through
sorghum allelopathy. J. Sust. Agric., 23: 73-86.
Cheema, Z.A., A. Khaliq, M. Abbas and M. Farooq. 2007. Allelopathic potential of sorghum
(Sorhum bicolor L.) cultivars for weed management. Allelopathy J., 20: 167-178.
Cheema, Z.A., A. Luqman and A. Khaliq. 1997. Use of allelopathic extracts of sorghum and
sunflower herbage for weed control in wheat. J.A.P.S., 7: 91-93.
Cheema, Z.A., A. Rakha and A. Khaliq. 2000. Use of sorghum water extract and sorghum
mulch for weed management in mung bean. Pak. J. Agric. Sci., 37: 140-144.
Cheng, F. and Z. Cheng. 2015. Research progress on the use of plant allelopathy in
agriculture and the physiological and ecological mechanisms of allelopathy. Front.
Plant Sci., 6: 1020.
Chon, S.U., J.A. Jennings and C.J. Nelson. 2006. Alfalfa (Medicago sativa L.) auto toxicity:
Current status. Allelopathy J., 18: 57-80.
122

Chou, C.H. 1999. Roles of allelopathy in plant biodiversity and sustainable agriculture. Crit.
Rev. Plant Sci., 18: 609-636.
Chou, C.H. and H.J. Lin. 1976. Autointoxication mechanism of Oryza sativa. I. Phytotoxic
effects of decomposing rice residues in soil. J. Chem. Ecol., 2: 353-367.
CIMMYT. 1988. From agronomic data to farmer recommendation: an economic training
manual. Mxico. Pp. 25-33.
Clark, A.J. 2007. Managing cover crops profitably 2nd edition. United States Department of
Agriculture, Beltsville, Md. USA.
Cousens, R. and M. Mortimer. 1995. Dynamics of weed populations. Cambridge University
Press. Cambridge, U.K. Crop Prod. 4: 43-119.
Cutillo, F., B. D’Abrosca, M. Della Greca, C. Di Marino, A. Golino, L. Previtera and A.
Zarrelli. 2003. Cinnamic acid amides from Chenopodium album: effects on seed
germination and plant growth. Phytochem., 64: 1381-1387.
Czarnota, M.A., A.M. Rimando and L.A. Weston. 2003. Evaluation of root exudates of seven
sorghum accessions. J. Chem. Ecol., 29: 2073-2083.
D’Abrosca, B., M. DellaGreca, A. Fiorentino, P. Monaco, P. Oriano and F. Temussi. 2004.
Structure elucidation and phytotoxicity of C13 nor-isoprenoids from Cestrum parqui.
Phytochem., 65: 497-505.
De Gelder, B. 2006. Towards the neurobiology of emotional body language. Nature Rev.
Neurosci., 7: 242-249.
Dick, R.P. 1994. Soil enzymatic activities as in indicator of soil quality, in deinding soil
quality for a sustainable development, J. W. Doran, D. C. Coleman, D. F. Bezdicek,
and B. A. Stewart, Eds., pp. 107-124, Soil Science Society of America, Madison,
Wis, USA.
Dick, W.A.,N.G. Juma and M.A. Tabatabai. 1983. Effects of soils on acid phosphatase and
inorganic pyro phosphatase of corn roots (Zea mays). Soil Sci., 136: 19-25.
Doran, J.W. 1980. Microbial changes associated with residue management with reduce
management with reduced tillage. Soil Sci. Society America J., 44: 518-524.
Einhellig, F.A., M.K. Schon and J.A. Rasmussen. 1982. Synergistic effects of four cinnamic
acid compounds on grain sorghum. J. Plant Growth Regul., 1: 251-258.
123

Elahi, M., Z.A. Cheema, S.M.A. Basra and Q. Ali, 2011. Use of allelopathic crop water
extracts for reducing isoproturon and phenoxaprop-p-ethyl dose in wheat. Int. J.
Agron. Vet. Med. Sci., 5: 488-496.
El-Khatib, A.A., A.K. Hegazy and H.K. Gala. 2004. Does allelopathy have a role in the
ecology of Chenopodium murale. Ann. Bot. Fennici., 41: 37-45.
Essien, B., J. Essien, J. Nwite, K. Eke, U. Anaele and J. Ogbu. 2009. Effect of organic mulch
materials on maize performance and weed growth in the derived savanna of South
Eastern Nigeria. Nigeria Agric. J., 40: 1-9.
Fahey, J.W., A.T. Zalcmann P. and Talalay. 2001. The chemical diversity and distribution of
glucosinolates and isothiocyanates among plants. Phytochem., 56: 5-51.
Farooq, M., A.A. Bajwa1, S.A. Cheema1 and Z.A. Cheema, 2013. Application of
Allelopathy in Crop Production. Int. J. Agric. Biol., 6: 1367-1378.
Farooq, M., K. Jabran, Z.A. Cheema, A. Wahid and K.H.M. Siddique. 2011a. Role of
allelopathy in agricultural pest management. Pest Manag. Sci., 67: 494-506.
Farooq, M., M. Habib, A. Rehman, A. Wahid and R. Munir. 2011b. Employing aqueous
allelopathic extracts of sunflower in improving salinity tolerance in rice. J. Agric.
Soc. Sci., 7: 75-80.
Ferguson, J.J. and B. Rathinasabapathi. 2003. Allelopathy: How Plants Suppress Other Plants
one of a series of the Horticultural Sciences Department, Florida Cooperative
Extension Service, Institute of Food and Agricultural Sciences, University of Florida.
Publication date: July 2003. Please visit the EDIS Web site at http://edis.ifas.ufl.edu.
Fujii, Y. 2001: Screening and future exploitation of allelopathic plants as alternative
herbicides with special reference. J. Crop Prod. 4: 57-276.
Fujita, K.I. and I. Kubo. 2003. Synergism of polygodial and trans-cinnamic acid on inhibition
of root elongation in lettuce seedling growth bioassays. J. Chem. Ecol., 29: 2253-
2262.
Furness, N.H., B. Adomas, Q. Dai, S. Li and M.K. Upadhaya. 2008. Allelopathic influence
of Houndstongue (Cynoglossum officinale) and its modification by UV-B radiation.
Weed Technol., 22: 101-107.
Gawronski, S.W., W. Bernat and H. Gawronska. 2002. Allelopathic potential of sunflower
mulch in weed control. In: Fujii Y, Hiradata S, Araya H (eds.), Abstracts, III world
124
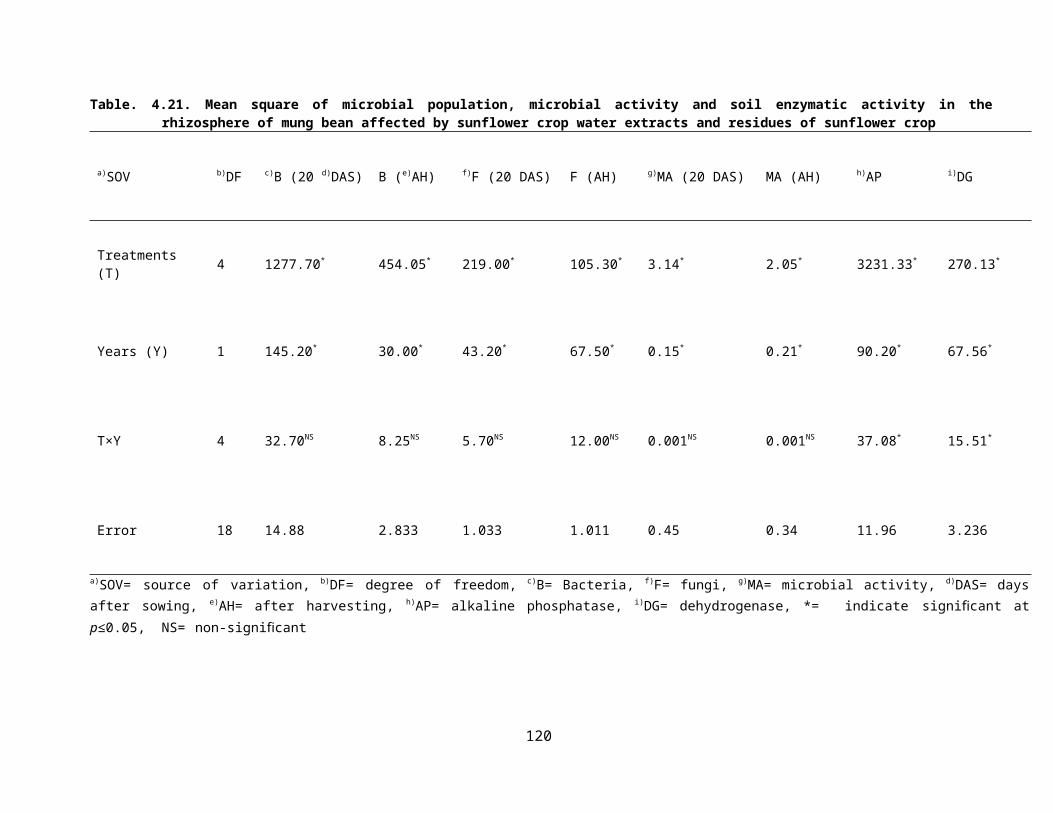
congress on allelopathy challenge for the new millennium, 26-30 Aug 2002, Tsukuba,
p 160.
Ghafar, A., B. Saleem and M.J. Qureshi. 2000. Allelopathic effects of sunflower on
germination and seedling growth of wheat. Pak. J. Biol. Sci., 3: 1301-1302.
Ghafar, A., S. Bushra, A. Haq and M.J. Qureshi. 2001. Isolation and identification of
allelochemicals of Sunflower (Helianthus annuus L.). Int. J. Agric. Biol., 1: 21-22.
Gniazdowska, A. and R. Bogatek. 2005. Alleopathic interaction between plants. Multiside
action of allelochemicals. Acta Physiol. Plant., 395-407.
Gong, Z., P. Li, B.M. Wilke and K. Alef. 2008. Effects of vegetable oil residue after soil
extraction on physical-chemical properties of sandy soil and plant growth. J. Environ.
Sci., 20: 1458-1462.
Gu, Y., P. Wang and C.H. Kong. 2009. Urease, invertase, dehydrogenase and
polyphenoloxidase activities in paddy soil influenced by allelopathic rice variety.
European J. Soil Biol., 45: 436-441.
Guenzi, W. and T. McCalla. 1966. Phenolic acids in oats, wheat, sorghum and corn residues
and their phytotoxicity. Agron. J., 58: 303-304.
Gupta, A. 2000. Allelopathic potential of root extracts of Parthenium hysterophorus L.
Allelopathy J., 7: 105-108.
Gupta, P.K. 2004. Pesticide exposure-Indian scene. Toxicology, 198: 83-90.
Gupta, U.S. 2011. What’s new about crop plants: novel discoveries of the 21st century. CRC
press, Taylor & Franc is group. Doi.org/10. 1201/b10 736.
Halligan, J.P. 1973. Bare areas associated with shrub stands in grasslands: the case of
Artemisia california. Biosci., 23: 429-432.
Hauggaard-Nielsen, H., P. Ambus and E.S. Jensen. 2001. Temporal and spatial distribution
of roots and competition for nitrogen in pea-barley intercrops-A field study
employing 32P technique. Plant and Soil, 236: 63-74.
Hejl, A.M. and K.L. Koster. 2004. The allelochemical sorgoleone inhibits root H+-ATPase
and water uptake. J. Chem. Ecol., 30: 2181-2191.
Helmke, P.A. and D.L. Sparks. 1996. Lithium, sodium and potassium. p. 551-575. In:
Methods of Soil Analysis.
125

Hozayn, M., A.A.A. Monem and E.M.A. Lateef. 2011. Crop residues, an effective tool for
improving growth of wheat and suppression of some associated weeds. Allelopathy J.
27: 237-344.
Huerta, A., I. Chiffelle, K. Puga, F. Az´ua and J.E. Araya. 2010. Toxicity and repellence of
aqueous and ethanolic extracts from Schinus molle on elm leaf beetle Xanthogaleruca
luteola. Crop Prot., 29: 1118-1123.
Iannucci, A., M. Fragasso, C. Platani and R. Papa. 2013. Plant growth and phenolic
compounds in the rhizosphere soil of wild oat (Avena fatua L.). Front. Plant Sci., 4:
509.
Imatomi, M., P. Novaes, A.P. Matos, S.C.J. Gualtieri, J.M.G. Molinillo, R. Lacret, R.M.
Varela and F.A. Macías. 2013. Phytotoxic effect of bioactive compounds isolated
from Myrcia tomentosa (Myrtaceae) leaves. Biochem. Sys. Ecol., 46: 29-35.
Inderjit and J. Weiner. 2001. Plant allelochemical interference or soil chemical ecology?
Persp. Plant Ecol. Evol. Systemat., 4: 4-12.
Inderjit and L.A. Weston. 2003. Root exudation: an overview. In Root Ecology; H deKroon,
Ed.; Ecological Studies168. Springer-Verlag Press: London, Pp. 235-255.
Inderjit, 2004a. Weed Biology and management. (Ed. Inderjit, Kluwer Academic Publishers,
Netherlands) pp 29-45.
Inderjit, 2004b. Weed Biology and management. (Ed. Inderjit, Kluwer Academic Publishers,
Netherlands) pp 47-63.
Inderjit, 2005. Soil microorganisms: An important determinant of allelopathic activity. Plant
Soil, 274: 227-236.
Iqbal, J. and Z.A. Cheema. 2008. Intercropping of field crops in cotton for the management
of purple nutsedge (Cyperus rotundus L.). Plant Soil, 300: 163-171.
Irshad, A. and Z.A. Cheema. 2004. Effect of sorghum extract on management of barnyard
grass in rice crop. Allelopathy J., 14: 205-212.
Irshad, A. and Z.A. Cheema. 2005. Comparative efficacy of sorghum allelopathic potential
for controlling barnyard grass in rice. Proceedings of Fourth World Congress on
Allelopathy. August, 21-26, 2005. Wagga Wagga, Australia
126

Jabran, K., M. Farooq, M. Hussain, H. Rehman and M.A. Ali. 2010. Wild oat (Avena fatua
L.) and canary grass (Phalaris minor Ritz.) management through allelopathy. J. Plant
Prot. Res., 50: 32-35.
Jamil, M., Z.A., Cheema, M.N. Mushtaq, M. Farooq and M.A. Cheema. 2009. Alternative
control of wild oat and canary grass in wheat fields by allelopathic plant water
extracts. Agron. Sustain. Develop., 29: 475-482.
Janssen, P.H., P.S. Yates, B.E. Grinton, P.M. Taylor and M. Sait. 2002. Improved
culturability of soil bacteria and isolation in pure culture of novel members of the
divisions Acido bacteria, Actino bacteria, Proteo bacteria, and Verruco microbia.
Appl. Environ. Microbiol., 68: 2391-2396.
Javaid, A. and R. Bajwa. 1999. Allelopathy and VA mycorrhiza IV: Tolerance to allelopathy
by mycorrhizae in maize. Pak. J. Phytopathol., 11: 70-73.
Javaid, A., S. Shafique, R. Bajwa and S. Shafique. 2006. Effect of aqueous extracts of
allelopathic crops on germination and growth of Parthenium hysterophorus L. South
Afr. J. Bot., 72: 609-612.
Jayakumar, M., K. Ponnuswamy and M.M. Amanullah. Influence of intercropping and
sources of nitrogen on yield attributes, yield and economics of cotton. Res. J. Agric.
Biol. Sci., 4: 149-153.
Jin, Y.Q., B.J. Du, H.J. Gao, J. Chang and L.G. Zhang. 2013. Effects of maize straw
returning on water dynamics and water use efficiency of winter wheat in lime
concretion black soil. J. Triticeae Crops, 33: 1-7.
Johansson, J.F., L.R. Paul and R.D. Finlay. 2004. Microbial interactions in the mycor
rhizosphere and their significance for sustainable agriculture. F.E.M.S. Micro. Ecol.,
48: 1-13.
Joseph, B., M.A. Dar and V. Kumar, 2008. Bio-efficacy of plant extracts to control Fusarium
solani f.sp. melongenae incitant of brinjal wilt. Glob. J. Biotechnol. Biochem., 3: 56-
59.
Kamal, J. and A. Bano. 2008. Allelopathic potential of sunflower (Helianthus annuus L.) on
soil metals and its leaves extracts on physiology of wheat (Triticum aestivum L.)
seedlings. Afr. J. Biotechnol., 7: 3261-3265.
127

Kamara, A., I. Akobundu, D. Chikoye and S. Jutzi. 2000. Selective control of weeds in an
arable crop by mulches from some multipurpose trees in south western Nigeria,
Agroforestry Systems 50: 17-26.
Kandhro, M.N., H.R. Memon, M.A. Ansari and A.N. Shah. 2015. Effect of allelopathic water
extract of sorghum and sunflower on weed mortality and cotton yield. Sarhad J.
Agric., 31: 165-174.
Kathiresan, R.M. 2000. Allelopathic potential of native plants against water hyacinth. Crop
Prot., 19: 705-708.
Kaur, H., R. Kaur, S. Kaur, I.T. Baldwin and Inderjit. 2009. Taking ecological function
seriously: Soil microbial communities can obviate allelopathic effects of released
metabolites. PLoS ONE, 4: 4700.
Kaya, Y., M. Seng¨ul, H. ¨Oˇg¨utc¸¨u, and O.F. Algur. 2006. The possibility of useful usage
of biodegradation products of sunlower plants. Bioresource Technol., 97: 599-604.
Khaliq, A., A. Matloob, A. Hussain, S. Hussain, F. Aslam, S.I. Zamir and M.U. Chattha.
2015. Wheat residue management options affect productivity, weed growth and soil
properties in direct-seeded fine aromatic rice. Clean-Soil Air Water, 43: 1259-1265.
Khaliq, A., A. Matloob, M. Farooq, M.N. Mushtaq and M.B. Khan. 2011. Effect of crop
residues applied isolated or in combination on the germination and seedling growth
of horse purslane (Trianthema portulacastrum). Planta Daninha, 29: 121-128.
Khaliq, A., A. Matloob, M.S. Irshad, A. Tanveer and M.S.I. Zamir. 2010. Organic weed
management in maize through integration of allelopathic crop residues. Pak. J. Weed
Sci. Res., 16: 409-420.
Khaliq, A., S. Hussain, A. Matloob, A. Tanveer and F. Aslam. 2014. Swine cress (Cronopus
didymus L. Sm.) residues inhibit rice emergence and early seedling growth. Phillips
Agric. Sci., 96: 419-425.
Khanh, T.D., M.I. Chung and T.D. Xuan, S. Tawata. 2005. The exploitation of crop
allelopathy in sustainable agricultural production. J. Agron. Crop Sci., 191: 172-184.
Kobayashi, K. 2004. Factors affecting phytotoxic activity of allelochemicals in soil. Weed
Biol. Manag., 4: 1-7.
128

Koger, C.H. and C.T. Bryson. 2004. Effect of cogongrass (Imperata cylindrica) extracts on
germination and seedling growth of selected grass and broadleaf species. Weed
Technol., 18: 236-242.
Kohli, R.K., D.R. Batish, H.P. Singh and K.S. Dogra. 2006. Status, invasiveness and
environmental threats of three tropical American invasive weeds (Parthenium
hysterophorus L., Ageratum conyzoides L., Lantana camara L.) in India. Biol.
Invasions, 8: 1501-1510.
Kohli, R.K., H.P. Singh and D.R. Batish. 2001 “Allelopathy in Agroecosystems.” Food
Products Press, New York, 447 pp.
Krishna, G.M.A., A.K.K. Misra, K.M. Hati, K.K. Bandyopadhyay, P.K. Ghosh and M.
Mohanty. Rice residue management options and effects on soil properties and crop
productivity. Food, Agric. Environ. 2004; 2: 224-231.
Kruidhof, H., L. Bastiaans and M. Kropff. 2008. Ecological weed management by cover
cropping: effects on weed growth in autumn and weed establishment in spring. Weed
Res. 48: 492-502.
Kruse, M., M. Strandberg and B. Strandberg. 2000. Ecological effects of allelopathic plants.
A review, Department of Terrestrial Ecology, Silkeborg, Denmark, Rep. No. 315.
Liebman, M. and E. Dyck. 1993. Crop rotation and intercropping strategies for weed
management. Ecol. Appl., 3: 92-122.
Lu, D.L. 2011. Biologically active secondary metabolites of barley. I: Developing techniques
and assessing allelopathy in barley. J. Chem. Ecol. 19: 2217-2230.
Macias, F.A. 2002. New approaches in allelopathy, challenge for the new millenium. Third
World Congress Allelopathy Abstracts, 38.
Macías, F.A., A. Lopez, R.M. Varela, A. Torres, J.M.G. Molinillo. 2008. Helikauranoside A,
A New Bioactive Diterpene. J. Chemical Ecol., 34: 65-69.
Mahmood, A and Z.A. Cheema. 2004. Influence of sorghum mulch on purple nutsedge
(Cyperus rotundus L.). Int. J. Agric. Biol. 6: 86-88.
Makoi, J.H.J.R. and P.A. Ndakidemi. 2012. Allelopathy as protectant, defense and growth
stimulants in legume cereal mixed culture systems. New Zealand J. Crop Horti. Sci.,
40: 161-186.
129
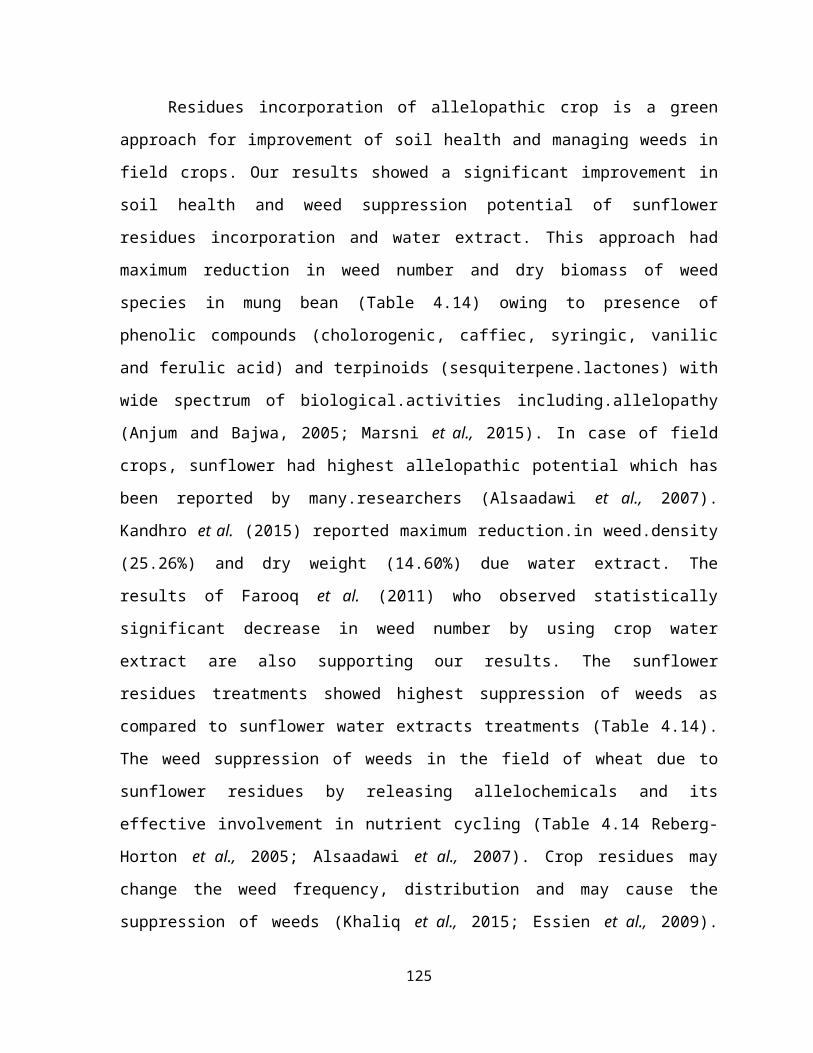
Mandava, N.B. 1985. Chemistry and biology of allelopathic agents. In: Thomson A ed. The
chemistry of allelopathy. Washington, DC, American Chemical Society. Pp. 33-54.
Marsni, Z.E., A. Torres, R.M. Varela, J.M.G. Molinillo, L. Casas, C. Mantell, E.J.M. Ossa
and F.A. Macias. 2015. Isolation of bioactive compounds from sunflower leaves
(Helianthus annuus L.) extracted with supercritical carbon dioxide. J. Agric. Food
Chem., 63: 6410-6421.
Martin, J.P. 1950. Use of acid rose bengal and streptomycin in the plate method for
enumerating soil fungi. Soil Sci., 69: 215-232.
Meazza, G., B.E. Scheffler, M.R. Tellez, A.M. Rimando, J.G. Romagni, S.O. Duke, D.
Nanayakkara, I.A. Khan, E.A. Abourashed and F.E. Dayan. 2002. The inhibitory
activity of natural products on plant p-hydroxyphenyl pyruvate dioxygenase.
Phytochem., 59: 281-288.
Mendes, R., P. Garbeva, and J.M. Raaijmakers. 2013. The rhizosphere microbiome:
significance of plant beneficial, plant pathogenic, and human pathogenic
microorganisms. FEMS Microbiol. Rev., 37: 634-663.
Mengal, B.S., S.U. Baloch, Y. Sun, W. Bashir, K.R. Wu, A.R. Shahwani, H.N. Baloch, S.K.
Baloch, R.A. Baloch, S.A.I. Sabiel, S.A. Badini and S. Baber. 2015. The influence of
allelopathic weeds extracts on weeds and yield of wheat (Triticum aestivum L.). J.
Biol. Agric. Healthcare, 5: 218-227.
Min, H., Y.F. Ye, Z.Y. Chen, W.X. Wu and Y.F. Du. 2001. Effects of butachlor on microbial
populations and enzyme activities in paddy soil. J. Environ. Sci. Health, 36: 581-595.
Molisch, H. 1937. Der Einfluss einer Pflanze auf die Andere-Allelopathic. Fischer, Jena,
Germany, 31: 12-16.
Mubeen, K., M.A. Nadeem, A. Tanveer and Z.A. Zahir. 2012. Allelopathic effects of
sorghum and sunflower water extracts on germination and seedling growth of rice
(Oryza sativa L.) and three weed species. J. Animal Plant Sci., 22: 738-746.
Mushtaq, M.N., Z.A. Cheema and A. Khaliq. 2010. Effects of mixture of allelopathic plant
aqueous extracts on (Trianthema portulacastrum L.) weed. Allelopathy J., 25: 205-
212.
Naeem, M., A. Mahmood, M.Z. Ihsan, I. Daur, S. Hussain, Z. Aslam, and S.A. Zamanan.
2016. Trianthema portulacastrum and Cyperus rotundus interference in maize and
130

application of allelopathic crop extracts for their effective management. Planta
Daninha, 34: 209-218.
Narwal, S.S. 2001. Allelopathic potential of legumes for weed management in sustainable
agriculture. Indian J. Pulses Res., 14: 90-106.
Narwal, S.S., 1994. Allelopathic strategies for weed control in sustainable agriculture. In:
Macias FA, Galindo JCG, Molinillo JMG, Gutler HC (eds.), Abstracts, first world
congress on allelopathy, a science for the future, 16-20. Cadiz, p 73.
Narwal, S.S., R. Palaniraj, R. Hardeep, S.C. Sati L.S. Rawat. 2002. Weed management
potential of barley accessions for sustainable agriculture in North India. In: Fujii Y,
Hiradata S, Araya H (eds.), Abstracts, III world congress on allelopathy challenge for
the new millennium, 26-30. Tsukuba, p 145.
Narwal, S.S., R. Palaniraj, S.C. Sati, D.S. Dahiya. 2004. Field screening of sorghum varieties
for allelopathic potential against Parthenum hysterophorus and Trianthema
portulacastrum. In: Narwal SS, Barbara P (eds.), Abstracts, IV international
conference allelopathy in sustainable terrestrial and aquatic
Narwal, S.S., S.C. Sati and R. Palaniraj. 2004. Allelopathic weed suppression of brassica
accessions against major winter weeds in north India. In: Proceedings of the Second
European Allelopathy Symposium “Allelopathy from Understanding to Application”
(Pulawy, Poland, June 3-5 2004). Conference proceeding, Pulawy, Poland, 21.
Naseem, M., M. Aslam, M, Ansar and M. Azhar. 2010. Allelopathic effects of sunflower
water extract on weed control and wheat productivity. Pak. J. Weed Sci. Res., 15:
107-116.
Naseem, M., M. Aslam, M. Ansar and M. Azhar. 2009. Allelopathic extracts of sunflower
water extract on weed control and wheat productivity. Pak. J. Weed Sci. Res., 15:
107-116.
Nawaz, A., R. Lal, R.K. Shrestha and M. Farooq. 2016. Mulching affects soil properties and
greenhouse gases emissions under long term no-till and plough till systems in Alfisol
of central Ohio. Land Development and Degradation, 28: 673-681
Netzly, D.H. and L.G. Butler. 1986. Root of sorghum exude hydrophobic droplets containing
biologically active components. Crop Sci., 26: 775-778.
131

Niakan, M., M. Tajari and M. Ghorbanli. 2008. The effect of salinity stress on allelopathic
potential of canola by studying some growth factors, chlorophyll a,b amount,
antioxidant enzyme and nitrate reductase activity of soybean seedling in hydroponic
culture. Iran J. Biol. 21: 315-325.
Norsworthy, J.K., M.S. Malik, P. Jha and M.J. Oliveira. 2006. Effects of isothiocyanates on
purple (Cyperus rotundus L.) and yellow nutsedge (Cyperus esculentus L.). Weed
Biol. Manag., 6: 131-138.
Obaid, K.A. and J.R. Qasem. 2005. Allelopathic activity of common weed species on
vegetable crops grown in Jordan. Allelopathy J., 15: 221-236.
Olofsdotter, M., B. Jensen and B. Courtois. 2002. Improving crop competitive ability using
allelopathy an example from rice. Plant Breeding, 121: 1-9.
Olsen, S.O. and I.E. Sommers. 1982. Phosphorus. In: Methods of Soil Analysis. A.L.Page
(ed.). Chemical and Microbial Properties. Part 2, 2nd Ed. American Society of
Agronomy, Madison, Wisconsin, USA. p. 403-430.
Pandey, J. and B.N. Mishra. 2003. Effect of weed management practices in a rice mustard-
mungbean cropping system on weeds and yield of crops. Annals Agric. Res., 24:
737-742.
Patterson, D.T. 1986. Allelopathy. In: Camper, N.D. (Ed.). Research Methods in Weed
Science. Illinois, Southern Weed Science Society of America. . Pp. 111-134.
Penna, A.B.D., S.R. Panzardi, A.M. Folcia and S. Leicach. 2003. Allelopathic effects of
Chenopodium ambrosioides L. aqueous extracts on Bidens pilosa L. germination.
I.D.E..S.I.A., 21: 103-108.
Petersen, J., R. Belz, F. Walker, and K. Hurle. 2001. Weed suppression by release of
isothiocyanates from turnip-rape mulch. Agron. J., 93: 37-42.
Pramanil, M.H.R., M. Nagai, T. Asao and Y. Matsui. 2000. Effects of temperature and
photoperiod on phytotoxic root exudates of cucumber (Cucumis sativus) in
hydroponic culture. J. Chem. Ecol., 26: 1953-1967.
Putnam, A.R. and W.B. Duke. 1974. Biological suppression of weeds evidence for
allelopathy in accessions of cucumber. Sci., 185: 370-71.
Putnam, A.R. and W.B. Duke. 1978. Allelopathy in agroecosystems. Ann. rev. Phytopathol.,
16: 431-451.
132
Raghavendra, M.P., S. Satish and K.A. Raveesha. 2006. Phytochemical analysis and
antibacterial ac-tivity of Oxalis corniculata; a known medicinal plant. mySCIENCE,
1: 72-78.
Randhawa, M.A., Z.A. Cheema and M.A. Ali. 2002. Allelopathic effect of sorghum water
extract on the germination and seedling growth of Trianthema portulacastrum. Int. J.
Agri. Biol., 4: 383-384.
Rasmussen, J.A. and F.A. Einhellig. 1977. Synergistic inhibitory effects of p-coumaric and
ferulic acids on germination and growth of grain sorghum. J. Chem. Ecol., 3: 197-
205.
Raut, V.U., R.T. Bhowate and A.G. Waghmare. 2010. Effect of crop residues on nutrient
contents in green gram-sunflower cropping sequence. Green Farm., 2010; 1: 14-19.
Ravankar, H.N., R. Patil and R.B. Puranik. 2000. Decomposition of different organic
residues in soil. PKV Res. J., 24: 23-25.
Reberg-Horton, S.C., J.D. Burton, D.A. Danehower, G. Ma, D.W. Monks, J.P. Murphy, N.N.
Ranells, J.D. Williamson and N.G. Creamer. 2005. Changes over time in the
allelochemicals content of ten cultivars of rye ( Secale cereale). J. Chemic. Ecol., 31:
179-193.
Reinhardt, K.O. and R.M. Callaway. 2006. Soil biota and plant invasions. New Phyt., 170:
445-457 .
Ren, D., Y. Liu, K.Y. Yang, L. Han, G. Mao, J. Glazebrook and S. Zhang. 2008. A fungal-
responsive MAPK cascade regulates phytoalexin biosynthesis in Arabidopsis. Proc.
Natl. Acad. Sci., 105: 5638-5643.
Riaz, M.Y. 2010. Non-chemical weed management strategies in dry direct seeded fine grain
aerobic rice (Oryza sativa L.). MSc (Hons.) Thesis, Department of Agronomy,
University of Agriculture, Faisalabad, Pakistan.
Rice, E.L., 1984. Allelopathy, 2nd edition. Academic Press, New York, USA.
Rimando, A.M. and S.O. Duke. 2003. Studies on rice allelochemicals. In: Smith CW, Dilday
RH, editors. Rice: Origin, history, technology and production. New Jersey: John
Wiley & Sons. pp 221-244.
Roth, C.M., J.P. Shroyer, and G.M. Paulsen. 2000. Allelopathy of sorghum on wheat under
several tillage systems. Agron. J. 92: 855-860.
133

Sabahie, M. S. Vazan, M. Oveisi, F. Golzardi. 2014. Evaluation of allelopathic effects of
aqueous extract of sorghum crops (Sorghum bicolor L.) on germination red root
pigweed (Amaranthus retroflexus L.)
Sadeghi, S., A. Rahnavard and Z.Y. Ashrafi. 2010. Response of wheat (Triticum aestivum)
germination and growth of seedling to allelopathic potential of sunflower (Helianthus
annuus) and barley (Hordeum vulgare L.) extracts. J. Agric. Technol., 6: 573-577.
Sannigrahi, A.K. and S. Chakraborty. 2005. Allelopathic effects of weeds on germination and
seedling growth of tomato. Allelopathy J., 16: 289-294.
Santamar´ıa, R. M.E. Aguirre and M.A. Commegna. 2008. Efects of sunlowers hull
incorporation on the distribution of water extractable elements in the soil. Agroch.,
52: 243-252.
Saravanan, V.S., M. Madhaiyan and M. Thangaraju. 2007. Solubilization of zinc compounds
by the diazotrophic, plant growth promoting bacterium Gluconacetobacter di
azotrophicus. Chemosphere, 66: 1794-1798.
Séne, M., C. Gallet and T. Dore. 2001. Phenolic compounds in a Sahelian sorghum (Sorghum
bicolor) genotype (CE145-66) and associated soils. J. Chem. Ecol., 27: 81-92.
Sène, M., T. Doré and F. Pellissier. 2000. Effect of phenolic acids in soil under and between
rows of a prior sorghum (Sorghum bicolor) crop on germination, emergence and
seedling growth of peanut (Arachis hypogea). J. Chem. Ecol., 26: 625-637.
Shah, S.H. E.A. Khan, H. Shah, N. Ahmad, J. Khan and G.U. Sadozai. 2016. Allelopathic
sorghum water extract helps to improve yield of sunflower (Helianthus annuus L.)
Shahid, M., B. Ahmad, R.A. Khatak, and M. Arif. 2007. Integration of herbicides with
aqueous allelopathic water extracts for weed control in wheat. Afr. Crop Sci. Conf.
Proc. 8: 209-212.
Shahid, M., S. Hameed, A. Imran, S. Ali and J.D. van Elsas. 2012. Root colonization and
growth promotion of sunflower (Helianthus annuus L.) by phosphate solubilizing
Entero bacter sp. Fs-11. World J. Microbiol. Biotechnol., 28: 2749-2758.
Sharma, M.P., S.V. Bali and D.K. Gupta. 2000. Crop yield and properties of inceptisol as
influenced by residue management under rice-wheat system. J. Indian Soc. Soil Sci.,
48: 506-509.
134

Shaver, T. 2010. Crop residue and soil physical properties. Proceedings of the 22nd annual
central plains irrigation conference, Kearney, NE., February 24-25, 2010. Available
from CPIA, 760 N.Thompson, Colby, Kansas.
Shibayama, H. 2001. Review: Weed and weed management in rice production in Japan.
Weed Biol. Manag., 1: 53-60.
Sidhu, B.S. and V. Beri. 2005. Experience with managing rice residue in intensive rice-wheat
cropping system in Punjab. In: Conservation Agriculture-Status and Prospects (Eds:
Abrol I P, Gupta R K and Malik R K) pp 55-63. Centre for Advancement of
Sustainable Agriculture (CASA)., New Delhi.
Siemens, D.H., S.H. Garner, T. Mitchell-Olds, and R.M. Callaway. 2002. Cost of defense in
the context of plant competition: Brassica rapa may grow and defend. Ecol., 83: 505-
517.
Singh, H.P., D.R. Batish and R.K. Kohli. 2001. Allelopathy in agro ecosystems: an over
view. J. Crop Prod., 4: 1-41.
Singh, H.P., D.R. Batish, S. Kaur and R.K. Kohli. 2003. Phytotoxic interference of Ageratum
conyzoides with Triticum aestivum. J. Agro. Crop Sci., 189: 341-346.
Singh, H.P., D.R. Batish, S. Kaur, N. Setia and R.K. Kohli. 2005. Effects of 2-
benzoxazolinone on the germination, early growth and morphogenetic response of
mungbean (Phaseolus aureus). Annals Appl. Biol., 147: 267-274.
Sinha, N.K. and S.J. Singh. 2004. Allelopathic effects of Xanthium strumarium on
Parthenium hysterophorus. Indian J. Plant Physiol., 9: 313-315.
Stagnari, F., A. Galieni, S. Speca, G. Cafiero and M. Pisante. 2014. Effects of straw mulch
on growth and yield of durum wheat during transition to conservation agriculture in
Mediterranean environment. Field Crop Research, 167: 51-63.
Steel, R.G., D.J.H. Torrie and D.A. Dickey. 1997. Principles and procedure of statistics: A
biometrical approach, 3rd edition, McGraw Hill Book Co. Inc. New York, USA. Pp.
400-428.
Steiner, K.G. 1984. Intercropping in tropical smallholder agriculture with special reference to
West Africa. Geselleschaft for Technische Zusammenarbeit (GTZ), Eschborn,
Germany.
135

Stotzky, G. Microbial respiration. In: BLACK, C.A., ed. Methods of soil analysis. Madison,
American Society of Agronomy, 1965. v.2. p.1550-1570.
Subudhi, P.K. and H.T. Nguyen. 2000. New horizons in biotechnology. In: Frederiksen RA
(ed) Sorghum: origin, history, technology, and production. Wiley, New York, pp 349-
397.
Tabatabai, M.A. and J.M Bremner. 1969. Use of p-nitrophenyl phosphate for assay of soil
phosphatase activity. Soil Bio. Biochem., 1: 301-307.
Tajuddin, Z., S.S. Shaukat and I.A. Siddiqui. 2002. Allelopathic potential of Solanum
forskalii Dunal: A tropical Rudral weed. Pak. J. Biol. Sci., 5: 866-868.
Tariq, M.I., S. Afzal, I. Hussain and N. Sultana. 2007. Pesticides exposure in Pakistan: A
review. Environ. Int., 33: 1107-1122.
Tawaha, A.M. and M.A. Turk. 2003. Allelopathic effects of black mustard (Brassica nigra)
on germination and growth of wild barley (Hordeum spontaneum). J. Agron. Crop
Sci., 189: 298-303.
Uchino, H., K. Iwama, Y. Jitsuyama, K. Ichiyama, T. Yudate, S. Nakamura and J. Gopal.
2012. Effect of interseeding cover crops and fertilization on weed suppression under
an organic and rotational cropping system 1. Stability of weed suppression over years
and main crops of potato, maize and soybean. Field Crops Res., 127: 9-16.
Uremis, I., M. Arslan and A. Uludag. 2005. Allelopathic effects of some brassica species on
germination and growth of cutleaf ground cherry (Physalis angulata L.). J. Biol. Sci.,
5: 661-665.
Vandermeer, J.H., 1992. The Ecology of Intercropping. Publisher: Cambridge University
Press.
Vandermeer. J. 1989. The Ecology of Intercropping. Cambridge, England: Cambridge
University Press.
Verhulst, N., V. Nelissen, N. Jespers, H. Haven, K.D. Sayre, D. Raes, J. Deckers and B.
Govaerts. 2011. Soil water content, maize yield and its stability as affected by tillage
and crop residue management in rainfed semi arid highlands. Plant and Soil, 124: 347
356.
136

Vivanco, J.M., H.P. Bais, F.R. Stermitz, G.C. Thelen and R.M. Callaway. 2004.
Biogeographical variation in community response to root allelochemistry: novel
weapons and exotic invasion. Ecol. Letters, 7: 285-292.
Vomocil, J.A. 1965. Porosity. In Methods of Soil Analysis. Blake CA (ed). American Society
of Agronomy, Madison, WI, USA; 299-314.
Walkley, A. and I.A. Black. 1934. An examination of Degtjareff method for determining soil
organic matter and a proposed modification of the chromic acid titration method. Soil
Scie. 37: 29-38.
Warwick, S.I. 2011. Brassicaceae in agriculture. In: Schmidt R, Bancroft I (eds) Genetics and
genomics of the Brassicaceae. Plant genetics and genomics: crops and models, vol 9.
Springer, New York, pp 33-65.
Weston, L.A. 2012. Mechanisms for cellular transport and release of allelochemicals from
plant roots into the rhizosphere. J. Exper. Bot., 63: 3445-3454.
Weston, L.A. and M.A. Czarnota. 2001. Activity and persistence of sorgoleone, a long chain
hydroquinone produced by Sorghum bicolor, pp. 363-377, in R. Kohli et al. (eds.),
Allelopathy and Agroecosystems. The Hayworth Press, London.
Weston, L.A., I.S. Alsaadawi and S.R. Baerson. 2013. Sorghum allelopathy from ecosystem
to molecule. J. Chem. Ecol., 39: 142-153.
Willis, R.J. 1985. The historical bases of the concept of allelopathy. J. Hist. Biol., 18: 71-
102.
Wilson, R.E. and E.L. Rice. 1968. Allelopathy as expressed by Helianthus annuus L., and its
role in old field succession. Bull. Torrey Bot. Club., 95: 432-448.
World Resources Institute. Creating a sustainable food future. Report 2013-2014: Interim
Findings; World Resources Institute: Washington, DC, USA, 2014.
Worsham, A.D. 1984. Crop residues kill weeds. Allelopathy at work with wheat and rye.
Crops and Soils Magazie, 37: 19-20.
Worthington, M. and S.C. Reberg Horton. 2013. Breeding cereal crops for enhanced weed
suppression: optimizing allelopathy and competitive ability. J. Chem. Ecol., 39: 213-
231.
137

Wu, G., T. Yao, L.G. Thompson and Z. Li. 2004. Microparticle record in the Guliya ice core
and its comparison with polar records since the last interglacial, Chin. Sci. Bull., 49:
607-611.
Xuan, T.D., T. Shinkichi, T.D. Khanh and I.M. Chung. 2005. Biological control of weeds
and plant pathogens in paddy rice by exploiting plant allelopathy: An overview. Crop
Protec., 24: 197-206.
Younesabadi, M. 2005. Study of allelopathic interference of rapeseed (Brassica napus var.
belinda) on germination and growth of cotton (Gossypium hirsutum) and it’s
dominant weeds. In: Proceedings, IV World Allelopathy Congress ‘Establishing the
Scientific Base’ (Eds., J.D. Harper, M. Anand and J.H. Kent). Pp. 283-286. Charles
Sturt University, Wagga Wagga. Regional Institute, Goford, Australia.
Yu, J.Q., S.F. Ye, M.F. Zhang and W.H. Hu. 2006. Effects of root exudates, aqueous root
extracts of cucumber (Cucumis sativus L.) and allelochemicals on photosynthesis and
antioxidant enzymes in cucumber. Biochem. System. Ecol., 31: 129-139.
Zaji, B. and A. Majd. 2011. Allelopathic potential of canola (Brassica napus L.) residues on
weed suppression and yield response of maize (Zea mays L.), in international
conference on chemical, ecology and environmental sciences (IICCEES), Pattaya,
Thailand; pp. 457-460.
Zaji, B., A. Shirkhani and S. Alaee. 2009. Study the allelopathic effects of canola varieties in
different concentrations on germination characteristics of some weeds. Iran J. Plant
Ecosys., 19: 27-40.
Zhang, D., J. Zhang, W. Yang and F. Wu. 2010. Potential allelopathic effect of Eucalyptus
grandis across a range of plantation ages. Ecol. Res., 25: 13-23.
Zhang, S.X., Z.Q. Gao and H.L. Liu. 2000. Continuous cropping obstacle and rhizospheric
microecology. Soil phenolic acids and their biological effect. Chinese J. App. Ecol.,
11: 741-744.
Zhou, J., D. Xu, and C. Xue. 2002. Study of comprehensive utilization efficiency of returning
rice straw to field. Chinese Agric. Sci. Bullitin, 4: 003.
Zhung, M., B. Ling, C. Kong, G. Liang and Y. Dong. 2005. Allelopathic effect of lantana
(Lantana camera L.) on water hyacinth (Eichornea crasspes. solum). Allelopathy J.,
15: 125-130.
138


![THE HIGH COURT COMMERCIAL [2019 No. 9399 P] BETWEEN ...](https://static.fdocuments.net/doc/165x107/62ddf47923709554753ace5e/the-high-court-commercial-2019-no-9399-p-between-.jpg)