PROVINCIAL COMMUNITY PROFILE SURVEY EASTERN CAPE...
156
COMMUNITY SURVEY 2016 Stats SA @statssa www.statssa.gov.za THE SOUTH AFRICA I KNOW, THE HOME I UNDERSTAND Report 03-01-08 PROVINCIAL EASTERN CAPE PROFILE
Transcript of PROVINCIAL COMMUNITY PROFILE SURVEY EASTERN CAPE...

COMMUNITY
S U R V E Y
2016
Stats SA @statssawww.statssa.gov.za
THE SOUTH AFRICA I KNOW, THE HOME I UNDERSTAND
Report 03-01-08
PROVINCIAL
EASTERN CAPE
PROFILE
www.statssa.gov.za
T +27 12 310 8911
F +27 12 310 8500
Private Bag X44, Pretoria, 0001, South Africa
ISIbalo House, Koch Street, Salvokop, Pretoria, 0002
Provincial profile: Eastern Cape Community Survey 2016
Report 03-01-08
STATISTICS SOUTH AFRICA i Report number 03-01-08
Provincial profile: Eastern Cape [Community Survey 2016], Report 03-01-08
Provincial profile: Eastern Cape / Statistics South Africa
Published by Statistics South Africa, Private Bag X44, Pretoria, 0001
© Statistics South Africa, 2018
Users may apply or process this data, provided Statistics South Africa (Stats SA) is acknowledged
as the original source of the data; that it is specified that the application and/or analysis is the result
of the user's independent processing of the data; and that neither the basic data nor any
reprocessed version or application thereof may be sold or offered for sale in any form whatsoever
without prior permission from Stats SA.
Stats SA Library Cataloguing-in-Publication (CIP) Data
Provincial profile: Eastern Cape / Statistics South Africa, Pretoria: Statistics South Africa, 2018
Report number 03-01-08
155pp
ISBN: 978-0-621-44980-8
A complete set of Stats SA publications is available at Stats SA Library and the following libraries:
National Library of South Africa, Pretoria Division
National Library of South Africa, Cape Town Division
Library of Parliament, Cape Town
Bloemfontein Public Library
Natal Society Library, Pietermaritzburg
Johannesburg Public Library
Eastern Cape Library Services, King William's Town
Central Regional Library, Polokwane
Central Reference Library, Mbombela
Central Reference Collection, Kimberley
Central Reference Library, Mmabatho
This report is available on the Stats SA website: www.statssa.gov.za
For technical enquiries, please contact:
Eastern Cape Provincial Office
Nonzukiso Stemela
East London Provincial Office
Tel.: 043 707 4953
Email: [email protected]
Nompucuko Sigwela
East London Provincial Office
Tel.: 043 707 4913
Email: [email protected]
STATISTICS SOUTH AFRICA ii Report number 03-01-08
Provincial profile: Eastern Cape [Community Survey 2016], Report 03-01-08
PREFACE
This report forms part of a series of publications generated from the recently conducted
Community Survey (CS) 2016. It is the second volume following one based on Census 2011. The
report has been compiled for each of the nine provinces to profile the uniqueness of each province
in terms of population dynamics, socio-economic development as well as progress in addressing
challenges relating to access to basic services rendered in the provinces.
The report provides statistics disaggregated at municipal level based on the 2016 municipal
boundaries. All indicators where CS 2016 data has been compared with Census 2011, data for the
latter were aligned to the 2016 municipal boundaries. The publication profiles various themes,
including population demographics, education, disability prevalence, parental survival status,
access to basic services and how households rate services, food security, crime and safety.
Risenga Maluleke Statistician-General
STATISTICS SOUTH AFRICA iii Report number 03-01-08
Provincial profile: Eastern Cape [Community Survey 2016], Report 03-01-08
CONTENTS
PREFACE ....................................................................................................................................... ii
LIST OF TABLES ........................................................................................................................... v
LIST OF FIGURES ........................................................................................................................ vii
LIST OF MAPS ............................................................................................................................ viii
Chapter 1: Introduction ................................................................................................................ 1
1.1 Introduction ........................................................................................................................... 1
1.2 Community Survey 2016 background ................................................................................... 1
1.2.1 Geography frame ............................................................................................................ 3
1.2.2 Community Survey 2016 sampling methodology ............................................................ 3
1.2.3 Questionnaire development processes for CS 2016 ....................................................... 3
1.2.4 Survey Coordination, Monitoring and Evaluation (SCM&E) ............................................ 4
1.2.5 Data editing .................................................................................................................... 5
1.2.6 Boundary changes .......................................................................................................... 5
Chapter 2: Population characteristics ........................................................................................ 7
2.1 Population size...................................................................................................................... 7
2.2 Age and sex structure ..........................................................................................................11
2.3 Marital status .......................................................................................................................16
2.4 Language .............................................................................................................................18
2.5 Religion ................................................................................................................................18
Chapter 3: Migration ....................................................................................................................20
3.1 Internal migration .................................................................................................................20
3.2 International migration ..........................................................................................................25
Chapter 4: General health and functioning................................................................................27
4.1 Health and functional domains .............................................................................................27
4.2 Disability prevalence ............................................................................................................29
Chapter 5: Parental survival .......................................................................................................32
5.1 Orphanhood .........................................................................................................................32
Chapter 6: Education ..................................................................................................................33
6.1 Early childhood development ...............................................................................................33
6.2 Educational attendance ........................................................................................................34
6.3 Type of educational institution ..............................................................................................35
6.4 Level of education ................................................................................................................36
Chapter 7: Fertility .......................................................................................................................40
7.1 Births in the last 12 months ..................................................................................................40
7.2 Breastfeeding practices ........................................................................................................41
Chapter 8: Household characteristics and access to services ................................................42
8.1 Introduction ..........................................................................................................................42
8.2 Household size ....................................................................................................................42

STATISTICS SOUTH AFRICA iv Report number 03-01-08
Provincial profile: Eastern Cape [Community Survey 2016], Report 03-01-08
8.3 Household headship ............................................................................................................45
8.4 Housing................................................................................................................................47
8.4.1 Type of dwelling ................................................................................................................47
8.4.2 RDP or government-subsidised dwellings .........................................................................48
8.5 Access to water ....................................................................................................................51
8.6 Toilet facility .........................................................................................................................56
8.7 Access to electricity .............................................................................................................59
8.8 Refuse removal ....................................................................................................................62
8.9 Energy sources ....................................................................................................................63
8.10 Household goods ...............................................................................................................66
8.11 Internet services .................................................................................................................67
8.12 Agricultural activities ..........................................................................................................69
8.13 Food security .....................................................................................................................70
8.14 Crime .................................................................................................................................73
8.15 Perceptions of municipal problems and services ................................................................77
8.16 Rating the quality of services .............................................................................................79
Chapter 9: Mortality .....................................................................................................................87
9.1 Household deaths ................................................................................................................87
Appendices ..................................................................................................................................91

STATISTICS SOUTH AFRICA v Report number 03-01-08
Provincial profile: Eastern Cape [Community Survey 2016], Report 03-01-08
LIST OF TABLES
Table 2.1: Population distribution by province, Census 2011 and CS 2016 ....................................................................................................................7
Table 2.2: Population distribution by district municipality and percentage, Census 2011 and CS 2016 .....................................................................8
Table 2.3: Distribution of population by district, municipality and broad age groups, CS 2016 ................................................................................. 12
Table 2.4: Distribution of population by 5-year age groups and sex, CS 2016 ............................................................................................................. 14
Table 2.5: Distribution of population by population group and district municipality, CS 2016 .................................................................................... 15
Table 2.6: Distribution of population aged 18 years and older by marital status and sex, Eastern Cape, CS 2016 ............................................... 16
Table 2.7: Distribution of population aged 18 years and older by marital status and district, CS 2016 .................................................................... 17
Table 2.8: Distribution of persons aged 1 year and older by language spoken at home, Census 2011 and CS 2016 .......................................... 18
Table 2.9a: Distribution of population by religious affiliation, CS 2016 .......................................................................................................................... 19
Table 2.9b: Distribution of population by Christian denomination, CS 2016 ................................................................................................................. 19
Table 3.1: Place of usual residence of Eastern Cape-born population, CS 2016 ........................................................................................................ 20
Table 3.2: Reasons for moving from previous place of residence by province, CS 2016 ........................................................................................... 21
Table 3.3a: Reasons for moving from previous place of residence by district (numbers), CS 2016 ......................................................................... 23
Table 3.3b: Reasons for moving from previous place of residence by district (percentage), CS 2016 .................................................................... 24
Table 3.4: Distribution of persons born outside South Africa by district and region of birth, CS 2016 ...................................................................... 26
Table 4.1: General health and functioning by functional domain for persons aged 5 years and older, Census 2011 and CS 2016 (1) ............. 28
Table 4.1: General health and functioning by functional domain for persons aged 5 years and older, Census 2011 and CS 2016 (2) ............. 28
Table 4.2: Disability prevalence by district and population group for persons aged 5 years and older, CS 2016 .................................................. 30
Table 4.3: Percentage of population aged 5 years and older by disability status, district, and age group, CS 2016 ............................................. 31
Table 5.1: Distribution of population aged younger than 18 years old by orphanhood status, CS 2016 .................................................................. 32
Table 6.1: Population aged 0–4 years by attendance at an educational institution, CS 2016 ................................................................................... 34
Table 6.2: Type of educational institution attended by district municipality, CS 2016 ................................................................................................. 36
Table 6.3: Percentage distribution of male persons aged 20 years and older by highest level of education, CS 2016 ......................................... 38
Table 6.4: Percentage distribution of female persons aged 20 years and older by highest level of education, CS 2016 ..................................... 39
Table 7.1: Female population and births in the last 12 months preceding the survey, Census 2011 and CS 2016 ............................................... 40
Table 7.2: Women breastfeeding practices by district, municipality and province, CS 2016 ..................................................................................... 41
Table 8.1: Number of households and average household size by district municipality, Census 2011 and CS 2016 ........................................... 42
Table 8.2: Distribution of households by the number of household members and municipality ................................................................................ 44

STATISTICS SOUTH AFRICA vi Report number 03-01-08
Provincial profile: Eastern Cape [Community Survey 2016], Report 03-01-08
Table 8.3: Distribution of households by sex of household head and district municipality, Census 2011 and CS 2016 ....................................... 45
Table 8.4: Distribution of households by age group of household head and district municipality, CS 2016 ............................................................ 46
Table 8.5: Distribution of households by type of main dwelling and districts, CS 2016 .............................................................................................. 48
Table 8.6: Distribution of households in RDP/government-subsidised dwellings by district municipalities, CS 2016 ............................................ 49
Table 8.7: Distribution of households by access to safe drinking water and district municipality, CS 2016 ............................................................ 51
Table 8.8: Distribution of households by main source of water for drinking, CS 2016 ................................................................................................ 52
Table 8.9: Distribution of households by main source of drinking water supplier, CS 2016 ....................................................................................... 55
Table 8.10: Distribution of households by water interruptions in the last 3 months, CS 2016 ................................................................................... 56
Table 8.11: Distribution of households by location of toilet facility for Eastern Cape districts, CS 2016 .................................................................. 56
Table 8.12: Distribution of households by type of toilet facility for Eastern Cape districts, CS 2016 ........................................................................ 57
Table 8.13: Distribution of households by main type of electric energy source, CS 2016 .......................................................................................... 59
Table 8.14: Distribution of households by supplier of electricity, CS 2016 .................................................................................................................... 61
Table 8.15: Distribution of households by refuse removal and municipality, CS 2016 ................................................................................................ 62
Table 8.16a: Distribution of households by source of energy for lighting, Eastern Cape, CS 2016 .......................................................................... 63
Table 8.16b: Distribution of households by source of energy for cooking, Eastern Cape, CS 2016 ......................................................................... 64
Table 8.16c: Distribution of households by source of energy for water heating, Eastern Cape, CS 2016 ............................................................... 65
Table 8.17: Distribution of households by access to internet services and district, CS 2016..................................................................................... 67
Table 8.18: Distribution of households by agricultural activities, CS 2016 .................................................................................................................... 69
Table 8.19: Distribution of households involved in agricultural activities by type of agricultural activities and district municipalities, CS 2016. 69
Table 8.20: Distribution of households that ran out of money to buy food in the last 12 months preceding the survey by province, CS 2016 . 70
Table 8.21: Distribution of households that ran out of money to buy food in the last 12 months by district municipalities, CS 2016 .................. 71
Table 8.22: Distribution of households that skipped a meal in the last 12 months by municipalities, CS 2016 ...................................................... 71
Table 8.23: Distribution of households by crime experienced in the last 12 months by municipalities, CS 2016 ................................................... 73
Table 8.24: Extent to which household agrees that municipality is trying to solve the problem by district, CS 2016 ............................................. 78
Table 9.1: Distribution of households by whether death occurred in the last 12 months by province, CS 2016 ..................................................... 87
Table 9.2: Distribution of households by whether death occurred in the last 12 months by districts and municipalities, CS 2016 ...................... 87
Table 9.3: Number of deaths per households that experienced death in the last 12 months by province, CS 2016 ............................................. 88
Table 9.4: Number of deaths per household that experienced death in the last 12 months by districts and metros, CS 2016 ............................ 89

STATISTICS SOUTH AFRICA vii Report number 03-01-08
Provincial profile: Eastern Cape [Community Survey 2016], Report 03-01-08
LIST OF FIGURES
Figure 2.1: Annual growth rate by province, Census 2011 and CS 2016 .........................................................................................................................8
Figure 2.2: Percentage distribution of population by sex, Census 2011 and CS 2016 ..................................................................................................9
Figure 2.3: Percentage distribution of population by age group, Census 2011 and CS 2016 .................................................................................... 11
Figure 2.4: Percentage distribution of population by broad age groups, Census 2011 and CS 2016 ...................................................................... 12
Figure 2.5: Age and sex structure, Eastern Cape, Census 2011 (shaded) and CS 2016 .......................................................................................... 13
Figure 3.2: Persons born outside South Africa by province of enumeration, CS 2016 ............................................................................................... 25
Figure 6.1: Population aged 5–24 years attending an educational institution, Eastern Cape, Census 2011 and CS 2016 .................................. 34
Figure 6.2: Population aged 5–24 years attending an educational institution, Census 2011 and CS 2016............................................................. 35
Figure 6.3: Distribution of the population aged 20 years and older by level of education for Eastern Cape and South Africa, CS 2016 ........... 37
Figure 8.1: Percentage distribution of households by type of main dwelling, Census 2011 and CS 2016 .............................................................. 47
Figure 8.2: Percentage distribution of households with RDP/government-subsidised dwellings in South Africa, CS 2016 .................................. 48
Figure 8.3: Household rating of RDP/government-subsidised dwellings by municipality, CS 2016 .......................................................................... 50
Figure 8.4: Ownership of selected household goods ........................................................................................................................................................ 66
Figure 8.5: Distribution of households’ perception of safety when walking alone during the day, CS 2016 ............................................................ 75
Figure: 8.6: Distribution of households by perception of safety when walking alone when it is dark, CS 2016 ...................................................... 76
Figure 8.7: Five leading problems/challenges faced by the municipality in Eastern Cape, CS 2016 ....................................................................... 77
Figure 8.8: Percentage distribution of households by rating of the overall quality of water services by districts, CS 2016 .................................. 79
Figure 8.9: Percentage distribution of households by rating of the overall quality of refuse removal services by districts, CS 2016 .................. 80
Figure 8.10: Percentage distribution of households by rating of the overall quality of electricity supply services by districts, CS 2016 ............. 81
Figure 8.11: Percentage distribution of households by rating of the overall quality of toilet/sanitation services by districts, CS 2016 ............... 82
Figure 8.12: Percentage distribution of households by rating of the overall quality of local public hospital by districts, CS 2016 ....................... 83
Figure 8.13: Percentage distribution of households by rating of the overall quality of public clinic by districts, CS 2016 ..................................... 84
Figure 8.14: Percentage distribution of households by rating of the overall quality of local police services by districts, CS 2016 ...................... 85
Figure 8.15: Percentage distribution of households by rating of the overall quality of public school by districts, CS 2016 ................................... 86

STATISTICS SOUTH AFRICA viii Report number 03-01-08
Provincial profile: Eastern Cape [Community Survey 2016], Report 03-01-08
LIST OF MAPS
Map 1.1: Boundary changes in Eastern Cape, new 2016 demarcations ..........................................................................................................................6
Map 2.1: Distribution of the population by municipality, CS 2016 ................................................................................................................................... 10
Map 8.1: Distribution of households by municipality, CS 2016 ....................................................................................................................................... 43
Map 8.2: Percentage of households with access to piped water by municipality, CS 2016 ....................................................................................... 54
Map 8.3: Percentage of households with access to flush/chemical toilet by local municipality, CS 2016 ................................................................ 58
Map 8.4: Percentage of households with access to electricity by local municipality, Eastern Cape, CS 2016 ....................................................... 60
Map 8.5: Percentage of households by access to internet services and local municipality, CS 2016 ...................................................................... 68
Map 8.6: Percentage of households that skipped a meal in the last 12 months by municipality, CS 2016 ............................................................. 71
Map 8.7: Percentage of households that experienced crime in the last 12 months by municipalities, CS 2016 ..................................................... 74
Map 9.1: Households that experienced death in the last 12 months preceding the survey by local municipality ................................................... 90

STATISTICS SOUTH AFRICA 1 Report number 03-01-08
Provincial profile: Eastern Cape [Community Survey 2016], Report 03-01-08
Chapter 1: Introduction
1.1 Introduction
The Eastern Cape is a province in the eastern part of South Africa. The province borders three
South African provinces (KwaZulu-Natal, Free State and Western Cape), and also borders
Lesotho. The province is predominantly populated by black Africans, with the most widely spoken
language being isiXhosa. Overall, the province is the third most populous province in the country.
The province is mostly rural and is among the country’s poorest provinces. Moreover, the province
houses two of the country’s eight metropolitan municipalities (Buffalo City and Nelson Mandela
Bay). One of the districts in the province, Cacadu, has been renamed on the new demarcations as
Sarah Baartman District Municipality.
1.2 Community Survey 2016 background
Community Survey 2016 (CS 2016) is the second intercensal survey in democratic South Africa.
This household-based survey is one of the few available data sources providing data at municipal
level. Provision of data at this level supports evidence-based decision-making that has become
increasingly a best practice that many countries, including South Africa, embrace. CS 2016 results
are thus critical in promoting optimal resource allocation and utilisation in all spheres of
government in order to reduce poverty and vulnerability among South Africa’s most marginalised.
Secondly, the development and implementation of policy, and the implementation of legislature
deem it necessary to have reliable statistics that inform the social, demographic and economic
standing of the country.
CS 2016 is the second large sample survey that Statistics South Africa (Stats SA) has undertaken
after CS 2007, but this time around, the data were collected electronically using the Computer-
Assisted Personal Interviewing (CAPI) system as opposed to the paper collection method used in
CS 2007. The new initiative in the organisation is expected to reduce financial and time costs in
data processing and to enhance data quality. Eligible persons for enumeration are all persons
present in the household(s) of the sampled dwelling units on the reference night (midnight 6 March
2016 to 7 March 2016), including visitors. Members of the household who were absent overnight,
for example, working, travelling, at entertainment or religious gatherings but who returned the next
day were also counted. For the purposes of Stats SA surveys, a household is a group of persons
who live together, and provide for themselves jointly with food and other essentials for living, or a
person who lives alone. Babies born before the reference night were also included in the count, the
reason being that they were already born by midnight of 6 March to 7 March 2016. Members of the

STATISTICS SOUTH AFRICA 2 Report number 03-01-08
Provincial profile: Eastern Cape [Community Survey 2016], Report 03-01-08
household who died after the reference night were also counted in, as they were alive during the
midnight of the reference period. In contrast, those born after the reference night were excluded.
The use of the CAPI system is not the only new process used; others include utilisation of the
present updated dwelling frame data captured from the Census 2011 listing process. Newly
incorporated data covered in the CS questionnaire include:
Main religious affiliation
Main reason for leaving the country
Mode of transport used to reach the person’s destination for going to school or work and
time taken to reach the destination
Main challenges/problems/difficulties facing a municipality
Quality and satisfaction with provision of basic services
Opinion on improving standards of living in households
Sources of income
Year of death of mother and/or father if reported deceased
Perceptions of safety and crime experienced in households
Food security measures
Extended additional questions on agricultural activities performed by households
Characteristics of emigrants (persons who left the country to live elsewhere)
This chapter highlights the planning processes for CS 2016. During the planning phase, the focus
in the early stages was primarily on setting strategic directions and ensuring that all dependencies
between the different phases and role players were identified, potential risks identified and control
measures put in place to minimise their adverse effects. This facilitated effective integration and
implementation of various activities by ensuring that each phase was properly resourced. During
the planning phase, all work streams and focus areas prepared operational plans that provided
detailed lists of activities that were to be undertaken to achieve specific objectives and outputs as
profiled in the CS 2016 Project Charter.
STATISTICS SOUTH AFRICA 3 Report number 03-01-08
Provincial profile: Eastern Cape [Community Survey 2016], Report 03-01-08
1.2.1 Geography frame
The dwelling frame (DF) is a structures frame, and dwelling units (DUs) form part of the feature
classification of structures. Datasets in the integrated DF base layer include the dwelling frame
2011 (formal and informal), Listing Census 2011, Spot Building Count 2012, address assignments
and municipal data. Worth mentioning is the fact that the use of the existing updated dwelling
frame for a large sample survey such as CS 2016 is the first of its kind in line with other first-time
data collection processes in the case of Stats SA. It is also accepted that ongoing improvement is
expected as it is not that perfect at this stage.
1.2.2 Community Survey 2016 sampling methodology
The sample design for CS 2016 was a stratified single stage sample design. At enumeration area
(EA) level, all in-scope EAs were included in the sample and a sample of dwelling units was taken
within each EA (i.e. there was no subsampling of EAs). The EA frame was based on the Census
2011 information. The updated dwelling unit (DU) frame was constructed by the Geography
Division, using geo-referenced spatial systems.
1.2.3 Questionnaire development processes for CS 2016
The development and design processes of the CS 2016 questionnaire were informed by national
priorities, global and continental emerging population issues embedded in the Sustainable
Development Goals (SDGs), data needs of both existing and prospective users, and comparability
with the previous community survey (i.e. CS 2007) and censuses. The development of the CS
questionnaire involved a number of phases as mentioned below:
Stakeholder needs assessment is an international best practice in survey and census
planning aimed at producing products that meet user needs. Stakeholders play a
fundamental role in providing information on questions to be asked in a survey. During this
phase, processes (including review of data items and questionnaires of previous censuses)
were undertaken, and user consultations were held with key internal stakeholders on what
needed to be measured in CS 2016.
Through the consultation process, it became clear that there is an increased demand for
data at municipal level. Following the consultation process, Community Survey data items
were then finalised and categorised into broader themes of demographics, migration,
general health and functioning, parental survival, education, income and social grants,
employment, fertility, mortality, housing conditions, and access to and quality of basic
service provision.

STATISTICS SOUTH AFRICA 4 Report number 03-01-08
Provincial profile: Eastern Cape [Community Survey 2016], Report 03-01-08
The Community Survey 2016 questionnaire was designed using the World Bank Survey Solutions
system, which is an online-based questionnaire design application. During the design, skipping
patterns and validation rules were predetermined and embedded in the electronic questionnaire.
Data collection instruments – questionnaires in particular – were developed and subjected to
thorough testing and review processes to ensure that the final product (questionnaire) solicits
accurate information. This Community Survey 2016 questionnaire consists of new questions while
some other questions have been adopted from existing household-based surveys and Census
2011. Two-stage testing was adopted for CS 2016, which incorporated ‘Behind-the-glass’ testing
and field-testing. The results of each test were used to improve the quality of the draft questions
and CS 2016 indicators. Thereafter the draft CS questionnaire was presented at different forums
for approval. These included the CS Technical Committee, Questionnaire Clearance Committee,
CS Management, Population & Social Statistics Cluster, Statistics Council Population
Subcommittee, and the Statistics Council.
1.2.4 Survey Coordination, Monitoring and Evaluation (SCM&E)
The Survey Coordination, Monitoring and Evaluation (SCM&E) Division in the Survey Operations
Cluster is responsible for the monitoring and evaluation of the quality aspects of all population and
household-based survey processes in the Survey Operations and Population and Social Statistics
clusters. As part of the enhancement of quality, the SCM&E division monitored CS 2016 field
operations in all provinces. The objectives of the CS 2016 monitoring included conducting quality
checks on the collected data, conducting verification on in- and out-of-scope cases, and monitoring
any other issues that can have impacts on data quality, with the purpose of compiling lessons
learnt. For the purpose of the study, monitors also used the tablets to conduct the monitoring
activities. Their tablets were loaded with Observation, Questionnaire Quality Check, Out-of-scope
Verification and Control Visit forms.
A total of 7 184 questionnaires were checked in the entire data collection period, and 5 376
(74,8%) errors were identified. During the interview observations, 1 852 observations and 3 501
control visits were conducted while a total of 7 870 points were verified and 3 787 DUs were in
agreement while 4 083 were not out of scope.
Intensive training was required during the use of technology, from the questionnaire, navigation
system and CAPI. In addition, the administration of the Dwelling Unit Record Form (DURF) in a
point needed close monitoring because in instances where there is growth or shrinkage,
fieldworkers (FWs) might decide to leave the DUs unlisted to avoid more workload. Intensive and

STATISTICS SOUTH AFRICA 5 Report number 03-01-08
Provincial profile: Eastern Cape [Community Survey 2016], Report 03-01-08
continuous training on the use of DURF was encouraged. Fieldwork supervisors (FWSs) and
district survey coordinators (DSCs) were encouraged to take more responsibility of observing the
FWs, especially during the first two weeks of data collection. DSCs were also urged to conduct
immediate and continuous quality checks and identify the non-response cases which would then
immediately be verified by the FWSs.
1.2.5 Data editing
Quality assurance in CS 2016 was largely automated and handled in two phases. The first phase
of quality assurance involved the electronic questionnaire being subjected to conditions and
validation rules. This process eliminated unnecessary inconsistencies in the data during data
collection. An additional automated quality assurance process was used during data collection
where completed questionnaires were flagged as REJECTED or ACCEPTED based on minimum
processability rules. Any questionnaires submitted to the database that did not meet the set
minimum rules were marked as REJECTED, and sent back to the fieldworker for verification and
correction. The fieldwork supervisors were involved in taking note of the flagged questionnaires
and assist the fieldworker in correcting the mistakes accordingly. For any record marked as
REJECTED once, the running of the rejection was done at least for four different times and at
different dates. This was necessary for the fieldworker to try and correct mistakes before a
particular questionnaire could be declared “Complete”. This process contributed tremendously in
reducing missing values on a number of questions.
1.2.6 Boundary changes
A number of changes occurred in terms of municipal boundaries during the period between
Census 2011 and CS 2016. Eastern Cape was affected by 2016 boundary changes in the
following district municipalities: Sarah Baartman, previously known as Cacadu, Joe Gqabi and
Amathole district municipalities. Under Sarah Baartman District Municipality, Baviaans and Kwezi
were merged into Camdeboo Local Municipality and renamed Dr Beyers Naudé Local Municipality.
Walter Sisulu Local Municipality was established by the amalgamation of Gariep and Maletswai
local municipalities under Joe Gqabi district. Enoch Mgijima Local Municipality was also
established by the amalgamation of Tsolwana, Inkwanca and Lukhanji local municipalities under
Chris Hani District Municipality. Nkonkobe and Nxuba local municipalities were merged into
Raymond Mhlaba Local Municipality under Amathole district. Map 1.1 shows the highlighted
changes.

STATISTICS SOUTH AFRICA 6 Report number 03-01-08
Provincial profile: Eastern Cape [Community Survey 2016], Report 03-01-08
Map 1.1: Boundary changes in Eastern Cape, new 2016 demarcations

STATISTICS SOUTH AFRICA 7 Report number 03-01-08
Provincial profile: Eastern Cape [Community Survey 2016], Report 03-01-08
Chapter 2: Population characteristics
This chapter looks into the population-related characteristics of persons in the Eastern Cape.
Where possible, inter-provincial comparisons are made in order to highlight how this province fares
when compared to other provinces with regard to certain indicators. Therefore, the aim of this
chapter is to provide a descriptive analysis of the Eastern Cape province using the Community
Survey (CS) 2016 and Census 2011 (where possible) datasets. Please note that the 2016
boundaries have come with certain changes in the names of some district and local municipality
names. For instance, Cacadu District Municipality was renamed as Sarah Baartman District
Municipality, and Camdeboo Local Municipality was renamed as Dr Beyers Naudé Local
Municipality.
2.1 Population size
The Eastern Cape population has shown an increase between 2011 and 2016 (Table 2.1). The
results show that the population percentage change for South Africa was 7,5% between the two
periods and Gauteng had the biggest share of the population. In Eastern Cape province, the total
population increased by about 434 923 people (from 6,6 million to almost 7 million people over the
same period). This increase constituted of a percentage change of 6,6 %.
Table 2.1: Population distribution by province, Census 2011 and CS 2016
Province Census 2011 CS 2016 Per cent change
Western Cape 5 822 734 6 279 730 7,8
Eastern Cape 6 562 053 6 996 976 6,6
Northern Cape 1 145 861 1 193 780 4,2
Free State 2 745 590 2 834 714 3,2
KwaZulu-Natal 10 267 300 11 065 240 7,8
North West 3 509 953 3 748 435 6,8
Gauteng 12 272 263 13 399 724 9,2
Mpumalanga 4 039 939 4 335 964 7,3
Limpopo 5 404 868 5 799 090 7,3
South Africa 51 770 561 55 653 654 7,5
Source: Statistics South Africa, Census 2011 and Community Survey 2016.
Table 2.2 shows the population of the Eastern Cape by district municipality. The most populous
district municipalities in 2016 were O.R. Tambo and Nelson Mandela Bay. The highest percentage
change in the population was found in Nelson Mandela Bay district (9,6%), followed by Alfred Nzo
district (8,3%). On the other hand, Amathole district (2,9%) had the lowest percentage chane in the
population.

STATISTICS SOUTH AFRICA 8 Report number 03-01-08
Provincial profile: Eastern Cape [Community Survey 2016], Report 03-01-08
Table 2.2: Population distribution by district municipality and percentage, Census 2011 and CS 2016
Province/district/local municipality Total population
Percentage change Census 2011 CS 2016
DC10: Sarah Baartman 450 584 479 923 6,5
DC12: Amathole 855 793 880 790 2,9
DC13: Chris Hani 806 478 840 055 4,2
DC14: Joe Gqabi 348 667 372 912 7,0
DC15: O.R. Tambo 1 366 045 1 457 384 6,7
DC44: Alfred Nzo 801 344 867 864 8,3
BUF: Buffalo City 781 027 834 997 6,9
NMA: Nelson Mandela Bay 1 152 115 1 263 051 9,6
Eastern Cape 6 562 053 6 996 976 6,6
Source: Statistics South Africa, Census 2011 and Community Survey 2016. Note: ‘Local municipalities’ are attached in appendix in Table 1.
Figure 2.1 shows the average annual growth rate between Census 2011 and CS 2016. At national
level, the population grew at a rate of 1,6%. Eastern Cape had an average annual growth rate of
1,5% between the two periods, a growth, slightly below the national growth rate.
Figure 2.1: Annual growth rate by province, Census 2011 and CS 2016
Source: Statistics South Africa, Community Survey 2016.
Figure 2.2 shows that the Eastern Cape has seen a slight increase in the proportion of the male
population, while there has been a slight decrease in the female population. The same trend can
be observed when looking at the national profile.
1.7
1.5
0.9
0.7
1.7
1.5
2.0
1.6 1.6 1.6
0.0
0.5
1.0
1.5
2.0
2.5
%
Province

STATISTICS SOUTH AFRICA 9 Report number 03-01-08
Provincial profile: Eastern Cape [Community Survey 2016], Report 03-01-08
Figure 2.2: Percentage distribution of population by sex, Census 2011 and CS 2016
Source: Statistics South Africa, Census 2011 and Community Survey 2016. Note: ‘Local municipalities’ are attached in appendix in Table 2.
Map 2.1 shows the population of the Eastern Cape by municipality; the most populous
municipalities in 2016 were the two metropolitan areas (Buffalo City and Nelson Mandela Bay).
Males Females Males Females
Census 2011 CS 2016
Eastern Cape 47.1 52.9 47.6 52.4
South Africa 48.7 51.3 49.0 51.0
44
45
46
47
48
49
50
51
52
53
54
%

STATISTICS SOUTH AFRICA 10 Report number 03-01-08
Provincial profile: Eastern Cape [Community Survey 2016], Report 03-01-08
Map 2.1: Distribution of the population by municipality, CS 2016

STATISTICS SOUTH AFRICA 11 Report number 03-01-08
Provincial profile: Eastern Cape [Community Survey 2016], Report 03-01-08
2.2 Age and sex structure
Figure 2.3 shows that there has been an increase in the young1 population within the province
between 2011 and 2016. However, for 2016, the population aged 35 years and older showed a
decline when compared to Census 2011.
Figure 2.3: Percentage distribution of population by age group, Census 2011 and CS 2016
Source: Statistics South Africa, Census 2011 and Community Survey 2016. Note: ‘Local municipalities’ are attached in appendix in Table 3.
When looking at the broad age groups (Figure 2.4), the majority of the population falls within the
15–34 years age group. The elderly (i.e. persons aged 65 years and older) constituted a small
percentage of the Eastern Cape population (8,1% in CS 2016 and 6,7% in Census 2011). Children
aged 0–14 years constitute more than a third of the population within the province (35,1% in CS
2016).
1 This includes: children (aged 0–14) and youth (aged 15–34).
0
2
4
6
8
10
12
14
00
-04
05
-09
10
-14
15
-19
20
-24
25
-29
30
-34
35
-39
40
-44
45
-49
50
-54
55
-59
60
-64
65
-69
70
-74
75
-79
80
-84
85
+
%
Age group
Census 2011 CS 2016

STATISTICS SOUTH AFRICA 12 Report number 03-01-08
Provincial profile: Eastern Cape [Community Survey 2016], Report 03-01-08
Figure 2.4: Percentage distribution of population by broad age groups, Census 2011 and CS 2016
Source: Statistics South Africa, Census 2011 and Community Survey 2016. Note: ‘Local municipalities’ are attached in appendix in table 3.
Table 2.3 shows that when compared to the other districts of Eastern Cape, Alfred Nzo district had
higher percentage of persons aged 0–14 years (39,8%), and the percentage of persons aged 15–
34 years was highest in Amathole compared to other districts. Two district municipalities (Sarah
Baartman and Nelson Mandela Bay) had over 9% of persons aged 65 years and older, while the
O.R. Tambo district had just over 6% of persons aged 65 years and older.
Table 2.3: Distribution of population by district, municipality and broad age groups, CS 2016
District 0 - 14 15 - 34 35 - 64 65 +
Number % Number % Number % Number %
DC10: Sarah Baartman 144 343 30,1 166 980 34,8 122 963 25,6 45 637 9,5
DC12: Amathole 287 986 32,7 371 300 42,2 146 108 16,6 75 397 8,6
DC13: Chris Hani 327 114 38,9 310 488 37,0 129 985 15,5 72 468 8,6
DC14: Joe Gqabi 137 176 36,8 150 369 40,3 57 281 15,4 28 086 7,5
DC15: O.R. Tambo 567 597 39,0 592 517 40,7 202 936 13,9 94 333 6,5
DC44: Alfred Nzo 345 624 39,8 340 753 39,3 113 039 13,0 68 448 7,9
BUF: Buffalo City 263 537 31,6 288 234 34,5 223 958 26,8 59 269 7,1
NMA: Nelson Mandela Bay 386 022 30,6 403 792 32,0 353 428 28,0 119 809 9,5
Eastern Cape 2 459 398 35,15 2 624 433 37,5 1 349 698 19,3 563 447 8,1
Source: Statistics South Africa, Community Survey 2016. Note: ‘Local municipalities’ are attached in appendix in Table 4.
The age–sex structure (Figure 2.5) shows that the province had unchanged proportion for children
aged 0-4 whilst those aged 5-14 increased for both males and females Census 2011 and CS 2016.
The age group 35-69 recorded a decrease. Generally, the province has an expansive population
0 - 14 15 - 34 35 - 64 65 +
Census 2011 33.0 33.9 26.3 6.7
CS 2016 35.1 37.5 19.3 8.1
0
5
10
15
20
25
30
35
40

STATISTICS SOUTH AFRICA 13 Report number 03-01-08
Provincial profile: Eastern Cape [Community Survey 2016], Report 03-01-08
structure,2 as shown by the larger percentages of persons in younger ages. This type of structure
may be characterised by high fertility rates.3
Figure 2.5: Age and sex structure, Eastern Cape, Census 2011 (shaded) and CS 2016
Source: Statistics South Africa, Census 2011 and Community Survey 2016.
Table 2.4 depicts the age–sex differentials within the province. A sex ratio of more than 100
depicts a higher number of males than females, while a number lower than 100 depicts a higher
number of females than males. A number which equals 100 means that there were equally as
many males as females within the population. For Eastern Cape province, the sex ratios show that
at lower ages (0–19 years), there were generally more males than females. Interestingly, from
ages 20 years and older, the sex ratios were lower than 100, depicting excess of females.
2 Expansive population structures are a norm in developing regions. 3 See: http://www.statssa.gov.za/publications/Report-03-01-63/Report-03-01-632011.pdf

STATISTICS SOUTH AFRICA 14 Report number 03-01-08
Provincial profile: Eastern Cape [Community Survey 2016], Report 03-01-08
Table 2.4: Distribution of population by 5-year age groups and sex, CS 2016
Age group Male Female Total Sex ratio
0-4 415 132 400 753 815 885 104
5-9 428 600 419 702 848 302 102
10-14 398 151 397 061 795 212 100
15-19 398 490 391 116 789 607 102
20-24 347 488 352 277 699 765 99
25-29 310 780 312 803 623 584 99
30-34 241 274 270 204 511 477 89
35-39 149 696 173 295 322 991 86
40-44 132 673 159 221 291 894 83
45-49 114 768 150 421 265 189 76
50-54 100 528 137 416 237 945 73
55-59 96 193 135 486 231 679 71
60-64 79 336 111 548 190 884 71
65-69 49 031 92 286 141 317 53
70-74 32 800 67 633 100 433 48
75-79 17 911 47 395 65 306 38
80-84 7 987 26 805 34 792 30
85+ 6 656 24 058 30 715 28
Eastern Cape 3 327 495 3 669 481 6 996 976 91
Source: Statistics South Africa, Community Survey 2016.
STATISTICS SOUTH AFRICA 15 Report number 03-01-08
Provincial profile: Eastern Cape [Community Survey 2016], Report 03-01-08
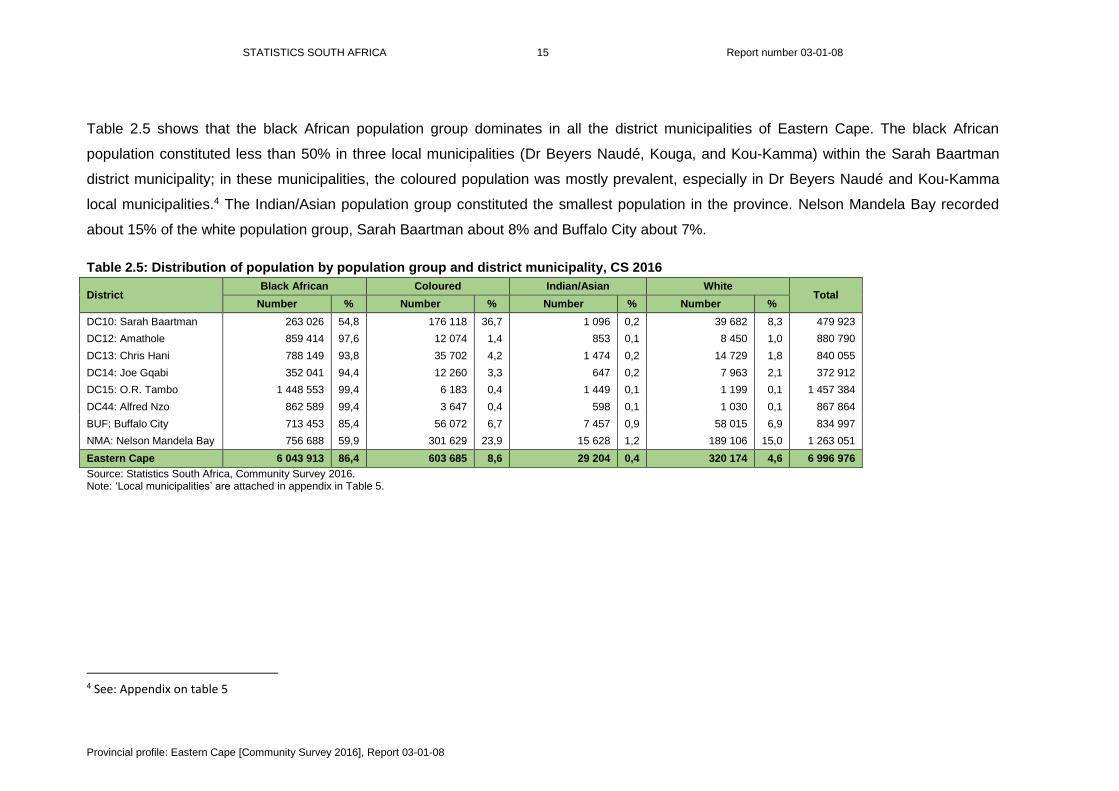
Table 2.5 shows that the black African population group dominates in all the district municipalities of Eastern Cape. The black African
population constituted less than 50% in three local municipalities (Dr Beyers Naudé, Kouga, and Kou-Kamma) within the Sarah Baartman
district municipality; in these municipalities, the coloured population was mostly prevalent, especially in Dr Beyers Naudé and Kou-Kamma
local municipalities.4 The Indian/Asian population group constituted the smallest population in the province. Nelson Mandela Bay recorded
about 15% of the white population group, Sarah Baartman about 8% and Buffalo City about 7%.
Table 2.5: Distribution of population by population group and district municipality, CS 2016
District Black African Coloured Indian/Asian White
Total Number % Number % Number % Number %
DC10: Sarah Baartman 263 026 54,8 176 118 36,7 1 096 0,2 39 682 8,3 479 923
DC12: Amathole 859 414 97,6 12 074 1,4 853 0,1 8 450 1,0 880 790
DC13: Chris Hani 788 149 93,8 35 702 4,2 1 474 0,2 14 729 1,8 840 055
DC14: Joe Gqabi 352 041 94,4 12 260 3,3 647 0,2 7 963 2,1 372 912
DC15: O.R. Tambo 1 448 553 99,4 6 183 0,4 1 449 0,1 1 199 0,1 1 457 384
DC44: Alfred Nzo 862 589 99,4 3 647 0,4 598 0,1 1 030 0,1 867 864
BUF: Buffalo City 713 453 85,4 56 072 6,7 7 457 0,9 58 015 6,9 834 997
NMA: Nelson Mandela Bay 756 688 59,9 301 629 23,9 15 628 1,2 189 106 15,0 1 263 051
Eastern Cape 6 043 913 86,4 603 685 8,6 29 204 0,4 320 174 4,6 6 996 976
Source: Statistics South Africa, Community Survey 2016. Note: ‘Local municipalities’ are attached in appendix in Table 5.
4 See: Appendix on table 5
STATISTICS SOUTH AFRICA 16 Report number 03-01-08
Provincial profile: Eastern Cape [Community Survey 2016], Report 03-01-08
2.3 Marital status
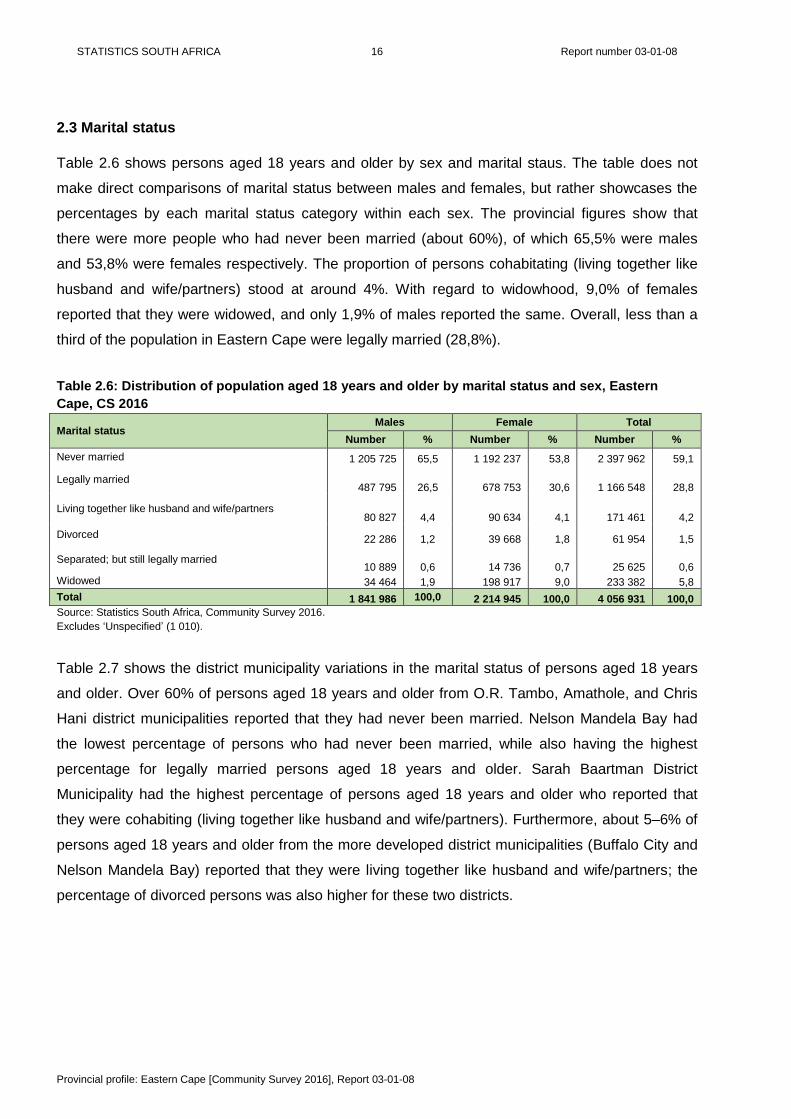
Table 2.6 shows persons aged 18 years and older by sex and marital staus. The table does not
make direct comparisons of marital status between males and females, but rather showcases the
percentages by each marital status category within each sex. The provincial figures show that
there were more people who had never been married (about 60%), of which 65,5% were males
and 53,8% were females respectively. The proportion of persons cohabitating (living together like
husband and wife/partners) stood at around 4%. With regard to widowhood, 9,0% of females
reported that they were widowed, and only 1,9% of males reported the same. Overall, less than a
third of the population in Eastern Cape were legally married (28,8%).
Table 2.6: Distribution of population aged 18 years and older by marital status and sex, Eastern
Cape, CS 2016
Marital status Males Female Total
Number % Number % Number %
Never married 1 205 725 65,5 1 192 237 53,8 2 397 962 59,1
Legally married 487 795 26,5 678 753 30,6 1 166 548 28,8
Living together like husband and wife/partners 80 827 4,4 90 634 4,1 171 461 4,2
Divorced 22 286 1,2 39 668 1,8 61 954 1,5
Separated; but still legally married 10 889 0,6 14 736 0,7 25 625 0,6
Widowed 34 464 1,9 198 917 9,0 233 382 5,8
Total 1 841 986 100,0 2 214 945 100,0 4 056 931 100,0
Source: Statistics South Africa, Community Survey 2016.
Excludes ‘Unspecified’ (1 010).
Table 2.7 shows the district municipality variations in the marital status of persons aged 18 years
and older. Over 60% of persons aged 18 years and older from O.R. Tambo, Amathole, and Chris
Hani district municipalities reported that they had never been married. Nelson Mandela Bay had
the lowest percentage of persons who had never been married, while also having the highest
percentage for legally married persons aged 18 years and older. Sarah Baartman District
Municipality had the highest percentage of persons aged 18 years and older who reported that
they were cohabiting (living together like husband and wife/partners). Furthermore, about 5–6% of
persons aged 18 years and older from the more developed district municipalities (Buffalo City and
Nelson Mandela Bay) reported that they were living together like husband and wife/partners; the
percentage of divorced persons was also higher for these two districts.

STATISTICS SOUTH AFRICA 17 Report number 03-01-08
Provincial profile: Eastern Cape [Community Survey 2016], Report 03-01-08
Table 2.7: Distribution of population aged 18 years and older by marital status and district, CS 2016
District/province Never
married Legally married
Living together
like husband and wife/ partners
Divorced
Separated; but still legally
married
Widowed Total
DC10: Sarah Baartman 168 501 90 453 28 720 5 146 1 695 15 397 309 912
DC12: Amathole 334 189 130 096 12 832 5 495 3 083 32 283 517 979
DC13: Chris Hani 277 964 117 806 21 023 4 881 2 547 28 610 452 830
DC14: Joe Gqabi 123 897 57 399 9 898 2 311 1 201 11 703 206 409
DC15: O.R. Tambo 498 178 203 732 13 371 6 342 3 673 45 425 770 720
DC44: Alfred Nzo 269 460 130 597 12 558 4 217 1 662 29 777 448 272
BUF: Buffalo City 308 008 153 024 30 651 10 696 4 340 24 144 530 864
NMA: Nelson Mandela Bay 417 766 283 440 42 409 22 865 7 423 46 042 819 946
Eastern Cape 2 397 962 1 166 548 171 461 61 954 25 625 233 382 4 056 931
DC10: Sarah Baartman 54,4 29,2 9,3 1,7 0,5 5,0 100,0
DC12: Amathole 64,5 25,1 2,5 1,1 0,6 6,2 100,0
DC13: Chris Hani 61,4 26,0 4,6 1,1 0,6 6,3 100,0
DC14: Joe Gqabi 60,0 27,8 4,8 1,1 0,6 5,7 100,0
DC15: O.R. Tambo 64,6 26,4 1,7 0,8 0,5 5,9 100,0
DC44: Alfred Nzo 60,1 29,1 2,8 0,9 0,4 6,6 100,0
BUF: Buffalo City 58,0 28,8 5,8 2,0 0,8 4,5 100,0
NMA: Nelson Mandela Bay 51,0 34,6 5,2 2,8 0,9 5,6 100,0
Eastern Cape 59,1 28,8 4,2 1,5 0,6 5,8 100,0
Source: Statistics South Africa, Community Survey 2016. Note: Never married = Single; but have been living together with someone as husband/wife/partner before as well as Single; and have
never lived together as husband/wife/partner. Excludes ‘Unspecified’ (1 010).
STATISTICS SOUTH AFRICA 18 Report number 03-01-08
Provincial profile: Eastern Cape [Community Survey 2016], Report 03-01-08
2.4 Language
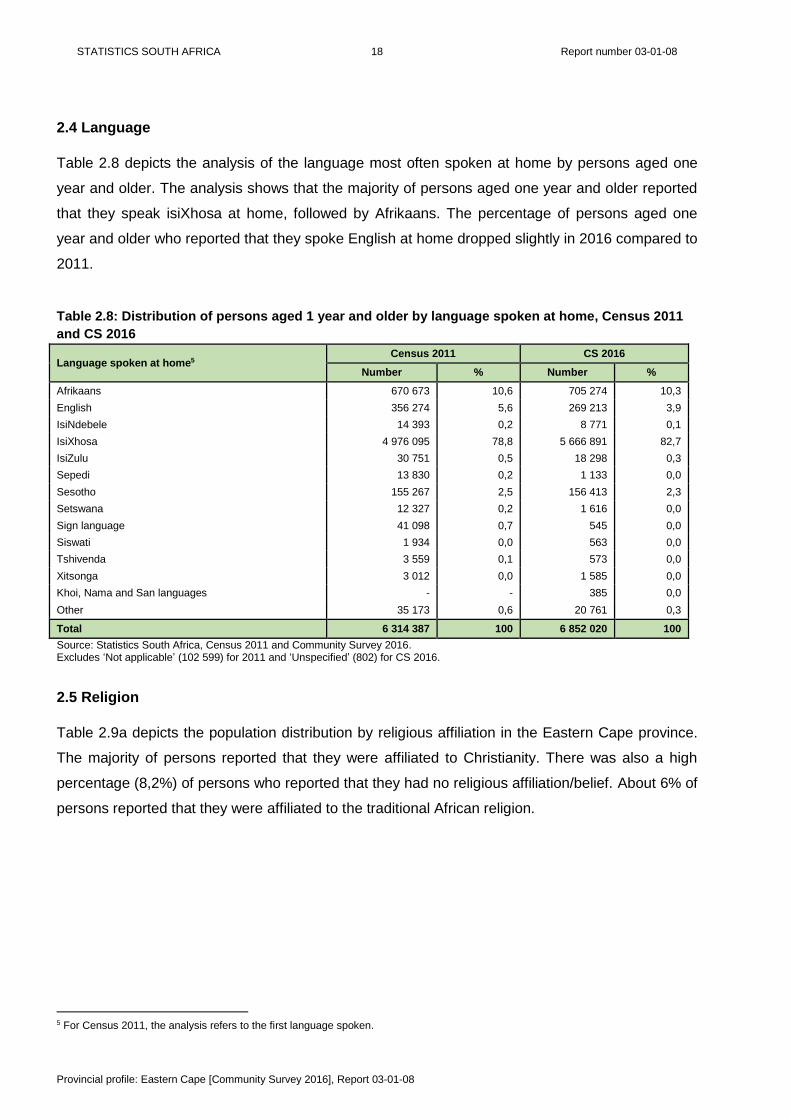
Table 2.8 depicts the analysis of the language most often spoken at home by persons aged one
year and older. The analysis shows that the majority of persons aged one year and older reported
that they speak isiXhosa at home, followed by Afrikaans. The percentage of persons aged one
year and older who reported that they spoke English at home dropped slightly in 2016 compared to
2011.
Table 2.8: Distribution of persons aged 1 year and older by language spoken at home, Census 2011
and CS 2016
Language spoken at home5 Census 2011 CS 2016
Number % Number %
Afrikaans 670 673 10,6 705 274 10,3
English 356 274 5,6 269 213 3,9
IsiNdebele 14 393 0,2 8 771 0,1
IsiXhosa 4 976 095 78,8 5 666 891 82,7
IsiZulu 30 751 0,5 18 298 0,3
Sepedi 13 830 0,2 1 133 0,0
Sesotho 155 267 2,5 156 413 2,3
Setswana 12 327 0,2 1 616 0,0
Sign language 41 098 0,7 545 0,0
Siswati 1 934 0,0 563 0,0
Tshivenda 3 559 0,1 573 0,0
Xitsonga 3 012 0,0 1 585 0,0
Khoi, Nama and San languages - - 385 0,0
Other 35 173 0,6 20 761 0,3
Total 6 314 387 100 6 852 020 100
Source: Statistics South Africa, Census 2011 and Community Survey 2016. Excludes ‘Not applicable’ (102 599) for 2011 and ‘Unspecified’ (802) for CS 2016.
2.5 Religion
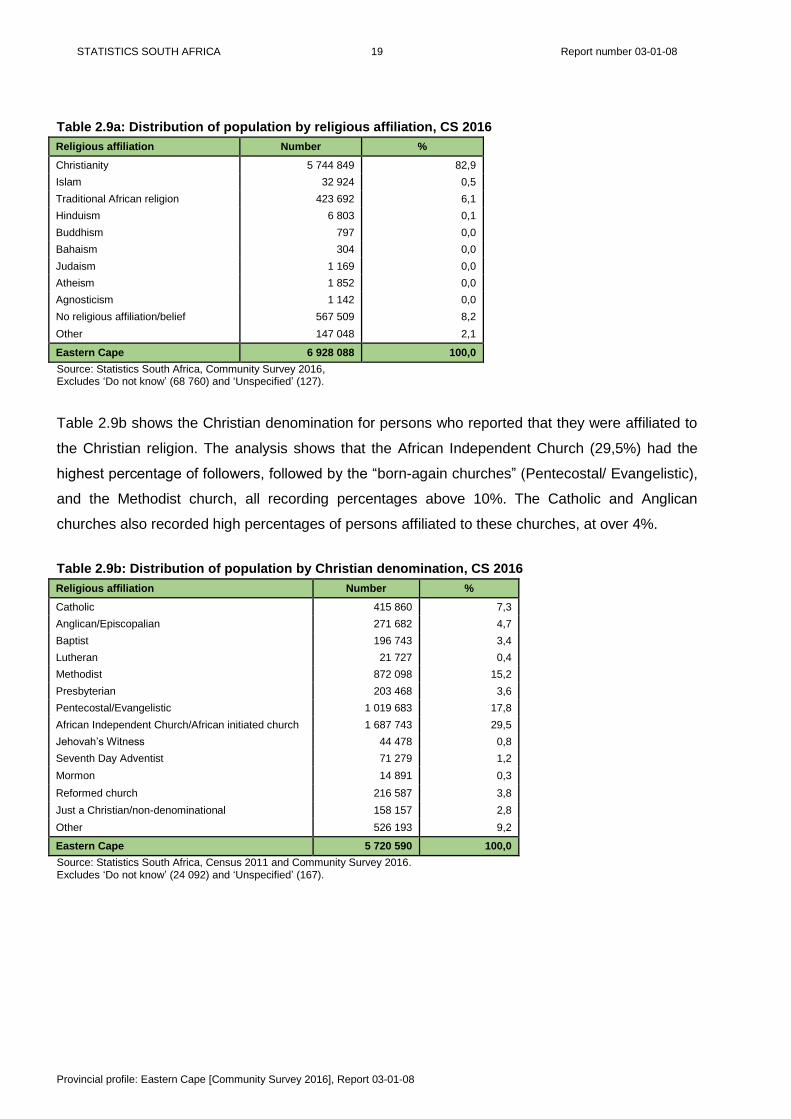
Table 2.9a depicts the population distribution by religious affiliation in the Eastern Cape province.
The majority of persons reported that they were affiliated to Christianity. There was also a high
percentage (8,2%) of persons who reported that they had no religious affiliation/belief. About 6% of
persons reported that they were affiliated to the traditional African religion.
5 For Census 2011, the analysis refers to the first language spoken.
STATISTICS SOUTH AFRICA 19 Report number 03-01-08
Provincial profile: Eastern Cape [Community Survey 2016], Report 03-01-08
Table 2.9a: Distribution of population by religious affiliation, CS 2016
Religious affiliation Number %
Christianity 5 744 849 82,9
Islam 32 924 0,5
Traditional African religion 423 692 6,1
Hinduism 6 803 0,1
Buddhism 797 0,0
Bahaism 304 0,0
Judaism 1 169 0,0
Atheism 1 852 0,0
Agnosticism 1 142 0,0
No religious affiliation/belief 567 509 8,2
Other 147 048 2,1
Eastern Cape 6 928 088 100,0
Source: Statistics South Africa, Community Survey 2016, Excludes ‘Do not know’ (68 760) and ‘Unspecified’ (127).
Table 2.9b shows the Christian denomination for persons who reported that they were affiliated to
the Christian religion. The analysis shows that the African Independent Church (29,5%) had the
highest percentage of followers, followed by the “born-again churches” (Pentecostal/ Evangelistic),
and the Methodist church, all recording percentages above 10%. The Catholic and Anglican
churches also recorded high percentages of persons affiliated to these churches, at over 4%.
Table 2.9b: Distribution of population by Christian denomination, CS 2016
Religious affiliation Number %
Catholic 415 860 7,3
Anglican/Episcopalian 271 682 4,7
Baptist 196 743 3,4
Lutheran 21 727 0,4
Methodist 872 098 15,2
Presbyterian 203 468 3,6
Pentecostal/Evangelistic 1 019 683 17,8
African Independent Church/African initiated church 1 687 743 29,5
Jehovah’s Witness 44 478 0,8
Seventh Day Adventist 71 279 1,2
Mormon 14 891 0,3
Reformed church 216 587 3,8
Just a Christian/non-denominational 158 157 2,8
Other 526 193 9,2
Eastern Cape 5 720 590 100,0
Source: Statistics South Africa, Census 2011 and Community Survey 2016. Excludes ‘Do not know’ (24 092) and ‘Unspecified’ (167).
STATISTICS SOUTH AFRICA 20 Report number 03-01-08
Provincial profile: Eastern Cape [Community Survey 2016], Report 03-01-08
Chapter 3: Migration
This chapter presents the descriptive analysis of the migratory patterns of persons with regard to
Eastern Cape using data from CS 2016. The chapter is subdivided into two sub-sections: one
focusing on internal migration, and the other focusing on international migration.
3.1 Internal migration
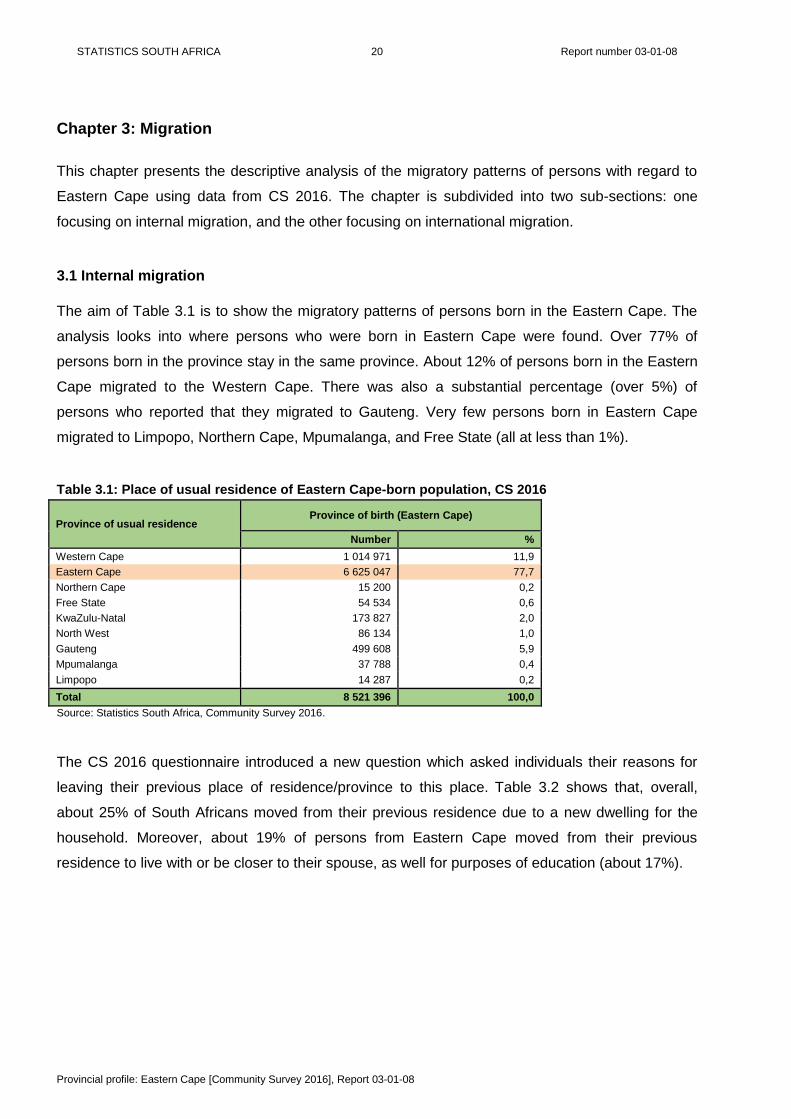
The aim of Table 3.1 is to show the migratory patterns of persons born in the Eastern Cape. The
analysis looks into where persons who were born in Eastern Cape were found. Over 77% of
persons born in the province stay in the same province. About 12% of persons born in the Eastern
Cape migrated to the Western Cape. There was also a substantial percentage (over 5%) of
persons who reported that they migrated to Gauteng. Very few persons born in Eastern Cape
migrated to Limpopo, Northern Cape, Mpumalanga, and Free State (all at less than 1%).
Table 3.1: Place of usual residence of Eastern Cape-born population, CS 2016
Province of usual residence Province of birth (Eastern Cape)
Number %
Western Cape 1 014 971 11,9
Eastern Cape 6 625 047 77,7
Northern Cape 15 200 0,2
Free State 54 534 0,6
KwaZulu-Natal 173 827 2,0
North West 86 134 1,0
Gauteng 499 608 5,9
Mpumalanga 37 788 0,4
Limpopo 14 287 0,2
Total 8 521 396 100,0
Source: Statistics South Africa, Community Survey 2016.
The CS 2016 questionnaire introduced a new question which asked individuals their reasons for
leaving their previous place of residence/province to this place. Table 3.2 shows that, overall,
about 25% of South Africans moved from their previous residence due to a new dwelling for the
household. Moreover, about 19% of persons from Eastern Cape moved from their previous
residence to live with or be closer to their spouse, as well for purposes of education (about 17%).

STATISTICS SOUTH AFRICA 21 Report number 03-01-08
Provincial profile: Eastern Cape [Community Survey 2016], Report 03-01-08
Table 3.2: Reasons for moving from previous place of residence by province, CS 2016
Reasons for moving Western
Cape Eastern
Cape Northern
Cape Free State
KwaZulu-Natal
North West
Gauteng Mpuma-
langa Limpopo
South Africa
Divorce/separation 12 063 5 417 853 3 367 4 919 3 606 24 140 2 793 2 829 59 988
Education 44 262 71 007 6 530 23 254 61 701 30 765 130 139 21 234 40 281 429 172
For better municipal services 15 775 7 197 784 2 721 9 302 4 024 35 240 6 423 2 775 84 240
Health 6 579 7 679 1 216 3 008 5 071 4 097 10 011 2 538 3 832 44 030
High levels of crime 10 710 4 127 676 1 463 3 552 2 193 15 389 1 142 703 39 955
Job loss/retrenchment/contract ended 5 438 12 094 1 970 4 030 8 633 6 639 17 486 3 414 6 928 66 632
Job transfer/take up new job opportunity 41 978 31 862 14 848 19 889 43 399 31 693 117 238 29 989 34 050 364 948
Look for paid work 46 224 32 606 10 484 11 894 42 925 32 163 177 971 30 735 39 140 424 141
Moving as a household with a household member 53 662 34 316 9 926 19 528 33 461 28 286 105 436 18 138 25 061 327 814
Moving to live with or be closer to spouse (marriage) 85 339 78 057 17 880 40 099 67 357 54 847 209 295 51 196 62 467 666 537
New dwelling for household 175 884 80 459 22 054 44 619 100 048 63 754 373 104 50 451 41 656 952 029
Other business reasons 4 330 5 083 787 1 675 2 969 3 108 12 670 2 122 2 193 34 937
Political instability/religious conflict/persecution 1 335 1 177 258 658 1 501 846 3 683 504 1 022 10 983
Retirement 12 344 3 830 618 1 372 2 833 1 452 7 013 718 2 068 32 247
Start a business 2 254 2 360 776 1 396 1 780 2 350 6 083 1 481 2 223 20 702
Other 34 169 22 723 4 752 10 431 19 565 15 111 68 226 10 861 10 066 195 904
Total 552 345 399 995 94 411 189 405 409 017 284 934 1 313 123 233 737 277 293 3 754 260
%
Reasons for moving Western
Cape Eastern
Cape Northern
Cape Free State
KwaZulu-Natal
North West
Gauteng Mpuma-
langa Limpopo
South Africa
Divorce/separation 2,2 1,4 0,9 1,8 1,2 1,3 1,8 1,2 1,0 1,6
Education 8,0 17,8 6,9 12,3 15,1 10,8 9,9 9,1 14,5 11,4
For better municipal services 2,9 1,8 0,8 1,4 2,3 1,4 2,7 2,7 1,0 2,2
Health 1,2 1,9 1,3 1,6 1,2 1,4 0,8 1,1 1,4 1,2
High levels of crime 1,9 1,0 0,7 0,8 0,9 0,8 1,2 0,5 0,3 1,1
Job loss/retrenchment/contract ended 1,0 3,0 2,1 2,1 2,1 2,3 1,3 1,5 2,5 1,8
Job transfer/take up new job opportunity 7,6 8,0 15,7 10,5 10,6 11,1 8,9 12,8 12,3 9,7
Look for paid work 8,4 8,2 11,1 6,3 10,5 11,3 13,6 13,1 14,1 11,3
Moving as a household with a household member 9,7 8,6 10,5 10,3 8,2 9,9 8,0 7,8 9,0 8,7
Moving to live with or be closer to spouse (marriage) 15,5 19,5 18,9 21,2 16,5 19,2 15,9 21,9 22,5 17,8
New dwelling for household 31,8 20,1 23,4 23,6 24,5 22,4 28,4 21,6 15,0 25,4
Other business reasons 0,8 1,3 0,8 0,9 0,7 1,1 1,0 0,9 0,8 0,9
STATISTICS SOUTH AFRICA 22 Report number 03-01-08
Provincial profile: Eastern Cape [Community Survey 2016], Report 03-01-08
Reasons for moving Western
Cape Eastern
Cape Northern
Cape Free State
KwaZulu-Natal
North West
Gauteng Mpuma-
langa Limpopo
South Africa
Political instability/religious conflict/persecution 0,2 0,3 0,3 0,3 0,4 0,3 0,3 0,2 0,4 0,3
Retirement 2,2 1,0 0,7 0,7 0,7 0,5 0,5 0,3 0,7 0,9
Start a business 0,4 0,6 0,8 0,7 0,4 0,8 0,5 0,6 0,8 0,6
Other 6,2 5,7 5,0 5,5 4,8 5,3 5,2 4,6 3,6 5,2
Total 100,0 100,0 100,0 100,0 100,0 100,0 100,0 100,0 100,0 100,0
Source: Statistics South Africa, Community Survey 2016. Excludes ‘Do not know’ (39 017) and ‘Unspecified’ (829).
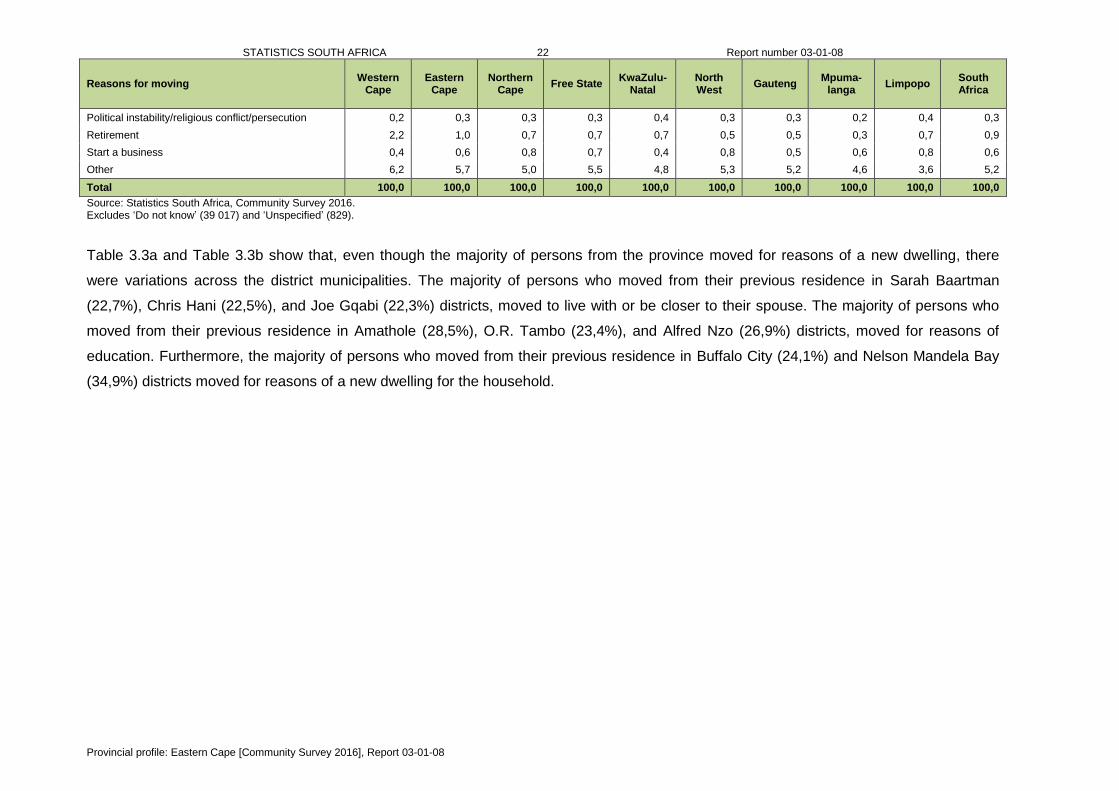
Table 3.3a and Table 3.3b show that, even though the majority of persons from the province moved for reasons of a new dwelling, there
were variations across the district municipalities. The majority of persons who moved from their previous residence in Sarah Baartman
(22,7%), Chris Hani (22,5%), and Joe Gqabi (22,3%) districts, moved to live with or be closer to their spouse. The majority of persons who
moved from their previous residence in Amathole (28,5%), O.R. Tambo (23,4%), and Alfred Nzo (26,9%) districts, moved for reasons of
education. Furthermore, the majority of persons who moved from their previous residence in Buffalo City (24,1%) and Nelson Mandela Bay
(34,9%) districts moved for reasons of a new dwelling for the household.

STATISTICS SOUTH AFRICA 23 Report number 03-01-08
Provincial profile: Eastern Cape [Community Survey 2016], Report 03-01-08
Table 3.3a: Reasons for moving from previous place of residence by district (numbers), CS 2016
Reasons Sarah
Baartman Amathole Chris Hani Joe Gqabi
O.R. Tambo
Alfred Nzo Buffalo
City
Nelson Mandela
Bay
Eastern Cape
Divorce/separation 484 253 405 185 357 486 851 2 396 5 417
Education 3 247 11 480 8 380 4 546 11 912 10 544 9 406 11 492 71 007
For better municipal services 577 664 596 134 919 338 1 387 2 582 7 197
Health 479 1 286 1 143 702 806 1 236 764 1 264 7 679
High levels of crime 156 286 495 75 276 143 652 2 044 4 127
Job loss/retrenchment/contract ended 372 2 523 2 600 919 1 511 1 644 1 200 1 326 12 094
Job transfer/take up new job opportunity 2 852 3 189 3 587 1 233 3 986 3 026 7 483 6 507 31 862
Look for paid work 3 265 3 090 3 874 1 898 6 105 4 272 5 493 4 609 32 606
Moving as a household with a household member 3 133 4 229 2 984 1 485 3 498 3 363 7 324 8 300 34 316
Moving to live with or be closer to spouse (marriage) 7 619 6 381 9 736 4 648 11 375 9 392 11 157 17 750 78 057
New dwelling for household 7 305 2 857 4 833 3 614 6 949 2 117 16 207 36 575 80 459
Other business reasons 581 272 503 133 321 292 1 464 1 517 5 083
Political instability/religious conflict/persecution 63 237 116 72 250 229 162 49 1 177
Retirement 926 440 284 170 141 245 267 1 358 3 830
Start a business 102 392 465 135 217 308 306 435 2 360
Other 2 382 2 729 3 252 858 2 189 1 590 3 168 6 554 22 723
Total 33 545 40 309 43 252 20 808 50 811 39 223 67 291 104 758 399 995

STATISTICS SOUTH AFRICA 24 Report number 03-01-08
Provincial profile: Eastern Cape [Community Survey 2016], Report 03-01-08
Table 3.3b: Reasons for moving from previous place of residence by district (percentage), CS 2016
Reasons Sarah Baart-man
Amathole Chris Hani
Joe Gqabi
O.R. Tambo
Alfred Nzo
Buffalo City
Nelson Mandela
Bay
Eastern Cape
Divorce/separation 1,4 0,6 0,9 0,9 0,7 1,2 1,3 2,3 1,4 Education 9,7 28,5 19,4 21,8 23,4 26,9 14,0 11,0 17,8 For better municipal services 1,7 1,6 1,4 0,6 1,8 0,9 2,1 2,5 1,8 Health 1,4 3,2 2,6 3,4 1,6 3,2 1,1 1,2 1,9 High levels of crime 0,5 0,7 1,1 0,4 0,5 0,4 1,0 2,0 1,0 Job loss/retrenchment/contract ended 1,1 6,3 6,0 4,4 3,0 4,2 1,8 1,3 3,0 Job transfer/take up new job opportunity 8,5 7,9 8,3 5,9 7,8 7,7 11,1 6,2 8,0 Look for paid work 9,7 7,7 9,0 9,1 12,0 10,9 8,2 4,4 8,2 Moving as a household with a household member 9,3 10,5 6,9 7,1 6,9 8,6 10,9 7,9 8,6 Moving to live with or be closer to spouse (marriage) 22,7 15,8 22,5 22,3 22,4 23,9 16,6 16,9 19,5 New dwelling for household 21,8 7,1 11,2 17,4 13,7 5,4 24,1 34,9 20,1 Other business reasons 1,7 0,7 1,2 0,6 0,6 0,7 2,2 1,4 1,3 Political instability/religious conflict/persecution 0,2 0,6 0,3 0,3 0,5 0,6 0,2 0,0 0,3 Retirement 2,8 1,1 0,7 0,8 0,3 0,6 0,4 1,3 1,0 Start a business 0,3 1,0 1,1 0,6 0,4 0,8 0,5 0,4 0,6 Other 7,1 6,8 7,5 4,1 4,3 4,1 4,7 6,3 5,7
Total 100,0 100,0 100,0 100,0 100,0 100,0 100,0 100,0 100,0
Source: Statistics South Africa, Community Survey 2016. Excludes ‘Do not know’ (2 916) and ‘Unspecified’ (15).

STATISTICS SOUTH AFRICA 25 Report number 03-01-08
Provincial profile: Eastern Cape [Community Survey 2016], Report 03-01-08
3.2 International migration
Figure 3.2 depicts the percentage of persons born outside South Africa by the province in which
they were found. The majority of persons born outside South Africa were enumerated in Gauteng.
Only 3,6% of persons born outside South Africa were enumerated (i.e. counted) in Eastern Cape.
Northern Cape had the lowest percentage of persons born outside South Africa.
Figure 3.1: Persons born outside South Africa by province of enumeration, CS 2016
Source: Statistics South Africa, Community Survey 2016.
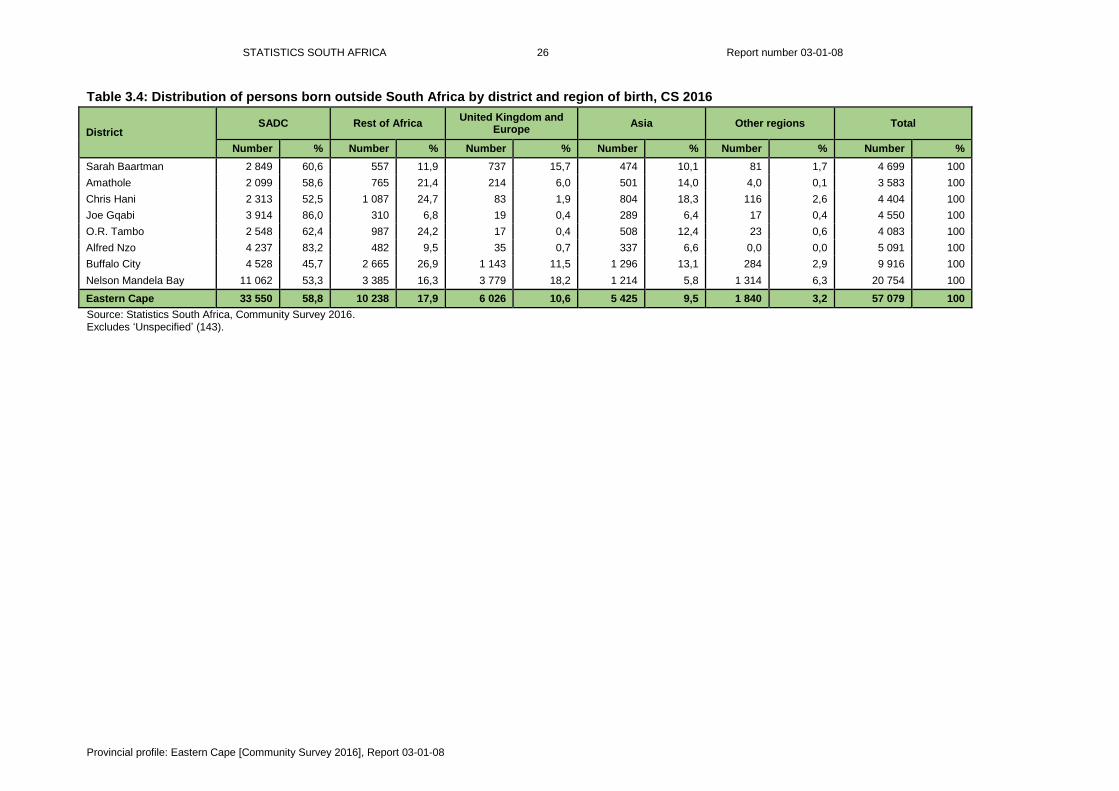
Table 3.4 shows that the majority of persons born outside South Africa were from African
countries, the Southern African Development Community (SADC) region contributing the highest
number (33 550). Looking at district statistics, it is noticeable that the highest number of persons
born outside South Africa were mostly concentrated in Buffalo City and Nelson Mandela Bay.
These two district municipalities are economic hubs of the province, and this may be a pull factor
for persons born outside South Africa.
STATISTICS SOUTH AFRICA 26 Report number 03-01-08
Provincial profile: Eastern Cape [Community Survey 2016], Report 03-01-08
Table 3.4: Distribution of persons born outside South Africa by district and region of birth, CS 2016
District SADC Rest of Africa
United Kingdom and Europe
Asia Other regions Total
Number % Number % Number % Number % Number % Number %
Sarah Baartman 2 849 60,6 557 11,9 737 15,7 474 10,1 81 1,7 4 699 100
Amathole 2 099 58,6 765 21,4 214 6,0 501 14,0 4,0 0,1 3 583 100
Chris Hani 2 313 52,5 1 087 24,7 83 1,9 804 18,3 116 2,6 4 404 100
Joe Gqabi 3 914 86,0 310 6,8 19 0,4 289 6,4 17 0,4 4 550 100
O.R. Tambo 2 548 62,4 987 24,2 17 0,4 508 12,4 23 0,6 4 083 100
Alfred Nzo 4 237 83,2 482 9,5 35 0,7 337 6,6 0,0 0,0 5 091 100
Buffalo City 4 528 45,7 2 665 26,9 1 143 11,5 1 296 13,1 284 2,9 9 916 100
Nelson Mandela Bay 11 062 53,3 3 385 16,3 3 779 18,2 1 214 5,8 1 314 6,3 20 754 100
Eastern Cape 33 550 58,8 10 238 17,9 6 026 10,6 5 425 9,5 1 840 3,2 57 079 100
Source: Statistics South Africa, Community Survey 2016. Excludes ‘Unspecified’ (143).

STATISTICS SOUTH AFRICA 27 Report number 03-01-08
Provincial profile: Eastern Cape [Community Survey 2016], Report 03-01-08
Chapter 4: General health and functioning
This chapter focuses on general health and functioning of persons aged 5 years and older. In this
chapter, descriptive analysis is used to highlight the functioning of persons aged 5 years and older
and to profile their disability prevalence using CS 2016 data. Where possible, Census 2011 data is
used to make comparisons, more specifically with regard to the functional domains.
4.1 Health and functional domains
This chapter focuses on general health, functioning, and disability prevalence among persons
aged 5 years and older. In this chapter, descriptive analysis is used to profile disability based on
six domains of functioning (seeing, hearing, communicating, walking, remembering, and self-care).
Disability prevalence was measured using a computed index based on the general health and
functioning question asked in CS 2016. The threshold (level of inclusion) used in computing
persons with and without disabilities was as follows:
A person who reported ‘some difficulty’ in at least two functional domains was categorised
as having a disability
A person who reported ‘a lot of difficulty’ in any of the six functional domains was
categorised as having a disability
A person who reported ‘unable to do’ in any of the six functional domains was categorised
as having a disability
A person who reported ‘no difficulty’ in any of the six functional domains was categorised as
having no disability
A person who reported ‘some difficulty’ in one of the six functional domains was
categorised as having no disability
Table 4.1 shows that the majority of persons aged five years and older in Eastern Cape reported
that they had no difficulty across the six domains of functioning. Less than 1% of persons aged 5
years and older reported that they cannot do all functions at all across all functional domains.

STATISTICS SOUTH AFRICA 28 Report number 03-01-08
Provincial profile: Eastern Cape [Community Survey 2016], Report 03-01-08
Table 4.1: General health and functioning by functional domain for persons aged 5 years and older,
Census 2011 and CS 2016 (1)
Level of difficulty Seeing Hearing Communicating
2011 2016 2011 2016 2011 2016
No difficulty 4 867 718 5 523 473 5 272 194 5 915 216 5 405 747 6 062 225
Some difficulty 558 247 541 972 200 666 204 915 73 127 78 841
A lot of difficulty 94 099 100 565 40 719 45 999 17 868 22 549
Cannot do at all 11 551 11 962 9 853 11 940 12 435 14 692
Total 5 531 616 6 177 971 5 523 432 6 178 069 5 509 177 6 178 306
%
No difficulty 88 89,4 95,5 95,7 98,1 98,1
Some difficulty 10,1 8,8 3,6 3,3 1,3 1,3
A lot of difficulty 1,7 1,6 0,7 0,7 0,3 0,4
Cannot do at all 0,2 0,2 0,2 0,2 0,2 0,2
Total 100 100 100 100 100 100
For Census 2011, the following exclusions are applicable: ‘Do not know’ (2 895) for seeing, 2 638 for hearing, 3 371 for communicating, 2 279 for walking, 6 223 for remembering, 8 438 for self-care; and ‘Unspecified’ (159 634) for seeing, 168 074 for hearing, 180 185 for communicating, 164 744 for walking, 172 463 for remembering, 194 699 for self-care. Moreover, ‘Not applicable’ (100 692) has been excluded for all functional domains. Also, ‘Cannot yet be determined’ has been excluded in the analysis for communicating (1 411), walking (513), remembering (4 087), and self-care (140 151). For CS 2016, the analysis excludes ‘Do not know’ (1 089) for seeing, 985 for hearing, 646 for communicating, 1 229 for walking, 2 809 for remembering, 836 for self-care; and ‘Unspecified’ (2 031) for seeing, 2 037 for hearing, 2 139 for communicating, 2 139 for walking, 2 199 for remembering, 2 066 for self-care.
Table 4.1: General health and functioning by functional domain for persons aged 5 years and older,
Census 2011 and CS 2016 (2)
Level of difficulty Walking Remembering Self-care
2011 2016 2011 2016 2011 2016
No difficulty 5 287 486 5 826 537 5 155 770 5 831 713 5 122 633 6 003 671
Some difficulty 171 443 229 540 265 171 255 432 141 279 115 169
A lot of difficulty 51 507 97 412 75 537 77 522 41 262 34 345
Cannot do at all 16 171 24 325 14 895 11 416 45 682 25 005
Total 5 526 609 6 177 813 5 511 372 6 176 084 5 350 856 6 178 190
%
No difficulty 95,7 94,3 93,5 94,4 95,7 97,2
Some difficulty 3,1 3,7 4,8 4,1 2,6 1,9
A lot of difficulty 0,9 1,6 1,4 1,3 0,8 0,6
Cannot do at all 0,3 0,4 0,3 0,2 0,9 0,4
Total 100 100 100 100 100 100
Source: Statistics South Africa, Community Survey 2016. For Census 2011, the following exclusions are applicable: ‘Do not know’ (2 895) for seeing, 2 638 for hearing, 3 371 for communicating, 2 279 for walking, 6 223 for remembering, 8 438 for self-care; and ‘Unspecified’ (159 634) for seeing, 168 074 for hearing, 180 185 for communicating, 164 744 for walking, 172 463 for remembering, 194 699 for self-care. Moreover, ‘Not applicable’ (100 692) has been excluded for all functional domains. Also, ‘Cannot yet be determined’ has been excluded in the analysis for communicating (1 411), walking (513), remembering (4 087), and self-care (140 151). For CS 2016, the analysis excludes ‘Do not know’ (1 089) for seeing, 985 for hearing, 646 for communicating, 1 229 for walking, 2 809 for remembering, 836 for self-care; and ‘Unspecified’ (2 031) for seeing, 2 037 for hearing, 2 139 for communicating, 2 139 for walking, 2 199 for remembering, 2 066 for self-care.

STATISTICS SOUTH AFRICA 29 Report number 03-01-08
Provincial profile: Eastern Cape [Community Survey 2016], Report 03-01-08
4.2 Disability prevalence
Table 4.2 depicts the disability prevalence of persons aged 5 years and older per district municipality, within each population group. The
analysis showed disability differentials with regard to the district municipalities. For instance, disability was slightly more prevalent among the
Indian/Asian population group in Sarah Baartman district as well as Nelson Mandela Bay, and was more prevalent among the white
population group in the following districts: Amathole, Chris Hani, Joe Gqabi, and Buffalo City. In O.R. Tambo district, disability prevalence
was higher within the coloured population group; in Alfred Nzo district, the prevalence of disability was more pronounced for the black African
population group. Overall, the black African and white population groups contributed the highest disability prevalence in the province (slightly
higher than the provincial prevalence of 8,6%); the biggest contributing district was Alfred Nzo (with a disability prevalence of more than
10%). Buffalo City District Municipality had the lowest overall disability prevalence (6,9%), which was quite a bit lower than the provincial
prevalence of 8,6%.

STATISTICS SOUTH AFRICA 30 Report number 03-01-08
Provincial profile: Eastern Cape [Community Survey 2016], Report 03-01-08
Table 4.2: Disability prevalence by district and population group for persons aged 5 years and older, CS 2016
District
Black African Coloured Indian/ Asian White Total
Wit
ho
ut
dis
ab
ilit
y
Wit
h
dis
ab
ilit
y
To
tal
Wit
ho
ut
dis
ab
ilit
y
Wit
h
dis
ab
ilit
y
To
tal
Wit
ho
ut
dis
ab
ilit
y
Wit
h
dis
ab
ilit
y
To
tal
Wit
ho
ut
dis
ab
ilit
y
Wit
h
dis
ab
ilit
y
To
tal
Wit
ho
ut
dis
ab
ilit
y
Wit
h
dis
ab
ilit
y
To
tal
Sarah Baartman 211 038 24 904 235 942 148 432 9 670 158 102 891 123 1 014 32 843 4 438 37 282 393 204 39 135 432 339
Amathole 692 422 73 988 766 409 10 083 974 11 057 806 47 853 7 089 982 8 071 710 399 75 991 786 390
Chris Hani 627 523 59 707 687 231 29 740 1 812 31 552 1 305 11 1 316 12 364 1 370 13 734 670 932 62 901 733 832
Joe Gqabi 283 817 25 281 309 098 10 715 552 11 267 599 26 624 6 487 594 7 081 301 618 26 452 328 070
O.R. Tambo 1 146 486 111 496 1 257 982 4 988 669 5 656 1 230 86 1 316 1 086 75 1 162 1 153 789 112 326 1 266 116
Alfred Nzo 667 123 78 727 745 849 2 998 211 3 209 539 12 551 926 103 1 028 671 586 79 053 750 638
Buffalo City 589 837 43 708 633 545 46 968 3 309 50 277 6 516 161 6 677 50 114 4 178 54 291 693 435 51 356 744 791
Nelson Mandela Bay 625 467 48 584 674 052 254 253 17 440 271 693 13 129 1 421 14 549 162 298 14 292 176 590 1 055 147 81 738 1 136 884
Eastern Cape 4 843 713 466 395 5 310 108 508 178 34 636 542 814 25 013 1 887 26 900 273 206 26 033 299 239 5 650 109 528 951 6 179 061
%
Sarah Baartman 89,4 10,6 100,0 93,9 6,1 100,0 87,9 12,1 100,0 88,1 11,9 100,0 90,9 9,1 100,0
Amathole 90,3 9,7 100,0 91,2 8,8 100,0 94,5 5,5 100,0 87,8 12,2 100,0 90,3 9,7 100,0
Chris Hani 91,3 8,7 100,0 94,3 5,7 100,0 99,1 0,9 100,0 90,0 10,0 100,0 91,4 8,6 100,0
Joe Gqabi 91,8 8,2 100,0 95,1 4,9 100,0 95,9 4,1 100,0 91,6 8,4 100,0 91,9 8,1 100,0
O.R. Tambo 91,1 8,9 100,0 88,2 11,8 100,0 93,5 6,5 100,0 93,5 6,5 100,0 91,1 8,9 100,0
Alfred Nzo 89,4 10,6 100,0 93,4 6,6 100,0 97,8 2,2 100,0 90,0 10,0 100,0 89,5 10,5 100,0
Buffalo City 93,1 6,9 100,0 93,4 6,6 100,0 97,6 2,4 100,0 92,3 7,7 100,0 93,1 6,9 100,0
Nelson Mandela Bay 92,8 7,2 100,0 93,6 6,4 100,0 90,2 9,8 100,0 91,9 8,1 100,0 92,8 7,2 100,0
Eastern Cape 91,2 8,8 100,0 93,6 6,4 100,0 93,0 7,0 100,0 91,3 8,7 100,0 91,4 8,6 100,0 Source: Statistics South Africa, Community Survey 2016. Excludes ‘Unspecified’ (2 031).
Table 4.3 shows the disability prevalence by age group and district. Although there were various differentials in the disability prevalence
across districts, the overall pattern shows that the disability prevalence increases with age across all districts. This means that as people get
older, they become more vulnerable to disability.

STATISTICS SOUTH AFRICA 31 Report number 03-01-08
Provincial profile: Eastern Cape [Community Survey 2016], Report 03-01-08
Table 4.3: Percentage of population aged 5 years and older by disability status, district, and age group, CS 2016 Age
group DC10 Sarah Baartman
DC12 Amathole
DC13 Chris Hani
DC14 Joe Gqabi
DC15 O.R. Tambo
DC44 Alfred Nzo
BUF Buffalo City
NMA Nelson Mandela Bay
Eastern Cape
5–9 5,0 4,4 4,1 3,9 4,1 4,8 3,4 2,0 3,9
10–14 3,6 2,7 2,6 2,6 3,2 2,9 2,7 1,9 2,8
15–19 2,2 2,6 2,5 3,0 3,3 2,6 1,8 2,3 2,7
20–24 1,9 3,3 2,5 1,9 3,8 3,2 2,0 1,4 2,7
25–29 2,5 4,5 3,5 3,0 4,3 4,6 2,1 2,1 3,4
30–34 4,0 5,7 4,2 3,5 6,3 6,1 2,9 2,8 4,5
35–39 4,9 7,6 5,8 5,0 7,7 8,4 2,7 3,2 5,1
40–44 5,8 9,6 7,7 7,4 10,3 12,5 5,9 5,5 7,6
45–49 11,3 13,3 11,7 12,0 15,5 19,5 7,2 7,8 11,2
50–54 15,2 19,8 18,0 16,5 21,6 25,5 12,5 12,5 16,7
55–59 21,6 24,1 20,9 23,3 26,1 32,4 17,9 15,7 21,5
60–64 26,8 30,5 27,8 29,6 30,7 39,5 22,6 23,3 27,9
65–69 35,0 37,2 35,2 38,6 40,7 45,1 33,4 26,4 35,7
70–74 41,6 47,2 43,2 49,6 49,6 57,0 43,6 35,9 45,4
75–79 49,2 60,2 53,4 57,4 55,1 62,0 52,7 50,7 54,9
80–84 52,7 69,3 63,1 73,7 65,4 75,8 68,3 58,8 65,9
85+ 73,8 78,7 75,3 79,5 75,1 82,9 73,4 72,1 76,6
Total 9,1 9,7 8,6 8,1 8,9 10,5 6,9 7,2 8,6
Source: Statistics South Africa, Community Survey 2016. Excludes ‘Unspecified’ (2 031). For numbers, please see appendix Table 39.

STATISTICS SOUTH AFRICA 32 Report number 03-01-08
Provincial profile: Eastern Cape [Community Survey 2016], Report 03-01-08
Chapter 5: Parental survival
Building on the previous chapter,6 this chapter focuses on orphanhood in Eastern Cape. The
profile examines the number of children in this province who were 18 years and less at the time of
CS 2016 who either lost only one parent or both parents. This group is particularly vulnerable in the
absence of family support structure.
5.1 Orphanhood
Table 5.1 depicts the extent to which persons aged 0–17 years were orphaned in the province.
The analysis showed differentials in the number of orphans across district municipalities. Maternal
orphans were more prevalent in O.R. Tambo district compared to other districts, whilst Joe Gqabi
district had the lowest. O.R. Tambo district had the highest number of paternal orphans, while
Sarah Baartman district had the lowest. Double orphans (having neither biological parent alive)
were more pronounced O.R. Tambo district, with the least number of double orphans found in
Sarah Baartman district. Overall, there were more paternal orphans (over 200 000) than other
types of orphans in the province.
Table 5.1: Distribution of population aged younger than 18 years old by orphanhood status, CS 2016
District/municipality/province Maternal orphans Paternal orphans Double orphans
DC10 Sarah Baartman 7 146 9 753 2 794
DC12 Amathole 12 110 30 581 5 959
DC13 Chris Hani 11 675 28 613 6 479
DC14 Joe Gqabi 5 364 12 487 3 667
DC15 O.R. Tambo 22 923 67 978 17 117
DC44 Alfred Nzo 16 546 46 457 14 128
BUF Buffalo City 9 291 18 587 3 775
NMA Nelson Mandela Bay 12 048 24 917 5 456
Eastern Cape 97 103 239 371 59 376
Source: Statistics South Africa, Community Survey 2016. Note: ‘Local municipalities’ are attached in appendix in Table 6.
6 Disability is considered a vulnerability among certain populations, especially with regard to children and the elderly.

STATISTICS SOUTH AFRICA 33 Report number 03-01-08
Provincial profile: Eastern Cape [Community Survey 2016], Report 03-01-08
Chapter 6: Education
Education is one of the basic human rights in South Africa, and among the fundamental socio-
economic indicators for development.7 In this chapter, educational attendance and levels are
profiled using CS 2016 data, with comparisons to Census 2011 where possible.
6.1 Early childhood development
Early childhood development (ECD) is one of the priority areas of the South African government
and remains a critical policy issue that the Department of Basic Education aims to address. Early
years in life are critical for the acquisition of perceptual-motor skills required for reading, writing and
numeracy in later years. It is for these reasons that resources are geared towards promotion of
access to ECD. Despite expanded expenditure on this priority area, gaps in access still exist.
Commitment towards ECD is visible in financial expenditure, which shows an upward trend in
billions of rands (increase from 1,4 in 2010/11 to 4,3 in 2016/17 financial year8) directed towards
ECD programmes. As a result, there has been an increase in enrolment in Grade R and South
Africa is close to reaching the target of universal access to education for five-year-olds.9
Table 6.1 shows the extent of school attendance among children aged 0–4 years within each
district municipality. Generally, more than a third of children in this age group were attending
school (36,6%), majority of whom were the 3 and 4 year olds (52,3% and 77,9% respectively).
District dynamics showed that there was a higher percentage of school attendance in Buffalo City
(49,1%) within this age group (0–4) compared to other districts whilst the lowest percentage in
school attendance was recorded in O.R. Tambo (27,7%). Buffalo City recorded the highest
percentage across all ages.
7 See: http://www.gov.za/sites/www.gov.za/files/devplan_2.pdf
8 Provincial Budgets and Expenditure Report Review: 2010/11–2016/17 9 General Household Survey 2015, Report No. P0318

STATISTICS SOUTH AFRICA 34 Report number 03-01-08
Provincial profile: Eastern Cape [Community Survey 2016], Report 03-01-08
Table 6.1: Population aged 0–4 years by attendance at an educational institution, CS 2016
District 0 1 2 3 4 0-4 (Total)
Sarah Baartman 1,6 12,3 30,8 61,4 78,2 38,3
Amathole 1,4 8,4 30,0 54,6 80,8 37,1
Chris Hani 1,6 11,3 31,5 55,1 80,4 38,5
Joe Gqabi 1,8 6,8 24,8 47,1 75,3 33,7
O.R. Tambo 1,2 3,7 14,1 37,7 74,1 27,7
Alfred Nzo 0,7 2,5 12,3 40,9 77,4 28,1
Buffalo City 4,5 19,1 49,8 77,3 87,7 49,1
Nelson Mandela Bay 2,7 16,5 42,6 61,3 73,8 41,0
Eastern Cape 1,9 9,3 28,0 52,3 77,9 35,6
Source: Statistics South Africa, Community Survey 2016. Note: ‘Local municipalities’ are attached in appendix in Table 7. Excludes ‘Unspecified’ (376) and ‘Do not know’ (137).
6.2 Educational attendance for persons aged 5-24
Figure 6.1 shows comparisons between Census 2011 and CS 2016. For ages 5–6 there was an
increase in the proportion of persons attending an educational institution. For both years, there was
a decrease in the proportions attending from age 15 to 24.
Figure 6.1: Population aged 5–24 years attending an educational institution, Eastern Cape, Census 2011 and CS 2016
Source: Statistics South Africa, Census 2011 and Community Survey 2016.
Figure 6.2 depicts persons aged 5–24 years who reported that they were attending an educational
institution. The analysis showed that there was an increase (between 2011 and 2016) in the
percentage of persons attending school in the following districts: Sarah Baartman, Joe Gqabi,
Buffalo City and Nelson Mandela Bay. There was a decrease in the following districts: Amathole,
Chris Hani, O.R. Tambo, and Alfred Nzo.
0
10
20
30
40
50
60
70
80
90
100
5 6 7 8 9 10 11 12 13 14 15 16 17 18 19 20 21 22 23 24
%
Age
CS 2016 Census 2011

STATISTICS SOUTH AFRICA 35 Report number 03-01-08
Provincial profile: Eastern Cape [Community Survey 2016], Report 03-01-08
Figure 6.2: Population aged 5–24 years attending an educational institution, Census 2011 and CS
2016
Source: Statistics South Africa, Community Survey 2016 and Census 2016.
6.3 Type of educational institution
Table 6.2 shows the attendance by type of educational institution. CS 2016 recorded that about 1,4
million persons were attending primary school, followed by 841 555 attending secondary school
and 43 513 attending technical vocational education and training.
SarahBaartma
nAmathole
ChrisHani
JoeGqabi
O.R.Tambo
AlfredNzo
BuffaloCity
NelsonMandela
Bay
Census 2011 66.1 79.9 79.4 78.6 81.0 81.1 74.9 70.7
CS 2016 70.7 76.6 77.4 79.2 77.7 79.5 78.5 76.4
0
10
20
30
40
50
60
70
80
90
%
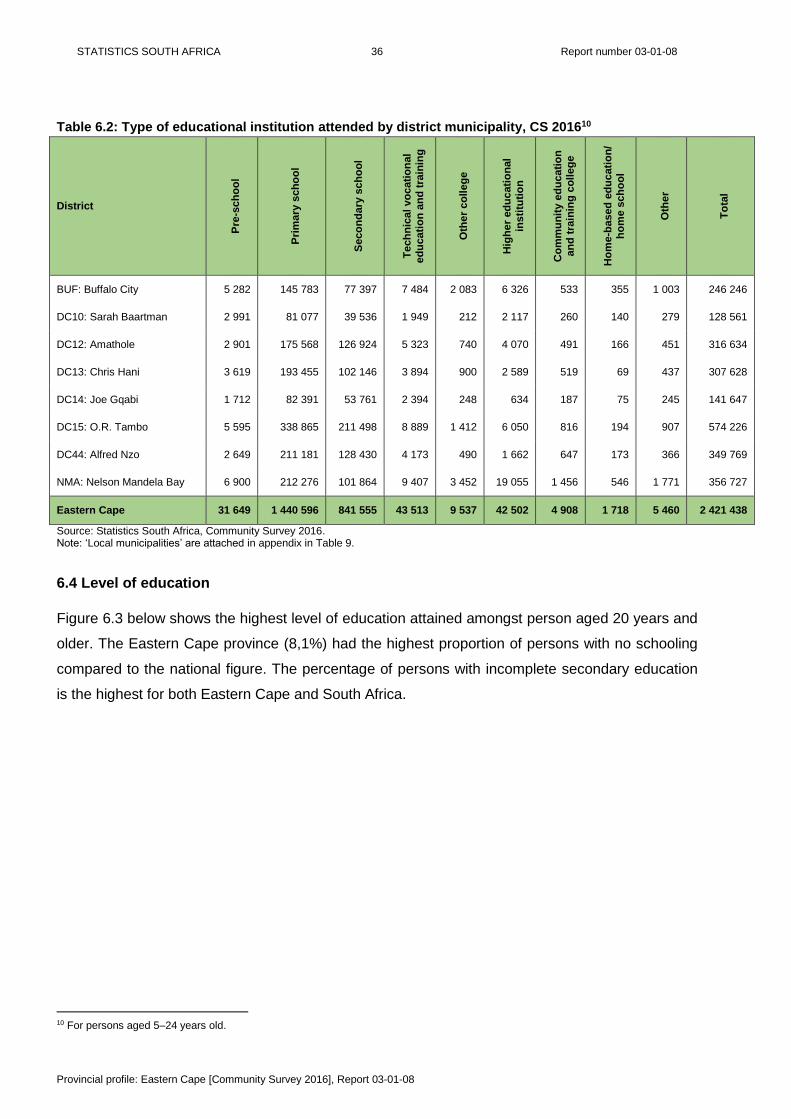
STATISTICS SOUTH AFRICA 36 Report number 03-01-08
Provincial profile: Eastern Cape [Community Survey 2016], Report 03-01-08
Table 6.2: Type of educational institution attended by district municipality, CS 201610
District
Pre
-sch
oo
l
Pri
mary
sch
oo
l
Seco
nd
ary
sch
oo
l
Te
ch
nic
al vo
cati
on
al
ed
uc
ati
on
an
d t
rain
ing
Oth
er
co
lleg
e
Hig
he
r ed
uc
ati
on
al
ins
titu
tio
n
Co
mm
un
ity e
du
cati
on
an
d t
rain
ing
co
lleg
e
Ho
me-b
ased
ed
uc
ati
on
/ h
om
e s
ch
oo
l
Oth
er
To
tal
BUF: Buffalo City 5 282 145 783 77 397 7 484 2 083 6 326 533 355 1 003 246 246
DC10: Sarah Baartman 2 991 81 077 39 536 1 949 212 2 117 260 140 279 128 561
DC12: Amathole 2 901 175 568 126 924 5 323 740 4 070 491 166 451 316 634
DC13: Chris Hani 3 619 193 455 102 146 3 894 900 2 589 519 69 437 307 628
DC14: Joe Gqabi 1 712 82 391 53 761 2 394 248 634 187 75 245 141 647
DC15: O.R. Tambo 5 595 338 865 211 498 8 889 1 412 6 050 816 194 907 574 226
DC44: Alfred Nzo 2 649 211 181 128 430 4 173 490 1 662 647 173 366 349 769
NMA: Nelson Mandela Bay 6 900 212 276 101 864 9 407 3 452 19 055 1 456 546 1 771 356 727
Eastern Cape 31 649 1 440 596 841 555 43 513 9 537 42 502 4 908 1 718 5 460 2 421 438
Source: Statistics South Africa, Community Survey 2016. Note: ‘Local municipalities’ are attached in appendix in Table 9.
6.4 Level of education
Figure 6.3 below shows the highest level of education attained amongst person aged 20 years and
older. The Eastern Cape province (8,1%) had the highest proportion of persons with no schooling
compared to the national figure. The percentage of persons with incomplete secondary education
is the highest for both Eastern Cape and South Africa.
10 For persons aged 5–24 years old.

STATISTICS SOUTH AFRICA 37 Report number 03-01-08
Provincial profile: Eastern Cape [Community Survey 2016], Report 03-01-08
Figure 6.3: Distribution of the population aged 20 years and older by level of education for Eastern
Cape and South Africa, CS 2016
Source: Statistics South Africa, Community Survey 2016.
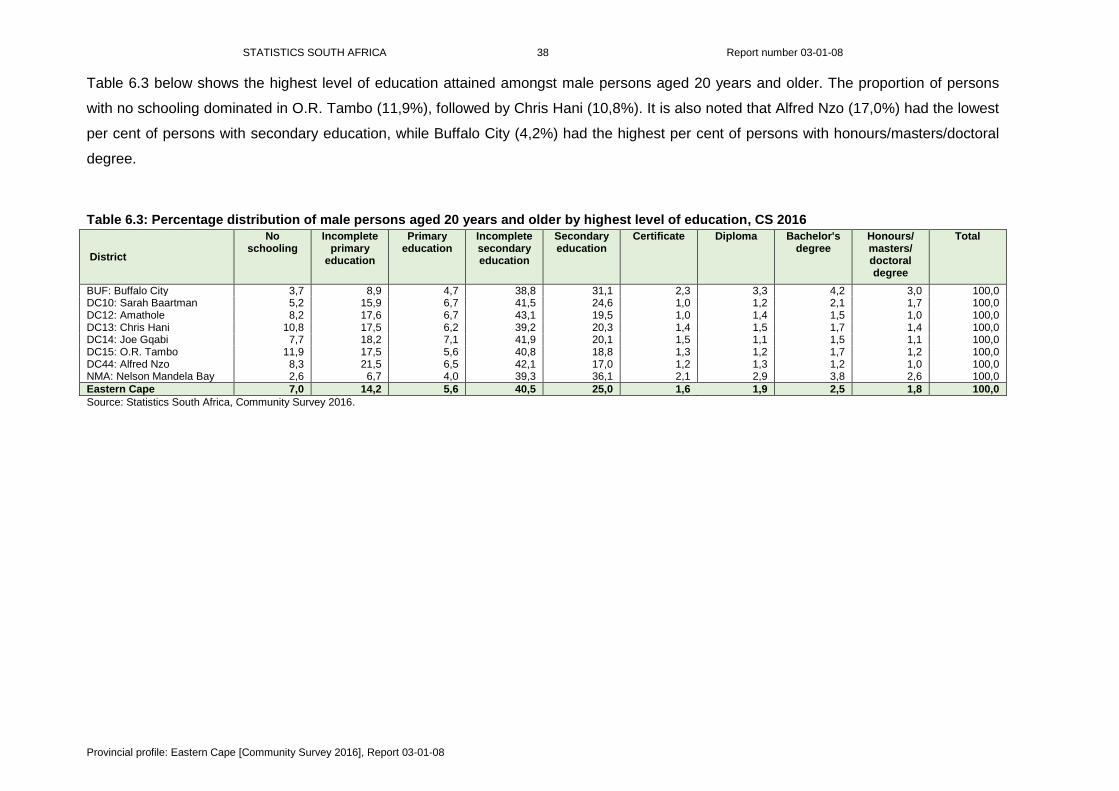
STATISTICS SOUTH AFRICA 38 Report number 03-01-08
Provincial profile: Eastern Cape [Community Survey 2016], Report 03-01-08
Table 6.3 below shows the highest level of education attained amongst male persons aged 20 years and older. The proportion of persons
with no schooling dominated in O.R. Tambo (11,9%), followed by Chris Hani (10,8%). It is also noted that Alfred Nzo (17,0%) had the lowest
per cent of persons with secondary education, while Buffalo City (4,2%) had the highest per cent of persons with honours/masters/doctoral
degree.
Table 6.3: Percentage distribution of male persons aged 20 years and older by highest level of education, CS 2016
District
No schooling
Incomplete primary
education
Primary education
Incomplete secondary education
Secondary education
Certificate Diploma Bachelor's degree
Honours/ masters/ doctoral degree
Total
BUF: Buffalo City 3,7 8,9 4,7 38,8 31,1 2,3 3,3 4,2 3,0 100,0 DC10: Sarah Baartman 5,2 15,9 6,7 41,5 24,6 1,0 1,2 2,1 1,7 100,0 DC12: Amathole 8,2 17,6 6,7 43,1 19,5 1,0 1,4 1,5 1,0 100,0 DC13: Chris Hani 10,8 17,5 6,2 39,2 20,3 1,4 1,5 1,7 1,4 100,0 DC14: Joe Gqabi 7,7 18,2 7,1 41,9 20,1 1,5 1,1 1,5 1,1 100,0 DC15: O.R. Tambo 11,9 17,5 5,6 40,8 18,8 1,3 1,2 1,7 1,2 100,0 DC44: Alfred Nzo 8,3 21,5 6,5 42,1 17,0 1,2 1,3 1,2 1,0 100,0 NMA: Nelson Mandela Bay 2,6 6,7 4,0 39,3 36,1 2,1 2,9 3,8 2,6 100,0
Eastern Cape 7,0 14,2 5,6 40,5 25,0 1,6 1,9 2,5 1,8 100,0
Source: Statistics South Africa, Community Survey 2016.

STATISTICS SOUTH AFRICA 39 Report number 03-01-08
Provincial profile: Eastern Cape [Community Survey 2016], Report 03-01-08
Table 6.4 below shows the highest level of education attained amongst female persons aged 20 years and older. The proportion of persons
with no schooling dominated in O.R. Tambo (15,6%), followed by Chris Hani (13,5%). It is also noted that Alfred Nzo (16,4%) had the lowest
per cent of persons with secondary education, while Buffalo City (3,2%) had the highest per cent of persons with honours/masters/doctoral
degree.
Table 6.4: Percentage distribution of female persons aged 20 years and older by highest level of education, CS 2016
District No
schooling
Incomplete primary
education
Primary education
Incomplete secondary education
Secondary education
Certificate Diploma Bachelor's
degree
Honours/ masters/ doctoral degree
Total
BUF: Buffalo City 4,4 7,2 4,0 37,8 31,6 2,0 4,5 5,2 3,2 100,0
DC10: Sarah Baartman 4,6 15,1 7,2 40,8 25,3 1,3 1,8 2,2 1,7 100,0
DC12: Amathole 12,0 14,5 6,3 41,8 19,0 1,3 2,0 1,8 1,3 100,0
DC13: Chris Hani 13,5 14,8 5,5 38,9 20,3 1,5 1,7 2,1 1,7 100,0
DC14: Joe Gqabi 8,4 18,0 6,5 41,3 19,4 1,9 1,7 1,6 1,3 100,0
DC15: O.R. Tambo 15,6 13,7 4,7 41,1 17,7 1,6 1,7 2,3 1,5 100,0
DC44: Alfred Nzo 9,7 17,8 6,9 43,1 16,4 1,5 1,7 1,8 1,2 100,0
NMA: Nelson Mandela Bay 2,7 6,7 4,3 39,7 35,2 2,2 2,9 3,9 2,4 100,0
Eastern Cape 9,1 12,5 5,4 40,5 23,9 1,7 2,3 2,8 1,9 100,0
Source: Statistics South Africa, Community Survey 2016.
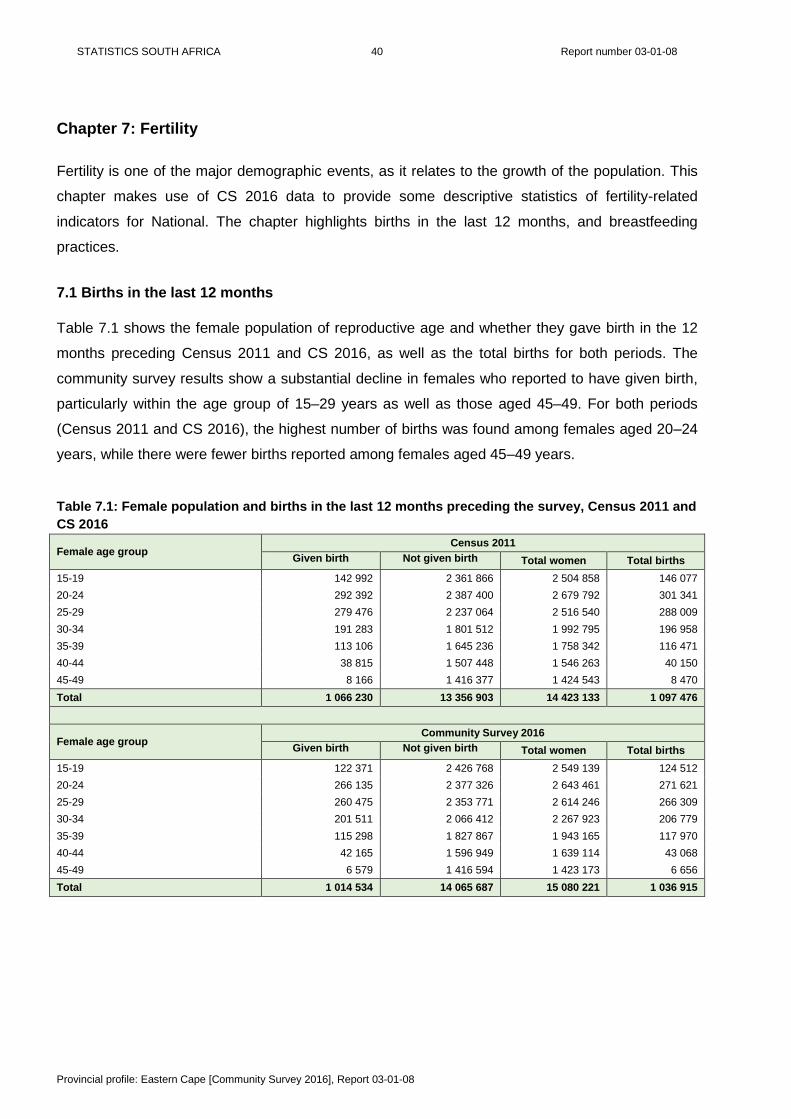
STATISTICS SOUTH AFRICA 40 Report number 03-01-08
Provincial profile: Eastern Cape [Community Survey 2016], Report 03-01-08
Chapter 7: Fertility
Fertility is one of the major demographic events, as it relates to the growth of the population. This
chapter makes use of CS 2016 data to provide some descriptive statistics of fertility-related
indicators for National. The chapter highlights births in the last 12 months, and breastfeeding
practices.
7.1 Births in the last 12 months
Table 7.1 shows the female population of reproductive age and whether they gave birth in the 12
months preceding Census 2011 and CS 2016, as well as the total births for both periods. The
community survey results show a substantial decline in females who reported to have given birth,
particularly within the age group of 15–29 years as well as those aged 45–49. For both periods
(Census 2011 and CS 2016), the highest number of births was found among females aged 20–24
years, while there were fewer births reported among females aged 45–49 years.
Table 7.1: Female population and births in the last 12 months preceding the survey, Census 2011 and
CS 2016
Female age group Census 2011
Given birth Not given birth Total women Total births
15-19 142 992 2 361 866 2 504 858 146 077
20-24 292 392 2 387 400 2 679 792 301 341
25-29 279 476 2 237 064 2 516 540 288 009
30-34 191 283 1 801 512 1 992 795 196 958
35-39 113 106 1 645 236 1 758 342 116 471
40-44 38 815 1 507 448 1 546 263 40 150
45-49 8 166 1 416 377 1 424 543 8 470
Total 1 066 230 13 356 903 14 423 133 1 097 476
Female age group Community Survey 2016
Given birth Not given birth Total women Total births
15-19 122 371 2 426 768 2 549 139 124 512
20-24 266 135 2 377 326 2 643 461 271 621
25-29 260 475 2 353 771 2 614 246 266 309
30-34 201 511 2 066 412 2 267 923 206 779
35-39 115 298 1 827 867 1 943 165 117 970
40-44 42 165 1 596 949 1 639 114 43 068
45-49 6 579 1 416 594 1 423 173 6 656
Total 1 014 534 14 065 687 15 080 221 1 036 915

STATISTICS SOUTH AFRICA 41 Report number 03-01-08
Provincial profile: Eastern Cape [Community Survey 2016], Report 03-01-08
7.2 Breastfeeding practices
Table 7.2 profiles the breastfeeding practices of women within the province. There were noticeable
differentials in breastfeeding practices across the province. At provincial level, seven in ten women
(76,8%) reported to have breastfed their last child. The district profile showed that two district
municipalities, Joe Gqabi and Sarah Baartman, recorded the highest percentage of women that
breastfed their last child whilst O.R. Tambo (73,7%) and Amathole (73,8%) were among the
districts with the lowest prevalence of breastfeeding.
Table 7.2: Women breastfeeding practices by district, municipality and province, CS 2016
District/province Breastfeeding practices (last child born alive)
Breastfed Did not breastfeed Prevalence Total
DC10 Sarah Baartman 64 469 13 725 82,4 78 194
DC12 Amathole 100 356 35 590 73,8 135 946
DC13 Chris Hani 87 432 22 053 79,9 109 485
DC14 Joe Gqabi 47 365 9 166 83,8 56 531
DC15 O.R. Tambo 166 650 59 339 73,7 225 989
DC44 Alfred Nzo 107 784 28 761 78,9 136 544
BUF Buffalo City 104 376 31 715 76,7 136 091
NMA Nelson Mandela Bay 133 975 45 562 74,6 179 537
Eastern Cape 812 406 245 911 76,8 1 058 317
Source: Statistics South Africa, Community Survey 2016. Note: ‘Local municipalities’ are attached in appendix in Table 11. The analysis is ONLY limited to women who have ever given birth. Excludes ‘Unspecified’ (10) and ‘Do not know’ (12 113).

STATISTICS SOUTH AFRICA 42 Report number 03-01-08
Provincial profile: Eastern Cape [Community Survey 2016], Report 03-01-08
Chapter 8: Household characteristics and access to services
8.1 Introduction
This chapter profiles household characteristics as well as access to basic services. Besides
knowledge of the population size and its structure, knowledge of household characteristics is
equally important for development and planning. In order to highlight living circumstances of
households in Eastern Cape, the chapter focuses on various subsections. These include,
household size, household headship, housing, access to basic services, type of energy sources
used by households, ownership of household goods, access to internet services, agricultural
activities and food security; crime experiences and perceptions of safety; perceptions of municipal
problems and services; and the rating of the quality of basic services rendered. The chapter also
showcases analysis from some of the new questions asked in CS 2016.
8.2 Household size
Table 8.1 and Map 8.1 show the number of households (as well as the average household size) in
Eastern Cape. Overall, the average household size remained the same (3,9 persons per
household) between 2011 and 2016 in the province. The number of households in the province
increased from about 1,7 million households to about 1,8 million households from 2011 to 2016.
Certain district differentials were noticeable. The average household size increased in three
districts (Amathole, Chris Hani, and Joe Gqabi), while it remained unchanged or decreased in the
rest of the districts between 2011 and 2016. As depicted in Map 8.1, for CS 2016 the municipalities
that had the largest number of households in the province were Buffalo City and Nelson Mandela
Bay.
Table 8.1: Number of households and average household size by district municipality, Census 2011
and CS 2016
District
Census 2011 CS 2016
Population Households
Avera
ge
ho
useh
old
siz
e
Population Households
Avera
ge
ho
useh
old
siz
e
DC10: Sarah Baartman 450 584 125 628 3,6 479 923 138 182 3,5
DC12: Amathole 855 793 227 821 3,8 880 790 213 763 4,1
DC13: Chris Hani 806 478 213 842 3,8 840 055 194 291 4,3
DC14: Joe Gqabi 348 667 97 470 3,6 372 912 95 107 3,9
DC15: O.R. Tambo 1 366 045 298 531 4,6 1 457 384 314 080 4,6
DC44: Alfred Nzo 801 344 169 258 4,7 867 864 195 975 4,4
BUF: Buffalo City 781 027 230 515 3,4 834 997 253 477 3,3
NMA: Nelson Mandela Bay 1 152 115 324 279 3,6 1 263 051 368 520 3,4
Eastern Cape 6 562 053 1 687 343 3,9 6 996 976 1 773 395 3,9

STATISTICS SOUTH AFRICA 43 Report number 03-01-08
Provincial profile: Eastern Cape [Community Survey 2016], Report 03-01-08
Source: Statistics South Africa, Census 2011 and Community Survey 2016. Note: ‘Local municipalities’ are attached in appendix in Table 8.1.
Map 8.1: Distribution of households by municipality, CS 2016
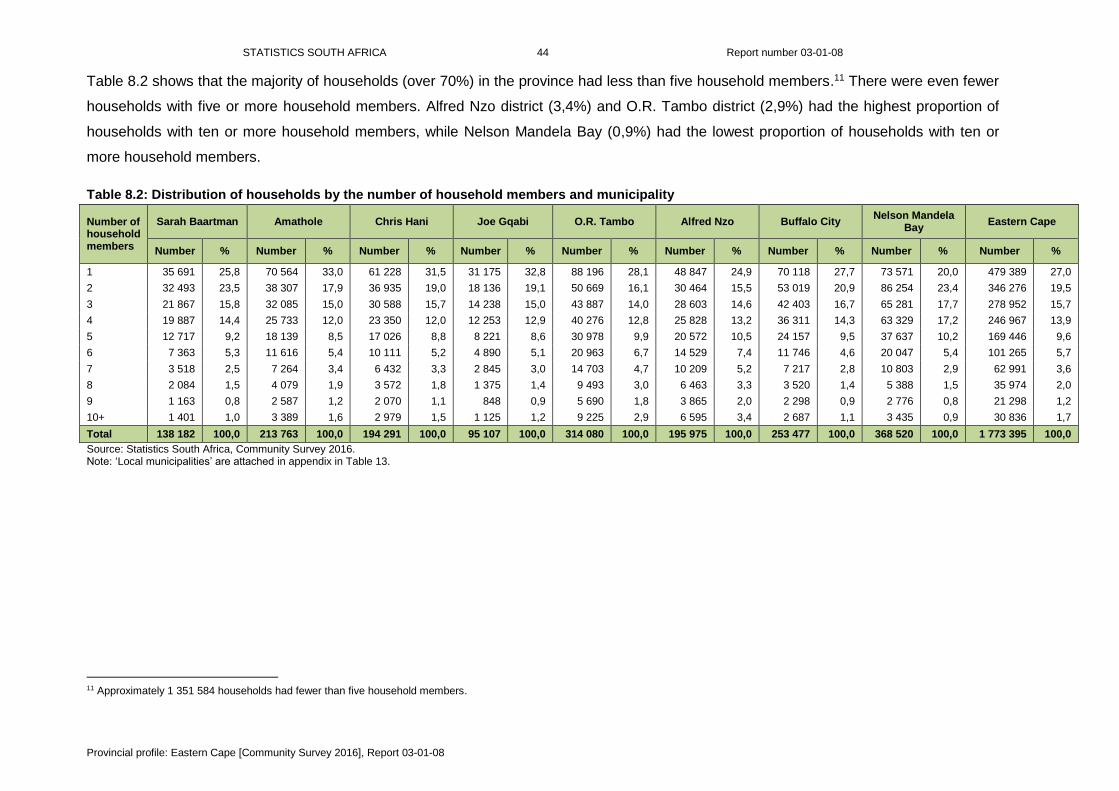
STATISTICS SOUTH AFRICA 44 Report number 03-01-08
Provincial profile: Eastern Cape [Community Survey 2016], Report 03-01-08
Table 8.2 shows that the majority of households (over 70%) in the province had less than five household members.11 There were even fewer
households with five or more household members. Alfred Nzo district (3,4%) and O.R. Tambo district (2,9%) had the highest proportion of
households with ten or more household members, while Nelson Mandela Bay (0,9%) had the lowest proportion of households with ten or
more household members.
Table 8.2: Distribution of households by the number of household members and municipality
Number of household members
Sarah Baartman Amathole Chris Hani Joe Gqabi O.R. Tambo Alfred Nzo Buffalo City Nelson Mandela
Bay Eastern Cape
Number % Number % Number % Number % Number % Number % Number % Number % Number %
1 35 691 25,8 70 564 33,0 61 228 31,5 31 175 32,8 88 196 28,1 48 847 24,9 70 118 27,7 73 571 20,0 479 389 27,0
2 32 493 23,5 38 307 17,9 36 935 19,0 18 136 19,1 50 669 16,1 30 464 15,5 53 019 20,9 86 254 23,4 346 276 19,5
3 21 867 15,8 32 085 15,0 30 588 15,7 14 238 15,0 43 887 14,0 28 603 14,6 42 403 16,7 65 281 17,7 278 952 15,7
4 19 887 14,4 25 733 12,0 23 350 12,0 12 253 12,9 40 276 12,8 25 828 13,2 36 311 14,3 63 329 17,2 246 967 13,9
5 12 717 9,2 18 139 8,5 17 026 8,8 8 221 8,6 30 978 9,9 20 572 10,5 24 157 9,5 37 637 10,2 169 446 9,6
6 7 363 5,3 11 616 5,4 10 111 5,2 4 890 5,1 20 963 6,7 14 529 7,4 11 746 4,6 20 047 5,4 101 265 5,7
7 3 518 2,5 7 264 3,4 6 432 3,3 2 845 3,0 14 703 4,7 10 209 5,2 7 217 2,8 10 803 2,9 62 991 3,6
8 2 084 1,5 4 079 1,9 3 572 1,8 1 375 1,4 9 493 3,0 6 463 3,3 3 520 1,4 5 388 1,5 35 974 2,0
9 1 163 0,8 2 587 1,2 2 070 1,1 848 0,9 5 690 1,8 3 865 2,0 2 298 0,9 2 776 0,8 21 298 1,2
10+ 1 401 1,0 3 389 1,6 2 979 1,5 1 125 1,2 9 225 2,9 6 595 3,4 2 687 1,1 3 435 0,9 30 836 1,7
Total 138 182 100,0 213 763 100,0 194 291 100,0 95 107 100,0 314 080 100,0 195 975 100,0 253 477 100,0 368 520 100,0 1 773 395 100,0
Source: Statistics South Africa, Community Survey 2016. Note: ‘Local municipalities’ are attached in appendix in Table 13.
11 Approximately 1 351 584 households had fewer than five household members.
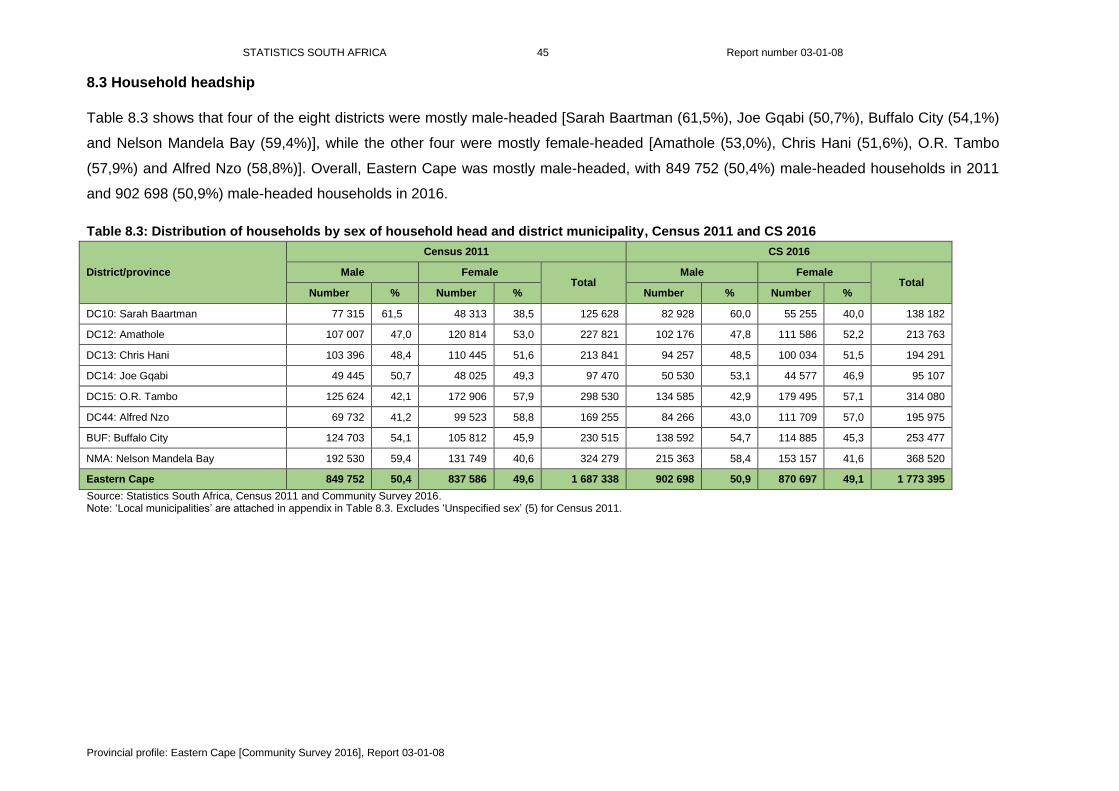
STATISTICS SOUTH AFRICA 45 Report number 03-01-08
Provincial profile: Eastern Cape [Community Survey 2016], Report 03-01-08
8.3 Household headship
Table 8.3 shows that four of the eight districts were mostly male-headed [Sarah Baartman (61,5%), Joe Gqabi (50,7%), Buffalo City (54,1%)
and Nelson Mandela Bay (59,4%)], while the other four were mostly female-headed [Amathole (53,0%), Chris Hani (51,6%), O.R. Tambo
(57,9%) and Alfred Nzo (58,8%)]. Overall, Eastern Cape was mostly male-headed, with 849 752 (50,4%) male-headed households in 2011
and 902 698 (50,9%) male-headed households in 2016.
Table 8.3: Distribution of households by sex of household head and district municipality, Census 2011 and CS 2016
District/province
Census 2011 CS 2016
Male Female Total
Male Female Total
Number % Number % Number % Number %
DC10: Sarah Baartman 77 315 61,5 48 313 38,5 125 628 82 928 60,0 55 255 40,0 138 182
DC12: Amathole 107 007 47,0 120 814 53,0 227 821 102 176 47,8 111 586 52,2 213 763
DC13: Chris Hani 103 396 48,4 110 445 51,6 213 841 94 257 48,5 100 034 51,5 194 291
DC14: Joe Gqabi 49 445 50,7 48 025 49,3 97 470 50 530 53,1 44 577 46,9 95 107
DC15: O.R. Tambo 125 624 42,1 172 906 57,9 298 530 134 585 42,9 179 495 57,1 314 080
DC44: Alfred Nzo 69 732 41,2 99 523 58,8 169 255 84 266 43,0 111 709 57,0 195 975
BUF: Buffalo City 124 703 54,1 105 812 45,9 230 515 138 592 54,7 114 885 45,3 253 477
NMA: Nelson Mandela Bay 192 530 59,4 131 749 40,6 324 279 215 363 58,4 153 157 41,6 368 520
Eastern Cape 849 752 50,4 837 586 49,6 1 687 338 902 698 50,9 870 697 49,1 1 773 395
Source: Statistics South Africa, Census 2011 and Community Survey 2016. Note: ‘Local municipalities’ are attached in appendix in Table 8.3. Excludes ‘Unspecified sex’ (5) for Census 2011.

STATISTICS SOUTH AFRICA 46 Report number 03-01-08
Provincial profile: Eastern Cape [Community Survey 2016], Report 03-01-08
Table 8.4 shows the age differentials of household heads by district municipality. Overall, household heads were mainly aged between 30
and 59 years. Compared to other districts in the province, the O.R. Tambo district was one with a higher number of persons aged 10–14
years as well as persons aged 75 years and older who were household heads. Households in Nelson Mandela Bay were mostly headed by
persons aged 30–74 years.
Table 8.4: Distribution of households by age group of household head and district municipality, CS 2016
Age group Sarah
Baartman Amathole Chris Hani Joe Gqabi O.R. Tambo Alfred Nzo Buffalo City
Nelson Mandela Bay
Eastern Cape
10-14 19 456 576 145 837 588 96 83 2 799
15 - 19 1 955 8 174 6 607 4 042 14 313 9 613 3 155 2 529 50 389
20 - 24 6 160 16 342 13 622 7 908 28 852 16 803 11 671 14 471 115 829
25 - 29 11 760 22 385 18 780 10 764 34 192 20 540 23 974 24 372 166 767
30 - 34 18 590 24 176 22 333 14 101 38 624 22 610 32 023 38 824 211 283
35 - 39 14 496 14 595 14 152 8 864 27 048 14 271 28 502 38 804 160 732
40 - 44 14 625 17 445 15 728 7 876 27 371 15 593 28 331 44 210 171 179
45 - 49 15 197 19 105 17 436 7 605 28 452 15 236 30 742 44 600 178 373
50 - 54 11 344 15 403 13 545 5 875 20 413 12 363 24 654 37 193 140 789
55 - 59 11 262 17 817 15 200 6 118 21 875 13 154 24 155 36 743 146 325
60 - 64 10 809 15 763 15 226 5 935 17 899 12 891 18 633 31 703 128 860
65 - 69 8 162 13 409 13 524 5 550 17 635 14 289 9 856 22 917 105 343
70 - 74 5 261 10 040 9 424 3 607 11 546 9 617 7 011 14 664 71 171
75 - 79 4 789 9 030 9 414 3 206 12 354 7 992 6 043 9 487 62 315
80 - 84 2 144 4 955 4 654 1 964 6 800 5 560 2 515 5 014 33 607
85+ 1 608 4 666 4 067 1 547 5 868 4 857 2 115 2 903 27 631
Total 138 182 213 763 194 291 95 107 314 080 195 975 253 477 368 520 1 773 395
Source: Statistics South Africa, Community Survey 2016. Note: ‘Local municipalities’ are attached in appendix in Table 8.4.

STATISTICS SOUTH AFRICA 47 Report number 03-01-08
Provincial profile: Eastern Cape [Community Survey 2016], Report 03-01-08
8.4 Housing
8.4.1 Type of dwelling12
Figure 8.1 shows the distribution of households by type of main dwelling in Eastern Cape and
South Africa. The results showed that the province was mostly comprised of households in formal
dwellings during both 2011 and 2016 at over 60%, respectively. However, those living in formal
dwellings in the province were 14 percentage points lower than the national average in CS 2016
(65,1% and 79,2%). The percentage of households in traditional dwellings were almost four times
higher than the national average in CS 2016 (26,6% and 7%, respectively). On the other hand,
households in informal dwellings constituted about 7% for both periods (2011 and 2016).
Figure 8.1: Percentage distribution of households by type of main dwelling, Census 2011 and CS
2016
Source: Statistics South Africa, Census 2011 and Community Survey 2016.
Table 8.5 shows that Nelson Mandela Bay (92,4%) and Sarah Baartman (87,1%) had the highest
proportion of households living in formal dwellings. Informal dwellings were more prevalent in
Buffalo City (24,9%) while O.R. Tambo and Alfred Nzo districts recorded the highest proportion of
households in traditional dwellings ( 170 173 and 104 679 respectively).
12 For more information on how these variables are recoded, see: http://cs2016.statssa.gov.za/wp-content/uploads/2016/06/CS-2016-Provinces-at-a-glance.pdf.
63.2 65.1
77.6 79.2
28.2 26.6
7.9 7.07.7 7.4
13.6 13
0.9 0.9 0.9 0.80
10
20
30
40
50
60
70
80
90
Census 2011 CS 2016 Census 2011 CS 2016
Eastern Cape South Africa
%
Formal dwelling
Traditional dwelling
Informal dwelling
Other

STATISTICS SOUTH AFRICA 48 Report number 03-01-08
Provincial profile: Eastern Cape [Community Survey 2016], Report 03-01-08
Table 8.5: Distribution of households by type of main dwelling and districts, CS 2016
District Formal dwelling
Traditional dwelling
Informal dwelling Other Total
Number % Number % Number % Number %
DC10 Sarah Baartman 120 331 87,1 3 339 2,4 12 967 9,4 1 546 1,1 138 182
DC12 Amathole 119 571 55,9 82 013 38,4 11 332 5,3 818 0,4 213 734
DC13 Chris Hani 109 460 56,3 75 660 38,9 5 564 2,9 3 587 1,8 194 271
DC14 Joe Gqabi 66 225 69,6 24 367 25,6 4 116 4,3 399 0,4 95 107
DC15 O.R. Tambo 136 913 43,6 170 173 54,2 3 989 1,3 2 975 0,9 314 050
DC44 Alfred Nzo 83 543 42,6 104 679 53,4 4 447 2,3 3 285 1,7 195 954
BUF Buffalo City 177 913 70,2 10 600 4,2 62 980 24,9 1 944 0,8 253 437
NMA Nelson Mandela Bay 340 887 92,5 868 0,2 25 490 6,9 1 274 0,3 368 520
Eastern Cape 1 154 843 65,1 471 699 26,6 130 885 7,4 15 828 0,9 1 773 255
Source: Statistics South Africa, Community Survey 2016. Note: ‘Local municipalities’ are attached in appendix in Table 16. Excludes ‘Unspecified’ (140).
8.4.2 RDP or government-subsidised dwellings
Figure 8.2 below shows that Free State (30,7%) had the highest proportion of households who
reported that they were living in RDP/government-subsidised dwellings, followed by Northern Cape
(30,1%) and Western Cape (30,0%). Limpopo (16,4%) had the lowest percentage of households
that reported living in RDP/government-subsidised dwellings, while Eastern Cape (22,0%) is below
the national average.
Figure 8.2: Percentage distribution of households with RDP/government-subsidised dwellings in
South Africa, CS 2016
Source: Statistics South Africa, Community Survey 2016.
The proportion of households that lived in RDP/government-subsidised dwellings is presented in
Table 8.6 below. There were high proportions of households in Sarah Baartman (46,4%) and
30.0
22.0
30.1 30.7
19.621.1
25.2
19.7
16.4
23.3
%
Province
RDP/government-subsidised dwellings

STATISTICS SOUTH AFRICA 49 Report number 03-01-08
Provincial profile: Eastern Cape [Community Survey 2016], Report 03-01-08
Nelson Mandela Bay (40,2%) that had RDP/government-subsidised dwellings. O.R. Tambo (6,3%)
and Alfred Nzo (6,6%) districts recorded the lowest percentage of households that had
RDP/government-subsidised dwellings.
Table 8.6: Distribution of households in RDP/government-subsidised dwellings by district
municipalities, CS 2016
District
RDP/government-subsidised dwellings
Not RDP/government-subsidised dwellings Total
Number % Number %
DC10 Sarah Baartman 63 752 46,4 73 531 53,6 137 282
DC12 Amathole 24 450 11,6 187 136 88,4 211 586
DC13 Chris Hani 41 184 21,4 151 529 78,6 192 713
DC14 Joe Gqabi 18 879 19,9 76 095 80,1 94 974
DC15 O.R. Tambo 19 730 6,3 293 594 93,7 313 324
DC44 Alfred Nzo 12 978 6,6 182 650 93,4 195 628
BUF Buffalo City 59 735 23,9 190 677 76,1 250 412
NMA Nelson Mandela Bay 146 094 40,2 217 101 59,8 363 195
Eastern Cape 386 802 22,0 1 372 311 78,0 1 759 113
Source: Statistics South Africa, Census 2011 and Community Survey 2016. Note: ‘Local municipalities’ are attached in appendix in Table 17. Excludes ‘Do not know’ (13 423) and ‘Unspecified’ (859).
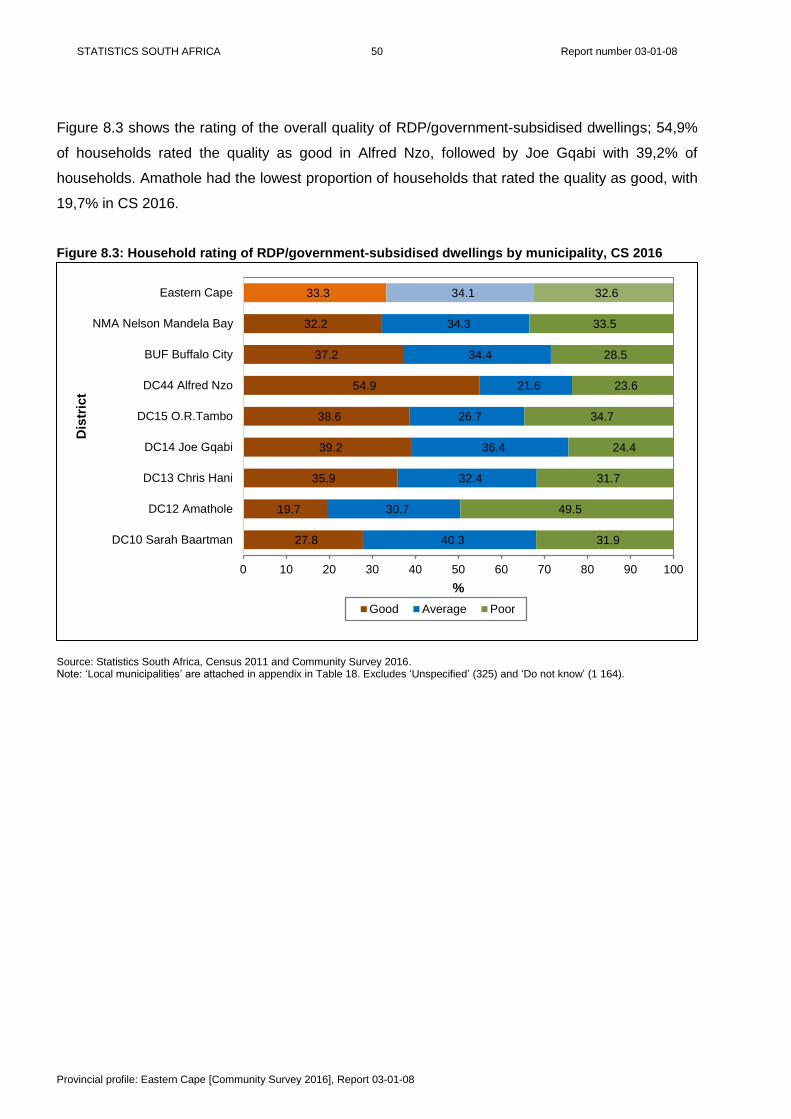
STATISTICS SOUTH AFRICA 50 Report number 03-01-08
Provincial profile: Eastern Cape [Community Survey 2016], Report 03-01-08
Figure 8.3 shows the rating of the overall quality of RDP/government-subsidised dwellings; 54,9%
of households rated the quality as good in Alfred Nzo, followed by Joe Gqabi with 39,2% of
households. Amathole had the lowest proportion of households that rated the quality as good, with
19,7% in CS 2016.
Figure 8.3: Household rating of RDP/government-subsidised dwellings by municipality, CS 2016
Source: Statistics South Africa, Census 2011 and Community Survey 2016. Note: ‘Local municipalities’ are attached in appendix in Table 18. Excludes ‘Unspecified’ (325) and ‘Do not know’ (1 164).
27.8
19.7
35.9
39.2
38.6
54.9
37.2
32.2
33.3
40.3
30.7
32.4
36.4
26.7
21.6
34.4
34.3
34.1
31.9
49.5
31.7
24.4
34.7
23.6
28.5
33.5
32.6
0 10 20 30 40 50 60 70 80 90 100
DC10 Sarah Baartman
DC12 Amathole
DC13 Chris Hani
DC14 Joe Gqabi
DC15 O.R.Tambo
DC44 Alfred Nzo
BUF Buffalo City
NMA Nelson Mandela Bay
Eastern Cape
%
Dis
tric
t
Good Average Poor

STATISTICS SOUTH AFRICA 51 Report number 03-01-08
Provincial profile: Eastern Cape [Community Survey 2016], Report 03-01-08
8.5 Access to water
Table 8.7 shows the distribution of households with access to safe drinking water by district
municipalities. In Eastern Cape, about 27,3% of households have no access to safe drinking water.
Households without access to safe drinking water were mostly found in O.R. Tambo (57,1%),
followed by Alfred Nzo (52,4%).
Table 8.7: Distribution of households by access to safe drinking water and district municipality, CS
2016
District Access to safe drinking water
No access to safe drinking water Total
Number % Number %
DC10 Sarah Baartman 116 933 85,1 20 508 14,9 137 442
DC12 Amathole 157 833 74,9 52 980 25,1 210 813
DC13 Chris Hani 146 063 76,0 46 017 24,0 192 080
DC14 Joe Gqabi 68 280 72,7 25 636 27,3 93 916
DC15 O.R. Tambo 133 977 42,9 178 015 57,1 311 991
DC44 Alfred Nzo 92 190 47,6 101 485 52,4 193 675
BUF Buffalo City 230 103 91,6 21 204 8,4 251 306
NMA Nelson Mandela Bay 331 908 90,5 34 811 9,5 366 719
Eastern Cape 1 277 288 72,7 480 655 27,3 1 757 943
Source: Statistics South Africa, Community Survey 2016. Note: ‘Local municipalities’ are attached in appendix in Table 8.7. Excludes ‘Do not know’ (11 810) and ‘Unspecified’ (3 642).

STATISTICS SOUTH AFRICA 52 Report number 03-01-08
Provincial profile: Eastern Cape [Community Survey 2016], Report 03-01-08
Table 8.8 below shows that 33,4% of households in the province reported that their main source of water for drinking was piped water inside
the dwelling/house. Nelson Mandela Bay (77,3%), Buffalo City (50,2%) and Sarah Baartman (48,1%) had the highest per cent of households
with access to piped (drinking) water inside the dwelling/house, while Alfred Nzo (2,9%) and O.R. Tambo (6,4%) recorded the lowest per
cent of households with access to piped (drinking) water inside the dwelling/house.
Table 8.8: Distribution of households by main source of water for drinking, CS 2016
Source of water for drinking Sarah
Baartman Amathole Chris Hani Joe Gqabi O.R. Tambo Alfred Nzo Buffalo City
Nelson Mandela
Bay
Eastern Cape
Piped (tap) water inside the dwelling/house 66 453 26 306 43 385 18 232 20 181 5 645 127 358 284 869 592 428
Piped (tap) water inside yard 49 592 27 596 41 972 25 515 39 053 25 508 50 442 59 199 318 877
Piped water on community stand 8 920 71 109 51 787 17 271 43 381 42 174 54 338 12 681 301 662
Borehole in the yard 1 020 536 1 378 1 327 428 498 484 1 109 6 779
Rain-water tank in yard 5 178 29 471 7 314 4 097 32 396 10 727 1 980 897 92 060
Neighbour’s tap 927 2 695 2 400 3 307 4 082 3 191 3 896 794 21 292
Public/communal tap 1 794 23 688 18 865 6 102 15 379 13 369 11 621 6 150 96 968
Water-carrier/tanker 959 3 140 1 378 702 3 844 2 262 2 536 491 15 312
Borehole outside the yard 877 531 1 840 1 485 1 880 1 832 98 570 9 115
Flowing water/stream/river 877 27 497 20 722 11 560 138 347 73 312 410 83 272 808
Well 61 68 20 2 374 1 758 3 208 7 124 7 621
Spring 262 301 2 002 2 982 12 705 13 759 68 206 32 285
Other 1 260 824 1 227 153 647 491 240 1 347 6 189
Total 138 182 213 763 194 291 95 107 314 080 195 975 253 477 368 520 1 773 395
%
Piped (tap) water inside the dwelling/house 48,1 12,3 22,3 19,2 6,4 2,9 50,2 77,3 33,4
Piped (tap) water inside yard 35,9 12,9 21,6 26,8 12,4 13,0 19,9 16,1 18,0
Piped water on community stand 6,5 33,3 26,7 18,2 13,8 21,5 21,4 3,4 17,0
Borehole in the yard 0,7 0,3 0,7 1,4 0,1 0,3 0,2 0,3 0,4
Rain-water tank in yard 3,7 13,8 3,8 4,3 10,3 5,5 0,8 0,2 5,2
Neighbour’s tap 0,7 1,3 1,2 3,5 1,3 1,6 1,5 0,2 1,2
Public/communal tap 1,3 11,1 9,7 6,4 4,9 6,8 4,6 1,7 5,5
Water-carrier/tanker 0,7 1,5 0,7 0,7 1,2 1,2 1,0 0,1 0,9
Borehole outside the yard 0,6 0,2 0,9 1,6 0,6 0,9 0,0 0,2 0,5
Flowing water/stream/river 0,6 12,9 10,7 12,2 44,0 37,4 0,2 0,0 15,4

STATISTICS SOUTH AFRICA 53 Report number 03-01-08
Provincial profile: Eastern Cape [Community Survey 2016], Report 03-01-08
Source of water for drinking Sarah
Baartman Amathole Chris Hani Joe Gqabi O.R. Tambo Alfred Nzo Buffalo City
Nelson Mandela
Bay
Eastern Cape
Well 0,0 0,0 0,0 2,5 0,6 1,6 0,0 0,0 0,4
Spring 0,2 0,1 1,0 3,1 4,0 7,0 0,0 0,1 1,8
Other 0,9 0,4 0,6 0,2 0,2 0,3 0,1 0,4 0,3
Total 100,0 100,0 100,0 100,0 100,0 100,0 100,0 100,0 100,0
Source: Statistics South Africa, Community Survey 2016. Note: ‘Local municipalities’ are attached in appendix in Tables 20 and 21.

STATISTICS SOUTH AFRICA 54 Report number 03-01-08
Provincial profile: Eastern Cape [Community Survey 2016], Report 03-01-08
Map 8.2: Percentage of households with access to piped water by municipality, CS 2016
Note: Piped water = Piped water inside the dwelling/house, Piped water inside yard and Piped water on community stand.

STATISTICS SOUTH AFRICA 55 Report number 03-01-08
Provincial profile: Eastern Cape [Community Survey 2016], Report 03-01-08
Over one million (67,8%) households in the province reported that their supplier of drinking water13 was the municipality as per Table 8.9
below, while 19 862 (1,1%) households reported that their main source of drinking water was supplied by a water vendor. O.R. Tambo
(57,3%) and Alfred Nzo (51,6%) reported that their drinking water was mainly from flowing water/stream/river/spring/rain water.
Table 8.9: Distribution of households by main source of drinking water supplier, CS 2016
District A municipality Other water scheme A water vendor Own service
Flowing water/stream/river/ spring/rain water
Total
Number % Number % Number % Number % Number % Number
DC10 Sarah Baartman 120 072 87,2 1 318 1,0 1 121 0,8 9 095 6,6 6 046 4,4 137 652
DC12 Amathole 135 981 64,1 12 638 6,0 1 769 0,8 7 552 3,6 54 138 25,5 212 079
DC14 Joe Gqabi 51 036 54,0 14 116 14,9 809 0,9 6 537 6,9 22 079 23,3 94 576
DC15 O.R. Tambo 100 365 32,2 18 227 5,8 5 029 1,6 9 632 3,1 178 732 57,3 311 985
DC44 Alfred Nzo 64 902 33,4 19 135 9,8 2 534 1,3 7 670 3,9 100 320 51,6 94 561
BUF Buffalo City 234 389 93,3 11 650 4,6 1 040 0,4 2 217 0,9 1 978 0,8 251 274
NMA Nelson Mandela Bay 359 965 97,8 2 242 0,6 2 181 0,6 2 628 0,7 885 0,2 367 901
Eastern Cape 1 195 046 67,8 96 378 5,5 19 862 1,1 55 255 3,1 395 933 22,5 1 762 475
Source: Statistics South Africa, Community Survey 2016. Note: ‘Local municipalities’ are attached in appendix in Table 22. Excludes ‘Do not know’ (10 598) and ‘Unspecified’ (322).
13 Main source of drinking water supplier

STATISTICS SOUTH AFRICA 56 Report number 03-01-08
Provincial profile: Eastern Cape [Community Survey 2016], Report 03-01-08
Table 8.10 profiles only households whose main water supplier is the municipality with regard to
water interruptions in the last three months before the survey. O.R. Tambo (53,5%), followed by
Amathole (49,2%) and Alfred Nzo (48,5%), had the highest percentage of households that
reported municipal water interruptions in the last three months preceding the survey.
Table 8.10: Distribution of households by water interruptions in the last 3 months, CS 2016
District No water interruption Water interruption
Total
Number % Number %
DC10: Sarah Baartman 87 923 74,9 29 466 25,1 117 389
DC12: Amathole 68 322 50,8 66 131 49,2 134 453
DC13: Chris Hani 73 051 57,6 53 769 42,4 126 820
DC14: Joe Gqabi 33 746 66,7 16 820 33,3 50 566
DC15: O.R. Tambo 46 235 46,5 53 093 53,5 99 329
DC44: Alfred Nzo 33 112 51,5 31 237 48,5 64 349
BUF: Buffalo City 162 002 69,7 70 406 30,3 232 407
NMA: Nelson Mandela Bay 313 633 87,8 43 607 12,2 357 240
Eastern Cape 818 023 69,2 364 529 30,8 1 182 552
Source: Statistics South Africa, Community Survey 2016. Note: ‘Local municipalities’ are attached in appendix in Table 23. Excludes ‘Do not know’ (11 667) and ‘Unspecified’ (827).
8.6 Toilet facility
Table 8.11 shows the households by location of toilet facility in the province, by district.
Provincially, 60,3% of households used toilet facilities located in the yard. Alfred Nzo (93,8%) and
O.R. Tambo (91,0%) recorded the highest per cent of households using toilet facilities located in
the yard. Buffalo City (16,0%) had the highest per cent of toilet facilities located outside the yard.
Table 8.11: Distribution of households by location of toilet facility for Eastern Cape districts, CS 2016
District In the dwelling/house In the yard Outside the yard
Total
Number % Number % Number %
DC10: Sarah Baartman 72 656 54,2 55 168 41,1 6 295 4,7 134 118
DC12: Amathole 29 260 15,7 153 608 82,3 3 705 2,0 186 573
DC13: Chris Hani 49 744 29,1 114 776 67,2 6 268 3,7 170 787
DC14: Joe Gqabi 23 598 26,4 63 242 70,8 2 501 2,8 89 341
DC15: O.R. Tambo 21 851 7,5 265 483 91,0 4 543 1,6 291 877
DC44: Alfred Nzo 9 684 5,2 173 146 93,8 1 819 1,0 184 649
BUF: Buffalo City 127 158 51,8 79 100 32,2 39 215 16,0 245 473
NMA: Nelson Mandela Bay 258 235 70,8 101 735 27,9 4 581 1,3 364 551
Eastern Cape 592 186 35,5 1 006 257 60,3 68 927 4,1 1 667 370
Source: Statistics South Africa, Community Survey 2016. Note: ‘Local municipalities’ are attached in appendix in Table 24. Excludes ‘Not applicable’ (19) and ‘Unspecified’ (1 472).

STATISTICS SOUTH AFRICA 57 Report number 03-01-08
Provincial profile: Eastern Cape [Community Survey 2016], Report 03-01-08
Table 8.12 shows that Nelson Mandela Bay had the highest proportion (93,2%) of households that had a flush toilet in 2016, while Amathole
(12,6%) and Chris Hani (12,0%) had the highest proportion of households without a toilet facility.
Table 8.12: Distribution of households by type of toilet facility for Eastern Cape districts, CS 2016
District Flush toilet Chemical toilet Pit latrine/toilet Ecological toilet Bucket toilet Other None
Total Number % Number % Number % Number % Number % Number % Number %
DC10: Sarah Baartman 113 041 81,8 540 0,4 9 419 6,8 151 0,1 7 480 5,4 3 602 2,6 3 950 2,9 138 182
DC12: Amathole 41 394 19,4 11 029 5,2 126 897 59,4 1 150 0,5 1 255 0,6 5 021 2,3 27 016 12,6 213 763
DC13: Chris Hani 65 943 33,9 17 369 8,9 77 771 40,0 728 0,4 2 818 1,5 6 370 3,3 23 292 12,0 194 291
DC14: Joe Gqabi 32 401 34,1 8 326 8,8 43 269 45,5 2 339 2,5 1 195 1,3 1 899 2,0 5 678 6,0 95 107
DC15: O.R. Tambo 31 675 10,1 46 793 14,9 200 560 63,9 2 543 0,8 4 426 1,4 6 117 1,9 21 968 7,0 314 080
DC44: Alfred Nzo 10 021 5,1 7 879 4,0 160 749 82,0 282 0,1 1 050 0,5 4 779 2,4 11 216 5,7 195 975
BUF: Buffalo City 191 174 75,4 6 963 2,7 39 767 15,7 522 0,2 2 954 1,2 4 492 1,8 7 605 3,0 253 477
NMA: Nelson Mandela Bay 343 491 93,2 294 0,1 2 600 0,7 13 0,0 17 139 4,7 1 172 0,3 3 810 1,0 368 520
Eastern Cape 829 140 46,8 99 193 5,6 661 033 37,3 7 728 0,4 38 317 2,2 33 452 1,9 104 533 5,9 1 773 395
Source: Statistics South Africa, Community Survey 2016. Note: ‘Local municipalities’ are attached in appendix in Table 25.
STATISTICS SOUTH AFRICA 58 Report number 03-01-08
Provincial profile: Eastern Cape [Community Survey 2016], Report 03-01-08
Map 8.3: Percentage of households with access to flush/chemical toilet by local municipality, CS 2016

STATISTICS SOUTH AFRICA 59 Report number 03-01-08
Provincial profile: Eastern Cape [Community Survey 2016], Report 03-01-08
8.7 Access to electricity
Table 8.13 shows the distribution of households by main type of electric energy source in the province. About 1,3 million households in the
province reported that they had access to in-house pre-paid electricity. There was also a large number of households without access to
electricity (206 456). With regard to the districts, over 240 000 households in Nelson Mandela Bay and O.R. Tambo district reported that they
had access to in-house pre-paid electricity. Compared to other districts, the largest number of households without access to electricity was in
Alfred Nzo district.
Table 8.13: Distribution of households by main type of electric energy source, CS 2016
District In-house
conventional meter
In-house pre-paid meter
Connected to other source
which household
pays for
Connected to other source
which household is not paying for
Solar home system
Generator/ battery
Other No access to
electricity Total
DC10 Sarah Baartman 19 811 102 986 2 673 1 324 240 306 499 10 344 138 182
DC12 Amathole 10 846 167 607 590 195 3 187 131 332 30 874 213 763
DC13 Chris Hani 14 989 161 059 2 146 1 042 1 612 95 578 12 769 194 291
DC14 Joe Gqabi 5 537 71 630 1 265 75 618 99 840 15 044 95 107
DC15 O.R. Tambo 17 585 245 129 2 957 6 043 241 458 1 334 40 334 314 080
DC44 Alfred Nzo 11 560 114 234 1 178 353 12 886 365 628 54 771 195 975
BUF Buffalo City 22 274 183 565 3 865 9 608 73 248 2 679 31 165 253 477
NMA Nelson Mandela Bay 45 858 300 952 4 029 2 865 174 46 3 441 11 155 368 520
Eastern Cape 148 460 1 347 162 18 703 21 505 19 031 1 747 10 331 206 456 1 773 395
Source: Statistics South Africa, Community Survey 2016. Note: ‘Local municipalities’ are attached in appendix in Table 26.

STATISTICS SOUTH AFRICA 60 Report number 03-01-08
Provincial profile: Eastern Cape [Community Survey 2016], Report 03-01-08
Map 8.4: Percentage of households with access to electricity by local municipality, Eastern Cape, CS 2016

STATISTICS SOUTH AFRICA 61 Report number 03-01-08
Provincial profile: Eastern Cape [Community Survey 2016], Report 03-01-08
Table 8.14 presents the distribution of households by type of electricity supplier. Overall, 52,7% of households reported that their electricity
was supplied by Eskom (pre-paid) in the province. There was also a high proportion of households whose electricity was supplied by the
municipality (pre-paid) at 42,7%; the same was observed within the districts, although there were noticeable differentials among the
metropolitan districts. Nelson Mandela Bay (85,6%) and Buffalo City (73,9%) reported that their electricity was mostly supplied by the
municipality and was pre-paid.
Table 8.14: Distribution of households by supplier of electricity, CS 2016
District
Municipality -pre-paid
Municipality - receive bill from municipality
Eskom - pre-paid Eskom - receive bill from
Eskom Other supplier
Total
Number % Number % Number % Number % Number %
DC10: Sarah Baartman 47 893 39,2 7 078 5,8 63 731 52,2 2 859 2,3 598 0,5 122 159
DC12: Amathole 17 666 9,9 670 0,4 156 208 87,8 3 243 1,8 61 0,0 177 848
DC13: Chris Hani 45 387 25,8 2 004 1,1 124 409 70,8 3 728 2,1 143 0,1 175 671
DC14: Joe Gqabi 18 798 24,4 635 0,8 56 356 73,2 1 101 1,4 91 0,1 76 981
DC15: O.R. Tambo 45 033 17,2 1 923 0,7 212 516 81,2 744 0,3 1 573 0,6 261 788
DC44: Alfred Nzo 14 071 11,2 197 0,2 109 819 87,5 772 0,6 664 0,5 125 523
BUF: Buffalo City 151 478 73,9 7 998 3,9 42 779 20,9 2 533 1,2 205 0,1 204 993
NMA: Nelson Mandela Bay 296 045 85,6 29 506 8,5 18 994 5,5 474 0,1 629 0,2 345 648
Eastern Cape 636 371 42,7 50 012 3,4 784 811 52,7 15 454 1,0 3 964 0,3 1 490 612
Source: Statistics South Africa, Community Survey 2016. Note: ‘Local municipalities’ are attached in appendix in Table 27. Excludes ‘Do not know’ (3 481) and ‘Unspecified’ (1 529).
STATISTICS SOUTH AFRICA 62 Report number 03-01-08
Provincial profile: Eastern Cape [Community Survey 2016], Report 03-01-08
8.8 Refuse removal
Table 8.15 shows the distribution of households by refuse removal. Of the households in the Eastern Cape, 44,3% reported that they use
their own refuse dump, followed by 41,3% of households whose refuse was removed by the local authority/private company/community
members at least once a week in Eastern Cape. Alfred Nzo (80,0%) and O.R. Tambo (75,7%) districts had the highest proportion of
households who reported that they had their own refuse dump, as well as households who reported that they had no refuse removal/no
rubbish disposal (O.R. Tambo 10,4%; Alfred Nzo 9,0%).
Table 8.15: Distribution of households by refuse removal and municipality, CS 2016
District
Removed by local authority/private
company/community members at least
once a week
Removed by local authority/private
company/community members less often than once a week
Communal refuse dump
Communal container/central collection point
Own refuse dump
Dump or leave rubbish
anywhere (no rubbish
disposal)
Other Total
Number % Number % Number % Number % Number % Number % Number %
DC10: Sarah Baartman 114 664 83,0 1 806 1,3 4 416 3,2 961 0,7 11 514 8,3 2 845 2,1 1 976 1,4 138 182
DC12: Amathole 37 145 17,4 1 657 0,8 7 404 3,5 2 919 1,4 146 032 68,3 15 077 7,1 3 529 1,7 213 763
DC13: Chris Hani 52 463 27,0 3 557 1,8 5 626 2,9 4 028 2,1 108 036 55,6 15 767 8,1 4 813 2,5 194 291
DC14: Joe Gqabi 32 425 34,1 1 304 1,4 1 721 1,8 382 0,4 53 339 56,1 4 755 5,0 1 181 1,2 95 107
DC15: O.R. Tambo 28 168 9,0 2 138 0,7 9 337 3,0 2 500 0,8 237 672 75,7 32 510 10,4 1 756 0,6 314 080
DC44: Alfred Nzo 10 419 5,3 906 0,5 4 760 2,4 290 0,1 158 295 80,8 17 726 9,0 3 580 1,8 195 975
BUF: Buffalo City 144 677 57,1 6 803 2,7 19 137 7,5 5 082 2,0 62 251 24,6 10 546 4,2 4 981 2,0 253 477
NMA: Nelson Mandela Bay 312 414 84,8 20 670 5,6 9 665 2,6 5 184 1,4 9 136 2,5 7 247 2,0 4 204 1,1 368 520
Eastern Cape 732 375 41,3 38 840 2,2 62 064 3,5 21 347 1,2 786 276 44,3 106 473 6,0 26 019 1,5 1 773 395
Source: Statistics South Africa, Community Survey 2016. Note: ‘Local municipalities’ are attached in appendix in Table 28.

STATISTICS SOUTH AFRICA 63 Report number 03-01-08
Provincial profile: Eastern Cape [Community Survey 2016], Report 03-01-08
8.9 Energy sources
Table 8.16a presents the distribution of households by source of energy used for lighting.
Provincially, 85,4% of households reported that they use electricity as an energy source for
lighting. At district level, the use of electricity for lighting was still more prominent compared to
other sources of energy in Nelson Mandela Bay (95,7%), followed by Sarah Baartman (91,4%) and
Chris Hani (90,1%). The use of other sources of energy for lighting was higher among households
in Alfred Nzo (36,6%) compared to other districts.
Table 8.16a: Distribution of households by source of energy for lighting, Eastern Cape, CS 2016
District Electricity Other None
Total Number % Number % Number %
DC10: Sarah Baartman 126 149 91,4 11 314 8,2 630 0,5 138 093
DC12: Amathole 176 496 82,7 36 484 17,1 410 0,2 213 390
DC13: Chris Hani 174 888 90,1 18 896 9,7 315 0,2 194 100
DC14: Joe Gqabi 76 110 80,2 18 292 19,3 551 0,6 94 953
DC15: O.R. Tambo 262 746 83,8 49 626 15,8 987 0,3 313 359
DC44: Alfred Nzo 123 910 63,3 71 779 36,6 199 0,1 195 887
BUF: Buffalo City 219 649 86,8 32 391 12,8 1 025 0,4 253 065
NMA: Nelson Mandela Bay 352 286 95,7 15 209 4,1 552 0,1 368 048
Eastern Cape 1 512 234 85,4 253 990 14,3 4 670 0,3 1 770 894
Source: Statistics South Africa, Community Survey 2016. Note: ‘Local municipalities’ are attached in appendix in Table 29. Access to electricity = Electricity from mains + other source of electricity. Excludes ‘Unspecified’ (2 501).

STATISTICS SOUTH AFRICA 64 Report number 03-01-08
Provincial profile: Eastern Cape [Community Survey 2016], Report 03-01-08
Table 8.16b presents the distribution of households by source of energy used for cooking.
Provincially, 76,8% of households reported that they use electricity as an energy source for
cooking. At district level, the use of electricity for cooking was still more prominent compared to
other sources of energy in Nelson Mandela Bay (91,4%), followed by Sarah Baartman (88,1%) and
Chris Hani (83,2%). The use of other sources of energy for cooking was higher among households
in Alfred Nzo (53,0%) compared to other districts.
Table 8.16b: Distribution of households by source of energy for cooking, Eastern Cape, CS 2016
District
Cooking
Electricity Other energy
sources None
Total
Number % Number % Number %
DC10 Sarah Baartman 121 707 88,1 15 935 11,5 532 0,4 138 174
DC12 Amathole 163 484 76,5 48 923 22,9 1 326 0,6 213 733
DC13 Chris Hani 161 608 83,2 32 199 16,6 483 0,2 194 290
DC14 Joe Gqabi 69 760 73,4 24 366 25,6 939 1,0 95 065
DC15 O.R. Tambo 210 011 66,9 102 372 32,6 1 568 0,5 313 951
DC44 Alfred Nzo 91 311 46,6 103 889 53,0 738 0,4 195 938
BUF Buffalo City 207 045 81,7 44 911 17,7 1 492 0,6 253 448
NMA Nelson Mandela Bay 336 713 91,4 31 060 8,4 605 0,2 368 378
Eastern Cape 1 361 639 76,8 403 655 22,8 7 683 0,4 1 772 977
Source: Statistics South Africa, Community Survey 2016. Note: ‘Local municipalities’ are attached in appendix in Table 29. Access to electricity = Electricity from mains + other source of electricity. Excludes ‘Unspecified’ (418).

STATISTICS SOUTH AFRICA 65 Report number 03-01-08
Provincial profile: Eastern Cape [Community Survey 2016], Report 03-01-08
Table 8.16c presents the distribution of households by source of energy used for water heating.
Provincially, 73,4% of households reported that they use electricity as an energy source for water
heating. At district level, the use of electricity for water heating was still more prominent compared
to other sources of energy in Nelson Mandela Bay (92,3%) followed by Sarah Baartman (87,1%)
and Chris Hani (77,0%). The use of other sources of energy for water heating was higher among
households in Alfred Nzo (56,6%) compared to other districts.
Table 8.16c: Distribution of households by source of energy for water heating, Eastern Cape, CS
2016
District
Water heating
Electricity Other energy
sources None Total
Number % Number % Number %
DC10 Sarah Baartman 120 210 87,1 13 676 9,9 4 189 3,0 138 075
DC12 Amathole 157 168 73,6 53 432 25,0 2 991 1,4 213 591
DC13 Chris Hani 149 572 77,0 42 584 21,9 2 086 1,1 194 242
DC14 Joe Gqabi 64 820 68,2 28 937 30,5 1 229 1,3 94 986
DC15 O.R. Tambo 180 257 57,4 123 667 39,4 9 856 3,1 313 780
DC44 Alfred Nzo 82 554 42,2 110 758 56,6 2 512 1,3 195 824
BUF Buffalo City 205 747 81,3 41 889 16,5 5 562 2,2 253 198
NMA Nelson Mandela Bay 339 713 92,3 24 820 6,7 3 640 1,0 368 173
Eastern Cape 1 300 040 73,4 439 763 24,8 32 066 1,8 1 771 869
Source: Statistics South Africa, Community Survey 2016. Note: Access to electricity = Electricity from mains + other source of electricity. Excludes ‘Unspecified’ (1 525).

STATISTICS SOUTH AFRICA 66 Report number 03-01-08
Provincial profile: Eastern Cape [Community Survey 2016], Report 03-01-08
8.10 Household goods
Figure 8.4 depicts the percentage distribution of ownership of selected household goods, looking
at Eastern Cape in relation to the national profile. There was an increase in the percentage of
households who owned all of the selected household goods, except for the ownership of radios,
which decreased from 61,1% to 59,1% between 2011 and 2016. Eastern Cape was below the
national average with regard to the ownership of the selected household goods. Compared to all
the other selected household goods, ownership of motor vehicles was lowest.
Figure 8.4: Ownership of selected household goods
Source: Statistics South Africa, Community Survey 2016.

STATISTICS SOUTH AFRICA 67 Report number 03-01-08
Provincial profile: Eastern Cape [Community Survey 2016], Report 03-01-08
8.11 Internet services
Table 8.17 shows that Nelson Mandela Bay (12,7%) had the highest proportion of households with
access to internet services, followed by Buffalo City (9,6%) and Sarah Baartman (8,2%).
Table 8.17: Distribution of households by access to internet services and district, CS 2016
District Access to internet No access to internet
Total Number % Number %
DC10 Sarah Baartman 10 461 8,2 116 675 91,8 127 136
DC12 Amathole 10 046 4,9 196 607 95,1 206 654
DC13 Chris Hani 10 276 5,5 175 921 94,5 186 197
DC14 Joe Gqabi 6 456 6,9 86 602 93,1 93 058
DC15 O.R. Tambo 7 668 2,5 298 168 97,5 305 836
DC44 Alfred Nzo 6 055 3,1 186 931 96,9 192 986
BUF Buffalo City 24 041 9,6 225 702 90,4 249 743
NMA Nelson Mandela Bay 45 320 12,7 311 877 87,3 357 197
Eastern Cape 120 323 7,0 1 598 483 93,0 1 718 807
Source: Statistics South Africa, Community Survey 2016. Note: ‘Local municipalities’ are attached in appendix in Table 30. Excluding ‘Unspecified’ (54 588).
STATISTICS SOUTH AFRICA 68 Report number 03-01-08
Provincial profile: Eastern Cape [Community Survey 2016], Report 03-01-08
Map 8.5: Percentage of households by access to internet services and local municipality, CS 2016
STATISTICS SOUTH AFRICA 69 Report number 03-01-08
Provincial profile: Eastern Cape [Community Survey 2016], Report 03-01-08
8.12 Agricultural activities
CS 2016 data in Table 8.18 shows that agricultural households were mainly found in KwaZulu-
Natal, Eastern Cape and Limpopo. Northern Cape and Western Cape had the lowest number of
agricultural households. With regard to the prevalence of agricultural households, Eastern Cape
(27,9%) had the highest prevalence of agricultural households, followed by Limpopo (24,1%),
KwaZulu-Natal (18,6%) and Mpumalanga (18,2%).
Table 8.18: Distribution of households by agricultural activities, CS 2016
Province Agricultural Non-agricultural Prevalence of
agricultural households
Total
Western Cape 69 152 1 864 725 3,6 1 933 876
Eastern Cape 495 042 1 278 353 27,9 1 773 395
Northern Cape 48 798 304 911 13,8 353 709
Free State 157 510 789 129 16,6 946 638
KwaZulu-Natal 536 225 2 339 618 18,6 2 875 843
North West 167 780 1 080 986 13,4 1 248 766
Gauteng 242 594 4 708 543 4,9 4 951 137
Mpumalanga 225 282 1 013 579 18,2 1 238 861
Limpopo 386 660 1 214 423 24,1 1 601 083
South Africa 2 329 043 14 594 266 13,8 16 923 309
Source: Statistics South Africa, Community Survey 2016.
There was a high number of households involved in livestock production as well as poultry
production in the province (Table 8.19). Household involvement in the production of industrial
crops was very low. Households in O.R. Tambo district were mainly involved in livestock
production, poultry production, grain and food crops, as well as vegetable production. Households
in Nelson Mandela Bay had low involvement in the production of the selected types of agricultural
activities.
Table 8.19: Distribution of households involved in agricultural activities by type of agricultural
activities and district municipalities, CS 2016
District Livestock Poultry Grain and food crops
Industrial crops
Fruits Vegetables Other
Sarah Baartman 5 870 5 543 842 11 897 4 993 219
Amathole 71 147 61 201 25 503 443 4 507 25 339 753
Chris Hani 54 989 46 544 14 313 120 7 050 14 125 405
Joe Gqabi 20 154 14 836 3 590 46 5 543 9 003 96
O.R. Tambo 85 725 96 230 79 087 1 048 14 799 42 058 1 769
Alfred Nzo 65 950 74 636 50 112 384 15 658 34 306 651
Buffalo City 17 157 15 886 4 132 111 3 225 18 762 495
Nelson Mandela Bay 2 771 3 744 1 360 36 1 564 9 148 795
Eastern Cape 323 763 318 621 178 939 2 200 53 242 157 732 5 183
Source: Statistics South Africa, Community Survey 2016.

STATISTICS SOUTH AFRICA 70 Report number 03-01-08
Provincial profile: Eastern Cape [Community Survey 2016], Report 03-01-08
8.13 Food security
Table 8.20 presents the distribution of households that ran out of money to buy food in the 12
months preceding the survey in South Africa. Food security is among the basic human needs, and
it’s very important for development. Northern Cape (27,6%), Eastern Cape (26,3%) and North
West (25,1%) had the highest percentage of households who reported that they ran out of money
to buy food in the 12 months preceding the survey. Western Cape (13,2%) had the lowest
percentage of households who ran out of money to buy food in the 12 months preceding the
survey.
Table 8.20: Distribution of households that ran out of money to buy food in the last 12 months
preceding the survey by province, CS 2016
Province Ran out of money to
buy food Did not run out of money to buy food
Prevalence of running out of
money to buy food in the last 12 months
Total
Western Cape 255 163 1 671 601 13,2 1 926 764
Eastern Cape 464 838 1 303 800 26,3 1 768 638
Northern Cape 97 169 255 514 27,6 352 683
Free State 220 863 723 575 23,4 944 438
KwaZulu-Natal 667 625 2 202 001 23,3 2 869 626
North West 312 324 931 612 25,1 1 243 936
Gauteng 771 725 4 150 248 15,7 4 921 973
Mpumalanga 273 886 958 542 22,2 1 232 428
Limpopo 288 963 1 305 479 18,1 1 594 441
South Africa 3 352 555 13 502 372 19,9 16 854 927
Source: Statistics South Africa, Community Survey 2016. Note: Excludes ‘Do not know’ (57 291) and ‘Unspecified’ (11 092).
Table 8.21 shows that Amathole (31,5%) and Alfred Nzo (30,0%) districts had the highest
percentage of households who reported that they ran out of money to buy food in the 12 months
preceding the survey, while Sarah Baartman (20,6%) had the lowest percentage of households
that ran out of money to buy food in the 12 months preceding the survey.

STATISTICS SOUTH AFRICA 71 Report number 03-01-08
Provincial profile: Eastern Cape [Community Survey 2016], Report 03-01-08
Table 8.21: Distribution of households that ran out of money to buy food in the last 12 months by
district municipalities, CS 2016
District Ran out of money
to buy food Did not run out of money to buy food
Prevalence of running out of
money to buy food Total
DC10 Sarah Baartman 28 344 109 122 20,6 137 466
DC12 Amathole 67 099 146 026 31,5 213 125
DC13 Chris Hani 44 719 149 172 23,1 193 891
DC14 Joe Gqabi 19 691 75 078 20,8 94 770
DC15 O.R. Tambo 86 536 226 554 27,6 313 090
DC44 Alfred Nzo 58 619 137 078 30,0 195 697
BUF Buffalo City 71 979 181 023 28,4 253 002
NMA Nelson Mandela Bay 87 850 279 746 23,9 367 596
Eastern Cape 464 838 1 303 800 26,3 1 768 638
Source: Statistics South Africa, Community Survey 2016. Note: ‘Local municipalities’ are attached in appendix in Table 31. Excludes ‘do not know’ (4 022) and ‘unspecified’ (735).
Table 8.22 presents the distribution of households that skipped a meal in the 12 months preceding
the survey by municipality. Amathole (21,6%), Buffalo City (19,8%) and O.R. Tambo (18,1%) had
the highest percentage of households who reported that they skipped a meal in the 12 months
preceding the survey. Sarah Baartman (12,1%) had the lowest number of households that skipped
a meal in the 12 months preceding the survey.
Table 8.22: Distribution of households that skipped14 a meal in the last 12 months by municipalities,
CS 2016
District Skipped a meal Did not skip a
meal Prevalence of
skipping a meal Total
DC10 Sarah Baartman 16 679 121 044 12,1 137 723
DC12 Amathole 46 084 167 190 21,6 213 274
DC13 Chris Hani 31 244 162 666 16,1 193 910
DC14 Joe Gqabi 12 513 82 283 13,2 94 796
DC15 O.R. Tambo 56 608 256 608 18,1 313 216
DC44 Alfred Nzo 34 119 161 487 17,4 195 606
BUF Buffalo City 50 259 202 941 19,8 253 200
NMA Nelson Mandela Bay 63 756 303 748 17,3 367 504
Eastern Cape 311 263 1 457 967 17,6 1 769 229
Source: Statistics South Africa, Community Survey 2016. Note: ‘Local municipalities’ are attached in appendix in Table 32. Excludes ‘Do not know’ (3 910) and ‘Unspecified’ (255).
Map 8.6: Percentage of households that skipped a meal in the last 12 months by municipality, CS
2016
14 Skipping a meal refers to a person not eating because there was not enough food for the household.
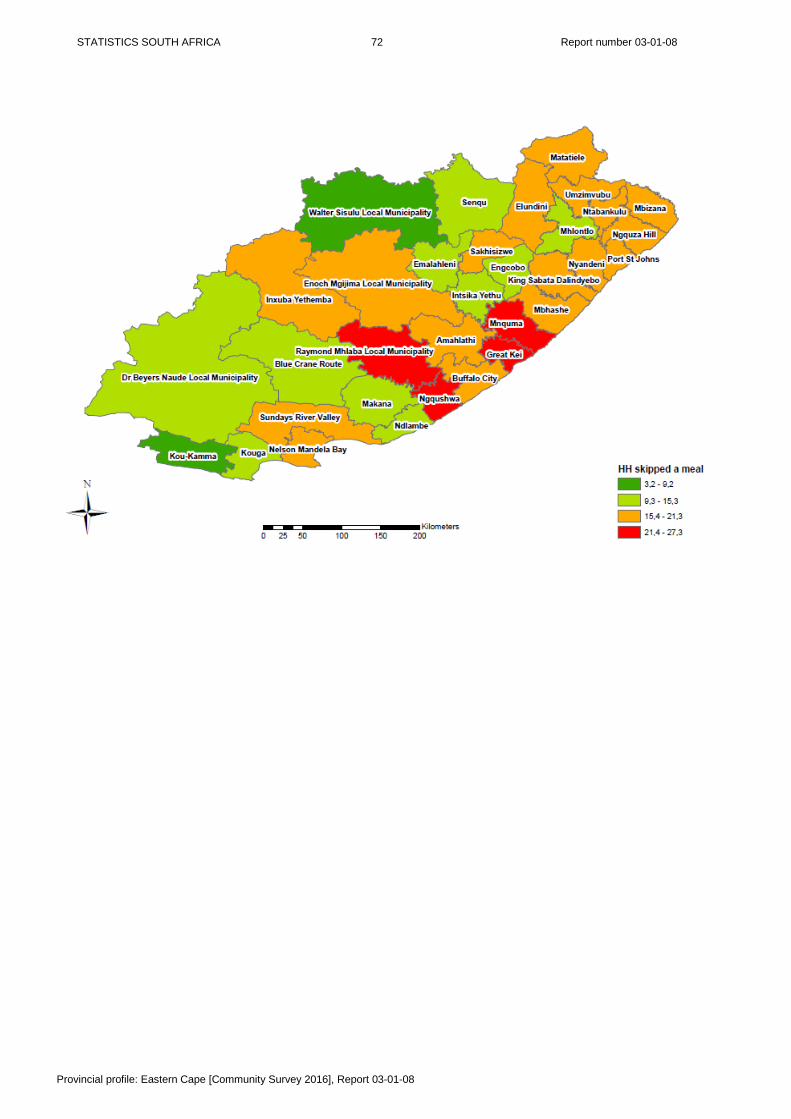
STATISTICS SOUTH AFRICA 72 Report number 03-01-08
Provincial profile: Eastern Cape [Community Survey 2016], Report 03-01-08
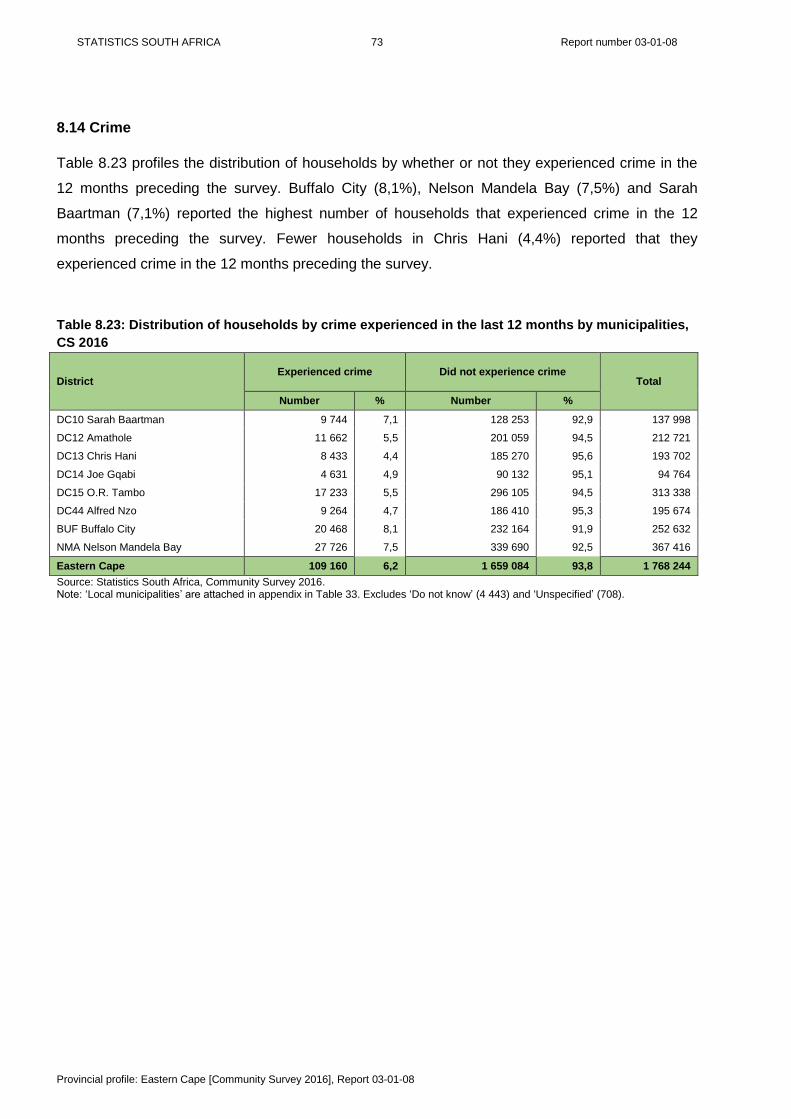
STATISTICS SOUTH AFRICA 73 Report number 03-01-08
Provincial profile: Eastern Cape [Community Survey 2016], Report 03-01-08
8.14 Crime
Table 8.23 profiles the distribution of households by whether or not they experienced crime in the
12 months preceding the survey. Buffalo City (8,1%), Nelson Mandela Bay (7,5%) and Sarah
Baartman (7,1%) reported the highest number of households that experienced crime in the 12
months preceding the survey. Fewer households in Chris Hani (4,4%) reported that they
experienced crime in the 12 months preceding the survey.
Table 8.23: Distribution of households by crime experienced in the last 12 months by municipalities,
CS 2016
District Experienced crime Did not experience crime
Total
Number % Number %
DC10 Sarah Baartman 9 744 7,1 128 253 92,9 137 998
DC12 Amathole 11 662 5,5 201 059 94,5 212 721
DC13 Chris Hani 8 433 4,4 185 270 95,6 193 702
DC14 Joe Gqabi 4 631 4,9 90 132 95,1 94 764
DC15 O.R. Tambo 17 233 5,5 296 105 94,5 313 338
DC44 Alfred Nzo 9 264 4,7 186 410 95,3 195 674
BUF Buffalo City 20 468 8,1 232 164 91,9 252 632
NMA Nelson Mandela Bay 27 726 7,5 339 690 92,5 367 416
Eastern Cape 109 160 6,2 1 659 084 93,8 1 768 244
Source: Statistics South Africa, Community Survey 2016. Note: ‘Local municipalities’ are attached in appendix in Table 33. Excludes ‘Do not know’ (4 443) and ‘Unspecified’ (708).

STATISTICS SOUTH AFRICA 74 Report number 03-01-08
Provincial profile: Eastern Cape [Community Survey 2016], Report 03-01-08
Map 8.7: Percentage of households that experienced crime in the last 12 months by municipalities,
CS 2016

STATISTICS SOUTH AFRICA 75 Report number 03-01-08
Provincial profile: Eastern Cape [Community Survey 2016], Report 03-01-08
Figure 8.5 presents the distribution of households’ perception of safety when walking alone during
the day. Both metropolitan areas had the highest proportion of households who reported that they
felt very unsafe walking alone during the day.
Figure 8.5: Distribution of households’ perception of safety when walking alone during the day, CS
2016
Source: Statistics South Africa, Community Survey 2016. Note: ‘Local municipalities’ are attached in appendix in Table 34.
59.6
54.6
62.5
61.9
55.7
65.3
38.7
32.0
50.7
26.6
27.5
21.6
21.1
27.8
22.5
32.1
34.9
28.1
10.2
10.6
10.4
7.5
10.3
7.7
18.9
20.8
13.3
3.6
7.4
5.5
9.5
6.1
4.5
10.2
12.3
7.9
0 10 20 30 40 50 60 70 80 90 100
DC10 Sarah Baartman
DC12 Amathole
DC13 Chris Hani
DC14 Joe Gqabi
DC15 O.R.Tambo
DC44 Alfred Nzo
BUF Buffalo City
NMA Nelson Mandela Bay
Eastern Cape
%
Dis
tric
t
Very safe Fairly safe A bit unsafe Very unsafe
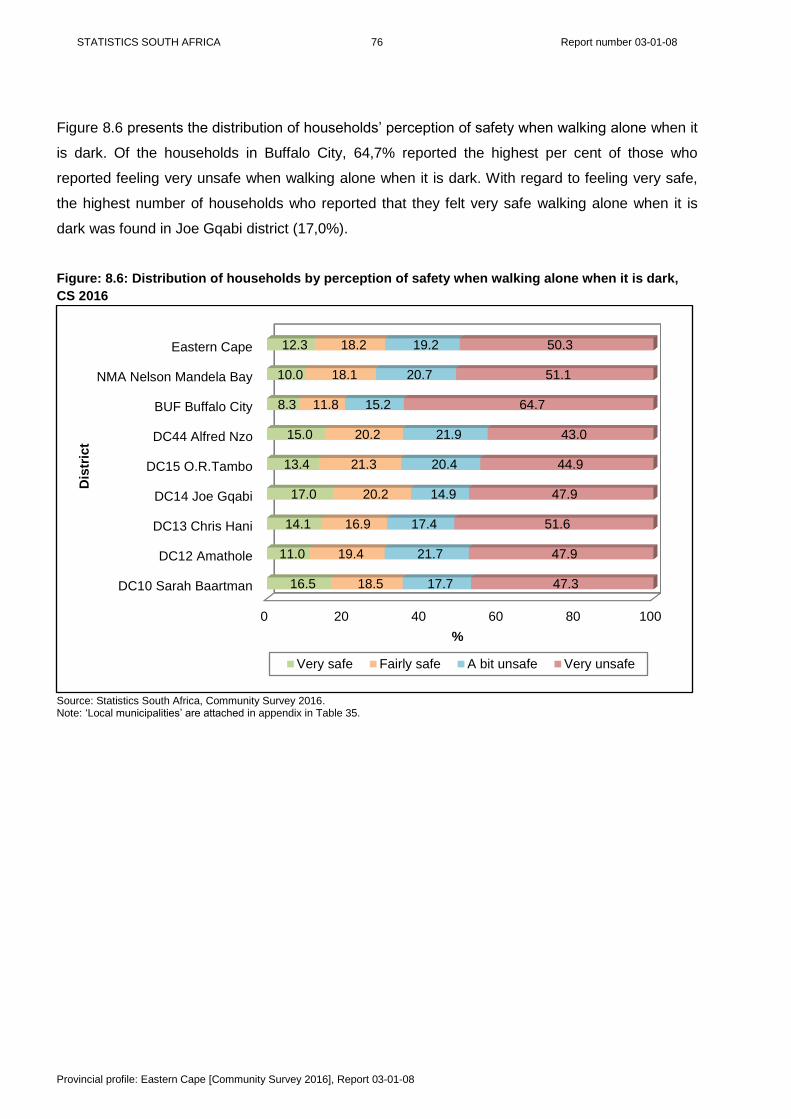
STATISTICS SOUTH AFRICA 76 Report number 03-01-08
Provincial profile: Eastern Cape [Community Survey 2016], Report 03-01-08
Figure 8.6 presents the distribution of households’ perception of safety when walking alone when it
is dark. Of the households in Buffalo City, 64,7% reported the highest per cent of those who
reported feeling very unsafe when walking alone when it is dark. With regard to feeling very safe,
the highest number of households who reported that they felt very safe walking alone when it is
dark was found in Joe Gqabi district (17,0%).
Figure: 8.6: Distribution of households by perception of safety when walking alone when it is dark,
CS 2016
Source: Statistics South Africa, Community Survey 2016. Note: ‘Local municipalities’ are attached in appendix in Table 35.
0 20 40 60 80 100
DC10 Sarah Baartman
DC12 Amathole
DC13 Chris Hani
DC14 Joe Gqabi
DC15 O.R.Tambo
DC44 Alfred Nzo
BUF Buffalo City
NMA Nelson Mandela Bay
Eastern Cape
16.5
11.0
14.1
17.0
13.4
15.0
8.3
10.0
12.3
18.5
19.4
16.9
20.2
21.3
20.2
11.8
18.1
18.2
17.7
21.7
17.4
14.9
20.4
21.9
15.2
20.7
19.2
47.3
47.9
51.6
47.9
44.9
43.0
64.7
51.1
50.3
%
Dis
tric
t
Very safe Fairly safe A bit unsafe Very unsafe

STATISTICS SOUTH AFRICA 77 Report number 03-01-08
Provincial profile: Eastern Cape [Community Survey 2016], Report 03-01-08
8.15 Perceptions of municipal problems and services
Figure 8.7 depicts the five leading problems/challenges faced by the municipalities in Eastern
Cape. The leading problem reported by households in the province was lack of safe and reliable
water supply (22,0%), followed by: inadequate housing (12,7%), lack of/inadequate employment
opportunities (11,4%), inadequate roads (10,1%), and cost of electricity (8,5%). Overall, the five
leading problems/challenges faced by the municipalities in Eastern Cape contributed 64,6% to the
provincial average when combined.
Figure 8.7: Five leading problems/challenges faced by the municipality in Eastern Cape, CS 2016
Source: Statistics South Africa, Community Survey 2016.
Note: 3,4% of households in the province reported none (i.e. they were not facing any problems or difficulties in the
municipality).
Tables 8.24 shows the extent to which households agree that their municipality is trying to solve the
problem of the water supply. Overall, the majority of households (46,8%) reported that they strongly
disagree with the statement that the municipality is trying to solve the problem (lack of safe and
reliable water supply). Households in O.R. Tambo (54,9%), Nelson Mandela Bay (52,3%) and
Amathole (50,8%) reported that they strongly disagree that the municipality is trying to solve the
problem of a lack of a safe and reliable water supply.
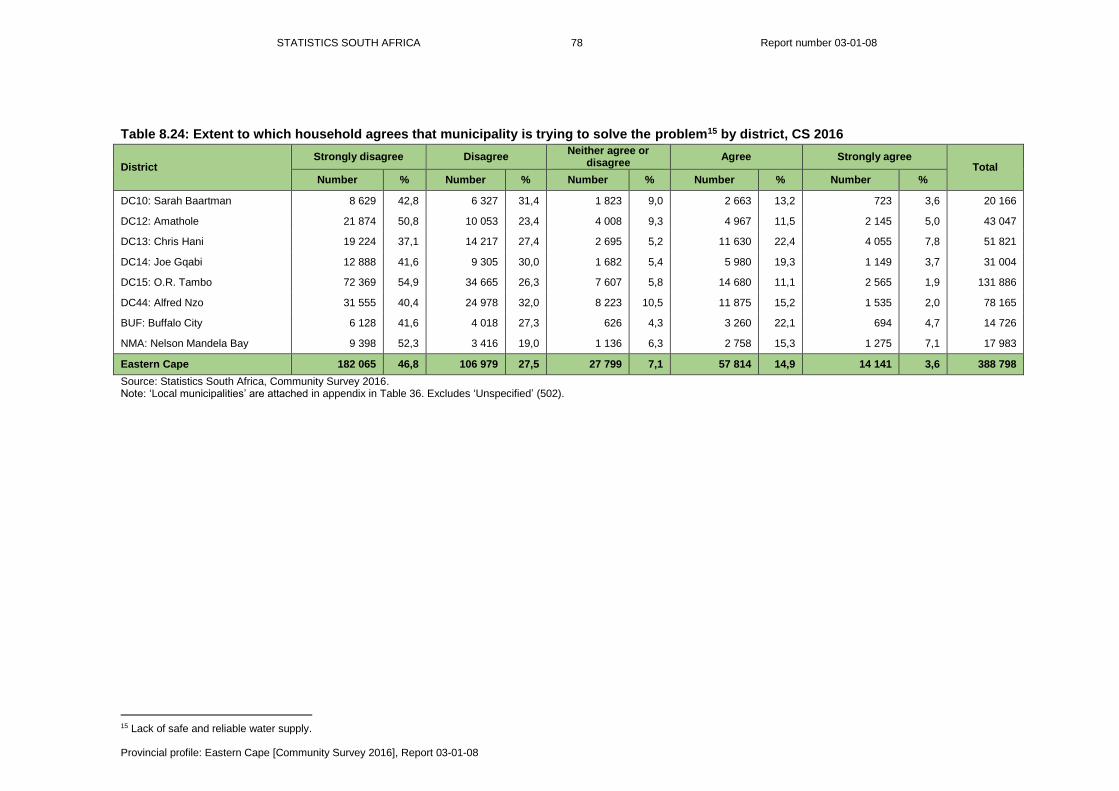
STATISTICS SOUTH AFRICA 78 Report number 03-01-08
Provincial profile: Eastern Cape [Community Survey 2016], Report 03-01-08
Table 8.24: Extent to which household agrees that municipality is trying to solve the problem15 by district, CS 2016
District Strongly disagree Disagree
Neither agree or disagree
Agree Strongly agree Total
Number % Number % Number % Number % Number %
DC10: Sarah Baartman 8 629 42,8 6 327 31,4 1 823 9,0 2 663 13,2 723 3,6 20 166
DC12: Amathole 21 874 50,8 10 053 23,4 4 008 9,3 4 967 11,5 2 145 5,0 43 047
DC13: Chris Hani 19 224 37,1 14 217 27,4 2 695 5,2 11 630 22,4 4 055 7,8 51 821
DC14: Joe Gqabi 12 888 41,6 9 305 30,0 1 682 5,4 5 980 19,3 1 149 3,7 31 004
DC15: O.R. Tambo 72 369 54,9 34 665 26,3 7 607 5,8 14 680 11,1 2 565 1,9 131 886
DC44: Alfred Nzo 31 555 40,4 24 978 32,0 8 223 10,5 11 875 15,2 1 535 2,0 78 165
BUF: Buffalo City 6 128 41,6 4 018 27,3 626 4,3 3 260 22,1 694 4,7 14 726
NMA: Nelson Mandela Bay 9 398 52,3 3 416 19,0 1 136 6,3 2 758 15,3 1 275 7,1 17 983
Eastern Cape 182 065 46,8 106 979 27,5 27 799 7,1 57 814 14,9 14 141 3,6 388 798
Source: Statistics South Africa, Community Survey 2016. Note: ‘Local municipalities’ are attached in appendix in Table 36. Excludes ‘Unspecified’ (502).
15 Lack of safe and reliable water supply.

STATISTICS SOUTH AFRICA 79 Report number 03-01-08
Provincial profile: Eastern Cape [Community Survey 2016], Report 03-01-08
8.16 Rating the quality of services
About 8% of households in the province reported that they had no access to water services. A
large percentage of households in Buffalo City (61,3%) and Nelson Mandela Bay (59,5%) rated the
overall quality of water services as good, while a larger percentage of households in O.R. Tambo
(40,1%) and Alfred Nzo (33,9%) district rated the quality of water services as poor.
Figure 8.8: Percentage distribution of households by rating of the overall quality of water services by
districts, CS 2016
Source: Statistics South Africa, Community Survey 2016. Note: Excludes ‘Do not use’ (6 062) and ‘Unspecified’ (1 981).
48.9
42.6
41.5
37.7
18.8
23.7
61.3
59.5
42.6
29.3
27.7
29.2
27.4
23.7
19.4
27.0
30.5
26.8
20.1
20.8
24.9
25.9
40.1
33.9
10.7
9.1
22.4
1.8
8.9
4.3
9.0
17.4
23.0
1.0
1.0
8.1
0 10 20 30 40 50 60 70 80 90 100
DC10 Sarah Baartman
DC12 Amathole
DC13 Chris Hani
DC14 Joe Gqabi
DC15 O.R.Tambo
DC44 Alfred Nzo
BUF Buffalo City
NMA Nelson Mandela Bay
Eastern Cape
%
Dis
tric
t
Good Average Poor No access

STATISTICS SOUTH AFRICA 80 Report number 03-01-08
Provincial profile: Eastern Cape [Community Survey 2016], Report 03-01-08
About 24% of households in the province reported that they had no access to refuse removal
services (Figure 8.9). A large percentage of households in Nelson Mandela Bay (62,2%) and
Sarah Baartman (59,1%) rated the overall quality of refuse removal services as good, while a
larger percentage of households in O.R. Tambo district (29,6%) and Buffalo City (24,9%) rated the
overall quality of refuse removal services as poor.
Figure 8.9: Percentage distribution of households by rating of the overall quality of refuse removal
services by districts, CS 2016
Source: Statistics South Africa, Community Survey 2016. Note: Excludes ‘Do not use’ (49 525) and ‘Unspecified’ (1 430).
59.1
19.8
28.7
32.0
10.6
14.5
32.4
62.2
33.1
26.0
23.7
23.4
22.7
23.1
17.2
26.5
26.8
24.0
11.4
17.3
19.8
18.3
29.6
17.0
24.9
8.2
18.4
3.5
39.2
28.1
26.9
36.7
51.3
16.2
2.8
24.4
0 10 20 30 40 50 60 70 80 90 100
DC10 Sarah Baartman
DC12 Amathole
DC13 Chris Hani
DC14 Joe Gqabi
DC15 O.R.Tambo
DC44 Alfred Nzo
BUF Buffalo City
NMA Nelson Mandela Bay
Eastern Cape
%
Dis
tric
t
Good Average Poor No access

STATISTICS SOUTH AFRICA 81 Report number 03-01-08
Provincial profile: Eastern Cape [Community Survey 2016], Report 03-01-08
About 10% of households in the province reported that they had no access to electricity supply
services (Figure 8.10). A large percentage of households in Sarah Baartman (58,3%) and Nelson
Mandela Bay (57,9%) rated the overall quality of electricity supply services as good, while a larger
percentage of households in Alfred Nzo (28,9%) had no access to electricity supply services.
Figure 8.10: Percentage distribution of households by rating of the overall quality of electricity
supply services by districts, CS 2016
Source: Statistics South Africa, Community Survey 2016. Note: Excludes ‘Do not use’ (22 909) and ‘Unspecified’ (1 383).
58.3
49.5
50.8
48.0
43.2
47.4
50.1
57.9
50.7
29.2
29.0
31.9
28.8
32.9
16.8
26.7
30.9
28.7
7.1
8.3
11.8
10.4
14.1
6.9
13.4
8.1
10.3
5.5
13.2
5.5
12.8
9.9
28.9
9.8
3.2
10.3
0 10 20 30 40 50 60 70 80 90 100
DC10 Sarah Baartman
DC12 Amathole
DC13 Chris Hani
DC14 Joe Gqabi
DC15 O.R.Tambo
DC44 Alfred Nzo
BUF Buffalo City
NMA Nelson Mandela Bay
Eastern Cape
%
Dis
tric
t
Good Average Poor No access
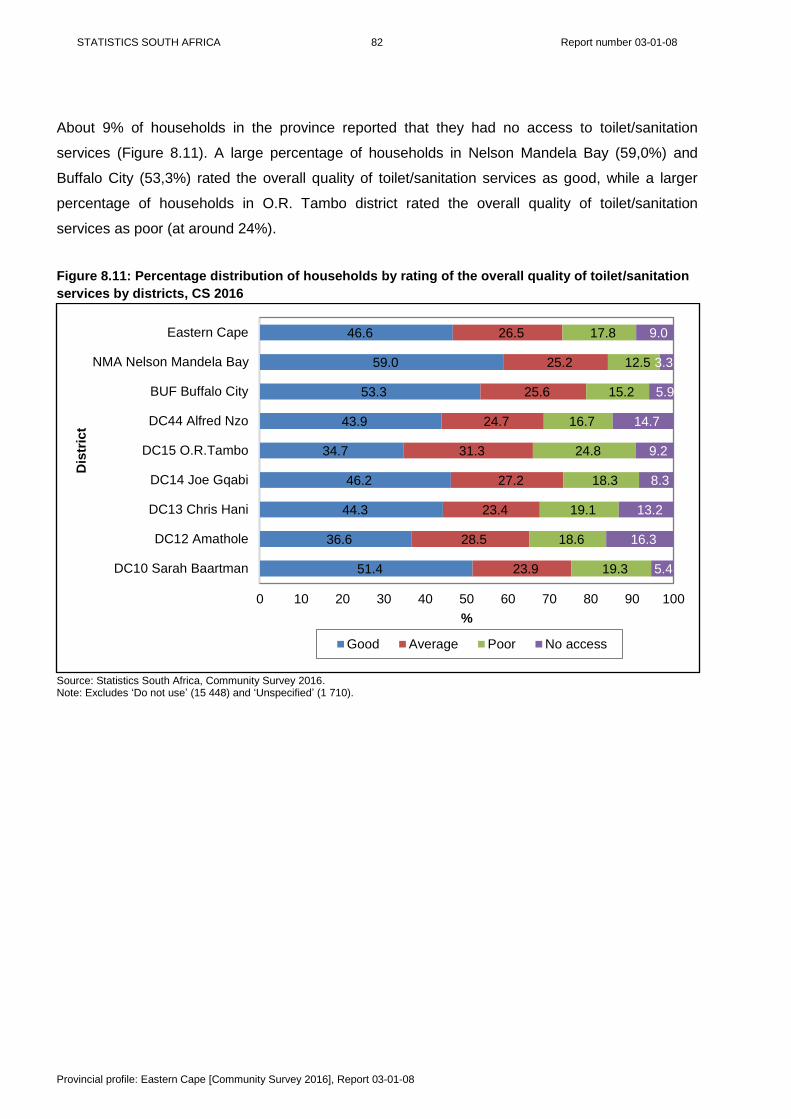
STATISTICS SOUTH AFRICA 82 Report number 03-01-08
Provincial profile: Eastern Cape [Community Survey 2016], Report 03-01-08
About 9% of households in the province reported that they had no access to toilet/sanitation
services (Figure 8.11). A large percentage of households in Nelson Mandela Bay (59,0%) and
Buffalo City (53,3%) rated the overall quality of toilet/sanitation services as good, while a larger
percentage of households in O.R. Tambo district rated the overall quality of toilet/sanitation
services as poor (at around 24%).
Figure 8.11: Percentage distribution of households by rating of the overall quality of toilet/sanitation
services by districts, CS 2016
Source: Statistics South Africa, Community Survey 2016. Note: Excludes ‘Do not use’ (15 448) and ‘Unspecified’ (1 710).
51.4
36.6
44.3
46.2
34.7
43.9
53.3
59.0
46.6
23.9
28.5
23.4
27.2
31.3
24.7
25.6
25.2
26.5
19.3
18.6
19.1
18.3
24.8
16.7
15.2
12.5
17.8
5.4
16.3
13.2
8.3
9.2
14.7
5.9
3.3
9.0
0 10 20 30 40 50 60 70 80 90 100
DC10 Sarah Baartman
DC12 Amathole
DC13 Chris Hani
DC14 Joe Gqabi
DC15 O.R.Tambo
DC44 Alfred Nzo
BUF Buffalo City
NMA Nelson Mandela Bay
Eastern Cape
%
Dis
tric
t
Good Average Poor No access

STATISTICS SOUTH AFRICA 83 Report number 03-01-08
Provincial profile: Eastern Cape [Community Survey 2016], Report 03-01-08
About 6% of households in the province reported that they had no access to local public hospitals
(Figure 8.12). A large percentage (above 50%) of households in Sarah Baartman district rated the
overall quality of local public hospitals as good, while a larger percentage of households in Alfred
Nzo district, Amathole district, and Nelson Mandela Bay rated the overall quality of local public
hospitals as poor (at above 20%). Moreover, a large percentage of households in Alfred Nzo
district reported that they had no access to local public hospitals (at above 10%).
Figure 8.12: Percentage distribution of households by rating of the overall quality of local public
hospital by districts, CS 2016
Source: Statistics South Africa, Community Survey 2016. Note: Excludes ‘Do not use’ (109 345) and ‘Unspecified’ (1 382).
50.6
35.3
43.5
44.8
34.3
37.5
47.9
37.6
40.2
30.1
34.6
30.1
31.3
38.6
27.9
30.1
36.9
33.3
10.5
22.6
19.2
16.6
18.9
23.5
17.1
22.2
19.5
8.8
7.5
7.2
7.3
8.2
11.2
4.8
3.4
6.9
0 10 20 30 40 50 60 70 80 90 100
DC10 Sarah Baartman
DC12 Amathole
DC13 Chris Hani
DC14 Joe Gqabi
DC15 O.R.Tambo
DC44 Alfred Nzo
BUF Buffalo City
NMA Nelson Mandela Bay
Eastern Cape
%
Dis
tric
t
Good Average Poor No access
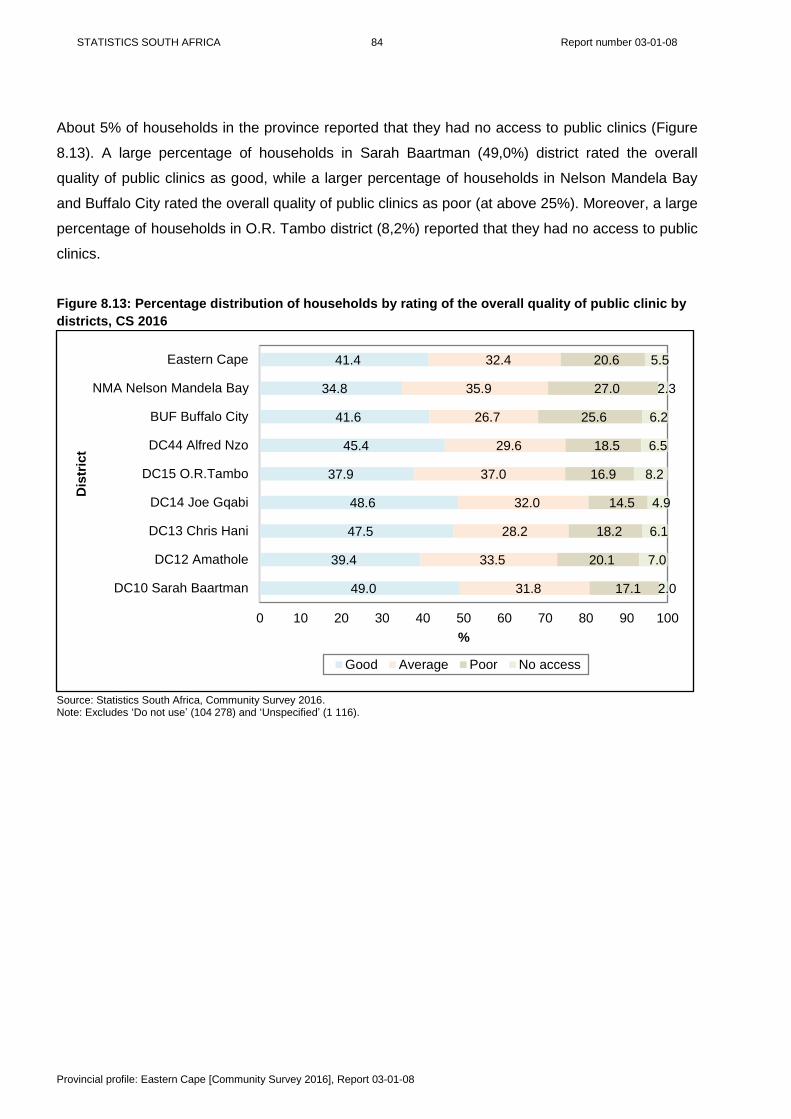
STATISTICS SOUTH AFRICA 84 Report number 03-01-08
Provincial profile: Eastern Cape [Community Survey 2016], Report 03-01-08
About 5% of households in the province reported that they had no access to public clinics (Figure
8.13). A large percentage of households in Sarah Baartman (49,0%) district rated the overall
quality of public clinics as good, while a larger percentage of households in Nelson Mandela Bay
and Buffalo City rated the overall quality of public clinics as poor (at above 25%). Moreover, a large
percentage of households in O.R. Tambo district (8,2%) reported that they had no access to public
clinics.
Figure 8.13: Percentage distribution of households by rating of the overall quality of public clinic by
districts, CS 2016
Source: Statistics South Africa, Community Survey 2016. Note: Excludes ‘Do not use’ (104 278) and ‘Unspecified’ (1 116).
49.0
39.4
47.5
48.6
37.9
45.4
41.6
34.8
41.4
31.8
33.5
28.2
32.0
37.0
29.6
26.7
35.9
32.4
17.1
20.1
18.2
14.5
16.9
18.5
25.6
27.0
20.6
2.0
7.0
6.1
4.9
8.2
6.5
6.2
2.3
5.5
0 10 20 30 40 50 60 70 80 90 100
DC10 Sarah Baartman
DC12 Amathole
DC13 Chris Hani
DC14 Joe Gqabi
DC15 O.R.Tambo
DC44 Alfred Nzo
BUF Buffalo City
NMA Nelson Mandela Bay
Eastern Cape
%
Dis
tric
t
Good Average Poor No access

STATISTICS SOUTH AFRICA 85 Report number 03-01-08
Provincial profile: Eastern Cape [Community Survey 2016], Report 03-01-08
About 4% of households in the province reported that they had no access to local police services
(Figure 8.14). A large percentage of households in Alfred Nzo district (41,9%) rated the overall
quality of local police services as good, while a larger percentage of households in Amathole
(28,1%) rated the overall quality of local police services as poor. Moreover, a large percentage of
households in Alfred Nzo district (8,0%) reported that they had no access to local police services.
Figure 8.14: Percentage distribution of households by rating of the overall quality of local police
services by districts, CS 2016
Source: Statistics South Africa, Community Survey 2016. Note: Excludes ‘Do not use’ (63 956) and ‘Unspecified’ (2 354).
39.1
30.0
37.9
39.2
29.0
41.9
37.4
35.5
35.4
35.6
36.7
29.3
32.3
39.8
32.2
32.8
38.2
35.4
23.7
28.1
27.5
23.8
24.3
17.9
26.0
24.3
24.6
1.7
5.2
5.3
4.7
7.0
8.0
3.9
2.0
4.7
0 10 20 30 40 50 60 70 80 90 100
DC10 Sarah Baartman
DC12 Amathole
DC13 Chris Hani
DC14 Joe Gqabi
DC15 O.R.Tambo
DC44 Alfred Nzo
BUF Buffalo City
NMA Nelson Mandela Bay
Eastern Cape
%
Dis
tric
t
Good Average Poor No access
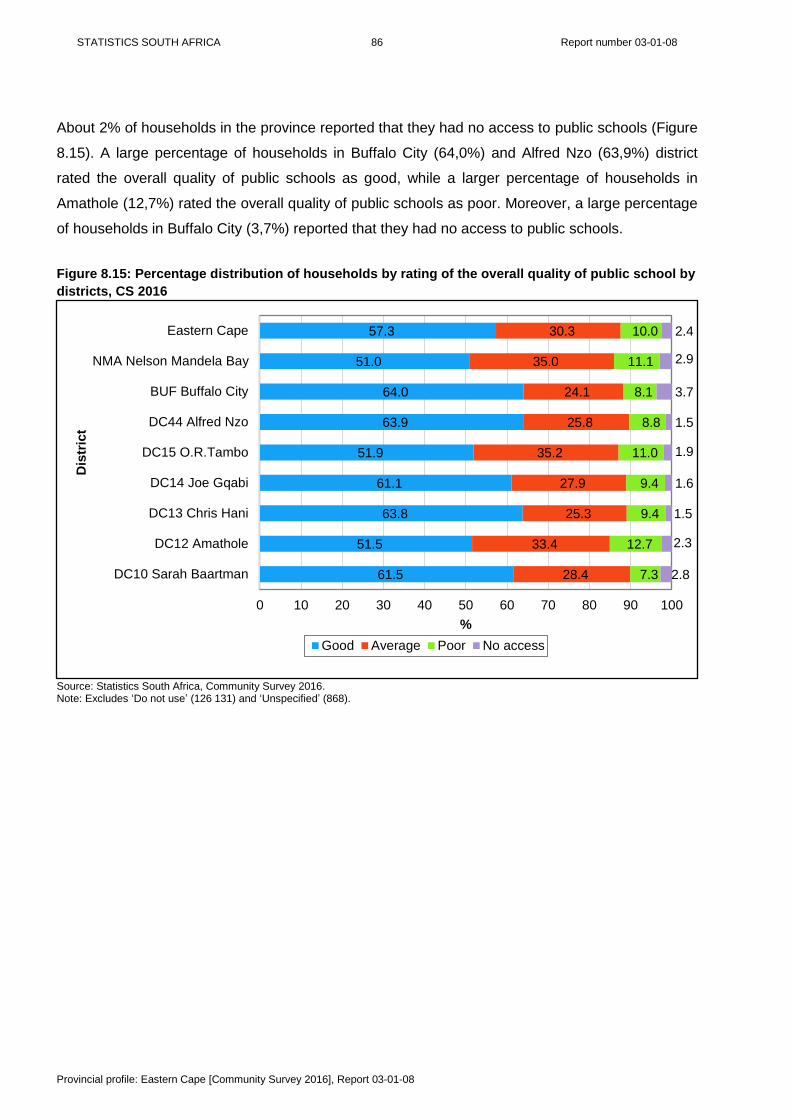
STATISTICS SOUTH AFRICA 86 Report number 03-01-08
Provincial profile: Eastern Cape [Community Survey 2016], Report 03-01-08
About 2% of households in the province reported that they had no access to public schools (Figure
8.15). A large percentage of households in Buffalo City (64,0%) and Alfred Nzo (63,9%) district
rated the overall quality of public schools as good, while a larger percentage of households in
Amathole (12,7%) rated the overall quality of public schools as poor. Moreover, a large percentage
of households in Buffalo City (3,7%) reported that they had no access to public schools.
Figure 8.15: Percentage distribution of households by rating of the overall quality of public school by
districts, CS 2016
Source: Statistics South Africa, Community Survey 2016. Note: Excludes ‘Do not use’ (126 131) and ‘Unspecified’ (868).
61.5
51.5
63.8
61.1
51.9
63.9
64.0
51.0
57.3
28.4
33.4
25.3
27.9
35.2
25.8
24.1
35.0
30.3
7.3
12.7
9.4
9.4
11.0
8.8
8.1
11.1
10.0
2.8
2.3
1.5
1.6
1.9
1.5
3.7
2.9
2.4
0 10 20 30 40 50 60 70 80 90 100
DC10 Sarah Baartman
DC12 Amathole
DC13 Chris Hani
DC14 Joe Gqabi
DC15 O.R.Tambo
DC44 Alfred Nzo
BUF Buffalo City
NMA Nelson Mandela Bay
Eastern Cape
%
Dis
tric
t
Good Average Poor No access

STATISTICS SOUTH AFRICA 87 Report number 03-01-08
Provincial profile: Eastern Cape [Community Survey 2016], Report 03-01-08
Chapter 9: Mortality
This chapter profiles the mortality differentials of persons from Eastern Cape. Mortality is among
the major demographic variables, and also has implications for population growth. The chapter
provides descriptive statistics on household deaths as well as the demographic differentials of the
deceased.
9.1 Household deaths
South Africa recorded 428 983 household deaths in the 12 months before the survey; Eastern
Cape (66 596) is the third largest contributor of household deaths (Table 9.1), led by KwaZulu-
Natal (87 778) and Gauteng (84 299).
Table 9.1: Distribution of households by whether death occurred in the last 12 months by province,
CS 2016
Province Yes No Total
Western Cape 33 212 1 900 665 1 933 876
Eastern Cape 66 596 1 706 798 1 773 395
Northern Cape 12 139 341 570 353 709
Free State 28 307 918 332 946 638
KwaZulu-Natal 87 778 2 788 065 2 875 843
North West 40 201 1 208 565 1 248 766
Gauteng 84 299 4 866 838 4 951 137
Mpumalanga 34 827 1 204 034 1 238 861
Limpopo 41 623 1 559 460 1 601 083
South Africa 428 983 16 494 326 16 923 309
Source: Statistics South Africa, Community Survey 2016.
O.R. Tambo district contributed the highest number of household deaths (Table 9.2). Joe Gqabi
recorded the lowest number of household deaths (around 3 000 household deaths).
Table 9.2: Distribution of households by whether death occurred in the last 12 months by districts
and municipalities, CS 2016
Province/district/local municipality Yes No Total
DC10 Sarah Baartman 4 270 133 912 138 182
DC12 Amathole 10 175 203 588 213 763
DC13 Chris Hani 7 976 186 314 194 291
DC14 Joe Gqabi 3 153 91 953 95 107
DC15 O.R. Tambo 12 211 301 870 314 080
DC44 Alfred Nzo 10 955 185 021 195 975
BUF Buffalo City 8 599 244 878 253 477
NMA Nelson Mandela Bay 9 257 359 263 368 520
Eastern Cape 66 596 1 706 798 1 773 395
Source: Statistics South Africa, Community Survey 2016. Note: ‘Local municipalities’ are attached in appendix in Table 37.

STATISTICS SOUTH AFRICA 88 Report number 03-01-08
Provincial profile: Eastern Cape [Community Survey 2016], Report 03-01-08
Table 9.3 below shows the number of household deaths in the 12 months preceding the survey.
KwaZulu-Natal (6,3%) recorded the highest percentage of households that had experienced two or
more deaths. Mpumalanga (6,0%), North West (5,9%), Gauteng (5,8%), and Eastern Cape (5,6%)
also recorded higher percentages of households with two or more household deaths. On the other
hand, Western Cape (3,8%) recorded the lowest percentage of households with two or more
deaths.
Table 9.3: Number of deaths per households that experienced death in the last 12 months by
province, CS 2016
Province 1 death 2+ deaths
Total Number % Number %
Western Cape 31 964 96,2 1 248 3,8 33 212
Eastern Cape 62 870 94,4 3 726 5,6 66 596
Northern Cape 11 515 94,9 624 5,1 12 139
Free State 26 959 95,2 1 348 4,8 28 307
KwaZulu-Natal 82 231 93,7 5 546 6,3 87 778
North West 37 848 94,1 2 353 5,9 40 201
Gauteng 79 427 94,2 4 872 5,8 84 299
Mpumalanga 32 753 94,0 2 074 6,0 34 827
Limpopo 39 653 95,3 1 970 4,7 41 623
South Africa 405 221 94,5 23 762 5,5 428 983
Source: Statistics South Africa, Community Survey 2016.

STATISTICS SOUTH AFRICA 89 Report number 03-01-08
Provincial profile: Eastern Cape [Community Survey 2016], Report 03-01-08
Table 9.4 below shows the number of household deaths in the 12 months preceding the survey.
Alfred Nzo (6,6%) recorded the highest percentage of households that had experienced two or
more deaths in the 12 months preceding the survey, followed by Amathole (6,2%) and O.R. Tambo
(6,0%). Sarah Baartman recorded the lowest percentage (3,4%) of households that had two or
more deaths.
Table 9.4: Number of deaths per household that experienced death in the last 12 months by districts
and metros, CS 2016
District 1 death 2+ deaths
Total Number % Number %
DC10: Sarah Baartman 4 125 96,6 145 3,4 4 270
DC12: Amathole 9 540 93,8 635 6,2 10 175
DC13: Chris Hani 7 522 94,3 454 5,7 7 976
DC14: Joe Gqabi 2 970 94,2 184 5,8 3 153
DC15: O.R. Tambo 11 475 94,0 736 6,0 12 211
DC44: Alfred Nzo 10 236 93,4 719 6,6 10 955
BUF: Buffalo City 8 114 94,4 485 5,6 8 599
NMA: Nelson Mandela Bay 8 888 96,0 369 4,0 9 257
Eastern Cape 62 870 94,4 3 726 5,6 66 596
Source: Statistics South Africa, Community Survey 2016. Note: ‘Local municipalities’ are attached in appendix in Table 38.

STATISTICS SOUTH AFRICA 90 Report number 03-01-08
Provincial profile: Eastern Cape [Community Survey 2016], Report 03-01-08
Map 9.1: Households that experienced death in the last 12 months preceding the survey by local
municipality

STATISTICS SOUTH AFRICA 91 Report number 03-01-08
Provincial profile: Eastern Cape [Community Survey 2016], Report 03-01-08
Appendices
Table 1: Population distribution by local municipality and percentage change, Census 2011 and CS
2016
Municipality Total population Percentage
change 2011 2016
DC10: Sarah Baartman 450 584 479 923 6,5
EC101 : Dr Beyers Naudé 79 292 82 197 3,7
EC102 : Blue Crane Route 36 002 36 063 0,2
EC104 : Makana 80 390 82 060 2,1
EC105 : Ndlambe 61 176 63 180 3,3
EC106 : Sundays River Valley 54 504 59 793 9,7
EC108 : Kouga 98 558 112 941 14,6
EC109 : Kou-Kamma 40 663 43 688 7,4
DC12: Amathole 855 793 880 790 2,9
EC121 : Mbhashe 261 773 277 250 5,9
EC122 : Mnquma 245 526 246 813 0,5
EC123 : Great Kei 30 832 31 692 2,8
EC124 : Amahlathi 101 035 101 826 0,8
EC126 : Ngqushwa 65 248 63 694 -2,4
EC129 : Raymond Mhlaba 151 379 159 515 5,4
DC13: Chris Hani 806 478 840 055 4,2
EC131 : Inxuba Yethemba 65 560 70 493 7,5
EC135 : Intsika Yethu 151 587 152 159 0,4
EC137 : Engcobo 155 513 162 014 4,2
EC138 : Sakhisizwe 62 284 63 846 2,5
EC139 : Enoch Mgijima 250 776 267 011 6,5
EC136 : Emalahleni 120 758 124 532 3,1
DC14: Joe Gqabi 348 667 372 912 7,0
EC141 : Elundini 137 039 144 929 5,8
EC142 : Senqu 134 150 140 720 4,9
EC145 : Walter Sisulu 77 477 87 263 12,6
DC15: O.R. Tambo 1 366 045 1 457 384 6,7
EC153 : Ngquza Hill 278 481 303 379 8,9
EC154 : Port St Johns 156 136 166 779 6,8
EC155 : Nyandeni 290 390 309 702 6,7
EC156 : Mhlontlo 190 751 189 176 -0,8
EC157 : King Sabata Dalindyebo 450 287 488 349 8,5
DC44: Alfred Nzo 801 344 867 864 8,3
EC441 : Matatiele 203 843 219 447 7,7
EC442 : Umzimvubu 191 775 199 620 4,1
EC443 : Mbizana 281 905 319 948 13,5
EC444 : Ntabankulu 123 821 128 848 4,1
BUF: Buffalo City 781 027 834 997 6,9
NMA: Nelson Mandela Bay 1 152 115 1 263 051 9,6
Eastern Cape 6 562 053 6 996 976 6,6

STATISTICS SOUTH AFRICA 92 Report number 03-01-08
Provincial profile: Eastern Cape [Community Survey 2016], Report 03-01-08
Table 2: Population distribution by sex, Census 2011 and CS 2016
Municipality
Census 2011 CS 2016
Male Female Total
Male Female Total
Number % Number % Number % Number %
DC10: Sarah Baartman 220 246 48,9 230 338 51,1 450 584 236 120 49,2 243 803 50,8 479 923 EC101 : Dr Beyers Naudé 38 599 48,7 40 693 51,3 79 292 40 097 48,8 42 100 51,2 82 197 EC102 : Blue Crane Route 17 680 49,1 18 322 50,9 36 002 17 841 49,5 18 223 50,5 36 063 EC104 : Makana 38 175 47,5 42 215 52,5 80 390 39 218 47,8 42 842 52,2 82 060 EC105 : Ndlambe 29 035 47,5 32 141 52,5 61 176 30 096 47,6 33 084 52,4 63 180 EC106 : Sundays River Valley 27 761 50,9 26 743 49,1 54 504 31 136 52,1 28 656 47,9 59 793 EC108 : Kouga 48 591 49,3 49 967 50,7 98 558 55 778 49,4 57 163 50,6 112 941 EC109 : Kou-Kamma 20 405 50,2 20 258 49,8 40 663 21 953 50,2 21 735 49,8 43 688
DC12: Amathole 401 735 46,9 454 058 53,1 855 793 416 355 47,3 464 436 52,7 880 790 EC121 : Mbhashe 120 279 45,9 141 494 54,1 261 773 128 458 46,3 148 792 53,7 277 250 EC122 : Mnquma 114 823 46,8 130 703 53,2 245 526 116 728 47,3 130 085 52,7 246 813 EC123 : Great Kei 14 798 48,0 16 034 52,0 30 832 15 223 48,0 16 469 52,0 31 692 EC124 : Amahlathi 48 357 47,9 52 678 52,1 101 035 49 133 48,3 52 693 51,7 101 826 EC126 : Ngqushwa 30 667 47,0 34 581 53,0 65 248 29 973 47,1 33 721 52,9 63 694 EC129 : Raymond Mhlaba 72 810 48,1 78 569 51,9 151 379 76 840 48,2 82 676 51,8 159 515
DC13: Chris Hani 381 850 47,3 424 628 52,7 806 478 398 806 47,5 441 249 52,5 840 055 EC131 : Inxuba Yethemba 31 671 48,3 33 889 51,7 65 560 33 432 47,4 37 061 52,6 70 493 EC135 : Intsika Yethu 71 730 47,3 79 858 52,7 151 587 73 432 48,3 78 727 51,7 152 159 EC137 : Engcobo 71 953 46,3 83 560 53,7 155 513 74 701 46,1 87 313 53,9 162 014 EC138 : Sakhisizwe 30 025 48,2 32 259 51,8 62 284 30 948 48,5 32 898 51,5 63 846 EC139 : Enoch Mgijima 119 230 47,5 131 546 52,5 250 776 126 803 47,5 140 208 52,5 267 011 EC136 : Emalahleni 57 242 47,4 63 516 52,6 120 758 59 490 47,8 65 042 52,2 124 532
DC14: Joe Gqabi 164 918 47,3 183 748 52,7 348 667 176 444 47,3 196 467 52,7 372 912 EC141 : Elundini 64 958 47,4 72 081 52,6 137 039 69 948 48,3 74 981 51,7 144 929 EC142 : Senqu 62 804 46,8 71 346 53,2 134 150 64 961 46,2 75 759 53,8 140 720 EC145 : Walter Sisulu 37 156 48,0 40 321 52,0 77 477 41 535 47,6 45 728 52,4 87 263
DC15: O.R. Tambo 630 612 46,2 735 433 53,8 1 366 045 679 882 46,7 777 502 53,3 1 457 384 EC153 : Ngquza Hill 128 974 46,3 149 507 53,7 278 481 142 829 47,1 160 549 52,9 303 379 EC154 : Port St Johns 71 482 45,8 84 654 54,2 156 136 77 077 46,2 89 701 53,8 166 779 EC155 : Nyandeni 134 241 46,2 156 149 53,8 290 390 143 803 46,4 165 899 53,6 309 702 EC156 : Mhlontlo 88 600 46,4 102 151 53,6 190 751 88 911 47,0 100 264 53,0 189 176 EC157 : King Sabata Dalindyebo 207 315 46,0 242 972 54,0 450 287 227 261 46,5 261 088 53,5 488 349
DC44: Alfred Nzo 366 488 45,7 434 857 54,3 801 344 397 206 45,8 470 658 54,2 867 864
EC441 : Matatiele 93 675 46,0 110 168 54,0 203 843 100 288 45,7 119 159 54,3 219 447
EC442 : Umzimvubu 88 013 45,9 103 762 54,1 191 775 92 129 46,2 107 491 53,8 199 620
EC443 : Mbizana 128 332 45,5 153 573 54,5 281 905 145 821 45,6 174 127 54,4 319 948
EC444 : Ntabankulu 56 467 45,6 67 354 54,4 123 821 58 968 45,8 69 880 54,2 128 848
BUF: Buffalo City 370 857 47,5 410 170 52,5 781 027 404 155 48,4 430 842 51,6 834 997
NMA: Nelson Mandela Bay 552 994 48,0 599 121 52,0 1 152 115 618 528 49,0 644 523 51,0 1 263 051
Eastern Cape 3 089 701 47,1 3 472 353 52,9 6 562 053 3 327 495 47,6 3 669 481 52,4 6 996 976

STATISTICS SOUTH AFRICA 93 Report number 03-01-08
Provincial profile: Eastern Cape [Community Survey 2016], Report 03-01-08
Table 3: Distribution of population by district, municipality and five-year age groups, CS 2016
Municipality 00-04 5-9 10-14 15-19 20-24 25-29 30-34 35-39 40-44 45-49 50-54 55-59 60+ Total
DC10: Sarah Baartman 47 494 49 079 47 769 43 039 42 057 42 977 38 907 30 107 27 449 25 304 20 890 19 213 45 637 479 923
EC101 : Dr Beyers Naudé 8 507 8 427 10 068 8 100 6 677 6 515 6 022 5 191 4 683 3 647 3 779 3 099 7 483 82 197
EC102 : Blue Crane Route 3 925 4 500 3 400 3 224 2 674 2 677 2 517 2 169 2 099 1 724 1 794 1 592 3 768 36 063
EC104 : Makana 7 183 8 290 6 551 7 405 9 069 8 999 6 819 4 437 4 197 4 268 3 643 3 501 7 699 82 060
EC105 : Ndlambe 5 896 6 032 5 769 4 612 5 486 4 981 5 114 4 421 3 896 3 430 2 751 2 875 7 919 63 180
EC106 : Sundays River Valley 5 001 5 923 6 495 6 162 5 095 5 784 5 013 4 422 3 721 3 500 2 191 2 342 4 143 59 793
EC108 : Kouga 11 857 11 301 10 802 10 074 9 841 9 998 9 190 6 581 6 161 6 488 4 897 4 320 11 431 112 941
EC109 : Kou-Kamma 5 125 4 607 4 683 3 464 3 216 4 024 4 232 2 886 2 692 2 247 1 835 1 484 3 193 43 688
DC12: Amathole 94 321 102 873 90 791 123 075 96 924 84 190 67 111 30 301 29 672 28 280 27 990 29 865 75 397 880 790
EC121 : Mbhashe 33 511 33 682 32 151 46 012 31 914 23 758 18 031 8 221 7 585 6 879 7 022 7 923 20 560 277 250
EC122 : Mnquma 26 611 28 822 26 136 35 857 27 446 23 989 16 936 8 054 7 805 7 463 7 359 8 255 22 080 246 813
EC123 : Great Kei 3 095 3 243 2 336 3 508 3 296 3 454 3 378 1 646 1 188 1 395 1 007 1 129 3 016 31 692
EC124 : Amahlathi 10 077 12 422 9 551 11 355 11 104 9 980 9 158 3 612 3 670 4 136 4 222 4 147 8 390 101 826
EC126 : Ngqushwa 6 616 7 474 5 744 6 915 6 150 5 587 4 804 2 466 2 769 2 430 2 558 2 746 7 434 63 694
EC129 : Raymond Mhlaba 14 410 17 229 14 874 19 427 17 013 17 422 14 804 6 302 6 653 5 976 5 823 5 665 13 917 159 515
DC13: Chris Hani 106 178 114 442 106 494 96 431 80 336 72 708 61 013 28 155 27 068 25 327 24 053 25 382 72 468 840 055
EC131 : Inxuba Yethemba 8 000 8 661 7 646 7 271 7 190 7 205 5 852 3 398 2 656 2 819 2 625 2 066 5 103 70 493
EC135 : Intsika Yethu 18 412 21 794 21 006 17 820 12 410 12 058 10 056 3 975 4 388 4 479 4 353 5 017 16 390 152 159
EC137 : Engcobo 24 220 24 034 23 370 17 963 15 674 12 671 10 172 4 407 4 484 3 954 3 865 4 460 12 740 162 014
EC138 : Sakhisizwe 9 023 7 926 7 742 7 898 6 579 5 476 4 754 2 249 2 036 1 791 1 774 1 804 4 795 63 846
EC139 : Enoch Mgijima 30 695 34 056 30 533 30 295 27 154 26 236 22 371 10 351 10 049 8 693 8 156 8 067 20 355 267 011
EC136 : Emalahleni 15 828 17 970 16 197 15 184 11 330 9 062 7 808 3 776 3 455 3 591 3 281 3 967 13 085 124 532
DC14: Joe Gqabi 44 429 47 460 45 287 47 754 38 523 34 472 29 620 14 278 12 256 10 553 10 245 9 949 28 086 372 912
EC141 : Elundini 17 250 18 355 18 677 20 145 14 797 12 488 10 282 4 863 4 507 3 818 3 994 3 920 11 832 144 929
EC142 : Senqu 17 152 18 299 16 429 18 180 14 532 13 559 10 512 5 746 4 316 3 748 3 550 3 720 10 976 140 720
EC145 : Walter Sisulu 10 027 10 806 10 180 9 430 9 194 8 425 8 825 3 669 3 433 2 987 2 702 2 308 5 278 87 263
DC15: O.R. Tambo 191 078 191 705 184 814 197 580 165 264 131 980 97 694 50 745 43 276 38 850 35 109 34 956 94 333 1 457 384
EC153 : Ngquza Hill 44 321 43 294 42 247 41 519 32 613 25 544 18 614 10 295 7 696 6 884 6 077 6 230 18 044 303 379
EC154 : Port St Johns 24 290 23 244 23 716 22 923 19 269 13 274 8 961 5 116 4 115 3 818 3 780 3 424 10 851 166 779
EC155 : Nyandeni 42 010 42 581 41 566 42 126 34 593 26 229 19 508 9 935 9 117 8 076 6 628 7 054 20 280 309 702
EC156 : Mhlontlo 23 856 24 938 24 620 24 917 18 973 15 752 11 665 6 207 5 583 5 669 5 127 5 704 16 165 189 176
EC157 : King Sabata Dalindyebo 56 602 57 650 52 665 66 094 59 816 51 181 38 946 19 193 16 766 14 402 13 496 12 545 28 993 488 349

STATISTICS SOUTH AFRICA 94 Report number 03-01-08
Provincial profile: Eastern Cape [Community Survey 2016], Report 03-01-08
Municipality 00-04 5-9 10-14 15-19 20-24 25-29 30-34 35-39 40-44 45-49 50-54 55-59 60+ Total
DC44: Alfred Nzo 117 209 117 389 111 027 119 260 92 279 74 326 54 888 28 239 24 442 20 842 19 371 20 144 68 448 867 864
EC441 : Matatiele 27 507 28 102 26 571 28 887 22 319 19 876 14 949 8 045 6 717 5 553 5 047 5 862 20 012 219 447
EC442 : Umzimvubu 23 451 25 308 24 345 26 586 22 341 18 149 13 391 6 916 5 831 5 405 5 128 4 871 17 900 199 620
EC443 : Mbizana 47 802 46 662 43 793 45 786 33 547 25 292 18 942 9 224 8 648 7 215 6 173 6 766 20 099 319 948
EC444 : Ntabankulu 18 449 17 316 16 318 18 001 14 072 11 009 7 607 4 054 3 247 2 670 3 023 2 646 10 437 128 848
BUF: Buffalo City 90 056 92 348 81 133 67 064 73 294 79 310 68 566 57 182 49 649 45 134 37 987 34 006 59 269 834 997
NMA: Nelson Mandela Bay 125 120 133 005 127 897 95 403 111 088 103 622 93 679 83 983 78 082 70 900 62 299 58 164 119 809 1 263 051
Eastern Cape 815 885 848 302 795 212 789 607 699 765 623 584 511 477 322 991 291 894 265 189 237 945 231 679 563 447 6 996 976

STATISTICS SOUTH AFRICA 95 Report number 03-01-08
Provincial profile: Eastern Cape [Community Survey 2016], Report 03-01-08
Table 4: Distribution of population by municipality, broad age groups and dependency ratio, CS 2016
Municipality 0 - 14 15 - 34 35 - 64 65 + Dependency
ratio Number % Number % Number % Number %
DC10: Sarah Baartman 144 343 30,1 166 980 34,8 122 963 25,6 45 637 9,5 57,1
EC101 : Dr Beyers Naudé 27 002 32,9 27 313 33,2 20 399 24,8 7 483 9,1 63,6
EC102 : Blue Crane Route 11 824 32,8 11 092 30,8 9 379 26 3 768 10,4 64,7
EC104 : Makana 22 024 26,8 32 291 39,4 20 046 24,4 7 699 9,4 47,9
EC105 : Ndlambe 17 697 28 20 192 32 17 373 27,5 7 919 12,5 58,8
EC106 : Sundays River Valley 17 420 29,1 22 054 36,9 16 176 27,1 4 143 6,9 50,3
EC108 : Kouga 33 960 30,1 39 103 34,6 28 447 25,2 11 431 10,1 59,7
EC109 : Kou-Kamma 14 416 33 14 936 34,2 11 143 25,5 3 193 7,3 58,8
DC12: Amathole 287 986 32,7 371 300 42,2 146 108 16,6 75 397 8,6 62,4
EC121 : Mbhashe 99 344 35,8 119 715 43,2 37 630 13,6 20 560 7,4 69,6
EC122 : Mnquma 81 570 33,1 104 229 42,2 38 935 15,8 22 080 8,9 63,8
EC123 : Great Kei 8 674 27,4 13 636 43 6 366 20,1 3 016 9,5 50,6
EC124 : Amahlathi 32 050 31,5 41 598 40,9 19 787 19,4 8 390 8,2 58,0
EC126 : Ngqushwa 19 834 31,1 23 456 36,8 12 970 20,4 7 434 11,7 64,6
EC129 : Raymond Mhlaba 46 513 29,2 68 666 43,1 30 419 19,1 13 917 8,7 53,2
DC13: Chris Hani 327 114 38,9 310 488 37 129 985 15,5 72 468 8,6 81,1
EC131 : Inxuba Yethemba 24 307 34,5 27 519 39 13 564 19,2 5 103 7,2 63,7
EC135 : Intsika Yethu 61 212 40,2 52 344 34,4 22 212 14,6 16 390 10,8 91,1
EC137 : Engcobo 71 624 44,2 56 480 34,9 21 170 13,1 12 740 7,9 98,6
EC138 : Sakhisizwe 24 691 38,7 24 707 38,7 9 653 15,1 4 795 7,5 78,0
EC139 : Enoch Mgijima 95 285 35,7 106 056 39,7 45 316 17 20 355 7,6 68,7
EC136 : Emalahleni 49 995 40,2 43 383 34,8 18 069 14,5 13 085 10,5 90,5
DC14: Joe Gqabi 137 176 36,8 150 369 40,3 57 281 15,4 28 086 7,5 71,7
EC141 : Elundini 54 283 37,5 57 712 39,8 21 102 14,6 11 832 8,2 75,6
EC142 : Senqu 51 880 36,9 56 783 40,4 21 080 15 10 976 7,8 72,4
EC145 : Walter Sisulu 31 013 35,5 35 874 41,1 15 098 17,3 5 278 6 64,6
DC15: O.R. Tambo 567 597 39 592 517 40,7 202 936 13,9 94 333 6,5 76,9
EC153 : Ngquza Hill 129 862 42,8 118 291 39 37 182 12,3 18 044 5,9 89,4
EC154 : Port St Johns 71 249 42,7 64 426 38,6 20 253 12,1 10 851 6,5 90,1
EC155 : Nyandeni 126 156 40,7 122 456 39,5 40 810 13,2 20 280 6,5 82,4
EC156 : Mhlontlo 73 414 38,8 71 307 37,7 28 290 15 16 165 8,5 81,6
EC157 : King Sabata Dalindyebo
166 917 34,2 216 037 44,2 76 402 15,6 28 993 5,9 61,8
DC44: Alfred Nzo 345 624 39,8 340 753 39,3 113 039 13 68 448 7,9 83,8
EC441 : Matatiele 82 180 37,5 86 032 39,2 31 224 14,2 20 012 9,1 78,3
EC442 : Umzimvubu 73 104 36,6 80 466 40,3 28 151 14,1 17 900 9 75,4
EC443 : Mbizana 138 257 43,2 123 567 38,6 38 025 11,9 20 099 6,3 92,5
EC444 : Ntabankulu 52 083 40,4 50 689 39,3 15 640 12,1 10 437 8,1 86,4
BUF: Buffalo City 263 537 31,6 288 234 34,5 223 958 26,8 59 269 7,1 55,4
NMA: Nelson Mandela Bay 386 022 30,6 403 792 32 353 428 28 119 809 9,5 57,3
Eastern Cape 2 459 398 35,15 2 624 433 37,5 1 349 698 19,3 563 447 8,1 68,0

STATISTICS SOUTH AFRICA 96 Report number 03-01-08
Provincial profile: Eastern Cape [Community Survey 2016], Report 03-01-08
Table 5: Distribution of population by population group and municipality, CS 2016
Municipality Black African Coloured Indian/Asian White
Total Number % Number % Number % Number %
DC10: Sarah Baartman 263 026 54,8 176 118 36,7 1 096 0,2 39 682 8,3 479 923
EC101 : Dr Beyers Naudé 20 611 25,1 55 324 67,3 45 0,1 6 217 7,6 82 197
EC102 : Blue Crane Route 21 283 59,0 13 283 36,8 50 0,1 1 448 4,0 36 063
EC104 : Makana 66 257 80,7 8 788 10,7 470 0,6 6 545 8,0 82 060
EC105 : Ndlambe 52 697 83,4 5 077 8,0 136 0,2 5 271 8,3 63 180
EC106 : Sundays River Valley 41 650 69,7 17 086 28,6 309 0,5 748 1,3 59 793
EC108 : Kouga 46 974 41,6 49 752 44,1 37 0,0 16 179 14,3 112 941
EC109 : Kou-Kamma 13 554 31,0 26 810 61,4 50 0,1 3 274 7,5 43 688
DC12: Amathole 859 414 97,6 12 074 1,4 853 0,1 8 450 1,0 880 790
EC121 : Mbhashe 276 646 99,8 187 0,1 212 0,1 206 0,1 277 250
EC122 : Mnquma 246 117 99,7 294 0,1 333 0,1 70 0,0 246 813
EC123 : Great Kei 27 727 87,5 356 1,1 30 0,1 3 580 11,3 31 692
EC124 : Amahlathi 97 591 95,8 1 575 1,5 116 0,1 2 543 2,5 101 826
EC126 : Ngqushwa 63 411 99,6 162 0,3 25 0,0 96 0,2 63 694
EC129 : Raymond Mhlaba 147 922 92,7 9 499 6,0 138 0,1 1 955 1,2 159 515
DC13: Chris Hani 788 149 93,8 35 702 4,2 1 474 0,2 14 729 1,8 840 055
EC131 : Inxuba Yethemba 39 740 56,4 25 216 35,8 159 0,2 5 379 7,6 70 493
EC135 : Intsika Yethu 151 925 99,8 152 0,1 67 0,0 15 0,0 152 159
EC137 : Engcobo 161 787 99,9 119 0,1 98 0,1 10 0,0 162 014
EC138 : Sakhisizwe 63 246 99,1 352 0,6 24 0,0 226 0,4 63 846
EC139 : Enoch Mgijima 248 125 92,9 9 035 3,4 998 0,4 8 853 3,3 267 011
EC136 : Emalahleni 123 327 99,0 829 0,7 129 0,1 246 0,2 124 532
DC14: Joe Gqabi 352 041 94,4 12 260 3,3 647 0,2 7 963 2,1 372 912
EC141 : Elundini 142 393 98,3 1 459 1,0 96 0,1 981 0,7 144 929
EC142 : Senqu 137 498 97,7 1 076 0,8 79 0,1 2 067 1,5 140 720
EC145 : Walter Sisulu 72 151 82,7 9 725 11,1 472 0,5 4 915 5,6 87 263
DC15: O.R. Tambo 1 448 553 99,4 6 183 0,4 1 449 0,1 1 199 0,1 1 457 384
EC153 : Ngquza Hill 301 663 99,4 1 305 0,4 315 0,1 96 0,0 303 379
EC154 : Port St Johns 165 382 99,2 995 0,6 217 0,1 185 0,1 166 779
EC155 : Nyandeni 308 682 99,7 829 0,3 137 0,0 54 0,0 309 702
EC156 : Mhlontlo 188 800 99,8 242 0,1 112 0,1 22 0,0 189 176
EC157 : King Sabata Dalindyebo 484 025 99,1 2 812 0,6 669 0,1 843 0,2 488 349
DC44: Alfred Nzo 862 589 99,4 3 647 0,4 598 0,1 1 030 0,1 867 864
EC441 : Matatiele 215 886 98,4 2 208 1,0 373 0,2 981 0,4 219 447
EC442 : Umzimvubu 199 031 99,7 477 0,2 110 0,1 2 0,0 199 620
EC443 : Mbizana 319 083 99,7 761 0,2 91 0,0 13 0,0 319 948
EC444 : Ntabankulu 128 588 99,8 201 0,2 24 0,0 35 0,0 128 848
BUF: Buffalo City 713 453 85,4 56 072 6,7 7 457 0,9 58 015 6,9 834 997
NMA: Nelson Mandela Bay 756 688 59,9 301 629 23,9 15 628 1,2 189 106 15,0 1 263 051
Eastern Cape 6 043 913 86,4 603 685 8,6 29 204 0,4 320 174 4,6 6 996 976
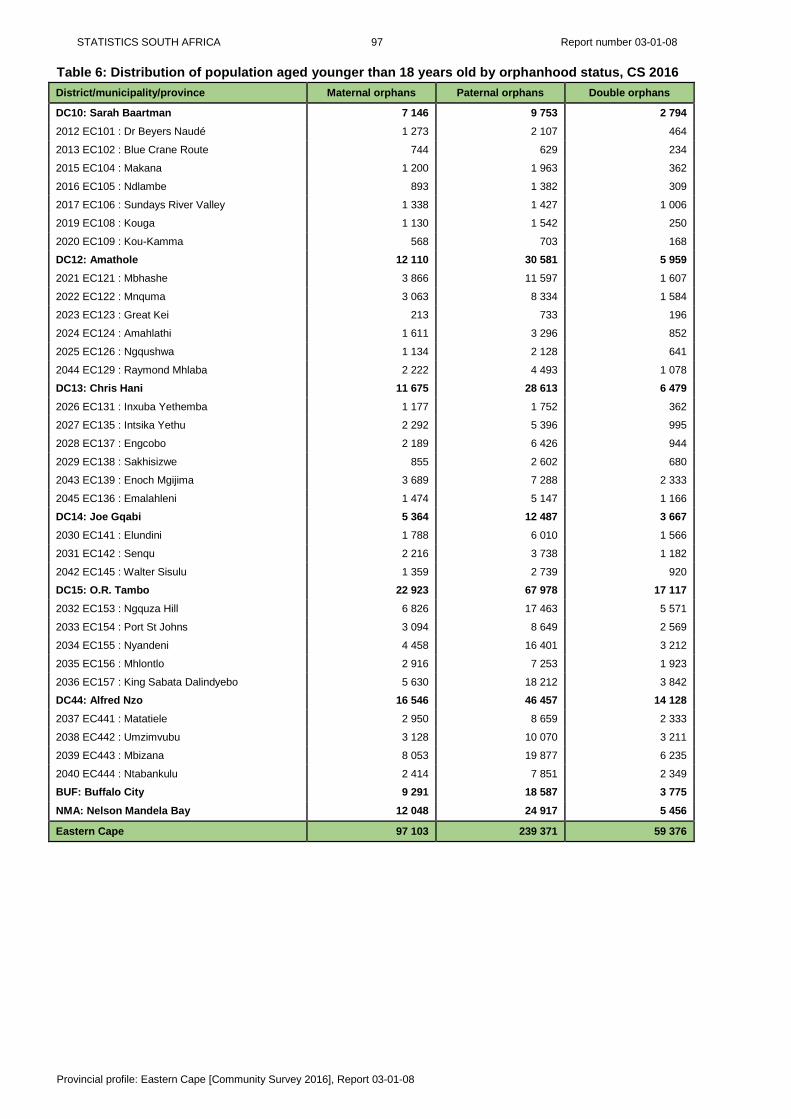
STATISTICS SOUTH AFRICA 97 Report number 03-01-08
Provincial profile: Eastern Cape [Community Survey 2016], Report 03-01-08
Table 6: Distribution of population aged younger than 18 years old by orphanhood status, CS 2016
District/municipality/province Maternal orphans Paternal orphans Double orphans
DC10: Sarah Baartman 7 146 9 753 2 794
2012 EC101 : Dr Beyers Naudé 1 273 2 107 464
2013 EC102 : Blue Crane Route 744 629 234
2015 EC104 : Makana 1 200 1 963 362
2016 EC105 : Ndlambe 893 1 382 309
2017 EC106 : Sundays River Valley 1 338 1 427 1 006
2019 EC108 : Kouga 1 130 1 542 250
2020 EC109 : Kou-Kamma 568 703 168
DC12: Amathole 12 110 30 581 5 959
2021 EC121 : Mbhashe 3 866 11 597 1 607
2022 EC122 : Mnquma 3 063 8 334 1 584
2023 EC123 : Great Kei 213 733 196
2024 EC124 : Amahlathi 1 611 3 296 852
2025 EC126 : Ngqushwa 1 134 2 128 641
2044 EC129 : Raymond Mhlaba 2 222 4 493 1 078
DC13: Chris Hani 11 675 28 613 6 479
2026 EC131 : Inxuba Yethemba 1 177 1 752 362
2027 EC135 : Intsika Yethu 2 292 5 396 995
2028 EC137 : Engcobo 2 189 6 426 944
2029 EC138 : Sakhisizwe 855 2 602 680
2043 EC139 : Enoch Mgijima 3 689 7 288 2 333
2045 EC136 : Emalahleni 1 474 5 147 1 166
DC14: Joe Gqabi 5 364 12 487 3 667
2030 EC141 : Elundini 1 788 6 010 1 566
2031 EC142 : Senqu 2 216 3 738 1 182
2042 EC145 : Walter Sisulu 1 359 2 739 920
DC15: O.R. Tambo 22 923 67 978 17 117
2032 EC153 : Ngquza Hill 6 826 17 463 5 571
2033 EC154 : Port St Johns 3 094 8 649 2 569
2034 EC155 : Nyandeni 4 458 16 401 3 212
2035 EC156 : Mhlontlo 2 916 7 253 1 923
2036 EC157 : King Sabata Dalindyebo 5 630 18 212 3 842
DC44: Alfred Nzo 16 546 46 457 14 128
2037 EC441 : Matatiele 2 950 8 659 2 333
2038 EC442 : Umzimvubu 3 128 10 070 3 211
2039 EC443 : Mbizana 8 053 19 877 6 235
2040 EC444 : Ntabankulu 2 414 7 851 2 349
BUF: Buffalo City 9 291 18 587 3 775
NMA: Nelson Mandela Bay 12 048 24 917 5 456
Eastern Cape 97 103 239 371 59 376

STATISTICS SOUTH AFRICA 98 Report number 03-01-08
Provincial profile: Eastern Cape [Community Survey 2016], Report 03-01-08
Table 7: Population aged 0–4 years by attendance at an educational institution, CS 2016
Attending Not attending
0 1 2 3 4 0 1 2 3 4
DC10: Sarah Baartman 141 1 093 3 074 6 346 7 531 8 488 7 786 6 910 3 995 2 105
EC101 : Dr Beyers Naudé - 92 209 871 1 158 1 219 1 699 1 747 862 626
EC102 : Blue Crane Route 21 45 324 720 904 639 484 521 171 94
EC104 : Makana 42 139 575 1 443 1 399 1 171 1 212 752 376 73
EC105 : Ndlambe - 387 906 1 114 956 1 089 869 279 168 127
EC106 : Sundays River Valley 22 116 320 632 1 147 727 819 519 620 80
EC108 : Kouga 56 259 369 1 038 1 322 2 563 1 751 2 266 1 295 939
EC109 : Kou-Kamma - 56 371 529 644 1 080 950 826 503 166
DC12: Amathole 220 1 526 6 113 10 467 16 647 15 575 16 715 14 290 8 706 3 955
EC121 : Mbhashe - 353 1 613 3 083 5 517 5 758 5 960 5 767 3 602 1 827
EC122 : Mnquma 26 310 1 422 2 759 4 439 4 481 5 429 3 971 2 624 1 124
EC123 : Great Kei 16 45 262 414 522 518 550 465 272 32
EC124 : Amahlathi 42 247 788 1 166 1 887 1 443 1 737 1 453 957 356
EC126 : Ngqushwa 39 175 692 964 1 388 1 096 1 007 745 395 84
EC129 : Raymond Mhlaba 97 396 1 337 2 081 2 893 2 279 2 032 1 890 857 532
DC13: Chris Hani 287 2 196 7 049 12 354 18 982 17 973 17 279 15 329 10 051 4 627
EC131 : Inxuba Yethemba - 138 466 1 005 1 238 1 572 1 473 1 073 787 248
EC135 : Intsika Yethu 41 265 954 2 028 3 178 2 922 3 114 2 533 2 223 1 154
EC137 : Engcobo 60 306 1 130 1 789 4 256 4 073 4 226 4 114 2 896 1 370
EC138 : Sakhisizwe 62 542 866 1 352 1 583 1 685 1 111 977 621 224
EC139 : Enoch Mgijima 54 670 2 446 4 386 5 991 5 240 4 737 4 137 1 934 1 051
EC136 : Emalahleni 71 276 1 188 1 794 2 736 2 481 2 618 2 496 1 589 580
DC14: Joe Gqabi 130 611 2 181 4 200 7 840 7 209 8 312 6 616 4 726 2 567
EC141 : Elundini 22 259 609 1 783 3 169 2 835 3 167 2 479 1 977 929
EC142 : Senqu 91 146 778 1 602 3 068 3 042 3 120 2 511 1 892 884
EC145 : Walter Sisulu 18 206 794 815 1 602 1 332 2 024 1 625 856 753

STATISTICS SOUTH AFRICA 99 Report number 03-01-08
Provincial profile: Eastern Cape [Community Survey 2016], Report 03-01-08
Attending Not attending
0 1 2 3 4 0 1 2 3 4
DC15: O.R. Tambo 398 1 375 5 280 15 491 30 363 33 629 36 159 32 046 25 592 10 635
EC153 : Ngquza Hill 56 271 1 067 3 146 6 974 7 909 8 111 7 680 6 579 2 494
EC154 : Port St Johns 21 54 237 1 699 3 218 4 482 4 365 4 573 3 779 1 861
EC155 : Nyandeni 144 389 1 351 3 150 6 868 6 993 9 001 6 827 5 260 1 985
EC156 : Mhlontlo 56 194 985 2 119 4 028 4 017 4 169 3 697 3 197 1 394
EC157 : King Sabata Dalindyebo 120 466 1 640 5 377 9 275 10 227 10 513 9 269 6 777 2 901
DC44: Alfred Nzo 157 586 2 939 9 597 19 650 20 888 22 814 20 937 13 864 5 740
EC441 : Matatiele 18 267 872 2 584 4 741 4 864 5 093 4 993 3 099 958
EC442 : Umzimvubu 31 144 713 2 357 4 506 4 344 4 362 3 826 2 468 684
EC443 : Mbizana 46 79 774 2 766 7 344 8 343 9 700 9 024 6 441 3 279
EC444 : Ntabankulu 62 97 578 1 890 3 059 3 336 3 659 3 094 1 855 819
BUF: Buffalo City 761 3 257 9 105 14 336 16 708 16 257 13 776 9 188 4 215 2 336
NMA: Nelson Mandela Bay 600 4 082 10 770 16 735 19 097 21 271 20 719 14 488 10 548 6 785
Eastern Cape 2 693 14 727 46 511 89 526 136 817 141 289 143 560 119 803 81 697 38 749

STATISTICS SOUTH AFRICA 100 Report number 03-01-08
Provincial profile: Eastern Cape [Community Survey 2016], Report 03-01-08
Table 8: Population aged 5–24 years attending an educational institution, Census 2011 and CS 2016
Municipality Census 2011 CS 2016
Number % Number %
DC10: Sarah Baartman 96 669 66,1 128 580 70,7
EC101 : Dr Beyers Naudé 18 657 68 23 658 71,2
EC102 : Blue Crane Route 8 036 66,8 10 267 74,4
EC104 : Makana 18 517 73 23 464 74,9
EC105 : Ndlambe 12 731 68,1 15 471 70,6
EC106 : Sundays River Valley 10 896 60,7 15 730 66,4
EC108 : Kouga 19 575 63,2 28 525 67,9
EC109 : Kou-Kamma 8 257 59,7 11 465 71,9
DC12: Amathole 275 812 79,9 316 715 76,6
EC121 : Mbhashe 98 580 81,7 111 310 77,5
EC122 : Mnquma 84 291 82,1 93 037 78,7
EC123 : Great Kei 7 517 72,7 8 834 71,3
EC124 : Amahlathi 28 276 76,1 32 064 72,2
EC126 : Ngqushwa 17 858 78,7 20 055 76,4
EC129 : Raymond Mhlaba 39 291 76,4 51 414 75,1
DC13: Chris Hani 259 857 79,4 307 821 77,4
EC131 : Inxuba Yethemba 15 906 70 21 178 68,8
EC135 : Intsika Yethu 52 065 81,7 57 789 79,1
EC137 : Engcobo 56 315 81,4 62 952 77,7
EC138 : Sakhisizwe 20 364 79,3 23 244 77,1
EC139 : Enoch Mgijima 74 441 77,4 95 941 78,7
EC136 : Emalahleni 40 766 81,6 46 718 77
DC14: Joe Gqabi 114 479 78,6 141 721 79,2
EC141 : Elundini 48 063 80,7 58 715 81,6
EC142 : Senqu 45 166 79,4 53 536 79,4
EC145 : Walter Sisulu 21 250 72,6 29 471 74,5
DC15: O.R. Tambo 520 331 81 574 344 77,7
EC153 : Ngquza Hill 107 449 79,6 127 457 79,9
EC154 : Port St Johns 63 788 82,3 63 617 71,4
EC155 : Nyandeni 117 442 82,5 129 041 80,2
EC156 : Mhlontlo 71 624 81,6 73 026 78,1
EC157 : King Sabata Dalindyebo 160 029 80 181 204 76,7
DC44: Alfred Nzo 308 115 81,1 349 855 79,5
EC441 : Matatiele 74 310 80,4 83 731 79,2
EC442 : Umzimvubu 69 889 80,8 77 104 78,2
EC443 : Mbizana 115 157 81,8 137 445 81
EC444 : Ntabankulu 48 759 81,3 51 577 78,5
BUF: Buffalo City 195 086 74,9 246 366 78,5
NMA: Nelson Mandela Bay 269 961 70,7 356 953 76,4
Eastern Cape 2 040 311 77,6 2 422 357 77,3
STATISTICS SOUTH AFRICA 101 Report number 03-01-08
Provincial profile: Eastern Cape [Community Survey 2016], Report 03-01-08
Table 9: Type of educational institution attended by municipality, CS 2016
Pre-
school Primary school
Seconda-ry school
Technical vocational
education and training
Other college
Higher educational institution
Community education and
training college
Home-based education/home
schooling Other Total
DC10: Sarah Baartman 2 991 81 077 39 536 1 949 212 2 117 260 140 279 128 561
EC101 : Dr Beyers Naudé 412 14 430 8 338 228 62 45 0 74 69 23 658
EC102 : Blue Crane Route 253 6 923 2 927 104 0 59 0 0 0 10 267
EC104 : Makana 835 12 193 7 293 1 305 80 1 582 67 0 90 23 445
EC105 : Ndlambe 276 9 889 4 954 70 0 129 52 66 34 15 471
EC106 : Sundays River Valley 206 11 485 3 812 115 25 41 47 0 0 15 730
EC108 : Kouga 881 17 838 9 371 69 24 208 48 0 86 28 525
EC109 : Kou-Kamma 127 8 320 2 840 57 21 54 45 0 0 11 465
DC12: Amathole 2 901 175 568 126 924 5 323 740 4 070 491 166 451 316 634
EC121 : Mbhashe 746 62 784 45 356 1 397 181 590 108 53 15 111 230
EC122 : Mnquma 1 093 49 603 37 846 2 141 129 1 930 238 2 53 93 037
EC123 : Great Kei 227 4 955 3 521 64 0 23 0 0 44 8 834
EC124 : Amahlathi 192 18 715 12 168 434 79 249 98 50 76 32 064
EC126 : Ngqushwa 157 11 797 7 517 357 107 88 18 14 0 20 055
EC129 : Raymond Mhlaba 485 27 714 20 515 931 245 1 190 28 46 263 51 414
DC13: Chris Hani 3 619 193 455 102 146 3 894 900 2 589 519 69 437 307 628
EC131 : Inxuba Yethemba 450 14 009 6 373 124 69 16 43 0 93 21 178
EC135 : Intsika Yethu 662 37 341 19 122 313 66 285 0 0 1 57 789
EC137 : Engcobo 493 41 441 19 946 491 60 355 47 0 49 62 882
EC138 : Sakhisizwe 177 14 254 8 212 201 21 217 48 0 63 23 193
EC139 : Enoch Mgijima 1 433 56 217 33 424 2 077 587 1 612 254 65 216 95 885
EC136 : Emalahleni 405 30 193 15 068 688 97 105 127 4 15 46 702
DC14: Joe Gqabi 1 712 82 391 53 761 2 394 248 634 187 75 245 141 647
EC141 : Elundini 408 33 918 22 947 733 66 346 88 38 171 58 715
EC142 : Senqu 770 30 570 20 821 924 146 202 46 38 0 53 517
EC145 : Walter Sisulu 534 17 903 9 993 736 37 86 53 0 74 29 415

STATISTICS SOUTH AFRICA 102 Report number 03-01-08
Provincial profile: Eastern Cape [Community Survey 2016], Report 03-01-08
Pre-
school Primary school
Secondary school
Technical vocational
education and training
Other college
Higher educational institution
Community education
and training college
Home-based education/home
schooling Other Total
DC15: O.R. Tambo 5 595 338 865 211 498 8 889 1 412 6 050 816 194 907 574 226
EC153 : Ngquza Hill 1 291 77 513 46 281 1 810 64 305 97 25 71 127 457
EC154 : Port St Johns 282 39 246 22 890 554 80 351 157 19 37 63 617
EC155 : Nyandeni 938 77 497 47 131 1 742 292 1 008 191 50 172 129 021
EC156 : Mhlontlo 762 45 536 25 412 612 186 283 121 0 75 72 987
EC157 : King Sabata Dalindyebo 2 322 99 073 69 784 4 171 788 4 104 250 99 552 181 144
DC44: Alfred Nzo 2 649 211 181 128 430 4 173 490 1 662 647 173 366 349 769
EC441 : Matatiele 930 50 496 29 457 1 681 169 381 186 97 270 83 665
EC442 : Umzimvubu 464 45 447 29 413 936 106 513 128 59 37 77 104
EC443 : Mbizana 957 83 673 50 522 1 349 158 557 192 17 19 137 443
EC444 : Ntabankulu 298 31 565 19 038 207 58 211 141 0 40 51 557
BUF: Buffalo City 5 282 145 783 77 397 7 484 2 083 6 326 533 355 1 003 246 246
NMA: Nelson Mandela Bay 6 900 212 276 101 864 9 407 3 452 19 055 1 456 546 1 771 356 727
Eastern Cape 31 649 1 440 596 841 555 43 513 9 537 42 502 4 908 1 718 5 460 2 421 438

STATISTICS SOUTH AFRICA 103 Report number 03-01-08
Provincial profile: Eastern Cape [Community Survey 2016], Report 03-01-08
Table 10: Distribution of the population aged 20 years and older by highest level of education, Eastern Cape and South Africa, CS 2016
District/local municipality No
schooling Incomplete
primary Primary
Incomplete secondary
Secondary Certificate Diploma Bachelor’s
degree Honours+ Total
DC10: Cacadu 14 051 44 478 20 002 118 124 71 709 3 288 4 324 6 287 4 826 287 090
EC101 : Dr Beyers Naudé 2 527 7 486 3 341 18 616 11 924 391 579 875 638 46 377
EC102 : Blue Crane Route 1 307 4 525 2 056 8 108 4 309 100 263 102 71 20 841
EC104 : Makana 1 921 5 464 2 629 20 699 14 228 1 654 1 130 2 251 1 803 51 779
EC105 : Ndlambe 2 998 7 212 2 817 15 047 9 479 227 1 139 758 886 40 562
EC106 : Sundays River Valley 2 088 7 664 2 732 16 081 5 630 132 206 130 91 34 755
EC108 : Kouga 2 644 8 252 4 515 28 045 20 348 468 718 1 491 1 081 67 562
EC109 : Kou-Kamma 566 3875 1912 11527 5791 317 289 680 256 25213
DC12: Amathole 47 883 73 798 29 992 196 539 89 081 5 451 8 087 7 726 5 360 463 917
EC121 : Mbhashe 20 527 25 479 8 041 52 800 18 024 1 296 1 479 1 891 1 236 130 772
EC122 : Mnquma 16 197 17 108 7 403 53 523 23 308 1 999 3 261 2 553 1 797 127 149
EC123 : Great Kei 1 491 3 385 1 320 8 462 3 731 170 274 226 187 19 245
EC124 : Amahlathi 3 171 9 426 4 290 26 196 11 819 699 854 809 426 57 688
EC126 : Ngqushwa 2 870 6 255 2 905 14 847 7 913 472 706 430 350 36 748
EC129 : Raymond Mhlaba 3 627 12 145 6 033 40 712 24 287 817 1 512 1 817 1 366 92 315
DC13: Chris Hani 50 852 65 919 23 793 160 506 83 425 6 050 6 761 7 857 6 536 411 700
EC131 : Inxuba Yethemba 2 420 5 801 3 139 14 831 9 721 366 712 857 499 38 346
EC135 : Intsika Yethu 9 101 13 991 4 949 29 853 11 616 588 973 839 868 72 777
EC137 : Engcobo 15 221 11 357 3 752 27 654 9 978 984 869 843 1 141 71 799
EC138 : Sakhisizwe 5 077 4 379 1 547 12 398 5 196 415 368 703 591 30 674
EC139 : Enoch Mgijima 11 831 17 466 6 894 52 131 37 731 3 237 3 307 4 183 2 757 139 538
EC136 : Emalahleni 7 203 12 926 3 511 23 640 9 183 459 532 433 680 58 566
DC14: Joe Gqabi 15 038 33 634 12 620 77 389 36 654 3 179 2 630 2 809 2 268 186 220
EC141 : Elundini 4 037 14 466 5 199 30 842 11 588 899 801 860 905 69 599
EC142 : Senqu 7 556 12 504 4 146 28 941 13 450 1 247 833 953 687 70 316
EC145 : Walter Sisulu 3 446 6 664 3 276 17 606 11 616 1 032 995 996 675 46 306
DC15: O.R. Tambo 96 184 104 941 35 213 281 296 124 775 10 284 10 272 14 156 9 440 686 561
EC153 : Ngquza Hill 15 470 26 207 7 430 56 349 18 917 2 119 1 540 2 073 1 422 131 526
EC154 : Port St Johns 11 688 15 307 4 274 27 297 11 344 692 552 646 575 72 373
EC155 : Nyandeni 18 464 21 208 7 483 60 743 24 748 2 151 1 355 1 975 1 898 140 025
EC156 : Mhlontlo 10 416 15 430 5 606 42 344 13 480 726 766 696 831 90 295
EC157 : King Sabata Dalindyebo 40 146 26 789 10 422 94 563 56 285 4 596 6 058 8 766 4 715 252 342
DC44: Alfred Nzo 36 504 77 214 26 885 170 757 66 538 5 524 6 018 6 159 4 458 400 056
STATISTICS SOUTH AFRICA 104 Report number 03-01-08
Provincial profile: Eastern Cape [Community Survey 2016], Report 03-01-08
District/local municipality No
schooling Incomplete
primary Primary
Incomplete secondary
Secondary Certificate Diploma Bachelor’s
degree Honours+ Total
EC441 : Matatiele 6 861 19 299 7 467 47 106 19 688 1 927 1 844 1 541 1 269 107 000
EC442 : Umzimvubu 4 352 18 165 7 203 46 848 16 904 1 506 1 673 1 514 1 176 99 341
EC443 : Mbizana 16 842 27 446 8 047 54 048 21 833 1 512 1 901 2 296 1 455 135 380
EC444 : Ntabankulu 8 448 12 305 4 169 22 755 8 114 578 601 808 558 58 335
BUF: Buffalo City 20 260 39 963 21 428 190 562 156 154 10 722 19 492 23 603 15 214 497 399
NMA: Nelson Mandela Bay 20 134 51 429 31 894 302 667 272 750 16 316 22 186 29 486 19 126 765 989
Eastern Cape 300 907 491 375 201 828 1 497 841 901 087 60 815 79 769 98 083 67 228 3 698 933

STATISTICS SOUTH AFRICA 105 Report number 03-01-08
Provincial profile: Eastern Cape [Community Survey 2016], Report 03-01-08
Table 11: Breastfeeding practices by district, municipality and province, CS 2016
Municipality Breastfeeding practices (last child born alive)
Breastfed Did not breastfeed Prevalence Total
DC10: Sarah Baartman 64 469 13 725 82,4 78 194
EC101 : Dr Beyers Naudé 11 992 1 047 92 13 039
EC102 : Blue Crane Route 3 699 895 80,5 4 594
EC104 : Makana 11 478 1 660 87,4 13 138
EC105 : Ndlambe 6 991 3 658 65,6 10 649
EC106 : Sundays River Valley 8 256 1 435 85,2 9 692
EC108 : Kouga 15 659 4 157 79 19 816
EC109 : Kou-Kamma 6 394 873 88 7 267
DC12: Amathole 100 356 35 590 73,8 135 946
EC121 : Mbhashe 30 882 12 857 70,6 43 739
EC122 : Mnquma 26 065 11 836 68,8 37 900
EC123 : Great Kei 3 341 2 140 61 5 481
EC124 : Amahlathi 13 036 2 765 82,5 15 801
EC126 : Ngqushwa 7 784 1 661 82,4 9 445
EC129 : Raymond Mhlaba 19 248 4 331 81,6 23 579
DC13: Chris Hani 87 432 22 053 79,9 109 485
EC131 : Inxuba Yethemba 9 828 2 127 82,2 11 956
EC135 : Intsika Yethu 14 356 4 203 77,4 18 558
EC137 : Engcobo 14 919 5 516 73 20 435
EC138 : Sakhisizwe 7 118 1 761 80,2 8 879
EC139 : Enoch Mgijima 31 962 6 037 84,1 37 999
EC136 : Emalahleni 9 248 2 409 79,3 11 658
DC14: Joe Gqabi 47 365 9 166 83,8 56 531
EC141 : Elundini 14 959 4 230 78 19 190
EC142 : Senqu 19 338 3 621 84,2 22 959
EC145 : Walter Sisulu 13 068 1 314 90,9 14 382
DC15: O.R. Tambo 166 650 59 339 73,7 225 989
EC153 : Ngquza Hill 33 141 13 835 70,5 46 976
EC154 : Port St Johns 17 764 7 331 70,8 25 096
EC155 : Nyandeni 35 812 11 803 75,2 47 615
EC156 : Mhlontlo 20 018 5 176 79,5 25 194
EC157 : King Sabata Dalindyebo 59 914 21 194 73,9 81 109
DC44: Alfred Nzo 107 784 28 761 78,9 136 544
EC441 : Matatiele 29 109 5 780 83,4 34 889
EC442 : Umzimvubu 26 599 5 653 82,5 32 252
EC443 : Mbizana 36 850 11 781 75,8 48 630
EC444 : Ntabankulu 15 226 5 547 73,3 20 773
BUF: Buffalo City 104 376 31 715 76,7 136 091
NMA: Nelson Mandela Bay 133 975 45 562 74,6 179 537
Eastern Cape 812 406 245 911 76,8 1 058 317

STATISTICS SOUTH AFRICA 106 Report number 03-01-08
Provincial profile: Eastern Cape [Community Survey 2016], Report 03-01-08
Table 12: Number of households and average household size by district municipality, Census 2011
and CS 2016
Municipality
Census 2011 CS 2016
Household size Average
household size Household size
Average household size
DC10: Sarah Baartman 3,6 125 628 3,5 138 182
EC101 : Dr Beyers Naudé 4 19 922 4 20 748
EC102 : Blue Crane Route 3,7 9 761 3,7 9 876
EC104 : Makana 3,8 21 388 3,6 22 700
EC105 : Ndlambe 3,2 19 330 3 20 818
EC106 : Sundays River Valley 3,7 14 749 3,5 17 221
EC108 : Kouga 3,3 29 447 3,2 35 236
EC109 : Kou-Kamma 3,7 11 032 3,8 11 583
DC12: Amathole 3,8 227 821 4,1 213 763
EC121 : Mbhashe 4,2 61 924 4,7 58 727
EC122 : Mnquma 3,6 67 931 3,9 63 514
EC123 : Great Kei 3,8 8 073 3,6 8 774
EC124 : Amahlathi 3,6 28 357 4,1 24 577
EC126 : Ngqushwa 3,4 19 471 3,7 17 149
EC129 : Raymond Mhlaba 3,6 42 065 3,9 41 022
DC13: Chris Hani 3,8 213 842 4,3 194 291
EC131 : Inxuba Yethemba 3,6 18 463 3,9 18 282
EC135 : Intsika Yethu 3,6 41 979 4,2 35 851
EC137 : Engcobo 4,2 37 214 4,9 33 156
EC138 : Sakhisizwe 3,9 15 827 4,3 14 848
EC139 : Enoch Mgijima 3,7 68 354 4,1 65 146
EC136 : Emalahleni 3,8 32 005 4,6 27 008
DC14: Joe Gqabi 3,6 97 470 3,9 95 107
EC141 : Elundini 3,6 37 550 4 35 804
EC142 : Senqu 3,5 38 046 4 35 597
EC145 : Walter Sisulu 3,5 21 874 3,7 23 706
DC15: O.R. Tambo 4,6 298 531 4,6 314 080
EC153 : Ngquza Hill 5 56 212 5 60 974
EC154 : Port St Johns 4,9 31 713 4,9 33 951
EC155 : Nyandeni 4,7 61 647 5 61 867
EC156 : Mhlontlo 4,3 44 080 4,6 41 395
EC157 : King Sabata Dalindyebo 4,3 104 878 4,2 115 894
DC44: Alfred Nzo 4,7 169 258 4,4 195 975
EC441 : Matatiele 4,1 49 527 3,9 56 868
EC442 : Umzimvubu 4,1 46 931 3,9 51 530
EC443 : Mbizana 5,8 48 446 5,2 61 383
EC444 : Ntabankulu 5,1 24 355 4,9 26 195
BUF: Buffalo City 3,4 230 515 3,3 253 477
NMA: Nelson Mandela Bay 3,6 324 279 3,4 368 520
Eastern Cape 3,9 1 687 343 3,9 1 773 395

STATISTICS SOUTH AFRICA 107 Report number 03-01-08
Provincial profile: Eastern Cape [Community Survey 2016], Report 03-01-08
Table 13: Distribution of households by the number of household members and municipality
Municipality 1 2 3 4 5 6 7 8 9 10+ Total
DC10: Sarah Baartman 35 691 32 493 21 867 19 887 12 717 7 363 3 518 2 084 1 163 1 401 138 182
EC101 : Dr Beyers Naudé 5 285 4 863 3 352 2 878 1 527 1 528 500 402 113 299 20 748
EC102 : Blue Crane Route 2 182 2 152 1 728 1 566 1 100 374 376 126 133 140 9 876
EC104 : Makana 6 454 4 668 3 330 3 490 2 156 1 072 601 321 259 349 22 700
EC105 : Ndlambe 5 672 4 976 3 171 2 547 2 009 1 307 505 319 120 193 20 818
EC106 : Sundays River Valley 3 846 4 086 2 862 2 613 1 783 837 495 275 234 190 17 221
EC108 : Kouga 8 315 9 219 5 561 5 278 3 283 1 844 795 516 226 197 35 236
EC109 : Kou-Kamma 3 936 2 529 1 861 1 516 859 400 247 125 78 33 11 583
DC12: Amathole 70 564 38 307 32 085 25 733 18 139 11 616 7 264 4 079 2 587 3 389 213 763
EC121 : Mbhashe 16 028 9 102 8 428 7 317 6 018 4 216 2 885 1 851 1 191 1 691 58 727
EC122 : Mnquma 22 019 12 514 9 892 7 109 4 843 3 029 1 766 946 597 798 63 514
EC123 : Great Kei 2 472 1 871 1 341 1 463 648 483 227 149 52 68 8 774
EC124 : Amahlathi 8 039 4 398 3 678 3 050 2 188 1 322 775 473 312 341 24 577
EC126 : Ngqushwa 5 978 3 285 2 675 2 180 1 199 695 611 231 148 147 17 149
EC129 : Raymond Mhlaba 16 026 7 137 6 071 4 613 3 242 1 870 1 000 430 287 344 41 022
DC13: Chris Hani 61 228 36 935 30 588 23 350 17 026 10 111 6 432 3 572 2 070 2 979 194 291
EC131 : Inxuba Yethemba 4 595 3 707 2 982 2 581 1 998 986 602 414 140 277 18 282
EC135 : Intsika Yethu 12 801 6 804 6 032 3 755 2 696 1 763 926 460 229 385 35 851
EC137 : Engcobo 10 872 6 463 5 077 3 865 2 730 1 537 1 208 514 394 496 33 156
EC138 : Sakhisizwe 4 756 2 708 2 431 1 728 1 148 719 571 309 256 222 14 848
EC139 : Enoch Mgijima 19 185 12 285 10 277 8 394 6 034 3 408 2 300 1 337 728 1 199 65 146
EC136 : Emalahleni 9 019 4 969 3 789 3 027 2 420 1 698 824 539 323 399 27 008
DC14: Joe Gqabi 31 175 18 136 14 238 12 253 8 221 4 890 2 845 1 375 848 1 125 95 107
EC141 : Elundini 11 401 6 366 5 113 4 524 3 755 2 172 1 155 586 336 396 35 804
EC142 : Senqu 12 466 6 828 5 558 4 332 2 593 1 672 943 521 304 380 35 597
EC145 : Walter Sisulu 7 308 4 942 3 567 3 397 1 873 1 046 748 269 208 349 23 706

STATISTICS SOUTH AFRICA 108 Report number 03-01-08
Provincial profile: Eastern Cape [Community Survey 2016], Report 03-01-08
Municipality 1 2 3 4 5 6 7 8 9 10+ Total
DC15: O.R. Tambo 88 196 50 669 43 887 40 276 30 978 20 963 14 703 9 493 5 690 9 225 314 080
EC153 : Ngquza Hill 16 614 8 049 8 166 7 689 6 543 4 507 3 280 2 241 1 379 2 507 60 974
EC154 : Port St Johns 9 056 5 666 4 955 4 052 3 153 2 227 1 668 1 144 779 1 251 33 951
EC155 : Nyandeni 14 532 9 312 8 735 8 714 6 765 4 936 3 508 2 222 1 264 1 878 61 867
EC156 : Mhlontlo 12 320 7 031 5 591 5 137 4 014 2 712 1 760 1 133 698 997 41 395
EC157 : King Sabata Dalindyebo 35 674 20 611 16 440 14 683 10 503 6 582 4 487 2 752 1 569 2 592 115 894
DC44: Alfred Nzo 48 847 30 464 28 603 25 828 20 572 14 529 10 209 6 463 3 865 6 595 195 975
EC441 : Matatiele 16 824 10 020 8 738 7 313 5 525 3 444 2 046 1 290 680 988 56 868
EC442 : Umzimvubu 14 827 8 800 8 059 6 796 5 048 3 282 2 051 1 028 714 925 51 530
EC443 : Mbizana 11 793 7 618 7 936 8 382 6 881 5 671 4 465 3 090 1 786 3 760 61 383
EC444 : Ntabankulu 5 402 4 025 3 870 3 337 3 118 2 132 1 648 1 055 685 922 26 195
BUF: Buffalo City 70 118 53 019 42 403 36 311 24 157 11 746 7 217 3 520 2 298 2 687 253 477
NMA: Nelson Mandela Bay 73 571 86 254 65 281 63 329 37 637 20 047 10 803 5 388 2 776 3 435 368 520
Eastern Cape 479 389 346 276 278 952 246 967 169 446 101 265 62 991 35 974 21 298 30 836 1 773 395

STATISTICS SOUTH AFRICA 109 Report number 03-01-08
Provincial profile: Eastern Cape [Community Survey 2016], Report 03-01-08
Table 14: Distribution of households by sex of household head and district municipality, Census 2011 and CS 2016
District/local municipality Census 2011 CS 2016
Male Female Total Male Female Total
Sarah Baartman 77 315 48 313 125 628 82 928 55 255 138 182
EC101 : Dr Beyers Naudé 12 203 7 719 19 922 12 403 8 345 20 748
EC102 : Blue Crane Route 5 927 3 834 9 761 5 796 4 080 9 876
EC104 : Makana 11 877 9 511 21 388 12 429 10 272 22 700
EC105 : Ndlambe 11 102 8 227 19 329 11 501 9 317 20 818
EC106 : Sundays River Valley 9 597 5 152 14 749 11 234 5 987 17 221
EC108 : Kouga 19 018 10 429 29 447 21 910 13 326 35 236
EC109 : Kou-Kamma 7 590 3 442 11 032 7 654 3 929 11 583
Amathole 107 007 120 814 227 821 102 176 111 586 213 763
EC121 : Mbhashe 25 811 36 112 61 923 25 168 33 559 58 727
EC122 : Mnquma 30 903 37 028 67 931 29 535 33 979 63 514
EC123 : Great Kei 4 475 3 597 8 072 4 829 3 945 8 774
EC124 : Amahlathi 14 746 13 612 28 358 12 979 11 597 24 577
EC126 : Ngqushwa 9 544 9 927 19 471 8 282 8 867 17 149
EC129 : Raymond Mhlaba 21 528 20 536 42 064 21 383 19 639 41 022
Chris Hani 103 396 110 445 213 841 94 257 100 034 194 291
EC131 : Inxuba Yethemba 10 917 7 546 18 463 10 545 7 737 18 282
EC135 : Intsika Yethu 19 082 22 897 41 979 16 543 19 308 35 851
EC137 : Engcobo 15 747 21 466 37 213 13 278 19 878 33 156
EC138 : Sakhisizwe 7 603 8 223 15 826 7 476 7 371 14 848
EC139 : Enoch Mgijima 35 243 33 112 68 355 33 770 31 377 65 146
EC136 : Emalahleni 14 804 17 201 32 005 12 645 14 363 27 008
Joe Gqabi 49 445 48 025 97 470 50 530 44 577 95 107
EC141 : Elundini 18 006 19 544 37 550 18 487 17 317 35 804
EC142 : Senqu 18 834 19 212 38 046 18 379 17 218 35 597
EC145 : Walter Sisulu 12 605 9 269 21 874 13 664 10 042 23 706
O.R. Tambo 125 624 172 906 298 530 134 585 179 495 314 080
EC153 : Ngquza Hill 22 977 33 234 56 211 25 486 35 487 60 974

STATISTICS SOUTH AFRICA 110 Report number 03-01-08
Provincial profile: Eastern Cape [Community Survey 2016], Report 03-01-08
District/local municipality Census 2011 CS 2016
Male Female Total Male Female Total
EC154 : Port St Johns 12 649 19 064 31 713 13 806 20 146 33 951
EC155 : Nyandeni 26 149 35 499 61 648 26 470 35 397 61 867
EC156 : Mhlontlo 19 018 25 062 44 080 17 760 23 635 41 395
EC157 : King Sabata Dalindyebo 44 830 60 047 104 877 51 064 64 830 115 894
Alfred Nzo 69 732 99 523 169 255 84 266 111 709 195 975
EC441 : Matatiele 22 147 27 378 49 525 26 809 30 059 56 868
EC442 : Umzimvubu 19 395 27 535 46 930 22 548 28 982 51 530
EC443 : Mbizana 18 553 29 893 48 446 24 428 36 955 61 383
EC444 : Ntabankulu 9 636 14 718 24 354 10 482 15 713 26 195
Buffalo City 124 703 105 812 230 515 138 592 114 885 253 477
Nelson Mandela Bay 192 530 131 749 324 279 215 363 153 157 368 520
Eastern Cape 849 752 837 586 1 687 338 902 698 870 697 1 773 395

STATISTICS SOUTH AFRICA 111 Report number 03-01-08
Provincial profile: Eastern Cape [Community Survey 2016], Report 03-01-08
Table 15: Distribution of households by age group of household head and municipality, CS 2016
10-14 15 - 19 20 - 24 25 - 29 30 - 34 35 - 39 40 - 44 45 - 49 50 - 54 55 - 59 60 - 64 65+
DC10: Sarah Baartman 19 1 955 6 160 11 760 18 590 14 496 14 625 15 197 11 344 11 262 10 809 21 964
EC101 : Dr Beyers Naudé 19 524 797 1 642 2 126 2 162 2 310 2 160 1 936 1 702 1 885 3 485
EC102 : Blue Crane Route 0 186 332 780 915 993 1 064 911 863 1 028 996 1 806
EC104 : Makana 0 195 1 461 2 186 2 508 2 106 2 144 2 550 2 017 2 030 1 929 3 575
EC105 : Ndlambe 0 179 610 1 314 2 400 2 037 2 303 2 068 1 773 2 140 1 593 4 401
EC106 : Sundays River Valley 0 95 731 1 510 3 012 2 178 1 887 2 037 1 258 1 317 1 305 1 890
EC108 : Kouga 0 686 1 552 3 260 5 713 3 560 3 476 4 228 2 572 2 286 2 201 5 701
EC109 : Kou-Kamma 0 90 677 1 067 1 917 1 460 1 441 1 243 925 758 900 1 106
DC12: Amathole 456 8 174 16 342 22 385 24 176 14 595 17 445 19 105 15 403 17 817 15 763 42 100
EC121 : Mbhashe 93 3 061 4 778 6 393 6 643 3 972 4 596 5 017 3 977 4 602 3 825 11 768
EC122 : Mnquma 249 3 054 5 450 7 442 6 674 4 122 4 658 5 074 4 236 5 336 4 891 12 329
EC123 : Great Kei 0 184 593 1 059 1 155 831 686 994 536 634 559 1 544
EC124 : Amahlathi 61 540 1 509 2 023 3 001 1 758 2 183 2 490 2 212 2 342 1 892 4 564
EC126 : Ngqushwa 21 504 958 997 1 572 1 059 1 510 1 506 1 402 1 725 1 429 4 464
EC129 : Raymond Mhlaba 32 832 3 054 4 470 5 131 2 853 3 812 4 024 3 041 3 178 3 168 7 429
DC13: Chris Hani 576 6 607 13 622 18 780 22 333 14 152 15 728 17 436 13 545 15 200 15 226 41 083
EC131 : Inxuba Yethemba 21 285 1 229 2 528 2 933 1 760 1 550 1 985 1 343 1 124 1 139 2 384
EC135 : Intsika Yethu 70 1 278 1 959 2 699 3 358 2 054 2 551 3 042 2 550 3 098 3 437 9 756
EC137 : Engcobo 346 1 710 2 740 2 886 3 321 2 236 2 981 2 798 2 015 2 627 2 319 7 176
EC138 : Sakhisizwe 35 761 1 614 1 278 1 491 1 239 1 221 1 118 1 194 1 173 1 019 2 706
EC139 : Enoch Mgijima 80 1 845 4 465 7 380 9 035 5 172 5 690 6 225 4 550 4 823 4 620 11 263
EC136 : Emalahleni 24 727 1 616 2 010 2 196 1 692 1 735 2 269 1 893 2 355 2 692 7 801
DC14: Joe Gqabi 145 4 042 7 908 10 764 14 101 8 864 7 876 7 605 5 875 6 118 5 935 15 874
EC141 : Elundini 61 1 617 3 098 3 662 4 311 2 957 2 945 2 776 2 229 2 574 2 489 7 084
EC142 : Senqu 38 1 887 2 925 4 210 4 711 3 359 2 756 2 624 2 242 2 329 2 283 6 230
EC145 : Walter Sisulu 46 538 1 884 2 893 5 079 2 548 2 175 2 205 1 403 1 215 1 163 2 558
DC15: O.R. Tambo 837 14 313 28 852 34 192 38 624 27 048 27 371 28 452 20 413 21 875 17 899 54 203
EC153 : Ngquza Hill 270 2 619 5 822 6 510 8 171 5 730 4 872 5 164 3 787 4 062 2 996 10 968
EC154 : Port St Johns 83 1 626 3 563 3 289 3 518 2 974 2 728 2 788 2 384 2 159 2 102 6 738
EC155 : Nyandeni 126 2 730 5 143 5 801 7 384 4 972 5 717 6 324 3 747 4 343 4 231 11 349

STATISTICS SOUTH AFRICA 112 Report number 03-01-08
Provincial profile: Eastern Cape [Community Survey 2016], Report 03-01-08
10-14 15 - 19 20 - 24 25 - 29 30 - 34 35 - 39 40 - 44 45 - 49 50 - 54 55 - 59 60 - 64 65+
EC156 : Mhlontlo 30 1 863 3 078 3 194 3 692 3 085 3 236 3 644 3 018 3 773 2 946 9 836
EC157 : King Sabata Dalindyebo 327 5 475 11 246 15 397 15 858 10 288 10 818 10 532 7 477 7 539 5 625 15 310
DC44: Alfred Nzo 588 9 613 16 803 20 540 22 610 14 271 15 593 15 236 12 363 13 154 12 891 42 315
EC441 : Matatiele 208 3 064 4 944 6 182 6 514 4 223 4 179 4 028 3 285 3 898 4 233 12 110
EC442 : Umzimvubu 93 2 067 4 329 6 117 6 416 3 486 3 912 4 083 3 316 3 176 3 567 10 968
EC443 : Mbizana 220 3 268 5 301 5 907 7 058 4 407 5 519 5 143 3 887 4 479 3 259 12 935
EC444 : Ntabankulu 67 1 214 2 229 2 334 2 622 2 156 1 983 1 982 1 876 1 600 1 831 6 301
BUF: Buffalo City 96 3 155 11 671 23 974 32 023 28 502 28 331 30 742 24 654 24 155 18 633 27 540
NMA: Nelson Mandela Bay 83 2 529 14 471 24 372 38 824 38 804 44 210 44 600 37 193 36 743 31 703 54 985
Eastern Cape 2 799 50 389 115 829 166 767 211 283 160 732 171 179 178 373 140 789 146 325 128 860 300 067

STATISTICS SOUTH AFRICA 113 Report number 03-01-08
Provincial profile: Eastern Cape [Community Survey 2016], Report 03-01-08
Table 16: Distribution of households by type of main dwelling and districts, CS 2016
Formal dwelling Traditional dwelling
Informal dwelling Other
Total Number % Number % Number % Number %
DC10: Sarah Baartman 120 331 87,1 3 339 2,4 12 967 9,4 1 546 1,1 138 182
EC101 : Dr Beyers Naudé 19 831 95,6 144 0,7 739 3,6 34 0,2 20 748
EC102 : Blue Crane Route 9 570 96,9 - - 306 3,1 - - 9 876
EC104 : Makana 20 589 90,7 1 046 4,6 934 4,1 132 0,6 22 701
EC105 : Ndlambe 18 589 89,3 857 4,1 1 315 6,3 58 0,3 20 818
EC106 : Sundays River Valley 14 493 84,2 313 1,8 2 289 13,3 126 0,7 17 221
EC108 : Kouga 26 444 75 731 2,1 6 868 19,5 1 194 3,4 35 236
EC109 : Kou-Kamma 10 816 93,4 248 2,1 516 4,5 4 0 11 583
DC12: Amathole 119 571 55,9 82 013 38,4 11 332 5,3 818 0,4 213 734
EC121 : Mbhashe 24 135 41,1 33 036 56,3 1 427 2,4 100 0,2 58 698
EC122 : Mnquma 33 467 52,7 25 585 40,3 4 187 6,6 274 0,4 63 514
EC123 : Great Kei 5 841 66,6 822 9,4 2 059 23,5 52 0,6 8 775
EC124 : Amahlathi 13 046 53,1 10 024 40,8 1 325 5,4 181 0,7 24 577
EC126 : Ngqushwa 12 504 72,9 3 859 22,5 721 4,2 66 0,4 17 149
EC129 : Raymond Mhlaba 30 578 74,5 8 686 21,2 1 613 3,9 145 0,4 41 022
DC13: Chris Hani 109 460 56,3 75 660 38,9 5 564 2,9 3 587 1,8 194 271
EC131 : Inxuba Yethemba 17 987 98,4 28 0,2 161 0,9 107 0,6 18 282
EC135 : Intsika Yethu 9 831 27,4 25 114 70,1 149 0,4 757 2,1 35 851
EC137 : Engcobo 5 453 16,5 26 353 79,5 346 1 984 3 33 136
EC138 : Sakhisizwe 10 041 67,6 4 543 30,6 218 1,5 46 0,3 14 848
EC139 : Enoch Mgijima 55 851 85,7 4 980 7,6 3 982 6,1 334 0,5 65 146
EC136 : Emalahleni 10 297 38,1 14 642 54,2 710 2,6 1 359 5 27 008
DC14: Joe Gqabi 66 225 69,6 24 367 25,6 4 116 4,3 399 0,4 95 107
EC141 : Elundini 17 125 47,8 18 204 50,8 240 0,7 235 0,7 35 804
EC142 : Senqu 27 929 78,5 6 162 17,3 1 477 4,1 28 0,1 35 597
EC145 : Walter Sisulu 21 171 89,3 - - 2 400 10,1 135 0,6 23 706
DC15: O.R. Tambo 136 913 43,6 170 173 54,2 3 989 1,3 2 975 0,9 314 050
EC153 : Ngquza Hill 24 413 40 34 747 57 710 1,2 1 092 1,8 60 962
EC154 : Port St Johns 12 543 36,9 21 132 62,2 243 0,7 33 0,1 33 951
EC155 : Nyandeni 22 784 36,8 38 428 62,1 269 0,4 376 0,6 61 858
EC156 : Mhlontlo 17 185 41,5 22 648 54,7 1 209 2,9 344 0,8 41 386
EC157 : King Sabata Dalindyebo 59 987 51,8 53 218 45,9 1 558 1,3 1 131 1 115 894
DC44: Alfred Nzo 83 543 42,6 104 679 53,4 4 447 2,3 3 285 1,7 195 954
EC441 : Matatiele 26 902 47,3 25 820 45,4 1 814 3,2 2 332 4,1 56 868
EC442 : Umzimvubu 23 308 45,2 26 877 52,2 579 1,1 756 1,5 51 519
EC443 : Mbizana 24 880 40,5 34 537 56,3 1 860 3 95 0,2 61 372
EC444 : Ntabankulu 8 452 32,3 17 446 66,6 195 0,7 102 0,4 26 195
BUF: Buffalo City 177 913 70,2 10 600 4,2 62 980 24,9 1 944 0,8 253 437
NMA: Nelson Mandela Bay 340 887 92,5 868 0,2 25 490 6,9 1 274 0,3 368 520
Eastern Cape 1 154 843 65,1 471 699 26,6 130 885 7,4 15 828 0,9 1 773 255

STATISTICS SOUTH AFRICA 114 Report number 03-01-08
Provincial profile: Eastern Cape [Community Survey 2016], Report 03-01-08
Table 17: Distribution of households in RDP/government-subsidised dwellings by municipality, CS
2016
RDP/government-subsidised dwellings
Not RDP/government-subsidised dwellings
Total Number % Number %
DC10: Sarah Baartman 63 752 46,4 73 531 53,6 137 282
EC101 : Dr Beyers Naudé 6 742 32,9 13 755 67,1 20 497
EC102 : Blue Crane Route 6 317 64,5 3 477 35,5 9 794
EC104 : Makana 7 531 33,4 15 000 66,6 22 531
EC105 : Ndlambe 12 183 58,8 8 554 41,2 20 737
EC106 : Sundays River Valley 9 501 55,4 7 650 44,6 17 150
EC108 : Kouga 14 577 41,5 20 581 58,5 35 158
EC109 : Kou-Kamma 6 901 60,5 4 515 39,5 11 416
DC12: Amathole 24 450 11,6 187 136 88,4 211 586
EC121 : Mbhashe 2 163 3,7 56 437 96,3 58 601
EC122 : Mnquma 3 786 6,1 58 306 93,9 62 092
EC123 : Great Kei 1 901 21,7 6 858 78,3 8 759
EC124 : Amahlathi 4 367 17,9 20 072 82,1 24 439
EC126 : Ngqushwa 2 128 12,4 14 994 87,6 17 122
EC129 : Raymond Mhlaba 10 106 24,9 30 468 75,1 40 574
DC13: Chris Hani 41 184 21,4 151 529 78,6 192 713
EC131 : Inxuba Yethemba 10 334 58,2 7 425 41,8 17 758
EC135 : Intsika Yethu 549 1,5 35 121 98,5 35 670
EC137 : Engcobo 1 065 3,2 32 035 96,8 33 099
EC138 : Sakhisizwe 3 184 21,4 11 664 78,6 14 848
EC139 : Enoch Mgijima 23 402 36,4 40 971 63,6 64 373
EC136 : Emalahleni 2 651 9,8 24 314 90,2 26 964
DC14: Joe Gqabi 18 879 19,9 76 095 80,1 94 974
EC141 : Elundini 4 451 12,5 31 264 87,5 35 715
EC142 : Senqu 4 600 12,9 30 986 87,1 35 586
EC145 : Walter Sisulu 9 829 41,5 13 844 58,5 23 672
DC15: O.R. Tambo 19 730 6,3 293 594 93,7 313 324
EC153 : Ngquza Hill 3 577 5,9 57 314 94,1 60 891
EC154 : Port St Johns 2 718 8 31 199 92 33 917
EC155 : Nyandeni 3 224 5,2 58 426 94,8 61 650
EC156 : Mhlontlo 1 976 4,8 39 353 95,2 41 329
EC157 : King Sabata Dalindyebo 8 235 7,1 107 302 92,9 115 537
DC44: Alfred Nzo 12 978 6,6 182 650 93,4 195 628
EC441 : Matatiele 4 482 7,9 52 244 92,1 56 726
EC442 : Umzimvubu 2 411 4,7 49 003 95,3 51 414
EC443 : Mbizana 5 231 8,5 56 075 91,5 61 306
EC444 : Ntabankulu 854 3,3 25 327 96,7 26 181
BUF: Buffalo City 59 735 23,9 190 677 76,1 250 412
NMA: Nelson Mandela Bay 146 094 40,2 217 101 59,8 363 195
Eastern Cape 386 802 22 1 372 311 78 1 759 113

STATISTICS SOUTH AFRICA 115 Report number 03-01-08
Provincial profile: Eastern Cape [Community Survey 2016], Report 03-01-08
Table 18: Household rating of RDP/government-subsidised dwellings by municipality, CS 2016
Municipality Good Average Poor Total Good Average Poor
Number Percentage
DC10: Sarah Baartman 17 675 25 571 20 278 63 524 27,8 40,3 31,9
EC101 : Dr Beyers Naudé 1 409 3 666 1 667 6 742 20,9 54,4 24,7
EC102 : Blue Crane Route 2 289 2 745 1 272 6 307 36,3 43,5 20,2
EC104 : Makana 2 380 2 364 2 739 7 483 31,8 31,6 36,6
EC105 : Ndlambe 5 670 2 629 3 872 12 171 46,6 21,6 31,8
EC106 : Sundays River Valley 1 936 2 506 4 984 9 426 20,5 26,6 52,9
EC108 : Kouga 2 426 6 972 5 132 14 530 16,7 48 35,3
EC109 : Kou-Kamma 1 565 4 689 611 6 866 22,8 68,3 8,9
DC12: Amathole 4 803 7 487 12 060 24 350 19,7 30,7 49,5
EC121 : Mbhashe 443 954 759 2 156 20,5 44,2 35,2
EC122 : Mnquma 1 704 1 401 651 3 757 45,4 37,3 17,3
EC123 : Great Kei 182 246 1 473 1 901 9,6 12,9 77,5
EC124 : Amahlathi 516 1 056 2 756 4 328 11,9 24,4 63,7
EC126 : Ngqushwa 581 431 1 115 2 128 27,3 20,3 52,4
EC129 : Raymond Mhlaba 1 376 3 398 5 306 10 081 13,6 33,7 52,6
DC13: Chris Hani 14 691 13 254 13 000 40 945 35,9 32,4 31,7
EC131 : Inxuba Yethemba 3 881 4 823 1 578 10 282 37,7 46,9 15,3
EC135 : Intsika Yethu 364 92 65 521 69,9 17,7 12,5
EC137 : Engcobo 289 339 437 1 065 27,1 31,8 41
EC138 : Sakhisizwe 629 1 506 1 049 3 184 19,8 47,3 32,9
EC139 : Enoch Mgijima 8 567 5 990 8 703 23 260 36,8 25,8 37,4
EC136 : Emalahleni 961 504 1 168 2 633 36,5 19,1 44,4
DC14: Joe Gqabi 7 347 6 820 4 563 18 730 39,2 36,4 24,4
EC141 : Elundini 1 242 1 698 1 502 4 442 28 38,2 33,8
EC142 : Senqu 1 734 2 020 812 4 565 38 44,2 17,8
EC145 : Walter Sisulu 4 372 3 102 2 250 9 724 45 31,9 23,1
DC15: O.R. Tambo 7 555 5 237 6 789 19 581 38,6 26,7 34,7
EC153 : Ngquza Hill 1 140 561 1 847 3 548 32,1 15,8 52,1
EC154 : Port St Johns 960 1 192 566 2 718 35,3 43,9 20,8
EC155 : Nyandeni 1 447 1 059 696 3 202 45,2 33,1 21,7
EC156 : Mhlontlo 1 038 202 689 1 929 53,8 10,5 35,7
STATISTICS SOUTH AFRICA 116 Report number 03-01-08
Provincial profile: Eastern Cape [Community Survey 2016], Report 03-01-08
EC157 : King Sabata Dalindyebo 2 970 2 223 2 991 8 184 36,3 27,2 36,5
DC44: Alfred Nzo 7 092 2 788 3 045 12 925 54,9 21,6 23,6
EC441 : Matatiele 1 575 660 2 236 4 471 35,2 14,8 50
EC442 : Umzimvubu 1 070 1 157 172 2 399 44,6 48,2 7,2
EC443 : Mbizana 4 047 744 410 5 201 77,8 14,3 7,9
EC444 : Ntabankulu 400 227 227 854 46,8 26,6 26,6
BUF: Buffalo City 22 113 20 459 16 940 59 512 37,2 34,4 28,5
NMA: Nelson Mandela Bay 46 981 49 965 48 800 145 746 32,2 34,3 33,5
Eastern Cape 128 257 131 581 125 475 385 313 33,3 34,1 32,6

STATISTICS SOUTH AFRICA 117 Report number 03-01-08
Provincial profile: Eastern Cape [Community Survey 2016], Report 03-01-08
Table 19: Distribution of household by access to safe drinking water and municipality, CS 2016
Municipality
Access to safe drinking water
No access to safe drinking water Total
Number % Number %
DC10: Sarah Baartman 116 933 85,1 20 508 14,9 137 442
EC101 : Dr Beyers Naudé 16 921 81,7 3 789 18,3 20 710
EC102 : Blue Crane Route 8 729 88,6 1 119 11,4 9 847
EC104 : Makana 18 944 84 3 616 16 22 560
EC105 : Ndlambe 18 512 89 2 294 11 20 806
EC106 : Sundays River Valley 13 934 83,3 2 798 16,7 16 732
EC108 : Kouga 32 215 91,5 2 998 8,5 35 212
EC109 : Kou-Kamma 7 679 66,3 3 895 33,7 11 574
DC12: Amathole 157 833 74,9 52 980 25,1 210 813
EC121 : Mbhashe 31 143 53,8 26 714 46,2 57 857
EC122 : Mnquma 44 852 72,4 17 060 27,6 61 912
EC123 : Great Kei 7 316 83,5 1 447 16,5 8 762
EC124 : Amahlathi 21 836 89,6 2 534 10,4 24 370
EC126 : Ngqushwa 15 760 92,2 1 333 7,8 17 093
EC129 : Raymond Mhlaba 36 927 90,5 3 891 9,5 40 818
DC13: Chris Hani 146 063 76 46 017 24 192 080
EC131 : Inxuba Yethemba 16 541 90,7 1 689 9,3 18 229
EC135 : Intsika Yethu 22 285 63,2 12 989 36,8 35 275
EC137 : Engcobo 15 307 47,6 16 861 52,4 32 168
EC138 : Sakhisizwe 12 666 85,5 2 141 14,5 14 806
EC139 : Enoch Mgijima 56 899 88 7 766 12 64 666
EC136 : Emalahleni 22 365 83 4 571 17 26 936
DC14: Joe Gqabi 68 280 72,7 25 636 27,3 93 916
EC141 : Elundini 19 877 56,7 15 169 43,3 35 047
EC142 : Senqu 25 902 73,3 9 435 26,7 35 337
EC145 : Walter Sisulu 22 501 95,6 1 032 4,4 23 533
DC15: O.R. Tambo 133 977 42,9 178 015 57,1 311 991
EC153 : Ngquza Hill 12 355 20,4 48 318 79,6 60 673
EC154 : Port St Johns 8 782 26 25 009 74 33 791
EC155 : Nyandeni 24 677 40,2 36 748 59,8 61 424
EC156 : Mhlontlo 21 759 52,9 19 344 47,1 41 103
EC157 : King Sabata Dalindyebo 66 404 57,7 48 596 42,3 115 000
DC44: Alfred Nzo 92 190 47,6 101 485 52,4 193 675
EC441 : Matatiele 35 845 63,9 20 289 36,1 56 134
EC442 : Umzimvubu 27 895 55,6 22 298 44,4 50 193
EC443 : Mbizana 17 819 29,1 43 343 70,9 61 162
EC444 : Ntabankulu 10 630 40,6 15 556 59,4 26 186
BUF: Buffalo City 230 103 91,6 21 204 8,4 251 306
NMA: Nelson Mandela Bay 331 908 90,5 34 811 9,5 366 719
Eastern Cape 1 277 288 72,7 480 655 27,3 1 757 943

STATISTICS SOUTH AFRICA 118 Report number 03-01-08
Provincial profile: Eastern Cape [Community Survey 2016], Report 03-01-08
Table 20: Distribution of households by main source of water for drinking, CS 2016 (1)
Municipality Piped water inside the
dwelling/house Piped water inside
yard Piped water on
community stand Neighbour’s tap Public/communal tap
DC10: Sarah Baartman 66 453 49 592 8 920 927 1 794
EC101 : Dr Beyers Naudé 10 888 7 923 67 50 0
EC102 : Blue Crane Route 3 683 4 965 243 55 57
EC104 : Makana 10 245 10 061 625 54 446
EC105 : Ndlambe 6 899 10 374 808 28 611
EC106 : Sundays River Valley 5 321 7 283 893 538 320
EC108 : Kouga 20 395 7 679 6 195 143 344
EC109 : Kou-Kamma 9 022 1 307 89 59 17
DC12: Amathole 26 306 27 596 71 109 2 695 23 688
EC121 : Mbhashe 1 919 2 014 12 752 398 8 467
EC122 : Mnquma 9 423 3 103 20 717 1 045 7 596
EC123 : Great Kei 712 2 626 2 995 217 283
EC124 : Amahlathi 3 358 6 403 9 828 484 1 968
EC126 : Ngqushwa 1 241 3 783 10 009 293 730
EC129 : Raymond Mhlaba 9 652 9 667 14 808 258 4 645
DC13: Chris Hani 43 385 41 972 51 787 2 400 18 865
EC131 : Inxuba Yethemba 11 168 5 864 442 87 123
EC135 : Intsika Yethu 873 1 716 17 102 157 4 451
EC137 : Engcobo 1 556 1 641 10 612 139 1 892
EC138 : Sakhisizwe 2 187 5 176 3 590 454 2 253
EC139 : Enoch Mgijima 26 349 19 496 9 672 1 135 5 647
EC136 : Emalahleni 1 253 8 079 10 369 428 4 498

STATISTICS SOUTH AFRICA 119 Report number 03-01-08
Provincial profile: Eastern Cape [Community Survey 2016], Report 03-01-08
Municipality Piped water inside the
dwelling/house Piped water inside
yard Piped water on
community stand Neighbour’s tap Public/communal tap
DC14: Joe Gqabi 18 232 25 515 17 271 3 307 6 102
EC141 : Elundini 3 965 3 750 11 117 122 3 142
EC142 : Senqu 2 874 13 085 3 973 3 015 2 758
EC145 : Walter Sisulu 11 392 8 679 2 181 170 202
DC15: O.R. Tambo 20 181 39 053 43 381 4 082 15 379
EC153 : Ngquza Hill 590 1 982 3 879 987 3 738
EC154 : Port St Johns 611 1 848 1 808 207 1 889
EC155 : Nyandeni 278 2 486 12 444 65 2 786
EC156 : Mhlontlo 427 3 727 11 774 194 4 032
EC157 : King Sabata Dalindyebo 18 274 29 009 13 476 2 628 2 934
DC44: Alfred Nzo 5 645 25 508 42 174 3 191 13 369
EC441 : Matatiele 3 275 14 659 15 681 1 538 3 998
EC442 : Umzimvubu 1 713 7 065 13 505 1 258 3 927
EC443 : Mbizana 364 2 342 9 202 192 1 553
EC444 : Ntabankulu 293 1 441 3 786 202 3 890
BUF: Buffalo City 127 358 50 442 54 338 3 896 11 621
NMA: Nelson Mandela Bay 284 869 59 199 12 681 794 6 150
Eastern Cape 592 428 318 877 301 662 21 292 96 968
STATISTICS SOUTH AFRICA 120 Report number 03-01-08
Provincial profile: Eastern Cape [Community Survey 2016], Report 03-01-08
Table 21: Distribution of households by main source of water for drinking, CS 2016 (2)
Municipality Borehole Rain-water tank in
yard Water-carrier/tanker
Flowing water/stream/river -
Other Total
DC10: Sarah Baartman 1 897 5 178 959 2 460 138 182
EC101 : Dr Beyers Naudé 549 1 203 - 69 20 748
EC102 : Blue Crane Route 244 235 99 295 9 876
EC104 : Makana 89 562 32 587 22 700
EC105 : Ndlambe 173 1 531 67 327 20 818
EC106 : Sundays River Valley 456 1 069 578 762 17 221
EC108 : Kouga 25 212 184 61 35 236
EC109 : Kou-Kamma 362 367 - 359 11 583
DC12: Amathole 1 067 29 471 3 140 28 690 213 763
EC121 : Mbhashe 200 13 298 1 018 18 662 58 727
EC122 : Mnquma 109 12 277 1 334 7 909 63 514
EC123 : Great Kei 298 1 037 43 563 8 774
EC124 : Amahlathi 303 1 201 186 846 24 577
EC126 : Ngqushwa 26 839 156 73 17 149
EC129 : Raymond Mhlaba 132 819 403 638 41 022
DC13: Chris Hani 3 218 7 314 1 378 23 971 194 291
EC131 : Inxuba Yethemba 345 40 91 120 18 282
EC135 : Intsika Yethu 242 2 639 206 8 465 35 851
EC137 : Engcobo 344 4 056 408 12 508 33 156
EC138 : Sakhisizwe 141 146 166 736 14 848
EC139 : Enoch Mgijima 915 370 451 1 111 65 146
EC136 : Emalahleni 1 230 63 56 1 031 27 008
STATISTICS SOUTH AFRICA 121 Report number 03-01-08
Provincial profile: Eastern Cape [Community Survey 2016], Report 03-01-08
Municipality Borehole Rain-water tank in
yard Water-carrier/tanker
Flowing water/stream/river -
Other Total
DC14: Joe Gqabi 2 812 4 097 702 17 070 95 107
EC141 : Elundini 572 1 031 335 11 769 35 804
EC142 : Senqu 1 345 2 971 338 5 238 35 597
EC145 : Walter Sisulu 894 94 29 63 23 706
DC15: O.R. Tambo 2 309 32 396 3 844 153 456 314 080
EC153 : Ngquza Hill 655 3 211 481 45 451 60 974
EC154 : Port St Johns 529 3 316 438 23 305 33 951
EC155 : Nyandeni 536 11 306 811 31 154 61 867
EC156 : Mhlontlo 200 3 411 396 17 233 41 395
EC157 : King Sabata Dalindyebo 389 11 152 1 718 36 313 115 894
DC44: Alfred Nzo 2 330 10 727 2 262 90 770 195 975
EC441 : Matatiele 1 527 1 304 1 014 13 871 56 868
EC442 : Umzimvubu 44 5 316 782 17 919 51 530
EC443 : Mbizana 651 3 684 393 43 001 61 383
EC444 : Ntabankulu 108 423 72 15 980 26 195
BUF: Buffalo City 582 1 980 2 536 725 253 477
NMA: Nelson Mandela Bay 1 679 897 491 1 760 368 520
Eastern Cape 15 893 92 060 15 312 318 902 1 773 395

STATISTICS SOUTH AFRICA 122 Report number 03-01-08
Provincial profile: Eastern Cape [Community Survey 2016], Report 03-01-08
Table 22: Distribution of households by main source of drinking water supplier, CS 2016
Municipality A municipality Other water
scheme A water vendor Own service
Flowing water/stream/river/spring/rain water
Total
DC10: Sarah Baartman 120 072 1 318 1 121 9 095 6 046 137 652
EC101 : Dr Beyers Naudé 18 182 13 70 1 327 1 157 20 748
EC102 : Blue Crane Route 8 462 56 137 643 448 9 745
EC104 : Makana 21 154 62 67 1 035 282 22 600
EC105 : Ndlambe 16 683 110 185 1 409 2 430 20 818
EC106 : Sundays River Valley 13 023 574 517 2 443 505 17 061
EC108 : Kouga 33 477 89 145 908 508 35 127
EC109 : Kou-Kamma 9 091 415 - 1 330 716 11 552
DC12: Amathole 135 981 12 638 1 769 7 552 54 138 212 079
EC121 : Mbhashe 21 008 4 000 940 2 380 29 980 58 308
EC122 : Mnquma 36 561 5 366 174 1 551 19 482 63 136
EC123 : Great Kei 6 383 129 227 1 111 729 8 578
EC124 : Amahlathi 20 069 930 254 1 131 1 834 24 218
EC126 : Ngqushwa 14 148 2 049 42 393 465 17 097
EC129 : Raymond Mhlaba 37 813 164 132 986 1 648 40 742
DC13: Chris Hani 128 336 17 052 5 378 9 925 31 755 192 447
EC131 : Inxuba Yethemba 15 050 78 35 2 783 200 18 146
EC135 : Intsika Yethu 16 577 3 029 1 070 935 13 834 35 445
EC137 : Engcobo 11 225 3 340 2 258 1 134 14 431 32 388
EC138 : Sakhisizwe 10 868 2 379 55 828 616 14 746
EC139 : Enoch Mgijima 54 929 4 921 1 207 2 804 994 64 855
EC136 : Emalahleni 19 688 3 305 754 1 440 1 680 26 866
DC14: Joe Gqabi 51 036 14 116 809 6 537 22 079 94 576
EC141 : Elundini 18 493 2 796 438 1 252 12 529 35 508
EC142 : Senqu 10 775 11 232 270 3 612 9 518 35 407
EC145 : Walter Sisulu 21 767 88 101 1 673 32 23 662

STATISTICS SOUTH AFRICA 123 Report number 03-01-08
Provincial profile: Eastern Cape [Community Survey 2016], Report 03-01-08
Municipality A municipality Other water
scheme A water vendor Own service
Flowing water/stream/river/spring/rain water
Total
DC15: O.R. Tambo 100 365 18 227 5 029 9 632 178 732 311 985
EC153 : Ngquza Hill 8 565 2 209 1 104 1 299 47 745 60 922
EC154 : Port St Johns 5 532 888 268 945 26 082 33 715
EC155 : Nyandeni 13 834 4 377 324 2 561 40 534 61 629
EC156 : Mhlontlo 16 110 4 831 473 898 18 904 41 215
EC157 : King Sabata Dalindyebo 56 324 5 922 2 861 3 929 45 467 114 503
DC44: Alfred Nzo 64 902 19 135 2 534 7 670 100 320 194 561
EC441 : Matatiele 28 758 8 547 558 3 169 15 070 56 101
EC442 : Umzimvubu 15 430 8 136 1 391 2 288 23 862 51 107
EC443 : Mbizana 12 368 1 260 243 2 069 45 381 61 321
EC444 : Ntabankulu 8 347 1 192 342 144 16 007 26 032
BUF: Buffalo City 234 389 11 650 1 040 2 217 1 978 251 274
NMA: Nelson Mandela Bay 359 965 2 242 2 181 2 628 885 367 901
Eastern Cape 1 195 046 96 378 19 862 55 255 395 933 1 762 475

STATISTICS SOUTH AFRICA 124 Report number 03-01-08
Provincial profile: Eastern Cape [Community Survey 2016], Report 03-01-08
Table 23: Distribution of households by water interruptions in the last 3 months, CS 2016
No water interruption Water interruption Total
Number % Number % Number
DC10: Sarah Baartman 29 466 25,1 87 923 74,9 117 389
2012 EC101 : Dr Beyers Naudé 1 402 7,7 16 754 92,3 18 156
2013 EC102 : Blue Crane Route 662 8 7 624 92 8 286
2015 EC104 : Makana 5 203 24,9 15 682 75,1 20 885
2016 EC105 : Ndlambe 3 954 24,2 12 416 75,8 16 369
2017 EC106 : Sundays River Valley 6 651 51,4 6 276 48,6 12 927
2019 EC108 : Kouga 7 053 22,2 24 669 77,8 31 722
2020 EC109 : Kou-Kamma 4 543 50,2 4 502 49,8 9 045
DC12: Amathole 66 131 49,2 68 322 50,8 134 453
2021 EC121 : Mbhashe 10 817 52,5 9 791 47,5 20 608
2022 EC122 : Mnquma 14 639 40,4 21 578 59,6 36 217
2023 EC123 : Great Kei 4 303 67,9 2 036 32,1 6 339
2024 EC124 : Amahlathi 7 373 37,2 12 459 62,8 19 832
2025 EC126 : Ngqushwa 7 633 54,3 6 422 45,7 14 055
2044 EC129 : Raymond Mhlaba 21 365 57,1 16 037 42,9 37 402
DC13: Chris Hani 53 769 42,4 73 051 57,6 126 820
2026 EC131 : Inxuba Yethemba 4 982 34,3 9 532 65,7 14 514
2027 EC135 : Intsika Yethu 8 806 53,5 7 648 46,5 16 454
2028 EC137 : Engcobo 4 104 36,9 7 027 63,1 11 131
2029 EC138 : Sakhisizwe 3 432 31,9 7 335 68,1 10 766
2043 EC139 : Enoch Mgijima 24 562 45,2 29 756 54,8 54 318
2045 EC136 : Emalahleni 7 883 40,1 11 754 59,9 19 637
DC14: Joe Gqabi 16 820 33,3 33 746 66,7 50 566
2030 EC141 : Elundini 8 722 48,2 9 379 51,8 18 100
2031 EC142 : Senqu 4 855 45,1 5 920 54,9 10 775
2042 EC145 : Walter Sisulu 3 243 15 18 447 85 21 690
DC15: O.R. Tambo 53 093 53,5 46 235 46,5 99 329
2032 EC153 : Ngquza Hill 5 111 60,2 3 374 39,8 8 485
2033 EC154 : Port St Johns 2 307 42 3 192 58 5 499
2034 EC155 : Nyandeni 7 720 56,1 6 040 43,9 13 760
2035 EC156 : Mhlontlo 8 497 53,1 7 494 46,9 15 991
2036 EC157 : King Sabata Dalindyebo 29 458 53 26 136 47 55 594
DC44: Alfred Nzo 31 237 48,5 33 112 51,5 64 349
2037 EC441 : Matatiele 14 566 51 14 022 49 28 587
2038 EC442 : Umzimvubu 7 831 51 7 533 49 15 363
2039 EC443 : Mbizana 4 614 37,3 7 742 62,7 12 356
2040 EC444 : Ntabankulu 4 227 52,6 3 815 47,4 8 042
BUF: Buffalo City 70 406 30,3 162 002 69,7 232 407
NMA: Nelson Mandela Bay 43 608 12,2 313 633 87,8 357 240
Eastern Cape 364 529 30,8 818 023 69,2 1 182 552

STATISTICS SOUTH AFRICA 125 Report number 03-01-08
Provincial profile: Eastern Cape [Community Survey 2016], Report 03-01-08
Table 24: Distribution of households by location of toilet facility for municipality, CS 2016
In the dwelling/house In the yard Outside the yard
Total Number % Number % Number %
DC10: Sarah Baartman 72 656 54 55 168 41 6 295 4,7 134 118
2012 EC101 : Dr Beyers Naudé 11 572 57 8 456 41 456 2,2 20 483
2013 EC102 : Blue Crane Route 4 403 46 4 981 52 145 1,5 9 529
2015 EC104 : Makana 11 706 53 10 188 46 326 1,5 22 220
2016 EC105 : Ndlambe 9 469 47 10 010 50 512 2,6 19 991
2017 EC106 : Sundays River Valley 5 618 34 10 366 62 797 4,7 16 780
2019 EC108 : Kouga 20 285 60 9 866 29 3 747 11 33 898
2020 EC109 : Kou-Kamma 9 603 86 1 302 12 312 2,8 11 217
DC12: Amathole 29 260 16 153 657 82 3 705 2 186 622
2021 EC121 : Mbhashe 1 610 3,5 43 632 95 838 1,8 46 080
2022 EC122 : Mnquma 8 488 16 44 948 82 1 285 2,3 54 721
2023 EC123 : Great Kei 1 803 26 4 940 71 212 3 6 955
2024 EC124 : Amahlathi 3 753 16 18 973 82 376 1,6 23 102
2025 EC126 : Ngqushwa 1 541 9,2 15 079 90 128 0,8 16 749
2044 EC129 : Raymond Mhlaba 12 064 31 26 085 67 866 2,2 39 016
DC13: Chris Hani 49 744 29 114 802 67 6 268 3,7 170 813
2026 EC131 : Inxuba Yethemba 12 649 74 4 205 25 322 1,9 17 176
2027 EC135 : Intsika Yethu 871 3,1 25 887 93 1 217 4,4 27 975
2028 EC137 : Engcobo 1 118 4,2 24 014 91 1 247 4,7 26 379
2029 EC138 : Sakhisizwe 2 264 17 10 395 80 339 2,6 12 997
2043 EC139 : Enoch Mgijima 30 835 49 29 766 47 2 236 3,6 62 838
2045 EC136 : Emalahleni 2 006 8,6 20 535 88 907 3,9 23 448
DC14: Joe Gqabi 23 598 26 63 242 71 2 501 2,8 89 341
2030 EC141 : Elundini 5 389 16 27 583 83 245 0,7 33 217
2031 EC142 : Senqu 5 453 16 26 953 81 795 2,4 33 201
2042 EC145 : Walter Sisulu 12 756 56 8 707 38 1 462 6,4 22 924
DC15: O.R. Tambo 21 851 7,5 265 483 91 4 543 1,6 291 877
2032 EC153 : Ngquza Hill 1 421 2,4 56 099 96 1 056 1,8 58 575
2033 EC154 : Port St Johns 571 2,1 25 955 95 724 2,7 27 250
2034 EC155 : Nyandeni 959 1,6 58 304 98 224 0,4 59 486
2035 EC156 : Mhlontlo 351 0,9 37 594 97 758 2 38 703
2036 EC157 : King Sabata Dalindyebo 18 550 17 87 532 81 1 781 1,7 107 864
DC44: Alfred Nzo 9 685 5,2 173 146 94 1 819 1 184 649
2037 EC441 : Matatiele 5 076 9,6 47 645 90 320 0,6 53 042
2038 EC442 : Umzimvubu 2 622 5,4 45 319 94 245 0,5 48 186
2039 EC443 : Mbizana 1 803 3,1 55 315 96 763 1,3 57 881
2040 EC444 : Ntabankulu 183 0,7 24 866 97 491 1,9 25 540
BUF Buffalo City 127 158 52 79 100 32 39 215 16 245 473
NMA Nelson Mandela Bay 258 235 71 101 735 28 4 581 1,3 364 551
Eastern Cape 592 186 36 1 006 332 60 68 927 4,1 1 667 445

STATISTICS SOUTH AFRICA 126 Report number 03-01-08
Provincial profile: Eastern Cape [Community Survey 2016], Report 03-01-08
Table 25: Distribution of households by type of toilet facility and municipality, CS 2016
District/municipality
CS 2016 Census 2011
Male Female Total
Males Females Total
Number % Number % Number % Number %
DC10: Sarah Baartman 82 928 60,0 55 255 40,0 138 182 77 315 61,5 48 313 38,5 125 628
EC101 : Dr Beyers Naudé 12 403 59,8 8 345 40,2 20 748 12 203 61,3 7 719 38,7 19 922
EC102 : Blue Crane Route 5 796 58,7 4 080 41,3 9 876 5 927 60,7 3 834 39,3 9 761
EC104 : Makana 12 429 54,8 10 272 45,2 22 700 11 877 55,5 9 511 44,5 21 388
EC105 : Ndlambe 11 501 55,2 9 317 44,8 20 818 11 102 57,4 8 227 42,6 19 330
EC106 : Sundays River Valley 11 234 65,2 5 987 34,8 17 221 9 597 65,1 5 152 34,9 14 749
EC108 : Kouga 21 910 62,2 13 326 37,8 35 236 19 018 64,6 10 429 35,4 29 447
EC109 : Kou-Kamma 7 654 66,1 3 929 33,9 11 583 7 590 68,8 3 442 31,2 11 032
DC12: Amathole 102 176 47,8 111 586 52,2 213 763 107 007 47,0 120 814 53,0 227 821
EC121 : Mbhashe 25 168 42,9 33 559 57,1 58 727 25 811 41,7 36 112 58,3 61 924
EC122 : Mnquma 29 535 46,5 33 979 53,5 63 514 30 903 45,5 37 028 54,5 67 931
EC123 : Great Kei 4 829 55,0 3 945 45,0 8 774 4 475 55,4 3 597 44,6 8 073
EC124 : Amahlathi 12 979 52,8 11 597 47,2 24 577 14 746 52,0 13 612 48,0 28 357
EC126 : Ngqushwa 8 282 48,3 8 867 51,7 17 149 9 544 49,0 9 927 51,0 19 471
EC129 : Raymond Mhlaba 21 383 52,1 19 639 47,9 41 022 21 528 51,2 20 536 48,8 42 065
DC13: Chris Hani 94 257 48,5 100 034 51,5 194 291 103 396 48,4 110 445 51,6 213 842
EC131 : Inxuba Yethemba 10 545 57,7 7 737 42,3 18 282 10 917 59,1 7 546 40,9 18 463
EC135 : Intsika Yethu 16 543 46,1 19 308 53,9 35 851 19 082 45,5 22 897 54,5 41 979
EC137 : Engcobo 13 278 40,0 19 878 60,0 33 156 15 747 42,3 21 466 57,7 37 214
EC138 : Sakhisizwe 7 476 50,4 7 371 49,6 14 848 7 603 48,0 8 223 52,0 15 827
EC139 : Enoch Mgijima 33 770 51,8 31 377 48,2 65 146 35 243 51,6 33 112 48,4 68 354
EC136 : Emalahleni 12 645 46,8 14 363 53,2 27 008 14 804 46,3 17 201 53,7 32 005
DC14: Joe Gqabi 50 530 53,1 44 577 46,9 95 107 49 445 50,7 48 025 49,3 97 470
EC141 : Elundini 18 487 51,6 17 317 48,4 35 804 18 006 48,0 19 544 52,0 37 550
EC142 : Senqu 18 379 51,6 17 218 48,4 35 597 18 834 49,5 19 212 50,5 38 046
EC145 : Walter Sisulu 13 664 57,6 10 042 42,4 23 706 12 605 57,6 9 269 42,4 21 874
DC15: O.R. Tambo 134 585 42,9 179 495 57,1 314 080 125 624 42,1 172 906 57,9 298 531
EC153 : Ngquza Hill 25 486 41,8 35 487 58,2 60 974 22 977 40,9 33 234 59,1 56 212
EC154 : Port St Johns 13 806 40,7 20 146 59,3 33 951 12 649 39,9 19 064 60,1 31 713

STATISTICS SOUTH AFRICA 127 Report number 03-01-08
Provincial profile: Eastern Cape [Community Survey 2016], Report 03-01-08
EC155 : Nyandeni 26 470 42,8 35 397 57,2 61 867 26 149 42,4 35 499 57,6 61 647
EC156 : Mhlontlo 17 760 42,9 23 635 57,1 41 395 19 018 43,1 25 062 56,9 44 080
EC157 : King Sabata Dalindyebo 51 064 44,1 64 830 55,9 115 894 44 830 42,7 60 047 57,3 104 878
DC44: Alfred Nzo 84 266 43,0 111 709 57,0 195 975 69 732 41,2 99 523 58,8 169 258
EC441 : Matatiele 26 809 47,1 30 059 52,9 56 868 22 147 44,7 27 378 55,3 49 527
EC442 : Umzimvubu 22 548 43,8 28 982 56,2 51 530 19 395 41,3 27 535 58,7 46 931
EC443 : Mbizana 24 428 39,8 36 955 60,2 61 383 18 553 38,3 29 893 61,7 48 446
EC444 : Ntabankulu 10 482 40,0 15 713 60,0 26 195 9 636 39,6 14 718 60,4 24 355
BUF: Buffalo City 138 592 54,7 114 885 45,3 253 477 124 703 54,1 105 812 45,9 230 515
NMA: Nelson Mandela Bay 215 363 58,4 153 157 41,6 368 520 192 530 59,4 131 749 40,6 324 279
Eastern Cape 902 698 50,9 870 697 49,1 1 773 395 849 752 50,4 837 586 49,6 1 687 343

STATISTICS SOUTH AFRICA 128 Report number 03-01-08
Provincial profile: Eastern Cape [Community Survey 2016], Report 03-01-08
Table 26: Distribution of households by main type of electric energy source, CS 2016
District/local municipality/province In-house
conventional meter
In-house pre-paid
meter
Connected to other source which
household pays for
Connected to other source which
household is not
paying for
Solar home system
Generator/ battery
Other No access
to electricity Total
DC10: Sarah Baartman 19 811 102 986 2 673 1 324 240 306 499 10 344 138 182
2012 EC101 : Dr Beyers Naudé 4 907 14 068 505 388 128 115 72 566 20 748
2013 EC102 : Blue Crane Route 389 8 463 144 109 - - 32 738 9 876
2015 EC104 : Makana 3 636 18 265 160 29 28 14 44 525 22 700
2016 EC105 : Ndlambe 4 176 14 600 99 43 - 72 92 1 737 20 818
2017 EC106 : Sundays River Valley 739 13 837 357 588 31 9 12 1 648 17 221
2019 EC108 : Kouga 4 810 24 145 1 164 132 - 96 247 4 643 35 236
2020 EC109 : Kou-Kamma 1 156 9 608 244 35 53 - - 487 11 583
DC12: Amathole 10 846 167 607 590 195 3 187 131 332 30 874 213 763
2021 EC121 : Mbhashe 1 195 38 969 142 49 3 104 88 72 15 108 58 727
2022 EC122 : Mnquma 3 872 48 462 129 58 18 5 58 10 911 63 514
2023 EC123 : Great Kei 1 342 5 240 50 52 36 17 34 2 004 8 774
2024 EC124 : Amahlathi 926 22 096 63 24 28 1 9 1 429 24 577
2025 EC126 : Ngqushwa 252 16 327 54 5 - - 30 481 17 149
2044 EC129 : Raymond Mhlaba 3 260 36 513 151 8 - 21 129 940 41 022
DC13: Chris Hani 14 989 161 059 2 146 1 042 1 612 95 578 12 769 194 291
2026 EC131 : Inxuba Yethemba 1 900 14 755 920 115 71 11 40 470 18 282
2027 EC135 : Intsika Yethu 520 30 923 188 417 6 17 70 3 710 35 851
2028 EC137 : Engcobo 3 785 24 097 582 337 1 302 - 99 2 954 33 156
2029 EC138 : Sakhisizwe 340 13 777 19 14 32 9 24 632 14 848
2043 EC139 : Enoch Mgijima 7 484 52 698 396 138 201 54 307 3 867 65 146
2045 EC136 : Emalahleni 959 24 810 41 21 - 3 38 1 136 27 008

STATISTICS SOUTH AFRICA 129 Report number 03-01-08
Provincial profile: Eastern Cape [Community Survey 2016], Report 03-01-08
District/local municipality/province In-house
conventional meter
In-house pre-paid
meter
Connected to other source which
household pays for
Connected to other source which
household is not
paying for
Solar home system
Generator/ battery
Other No access
to electricity
Total
DC15: O.R. Tambo 17 585 245 129 2 957 6 043 241 458 1 334 40 334 314 080
2032 EC153 : Ngquza Hill 3 047 48 071 1 116 824 121 77 119 7 599 60 974
2033 EC154 : Port St Johns 645 26 865 79 997 25 28 33 5 278 33 951
2034 EC155 : Nyandeni 3 135 48 363 655 1 299 14 52 218 8 130 61 867
2035 EC156 : Mhlontlo 1 813 34 753 22 - 4 1 226 4 576 41 395
2036 EC157 : King Sabata Dalindyebo 8 945 87 077 1 084 2 922 77 300 739 14 750 115 894
DC44: Alfred Nzo 11 560 114 234 1 178 353 12 886 365 628 54 771 195 975
2037 EC441 : Matatiele 6 821 26 564 497 95 5 067 168 202 17 454 56 868
2038 EC442 : Umzimvubu 3 004 30 760 244 222 2 249 36 43 14 971 51 530
2039 EC443 : Mbizana 1 310 43 779 205 28 4 375 99 127 11 460 61 383
2040 EC444 : Ntabankulu 424 13 131 232 9 1 196 61 256 10 885 26 195
BUF: Buffalo City 22 274 183 565 3 865 9 608 73 248 2 679 31 165 253 477
NMA: Nelson Mandela Bay 45 858 300 952 4 029 2 865 174 46 3 441 11 155 368 520
Eastern Cape 148 460 1 347 162 18 703 21 505 19 031 1 747 10 331 206 456 1 773 395

STATISTICS SOUTH AFRICA 130 Report number 03-01-08
Provincial profile: Eastern Cape [Community Survey 2016], Report 03-01-08
Table 27: Distribution of households by supplier of electricity, CS 2016
Municipality - pre-paid Municipality - receive bill from municipality Eskom - pre-paid
Eskom - receive bill from Eskom Other supplier
Total Number % Number % Number % Number % Number %
DC10: Sarah Baartman 47 893 39,2 7 078 5,8 63 731 52,2 2 859 2,3 598 0,5 122 159
2012 EC101 : Dr Beyers Naudé 11 701 61,7 1 008 5,3 5 776 30,5 466 2,5 - - 18 950
2013 EC102 : Blue Crane Route 5 317 61,2 573 6,6 2 686 30,9 - - 115 1,3 8 691
2015 EC104 : Makana 5 059 23,2 428 2 16 037 73,5 254 1,2 53 0,2 21 830
2016 EC105 : Ndlambe 1 924 10,3 1 719 9,2 14 336 76,5 637 3,4 120 0,6 18 735
2017 EC106 : Sundays River Valley 2 741 18,9 122 0,8 11 305 78,1 102 0,7 199 1,4 14 468
2019 EC108 : Kouga 17 153 59,5 3 149 10,9 7 663 26,6 758 2,6 92 0,3 28 815
2020 EC109 : Kou-Kamma 4 000 37,5 80 0,7 5 929 55,6 642 6 20 0,2 10 671
DC12: Amathole 17 666 9,9 670 0,4 156 208 87,8 3 243 1,8 61 0 177 849
2021 EC121 : Mbhashe 1 141 2,8 38 0,1 38 666 96,5 216 0,5 - - 40 060
2022 EC122 : Mnquma 2 131 4,1 81 0,2 49 112 94,3 751 1,4 4 0 52 078
2023 EC123 : Great Kei 2 331 35,6 25 0,4 2 934 44,8 1 253 19,2 - - 6 543
2024 EC124 : Amahlathi 1 549 6,8 270 1,2 20 635 90 418 1,8 47 0,2 22 920
2025 EC126 : Ngqushwa 348 2,1 9 0,1 16 140 97,5 51 0,3 2 0 16 550
2044 EC129 : Raymond Mhlaba 10 166 25,6 247 0,6 28 721 72,3 555 1,4 8 0 39 697
DC13: Chris Hani 45 387 25,8 2 004 1,1 124 409 70,8 3 728 2,1 143 0,1 175 671
2026 EC131 : Inxuba Yethemba 8 784 52,9 1 007 6,1 6 255 37,7 564 3,4 - - 16 610
2027 EC135 : Intsika Yethu 1 994 6,4 - - 28 653 91,3 710 2,3 39 0,1 31 396
2028 EC137 : Engcobo 527 1,9 7 0 26 100 94,2 1 068 3,9 - - 27 702
2029 EC138 : Sakhisizwe 719 5,1 14 0,1 13 302 94,2 82 0,6 - - 14 117
2043 EC139 : Enoch Mgijima 30 520 50,8 976 1,6 27 407 45,6 1 167 1,9 25 0 60 094
2045 EC136 : Emalahleni 2 844 11 2 0 22 692 88,1 136 0,5 79 0,3 25 753
DC14: Joe Gqabi 18 798 24,4 636 0,8 56 356 73,2 1 101 1,4 91 0,1 76 981
2030 EC141 : Elundini 5 814 24,5 69 0,3 17 645 74,5 139 0,6 30 0,1 23 697
2031 EC142 : Senqu 892 2,7 299 0,9 32 229 95,9 133 0,4 59 0,2 33 611
2042 EC145 : Walter Sisulu 12 091 61,5 268 1,4 6 482 33 829 4,2 3 0 19 673

STATISTICS SOUTH AFRICA 131 Report number 03-01-08
Provincial profile: Eastern Cape [Community Survey 2016], Report 03-01-08
Municipality - pre-paid
Municipality - receive bill from municipality Eskom - pre-paid
Eskom-receive bill from Eskom Other supplier
Total N % N % N % N % N %
DC15: O.R. Tambo 45 033 17,2 1 923 0,7 212 516 81,2 744 0,3 1 573 0,6 261 788
2032 EC153 : Ngquza Hill 481 0,9 84 0,2 50 187 98,4 244 0,5 - - 50 996
2033 EC154 : Port St Johns 1 352 5 31 0,1 25 754 94,3 137 0,5 26 0,1 27 300
2034 EC155 : Nyandeni 393 0,8 12 0 50 370 98,2 167 0,3 344 0,7 51 287
2035 EC156 : Mhlontlo 2 338 6,4 23 0,1 34 037 93,3 65 0,2 37 0,1 36 499 2036 EC157 : King Sabata
Dalindyebo 40 468 42,3 1 773 1,9 52 168 54,5 131 0,1 1 165 1,2 95 706
DC44: Alfred Nzo 14 071 11,2 197 0,2 109 819 87,5 772 0,6 664 0,5 125 523
2037 EC441 : Matatiele 8 688 26,1 46 0,1 24 415 73,2 88 0,3 100 0,3 33 336
2038 EC442 : Umzimvubu 341 1 44 0,1 32 809 97,5 449 1,3 - - 33 643
2039 EC443 : Mbizana 4 463 9,9 84 0,2 39 693 88,2 184 0,4 564 1,3 44 989
2040 EC444 : Ntabankulu 580 4,3 23 0,2 12 901 95,2 52 0,4 - - 13 555
BUF: Buffalo City 151 478 73,9 7 998 3,9 42 779 20,9 2 533 1,2 205 0,1 204 993
NMA: Nelson Mandela Bay 296 045 85,6 29 506 8,5 18 994 5,5 474 0,1 629 0,2 345 648
Eastern Cape 636 371 42,7 50 012 3,4 784 811 52,7 15 455 1 3 964 0,3 1 490 612

STATISTICS SOUTH AFRICA 132 Report number 03-01-08
Provincial profile: Eastern Cape [Community Survey 2016], Report 03-01-08
Table 28: Distribution of households by refuse removal and municipality, CS 2016
Municipality
Removed by local authority/private
company/community members at least
once a week
Removed by local authority/private
company/community members less often than
once a week
Communal refuse dump
Communal container/central collection
point
Own refuse dump
Dump or leave rubbish anywhere (no
rubbish disposal) Other Total
DC10: Sarah Baartman 114 664 1 806 4 416 961 11 514 2 845 1 976 138 182
EC101 : Dr Beyers Naudé 18 319 128 529 0 1 484 127 162 20 748
EC102 : Blue Crane Route 8 505 37 426 0 637 258 13 9 876
EC104 : Makana 20 444 223 110 778 528 347 270 22 700
EC105 : Ndlambe 18 544 121 285 66 1 230 512 60 20 818
EC106 : Sundays River Valley 10 615 369 364 28 4 422 390 1 031 17 221
EC108 : Kouga 29 082 749 2 492 58 1 602 847 406 35 236
EC109 : Kou-Kamma 9 156 179 210 31 1 612 364 33 11 583
DC12: Amathole 37 145 1 657 7 404 2 919 146 032 15 077 3 529 213 763
EC121 : Mbhashe 6 398 363 2 013 526 42 988 6 332 108 58 727
EC122 : Mnquma 11 494 61 1 892 0 43 265 5 402 1 401 63 514
EC123 : Great Kei 2 339 105 429 44 4 462 1 143 251 8 774
EC124 : Amahlathi 3 438 256 491 2 147 17 323 231 690 24 577
EC126 : Ngqushwa 1 508 22 624 39 14 233 686 38 17 149
EC129 : Raymond Mhlaba 11 969 850 1 955 164 23 761 1 282 1 040 41 022
DC13: Chris Hani 52 463 3 557 5 626 4 028 108 036 15 767 4 813 194 291
EC131 : Inxuba Yethemba 13 556 1 850 278 74 2 308 165 52 18 282
EC135 : Intsika Yethu 194 123 626 558 31 227 2 068 1 055 35 851
EC137 : Engcobo 139 916 822 64 25 546 4 073 1 596 33 156
EC138 : Sakhisizwe 1 050 36 525 12 9 173 3 522 530 14 848
EC139 : Enoch Mgijima 32 474 554 2 531 2 728 21 701 3 615 1 543 65 146
EC136 : Emalahleni 5 050 79 844 592 18 081 2 324 37 27 008
STATISTICS SOUTH AFRICA 133 Report number 03-01-08
Provincial profile: Eastern Cape [Community Survey 2016], Report 03-01-08
Municipality
Removed by local authority/private
company/community members at least once
a week
Removed by local authority/private
company/community members less often than
once a week Communal
refuse dump
Communal container/ce
ntral collection
point
Own refuse dump
Dump or leave rubbish anywhere (no
rubbish disposal) Other Total
DC15: O.R. Tambo 28 168 2 138 9 337 2 500 237 672 32 510 1 756 314 080
EC153 : Ngquza Hill 1 769 887 911 217 49 238 7 911 40 60 974
EC154 : Port St Johns 156 53 785 26 25 665 6 517 748 33 951
EC155 : Nyandeni 588 442 1 219 164 53 724 5 568 161 61 867
EC156 : Mhlontlo 750 99 1 737 25 34 099 4 217 467 41 395
EC157 : King Sabata Dalindyebo 24 903 656 4 685 2 069 74 945 8 296 341 115 894
DC44: Alfred Nzo 10 419 906 4 760 290 158 295 17 726 3 580 195 975
EC441 : Matatiele 7 081 143 1 726 51 40 952 4 506 2 409 56 868
EC442 : Umzimvubu 2 205 584 290 133 45 161 2 548 609 51 530
EC443 : Mbizana 871 64 2 304 82 53 986 3 774 301 61 383
EC444 : Ntabankulu 261 115 440 24 18 196 6 898 260 26 195
BUF: Buffalo City 144 677 6 803 19 137 5 082 62 251 10 546 4 981 253 477
NMA: Nelson Mandela Bay 312 414 20 670 9 665 5 184 9 136 7 247 4 204 368 520
Eastern Cape 732 375 38 840 62 064 21 347 786 276 106 473 26 019 1 773 395

STATISTICS SOUTH AFRICA 134 Report number 03-01-08
Provincial profile: Eastern Cape [Community Survey 2016], Report 03-01-08
Table 29: Distribution of households by source of energy for cooking and lighting, CS 2016
Municipality
Cooking Lighting
Electricity Other energy
sources None Total Electricity
Other energy sources
None Total
DC10: Sarah Baartman 121 707 15 935 532 138 174 126 149 11 314 630 138 093
EC101 : Dr Beyers Naudé 19 104 1 549 95 20 748 19 754 959 36 20 749
EC102 : Blue Crane Route 8 649 1 142 85 9 876 8 908 950 18 9 876
EC104 : Makana 20 692 1 961 48 22 701 22 025 597 32 22 654
EC105 : Ndlambe 17 918 2 815 85 20 818 18 578 1 809 431 20 818
EC106 : Sundays River Valley 15 119 1 999 103 17 221 15 426 1 689 62 17 177
EC108 : Kouga 29 335 5 886 15 35 236 30 480 4 727 29 35 236
EC109 : Kou-Kamma 10 890 584 102 11 576 10 979 582 22 11 583
DC12: Amathole 163 484 48 923 1 326 213 733 176 496 36 484 410 213 390
EC121 : Mbhashe 34 667 23 742 318 58 727 39 319 19 264 79 58 662
EC122 : Mnquma 48 348 14 871 285 63 504 51 748 11 509 169 63 426
EC123 : Great Kei 6 161 2 611 2 8 774 6 685 2 050 2 8 737
EC124 : Amahlathi 20 865 3 404 288 24 557 22 645 1 746 64 24 455
EC126 : Ngqushwa 14 954 1 981 213 17 148 16 476 628 7 17 111
EC129 : Raymond Mhlaba 38 489 2 313 220 41 022 39 623 1 287 88 40 998
DC13: Chris Hani 161 608 32 199 483 194 290 174 888 18 896 315 194 099
EC131 : Inxuba Yethemba 16 868 1 395 19 18 282 17 546 718 13 18 277
EC135 : Intsika Yethu 27 403 8 290 158 35 851 31 091 4 605 84 35 780
EC137 : Engcobo 22 223 10 893 41 33 157 26 641 6 468 23 33 132
EC138 : Sakhisizwe 13 245 1 575 28 14 848 13 946 895 7 14 848
EC139 : Enoch Mgijima 58 373 6 614 160 65 147 60 268 4 644 152 65 064
EC136 : Emalahleni 23 497 3 433 78 27 008 25 397 1 567 36 27 000
DC14: Joe Gqabi 69 760 24 366 939 95 065 76 110 18 292 551 94 953
EC141 : Elundini 17 779 17 358 658 35 795 22 222 13 102 441 35 765
EC142 : Senqu 31 753 3 691 153 35 597 33 130 2 406 43 35 579
EC145 : Walter Sisulu 20 228 3 317 128 23 673 20 758 2 784 68 23 610
STATISTICS SOUTH AFRICA 135 Report number 03-01-08
Provincial profile: Eastern Cape [Community Survey 2016], Report 03-01-08
Municipality
Cooking Lighting
Electricity Other energy
sources None Total Electricity
Other energy sources
None Total
DC15: O.R. Tambo 210 011 102 372 1 568 313 951 262 746 49 626 987 313 359
EC153 : Ngquza Hill 35 209 25 564 199 60 972 51 750 9 135 53 60 938
EC154 : Port St Johns 16 914 16 755 256 33 925 27 902 5 799 226 33 927
EC155 : Nyandeni 39 399 22 290 139 61 828 50 376 11 110 130 61 616
EC156 : Mhlontlo 29 382 11 635 368 41 385 34 817 6 360 161 41 338
EC157 : King Sabata Dalindyebo 89 107 26 129 606 115 842 97 901 17 222 417 115 540
DC44: Alfred Nzo 91 311 103 889 738 195 938 123 910 71 779 199 195 888
EC441 : Matatiele 28 483 28 124 240 56 847 33 131 23 625 93 56 849
EC442 : Umzimvubu 26 759 24 513 242 51 514 33 291 18 163 44 51 498
EC443 : Mbizana 26 184 35 104 95 61 383 44 070 17 244 32 61 346
EC444 : Ntabankulu 9 885 16 148 161 26 194 13 418 12 747 30 26 195
BUF: Buffalo City 207 045 44 911 1 492 253 448 219 649 32 391 1 025 253 065
NMA: Nelson Mandela Bay 336 713 31 060 605 368 378 352 286 15 209 552 368 047
Eastern Cape 1 361 639 403 655 7 683 1 772 977 1 512 234 253 990 4 670 1 770 894

STATISTICS SOUTH AFRICA 136 Report number 03-01-08
Provincial profile: Eastern Cape [Community Survey 2016], Report 03-01-08
Table 30: Distribution of households by access to internet services and district, CS 2016
Access to internet No access to internet
DC10: Sarah Baartman 10 461 116 675
2012 EC101 : Dr Beyers Naudé 1 444 18 932
2013 EC102 : Blue Crane Route 165 9 440
2015 EC104 : Makana 1 461 18 837
2016 EC105 : Ndlambe 1 863 18 115
2017 EC106 : Sundays River Valley 163 15 068
2019 EC108 : Kouga 4 846 25 500
2020 EC109 : Kou-Kamma 518 10 784
DC12: Amathole 10 046 196 607
2021 EC121 : Mbhashe 1 467 52 471
2022 EC122 : Mnquma 2 842 59 646
2023 EC123 : Great Kei 1 130 7 574
2024 EC124 : Amahlathi 1 316 22 769
2025 EC126 : Ngqushwa 703 16 331
2044 EC129 : Raymond Mhlaba 2 588 37 816
DC13: Chris Hani 10 276 175 921
2026 EC131 : Inxuba Yethemba 1 102 16 859
2027 EC135 : Intsika Yethu 781 30 358
2028 EC137 : Engcobo 921 31 720
2029 EC138 : Sakhisizwe 1 235 13 160
2043 EC139 : Enoch Mgijima 5 773 57 620
2045 EC136 : Emalahleni 465 26 203
DC14: Joe Gqabi 6 456 86 602
2030 EC141 : Elundini 1 396 33 571
2031 EC142 : Senqu 2 591 32 138
2042 EC145 : Walter Sisulu 2 469 20 892
DC15: O.R. Tambo 7 668 298 168
2032 EC153 : Ngquza Hill 681 59 358
2033 EC154 : Port St Johns 543 32 495
2034 EC155 : Nyandeni 2 058 58 590
2035 EC156 : Mhlontlo 844 39 748
2036 EC157 : King Sabata Dalindyebo 3 543 107 976
DC44: Alfred Nzo 6 055 186 931
2037 EC441 : Matatiele 1 675 54 305
2038 EC442 : Umzimvubu 2 257 48 507
2039 EC443 : Mbizana 1 654 58 817
2040 EC444 : Ntabankulu 469 25 302
BUF: Buffalo City 24 041 225 702
NMA: Nelson Mandela Bay 45 320 311 877
Eastern Cape 120 323 1 598 483

STATISTICS SOUTH AFRICA 137 Report number 03-01-08
Provincial profile: Eastern Cape [Community Survey 2016], Report 03-01-08
Table 31: Distribution of households that ran out of money to buy food in the last 12 months, CS 2016
Municipality Ran out of
money to buy food
Did not run out of money to buy
food
Prevalence of running out of money to buy
food
Total
DC10: Sarah Baartman 28 344 109 122 20,6 137 466
2012 EC101 : Dr Beyers Naudé 2 908 17 840 14 20 748
2013 EC102 : Blue Crane Route 2 537 7 283 25,8 9 820
2015 EC104 : Makana 4 405 18 232 19,5 22 637
2016 EC105 : Ndlambe 5 003 15 795 24,1 20 798
2017 EC106 : Sundays River Valley 5 599 11 493 32,8 17 091
2019 EC108 : Kouga 7 389 27 426 21,2 34 814
2020 EC109 : Kou-Kamma 503 11 054 4,4 11 556
DC12: Amathole 67 099 146 026 31,5 213 125
2021 EC121 : Mbhashe 16 644 41 821 28,5 58 465
2022 EC122 : Mnquma 21 040 42 275 33,2 63 315
2023 EC123 : Great Kei 3 083 5 692 35,1 8 774
2024 EC124 : Amahlathi 6 883 17 620 28,1 24 503
2025 EC126 : Ngqushwa 7 270 9 879 42,4 17 149
2044 EC129 : Raymond Mhlaba 12 179 28 740 29,8 40 919
DC13: Chris Hani 44 719 149 172 23,1 193 891
2026 EC131 : Inxuba Yethemba 4 301 13 876 23,7 18 177
2027 EC135 : Intsika Yethu 7 404 28 317 20,7 35 721
2028 EC137 : Engcobo 5 415 27 730 16,3 33 145
2029 EC138 : Sakhisizwe 4 189 10 649 28,2 14 838
2043 EC139 : Enoch Mgijima 15 327 49 704 23,6 65 031
2045 EC136 : Emalahleni 8 084 18 896 30 26 979
DC14: Joe Gqabi 19 691 75 078 20,8 94 770
2030 EC141 : Elundini 9 390 26 174 26,4 35 564
2031 EC142 : Senqu 7 162 28 377 20,2 35 539
2042 EC145 : Walter Sisulu 3 139 20 528 13,3 23 667
DC15: O.R. Tambo 86 536 226 554 27,6 313 090
2032 EC153 : Ngquza Hill 20 644 40 273 33,9 60 918
2033 EC154 : Port St Johns 8 571 25 330 25,3 33 902
2034 EC155 : Nyandeni 19 515 42 202 31,6 61 718
2035 EC156 : Mhlontlo 8 704 32 473 21,1 41 177
2036 EC157 : King Sabata Dalindyebo 29 101 86 275 25,2 115 376
DC44: Alfred Nzo 58 619 137 078 30 195 697
2037 EC441 : Matatiele 18 644 38 167 32,8 56 811
2038 EC442 : Umzimvubu 15 126 36 266 29,4 51 392
2039 EC443 : Mbizana 18 497 42 860 30,1 61 357
2040 EC444 : Ntabankulu 6 351 19 785 24,3 26 136
BUF: Buffalo City 71 979 181 023 28,4 253 002
NMA: Nelson Mandela Bay 87 850 279 746 23,9 367 596
Eastern Cape 464 838 1 303 800 26,3 1 768 638

STATISTICS SOUTH AFRICA 138 Report number 03-01-08
Provincial profile: Eastern Cape [Community Survey 2016], Report 03-01-08
Table 32: Distribution of households that skipped16 a meal in the last 12 months by municipalities, CS
2016
Skipped a meal Did not skip a
meal Prevalence of
skipping a meal Total
DC10: Sarah Baartman 16 679 121 044 12,1 137 723
EC101 : Dr Beyers Naudé 2 115 18 633 10,2 20 748
EC102 : Blue Crane Route 1 064 8 753 10,8 9 818
EC104 : Makana 2 615 20 053 11,5 22 668
EC105 : Ndlambe 3 002 17 767 14,5 20 768
EC106 : Sundays River Valley 3 054 14 066 17,8 17 120
EC108 : Kouga 4 455 30 590 12,7 35 044
EC109 : Kou-Kamma 374 11 182 3,2 11 556
DC12: Amathole 46 084 167 190 21,6 213 274
EC121 : Mbhashe 11 073 47 429 18,9 58 502
EC122 : Mnquma 14 261 49 160 22,5 63 421
EC123 : Great Kei 2 183 6 591 24,9 8 774
EC124 : Amahlathi 3 992 20 515 16,3 24 506
EC126 : Ngqushwa 4 681 12 468 27,3 17 149
EC129 : Raymond Mhlaba 9 895 31 027 24,2 40 922
DC13: Chris Hani 31 244 162 666 16,1 193 910
EC131 : Inxuba Yethemba 3 262 14 948 17,9 18 210
EC135 : Intsika Yethu 5 272 30 527 14,7 35 799
EC137 : Engcobo 4 185 28 916 12,6 33 100
EC138 : Sakhisizwe 3 010 11 829 20,3 14 839
EC139 : Enoch Mgijima 11 464 53 531 17,6 64 995
EC136 : Emalahleni 4 052 22 916 15 26 968
DC14: Joe Gqabi 12 513 82 283 13,2 94 796
EC141 : Elundini 6 583 29 021 18,5 35 604
EC142 : Senqu 4 277 31 248 12 35 526
EC145 : Walter Sisulu 1 653 22 014 7 23 667
DC15: O.R. Tambo 56 608 256 608 18,1 313 216
EC153 : Ngquza Hill 12 262 48 688 20,1 60 950
EC154 : Port St Johns 6 114 27 828 18 33 943
EC155 : Nyandeni 11 404 50 287 18,5 61 691
EC156 : Mhlontlo 5 275 35 989 12,8 41 264
EC157 : King Sabata Dalindyebo 21 552 93 816 18,7 115 368
DC44: Alfred Nzo 34 119 161 487 17,4 195 606
EC441 : Matatiele 9 735 47 024 17,2 56 760
EC442 : Umzimvubu 9 275 42 110 18,1 51 385
EC443 : Mbizana 10 954 50 402 17,9 61 356
EC444 : Ntabankulu 4 154 21 951 15,9 26 105
BUF: Buffalo City 50 259 202 941 19,8 253 200
NMA: Nelson Mandela Bay 63 756 303 748 17,3 367 504
Eastern Cape 311 263 1 457 967 17,6 1 769 229
16 Skipping a meal refers to a person not eating because there was not enough food for the household.

STATISTICS SOUTH AFRICA 139 Report number 03-01-08
Provincial profile: Eastern Cape [Community Survey 2016], Report 03-01-08
Table 33: Distribution of households by crime experienced in the last 12 months by municipalities,
CS 2016
Experienced crime Did not experience crime Total
DC10: Sarah Baartman 9 744 128 253 137 998
EC101 : Dr Beyers Naudé 907 19 840 20 746
EC102 : Blue Crane Route 367 9 474 9 841
EC104 : Makana 2 402 20 296 22 698
EC105 : Ndlambe 1 458 19 339 20 797
EC106 : Sundays River Valley 1 006 16 173 17 179
EC108 : Kouga 3 255 31 899 35 154
EC109 : Kou-Kamma 351 11 233 11 583
DC12: Amathole 11 662 201 059 212 721
EC121 : Mbhashe 2 055 56 363 58 418
EC122 : Mnquma 3 999 59 196 63 194
EC123 : Great Kei 927 7 848 8 774
EC124 : Amahlathi 1 413 23 106 24 519
EC126 : Ngqushwa 1 015 16 089 17 104
EC129 : Raymond Mhlaba 2 253 38 459 40 712
DC13: Chris Hani 8 433 185 270 193 702
EC131 : Inxuba Yethemba 838 17 403 18 241
EC135 : Intsika Yethu 1 275 34 425 35 701
EC137 : Engcobo 770 32 316 33 085
EC138 : Sakhisizwe 481 14 356 14 837
EC139 : Enoch Mgijima 4 092 60 846 64 938
EC136 : Emalahleni 977 25 923 26 900
DC14: Joe Gqabi 4 631 90 132 94 764
EC141 : Elundini 2 438 33 152 35 589
EC142 : Senqu 1 571 33 922 35 492
EC145 : Walter Sisulu 623 23 059 23 682
DC15: O.R. Tambo 17 233 296 105 313 338
EC153 : Ngquza Hill 1 933 58 918 60 851
EC154 : Port St Johns 990 32 919 33 909
EC155 : Nyandeni 3 362 58 307 61 670
EC156 : Mhlontlo 1 373 39 936 41 309
EC157 : King Sabata Dalindyebo 9 574 106 025 115 599
DC44: Alfred Nzo 9 264 186 410 195 674
EC441 : Matatiele 2 986 53 798 56 784
EC442 : Umzimvubu 2 698 48 684 51 382
EC443 : Mbizana 2 669 58 660 61 329
EC444 : Ntabankulu 911 25 269 26 180
BUF: Buffalo City 20 468 232 164 252 632
NMA: Nelson Mandela Bay 27 726 339 690 367 416
Eastern Cape 109 160 1 659 084 1 768 244

STATISTICS SOUTH AFRICA 140 Report number 03-01-08
Provincial profile: Eastern Cape [Community Survey 2016], Report 03-01-08
Table 34: Distribution of households’ perception of safety when walking alone during the day, CS
2016
Municipality Very safe Fairly safe A bit unsafe Very unsafe Total
DC10: Sarah Baartman 82 323 36 798 14 071 4 968 138 160
EC101 : Dr Beyers Naudé 12 725 6 153 1 087 783 20 748
EC102 : Blue Crane Route 7 796 1 711 312 56 9 876
EC104 : Makana 10 848 8 067 2 746 1 031 22 692
EC105 : Ndlambe 11 967 4 969 2 702 1 180 20 818
EC106 : Sundays River Valley 10 951 3 936 1 936 398 17 221
EC108 : Kouga 21 432 9 264 3 457 1 068 35 221
EC109 : Kou-Kamma 6 604 2 696 1 832 452 11 583
DC12: Amathole 116 591 58 711 22 554 15 795 213 651
EC121 : Mbhashe 26 585 20 949 8 284 2 878 58 696
EC122 : Mnquma 31 141 20 764 7 183 4 391 63 480
EC123 : Great Kei 5 854 1 819 469 632 8 774
EC124 : Amahlathi 17 016 5 283 1 296 960 24 556
EC126 : Ngqushwa 12 885 2 416 677 1 163 17 142
EC129 : Raymond Mhlaba 23 109 7 480 4 644 5 770 41 004
DC13: Chris Hani 121 453 41 929 20 204 10 703 194 289
EC131 : Inxuba Yethemba 12 839 2 668 1 906 869 18 282
EC135 : Intsika Yethu 21 718 7 954 4 151 2 029 35 851
EC137 : Engcobo 20 435 7 436 4 369 913 33 154
EC138 : Sakhisizwe 10 202 2 145 1 588 913 14 848
EC139 : Enoch Mgijima 38 083 15 605 6 244 5 214 65 146
EC136 : Emalahleni 18 176 6 120 1 947 765 27 008
DC14: Joe Gqabi 58 808 20 077 7 100 9 037 95 023
EC141 : Elundini 21 595 6 819 3 487 3 836 35 737
EC142 : Senqu 23 224 6 908 1 614 3 850 35 597
EC145 : Walter Sisulu 13 989 6 350 1 999 1 350 23 688
DC15: O.R. Tambo 174 875 87 355 32 472 19 161 313 863
EC153 : Ngquza Hill 37 830 15 940 4 733 2 410 60 913
EC154 : Port St Johns 20 102 9 749 3 403 697 33 951
EC155 : Nyandeni 39 035 15 347 4 331 3 069 61 782
EC156 : Mhlontlo 26 979 10 636 2 391 1 370 41 376
EC157 : King Sabata Dalindyebo 50 929 35 684 17 614 11 614 115 841
DC44: Alfred Nzo 127 913 44 062 15 178 8 728 195 880
EC441 : Matatiele 39 204 9 967 4 543 3 118 56 831
EC442 : Umzimvubu 33 800 12 180 3 774 1 765 51 519
EC443 : Mbizana 38 408 15 823 5 166 1 937 61 335
EC444 : Ntabankulu 16 500 6 093 1 695 1 907 26 195
BUF: Buffalo City 98 018 81 441 48 005 25 932 253 397
NMA: Nelson Mandela Bay 118 051 128 632 76 507 45 251 368 441
Eastern Cape 898 032 499 006 236 091 139 574 1 772 702

STATISTICS SOUTH AFRICA 141 Report number 03-01-08
Provincial profile: Eastern Cape [Community Survey 2016], Report 03-01-08
Table 35: Distribution of households by perception of safety when walking alone when it is dark, CS
2016
Municipality Very safe Fairly safe A bit unsafe Very unsafe Total
DC10: Sarah Baartman 22 863 25 518 24 409 65 376 138 165
EC101 : Dr Beyers Naudé 6 361 7 010 2 964 4 414 20 748
EC102 : Blue Crane Route 2 653 2 324 1 568 3 331 9 876
EC104 : Makana 2 368 4 386 6 223 9 725 22 700
EC105 : Ndlambe 2 841 2 615 2 174 13 188 20 818
EC106 : Sundays River Valley 1 921 2 071 3 322 9 907 17 221
EC108 : Kouga 3 653 3 926 5 375 22 265 35 219
EC109 : Kou-Kamma 3 067 3 186 2 784 2 546 11 583
DC12: Amathole 23 562 41 370 46 343 102 448 213 724
EC121 : Mbhashe 5 445 16 286 14 353 22 642 58 726
EC122 : Mnquma 6 122 11 525 15 539 30 317 63 504
EC123 : Great Kei 1 095 723 1 338 5 605 8 761
EC124 : Amahlathi 2 405 2 595 4 247 15 329 24 577
EC126 : Ngqushwa 2 301 3 371 3 744 7 717 17 133
EC129 : Raymond Mhlaba 6 194 6 869 7 122 20 837 41 022
DC13: Chris Hani 27 305 32 821 33 866 100 261 194 253
EC131 : Inxuba Yethemba 4 371 3 202 4 146 6 564 18 282
EC135 : Intsika Yethu 4 709 5 192 6 152 19 798 35 851
EC137 : Engcobo 4 993 9 676 5 309 13 174 33 152
EC138 : Sakhisizwe 2 111 3 594 2 009 7 135 14 848
EC139 : Enoch Mgijima 9 144 7 950 11 206 36 830 65 130
EC136 : Emalahleni 1 978 3 207 5 044 16 761 26 989
DC14: Joe Gqabi 16 140 19 248 14 168 45 519 95 074
EC141 : Elundini 4 964 5 561 5 576 19 693 35 794
EC142 : Senqu 5 199 6 570 4 794 19 011 35 574
EC145 : Walter Sisulu 5 976 7 117 3 798 6 814 23 706
DC15: O.R. Tambo 41 957 66 995 64 033 140 990 313 975
EC153 : Ngquza Hill 8 875 15 528 12 798 23 714 60 915
EC154 : Port St Johns 5 580 8 459 6 961 12 939 33 939
EC155 : Nyandeni 9 602 14 477 12 404 25 366 61 849
EC156 : Mhlontlo 8 516 8 611 8 750 15 517 41 395
EC157 : King Sabata Dalindyebo 9 384 19 920 23 120 63 453 115 878
DC44: Alfred Nzo 29 298 39 514 42 861 84 282 195 956
EC441 : Matatiele 7 069 9 853 10 592 29 353 56 868
EC442 : Umzimvubu 7 334 10 915 11 684 21 597 51 530
EC443 : Mbizana 8 596 13 848 13 344 25 576 61 364
EC444 : Ntabankulu 6 300 4 897 7 242 7 756 26 195
BUF: Buffalo City 20 998 29 984 38 586 163 872 253 440
NMA: Nelson Mandela Bay 36 766 66 832 76 394 188 447 368 438
Eastern Cape 218 889 322 281 340 661 891 194 1 773 025
STATISTICS SOUTH AFRICA 142 Report number 03-01-08
Provincial profile: Eastern Cape [Community Survey 2016], Report 03-01-08
Table 36: Extent to which household agrees that municipality is trying to solve the problem, CS 2016
Municipality Strongly disagree Disagree
Neither agree or disagree Agree Strongly agree
DC10: Sarah Baartman 71 593 31 625 9 184 12 790 3 848
EC101 : Dr Beyers Naudé 12 873 4 602 585 1 715 227
EC102 : Blue Crane Route 3 852 3 159 165 839 196
EC104 : Makana 8 720 5 033 2 548 4 675 332
EC105 : Ndlambe 9 346 4 688 1 162 1 999 2 193
EC106 : Sundays River Valley 10 368 3 739 492 924 481
EC108 : Kouga 23 122 4 786 3 285 2 214 394
EC109 : Kou-Kamma 3 312 5 618 948 424 25
DC12: Amathole 113 482 53 291 14 371 20 859 6 995
EC121 : Mbhashe 23 155 16 295 6 181 8 228 3 532
EC122 : Mnquma 33 566 17 399 4 201 4 972 2 165
EC123 : Great Kei 4 737 2 278 939 438 8
EC124 : Amahlathi 10 832 8 646 1 104 3 118 335
EC126 : Ngqushwa 10 592 2 461 1 417 1 417 804
EC129 : Raymond Mhlaba 30 599 6 211 530 2 686 152
DC13: Chris Hani 80 581 53 253 11 615 30 709 10 570
EC131 : Inxuba Yethemba 5 192 3 565 1 663 3 474 1 854
EC135 : Intsika Yethu 17 734 8 064 2 304 3 963 3 053
EC137 : Engcobo 8 610 12 469 3 132 6 878 1 523
EC138 : Sakhisizwe 6 888 3 170 936 3 359 370
EC139 : Enoch Mgijima 31 668 18 313 2 518 7 267 2 062
EC136 : Emalahleni 10 489 7 673 1 062 5 768 1 708
DC14: Joe Gqabi 39 566 26 037 7 077 11 852 3 200
EC141 : Elundini 14 967 8 672 4 258 4 302 1 925
EC142 : Senqu 14 057 13 112 1 794 4 721 116
EC145 : Walter Sisulu 10 542 4 254 1 025 2 828 1 159
DC15: O.R. Tambo 164 698 82 925 23 684 31 618 7 214
EC153 : Ngquza Hill 36 138 14 772 4 912 4 783 183
EC154 : Port St Johns 20 025 7 442 1 925 3 248 1 244
EC155 : Nyandeni 28 470 20 156 4 851 6 652 430
EC156 : Mhlontlo 18 598 11 896 3 422 6 619 365
EC157 : King Sabata Dalindyebo 61 468 28 659 8 575 10 317 4 991
DC44: Alfred Nzo 80 359 58 403 22 439 28 185 3 416
EC441 : Matatiele 21 317 16 081 6 056 10 424 1 389
EC442 : Umzimvubu 23 499 14 304 5 566 7 425 410
EC443 : Mbizana 24 452 20 611 8 049 6 747 502
EC444 : Ntabankulu 11 092 7 408 2 768 3 588 1 115
BUF: Buffalo City 134 669 58 567 16 123 19 927 11 210
NMA: Nelson Mandela Bay 161 191 96 048 28 431 30 897 18 910
Eastern Cape 846 140 460 150 132 924 186 836 65 362

STATISTICS SOUTH AFRICA 143 Report number 03-01-08
Provincial profile: Eastern Cape [Community Survey 2016], Report 03-01-08
Table 37: Distribution of households by whether death occurred in the last 12 months by
municipalities, CS 2016
Municipality Yes No Total
DC10: Sarah Baartman 4 270 133 912 138 182
EC101 : Dr Beyers Naudé 635 20 113 20 748
EC102 : Blue Crane Route 235 9 641 9 876
EC104 : Makana 1 406 21 294 22 700
EC105 : Ndlambe 650 20 168 20 818
EC106 : Sundays River Valley 441 16 780 17 221
EC108 : Kouga 784 34 452 35 236
EC109 : Kou-Kamma 119 11 464 11 583
DC12: Amathole 10 175 203 588 213 763
EC121 : Mbhashe 2 477 56 250 58 727
EC122 : Mnquma 3 240 60 274 63 514
EC123 : Great Kei 288 8 486 8 774
EC124 : Amahlathi 1 195 23 381 24 577
EC126 : Ngqushwa 966 16 183 17 149
EC129 : Raymond Mhlaba 2 008 39 014 41 022
DC13: Chris Hani 7 976 186 314 194 291
EC131 : Inxuba Yethemba 602 17 680 18 282
EC135 : Intsika Yethu 1 793 34 058 35 851
EC137 : Engcobo 1 055 32 101 33 156
EC138 : Sakhisizwe 599 14 249 14 848
EC139 : Enoch Mgijima 2 477 62 669 65 146
EC136 : Emalahleni 1 449 25 558 27 008
DC14: Joe Gqabi 3 153 91 953 95 107
EC141 : Elundini 1 693 34 112 35 804
EC142 : Senqu 1 180 34 417 35 597
EC145 : Walter Sisulu 281 23 425 23 706
DC15: O.R. Tambo 12 211 301 870 314 080
EC153 : Ngquza Hill 2 661 58 313 60 974
EC154 : Port St Johns 1 633 32 319 33 951
EC155 : Nyandeni 2 521 59 346 61 867
EC156 : Mhlontlo 1 484 39 911 41 395
EC157 : King Sabata Dalindyebo 3 912 111 982 115 894
DC44: Alfred Nzo 10 955 185 021 195 975
EC441 : Matatiele 2 694 54 174 56 868
EC442 : Umzimvubu 2 846 48 684 51 530
EC443 : Mbizana 3 991 57 392 61 383
EC444 : Ntabankulu 1 424 24 771 26 195
BUF: Buffalo City 8 599 244 878 253 477
NMA: Nelson Mandela Bay 9 257 359 263 368 520
Eastern Cape 66 596 1 706 798 1 773 395

STATISTICS SOUTH AFRICA 144 Report number 03-01-08
Provincial profile: Eastern Cape [Community Survey 2016], Report 03-01-08
Table 38: Number of deaths per households that experienced death in the last 12 months by
municipality, CS 2016
Municipality 1 death 2+ deaths Total
DC10: Sarah Baartman 4 125 145 4 270
EC101 : Dr Beyers Naudé 614 22 635
EC102 : Blue Crane Route 235 - 235
EC104 : Makana 1 325 81 1 406
EC105 : Ndlambe 626 24 650
EC106 : Sundays River Valley 423 18 441
EC108 : Kouga 784 - 784
EC109 : Kou-Kamma 119 - 119
DC12: Amathole 9 540 635 10 175
EC121 : Mbhashe 2 325 152 2 477
EC122 : Mnquma 3 026 214 3 240
EC123 : Great Kei 250 38 288
EC124 : Amahlathi 1 149 46 1 195
EC126 : Ngqushwa 925 40 966
EC129 : Raymond Mhlaba 1 864 144 2 008
DC13: Chris Hani 7 522 454 7 976
EC131 : Inxuba Yethemba 565 37 602
EC135 : Intsika Yethu 1 749 44 1 793
EC137 : Engcobo 1 027 28 1 055
EC138 : Sakhisizwe 500 99 599
EC139 : Enoch Mgijima 2 347 131 2 477
EC136 : Emalahleni 1 334 116 1 449
DC14: Joe Gqabi 2 970 184 3 153
EC141 : Elundini 1 586 107 1 693
EC142 : Senqu 1 119 61 1 180
EC145 : Walter Sisulu 265 16 281
DC15: O.R. Tambo 11 475 736 12 211
EC153 : Ngquza Hill 2 517 144 2 661
EC154 : Port St Johns 1 496 137 1 633
EC155 : Nyandeni 2 426 96 2 521
EC156 : Mhlontlo 1 367 117 1 484
EC157 : King Sabata Dalindyebo 3 669 243 3 912
DC44: Alfred Nzo 10 236 719 10 955
EC441 : Matatiele 2 453 241 2 694
EC442 : Umzimvubu 2 681 164 2 846
EC443 : Mbizana 3 730 261 3 991
EC444 : Ntabankulu 1 372 52 1 424
BUF: Buffalo City 8 114 485 8 599
NMA: Nelson Mandela Bay 8 888 369 9 257
Eastern Cape 62 870 3 726 66 596

STATISTICS SOUTH AFRICA 145 Report number 03-01-08
Provincial profile: Eastern Cape [Community Survey 2016], Report 03-01-08
Table 39a: Distribution of disability by district and age group: Eastern Cape, CS 2016
Age group
DC10 Sarah Baartman DC12 Amathole DC13 Chris Hani DC14 Joe Gqabi DC15 O.R. Tambo
Wit
ho
ut
dis
ab
ilit
y
Wit
h
dis
ab
ilit
y
To
tal
Wit
ho
ut
dis
ab
ilit
y
Wit
h
dis
ab
ilit
y
To
tal
Wit
ho
ut
dis
ab
ilit
y
Wit
h
dis
ab
ilit
y
To
tal
Wit
ho
ut
dis
ab
ilit
y
Wit
h
dis
ab
ilit
y
To
tal
Wit
ho
ut
dis
ab
ilit
y
Wit
h
dis
ab
ilit
y
To
tal
5–9 46 626 2 454 49 079 98 288 4 537 102 824 109 725 4 697 114 423 45 553 1 833 47 386 183 783 7 891 191 674
10–14 46 047 1 723 47 769 88 342 2 450 90 791 103 690 2 804 106 494 44 021 1 172 45 194 178 802 5 975 184 777
15–19 42 053 956 43 008 119 868 3 186 123 055 93 974 2 457 96 431 46 277 1 410 47 687 191 104 6 475 197 580
20–24 41 245 812 42 057 93 758 3 166 96 924 78 293 2 043 80 336 37 712 716 38 427 158 907 6 357 165 264
25–29 41 895 1 082 42 977 80 383 3 806 84 190 70 182 2 525 72 708 33 439 1 032 34 472 126 260 5 663 131 923
30–34 37 333 1 573 38 907 63 308 3 803 67 111 58 413 2 575 60 988 28 517 1 032 29 549 91 492 6 196 97 687
35–39 28 630 1 477 30 107 27 990 2 311 30 301 26 530 1 625 28 155 13 566 712 14 278 46 822 3 911 50 733
40–44 25 855 1 594 27 449 26 811 2 861 29 672 24 976 2 092 27 068 11 351 905 12 256 38 811 4 464 43 275
45–49 22 443 2 861 25 304 24 509 3 771 28 280 22 359 2 968 25 327 9 287 1 266 10 553 32 816 6 034 38 850
50–54 17 724 3 166 20 890 22 456 5 532 27 988 19 730 4 324 24 053 8 556 1 689 10 245 27 508 7 581 35 089
55–59 15 018 4 136 19 154 22 678 7 187 29 865 20 084 5 298 25 382 7 634 2 315 9 949 25 843 9 114 34 956
60–64 11 310 4 140 15 450 17 430 7 636 25 066 16 826 6 464 23 289 6 711 2 827 9 538 19 535 8 635 28 170
65–69 7 541 4 069 11 610 11 168 6 620 17 788 11 641 6 326 17 967 4 488 2 823 7 311 14 189 9 719 23 908
70–74 4 766 3 392 8 159 7 403 6 628 14 032 7 513 5 709 13 222 2 444 2 409 4 852 8 394 8 276 16 670
75–79 2 960 2 863 5 823 3 482 5 274 8 756 4 250 4 879 9 129 1 250 1 681 2 931 5 634 6 914 12 548
80–84 1 246 1 388 2 633 1 475 3 337 4 813 1 696 2 906 4 602 482 1 353 1 835 2 311 4 360 6 670
85+ 513 1 448 1 961 1 052 3 883 4 934 1 050 3 208 4 258 330 1 276 1 606 1 580 4 761 6 341
Total 393 204 39 135 432 339 710 399 75 991 786 390 670 932 62 901 733 832 301 618 26 452 328 070 1 153 789 112 326 1 266 116

STATISTICS SOUTH AFRICA 146 Report number 03-01-08
Provincial profile: Eastern Cape [Community Survey 2016], Report 03-01-08
Table 39b: Distribution of disability by district and age group: Eastern Cape, CS 2016
Age group
DC44 Alfred Nzo BUF Buffalo City NMA Nelson Mandela Bay Eastern Cape
Wit
ho
ut
dis
ab
ilit
y
Wit
h
dis
ab
ilit
y
To
tal
Wit
ho
ut
dis
ab
ilit
y
Wit
h
dis
ab
ilit
y
To
tal
Wit
ho
ut
dis
ab
ilit
y
Wit
h
dis
ab
ilit
y
To
tal
Wit
ho
ut
dis
ab
ilit
y
Wit
h
dis
ab
ilit
y
To
tal
5–9 111 757 5 629 117 386 89 253 3 096 92 348 130 284 2 633 132 918 815 269 32 770 848 040
10–14 107 748 3 274 111 022 78 909 2 208 81 118 125 480 2 417 127 897 773 039 22 023 795 062
15–19 116 139 3 121 119 260 65 852 1 197 67 049 93 038 2 159 95 197 768 306 20 962 789 267
20–24 89 356 2 923 92 279 71 795 1 482 73 276 109 423 1 517 110 939 680 488 19 014 699 502
25–29 70 892 3 435 74 326 77 606 1 688 79 294 101 366 2 189 103 555 602 023 21 421 623 444
30–34 51 551 3 337 54 888 66 587 1 979 68 566 90 946 2 613 93 559 488 145 23 110 511 255
35–39 25 880 2 359 28 239 55 605 1 562 57 167 81 271 2 652 83 923 306 294 16 610 322 904
40–44 21 390 3 052 24 442 46 732 2 917 49 649 73 726 4 326 78 052 269 652 22 211 291 863
45–49 16 778 4 064 20 842 41 861 3 246 45 106 65 245 5 503 70 748 235 296 29 714 265 010
50–54 14 437 4 935 19 371 33 242 4 745 37 987 54 387 7 798 62 185 198 039 39 770 237 809
55–59 13 618 6 527 20 144 27 931 6 075 34 006 49 055 9 109 58 164 181 860 49 760 231 620
60–64 11 158 7 282 18 440 19 461 5 678 25 139 35 080 10 648 45 728 137 510 53 311 190 821
65–69 9 935 8 155 18 090 8 634 4 336 12 970 23 297 8 363 31 660 90 894 50 412 141 306
70–74 5 737 7 591 13 327 5 473 4 227 9 700 13 099 7 340 20 439 54 830 45 572 100 402
75–79 2 971 4 839 7 810 3 010 3 352 6 362 5 872 6 048 11 920 29 429 35 850 65 280
80–84 1 348 4 218 5 566 869 1 876 2 745 2 436 3 475 5 912 11 862 22 914 34 776
85+ 892 4 312 5 204 614 1 693 2 307 1 141 2 946 4 087 7 172 23 527 30 700
Total 671 586 79 053 750 638 693 435 51 356 744 791 1 055 147 81 738 1 136 884 5 650 109 528 951 6 179 061