Procurement Cost Savings Report - Welcome to …€¦ · PROCUREMENT SAVINGS REPORT ... Simplified...
36
Transcript of Procurement Cost Savings Report - Welcome to …€¦ · PROCUREMENT SAVINGS REPORT ... Simplified...
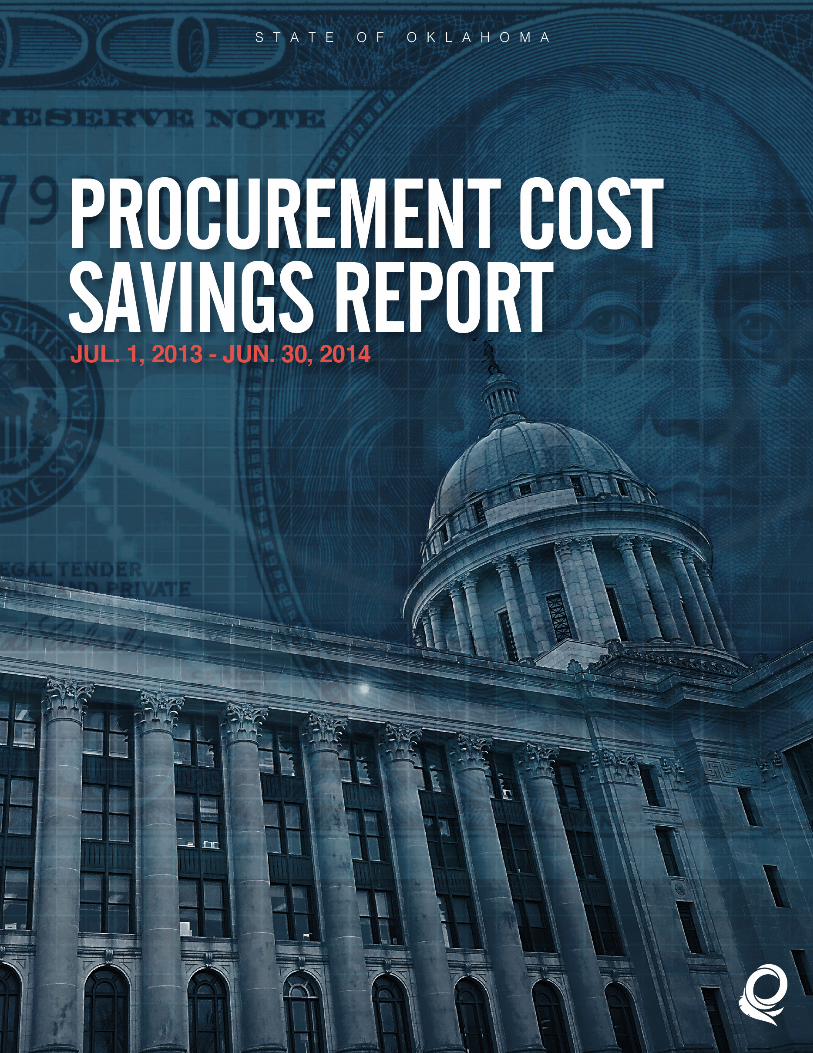
PROCUREMENT SAVINGS REPORT | JUL 1, 2013 - JUN 30, 2014 PROCUREMENT SAVINGS REPORT | JUL 1, 2013 - JUN 30, 2014
This publication is issued by the Office of Management and Enterprise Services as authorized by Title 62, Section 34. Copies have not been printed but are available through the agency website. This work is licensed under a Creative Attribution-NonCommercial-NoDerivs 3.0 Unported License.
PROCUREMENT SAVINGS REPORT | JUL 1, 2013 - JUN 30, 2014
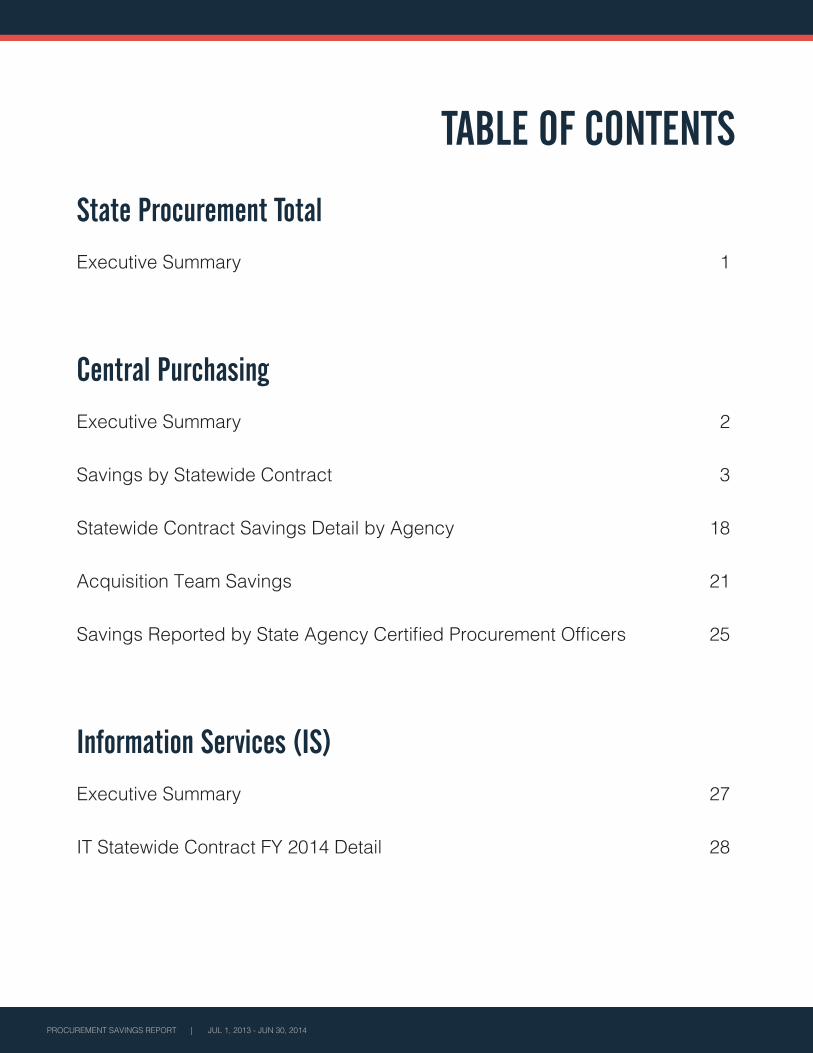
TABLE OF CONTENTS
State Procurement TotalExecutive Summary 1
Central PurchasingExecutive Summary 2
Savings by Statewide Contract 3
Statewide Contract Savings Detail by Agency 18
Acquisition Team Savings 21
Savings Reported by State Agency Certified Procurement Officers 25
Information Services (IS)Executive Summary 27
IT Statewide Contract FY 2014 Detail 28
PROCUREMENT SAVINGS REPORT | JUL 1, 2013 - JUN 30, 2014
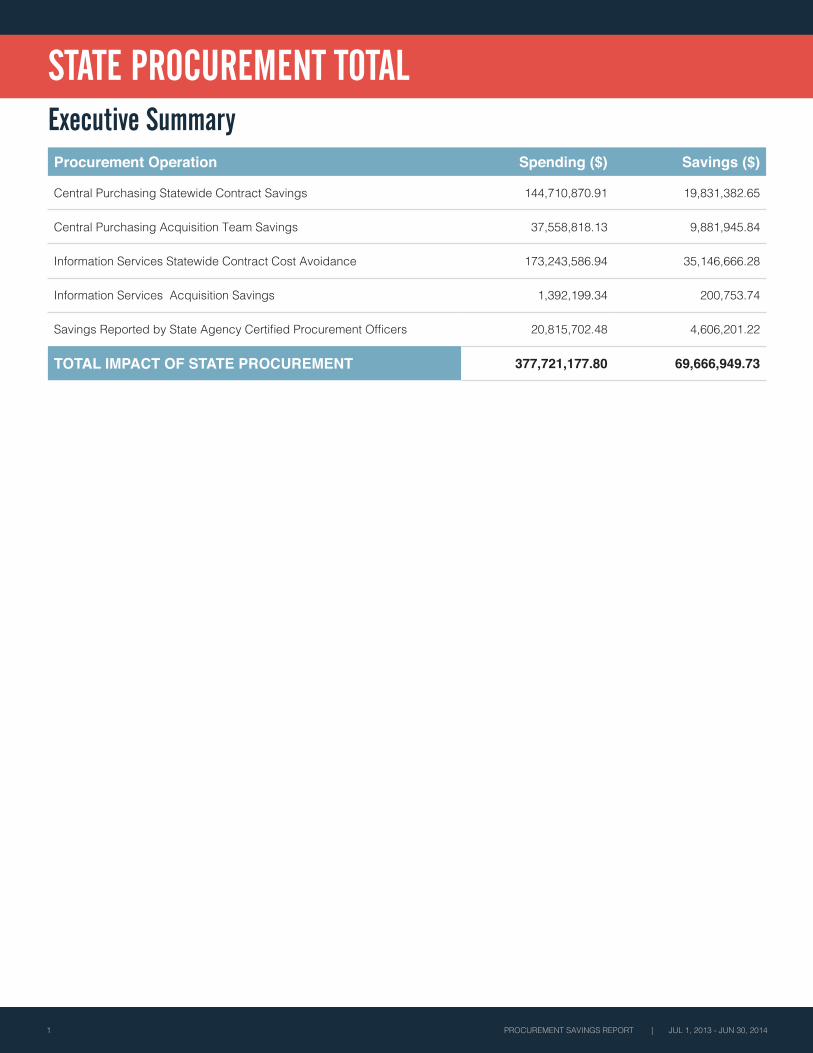
STATE PROCUREMENT TOTALExecutive SummaryProcurement Operation Spending ($) Savings ($)
Central Purchasing Statewide Contract Savings 144,710,870.91 19,831,382.65
Central Purchasing Acquisition Team Savings 37,558,818.13 9,881,945.84
Information Services Statewide Contract Cost Avoidance 173,243,586.94 35,146,666.28
Information Services Acquisition Savings 1,392,199.34 200,753.74
Savings Reported by State Agency Certified Procurement Officers 20,815,702.48 4,606,201.22
TOTAL IMPACT OF STATE PROCUREMENT 377,721,177.80 69,666,949.73
1
PROCUREMENT SAVINGS REPORT | JUL 1, 2013 - JUN 30, 2014
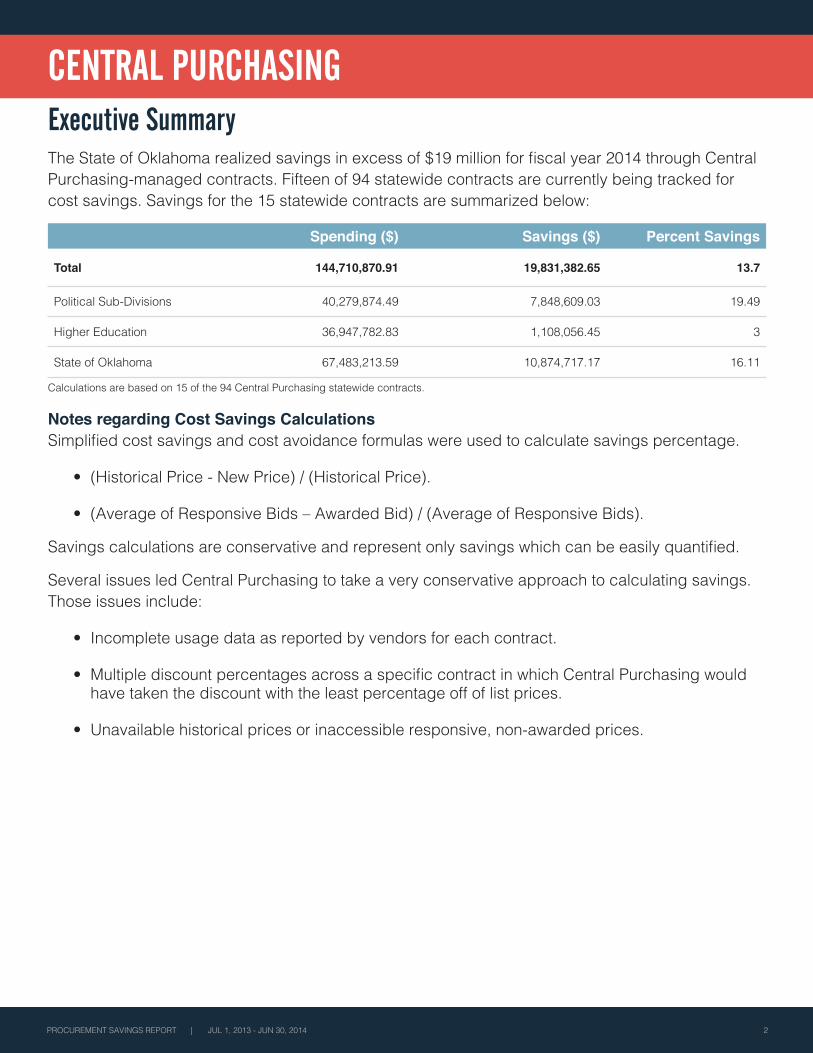
CENTRAL PURCHASINGExecutive SummaryThe State of Oklahoma realized savings in excess of $19 million for fiscal year 2014 through Central Purchasing-managed contracts. Fifteen of 94 statewide contracts are currently being tracked for cost savings. Savings for the 15 statewide contracts are summarized below:
Spending ($) Savings ($) Percent Savings
Total 144,710,870.91 19,831,382.65 13.7
Political Sub-Divisions 40,279,874.49 7,848,609.03 19.49
Higher Education 36,947,782.83 1,108,056.45 3
State of Oklahoma 67,483,213.59 10,874,717.17 16.11
Calculations are based on 15 of the 94 Central Purchasing statewide contracts.
Notes regarding Cost Savings CalculationsSimplified cost savings and cost avoidance formulas were used to calculate savings percentage.
• (Historical Price - New Price) / (Historical Price).
• (Average of Responsive Bids – Awarded Bid) / (Average of Responsive Bids).
Savings calculations are conservative and represent only savings which can be easily quantified.
Several issues led Central Purchasing to take a very conservative approach to calculating savings. Those issues include:
• Incomplete usage data as reported by vendors for each contract.
• Multiple discount percentages across a specific contract in which Central Purchasing would have taken the discount with the least percentage off of list prices.
• Unavailable historical prices or inaccessible responsive, non-awarded prices.
2
3 PROCUREMENT SAVINGS REPORT | JUL 1, 2013 - JUN 30, 2014
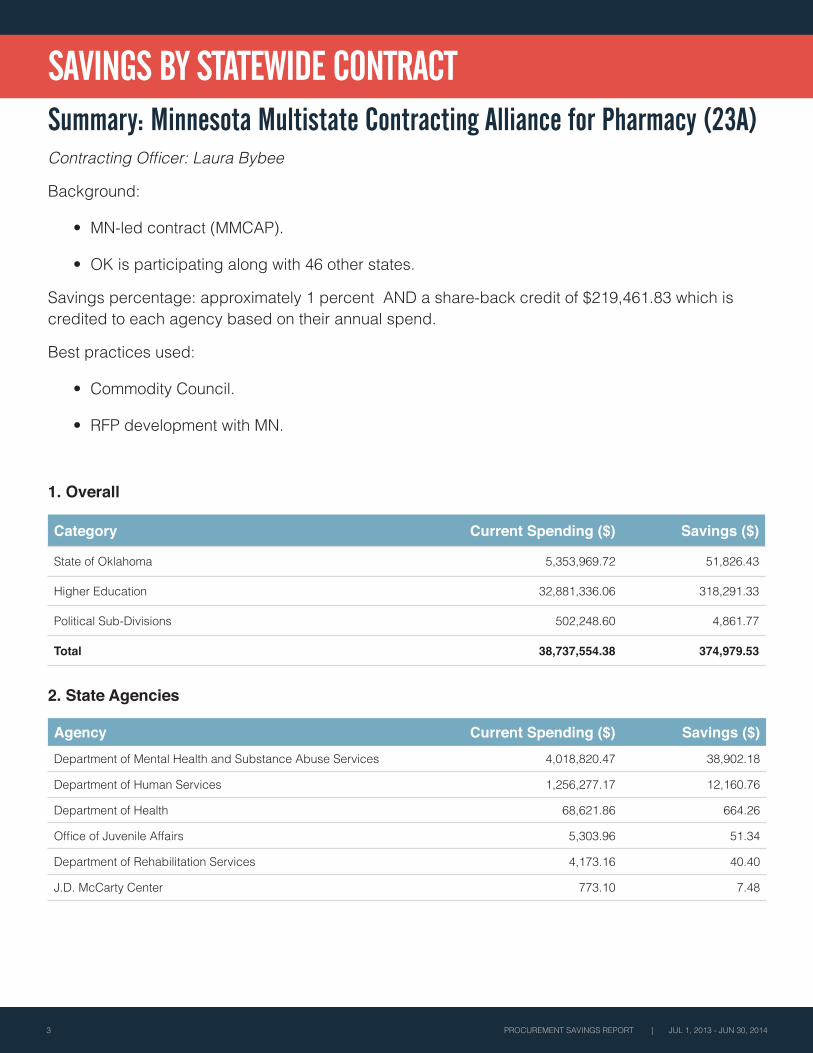
SAVINGS BY STATEWIDE CONTRACTSummary: Minnesota Multistate Contracting Alliance for Pharmacy (23A)Contracting Officer: Laura Bybee
Background:
• MN-led contract (MMCAP).
• OK is participating along with 46 other states.
Savings percentage: approximately 1 percent AND a share-back credit of $219,461.83 which is credited to each agency based on their annual spend.
Best practices used:
• Commodity Council.
• RFP development with MN.
1. Overall
Category Current Spending ($) Savings ($)
State of Oklahoma 5,353,969.72 51,826.43
Higher Education 32,881,336.06 318,291.33
Political Sub-Divisions 502,248.60 4,861.77
Total 38,737,554.38 374,979.53
2. State Agencies
Agency Current Spending ($) Savings ($)Department of Mental Health and Substance Abuse Services 4,018,820.47 38,902.18
Department of Human Services 1,256,277.17 12,160.76
Department of Health 68,621.86 664.26
Office of Juvenile Affairs 5,303.96 51.34
Department of Rehabilitation Services 4,173.16 40.40
J.D. McCarty Center 773.10 7.48
PROCUREMENT SAVINGS REPORT | JUL 1, 2013 - JUN 30, 2014
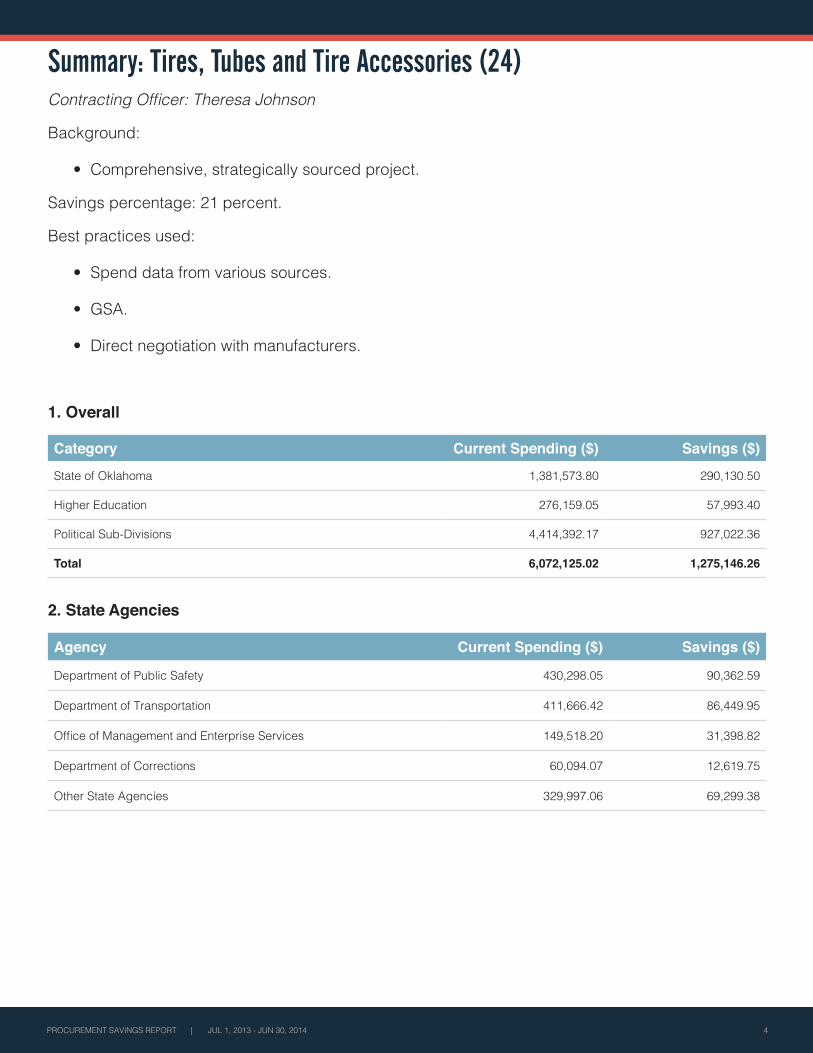
Summary: Tires, Tubes and Tire Accessories (24)Contracting Officer: Theresa Johnson
Background:
• Comprehensive, strategically sourced project.
Savings percentage: 21 percent.
Best practices used:
• Spend data from various sources.
• GSA.
• Direct negotiation with manufacturers.
1. Overall
Category Current Spending ($) Savings ($)
State of Oklahoma 1,381,573.80 290,130.50
Higher Education 276,159.05 57,993.40
Political Sub-Divisions 4,414,392.17 927,022.36
Total 6,072,125.02 1,275,146.26
2. State Agencies
Agency Current Spending ($) Savings ($)
Department of Public Safety 430,298.05 90,362.59
Department of Transportation 411,666.42 86,449.95
Office of Management and Enterprise Services 149,518.20 31,398.82
Department of Corrections 60,094.07 12,619.75
Other State Agencies 329,997.06 69,299.38
4
PROCUREMENT SAVINGS REPORT | JUL 1, 2013 - JUN 30, 2014
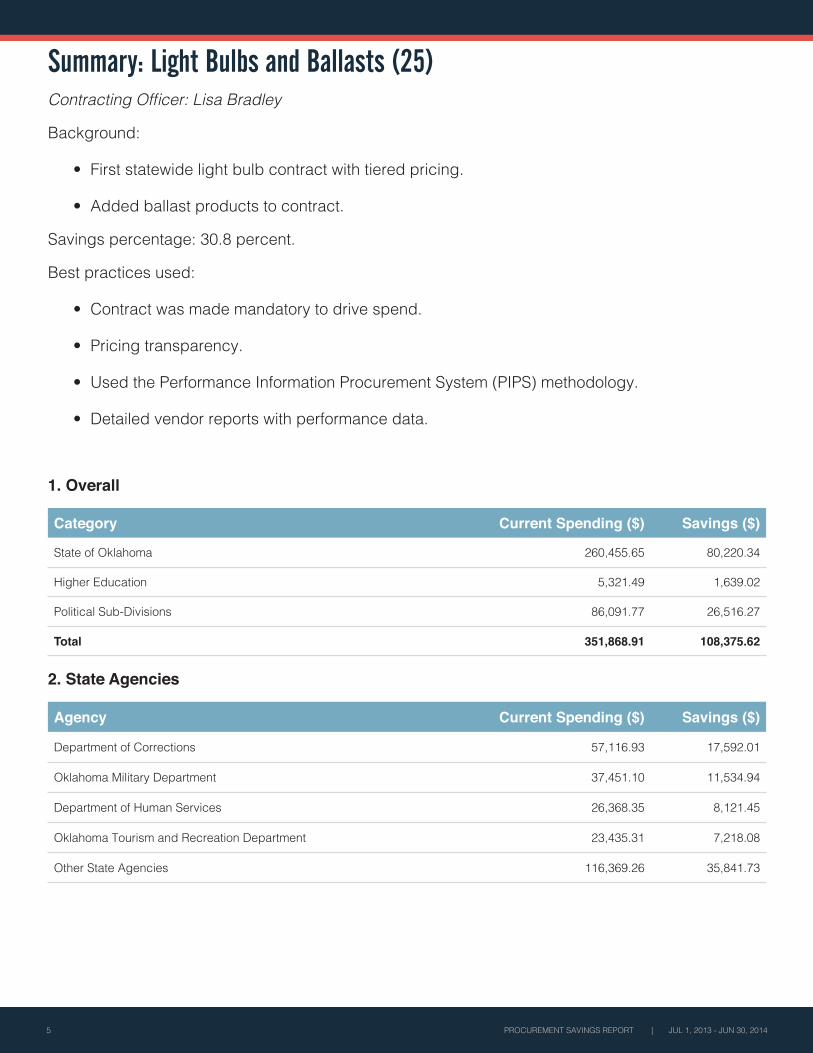
Summary: Light Bulbs and Ballasts (25)Contracting Officer: Lisa Bradley
Background:
• First statewide light bulb contract with tiered pricing.
• Added ballast products to contract.
Savings percentage: 30.8 percent.
Best practices used:
• Contract was made mandatory to drive spend.
• Pricing transparency.
• Used the Performance Information Procurement System (PIPS) methodology.
• Detailed vendor reports with performance data.
1. Overall
Category Current Spending ($) Savings ($)
State of Oklahoma 260,455.65 80,220.34
Higher Education 5,321.49 1,639.02
Political Sub-Divisions 86,091.77 26,516.27
Total 351,868.91 108,375.62
2. State Agencies
Agency Current Spending ($) Savings ($)
Department of Corrections 57,116.93 17,592.01
Oklahoma Military Department 37,451.10 11,534.94
Department of Human Services 26,368.35 8,121.45
Oklahoma Tourism and Recreation Department 23,435.31 7,218.08
Other State Agencies 116,369.26 35,841.73
5
PROCUREMENT SAVINGS REPORT | JUL 1, 2013 - JUN 30, 2014
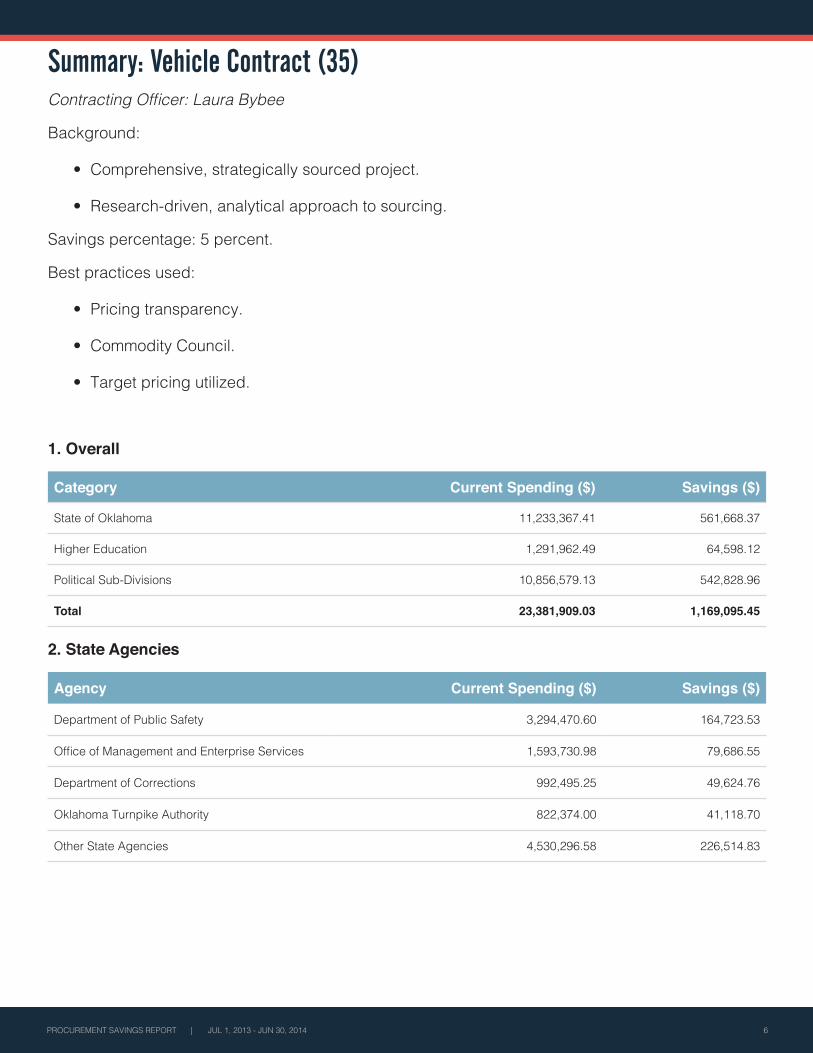
Summary: Vehicle Contract (35)Contracting Officer: Laura Bybee
Background:
• Comprehensive, strategically sourced project.
• Research-driven, analytical approach to sourcing.
Savings percentage: 5 percent.
Best practices used:
• Pricing transparency.
• Commodity Council.
• Target pricing utilized.
1. Overall
Category Current Spending ($) Savings ($)
State of Oklahoma 11,233,367.41 561,668.37
Higher Education 1,291,962.49 64,598.12
Political Sub-Divisions 10,856,579.13 542,828.96
Total 23,381,909.03 1,169,095.45
2. State Agencies
Agency Current Spending ($) Savings ($)
Department of Public Safety 3,294,470.60 164,723.53
Office of Management and Enterprise Services 1,593,730.98 79,686.55
Department of Corrections 992,495.25 49,624.76
Oklahoma Turnpike Authority 822,374.00 41,118.70
Other State Agencies 4,530,296.58 226,514.83
6
PROCUREMENT SAVINGS REPORT | JUL 1, 2013 - JUN 30, 2014
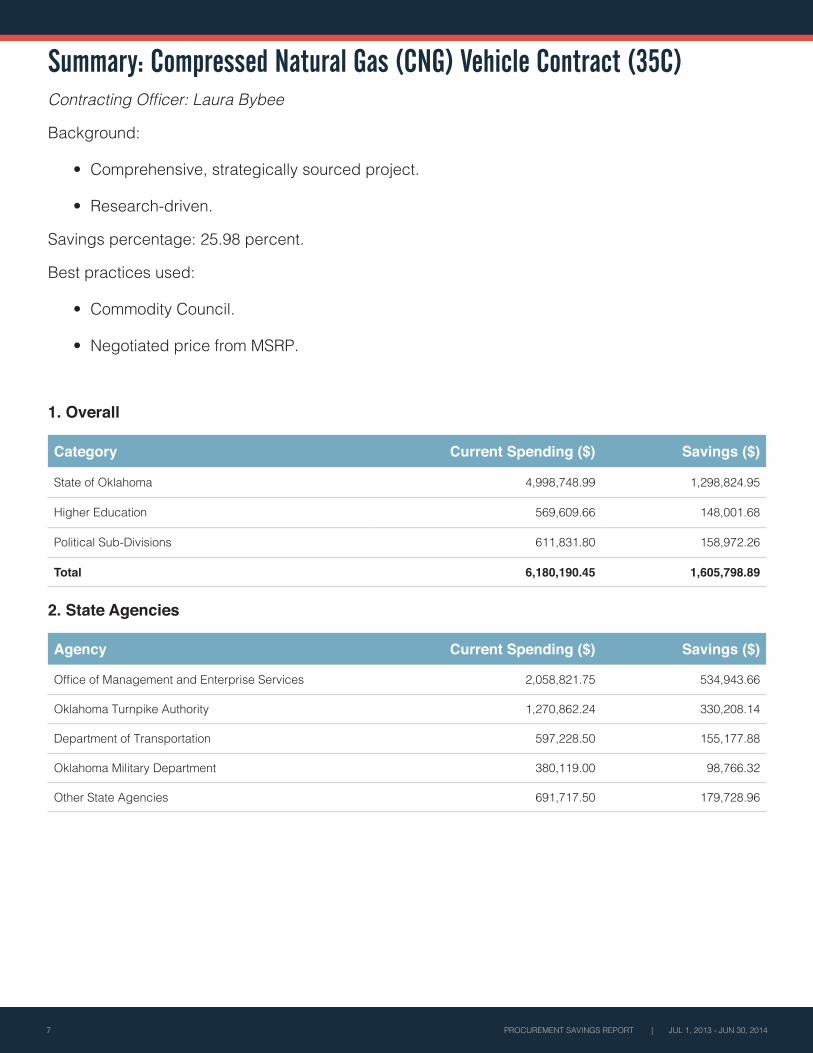
Summary: Compressed Natural Gas (CNG) Vehicle Contract (35C)Contracting Officer: Laura Bybee
Background:
• Comprehensive, strategically sourced project.
• Research-driven.
Savings percentage: 25.98 percent.
Best practices used:
• Commodity Council.
• Negotiated price from MSRP.
1. Overall
Category Current Spending ($) Savings ($)
State of Oklahoma 4,998,748.99 1,298,824.95
Higher Education 569,609.66 148,001.68
Political Sub-Divisions 611,831.80 158,972.26
Total 6,180,190.45 1,605,798.89
2. State Agencies
Agency Current Spending ($) Savings ($)
Office of Management and Enterprise Services 2,058,821.75 534,943.66
Oklahoma Turnpike Authority 1,270,862.24 330,208.14
Department of Transportation 597,228.50 155,177.88
Oklahoma Military Department 380,119.00 98,766.32
Other State Agencies 691,717.50 179,728.96
7
PROCUREMENT SAVINGS REPORT | JUL 1, 2013 - JUN 30, 2014
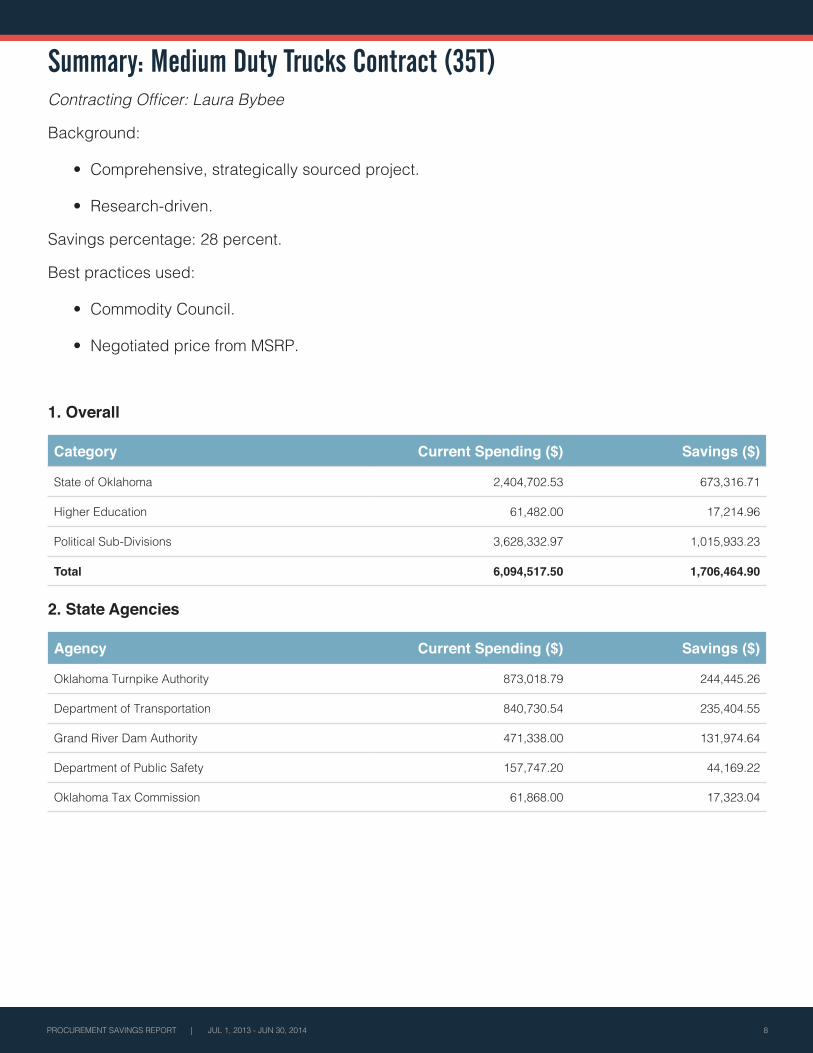
Summary: Medium Duty Trucks Contract (35T)Contracting Officer: Laura Bybee
Background:
• Comprehensive, strategically sourced project.
• Research-driven.
Savings percentage: 28 percent.
Best practices used:
• Commodity Council.
• Negotiated price from MSRP.
1. Overall
Category Current Spending ($) Savings ($)
State of Oklahoma 2,404,702.53 673,316.71
Higher Education 61,482.00 17,214.96
Political Sub-Divisions 3,628,332.97 1,015,933.23
Total 6,094,517.50 1,706,464.90
2. State Agencies
Agency Current Spending ($) Savings ($)
Oklahoma Turnpike Authority 873,018.79 244,445.26
Department of Transportation 840,730.54 235,404.55
Grand River Dam Authority 471,338.00 131,974.64
Department of Public Safety 157,747.20 44,169.22
Oklahoma Tax Commission 61,868.00 17,323.04
8
9 PROCUREMENT SAVINGS REPORT | JUL 1, 2013 - JUN 30, 2014
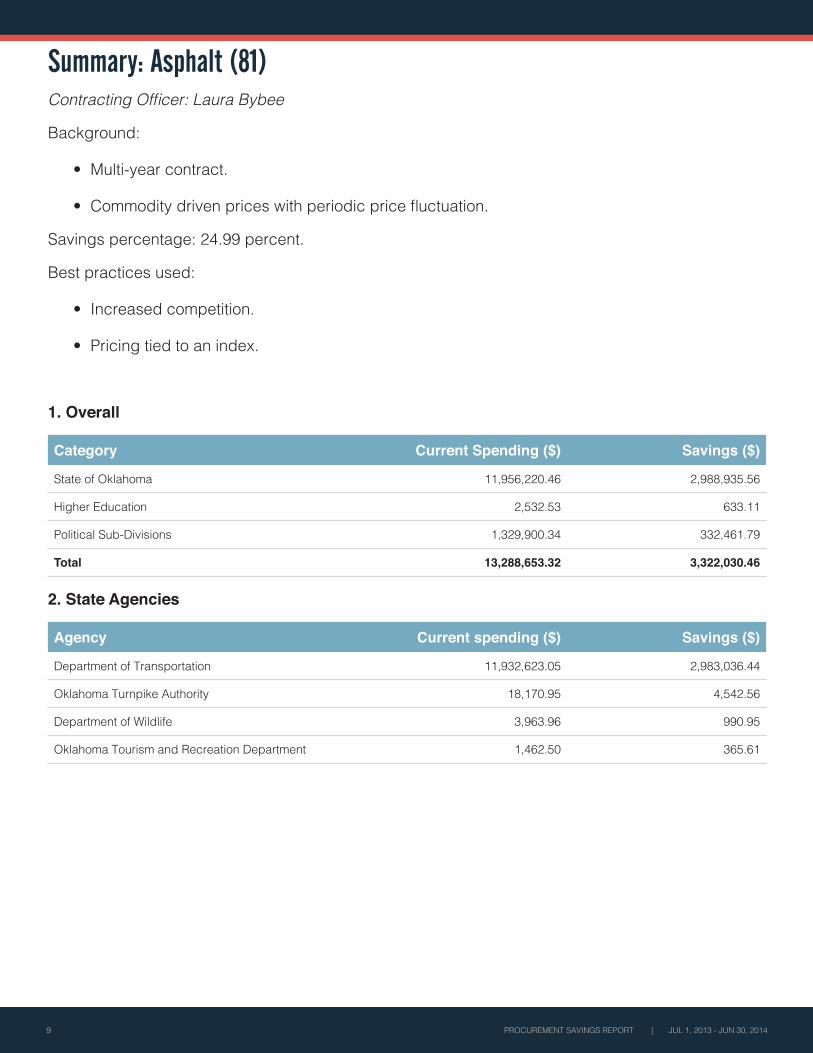
Summary: Asphalt (81)Contracting Officer: Laura Bybee
Background:
• Multi-year contract.
• Commodity driven prices with periodic price fluctuation.
Savings percentage: 24.99 percent.
Best practices used:
• Increased competition.
• Pricing tied to an index.
1. Overall
Category Current Spending ($) Savings ($)
State of Oklahoma 11,956,220.46 2,988,935.56
Higher Education 2,532.53 633.11
Political Sub-Divisions 1,329,900.34 332,461.79
Total 13,288,653.32 3,322,030.46
2. State Agencies
Agency Current spending ($) Savings ($)
Department of Transportation 11,932,623.05 2,983,036.44
Oklahoma Turnpike Authority 18,170.95 4,542.56
Department of Wildlife 3,963.96 990.95
Oklahoma Tourism and Recreation Department 1,462.50 365.61
PROCUREMENT SAVINGS REPORT | JUL 1, 2013 - JUN 30, 2014 10
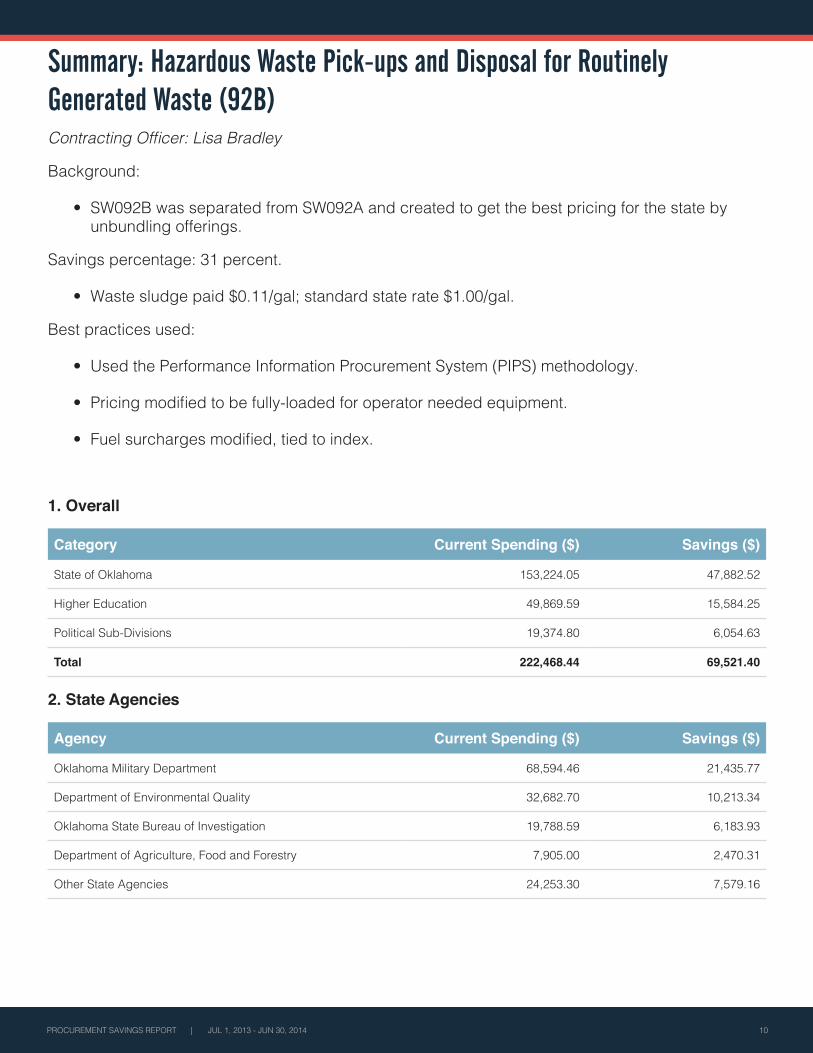
Summary: Hazardous Waste Pick-ups and Disposal for Routinely Generated Waste (92B)Contracting Officer: Lisa Bradley
Background:
• SW092B was separated from SW092A and created to get the best pricing for the state by unbundling offerings.
Savings percentage: 31 percent.
• Waste sludge paid $0.11/gal; standard state rate $1.00/gal.
Best practices used:
• Used the Performance Information Procurement System (PIPS) methodology.
• Pricing modified to be fully-loaded for operator needed equipment.
• Fuel surcharges modified, tied to index.
1. Overall
Category Current Spending ($) Savings ($)
State of Oklahoma 153,224.05 47,882.52
Higher Education 49,869.59 15,584.25
Political Sub-Divisions 19,374.80 6,054.63
Total 222,468.44 69,521.40
2. State Agencies
Agency Current Spending ($) Savings ($)
Oklahoma Military Department 68,594.46 21,435.77
Department of Environmental Quality 32,682.70 10,213.34
Oklahoma State Bureau of Investigation 19,788.59 6,183.93
Department of Agriculture, Food and Forestry 7,905.00 2,470.31
Other State Agencies 24,253.30 7,579.16
11 PROCUREMENT SAVINGS REPORT | JUL 1, 2013 - JUN 30, 2014
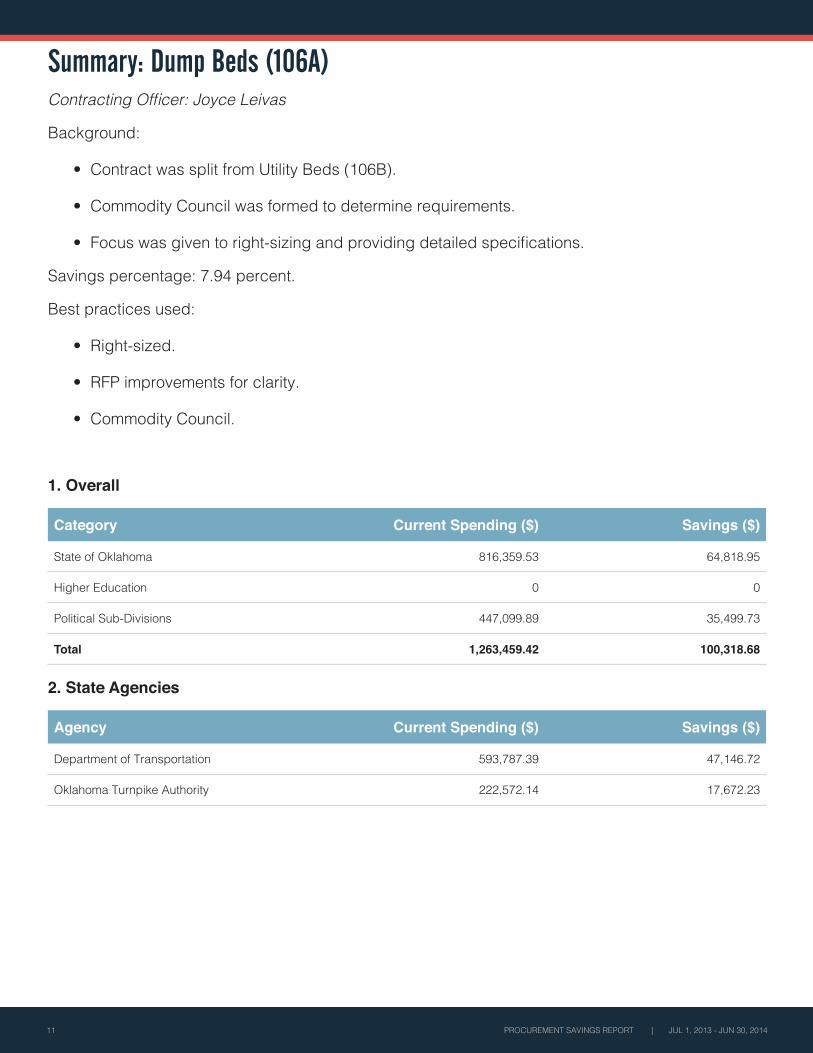
Summary: Dump Beds (106A)Contracting Officer: Joyce Leivas
Background:
• Contract was split from Utility Beds (106B).
• Commodity Council was formed to determine requirements.
• Focus was given to right-sizing and providing detailed specifications.
Savings percentage: 7.94 percent.
Best practices used:
• Right-sized.
• RFP improvements for clarity.
• Commodity Council.
1. Overall
Category Current Spending ($) Savings ($)
State of Oklahoma 816,359.53 64,818.95
Higher Education 0 0
Political Sub-Divisions 447,099.89 35,499.73
Total 1,263,459.42 100,318.68
2. State Agencies
Agency Current Spending ($) Savings ($)
Department of Transportation 593,787.39 47,146.72
Oklahoma Turnpike Authority 222,572.14 17,672.23
PROCUREMENT SAVINGS REPORT | JUL 1, 2013 - JUN 30, 2014 12
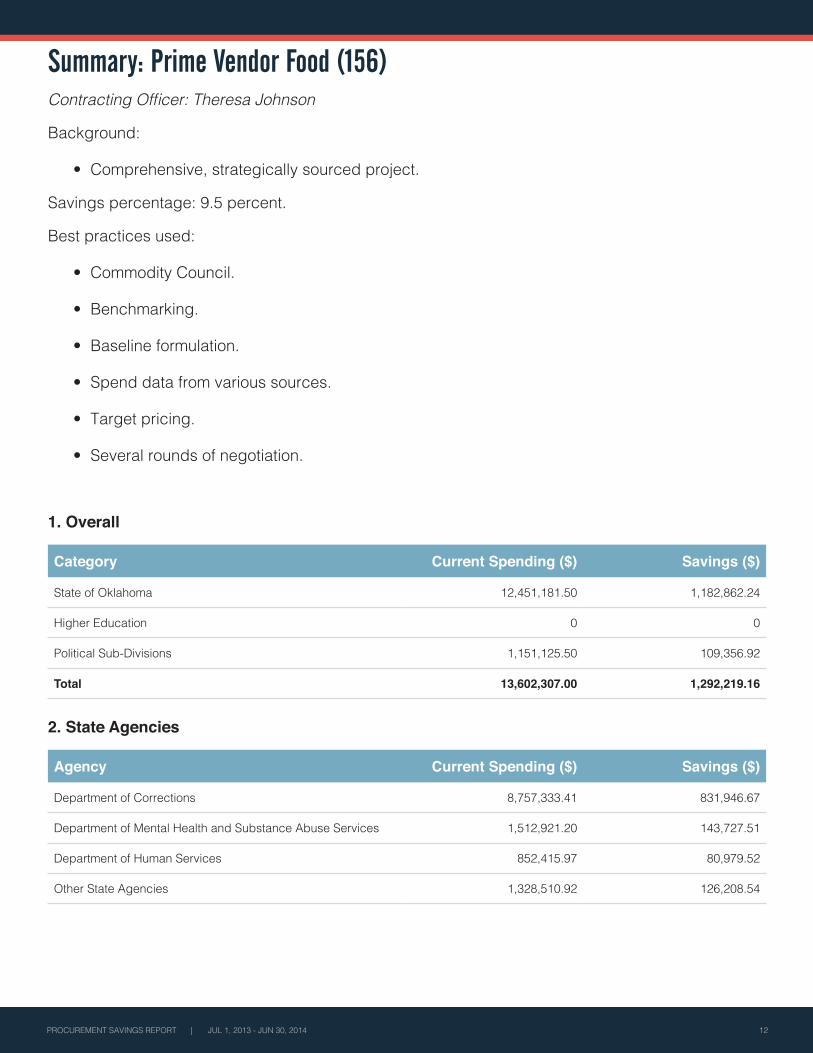
Summary: Prime Vendor Food (156)Contracting Officer: Theresa Johnson
Background:
• Comprehensive, strategically sourced project.
Savings percentage: 9.5 percent.
Best practices used:
• Commodity Council.
• Benchmarking.
• Baseline formulation.
• Spend data from various sources.
• Target pricing.
• Several rounds of negotiation.
1. Overall
Category Current Spending ($) Savings ($)
State of Oklahoma 12,451,181.50 1,182,862.24
Higher Education 0 0
Political Sub-Divisions 1,151,125.50 109,356.92
Total 13,602,307.00 1,292,219.16
2. State Agencies
Agency Current Spending ($) Savings ($)
Department of Corrections 8,757,333.41 831,946.67
Department of Mental Health and Substance Abuse Services 1,512,921.20 143,727.51
Department of Human Services 852,415.97 80,979.52
Other State Agencies 1,328,510.92 126,208.54
13 PROCUREMENT SAVINGS REPORT | JUL 1, 2013 - JUN 30, 2014
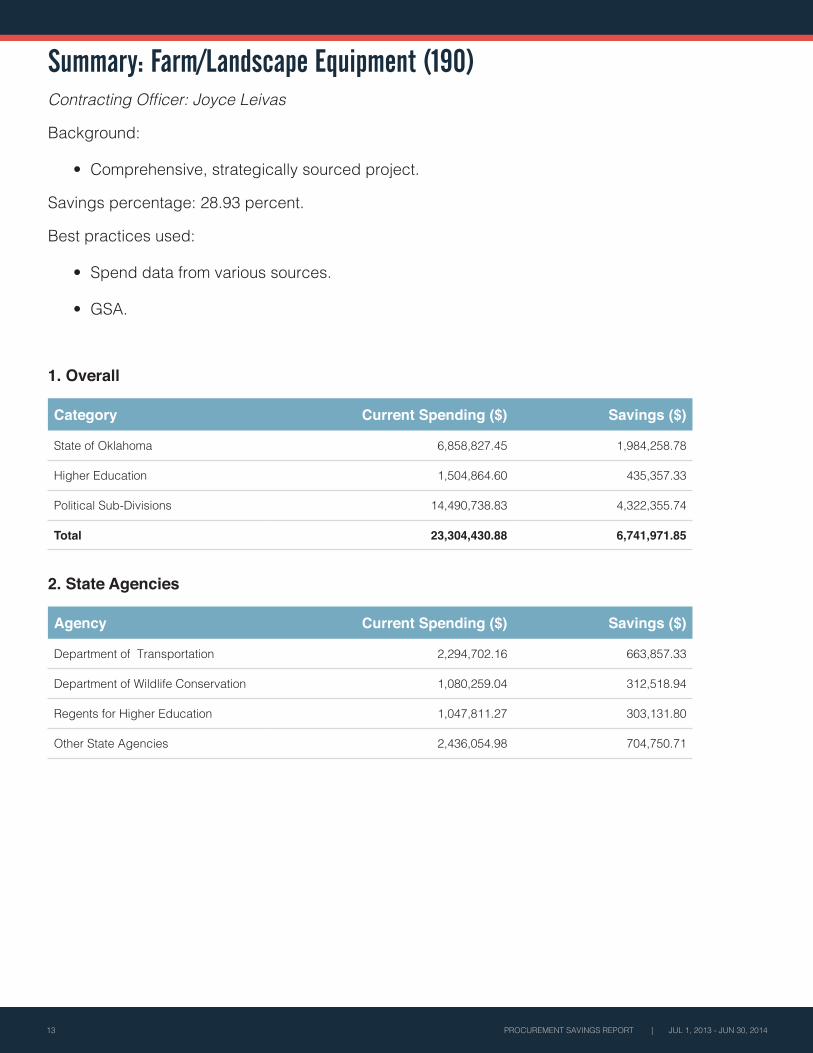
Summary: Farm/Landscape Equipment (190)Contracting Officer: Joyce Leivas
Background:
• Comprehensive, strategically sourced project.
Savings percentage: 28.93 percent.
Best practices used:
• Spend data from various sources.
• GSA.
1. Overall
Category Current Spending ($) Savings ($)
State of Oklahoma 6,858,827.45 1,984,258.78
Higher Education 1,504,864.60 435,357.33
Political Sub-Divisions 14,490,738.83 4,322,355.74
Total 23,304,430.88 6,741,971.85
2. State Agencies
Agency Current Spending ($) Savings ($)
Department of Transportation 2,294,702.16 663,857.33
Department of Wildlife Conservation 1,080,259.04 312,518.94
Regents for Higher Education 1,047,811.27 303,131.80
Other State Agencies 2,436,054.98 704,750.71
PROCUREMENT SAVINGS REPORT | JUL 1, 2013 - JUN 30, 2014 14
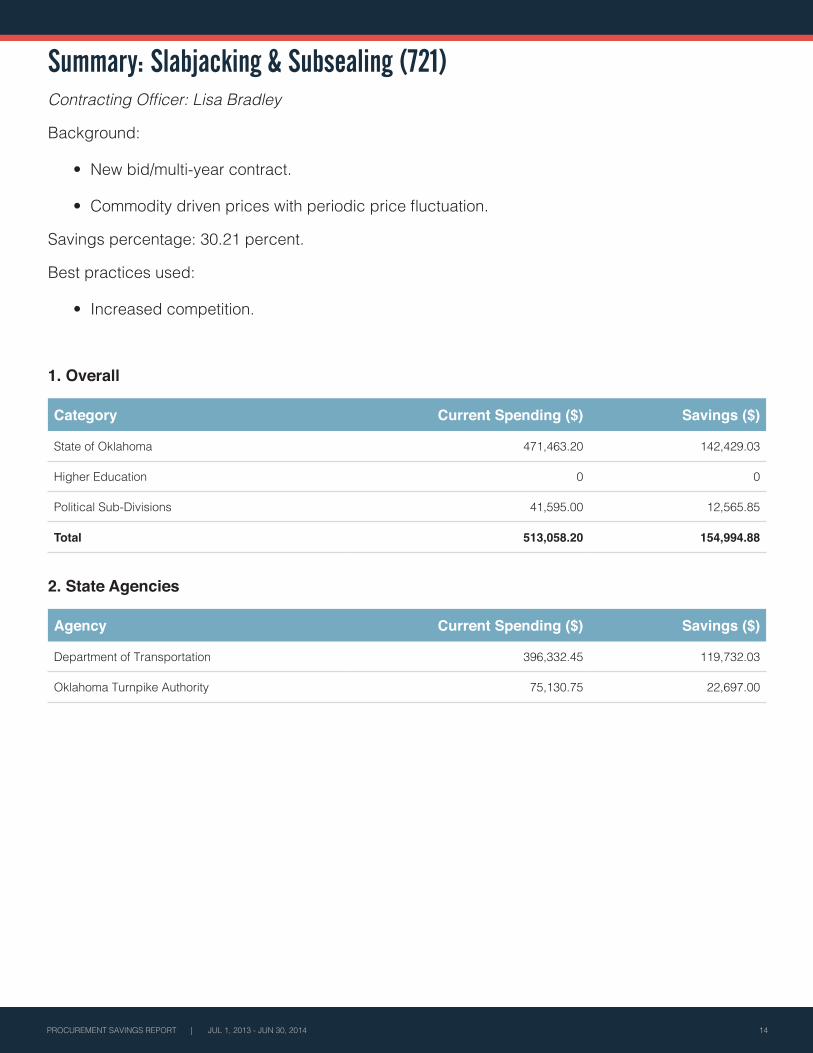
Summary: Slabjacking & Subsealing (721)Contracting Officer: Lisa Bradley
Background:
• New bid/multi-year contract.
• Commodity driven prices with periodic price fluctuation.
Savings percentage: 30.21 percent.
Best practices used:
• Increased competition.
1. Overall
Category Current Spending ($) Savings ($)
State of Oklahoma 471,463.20 142,429.03
Higher Education 0 0
Political Sub-Divisions 41,595.00 12,565.85
Total 513,058.20 154,994.88
2. State Agencies
Agency Current Spending ($) Savings ($)
Department of Transportation 396,332.45 119,732.03
Oklahoma Turnpike Authority 75,130.75 22,697.00
15 PROCUREMENT SAVINGS REPORT | JUL 1, 2013 - JUN 30, 2014
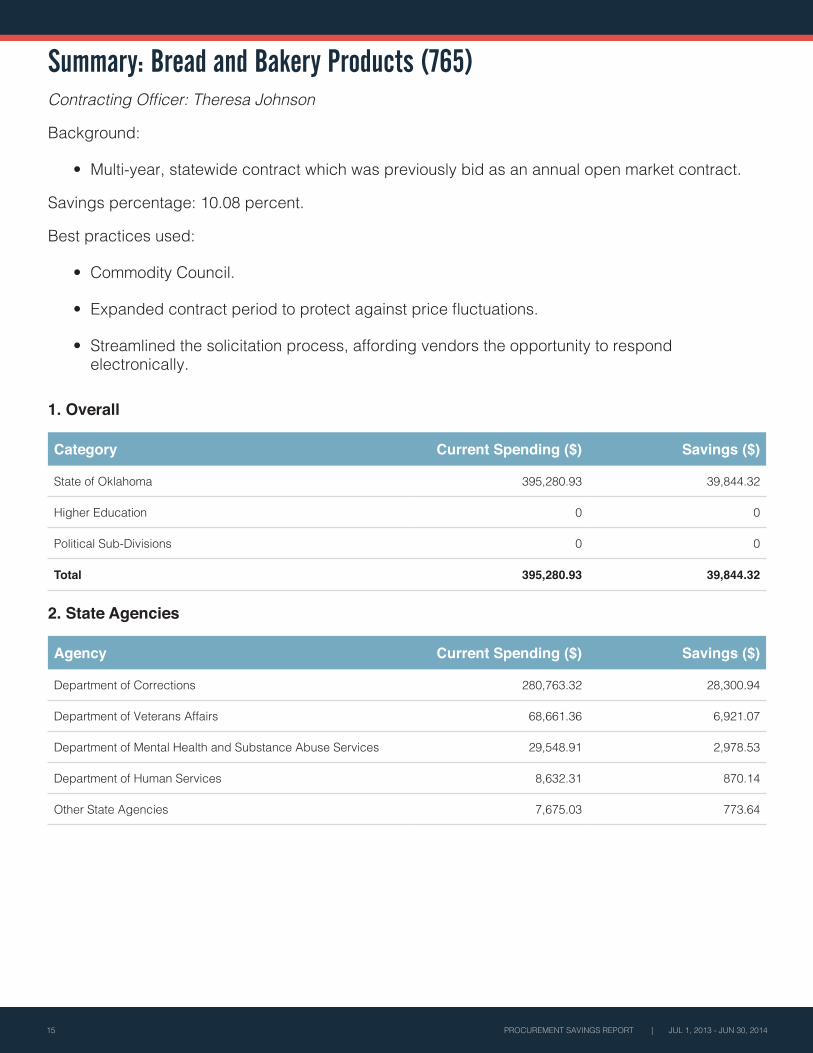
Summary: Bread and Bakery Products (765)Contracting Officer: Theresa Johnson
Background:
• Multi-year, statewide contract which was previously bid as an annual open market contract.
Savings percentage: 10.08 percent.
Best practices used:
• Commodity Council.
• Expanded contract period to protect against price fluctuations.
• Streamlined the solicitation process, affording vendors the opportunity to respond electronically.
1. Overall
Category Current Spending ($) Savings ($)
State of Oklahoma 395,280.93 39,844.32
Higher Education 0 0
Political Sub-Divisions 0 0
Total 395,280.93 39,844.32
2. State Agencies
Agency Current Spending ($) Savings ($)
Department of Corrections 280,763.32 28,300.94
Department of Veterans Affairs 68,661.36 6,921.07
Department of Mental Health and Substance Abuse Services 29,548.91 2,978.53
Department of Human Services 8,632.31 870.14
Other State Agencies 7,675.03 773.64
PROCUREMENT SAVINGS REPORT | JUL 1, 2013 - JUN 30, 2014 16
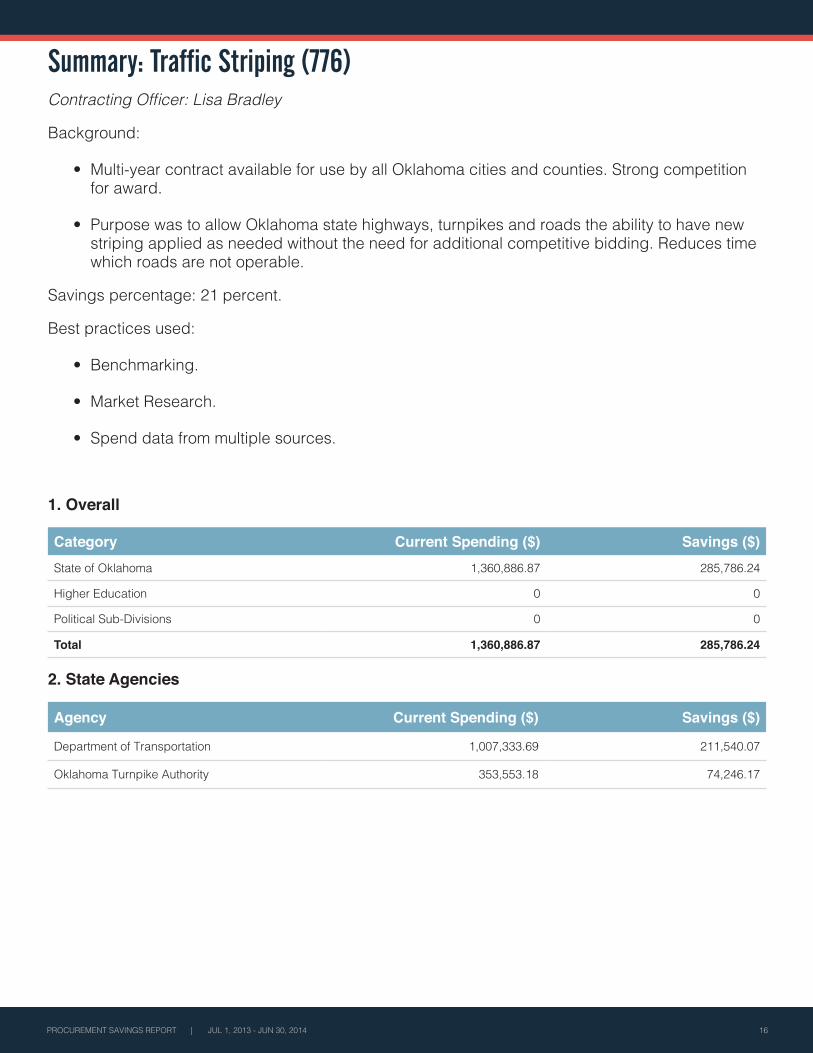
Summary: Traffic Striping (776)Contracting Officer: Lisa Bradley
Background:
• Multi-year contract available for use by all Oklahoma cities and counties. Strong competition for award.
• Purpose was to allow Oklahoma state highways, turnpikes and roads the ability to have new striping applied as needed without the need for additional competitive bidding. Reduces time which roads are not operable.
Savings percentage: 21 percent.
Best practices used:
• Benchmarking.
• Market Research.
• Spend data from multiple sources.
1. Overall
Category Current Spending ($) Savings ($)State of Oklahoma 1,360,886.87 285,786.24
Higher Education 0 0
Political Sub-Divisions 0 0
Total 1,360,886.87 285,786.24
2. State Agencies
Agency Current Spending ($) Savings ($)
Department of Transportation 1,007,333.69 211,540.07
Oklahoma Turnpike Authority 353,553.18 74,246.17
17 PROCUREMENT SAVINGS REPORT | JUL 1, 2013 - JUN 30, 2014
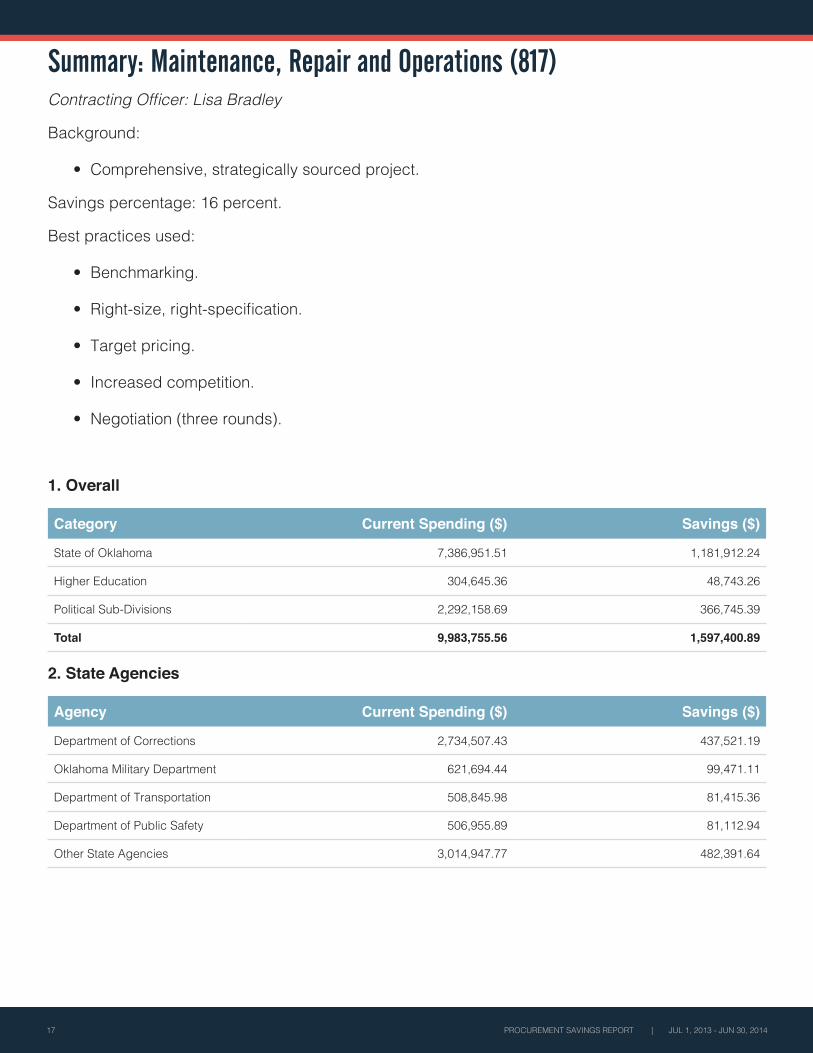
Summary: Maintenance, Repair and Operations (817)Contracting Officer: Lisa Bradley
Background:
• Comprehensive, strategically sourced project.
Savings percentage: 16 percent.
Best practices used:
• Benchmarking.
• Right-size, right-specification.
• Target pricing.
• Increased competition.
• Negotiation (three rounds).
1. Overall
Category Current Spending ($) Savings ($)
State of Oklahoma 7,386,951.51 1,181,912.24
Higher Education 304,645.36 48,743.26
Political Sub-Divisions 2,292,158.69 366,745.39
Total 9,983,755.56 1,597,400.89
2. State Agencies
Agency Current Spending ($) Savings ($)
Department of Corrections 2,734,507.43 437,521.19
Oklahoma Military Department 621,694.44 99,471.11
Department of Transportation 508,845.98 81,415.36
Department of Public Safety 506,955.89 81,112.94
Other State Agencies 3,014,947.77 482,391.64
PROCUREMENT SAVINGS REPORT | JUL 1, 2013 - JUN 30, 2014 18
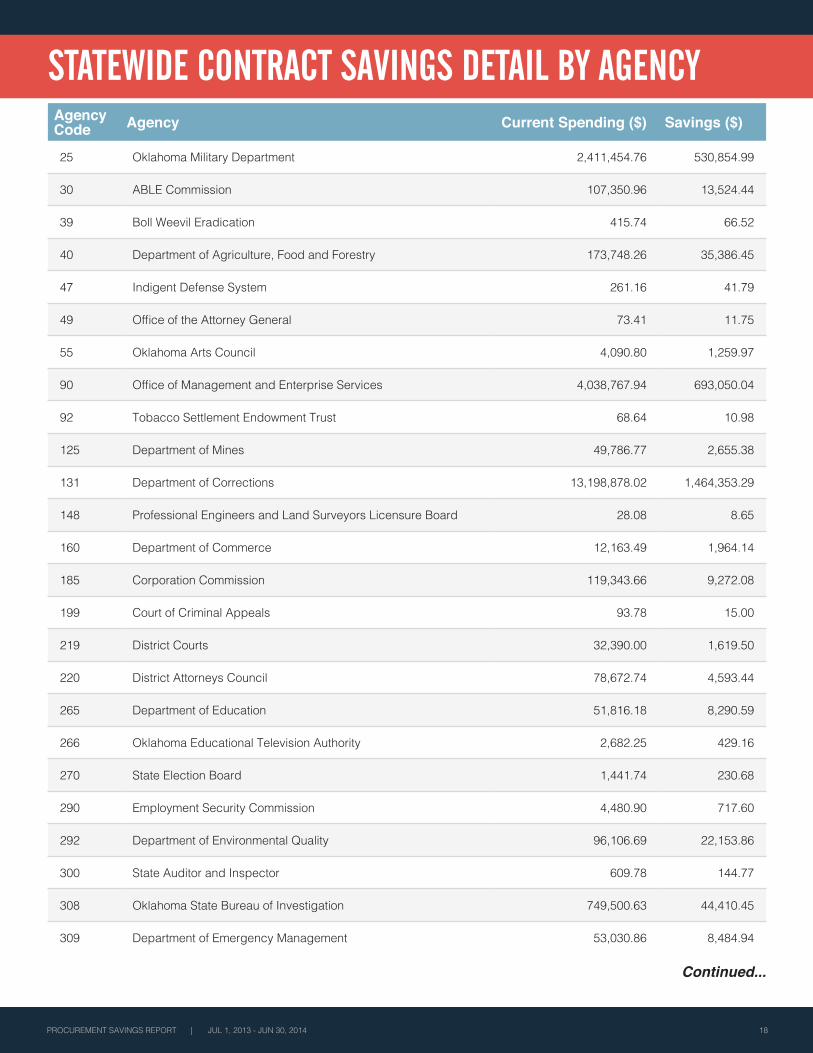
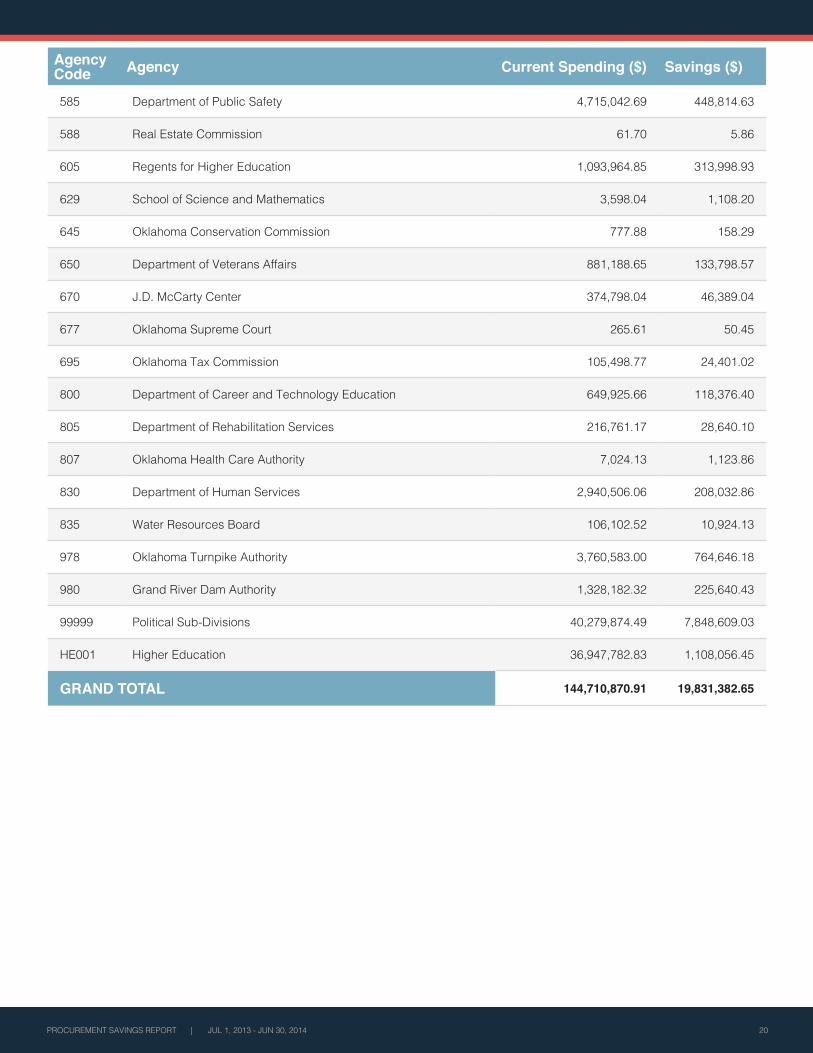
STATEWIDE CONTRACT SAVINGS DETAIL BY AGENCYAgency Code Agency Current Spending ($) Savings ($)
25 Oklahoma Military Department 2,411,454.76 530,854.99
30 ABLE Commission 107,350.96 13,524.44
39 Boll Weevil Eradication 415.74 66.52
40 Department of Agriculture, Food and Forestry 173,748.26 35,386.45
47 Indigent Defense System 261.16 41.79
49 Office of the Attorney General 73.41 11.75
55 Oklahoma Arts Council 4,090.80 1,259.97
90 Office of Management and Enterprise Services 4,038,767.94 693,050.04
92 Tobacco Settlement Endowment Trust 68.64 10.98
125 Department of Mines 49,786.77 2,655.38
131 Department of Corrections 13,198,878.02 1,464,353.29
148 Professional Engineers and Land Surveyors Licensure Board 28.08 8.65
160 Department of Commerce 12,163.49 1,964.14
185 Corporation Commission 119,343.66 9,272.08
199 Court of Criminal Appeals 93.78 15.00
219 District Courts 32,390.00 1,619.50
220 District Attorneys Council 78,672.74 4,593.44
265 Department of Education 51,816.18 8,290.59
266 Oklahoma Educational Television Authority 2,682.25 429.16
270 State Election Board 1,441.74 230.68
290 Employment Security Commission 4,480.90 717.60
292 Department of Environmental Quality 96,106.69 22,153.86
300 State Auditor and Inspector 609.78 144.77
308 Oklahoma State Bureau of Investigation 749,500.63 44,410.45
309 Department of Emergency Management 53,030.86 8,484.94
Continued...
19 PROCUREMENT SAVINGS REPORT | JUL 1, 2013 - JUN 30, 2014
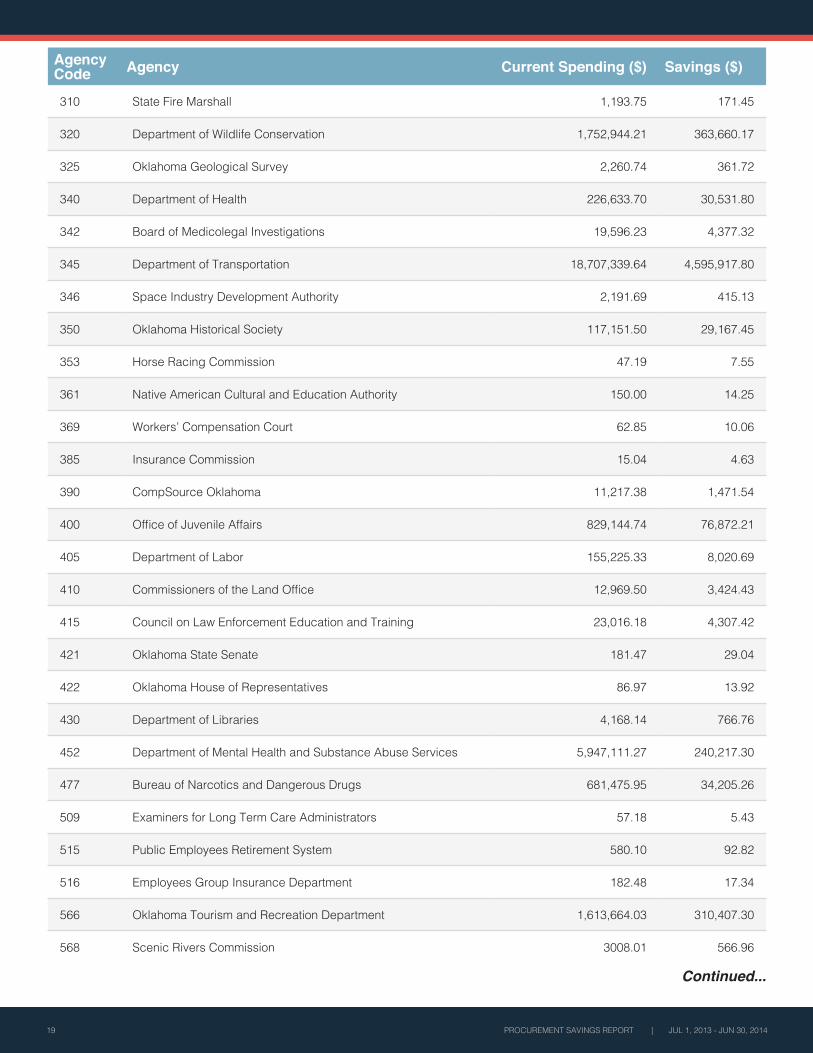
Agency Code Agency Current Spending ($) Savings ($)
310 State Fire Marshall 1,193.75 171.45
320 Department of Wildlife Conservation 1,752,944.21 363,660.17
325 Oklahoma Geological Survey 2,260.74 361.72
340 Department of Health 226,633.70 30,531.80
342 Board of Medicolegal Investigations 19,596.23 4,377.32
345 Department of Transportation 18,707,339.64 4,595,917.80
346 Space Industry Development Authority 2,191.69 415.13
350 Oklahoma Historical Society 117,151.50 29,167.45
353 Horse Racing Commission 47.19 7.55
361 Native American Cultural and Education Authority 150.00 14.25
369 Workers’ Compensation Court 62.85 10.06
385 Insurance Commission 15.04 4.63
390 CompSource Oklahoma 11,217.38 1,471.54
400 Office of Juvenile Affairs 829,144.74 76,872.21
405 Department of Labor 155,225.33 8,020.69
410 Commissioners of the Land Office 12,969.50 3,424.43
415 Council on Law Enforcement Education and Training 23,016.18 4,307.42
421 Oklahoma State Senate 181.47 29.04
422 Oklahoma House of Representatives 86.97 13.92
430 Department of Libraries 4,168.14 766.76
452 Department of Mental Health and Substance Abuse Services 5,947,111.27 240,217.30
477 Bureau of Narcotics and Dangerous Drugs 681,475.95 34,205.26
509 Examiners for Long Term Care Administrators 57.18 5.43
515 Public Employees Retirement System 580.10 92.82
516 Employees Group Insurance Department 182.48 17.34
566 Oklahoma Tourism and Recreation Department 1,613,664.03 310,407.30
568 Scenic Rivers Commission 3008.01 566.96
Continued...
PROCUREMENT SAVINGS REPORT | JUL 1, 2013 - JUN 30, 2014 20
Agency Code Agency Current Spending ($) Savings ($)
585 Department of Public Safety 4,715,042.69 448,814.63
588 Real Estate Commission 61.70 5.86
605 Regents for Higher Education 1,093,964.85 313,998.93
629 School of Science and Mathematics 3,598.04 1,108.20
645 Oklahoma Conservation Commission 777.88 158.29
650 Department of Veterans Affairs 881,188.65 133,798.57
670 J.D. McCarty Center 374,798.04 46,389.04
677 Oklahoma Supreme Court 265.61 50.45
695 Oklahoma Tax Commission 105,498.77 24,401.02
800 Department of Career and Technology Education 649,925.66 118,376.40
805 Department of Rehabilitation Services 216,761.17 28,640.10
807 Oklahoma Health Care Authority 7,024.13 1,123.86
830 Department of Human Services 2,940,506.06 208,032.86
835 Water Resources Board 106,102.52 10,924.13
978 Oklahoma Turnpike Authority 3,760,583.00 764,646.18
980 Grand River Dam Authority 1,328,182.32 225,640.43
99999 Political Sub-Divisions 40,279,874.49 7,848,609.03
HE001 Higher Education 36,947,782.83 1,108,056.45
GRAND TOTAL 144,710,870.91 19,831,382.65
21 PROCUREMENT SAVINGS REPORT | JUL 1, 2013 - JUN 30, 2014
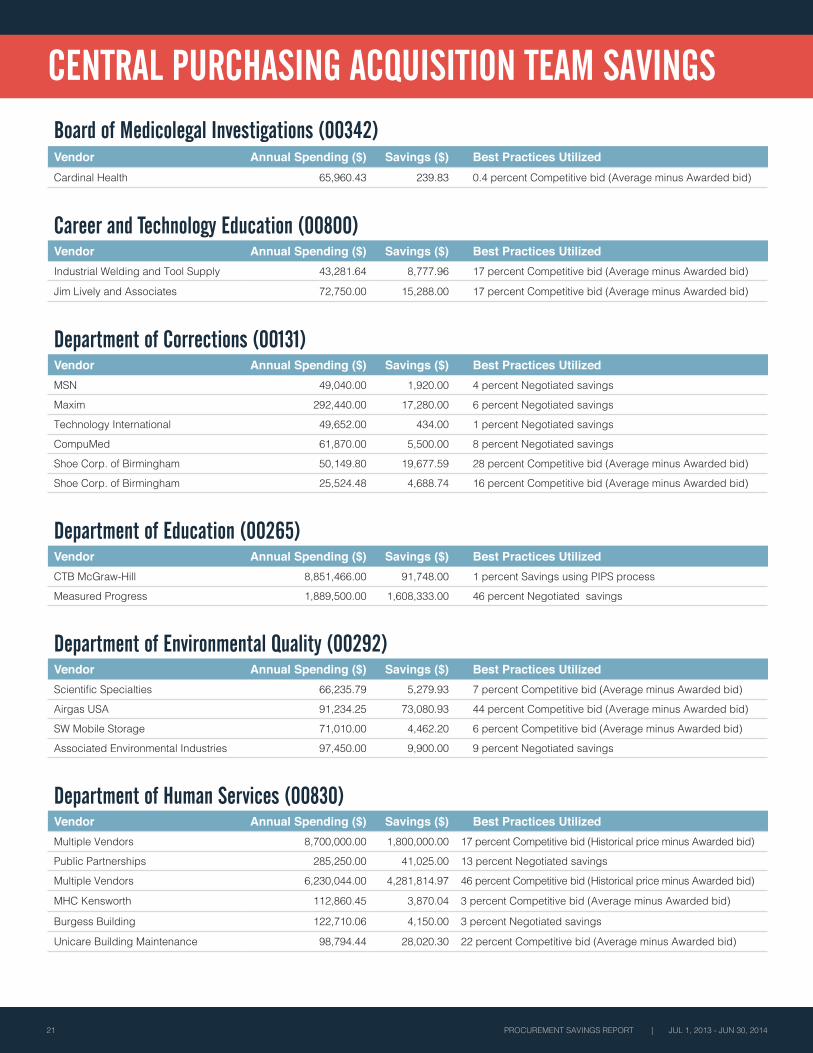
CENTRAL PURCHASING ACQUISITION TEAM SAVINGSBoard of Medicolegal Investigations (00342)Vendor Annual Spending ($) Savings ($) Best Practices UtilizedCardinal Health 65,960.43 239.83 0.4 percent Competitive bid (Average minus Awarded bid)
Career and Technology Education (00800)Vendor Annual Spending ($) Savings ($) Best Practices UtilizedIndustrial Welding and Tool Supply 43,281.64 8,777.96 17 percent Competitive bid (Average minus Awarded bid)
Jim Lively and Associates 72,750.00 15,288.00 17 percent Competitive bid (Average minus Awarded bid)
Department of Corrections (00131)Vendor Annual Spending ($) Savings ($) Best Practices UtilizedMSN 49,040.00 1,920.00 4 percent Negotiated savings
Maxim 292,440.00 17,280.00 6 percent Negotiated savings
Technology International 49,652.00 434.00 1 percent Negotiated savings
CompuMed 61,870.00 5,500.00 8 percent Negotiated savings
Shoe Corp. of Birmingham 50,149.80 19,677.59 28 percent Competitive bid (Average minus Awarded bid)
Shoe Corp. of Birmingham 25,524.48 4,688.74 16 percent Competitive bid (Average minus Awarded bid)
Department of Education (00265)Vendor Annual Spending ($) Savings ($) Best Practices UtilizedCTB McGraw-Hill 8,851,466.00 91,748.00 1 percent Savings using PIPS process
Measured Progress 1,889,500.00 1,608,333.00 46 percent Negotiated savings
Department of Environmental Quality (00292)Vendor Annual Spending ($) Savings ($) Best Practices UtilizedScientific Specialties 66,235.79 5,279.93 7 percent Competitive bid (Average minus Awarded bid)
Airgas USA 91,234.25 73,080.93 44 percent Competitive bid (Average minus Awarded bid)
SW Mobile Storage 71,010.00 4,462.20 6 percent Competitive bid (Average minus Awarded bid)
Associated Environmental Industries 97,450.00 9,900.00 9 percent Negotiated savings
Department of Human Services (00830)Vendor Annual Spending ($) Savings ($) Best Practices UtilizedMultiple Vendors 8,700,000.00 1,800,000.00 17 percent Competitive bid (Historical price minus Awarded bid)
Public Partnerships 285,250.00 41,025.00 13 percent Negotiated savings
Multiple Vendors 6,230,044.00 4,281,814.97 46 percent Competitive bid (Historical price minus Awarded bid)
MHC Kensworth 112,860.45 3,870.04 3 percent Competitive bid (Average minus Awarded bid)
Burgess Building 122,710.06 4,150.00 3 percent Negotiated savings
Unicare Building Maintenance 98,794.44 28,020.30 22 percent Competitive bid (Average minus Awarded bid)
PROCUREMENT SAVINGS REPORT | JUL 1, 2013 - JUN 30, 2014 22
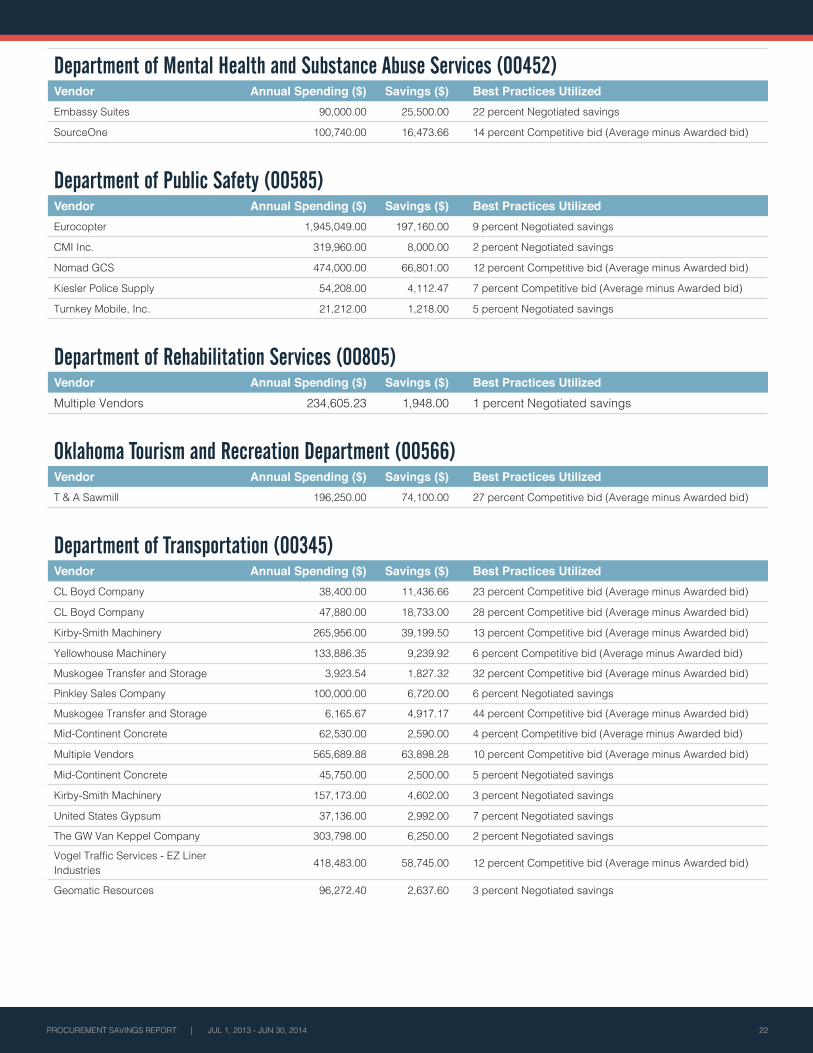
Department of Mental Health and Substance Abuse Services (00452)Vendor Annual Spending ($) Savings ($) Best Practices UtilizedEmbassy Suites 90,000.00 25,500.00 22 percent Negotiated savings
SourceOne 100,740.00 16,473.66 14 percent Competitive bid (Average minus Awarded bid)
Department of Public Safety (00585)Vendor Annual Spending ($) Savings ($) Best Practices UtilizedEurocopter 1,945,049.00 197,160.00 9 percent Negotiated savings
CMI Inc. 319,960.00 8,000.00 2 percent Negotiated savings
Nomad GCS 474,000.00 66,801.00 12 percent Competitive bid (Average minus Awarded bid)
Kiesler Police Supply 54,208.00 4,112.47 7 percent Competitive bid (Average minus Awarded bid)
Turnkey Mobile, Inc. 21,212.00 1,218.00 5 percent Negotiated savings
Department of Rehabilitation Services (00805)Vendor Annual Spending ($) Savings ($) Best Practices UtilizedMultiple Vendors 234,605.23 1,948.00 1 percent Negotiated savings
Oklahoma Tourism and Recreation Department (00566)Vendor Annual Spending ($) Savings ($) Best Practices UtilizedT & A Sawmill 196,250.00 74,100.00 27 percent Competitive bid (Average minus Awarded bid)
Department of Transportation (00345)Vendor Annual Spending ($) Savings ($) Best Practices UtilizedCL Boyd Company 38,400.00 11,436.66 23 percent Competitive bid (Average minus Awarded bid)
CL Boyd Company 47,880.00 18,733.00 28 percent Competitive bid (Average minus Awarded bid)
Kirby-Smith Machinery 265,956.00 39,199.50 13 percent Competitive bid (Average minus Awarded bid)
Yellowhouse Machinery 133,886.35 9,239.92 6 percent Competitive bid (Average minus Awarded bid)
Muskogee Transfer and Storage 3,923.54 1,827.32 32 percent Competitive bid (Average minus Awarded bid)
Pinkley Sales Company 100,000.00 6,720.00 6 percent Negotiated savings
Muskogee Transfer and Storage 6,165.67 4,917.17 44 percent Competitive bid (Average minus Awarded bid)
Mid-Continent Concrete 62,530.00 2,590.00 4 percent Competitive bid (Average minus Awarded bid)
Multiple Vendors 565,689.88 63,898.28 10 percent Competitive bid (Average minus Awarded bid)
Mid-Continent Concrete 45,750.00 2,500.00 5 percent Negotiated savings
Kirby-Smith Machinery 157,173.00 4,602.00 3 percent Negotiated savings
United States Gypsum 37,136.00 2,992.00 7 percent Negotiated savings
The GW Van Keppel Company 303,798.00 6,250.00 2 percent Negotiated savings
Vogel Traffic Services - EZ Liner Industries 418,483.00 58,745.00 12 percent Competitive bid (Average minus Awarded bid)
Geomatic Resources 96,272.40 2,637.60 3 percent Negotiated savings
23 PROCUREMENT SAVINGS REPORT | JUL 1, 2013 - JUN 30, 2014
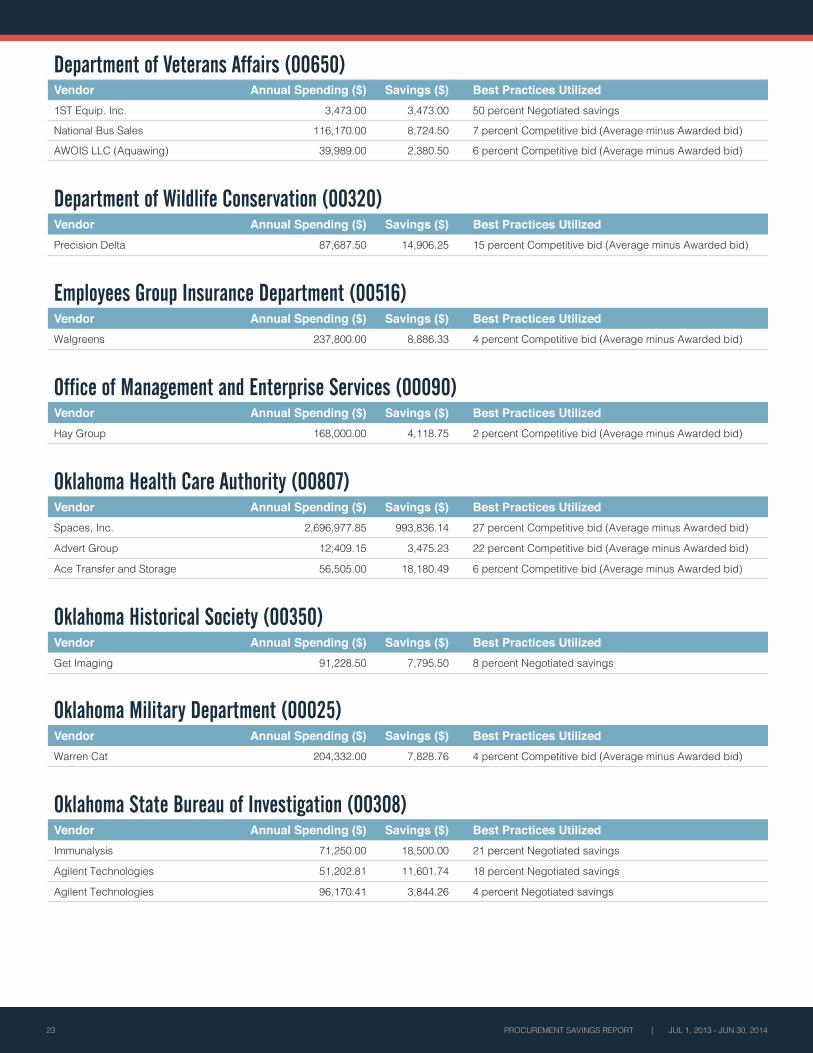
Department of Veterans Affairs (00650)Vendor Annual Spending ($) Savings ($) Best Practices Utilized1ST Equip. Inc. 3,473.00 3,473.00 50 percent Negotiated savings
National Bus Sales 116,170.00 8,724.50 7 percent Competitive bid (Average minus Awarded bid)
AWOIS LLC (Aquawing) 39,989.00 2,380.50 6 percent Competitive bid (Average minus Awarded bid)
Department of Wildlife Conservation (00320)Vendor Annual Spending ($) Savings ($) Best Practices UtilizedPrecision Delta 87,687.50 14,906.25 15 percent Competitive bid (Average minus Awarded bid)
Employees Group Insurance Department (00516)Vendor Annual Spending ($) Savings ($) Best Practices UtilizedWalgreens 237,800.00 8,886.33 4 percent Competitive bid (Average minus Awarded bid)
Office of Management and Enterprise Services (00090)Vendor Annual Spending ($) Savings ($) Best Practices UtilizedHay Group 168,000.00 4,118.75 2 percent Competitive bid (Average minus Awarded bid)
Oklahoma Health Care Authority (00807)Vendor Annual Spending ($) Savings ($) Best Practices UtilizedSpaces, Inc. 2,696,977.85 993,836.14 27 percent Competitive bid (Average minus Awarded bid)
Advert Group 12,409.15 3,475.23 22 percent Competitive bid (Average minus Awarded bid)
Ace Transfer and Storage 56,505.00 18,180.49 6 percent Competitive bid (Average minus Awarded bid)
Oklahoma Historical Society (00350)Vendor Annual Spending ($) Savings ($) Best Practices UtilizedGet Imaging 91,228.50 7,795.50 8 percent Negotiated savings
Oklahoma Military Department (00025)Vendor Annual Spending ($) Savings ($) Best Practices UtilizedWarren Cat 204,332.00 7,828.76 4 percent Competitive bid (Average minus Awarded bid)
Oklahoma State Bureau of Investigation (00308)Vendor Annual Spending ($) Savings ($) Best Practices UtilizedImmunalysis 71,250.00 18,500.00 21 percent Negotiated savings
Agilent Technologies 51,202.81 11,601.74 18 percent Negotiated savings
Agilent Technologies 96,170.41 3,844.26 4 percent Negotiated savings
PROCUREMENT SAVINGS REPORT | JUL 1, 2013 - JUN 30, 2014 24
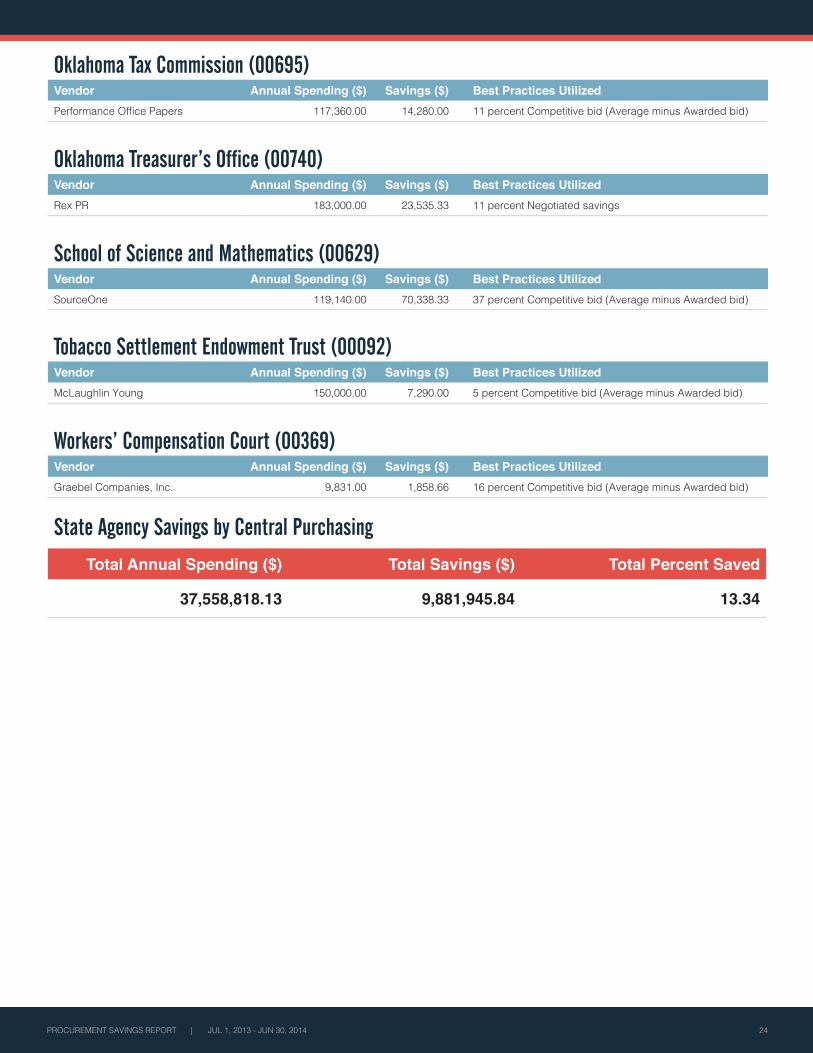
Oklahoma Tax Commission (00695)Vendor Annual Spending ($) Savings ($) Best Practices UtilizedPerformance Office Papers 117,360.00 14,280.00 11 percent Competitive bid (Average minus Awarded bid)
Oklahoma Treasurer’s Office (00740)Vendor Annual Spending ($) Savings ($) Best Practices UtilizedRex PR 183,000.00 23,535.33 11 percent Negotiated savings
School of Science and Mathematics (00629)Vendor Annual Spending ($) Savings ($) Best Practices UtilizedSourceOne 119,140.00 70,338.33 37 percent Competitive bid (Average minus Awarded bid)
Tobacco Settlement Endowment Trust (00092)Vendor Annual Spending ($) Savings ($) Best Practices UtilizedMcLaughlin Young 150,000.00 7,290.00 5 percent Competitive bid (Average minus Awarded bid)
Workers’ Compensation Court (00369)Vendor Annual Spending ($) Savings ($) Best Practices UtilizedGraebel Companies, Inc. 9,831.00 1,858.66 16 percent Competitive bid (Average minus Awarded bid)
State Agency Savings by Central Purchasing
Total Annual Spending ($) Total Savings ($) Total Percent Saved
37,558,818.13 9,881,945.84 13.34
25 PROCUREMENT SAVINGS REPORT | JUL 1, 2013 - JUN 30, 2014
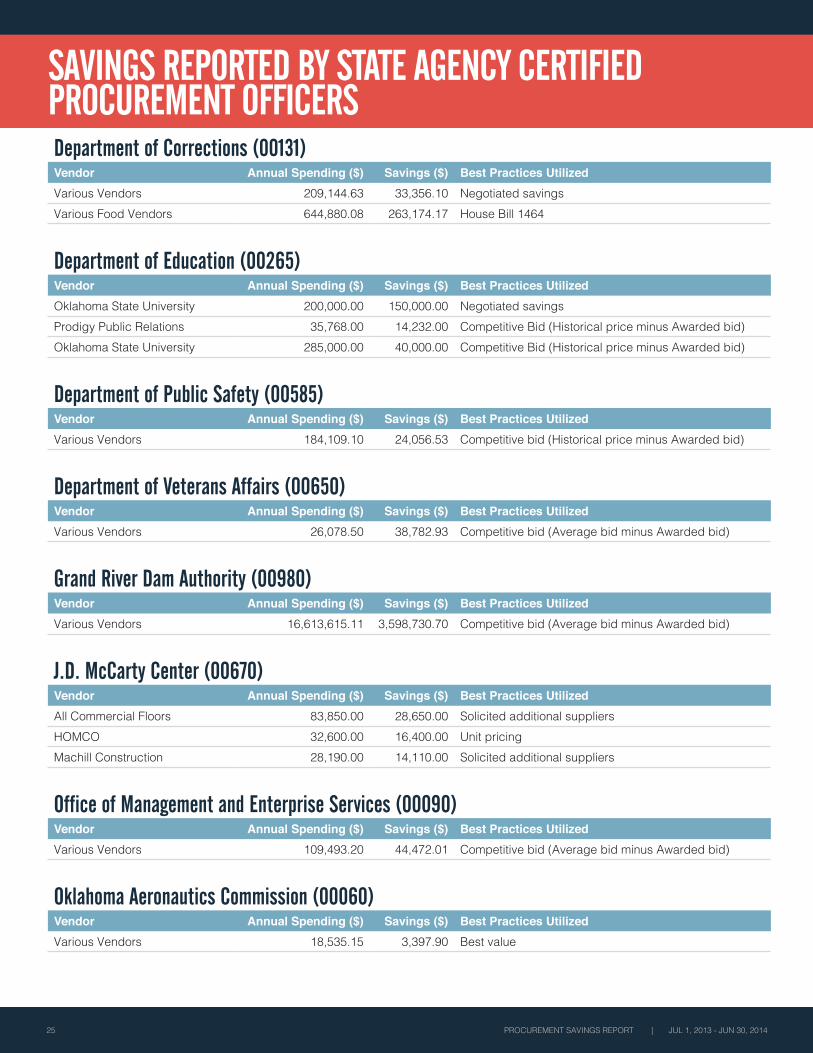
SAVINGS REPORTED BY STATE AGENCY CERTIFIED PROCUREMENT OFFICERSDepartment of Corrections (00131)Vendor Annual Spending ($) Savings ($) Best Practices UtilizedVarious Vendors 209,144.63 33,356.10 Negotiated savingsVarious Food Vendors 644,880.08 263,174.17 House Bill 1464
Department of Education (00265)Vendor Annual Spending ($) Savings ($) Best Practices UtilizedOklahoma State University 200,000.00 150,000.00 Negotiated savingsProdigy Public Relations 35,768.00 14,232.00 Competitive Bid (Historical price minus Awarded bid)Oklahoma State University 285,000.00 40,000.00 Competitive Bid (Historical price minus Awarded bid)
Department of Public Safety (00585)Vendor Annual Spending ($) Savings ($) Best Practices UtilizedVarious Vendors 184,109.10 24,056.53 Competitive bid (Historical price minus Awarded bid)
Department of Veterans Affairs (00650)Vendor Annual Spending ($) Savings ($) Best Practices UtilizedVarious Vendors 26,078.50 38,782.93 Competitive bid (Average bid minus Awarded bid)
Grand River Dam Authority (00980)Vendor Annual Spending ($) Savings ($) Best Practices UtilizedVarious Vendors 16,613,615.11 3,598,730.70 Competitive bid (Average bid minus Awarded bid)
J.D. McCarty Center (00670)Vendor Annual Spending ($) Savings ($) Best Practices UtilizedAll Commercial Floors 83,850.00 28,650.00 Solicited additional suppliersHOMCO 32,600.00 16,400.00 Unit pricing Machill Construction 28,190.00 14,110.00 Solicited additional suppliers
Office of Management and Enterprise Services (00090)Vendor Annual Spending ($) Savings ($) Best Practices UtilizedVarious Vendors 109,493.20 44,472.01 Competitive bid (Average bid minus Awarded bid)
Oklahoma Aeronautics Commission (00060)Vendor Annual Spending ($) Savings ($) Best Practices UtilizedVarious Vendors 18,535.15 3,397.90 Best value
PROCUREMENT SAVINGS REPORT | JUL 1, 2013 - JUN 30, 2014 26
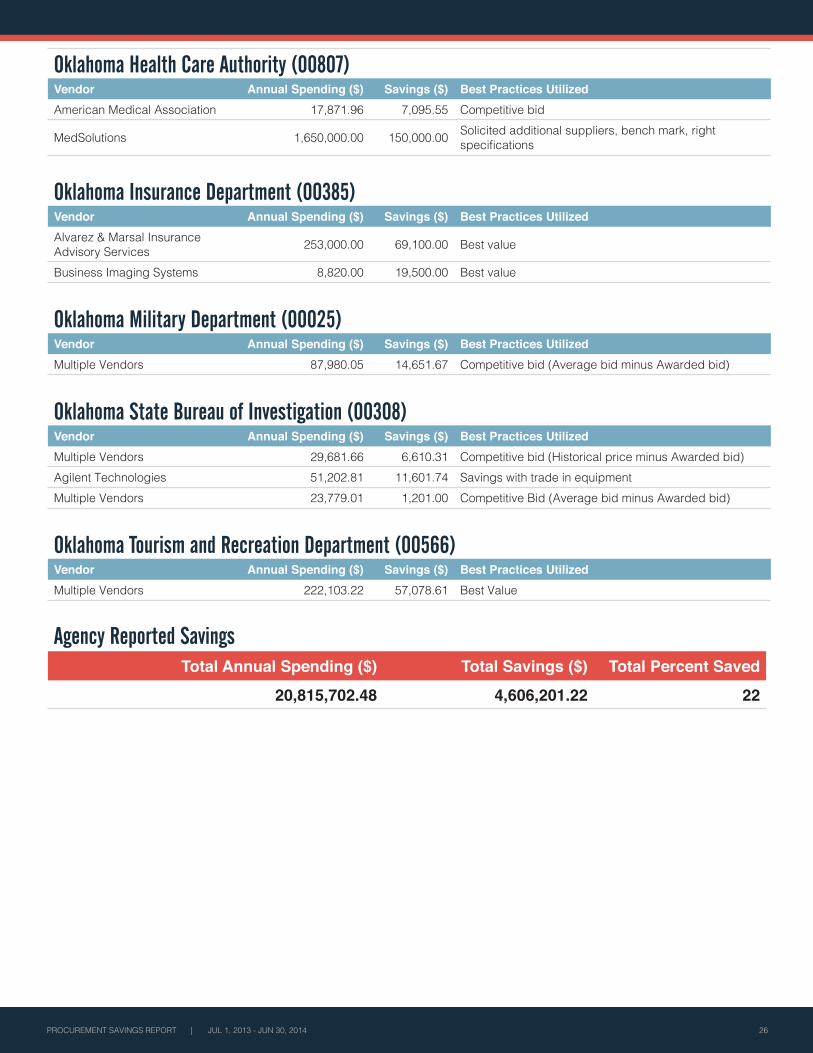
Oklahoma Health Care Authority (00807)Vendor Annual Spending ($) Savings ($) Best Practices UtilizedAmerican Medical Association 17,871.96 7,095.55 Competitive bid
MedSolutions 1,650,000.00 150,000.00 Solicited additional suppliers, bench mark, right specifications
Oklahoma Insurance Department (00385)Vendor Annual Spending ($) Savings ($) Best Practices UtilizedAlvarez & Marsal Insurance Advisory Services 253,000.00 69,100.00 Best value
Business Imaging Systems 8,820.00 19,500.00 Best value
Oklahoma Military Department (00025)Vendor Annual Spending ($) Savings ($) Best Practices UtilizedMultiple Vendors 87,980.05 14,651.67 Competitive bid (Average bid minus Awarded bid)
Oklahoma State Bureau of Investigation (00308)Vendor Annual Spending ($) Savings ($) Best Practices UtilizedMultiple Vendors 29,681.66 6,610.31 Competitive bid (Historical price minus Awarded bid)Agilent Technologies 51,202.81 11,601.74 Savings with trade in equipmentMultiple Vendors 23,779.01 1,201.00 Competitive Bid (Average bid minus Awarded bid)
Oklahoma Tourism and Recreation Department (00566)Vendor Annual Spending ($) Savings ($) Best Practices UtilizedMultiple Vendors 222,103.22 57,078.61 Best Value
Agency Reported SavingsTotal Annual Spending ($) Total Savings ($) Total Percent Saved
20,815,702.48 4,606,201.22 22
27 PROCUREMENT SAVINGS REPORT | JUL 1, 2013 - JUN 30, 2014
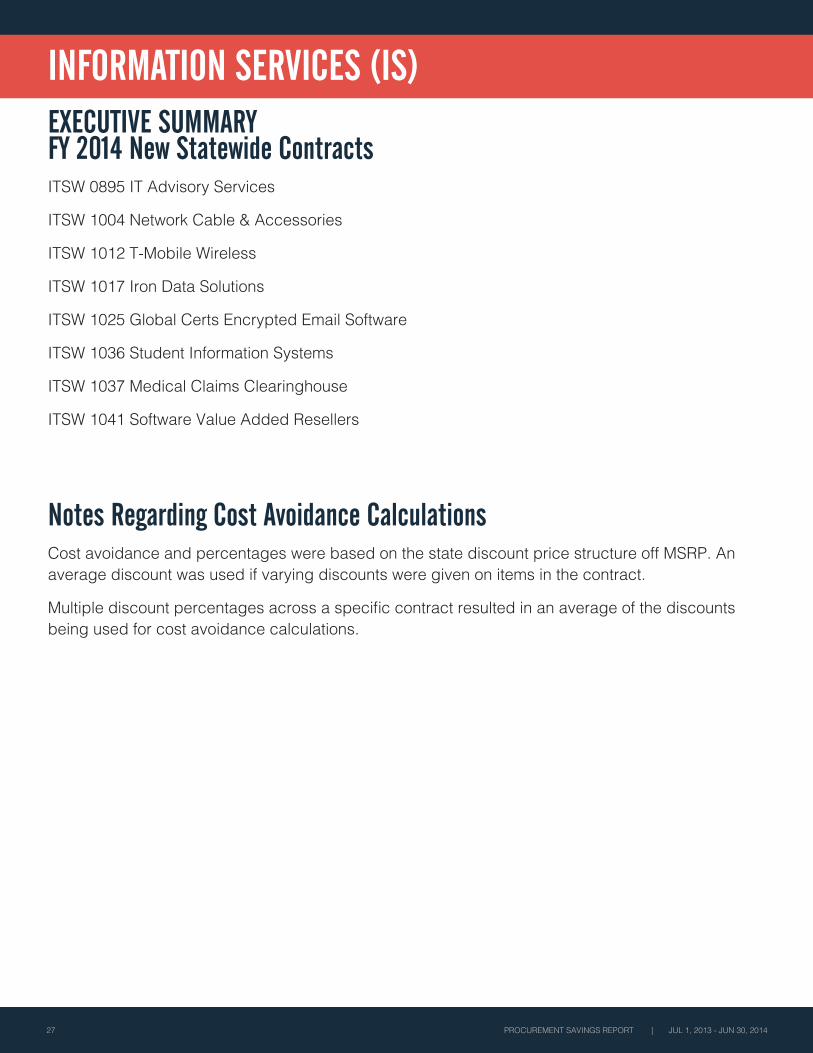
INFORMATION SERVICES (IS)EXECUTIVE SUMMARY FY 2014 New Statewide ContractsITSW 0895 IT Advisory Services
ITSW 1004 Network Cable & Accessories
ITSW 1012 T-Mobile Wireless
ITSW 1017 Iron Data Solutions
ITSW 1025 Global Certs Encrypted Email Software
ITSW 1036 Student Information Systems
ITSW 1037 Medical Claims Clearinghouse
ITSW 1041 Software Value Added Resellers
Notes Regarding Cost Avoidance CalculationsCost avoidance and percentages were based on the state discount price structure off MSRP. An average discount was used if varying discounts were given on items in the contract.
Multiple discount percentages across a specific contract resulted in an average of the discounts being used for cost avoidance calculations.
PROCUREMENT SAVINGS REPORT | JUL 1, 2013 - JUN 30, 2014 28
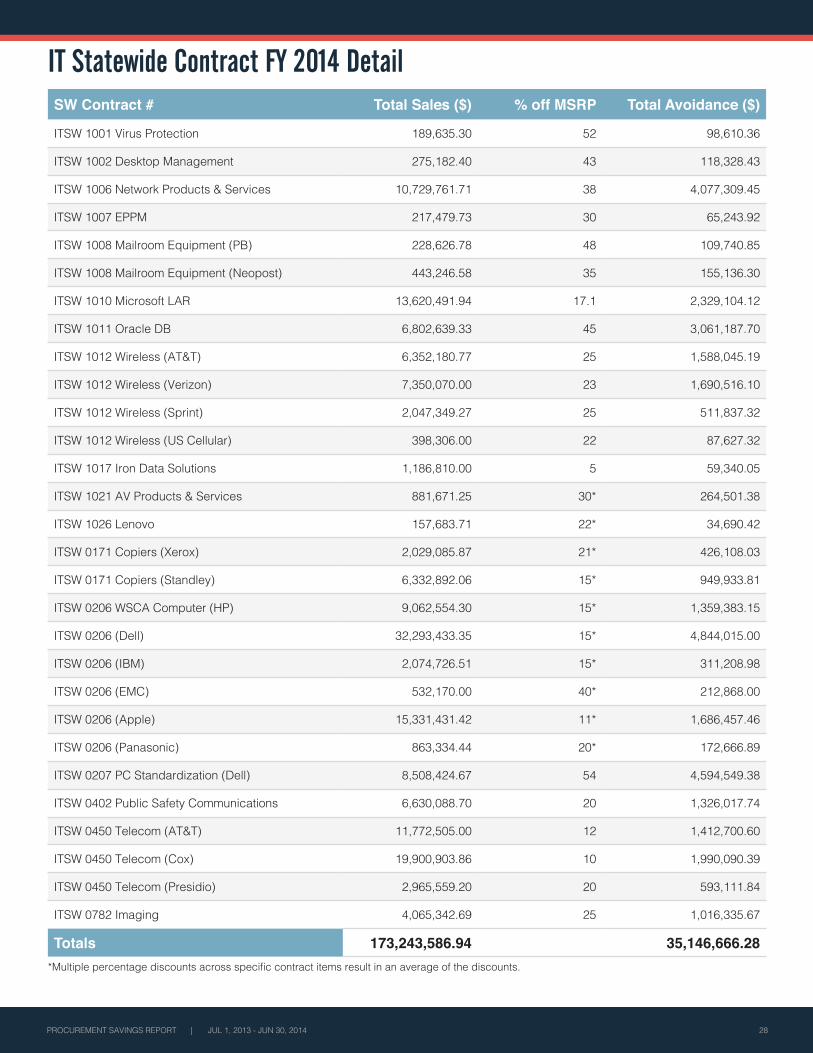
IT Statewide Contract FY 2014 DetailSW Contract # Total Sales ($) % off MSRP Total Avoidance ($)
ITSW 1001 Virus Protection 189,635.30 52 98,610.36
ITSW 1002 Desktop Management 275,182.40 43 118,328.43
ITSW 1006 Network Products & Services 10,729,761.71 38 4,077,309.45
ITSW 1007 EPPM 217,479.73 30 65,243.92
ITSW 1008 Mailroom Equipment (PB) 228,626.78 48 109,740.85
ITSW 1008 Mailroom Equipment (Neopost) 443,246.58 35 155,136.30
ITSW 1010 Microsoft LAR 13,620,491.94 17.1 2,329,104.12
ITSW 1011 Oracle DB 6,802,639.33 45 3,061,187.70
ITSW 1012 Wireless (AT&T) 6,352,180.77 25 1,588,045.19
ITSW 1012 Wireless (Verizon) 7,350,070.00 23 1,690,516.10
ITSW 1012 Wireless (Sprint) 2,047,349.27 25 511,837.32
ITSW 1012 Wireless (US Cellular) 398,306.00 22 87,627.32
ITSW 1017 Iron Data Solutions 1,186,810.00 5 59,340.05
ITSW 1021 AV Products & Services 881,671.25 30* 264,501.38
ITSW 1026 Lenovo 157,683.71 22* 34,690.42
ITSW 0171 Copiers (Xerox) 2,029,085.87 21* 426,108.03
ITSW 0171 Copiers (Standley) 6,332,892.06 15* 949,933.81
ITSW 0206 WSCA Computer (HP) 9,062,554.30 15* 1,359,383.15
ITSW 0206 (Dell) 32,293,433.35 15* 4,844,015.00
ITSW 0206 (IBM) 2,074,726.51 15* 311,208.98
ITSW 0206 (EMC) 532,170.00 40* 212,868.00
ITSW 0206 (Apple) 15,331,431.42 11* 1,686,457.46
ITSW 0206 (Panasonic) 863,334.44 20* 172,666.89
ITSW 0207 PC Standardization (Dell) 8,508,424.67 54 4,594,549.38
ITSW 0402 Public Safety Communications 6,630,088.70 20 1,326,017.74
ITSW 0450 Telecom (AT&T) 11,772,505.00 12 1,412,700.60
ITSW 0450 Telecom (Cox) 19,900,903.86 10 1,990,090.39
ITSW 0450 Telecom (Presidio) 2,965,559.20 20 593,111.84
ITSW 0782 Imaging 4,065,342.69 25 1,016,335.67
Totals 173,243,586.94 35,146,666.28*Multiple percentage discounts across specific contract items result in an average of the discounts.
29 PROCUREMENT SAVINGS REPORT | JUL 1, 2013 - JUN 30, 2014
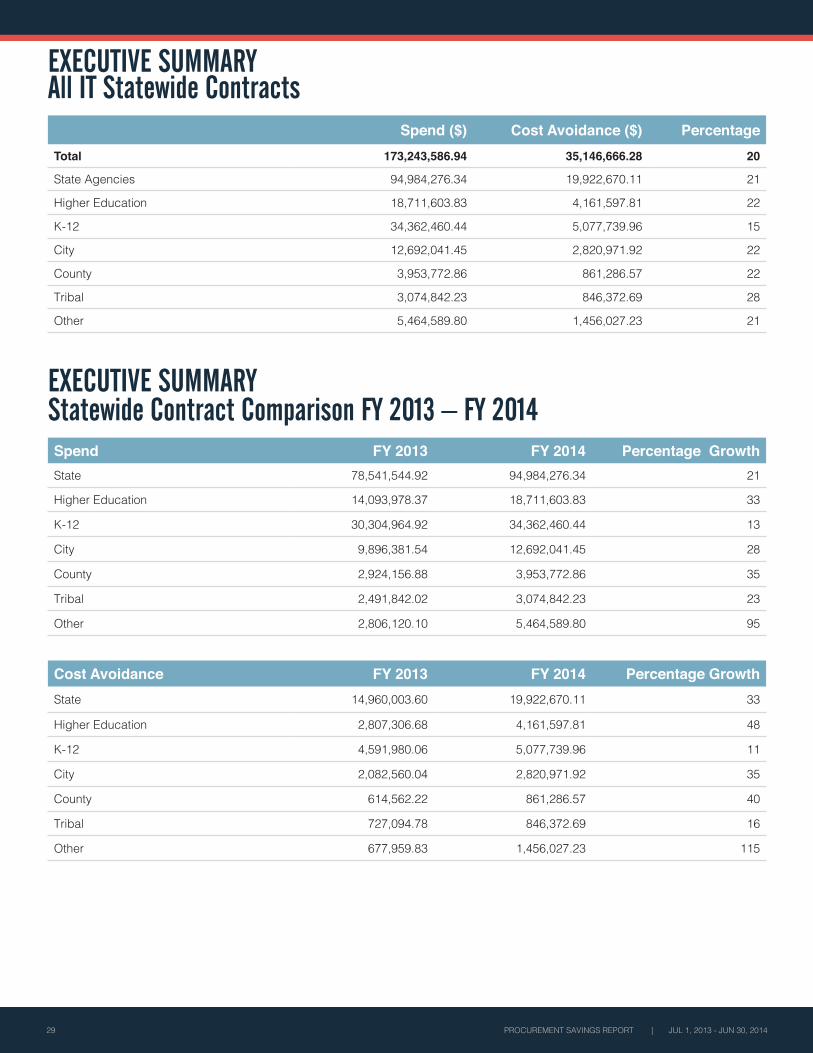
EXECUTIVE SUMMARYAll IT Statewide Contracts
Spend ($) Cost Avoidance ($) PercentageTotal 173,243,586.94 35,146,666.28 20
State Agencies 94,984,276.34 19,922,670.11 21
Higher Education 18,711,603.83 4,161,597.81 22
K-12 34,362,460.44 5,077,739.96 15
City 12,692,041.45 2,820,971.92 22
County 3,953,772.86 861,286.57 22
Tribal 3,074,842.23 846,372.69 28
Other 5,464,589.80 1,456,027.23 21
EXECUTIVE SUMMARYStatewide Contract Comparison FY 2013 – FY 2014Spend FY 2013 FY 2014 Percentage GrowthState 78,541,544.92 94,984,276.34 21
Higher Education 14,093,978.37 18,711,603.83 33
K-12 30,304,964.92 34,362,460.44 13
City 9,896,381.54 12,692,041.45 28
County 2,924,156.88 3,953,772.86 35
Tribal 2,491,842.02 3,074,842.23 23
Other 2,806,120.10 5,464,589.80 95
Cost Avoidance FY 2013 FY 2014 Percentage GrowthState 14,960,003.60 19,922,670.11 33
Higher Education 2,807,306.68 4,161,597.81 48
K-12 4,591,980.06 5,077,739.96 11
City 2,082,560.04 2,820,971.92 35
County 614,562.22 861,286.57 40
Tribal 727,094.78 846,372.69 16
Other 677,959.83 1,456,027.23 115
PROCUREMENT SAVINGS REPORT | JUL 1, 2013 - JUN 30, 2014 30
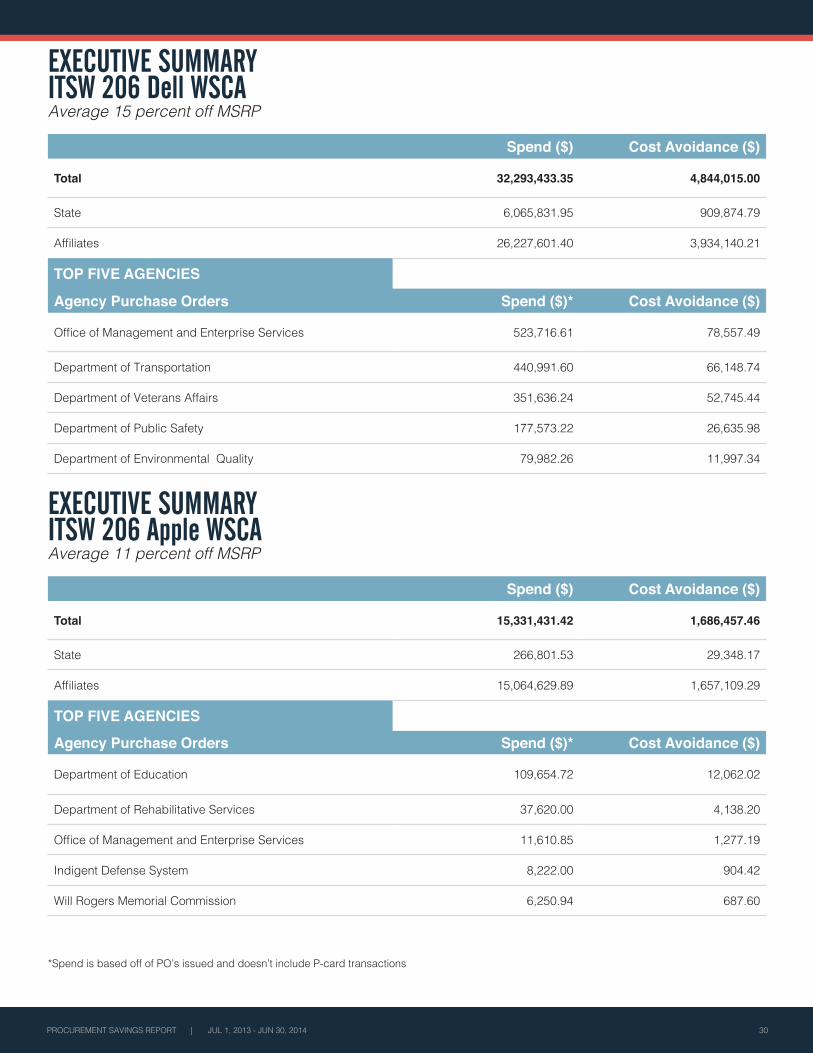
EXECUTIVE SUMMARY ITSW 206 Dell WSCAAverage 15 percent off MSRP
Spend ($) Cost Avoidance ($)
Total 32,293,433.35 4,844,015.00
State 6,065,831.95 909,874.79
Affiliates 26,227,601.40 3,934,140.21
TOP FIVE AGENCIES
Agency Purchase Orders Spend ($)* Cost Avoidance ($)
Office of Management and Enterprise Services 523,716.61 78,557.49
Department of Transportation 440,991.60 66,148.74
Department of Veterans Affairs 351,636.24 52,745.44
Department of Public Safety 177,573.22 26,635.98
Department of Environmental Quality 79,982.26 11,997.34
EXECUTIVE SUMMARY ITSW 206 Apple WSCAAverage 11 percent off MSRP
Spend ($) Cost Avoidance ($)
Total 15,331,431.42 1,686,457.46
State 266,801.53 29,348.17
Affiliates 15,064,629.89 1,657,109.29
TOP FIVE AGENCIES
Agency Purchase Orders Spend ($)* Cost Avoidance ($)
Department of Education 109,654.72 12,062.02
Department of Rehabilitative Services 37,620.00 4,138.20
Office of Management and Enterprise Services 11,610.85 1,277.19
Indigent Defense System 8,222.00 904.42
Will Rogers Memorial Commission 6,250.94 687.60
*Spend is based off of PO’s issued and doesn’t include P-card transactions
31 PROCUREMENT SAVINGS REPORT | JUL 1, 2013 - JUN 30, 2014
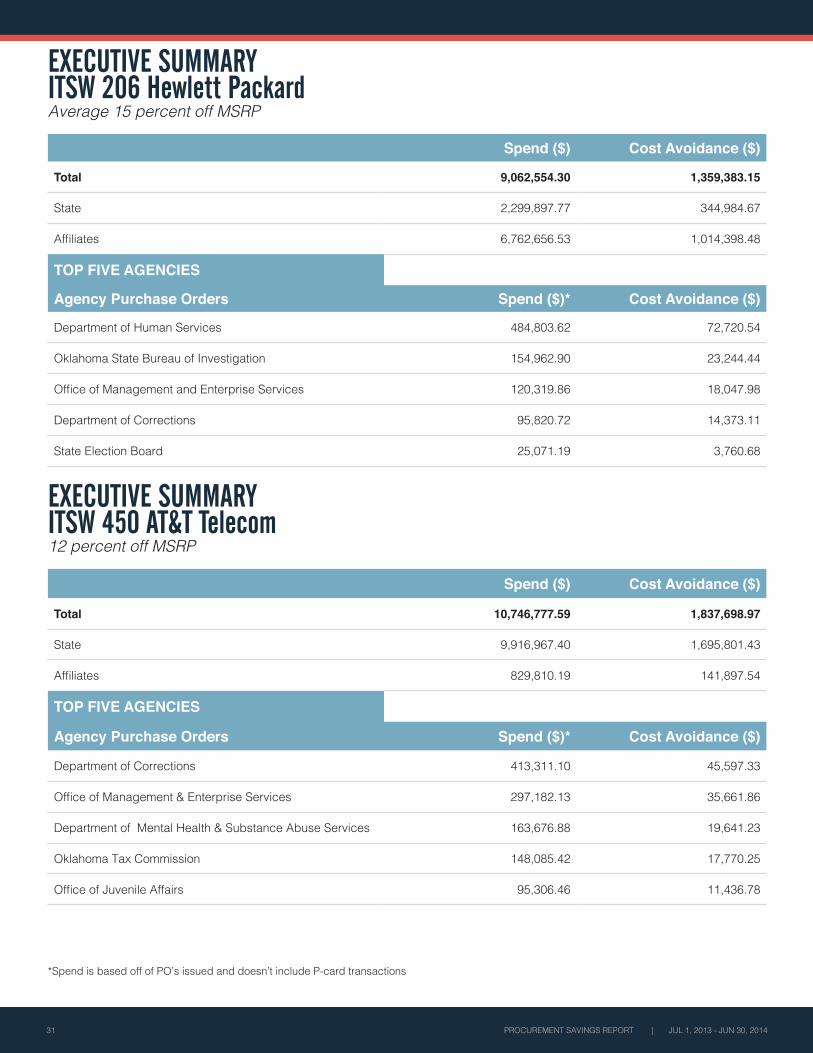
EXECUTIVE SUMMARY ITSW 206 Hewlett PackardAverage 15 percent off MSRP
Spend ($) Cost Avoidance ($)
Total 9,062,554.30 1,359,383.15
State 2,299,897.77 344,984.67
Affiliates 6,762,656.53 1,014,398.48
TOP FIVE AGENCIES
Agency Purchase Orders Spend ($)* Cost Avoidance ($)
Department of Human Services 484,803.62 72,720.54
Oklahoma State Bureau of Investigation 154,962.90 23,244.44
Office of Management and Enterprise Services 120,319.86 18,047.98
Department of Corrections 95,820.72 14,373.11
State Election Board 25,071.19 3,760.68
EXECUTIVE SUMMARY ITSW 450 AT&T Telecom12 percent off MSRP
Spend ($) Cost Avoidance ($)
Total 10,746,777.59 1,837,698.97
State 9,916,967.40 1,695,801.43
Affiliates 829,810.19 141,897.54
TOP FIVE AGENCIES
Agency Purchase Orders Spend ($)* Cost Avoidance ($)
Department of Corrections 413,311.10 45,597.33
Office of Management & Enterprise Services 297,182.13 35,661.86
Department of Mental Health & Substance Abuse Services 163,676.88 19,641.23
Oklahoma Tax Commission 148,085.42 17,770.25
Office of Juvenile Affairs 95,306.46 11,436.78
*Spend is based off of PO’s issued and doesn’t include P-card transactions
PROCUREMENT SAVINGS REPORT | JUL 1, 2013 - JUN 30, 2014 32
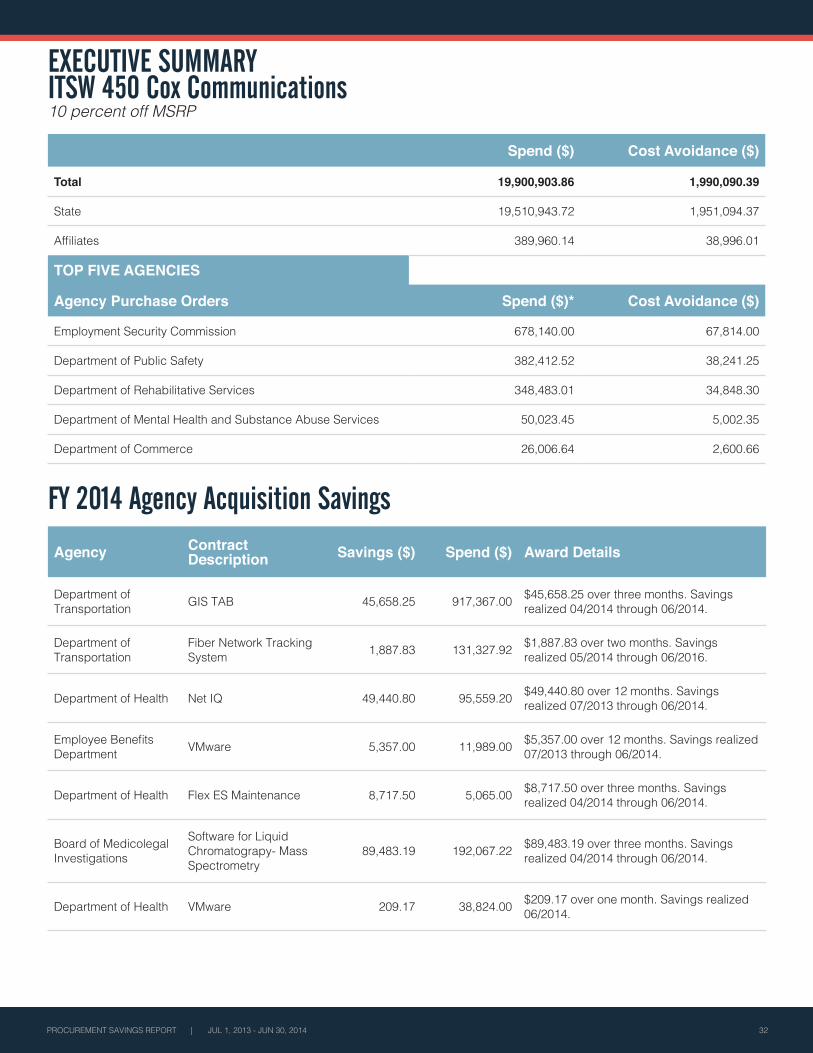
EXECUTIVE SUMMARYITSW 450 Cox Communications10 percent off MSRP
Spend ($) Cost Avoidance ($)
Total 19,900,903.86 1,990,090.39
State 19,510,943.72 1,951,094.37
Affiliates 389,960.14 38,996.01
TOP FIVE AGENCIES
Agency Purchase Orders Spend ($)* Cost Avoidance ($)
Employment Security Commission 678,140.00 67,814.00
Department of Public Safety 382,412.52 38,241.25
Department of Rehabilitative Services 348,483.01 34,848.30
Department of Mental Health and Substance Abuse Services 50,023.45 5,002.35
Department of Commerce 26,006.64 2,600.66
FY 2014 Agency Acquisition Savings
Agency Contract Description Savings ($) Spend ($) Award Details
Department of Transportation GIS TAB 45,658.25 917,367.00 $45,658.25 over three months. Savings
realized 04/2014 through 06/2014.
Department of Transportation
Fiber Network Tracking System 1,887.83 131,327.92 $1,887.83 over two months. Savings
realized 05/2014 through 06/2016.
Department of Health Net IQ 49,440.80 95,559.20 $49,440.80 over 12 months. Savings realized 07/2013 through 06/2014.
Employee Benefits Department VMware 5,357.00 11,989.00 $5,357.00 over 12 months. Savings realized
07/2013 through 06/2014.
Department of Health Flex ES Maintenance 8,717.50 5,065.00 $8,717.50 over three months. Savings realized 04/2014 through 06/2014.
Board of Medicolegal Investigations
Software for Liquid Chromatograpy- Mass Spectrometry
89,483.19 192,067.22 $89,483.19 over three months. Savings realized 04/2014 through 06/2014.
Department of Health VMware 209.17 38,824.00 $209.17 over one month. Savings realized 06/2014.