
TABLE OF CONTENTS - Welcome to Oklahoma's Official …€¦ · TABLE OF CONTENTS State Procurement...
34
Transcript of TABLE OF CONTENTS - Welcome to Oklahoma's Official …€¦ · TABLE OF CONTENTS State Procurement...

TABLE OF CONTENTS
State Procurement Total
Executive Summary ............................................................ 2
Central Purchasing Division
Executive Summary ........................................................... 3 Statewide Contract Savings ................................................ 4 Statewide Contract Savings Detail by Agency .................... 19 Acquisition Team Savings ................................................. 21 Savings Reported by State Agencies ................................... 26
Information Services Division (ISD)
Executive Summary ............................................................ 27 IT Statewide Contract FY12 Detail ...................................... 28
This Publication is issued by the Office of Management and Enterprise Services, Purchasing Division as authorized by 65 O.S. 2001 §3-110. Copies have not been printed but are available on the agency website.
1

STATE PROCUREMENT TOTAL
EXECUTIVE SUMMARY
Procurement Operation Spending ($) Savings ($)Central Purchasing Division Statewide Contract Savings 154,680,838.99 22,167,312.20
Central Purchasing Division Acquisition Team Savings 12,711,816.01 2,966,620.06
Information Services Division Statewide Contract Savings 141,058,989.75 26,463,195.71
Information Services Division Acquisition Savings 4,122,835.63 390,327.40
Savings Reported by State Agency Certified Procurement Officers 344,305.96 214,143.95
TOTAL IMPACT OF STATE PROCUREMENT 312,918,786.34 52,201,599.32
2
CENTRAL PURCHASING DIVISION
EXECUTIVE SUMMARY
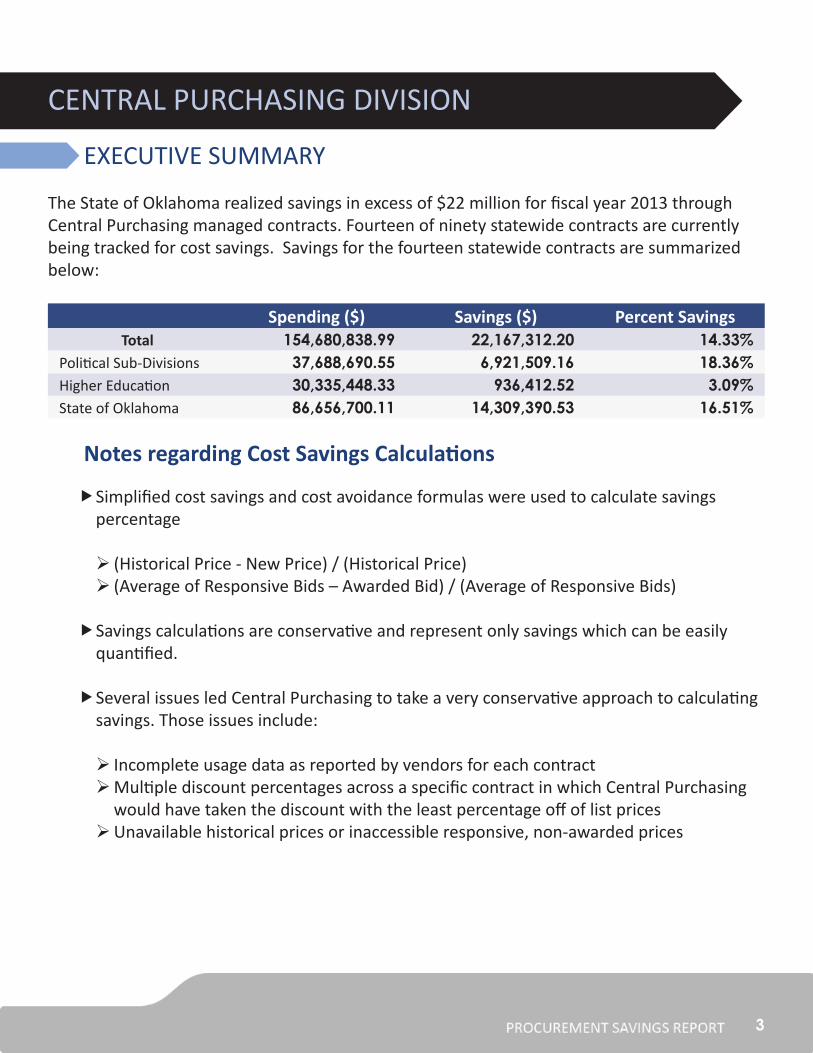
The State of Oklahoma realized savings in excess of $22 million for fiscal year 2013 through Central Purchasing managed contracts. Fourteen of ninety statewide contracts are currently being tracked for cost savings. Savings for the fourteen statewide contracts are summarized below:
Spending ($) Savings ($) Percent SavingsTotal 154,680,838.99 22,167,312.20 14.33%
Political Sub-Divisions 37,688,690.55 6,921,509.16 18.36%Higher Education 30,335,448.33 936,412.52 3.09%State of Oklahoma 86,656,700.11 14,309,390.53 16.51%
Notes regarding Cost Savings Calculations
fSimplified cost savings and cost avoidance formulas were used to calculate savings percentage
¾ (Historical Price - New Price) / (Historical Price) ¾ (Average of Responsive Bids – Awarded Bid) / (Average of Responsive Bids)
fSavings calculations are conservative and represent only savings which can be easily quantified.
fSeveral issues led Central Purchasing to take a very conservative approach to calculating savings. Those issues include:
¾ Incomplete usage data as reported by vendors for each contract ¾Multiple discount percentages across a specific contract in which Central Purchasing would have taken the discount with the least percentage off of list prices ¾Unavailable historical prices or inaccessible responsive, non-awarded prices
3

CENTRAL PURCHASING SAVINGS BY STATEWIDE CONTRACT
Summary: Minnesota Multistate Contracting Alliance for Pharmacy (23A)Contracting Officer: Laura Bybee
fBackground:
¾MN-led contract (MMCAP) ¾OK is participating along with 46 other states ¾ 1.8 billion dollar spend with over 21,000 items used by Oklahoma
fSavings percentage: approximately 1% fBest practices used:
¾ Commodity Council ¾ RFP development with MN
I. Overall
Category Current Spending ($) Savings ($)State of Oklahoma 6,278,679.20 60,777.61Higher Education 26,929,079.47 260,673.49Political Sub-Divisions 401,826.57 3,889.68Total 33,609,585.23 325,340.79
II. State Agencies
Agency Current Spending ($) Savings ($)Department of Mental Health & Substance Abuse Services
3,648,656.37 35,318.99
Department of Health 1,472,568.65 14,254.46Department of Human Services 1,150,653.19 1,138.32Office of Juvenile Affairs 5,231.41 50.64Department of Rehabilitation Services 1,569.57 15.19
4

Summary: Tires, Tubes and Tire Accessories (24)Contracting Officer: Theresa Johnson
fBackground:
¾ Comprehensive, strategically sourced project
fSavings percentage: 21% fBest Practices used:
¾ Spend data from various sources ¾GSA ¾Direct negotiation with manufacturers
I. Overall
Category Current Spending ($) Savings ($)State of Oklahoma 1,512,491.98 317,623.32Higher Education 222,424.61 46,709.17Political Sub-Divisions 6,663,209.65 1,399,274.03Total 8,398,126.23 1,763,606.51
II. State Agencies
Agency Current Spending ($) Savings ($)Department of Public Safety 428,599.49 90,005.89Department of Transportation 392,812.20 82,490.56Grand River Dam Authority 69,619.15 14,620.02Department of Agriculture, Food & Forestry 66,723.71 14,011.98Other State Agencies 554,737.43 198,631.97
5

Summary: Light Bulbs and Ballasts (25)Contracting Officer: Lisa Bradley
fBackground:
¾ First statewide light bulb contract with tiered pricing ¾Added ballast products to contract
fSavings percentage: 30.8% fBest practices used:
¾ Contract was made mandatory to drive spend ¾ Pricing transparency ¾Used the Performance Information Procurement System (PIPS) methodology ¾Detailed vendor reports with performance data
I. Overall
Category Current Spending ($) Savings ($)State of Oklahoma 374,836.02 115,449.49Higher Education 1,782.80 549.10Political Sub-Divisions 68,916.70 21,226.34Total 445,535.52 137,224.94
II. State Agencies
Agency Current Spending ($) Savings ($)Department of Corrections 89,673.23 27,608.27Oklahoma Military Department 50,073.94 15,422.77Department of Veterans Affairs 38,435.67 11,838.19Office of Management & Enterprise Services 33,296.74 10,255.40Other State Agencies 163,392.44 50,324.87
6

Summary: Vehicle Contract (35)Contracting Officer: Laura Bybee
fBackground:
¾ Comprehensive, strategically sourced project ¾ Research-driven, analytical approach to sourcing
fSavings percentage: 5% fBest practices used:
¾ Pricing transparency ¾ Commodity Council ¾ Target pricing utilized
I. Overall
Category Current Spending ($) Savings ($)State of Oklahoma 17,583,473.50 879,173.68Higher Education 1,032,368.62 51,618.43Political Sub-Divisions 9,298,965.97 464,948.30Total 27,914,808.09 1,395,740.40
II. State Agencies
Agency Current Spending ($) Savings ($)Department of Public Safety 4,539,054.00 226,952.70Department of Transportation 2,828,077.92 141,403.90Office of Management & Enterprise Services 2,182,442.02 109,122.10Department of Corrections 2,079,606.29 103,980.31Other State Agencies 5,954,293.27 297,714.66
7

Summary: Compressed Natural Gas (CNG) Vehicle Contract (35C)Contracting Officer: Laura Bybee
fBackground:
¾ Comprehensive, strategically sourced project ¾ Research-driven
fSavings percentage: 25.98% fBest practices used:
¾ Commodity Council ¾Negotiated price from MSRP
I. Overall
Category Current Spending ($) Savings ($)State of Oklahoma 9,729,450.56 2,528,003.14Higher Education 84,029.84 21,833.47Political Sub-Divisions 379,629.78 98,639.21Total 10,193,110.18 2,648,475.82
II. State Agencies
Agency Current Spending ($) Savings ($)Department of Transportation 5,425,464.00 1,409,698.31Office of Management & Enterprise Services 2,271,390.00 590,175.26Oklahoma Turnpike Authority 1,356,365.56 352,424.46Department of Wildlife Conservation 406,848.00 105,711.32Other State Agencies 269,383.00 69,993.78
8

Summary: Medium Duty Trucks Contract (35T)Contracting Officer: Laura Bybee
fBackground:
¾ Comprehensive, strategically sourced project ¾ Research-driven
fSavings percentage: 28% fBest practices used:
¾ Commodity Council ¾Negotiated price from MSRP
I. Overall
Category Current Spending ($) Savings ($)State of Oklahoma 3,675,554.06 1,029,155.14Higher Education 0.00 0.00Political Sub-Divisions 4,111,689.36 1,151,273.02Total 7,787,243.42 2,180,428.16
II. State Agencies
Agency Current Spending ($) Savings ($)Department of Transportation 3,323,082.44 930,463.08Oklahoma Turnpike Authority 273,271.62 73,516.05Department of Corrections 79,200.00 22,176.00
9
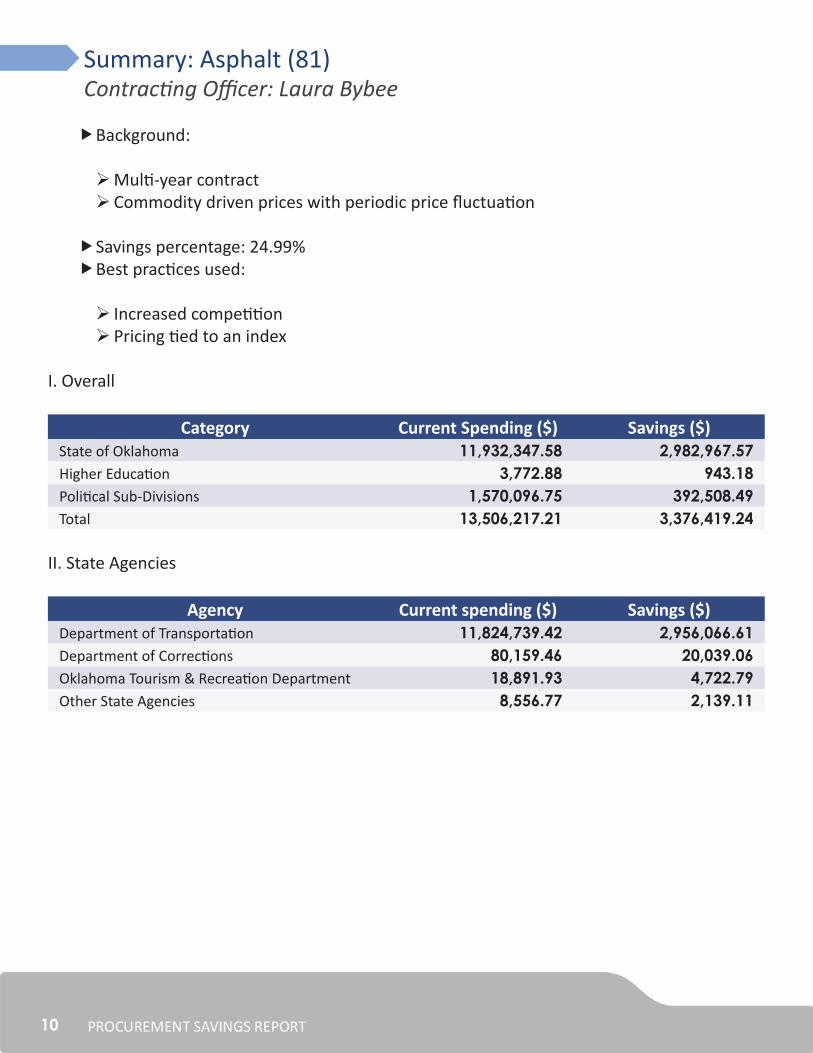
Summary: Asphalt (81)Contracting Officer: Laura Bybee
fBackground:
¾ Commodity driven prices with periodic price fluctuation ¾Multi-year contract
fSavings percentage: 24.99% fBest practices used:
¾ Increased competition ¾ Pricing tied to an index
I. Overall
Category Current Spending ($) Savings ($)State of Oklahoma 11,932,347.58 2,982,967.57Higher Education 3,772.88 943.18Political Sub-Divisions 1,570,096.75 392,508.49Total 13,506,217.21 3,376,419.24
II. State Agencies
Agency Current spending ($) Savings ($)Department of Transportation 11,824,739.42 2,956,066.61Department of Corrections 80,159.46 20,039.06Oklahoma Tourism & Recreation Department 18,891.93 4,722.79Other State Agencies 8,556.77 2,139.11
10

Summary: Hazardous Waste Pick-ups and Disposal for Routinely Generated Waste (92B)Contracting Officer: Lisa Bradley
fBackground:
¾ SW092B was separated from SW092A and created to get the best pricing for the state by unbundling offerings
fSavings percentage: 31%
¾Waste sludge paid $0.11/gal standard state rate $1.00/gal
fBest practices used:
¾Used the Performance Information Procurement System (PIPS) methodology ¾ Pricing modified to be fully-loaded for operator needed equipment ¾ Fuel surcharges modified, tied to index
I. Overall
Category Current Spending ($) Savings ($)State of Oklahoma 127,467.45 39 833.58Higher Education 76,587.90 23,933.72Political Sub-Divisions 47,267.38 14,771.06Total 47,267.38 78,538.35
II. State Agencies
Agency Current Spending ($) Savings ($)Oklahoma Military Department 41,025.35 12,820.42Department of Transportation 27,185.80 8,495.56Department of Environmental Quality 21,491.30 6,716.03Oklahoma Tourism & Recreation Department 16,615.50 5,192.34Other State Agencies 21,149.50 6,609.22
11

Summary: Dump Beds (106A)Contracting Officer: Joyce Leivas
fBackground:
¾ Contract was split from Utility Beds (106B) ¾ Commodity Council was formed to determine requirements ¾ Focus was given to right-sizing and providing detailed specifications
fSavings percentage: 7.94% fBest practices used:
¾ Right-sized ¾ RFP Improvements for clarity ¾ Commodity Council
I. Overall
Category Current Spending ($) Savings ($)State of Oklahoma 1,243,703.00 98,750.02Higher Education 0.00 0.00Political Sub-Divisions 324,615.22 25,774.45Total 1,568,318.22 124,524.47
II. State Agencies
Agency Current Spending ($) Savings ($)Department of Transportation 1,243,703.00 98,750.02
12

Summary: Prime Vendor Food (156)Contracting Officer: Theresa Johnson
fBackground:
¾ Comprehensive, strategically sourced project
fSavings percentage: 9.5% fBest practices used:
¾ Commodity Council ¾ Benchmarking ¾ Baseline formulation ¾ Spend data from various sources ¾ Target pricing ¾ Several rounds of negotiation
I. Overall
Category Current Spending ($) Savings ($)State of Oklahoma 13,238,060.24 1,257,615.72Higher Education 39,290.14 3,732.56Political Sub-Divisions 3,401,396.51 323,132.67Total 16,678,746.89 1,584,480.95
II. State Agencies
Agency Current Spending ($) Savings ($)Department of Corrections 9,391,488.97 892,191.45Department of Mental Health & Substance Abuse Services
1,304,685.06 123,945.08
Department of Human Services 1,053,924.50 100,122.83Other State Agencies 1,487,961.71 141,356.36
13

Summary: Farm/Landscape Equipment (190)Contracting Officer: Joyce Leivas
fBackground:
¾ Comprehensive, strategically sourced project
fSavings percentage: 28.93% fBest practices used:
¾ Spend data from various sources ¾GSA
I. Overall
Category Current Spending ($) Savings ($)State of Oklahoma 11,699,620.29 3,384,700.15Higher Education 1,664,401.41 481,511.33Political Sub-Divisions 9,215,252.95 2,665,972.68Total 22,579,274.65 6,532,184.16
II. State Agencies
Agency Current Spending ($) Savings ($)Department of Transportation 8,946,585.88 2,588,247.30Department of Wildlife Conservation 781,325.84 226,037.57Regents for Higher Education 460,713.69 133,284.47Other State Agencies 1,510,994.88 437,130.82
14

Summary: Slabjacking & Subsealing (721)Contracting Officer: Lisa Bradley
fBackground:
¾New bid / multi-year contract ¾ Commodity driven prices with periodic price fluctuation
fSavings percentage: 30.21% fBest Practices used:
¾ Increased competition
I. Overall
Category Current Spending ($) Savings ($)State of Oklahoma 328,301.74 99,179.96Higher Education 0.00 0.00Political Sub-Divisions 41,735.00 12,608.14Total 370,036.74 111,788.10
II. State Agencies
Agency Current Spending ($) Savings ($)Department of Transportation 171,017.74 51,664.46Oklahoma Turnpike Authority 157,284.00 47,515.50
15

Summary: Bread and Bakery Products (765)Contracting Officer: Theresa Johnson
fBackground:
¾Multi-year, statewide contract which was previously bid as an annual open market contract
fSavings percentage: 10.08% fBest Practices used:
¾ Commodity Council ¾ Expanded contract period to protect against price fluctuations ¾ Streamlined the solicitation process, affording vendors the opportunity to respond electronically
I. Overall
Category Current Spending ($) Savings ($)State of Oklahoma 536,370.22 54,066.12Higher Education 2,798.00 282.04Political Sub-Divisions 2,832.50 285.52Total 542,000.72 54,633.67
II. State Agencies
Agency Current Spending ($) Savings ($)Department of Corrections 393,435.65 39,658.31Department of Veterans Affairs 70,189.53 7,075.10Department of Mental Health & Substance Abuse Services
39,344.77 3,964.94
Department of Human Services 13,137.95 1,324.31Other State Agencies 20,272.32 2,043.45
16
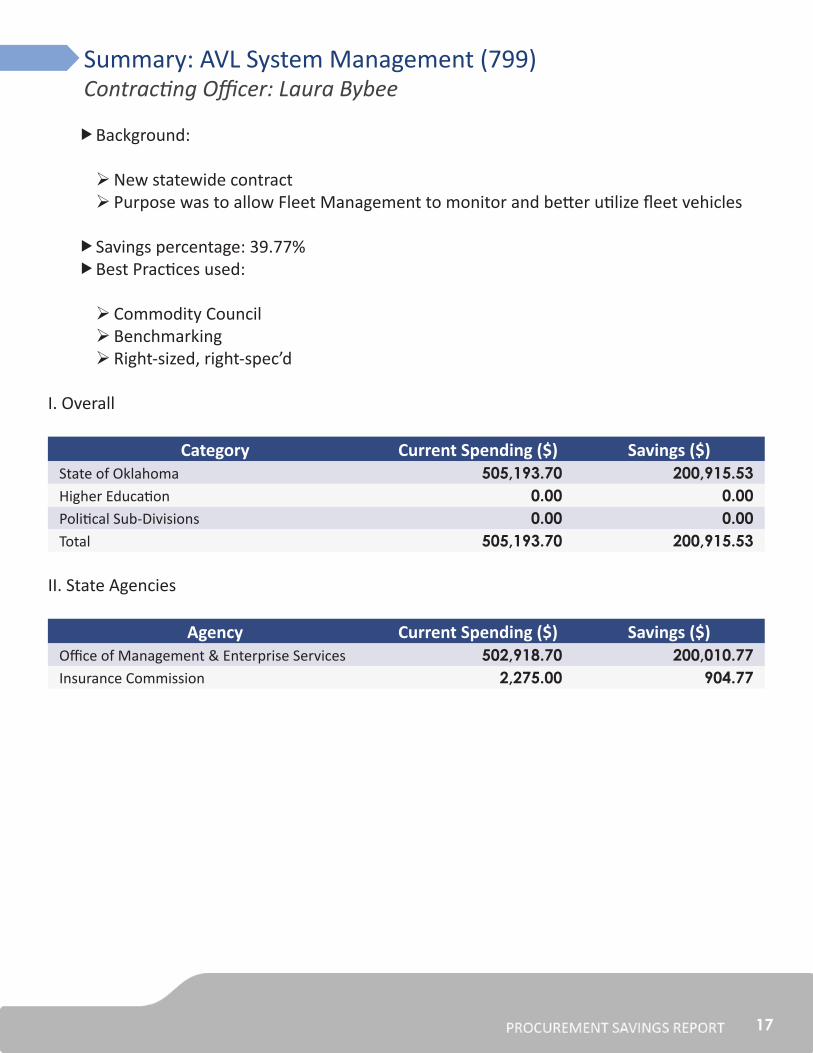
Summary: AVL System Management (799)Contracting Officer: Laura Bybee
fBackground:
¾New statewide contract ¾ Purpose was to allow Fleet Management to monitor and better utilize fleet vehicles
fSavings percentage: 39.77% fBest Practices used:
¾ Commodity Council ¾ Benchmarking ¾ Right-sized, right-spec’d
I. Overall
Category Current Spending ($) Savings ($)State of Oklahoma 505,193.70 200,915.53Higher Education 0.00 0.00Political Sub-Divisions 0.00 0.00Total 505,193.70 200,915.53
II. State Agencies
Agency Current Spending ($) Savings ($)Office of Management & Enterprise Services 502,918.70 200,010.77Insurance Commission 2,275.00 904.77
17

Summary: Maintenance, Repair, and Operations (817)Contracting Officer: Lisa Bradley
fBackground:
¾ Comprehensive, strategically sourced project
fSavings percentage: 16% fBest Practices used:
¾ Benchmarking ¾ Right sized, right-spec’d ¾ Target pricing ¾ Increased competition ¾Negotiation (3 rounds)
I. Overall
Category Current Spending ($) Savings ($)State of Oklahoma 7,891,150.58 1,262,584.09Higher Education 278,912.69 44,626.03Political Sub-Divisions 2,161,256.21 345,800.99Total 10,331,319.48 1,653,011.12
II. State Agencies
Agency Current Spending ($) Savings ($)Department of Corrections 2,923,396.72 467,743.48Department of Transportation 889,987.82 142,398.05Oklahoma Military Department 682,252.77 109,160.44Department of Human Services 662,221.98 105,955.52Other State Agencies 2,733,291.29 437,326.61
18

Statewide Contract Savings Detail by AgencyAgency Code Agency Current
Spending ($) Savings ($)
00025 Oklahoma Military Department 1,324,724.69 240,186.07 00030 ABLE Commission 93,329.34 5,234.0400039 Boll Weevil Eradication 37,754.85 9,663.5000040 Department of Agriculture, Food & Forestry 677,664.72 109,666.4800047 Indigent Defense System 397.43 63.5900049 Office of the Attorney General 50,066.27 2,536.8000060 Aeronautics Commission 2,257.81 361.2500080 Career and Technology Education 711,768.21 138,282.0700090 Office of Management & Enterprise Services 5,248,617.78 956,438.6600092 Tobacco Settlement Endowment Trust 1.50 0.4600125 Department of Mines 119.34 25.0600131 Department of Corrections 15,439,840.51 1,683,933.8200160 Department of Commerce 9,573.44 1,591.6200185 Corporation Commission 14,760.40 2,817.3800204 J.M. Davis Memorial Commission 799.75 246.3200220 District Attorneys Council 1,645.37 342.2100265 Department of Education 277.44 40.8400266 Oklahoma Educational Television Authority 3,730.50 596.8800270 State Election Board 60.94 9.7500290 Employment Security Commission 4,615.82 738.5300292 Department of Environmental Quality 85,489.89 18,953.7600300 State Auditor and Inspector 127.70 12.1300308 Oklahoma State Bureau of Investigation 537,019.02 31,506.2200309 Department of Emergency Management 29,876.21 5,348.3700310 State Fire Marshal 257.08 24.4200320 Department of Wildlife Conservation 2,133,544.61 397,385.4100325 Oklahoma Geological Survey 845.76 135.3200340 Department of Health 1,654,621.83 38,114.9100342 Board of Medicolegal Investigations 17,193.86 2,839.2400345 Department of Transportation 35,112,092.23 8,419,289.8600346 Space Industry Development Authority 13,883.79 3,557.2600350 Oklahoma Historical Society 97,964.12 24,611.2800353 Horse Racing Commission 450.92 72.1500361 Native American Cultural and Education Authority 23.96 2.2800385 Insurance Department 173,235.00 9,452.7700390 CompSource Oklahoma 15,177.93 2,714.47
19

Statewide Contract Savings Detail by AgencyAgency Code Agency Current
Spending ($) Savings ($)
00400 Office of Juvenile Affairs 747,859.12 72,636.3900405 Department of Labor 338,794.06 17,709.9300410 Commissioners of the Land Office 20,012.19 5,551.4900415 Council on Law Enforcement Education & Training 25,798.49 4,952.9400421 Oklahoma State Senate 1,053.48 168.5600430 Department of Libraries 6,803.75 1,088.6000445 Liquefied Petroleum Gas Board 633.68 133.0700452 Department of Mental Health & Substance Abuse
Services5,317,437.50 202,475.16
00477 Bureau of Narcotics and Dangerous Drugs 214,770.16 12,431.0600515 Public Employees Retirement System 628.28 100.5200516 Employees Group Insurance Division 1,030.96 97.9400566 Oklahoma Tourism & Recreation Department 1,037,592.56 191,796.7000568 Scenic Rivers Commission 805.05 167.5100570 Licensure for Professional Engineers & Land Surveyors 10.38 3.2000585 Department of Public Safety 5,394,671.81 379,883.2900588 Real Estate Commission 340.02 32.3000605 Regents for Higher Education 537,838.17 137,650.7100625 Oklahoma Secretary of State 102.87 16.4600629 School of Science and Mathematics 2,616.15 796.6800645 Oklahoma Conservation Commission 3,959.08 787.4400650 Department of Veterans Affairs 678,515.66 89,602.2200670 J.D. McCarty Center 337,708.69 38,911.0800677 Oklahoma Supreme Court 1,267.34 202.7700695 Oklahoma Tax Commission 17,595.50 2,815.2800740 Oklahoma State Treasurer’s Office 96.93 15.5100772 Board of Tests for Alcohol and Drug Influence 178.04 16.9100805 Department of Rehabilitation Services 509,192.68 52,840.8800807 Oklahoma Health Care Authority 5,709.67 913.5500830 Department of Human Services 3,519,197.74 269,576.8800835 Water Resources Board 70,016.32 3,952.5300978 Oklahoma Turnpike Authority 3,468,229.07 617,927.9900980 Grand River Dam Authority 902,424.70 97,339.8299999 Political Sub-Divisions 37,688,690.55 6,921,509.16HE001 Higher Education 30,335,448.35 936,412.52Grand Total 154,680,838.99 22,167,312.20
20

Central Purchasing Division Acquisition Team Savings
Career and Technology Education (00800)Vendor Annual Spending ($) Savings ($) Best Practices Utilized
Clampitt Paper 92,950.00 2,475.00 3% Competitive bid (Average minus Awarded bid)
Unisource Worldwide 174,252.00 6,708.00 4% Competitive bid (Historical price
minus Awarded bid)Unisource Worldwide 173,355.00 897.00 1% Negotiated in savings
Corporation Commission (00185)Vendor Annual Spending ($) Savings ($) Best Practices Utilized
United Cementing LLC 67,551.00 162,036.75 71% Competitive bid (Average minus
Awarded bid)
Department of Agriculture, Food & Forestry (00040)Vendor Annual Spending ($) Savings ($) Best Practices Utilized
Casco Industries 129,000.00 2,500.00 2% Competitive bid (Average minus Awarded bid)
Weyerhaueuser NR Company 88,750.00 1,250.00 1% Negotiated savings
Department of Corrections (00131)Vendor Annual Spending ($) Savings ($) Best Practices Utilized
American Aluminum 136,464.00 10,686.00 7% Negotiated savings
Culinary Depot 69,336.33 6,486.66 9% Competitive bid (Average minus Awarded bid)
Keewes Equipment Company
53,162.00 10,351.38 16% Competitive bid (Average minus Awarded bid)
Sentinel Fence & Contracting 137,453.98 19,831.83 13% Competitive bid (Average minus
Awarded bid)
Shoop & Sons 80,076.41 15,778.94 16% Competitive bid (Average minus Awarded bid)
Shoop & Sons 83,460.86 14,518.96 15% Competitive bid (Average minus Awarded bid)
Stericycle 54,250.00 364.00 1% Negotiated in savings
United Rentals 55,057.00 19,198.67 26% Competitive bid (Average minus Awarded bid)
21

Central Purchasing Division Acquisition Team Savings
Department of Education (00265)Vendor Annual Spending ($) Savings ($) Best Practices Utilized
Behavior Doctor Seminars 88,260.00 30,770.00 26% Competitive bid (Average minus
Awarded bid)
TES Productions 70,000.00 23,284.88 25% Competitive bid (Average minus Awarded bid)
Department of Environmental Quality (00292)Vendor Annual Spending ($) Savings ($) Best Practices Utilized
Teledyne Instruments 98,941.00 1,691.80 2% Competitive bid (Average minus
Awarded bid)
Department of Health (00340)Vendor Annual Spending ($) Savings ($) Best Practices Utilized
Vi Marketing 885,000.00 416,470.50 32% Competitive bid (Average minus Awarded bid)
Department of Human Services (00830)Vendor Annual Spending ($) Savings ($) Best Practices Utilized
Labexpress, LLC 90,000.00 1,875.00 2% Competitive bid (Average minus Awarded bid)
Department of Public Safety (00265)Vendor Annual Spending ($) Savings ($) Best Practices Utilized
Carson Manufacturing 10,490.00 548.60 5% Competitive bid (Average minus
Awarded bid)Eurocopter 2,695,700.00 589,564.00 1% Negotiated in savings
Multiple Vendors 150,161.50 28,146.90 16% Negotiated in savings for ammunition
Turn-key Mobile 89,726.00 2,998.00 3% Competitive bid (Average minus Awarded bid)
Visual Force, Inc. 51,083.20 19,823.90 28% Competitive bid (Average minus Awarded bid)
22

Central Purchasing Division Acquisition Team Savings
Oklahoma Tourism & Recreation Department (00566)Vendor Annual Spending ($) Savings ($) Best Practices Utilized
T & A Sawmill 316,550.00 161,389.07 34% Competitive bid (Average minus Awarded bid)
Woods Work Enterprises 56,690.00 10,923.00 16% Competitive bid (Average minus
Awarded bid)
Department of Transportation (00345)Vendor Annual Spending ($) Savings ($) Best Practices Utilized
Ames Engineering 43,270.00 1,994.67 4% Competitive bid (Average minus Awarded bid)
CL Boyd Company 85,200.00 40,223.33 32% Competitive bid (Average minus Awarded bid)
Coastal Energy 1,216,844.06 26,120.48 2% Competitive bid (Average minus Awarded bid)
Multiple Vendors 455,229.61 5,279.21 1% Negotiated savingsMultiple Vendors 122,172.00 2,552.00 2% Negotiated savings
Department of Veterans Affairs (00650)Vendor Annual Spending ($) Savings ($) Best Practices Utilized
Arrow Machinery Co. 81,850.00 33,571.00 29% Competitive bid (Average minus
Awarded bid)
James Supplies 33,230.00 10,626.00 24% Competitive bid (Average minus Awarded bid)
RadSource Imaging 81,417.92 2,518.08 3% Negotiated savings
Department of Wildlife Conservation (00320)Vendor Annual Spending ($) Savings ($) Best Practices Utilized
GT Distributors 51,405.00 531.50 1% Competitive bid (Average minus Awarded bid)
Oklahoma Historical Society (00350)Vendor Annual Spending ($) Savings ($) Best Practices Utilized
US Lawns 45,036.00 23,622.00 34% Negotiated additional services, terms and lower costs.
23

Central Purchasing Division Acquisition Team Savings
JD McCarty Center (00670)Vendor Annual Spending ($) Savings ($) Best Practices Utilized
Walgreens 230,000.00 2,400.00Negotiated $2.00 dispensing fee to zero which will save approximately $200 per month
Board of Medicolegal Investigations (00342)Vendor Annual Spending ($) Savings ($) Best Practices Utilized
Shimadzu Scientific Instruments
97,990.14 4,421.87 4% Competitive bid (Average minus Awarded bid)
Office of Management & Enterprise Services (00090)Vendor Annual Spending ($) Savings ($) Best Practices Utilized
MSB Consulting 54,500.00 1,500.00 3% Competitive bid (Average minus Awarded bid)
Neville Blair Kenning 77,700.00.00 11,150.00 13% Competitive bid (Average minus
Awarded bid)
School of Science & Mathematics (00629)Vendor Annual Spending ($) Savings ($) Best Practices Utilized
Valley Services 473,785.00 2,685.00 1% Competitive bid (Average minus Awarded bid)
Oklahoma Supreme Court (00677)Vendor Annual Spending ($) Savings ($) Best Practices Utilized
CHT 812,382.00 216,178.00 21% Negotiated savingsTyler Tech. 2,356,765.00 932,843.00 28% Negotiated savings
Oklahoma Tax Commission (00695)Vendor Annual Spending ($) Savings ($) Best Practices Utilized
BKD LLP 290,000.00 40,000.00 12% Negotiated savings in a lower hourly rate
Performance Office Papers 120,240.00 22,600.08 16% Competitive bid (Average minus
Awarded bid)
24
Central Purchasing Division Acquisition Team Savings
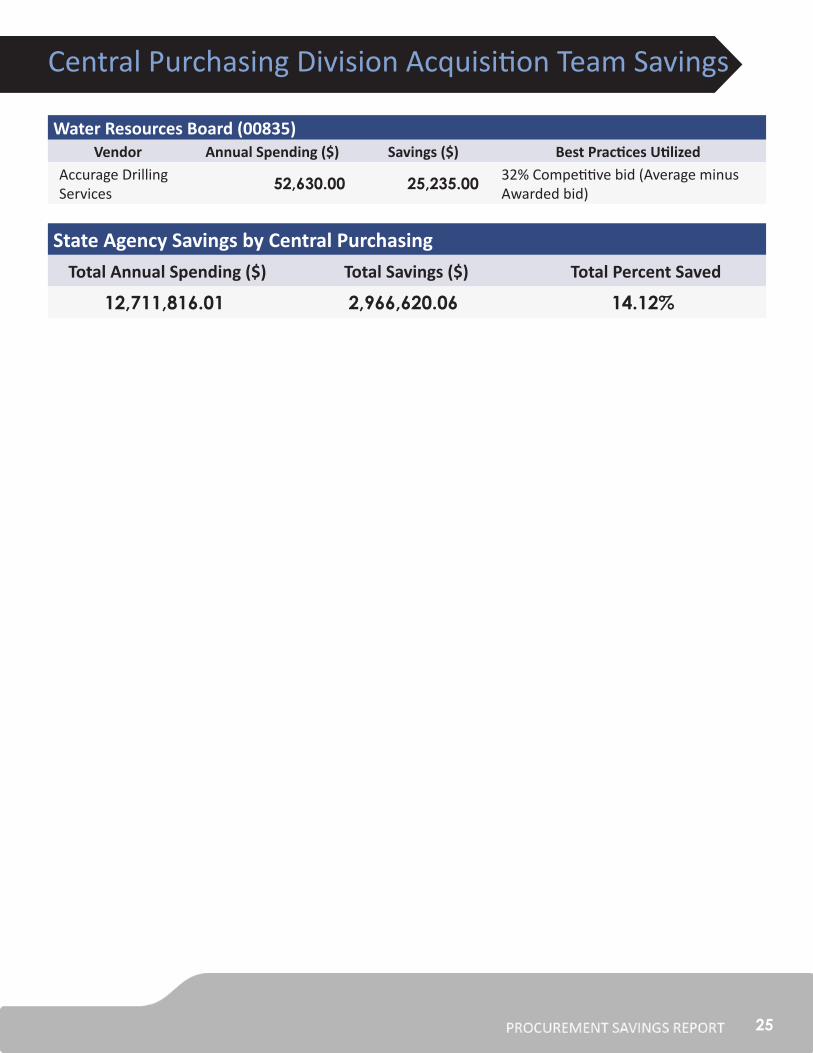
Water Resources Board (00835) Vendor Annual Spending ($) Savings ($) Best Practices Utilized
Accurage Drilling Services 52,630.00 25,235.00 32% Competitive bid (Average minus
Awarded bid)
State Agency Savings by Central PurchasingTotal Annual Spending ($) Total Savings ($) Total Percent Saved
12,711,816.01 2,966,620.06 14.12%
25

Savings Reported by State Agency Certified Procurement Officers
Aeronautics Commission (00060) Vendor Annual Spending ($) Savings ($) Best Practices Utilized
Various Vendors 4,732.56 2,572.42 Best value, right sizing
Department of Commerce (00160)Vendor Annual Spending ($) Savings ($) Best Practices Utilized
Various Vendors 111,109.20 120,852.68 Competitive Bid
Department of Mental Health & Substance Abuse Services (00452)Vendor Annual Spending ($) Savings ($) Best Practices Utilized
AT&T 11,060.00 10,000.00 Best Spend Practices UtilizedEcolab, Inc. 2,094.40 650.00 Best Spend Practices Utilized
Department of Public Safety (00585)Vendor Annual Spending ($) Savings ($) Best Practices Utilized
Various Vendors 152,680.70 59,139.92 Open Market Bid
Oklahoma Health Care Authority (00807)Vendor Annual Spending ($) Savings ($) Best Practices Utilized
American Medical Association 13,189.10 12,368.93 Competitive Bid
Oklahoma State Bureau of Investigation (00308)Vendor Annual Spending ($) Savings ($) Best Practices Utilized
TriTech Forensics 49,440.00 8,560.00 Competitive Bid
Agency Reported Savings
Total Annual Spending ($) Total Savings ($) Total Percent Saved
344,305.96 214,143.95 62%
26

Information Services Division (ISD)
FY2013 New Statewide Contracts
fITSW 1006 Avaya Network Products fITSW 1014 Satellite Telephones fITSW 1020 Lexmark WSCA agreement fITSW 1021 AV Products, Services & Installation fITSW 1023 PeopleSoft Staff Augmentation fITSW 1025 IT Staffing & Services fITSW 1026 Lenovo WSCA agreement fITSW 1028 Fujitsu Network Equipment fITSW 0206 Apple Computers WSCA
Notes Regarding Cost Avoidance Calculations
Cost avoidance and percentages were based on the State discount price structure off MSRP. An average discount was used if varying discounts were given on items in the contract.Multiple discount percentages across a specific contract resulting in an average of the discounts being used for cost avoidance calculations.
27

Information Services Division
IT Statewide Contract FY2103 Detail
SW Contract # Total Sales ($) % off MSRP Total Avoidance ($)ITSW 1001 Virus Protection 413,471.70 52% 215,005.28ITSW 1002 Desktop Management 425,462.55 43% 182,948.90ITSW 1006 Network Products & Services 7,193,152.81 38% 2,733,398.07ITSW 1007 EPPM 210,657.00 30% 63,197.10ITSW 1008 Mailroom Equipment (PB) 155,272.75 48% 74,487.72ITSW 1008 Mailroom Equipment (Neopost) 433,360.00 35% 151,676.00ITSW 1010 Microsoft LAR 10,746,777.59 17.1% 1,837,698.97ITSW 1011 Oracle DB 2,582,957.92 45% 1,162,331.06ITSW 1012 Wireless (AT&T) 4,082,782.99 25% 1,020,695.75ITSW 1012 Wireless (Verizon) 4,375,508.06 23% 1,006,366.85ITSW 1012 Wireless (Sprint) 2,072,187.39 25% 518,046.85ITSW 1012 Wireless (US Cellular) 381,232.38 22% 83,871.12ITSW 0171 Copiers (Xerox) 1,287,835.48 21%* 270,445.45ITSW 0171 Copiers (Standley) 5,569,443.88 15%* 835,416.58ITSW 0206 WSCA Computer (HP) 7,497,365.50 15%* 1,124,604.83ITSW 0206 (Dell) 29,553,062.76 15%* 4,432,959.41ITSW 0206 (IBM) 972,364.55 15%* 145,854.68ITSW 0206 (EMC) 704,760.00 40%* 281,904.00ITSW 0206 (Apple) 12,247,104.54 11%* 1,347,181.50ITSW 0206 (Panasonic) 507,135.30 20%* 101,427.06ITSW 0207 PC Standardization (Dell) 5,103,136.21 54% 2,755,693.55ITSW 0402 Public Safety Communications 7,477,842.79 20% 1,495,568.56ITSW 0450 Telecom (AT&T) 12,013,096.00 12% 1,441,571.52ITSW 0450 Telecom (Cox) 19,591,601.10 10% 1,959,160.11ITSW 0450 Telecom (Presidio) 2,872,277.00 20% 574,455.40ITSW 0782 Imaging 2,588,138.09 25% 647,034.52
Totals 141,058,989.75 26,463,195.71
*Multiple percentage discounts across specific contract items result in an average of the discounts.
28
Information Services Division
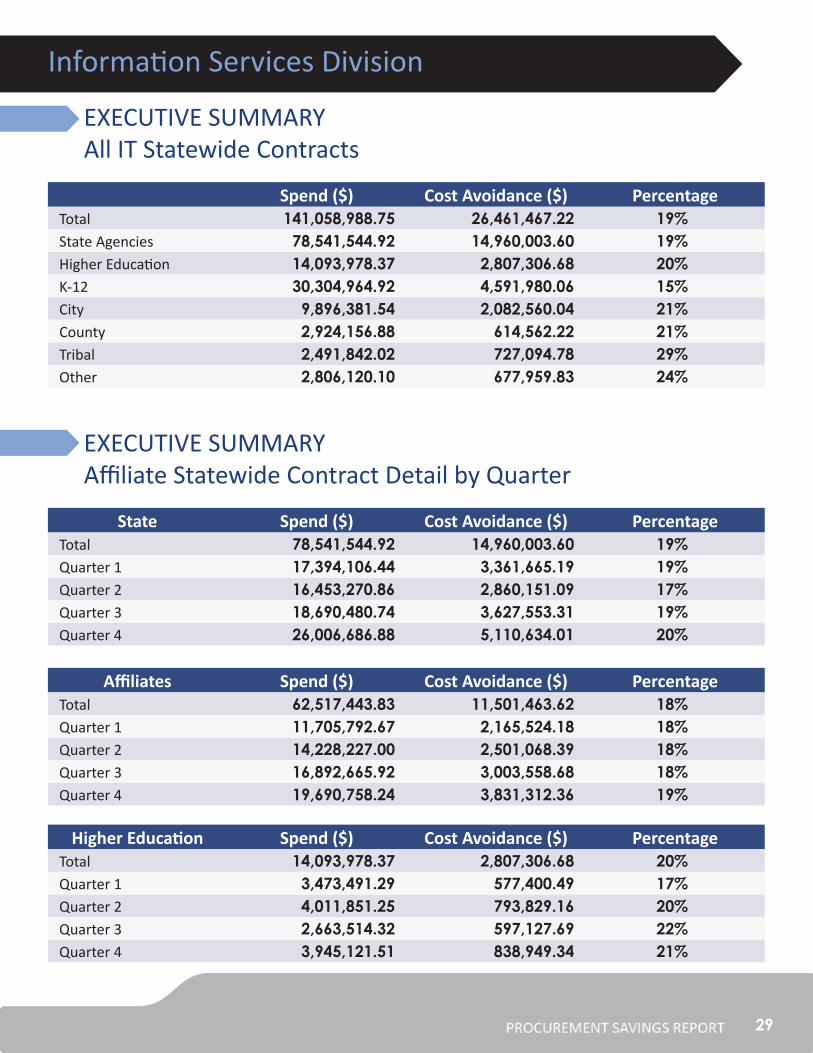
EXECUTIVE SUMMARYAll IT Statewide Contracts
Spend ($) Cost Avoidance ($) PercentageTotal 141,058,988.75 26,461,467.22 19%State Agencies 78,541,544.92 14,960,003.60 19%Higher Education 14,093,978.37 2,807,306.68 20%K-12 30,304,964.92 4,591,980.06 15%City 9,896,381.54 2,082,560.04 21%County 2,924,156.88 614,562.22 21%Tribal 2,491,842.02 727,094.78 29%Other 2,806,120.10 677,959.83 24%
EXECUTIVE SUMMARYAffiliate Statewide Contract Detail by Quarter
State Spend ($) Cost Avoidance ($) PercentageTotal 78,541,544.92 14,960,003.60 19%Quarter 1 17,394,106.44 3,361,665.19 19%Quarter 2 16,453,270.86 2,860,151.09 17%Quarter 3 18,690,480.74 3,627,553.31 19%Quarter 4 26,006,686.88 5,110,634.01 20%
Affiliates Spend ($) Cost Avoidance ($) PercentageTotal 62,517,443.83 11,501,463.62 18%Quarter 1 11,705,792.67 2,165,524.18 18%Quarter 2 14,228,227.00 2,501,068.39 18%Quarter 3 16,892,665.92 3,003,558.68 18%Quarter 4 19,690,758.24 3,831,312.36 19%
Higher Education Spend ($) Cost Avoidance ($) PercentageTotal 14,093,978.37 2,807,306.68 20%Quarter 1 3,473,491.29 577,400.49 17%Quarter 2 4,011,851.25 793,829.16 20%Quarter 3 2,663,514.32 597,127.69 22%Quarter 4 3,945,121.51 838,949.34 21%
29

Information Services Division
EXECUTIVE SUMMARYAffiliate Statewide Contract Detail by Quarter
K-12 Spend ($) Cost Avoidance ($) PercentageTotal 30,304,964.12 4,591,980.06 15%Quarter 1 4,634,647.49 700,931.19 15%Quarter 2 6,522,945.79 965,526.47 15%Quarter 3 9,892,345.38 1,402,734.22 14%Quarter 4 9,255,026.06 1,522,788.18 16%
City Spend ($) Cost Avoidance ($) PercentageTotal 9,896,381.54 2,082,560.04 21%Quarter 1 1,291,230.57 313,025.29 24%Quarter 2 2,101,756.41 408,861.42 19%Quarter 3 2,324,422.55 528,886.63 23%Quarter 4 4,178,972.01 831,786.70 20%
County Spend ($) Cost Avoidance ($) PercentageTotal 2,924,156.88 614,562.22 21%Quarter 1 749,888.08 151,433.15 20%Quarter 2 713,872.88 137,494.90 19%Quarter 3 720,223.35 160,717.37 22%Quarter 4 740,172.57 164,916.80 22%
Tribal Spend ($) Cost Avoidance ($) PercentageTotal 2,491,842.02 727,094.78 29%Quarter 1 656,835.69 212,759.06 32%Quarter 2 346,559.49 83,902.37 24%Quarter 3 673,824.62 186,986.76 28%Quarter 4 814,622.22 243,446.59 30%
Other Spend ($) Cost Avoidance ($) PercentageTotal 2,806,120.10 677,959.83 24%Quarter 1 899,699.55 209,975.01 23%Quarter 2 531,241.18 111,454.08 21%Quarter 3 618,335.70 127,106.01 21%Quarter 4 756,843.67 229,424.74 30%
30

Information Services Division
EXECUTIVE SUMMARYITSW 206 Dell WSCAAverage 15% off MSRP
Spend ($) Cost Avoidance ($)Total 29,553,062.76 4,432,959.41State 3,677,706.91 551,656.04Affiliates 25,875,355.85 3,881,303.37
Top 5 State Agencies
Agency Purchase Orders Spend ($)* Cost Avoidance ($)Office of Management & Enterprise Services 730,718.99 109,607.85Oklahoma Tax Commission 465,729.72 69,859.46Corporation Commission 285,724.12 42,858.62Department of Public Safety 282,503.56 42,375.53Department of Veterans Affairs 268,221.34 40,233.20
*Spend is based off of PO’s issued and doesn’t include Pcard transactions
EXECUTIVE SUMMARYITSW 206 Apple WSCAAverage 11% off MSRP
Spend ($) Cost Avoidance ($)Total 12,247,104.54 1,347,181.50State 217,168.50 23,888.54Affiliates 12,029,936.04 1,323,292.94
Top 5 State Agencies
Agency Purchase Orders Spend ($)* Cost Avoidance ($)Department of Education 41,140.27 4,525.43Oklahoma Tourism & Recreation Department 10,116.90 1,112.86Police Pension & Retirement System 7,784.00 856.24Commission on Consumer Credit 6,790.00 746.90Department of Environmental Quality 6,594.00 725.34
*Spend is based off of PO’s issued and doesn’t include Pcard transactions
31

Information Services Division
EXECUTIVE SUMMARYITSW 450 AT&T Telecom12% off MSRP
Spend ($) Cost Avoidance ($)Total 12,013,096.00 1,441,571.52State 12,013,096.00 1,441,571.52Affiliates Not Reported Not Reported
Top 5 State Agencies
Agency Purchase Orders Spend ($)* Cost Avoidance ($)Department of Public Safety 1,670,887.25 200,506.47Office of Management & Enterprise Services 1,177,208.68 141,265.04Department of Corrections 641,934.85 77,032.18Employment Security Commission 470,100.00 56,412.00Department of Environmental Quality 359,436.80 43,132.42
*Spend is based off of PO’s issued and doesn’t include Pcard transactions
EXECUTIVE SUMMARYITSW 1010 SHI Microsoft17.1% off MSRP
Spend ($) Cost Avoidance ($)Total 10,746,777.59 1,837,698.97State 9,916,967.40 1,695,801.43Affiliates 829,810.19 141,897.54
Top 5 State Agencies
Agency Purchase Orders Spend ($)* Cost Avoidance ($)Office of Management & Enterprise Services 6,077,216.00 1,039,203.94Department of Commerce 354,616.00 60,639.34Department of Human Services 292,637.00 50,040.93Department of Transportation 91,678.00 15,676.94Department of Rehabilitation Services 60,373.00 10,323.78
*Spend is based off of PO’s issued and doesn’t include Pcard transactions
32

Information Services Division
FY2013 Agency Acquisition Savings
Agency Contract Description Savings ($) Spend ($) Award Details
Department of Corrections
Digital Panoramic X-Ray System 71,519.88 175,287.50
$71,519 over 10 months. Savings realized 09/2012 through 06/2013.
Department of Health
Lumension Patch & Remediation/Lumension Content Wizard
9,590.29 64,141.93$9,590.29 over 9 months. Savings realized 10/2012 through 06/2013.
Department of Human Services
Child Support Registry Services 249,814.24 3,712,500.00
$249,814.24 over 11 months. Savings realized 08/2012 through 06/2013.
Oklahoma State Treasurer’s Office
Unclaimed Property Location & Processing Services
49,119.83 112,967.12$49,119.83 over 3 months. Savings realized 04/2013 through 06/2013.
Department of Education
Lexile & Quantile Licenses 4,200.00 42,000.00
$4,200 over 4 months. Savings realized 03/2013 through 06/2013
Department of Transportation
Video Editing Solution 2,472.48 5,249.91 $2,472.48 over 1 month.
Savings realized 06/2013.Oklahoma Health Care Authority
Microsoft Great Plains Financial System Upgrade
3,610.68 10,689.17$3,610.68 over 2 months. Savings realized 05/2013 through 06/2013.
33


