Price Advertising In Franchised Chains: The Case Of McDonald's
46
Price Advertising In Franchised Chains: The Case Of McDonald’s Dollar Menu * Itai Ater Stanford University [email protected] Oren Rigbi Stanford University [email protected] November 2007 Abstract We highlight the role of advertising as a mechanism for alleviating organizational agency problems. Through advertising, the chain informs consumers about a desired behavior for franchisees. Consequently, franchisees find it optimal to adopt the chain’s desired behavior. We demonstrate this idea using McDonald’s Dollar Menu advertising campaign in 2002. We exploit McDonald’s dual organizational structure, operating both corporate- owned and franchised restaurants to test changes in the prices of advertised and non- advertised items. We find that price differences between franchised and corporate-owned outlets have decreased substantially only for items with good substitutes in the Dollar Menu. Second, the change in the price differential is larger in outlets located near highways, where the incentive of franchisees to free-ride on the chain’s reputation is large. These findings suggest that the Dollar Menu advertising campaign has improved McDonald’s control over its franchisees, and that, more generally, advertising could play an important role within the organization. * We are indebted to Liran Einav for his guidance and support beginning in the early stages of the project. We are thankful to Raphael Thomadsen for his comments and for kindly providing us with the 1999 data. We are grateful to Ran Abramitzky, Tim Bresnahan and Peter Reiss for very helpful guidance and advice. We also received helpful comments from Susan Athey, Assaf Eilat, David Genesove, Seema Jayachandran, Jakub Kastl, Francine Lafontaine, Philip Leslie, Yaniv Yedid-Levi, the I.O.workshop participants at Stanford University and at the 2007 ALEA Meeting. Ater gratefully acknowledges financial support from the Stanford John M. Olin Law and Economics Program and the B.F. Haley and E.S. Shaw Fellowship. 1
Transcript of Price Advertising In Franchised Chains: The Case Of McDonald's

Price Advertising In Franchised Chains: The Case Of
McDonald’s Dollar Menu∗
Itai Ater
Stanford University
Oren Rigbi
Stanford University
November 2007
Abstract
We highlight the role of advertising as a mechanism for alleviating organizational agency
problems. Through advertising, the chain informs consumers about a desired behavior
for franchisees. Consequently, franchisees find it optimal to adopt the chain’s desired
behavior. We demonstrate this idea using McDonald’s Dollar Menu advertising campaign
in 2002. We exploit McDonald’s dual organizational structure, operating both corporate-
owned and franchised restaurants to test changes in the prices of advertised and non-
advertised items. We find that price differences between franchised and corporate-owned
outlets have decreased substantially only for items with good substitutes in the Dollar
Menu. Second, the change in the price differential is larger in outlets located near highways,
where the incentive of franchisees to free-ride on the chain’s reputation is large. These
findings suggest that the Dollar Menu advertising campaign has improved McDonald’s
control over its franchisees, and that, more generally, advertising could play an important
role within the organization.
∗We are indebted to Liran Einav for his guidance and support beginning in the early stages of the project.
We are thankful to Raphael Thomadsen for his comments and for kindly providing us with the 1999 data. We
are grateful to Ran Abramitzky, Tim Bresnahan and Peter Reiss for very helpful guidance and advice. We also
received helpful comments from Susan Athey, Assaf Eilat, David Genesove, Seema Jayachandran, Jakub Kastl,
Francine Lafontaine, Philip Leslie, Yaniv Yedid-Levi, the I.O.workshop participants at Stanford University and
at the 2007 ALEA Meeting. Ater gratefully acknowledges financial support from the Stanford John M. Olin
Law and Economics Program and the B.F. Haley and E.S. Shaw Fellowship.
1

JEL classification: L14; L22; L42; K21; M37;
Keywords: Franchising; Free-Riding; Reputation; Advertising; Fast-Food
1 Introduction
Chains choose to franchise outlets in order to provide franchisees with high-powered incentives
to operate their outlets efficiently and to maximize profits.1 Typically, a chain receives royalties
based on its franchisees’ sales and the franchisees, who own and operate their businesses, max-
imize the profits net of royalties. Nevertheless, the franchising literature has long emphasized
the different incentives of the franchisees and the franchisor with respect to the chain’s overall
reputation. For instance, the chain considers future customers to be an important source of
profits, regardless of the specific outlet they visit. A franchisee, on the other hand, maximizes
her own, rather than the chain’s, profits and is concerned about future customers only as long
as they visit her own outlet. Thus, franchisees have little incentive, compared to the chain, to
take the impact of their pricing decision on the chain’s future sales into account.
In this paper, we empirically examine the inherent tension between the chain and its
franchisees by focusing on the largest franchising chain, McDonald’s. We offer a mechanism
that a chain can undertake to discipline franchisees and to induce them to choose prices that are
more aligned with the chain’s objective. Our idea is that by advertising low prices, the chain
alters consumers’ expectations to be offered lower prices and indirectly exploits consumers to
discipline franchisees’ behavior. Thus, our main goals are to demonstrate that franchisees,
maximizing their individual profits, choose prices that are too high (from the chain’s point of
view), and to show that a chain can discipline franchisees by advertising low-priced items.
The premise of our analysis is the notion of positive demand externalities - implying
that lower prices at one outlet positively affect future demand at the same outlet as well as
at other outlets of the chain. To establish a positive demand externality across the chain’s
outlets, we assume that consumers do not observe the price prior to entering an outlet and do
not necessarily visit the same outlet each time they patronize the chain. In addition, higher1According to Blair and Lafontaine (2005), franchising sales in the U.S. account for 12% of the GDP. The
literature on franchising distinguishes between business-format franchising and traditional franchising. This
paper focuses on the former.
2

(lower) prices have a negative (positive) effect on consumers’ future demand, and consumers
cannot completely differentiate between high prices at a particular restaurant and overall high
chain prices. Consequently, a franchisee who owns one outlet has fewer incentives to take the
impact of her pricing decisions on future sales into account compared to a franchisee who owns
multiple outlets. Furthermore, since the profits of the franchisor are determined based on
the sales across all outlets, the franchisor has an incentive to induce franchisees to internalize
the demand externality by choosing lower prices, thereby increasing other outlets’ sales. In
Appendix A, we develop a theoretical framework which characterizes the relationship between
a chain and its franchisees.2
To illustrate how advertising influences the prices at outlets characterized by different
incentives to internalize the price externality, we investigate the effect of the Dollar Menu
advertising campaign on prices at McDonald’s outlets. The Dollar Menu is a collection of
items whose price is advertised as $1 each. McDonald’s launched its Dollar Menu advertising
campaign in 2002, and its franchisees choose whether to adopt the advertised prices. The prices
of other items, which are not part of the Dollar Menu, are not advertised by McDonald’s. We
use unique panel data from 1999 and 2006 of the fast-food outlets located in Santa Clara
County, California and analyze the changes in prices charged at McDonald’s franchised and
company-owned outlets. We exploit the distinction between franchised and corporate-owned
restaurants as a proxy for different levels of incentives to internalize the demand externality.
Corporate-owned restaurants are assumed to have a higher incentive to take the impact of their
pricing decision on future sales into consideration compared to franchised outlets. We find that
franchisees’ price premium, defined as the price difference between franchised and corporate-
owned outlets, for the primary item of the Dollar Menu - the Double Cheeseburger - fell from
9% in 1999 to 0 in 2006. We also examine the changes in the prices of items whose price was
not advertised. For example, the price premium for the Big-Mac meal fell significantly. In
1999 the price premium was 12.4%, whereas in 2006 the premium dropped to 3.6%. On the
other hand, the price premium for the Fillet-O-Fish meal, another non-price advertised item,
has changed only slightly over the same period of time.
The distinct pricing patterns of the non-advertised items can be explained based on2The framework illustrates how low-price advertising affects both outlet prices and the franchisor’s profits.
It also demonstrates that it is in the chain’s interest not to induce lower prices at all of the chain outlets.
3

their substitutability with the Dollar Menu items. To examine the substitution pattern, we
analyze a separate dataset comprised of per item sales conducted at one McDonald’s franchised
outlet over several months before and after the introduction of the Dollar Menu. We present
evidence indicating that items whose price premia have fallen, such as the Big-Mac meal, are
characterized by high substitutability with the Dollar Menu items. On the other hand, items
whose premia have remained relatively stable, such as the Fillet-O-Fish, exhibit lower substi-
tutability with the Dollar Menu items. We interpret these substitution patterns as supporting
the view that the Dollar Menu advertising campaign led indirectly to lower price premia for
substitutable non-advertised items.
To further explore the pricing decisions of franchisees who adopted the low-priced items,
we use an outlet’s distance from the highway as an additional proxy for an outlet’s incentive to
take the impact of its pricing decision on future sales into account. In the regression analysis,
we test how an outlet’s distance from the highway affects the prices of the Big-Mac Meal, a
non-advertised item. We find, for example, that the price premium at franchised outlets located
near the highway was higher than the price premium at outlets located at a distance from the
highway. Furthermore, between 1999 and 2006, the price difference between franchised and
corporate-owned outlets has fallen more in outlets located close to a highway, compared to
outlets located at a distance from the highway.
Finally, we present evidence on restaurants located at airports, assuming that airport
restaurants are characterized by little incentive to internalize the demand externality they
impose on future sales. We compare airport and non-airport restaurants, and find that only
4% of the airport restaurants adopted a Value Menu, whereas all the non-airport restaurants
except one did adopt a Value Menu. Prices at airport restaurants are also significantly higher
than those at non-airport restaurants.
Three basic features of the fast-food franchising industry make it suitable for testing
reputation and advertisement theories. First, fast-food chains, such as McDonald’s, invest
tremendous resources in maintaining their brand name; advertisement is a prime example
of these substantial efforts.3 Second, a standard experience across fast-food chain outlets
has been a basic ingredient of the fast-food industry’s success and growth over the last 503In the U.S. McDonald’s spends about $600 million annually on advertising.
4

years. Thus, it is natural to focus on chains’ efforts to maintain and enhance their reputation
through advertising as well as to achieve uniformity across outlets. Importantly, the fact that
outlets offer the same set of products enables us to examine the impact of price-advertising
on advertised as well as on several non-advertised items. Finally, most franchising chains
operate franchised outlets as well as corporate-owned outlets. Whereas, the chain controls the
prices and quality in corporate-owned outlets, franchisees set the prices and decide whether to
adopt the advertised prices at their outlets. This mixed structure of operations offers a unique
opportunity to test the ability of the chain to affect prices at franchised outlets by comparing
the two types of outlets.
Our paper contributes to several strands of the literature. First, we link the advertising
literature and the organizational economics literature. We highlight a new role for price adver-
tising as a mechanism for alleviating organizational problems. Price advertising in franchised
chains is unique because the advertising and the pricing decisions are determined separately
by different decision makers. The chain determines the content and scope of advertising, while
the franchisees set the actual price.4 Our findings also contribute to the existing literature on
the effect of advertising on retailers’ profits and prices. In particular, we are able to provide a
simple explanation of the effects of advertisement on the prices of non-advertised items.5
Second, we provide empirical evidence for the benefits of vertical integration, in the
sense of a chain’s decision to operate through corporate-owned outlets or alternatively operate
through independent franchisees. Indeed, despite a substantial body of theoretical literature
on the costs and benefits of vertical integration, there exists only limited empirical evidence of
the extent of these costs and benefits.6 Our setup enables us to compare prices at franchised
and corporate outlets and to rule out alternative explanations for the variation in prices which
are not based on organizational structure. Indeed, several papers have discussed the concerns
of chains over franchisees’ free-riding problem,7 and how chains try to mitigate this problem.8
4See Steiner (1973) and Farris and Albion (1980) for related arguments.5See Bagwell (2005) for an extensive survey on the economic analysis of advertising and Milyo and Waldfogel
(1999) for a related paper on the effect of price-advertising on the prices of non-advertised items.6See Forbes and Lederman (2007) for another recent example.7Most of the franchising literature refers to the franchisee agency problem as free-riding. See the survey by
Lafontaine and Slade (2007)8For example, Brickley and Dark (1987) examined how repeat customer patterns affect decisions regarding
the location of franchised outlets vs. corporate-owned outlets. Other papers addressing the free-riding problems
5

Other papers have used cross-sectional data to explore how franchisees’ product quality and
prices differ from the quality and prices in corporate-owned outlets.9 However, these papers
have not used quantity and panel price data or exploited a change in franchisees’ incentives to
set lower prices as we do here.10
Finally, our paper contributes to the empirical literature on reputation, illustrating how
a chain can maintain and enhance its reputation. Previous empirical papers on reputation have
generally focused on the demand side of reputation and how consumers react to exogenous
events that affect a firm’s reputation.11 This paper, on the other hand, offers a supply-side
analysis of a reputation-enhancing mechanism.
The remainder of the paper is organized as follows. Section 2 provides information on
McDonald’s Dollar Menu and describes the data used in the paper. The estimation results
of the Dollar Menu’s effect on prices, the sales data analysis, the analysis using the highway
proxy and the airport data analysis are presented in Section 3. Section 4 reviews alternative
explanations for the observed patterns. In Section 5, we discuss our results and offer concluding
remarks.
in the context of franchising include Rubin (1978), Brickley (1999), Klein and Leffler (1981) and Lafontaine and
Shaw (2005).9For example, Barron and Umbeck (1984) found that a change in the contractual arrangement at gasoline
stations from refiner-controlled to a franchise operation reduced the hours of operation. Lafontaine and Slade
(1997) present a survey of the empirical evidence for the different pricing patterns. Lafontaine (1995) provided
evidence for fast-food chain restaurants in the Pittsburgh and Detroit metropolis, and Graddy (1997) found
similar patterns in fast-food chains in New Jersey.10Most closely related to this paper is the research of Jin and Leslie (forthcoming), who study the hygienic
quality of restaurants and use an exogenous change in the available information possessed by consumers to study
its effects on restaurants’ incentives to maintain good hygienic quality. Unlike Jin and Leslie, we investigate how
a chain can affect its franchisees’ incentives to adhere to the chain’s objective. Importantly, the chain cannot
self-regulate the franchisee’s behavior and needs to implement an alternative mechanism to achieve its goal.11Borenstein and Zimmerman (1988), for example, examined how the demand for air travel is affected by
accidents.
6

2 Dollar Menu, Data and Demand Externality Proxies
2.1 McDonald’s Dollar Menu
McDonald’s Dollar Menu is a collection of 6 to 8 menu items that are sold for one dollar
each. The Dollar Menu accounts for 14% of McDonald’s sales in the U.S.12 and it represents
10%-15% of McDonald’s total advertising expenditure.13 The Dollar Menu was introduced na-
tionwide in September 2002 following a six quarter-period of relatively poor sales performance.
According to industry news reports, it was an attempt to boost sluggish sales and cripple
Burger-King, McDonald’s main rival.14The Dollar Menu usually includes two main dishes -
a Double Cheeseburger and a McChicken sandwich, together with side dishes and desserts,
such as Small Fries, Small Soft Drink, Side Salad, Apple Pie and Sundae.15 To promote the
new Dollar Menu introduction, McDonald’s added $20 million to its advertising budget in the
last quarter of 2002. McDonald’s 2002 annual financial report explains the 2002 increase in
expenses: “The increase in 2002 was primarily due to .. higher advertising expenses in the
U.S. primarily related to the introduction of the Dollar Menu.” Based on conversations with
franchisees, the introduction of the Dollar Menu is optional, and a franchisee can unilaterally
decide not to offer the Dollar Menu.16 McDonald’s corporate officer was willing to say that12According to McDonald’s CEO, Ralph Alavarez, Dow Jones Newswires, 10/19/0713McDonald’s Earnings Conference Call, 01/24/06. See http : //seekingalpha.com for full transcript.14James Cantalupo, McDonald’s CEO at the time the Dollar Menu was introduced was cited saying: “We
like to wear out our competitors with our price”, Business Week, 03/03/0315According to the New-York Times, the Double Cheeseburger has become McDonald’s most ordered item
since the Dollar Menu was introduced. New York Times, 04/19/2006. At first, the Dollar Menu included only
the McChicken and the Big N’ Tasty sandwiches. In November 2002 the non-entree items were added, and in
February 2003, the Double Cheeseburger replaced the Big N’ Tasty as the second dish offered in the Dollar
Menu. All the outlets in Santa Clara County offer the Dollar Menu except the franchised outlet at the Stanford
Shopping Center. There is some cross-regional variation in the Dollar Menu items. For example, in New York,
the Dollar Menu usually includes a Chicken McNuggets item, whereas in the Santa Clara County it does not.16Business Week cites a McDonald’s franchisee complaining that the Big N’ Tasty costs him $1.07 to make
–so he sells it for $2.25 unless a customer asks for the $1 promotion price. “We have become our worst enemy”
Business Week, 03/03/03. The Wall Street Journal cites a McDonald’s franchisee, Irwin Kruger, saying that
the dollar-value menu is not increasing sales at his seven New York City restaurants but rather squeezing profit
because he is selling discounted items. For now, though, he says he is not concerned because part of McDonald’s
value strategy was to cripple rival Burger King, Wall Street Journal, 11/2/2002.
7

franchisees are encouraged to adopt the Dollar Menu.
2.2 Data
We constructed our data from several sources. Our main data set is an original panel data set
collected in July 1999 and July 2006 regarding the location, price menu, outlet characteristics17
and competition level18 of all the hamburger outlets that are chain-affiliated in Santa Clara
County, California.19 In the empirical analysis, we examine the prices at McDonald’s outlets
and the data on the other chains are used to determine the competitive environment of an
outlet.20 The 1999 data were collected by Thomadsen (2005). We collected the 2006 data
by visiting all the outlets in the Santa Clara County and documenting the menu prices and
characteristics of the outlet.21 Ownership data were obtained by cross-referencing several
public records.22 Outlets data are supplemented by zip code demographic data.23 In addition,
we use sales data from one McDonald’s franchised outlet which adopted the Dollar Menu.
The sales data include prices, the quantities sold for each item and the number of cashier
transactions in that outlet for several months between 2001 and 2006.24 The number of cashier
transactions is used as a measure of the number of customers patronizing the outlet in a
particular month. The third dataset was collected from hamburger restaurants located in the
35 largest U.S. airports. We collected information regarding whether these restaurants offer17The observed outlet characteristics are: the number of seats, the presence of a playground, the presence of
a drive-thru, the availability of wireless service at the outlet and whether the outlet is located in a mall.18Defined as the number of hamburger chain-affiliated outlets located within a certain perimeter.19There are about 300 outlets and the relevant chains are: Burger-King, Carl’s Jr., In-N-Out, Jack-in-the-Box,
McDonald’s and Wendy’s.20We also obtain and present similar results when we analyze the prices of Jack-in-the-Box another big
hamburger chain. McDonald’s and Jack-In-The-Box are the only chains in Santa Clara County which operate
a mixture of corporate-owned and franchised outlets.21Outlet locations were obtained from chains’ websites as well as from business locator services, such as Google
Maps and Yahoo Local Maps. Prices were photographed (when permitted) and a subset of prices were copied
when taking photographs was not possible.22For each outlet we observe whether it is franchised or corporate-owned. Ownership data were assembled
from the Assessor Office and the Public Health Department in Santa Clara County.23Zip code demographics were obtained from the 2000 Census data and 2005 Community Sourcebook America.
We use data on median household income, median rent contracts and dine out spending potential index.24The sales data cover the following months: October 2001-2005, August 2002-2005, November 2002, March
2003-2006.
8
the Dollar Menu, an airport employee discount as well as ownership information and prices of
a Big-Mac meal and a Double CheeseBurger.25 26 Figure 1 displays the Big-Mac meal price
distributions using data from 2006 and 2007 divided into franchised and corporate outlets
located in Santa Clara County and outlets located in U.S. airports.
2.3 Demand Externality Proxies
We employ two sets of proxies to represent an outlet’s incentive to take the impact of its
pricing decision on the chain’s future sales into account. The primary set pertains to the
distinction between a franchised and a corporate-owned outlet. We assume that a corporate-
owned outlet located in Santa Clara County has a higher incentive to internalize the demand
externality it imposes on future sales compared to a franchised outlet. This distinction relies on
the different incentives of franchisees and the chain to encourage repeat business. The chain,
unlike franchisees, benefits from a customer regardless of the specific outlet he attends and
has stronger incentives to encourage customers to revisit any of the chain outlets by charging
low prices. Since the chain has a larger incentive to encourage customers to revisit any of the
chain outlet, it will set a lower price. The number of corporate and franchised outlets in 1999
and in 2006 as well as the entry and exit patterns of McDonald’s outlets in the Santa Clara
County are displayed in Table 1.
The secondary set of proxies enables us to distinguish between one franchised outlet and
another and between one corporate outlet and another. The main secondary proxy we use is the
outlet’s distance from the highway, where a natural interpretation of that proxy is that, ceteris
paribus, outlets located near a highway are characterized by fewer repeat customers and have
a lower incentive to consider the impact of their pricing decisions on future sales compared to
an outlet located at a distance from the highway.27 Indeed, using the distance from a highway25We also collected data on Burger-King restaurants located in airports. We inquired whether the restaurant
offers BK Value Menu, an airport employee discount and ownership information.26The airport restaurant data were collected by phone in September-October 2007. The ownership data was
gathered also from the chains’ websites. We also sampled few McDonald’s restaurants in Santa Clara County
in September 2007 and verified that prices have not significantly changed since July 2006.27The 2000 Bay Area Travel Survey, www.mtc.ca.gov, reports that 60% of trips on the 101 Highway, one of
the two main highways in Santa Clara County, are not home-work trips.
9

as a proxy for customers’ tendency to repeat was mentioned several times in the literature.28
Based on conversations with franchisees and survey data, we employ two additional suggestive
proxies for an outlet’s level of repeat business: the presence of a playground29 and whether
wireless service is offered at the restaurant.30 Table 2 contains the number of outlets that are
characterized by the secondary set of proxies divided into corporate and franchised outlets. A
feature of these proxies is that each can be interpreted as accounting for a different segment
of fast-food consumers: travelers, families with young children, and local high school students
and workers. We employ these proxies separately and jointly when we analyze the pricing
patterns of McDonald’s restaurants.
3 Empirical Analysis
In this section we examine the changes in prices between 1999 and 2006 at franchised and
corporate-owned outlets, and employ regression analysis on restaurants which adopted the
Dollar Menu. We begin with a primary item of the Dollar Menu - the Double Cheeseburger -
and then turn to analyze the changes of items whose price was not advertised, such as the Big-
Mac Meal - McDonald’s signature dish. To explain the distinct pricing patterns of the non-price
advertised items, in Section 3.2 we analyze the sales data before and after the introduction
of the Dollar Menu. The analysis demonstrates that non-price advertised items, characterized
by high substitution with the Dollar Menu items suffered a significant decline in their price28See Klein and Saft (1985) and Brickley and Dark (1987) for early references.29Playgrounds attract children to McDonald’s restaurants. Indeed, McDonald’s performs a survey which
is based on demographic trends at the vicinity of the outlet to determine the profitability of a playground.
Furthermore, Robinson, Borsekowski, Matheson and Kraemer (2007) reports that 32% of the children in his
sample, who reside in the San Francisco Bay Area, visit more than once a week at McDonald’s and nearly 72%
visit more than once a month at McDonald’s. As a comparison, the results of the survey discussed in Appendix
B indicate that only 2% of Stanford students visit more than once a week at McDonald’s. Conversations with
franchisees confirm our notion that children are more likely to revisit an outlet compared to other customer
groups.30Wireless service proxies for high school students, attending McDonald’s restaurants. Franchisees confirm
that high school students are more likely to use wireless service at McDonald’s restaurants, and that high school
students account for relatively large share of their clientele. Wireless service was not offered in 1999. We treat
outlets that chose to offer wireless service in 2006, as catering to intermediate consumers with a tendency to
repeat both in 1999 and 2006.
10

premia, whereas the price premium of other less substitutable items remained relatively stable.
We then turn to utilize the secondary set of proxies, and preform a difference-in-difference-
in-difference regression analysis to examine how an outlet location near the highway affects
prices at franchised and corporate-owned outlets. Before discussing alternative explanations
for our findings, we also present evidence on prices and on the availability of Value Menus in
U.S. airports.
3.1 Price Patterns Across Adopting Outlets
3.1.1 Summary Statistics
The franchisee’s price premium for the Double Cheeseburger, defined as the difference between
the average franchise price and the average corporate price was 8 cents in 1999,31 and it
disappeared among adopting restaurants in 2006.32 Descriptive statistics of the prices of the
Big-Mac meal are presented in Table 3. The franchisee’s Big-Mac meal premium decreased
from 41 cents in 1999 to 22 cents in 2006. The standard deviation of the Big-Mac meal dropped
from 24 cents and 27 cents in 1999 for corporate-owned and franchised outlets to 12 cents and
17 cents in 2006, respectively. Moreover, the price range decreased from $1.10 in both types of
outlets in 1999 to 50 cents in corporate-owned and 80 cents in franchised outlets in 2006. To
provide additional descriptive evidence of the change in the Big-Mac meal price distributions
from 1999 to 2006, we define an outlet-normalized price in year t as the ratio of the Big-Mac
meal price in the outlet to the average Big-Mac meal price in the corporate-owned outlets
in that year. The kernel densities of the normalized price of franchised and corporate-owned
outlets in both time periods are presented in Figure 2. The Figure illustrates how the two
price distributions approached each other from 1999 to 2006.
3.1.2 Regression Analysis
The following specification is used to test the changes in prices between 1999 and 2006:
ln(pit) = α+γ∗D2006,it+δ∗Dfranchised,it+η∗D2006,i∗Dfranchised,it+β∗Xit+θ∗Compit+εit (1)
31All the corporate outlets charged the same price, $1.08 (with tax) for the Double Cheeseburger, and all the
franchised outlets, except two, charged a higher price than the price at corporate-owned outlets.32The only restaurant that did not adopt the Dollar Menu in 2006 charge $2.59 for a Double Cheeseburger.
11

This specification tests the change in the prices of the Big-Mac meal, a non-advertised
item and consists of outlets operating in both 1999 and 2006. pit is the price in outlet i in
year t. D2006,i is a dummy variable equal to 1 if outlet i operated in 2006. Dfranchised,i is a
dummy variable equal to 1 if outlet i is a franchised outlet. Xit is a vector containing outlet
i characteristics in year t including the number of seats, the existence of a drive-thru, the
existence of a playground, whether the outlet is located in a mall and demographic variables
of the zip code in which the outlet is located. The competition proxies indicate the number of
competitors located near an outlet.33
Table 4 presents the estimation results for the Big-Mac meal price as the dependent
variable. In the Big-Mac regression, we find that conditional on outlet characteristics and
demographics, the franchisee’s price premium for the Big-Mac meal significantly decreased
from 12.42% in 1999 to 3.61% in 2006. All other outlet and demographic characteristics were
insignificant with the exception of the coefficient of the dine-out spending potential index which
was positive. The insignificant effects of the competition proxies are consistent with previous
literature on the fast-food industry.34 We perform the same analysis for all the meals that were
offered in both 1999 and 2006. The results in Table 5 demonstrate two interesting patterns: for
the Quarter Pounder and the Double Quarter Pounder meals, we find statistically significant
reductions in the premiums from 7.2% to 1% and 7.4% to 2.8%, respectively. However, for the
regressions of the Fillet-O-Fish, Chicken McNuggets 6 pc. and Chicken McNuggets 20 pc. as
the dependent variables we find the following statistically insignificant price changes: 2.6% to
1.4%, 5.1% to 5.7% and 2.1% to 3.17%, respectively.35
Thus, our findings on the Dollar Menu item - the Double Cheeseburger indicate that the
advertising campaign was successful in eliminating franchisee’s price premium. The empirical
evidence on the changes in the price premia for non-price advertised items depicts two distinct
patterns: for some items we found that the price premia have fallen, whereas for some it
remained stable.33We present estimation results for two competition variables; close competitors, defined as the number of
competitors within 0.1 mile from the outlet; far competitors, defined as the number of competitors within 0.1
to 0.5 miles. Using other criteria for the level of competition (e.g. perimeters around each outlet) and various
specifications did not change our results.34See Kalnins (2003), and Thomadsen (forthcoming).35The results are almost identical if we only use data from outlets that operated in both time periods.
12

To demonstrate that the drop in the premium is not driven by unobserved changes
at McDonald’s, we performed the same basic empirical analysis for Jack-in-the-Box, another
major hamburger chain. We found that the introduction of its Value Meal at the end of 2001
had a similar qualitative effect and report the estimation results for the Jumbo Jack meal,
Jack-in-the-Box’s signature dish, in Table 6. The average premium charged by Jack-in-the-
Box franchisees dropped significantly from 5.7% in 1999 to -0.1% in 2006.36
3.2 Explaining the Variation in Price Changes across Non-Advertised Items
To explain the observed distinct patterns of the non-Dollar Menu items, we now turn to
analyzing the sales data. In Figures 2 and 3 we present the time series of two measures of
sales for the Big-Mac, Quarter Pounder, Chicken McNuggets 6 pc., and Fillet-O-Fish meals
as well as for a combined measure of the Dollar Menu items: Double Cheeseburger and the
McChicken sandwich.37 The first measure presented in Figure 2 is an item percentage of total
outlet sales in that month. The second measure displayed in Figure 3 is the proportion of
cashier transactions for each item interpreted as the percentage of customers who bought a
particular item. Each item measure is normalized based on its own August 2002 sales; in the
lower part of the figures we display the Dollar Menu items time series, and in the upper part
we present the regular menu meals time series.
The percentage of McChicken sales out of the total revenue surged from 2.06% to 4.36%
between August 2002 and March 2004. The percentage of the Double Cheeseburger out of the
total revenue skyrocketed from 0.18% to 2.96%. One explanation for this difference is the fact
that the price of the McChicken sandwich has not changed, whereas the price of the double
cheeseburger dropped by 50% following the introduction of the Dollar Menu. Over the same
period of time the Big-Mac meal and the Quarter Pounder meal percentage of revenue dropped
sharply from 7.7% to 5.62% and from 5.47% to 3.02%, respectively. On the other hand, the
meals whose price premium has not changed between 1999 and 2006 exhibit a different pattern.
For example, the Fillet-O-Fish rose from 2.83% to 3.05%, and the Chicken McNuggets 6 pc.36We explore the changes in prices only at McDonald’s and Jack-In-The-Box, since these chains are the only
chains in Santa Clara County which operate a mixture of corporate-owned and franchised outlets.37Since the Double Cheeseburger replaced the Big N’ Tasty as the main item in the Dollar Menu in March
2003, we use the sales of the Big N’ Tasty rather than the Double Cheeseburger sales during that period.
13

increased from 3.30% to 3.89%. Although the clear distinction in trends is not that obvious
across the entire time period, the figure strongly suggests that the shift in sales towards the
Dollar Menu items is largely driven by customers who had previously purchased the Big-Mac
and the Quarter Pounder meals.38
Similar patterns arise when we examine the percentage of customers purchasing each
item. From August 2002 to March 2004 the percentage of customers who bought the Double
Cheeseburger and McChicken sandwiches increased from 0.4% to 14.6% and from 11.17% to
21.44%, respectively. On the other hand, the proportion of transactions in which the Big-Mac
and the Quarter Pounder meals were sold dropped from 8.69% to 5.8% and from 6.18% to
3.12%, respectively. The non-substitutable meals exhibit a different pattern; The Fillet-O-
Fish and McNuggets 6pc. percentage of cashier transactions change slightly from 3.89% to
3.84% and from 3.72% to 4.02%, respectively.39
We also conducted a survey among 104 undergraduate students exploring the substi-
tution patterns across the Chicken McNuggets meal, the Big-Mac meal and the Dollar Menu
items. The survey itself and the results are presented in Appendix B: 82% of the respondents
who chose the Big-Mac meal before the Dollar Menu was available switched to a Dollar Menu
option after it was introduced to them. On the other hand, only 53% of the Chicken Mc-
Nuggets choosers switched to a Dollar Menu option when it was available. We compare the
mean of the two groups and reject the null hypothesis of mean equality at 1% confidence level.
Finally, Consistent with our argument, Matthew Paull, McDonald’s Corporation CFO at the
time the Dollar Menu was introduced acknowledged in an analysts conference call: “It brought
in a lot of customers who might not have otherwise visited us. (But) We have seen a small
drop in sales of our signature sandwiches, things like the Big-Mac and the Quarter Pounder38Clearly, the evidence is based on only one outlet and should be regarded so. Moreover, it is hard to
disentangle between the effect of the Dollar menu introduction on the Chicken McNuggets sales and the large
drop in its sales between October 2001 and August 2002, prior to the introduction of the Dollar Menu.39We also report the changes in the prices of the different meal items between August 2002 and March 2007.
The prices of the Big Mac, Quarter Pounder and McNuggets 6pc. meals were always the same with 3 price
increments. The total price change was 30 cents, roughly 7%. The Fillet-O-Fish meal price also changed 3 times
over the period by 30 cents, an overall increase of 8%. The Double Cheeseburger price dropped from $1.99 to
one dollar once it was added to the Dollar Menu, and the McChicken price was 99 cents before the Dollar Menu
introduction and one dollar thereafter.
14

with Cheese. We’re not thrilled with that.”40
In the next section, we refine our analysis and utilize the secondary set of proxies to
examine how the price variation within franchised-owned outlets and within corporate-owned
outlets is correlated with these proxies.
3.3 Refining the Repeat Customers Analysis
In this section we utilize an outlet distance from a highway to explore more in-depth how
it affects prices. Our interpretation for the highway location is that franchised restaurants
located near highways cater to fewer repeat customers, and, thus, these franchised outlets
are more likely to free-ride on the chain’s reputation and charge higher prices compared to
franchised outlets located at a distance from highways. We also present the regression results
of the additional secondary proxies: playground presence, and wireless connection offered at
the restaurant, and suggest that these characteristics are correlated with a higher outlet level
of repeat customers.
As before, we test for a negative relationship between the level of prices and the proxies
for a restaurant level of repeat business, and a negative relationship between the proxies and
the changes in prices between 1999 and 2006. In the analysis below, we focus on the Big-Mac
meal price. One advantage of using the the Big-Mac meal price is that restaurants owners are
likely to consider the impact of the Big-Mac pricing decision more closely, and customers are
likely to form expectations based on items they often buy. Moreover, the chain is likely to
focus its monitoring efforts on primary items, such as the Big-Mac.
3.3.1 Within Franchised and Within Corporate-Owned Price Analysis
The following specification is used to test whether an outlet highway location can explain the
price variation across franchised outlets and across corporate-owned outlets in 1999:
ln(pit) = α+γ∗Drepeat,i+δ∗Dfranchised,it+η∗Drepeat,i∗Dfranchised,it+β∗Xi+θ∗Compit+εi (2)
The dependent variable is the Big-Mac meal price in 1999, where Drepeat,i is a dummy variable
equal to 1 if outlet i is located at a distance from the highway. Note that the effect of an40“Restaurant Business”, 01/28/03.
15
outlet distance from the highway on price is γ in corporate-owned outlets, whereas it is γ + η
in franchised outlets.
We employ the secondary proxies separately and also as a combined proxy in four re-
gressions. The results for the regressions are displayed in Table 7. When we use the distance
from a highway as a proxy, we find that the price difference between a franchised outlet and a
corporate-owned outlet located near a highway is 15.8%, whereas only 10.9% at outlets located
at a distance from the highway. When we use the joint proxy, we find that prices at franchised
outlets characterized by the joint proxy, i.e. located at a distance from the highway with
a playground and offering a wireless service, were 2.6% higher than corporate-owned outlets
characterized by the joint proxy, whereas franchised outlet not characterized by the joint proxy
charged 14.9% higher prices than corporate-owned restaurants not characterized by the joint
proxy. We obtain similar qualitative results in the separate regressions which utilize the play-
ground and the wireless service availability proxies. Under the interpretation that an outlet
location near a highway is a good proxy for few repeat customers, the observed price variation
across franchised and corporate-owned outlets is consistent with the positive price externality
interpretation; franchisees operating at locations characterized by more repeat customers have
a higher incentive to internalize the externality, or alternatively, these franchisees find it less
profitable to charge high prices and to degrade the chain’s reputation.
We now turn to test the changes in the price premium between 1999 and 2006 at outlets
characterized or not by the secondary set of proxies. We examine, for example, whether the
price premium at outlets located near the highway, has fallen between 1999 and 2006 more
than it fell at outlets located at a distance from the highway. We employ a Difference-In-
Difference-In-Difference approach, and the specification is as follows:
ln(pit) = α+γ1 ∗Drepeat,i + γ2 ∗Dfranchised,it+
γ3 ∗D2006,i + γ4 ∗Drepeat,i ∗Dfranchised,it+
γ5 ∗Drepeat,i ∗D2006,i + γ6 ∗Dfranchised,it ∗D2006,i+
γ7 ∗Drepeat,i ∗Dfranchised,it ∗D2006,i+
β ∗Xit + θ ∗ Compit + εit
(3)
The results are shown in Table 8, and for the regression using the distance from the
16

highway dummy are demonstrated graphically in Figure 6.41 As can be seen in the Figure, the
franchisee’s price premium was 16.1% (γ2) in 1999 near the highway and it dropped to 4.6%
(γ2 + γ6) in 2006. At outlets located at a distance from the highway, the premium was 11.1%
(γ2 +γ4) in 1999 and only 3.3% (γ2 +γ4 +γ6 +γ7) in 2006. We can reject a joint F test for the
three following hypotheses: (γ2 > 0; γ2 + γ4 > 0; γ2 > γ2 + γ4) as well as for the following joint
test: (γ2 + γ6 > 0; γ2 + γ4 + γ6 + γ7 > 0; γ2 + γ6 > γ2 + γ4 + γ6 + γ7), but cannot reject each
hypothesis separately. We obtain qualitatively similar results when we use the other proxies as
well as the joint proxy. These results are, again, consistent with the interpretation that outlets
with lower incentive to take the impact of their pricing decision on future sales were charging
higher prices in 1999. Moreover, following the Dollar Menu introduction the profitability of
maintaining the high prices was curtailed, and hence, the price difference between these outlets
and outlets which initially charged lower price decreased.
In this Section, we focused on the prices and changes in prices of non-advertised items
at outlets which adopted the Dollar Menu. We showed that these price differences have fallen
between 1999 and 2006 only for items with good substitutes in the Dollar Menu. We interpret
these results as suggesting that the Dollar Menu curtailed the profitability of high prices and
that its impact was more significant with respect to franchisees who initially had a greater
incentive to free-ride on the chain’s reputation, such as at outlets located near highways.
Before discussing alternative explanations for our findings, we present evidence that outlets at
airports charge higher prices than non-airport restaurants and that these outlets are less likely
to offer the Dollar Menu compared to non-airport restaurants.
3.4 Value Menu at U.S. Airports
In the previous section we provided several pieces of evidence that franchisees charged higher
prices than corporate-owned outlets. To provide additional evidence on the decision whether
to adopt the advertised low-prices42 and its impact on prices, we present evidence on the avail-
ability of Value Menus at McDonald’s and Burger-King restaurants located in U.S. airports.41The Figure shows the relative prices of corporate-and franchised outlets at a given year and location. Thus,
it does not reflect, for instance, the aggregate change in prices from 1999 to 2006 (γ3).42Note that the items included in the Value Menus are offered at all the airport restaurants, and we are only
examining the prices of these items.
17

One interpretation for restaurants located at airports is that these restaurants serve very few
repeat customers43 and, thus, have little incentive to internalize the demand externality created
by their pricing decision.44 Thus, restaurants with little incentive to internalize the demand
externality are more likely to choose not to offer the Dollar Menu at the price of disappointing
their (few) repeat consumers.45
The comparison between airport and non-airport restaurants provides a clear distinc-
tion. Fifty nine out of 60 McDonald’s restaurants and all Burger-King restaurants located in
Santa Clara County offer the chain’s corresponding Value Menu. On the other hand, none of
the 41 McDonald’s restaurants located at airports chooses to offer the Dollar Menu, and seven
out of nine Burger-King restaurants located at airports do not offer Burger-King Value Menu.
The average price (including tax) of a Double Cheeseburger at an airport restaurant is $1.95
compared to an average price of $1.12 at non-airport restaurants. Interestingly, the only two
restaurants which adopt the Value Menu are corporate-owned restaurants. On the other hand,
there are also 3 corporate-owned restaurants which do not. Another suggestive evidence that
airport restaurants have fewer incentive to internalize the price externality is their usage of an
airport employee discount. Nearly 80% of airport restaurants offer an airport employee dis-
count. These discounts vary across outlets within an airport and typically depends on the price
of the item.46 If airport restaurants are able to distinguish between frequent customers and less
frequent customers then their incentive to internalize the externality is further reduced. Table
9 displays the information on 41 McDonald’s and 9 Burger-King airport restaurants located
at U.S. airports.
The evidence from U.S. airports has three interrelated goals: first, it supports our43A survey of 1900 departing passengers at Denver International Airport reports that, on average, pas-
sengers travel through the airport less than four times a year, suggesting that the level of repeat busi-
ness at airports is considerably less than non-airport locations. The full report is available at http :
www.flydenver.com/diabiz/bizops/documents/concesSurvey.pdf44Airport restaurants may have little incentives to internalize the price externality for other reasons: The
likelihood passengers will choose another airport or terminal because of the high price is not presumably low;
Moreover, an airport passenger average income is relatively high implying higher search costs, compared to
non-airport customers.45The theoretical framework in Appendix A demonstrates this argument formally.46The typical discount is calculated as a percentage share of the price, 5% - 10%, although some offer an
absolute price discount. Some restaurants offer different discounts depending on the item price.
18

claim that franchisees weigh the costs and benefits of offering the advertised low-prices, and
that franchisees are not forced by the chain to offer the advertised low-prices. Second, the
fact that airport restaurants, which did not adopt the Value Menu, charge considerably higher
prices for the non-advertised items than restaurants which adopted it is consistent with our
interpretation that the Value Menu curtailed the profitability of higher prices. Finally, under
the interpretation that airport outlets face fewer incentives to take the impact of their pricing
decision on future sales into account, we can explain why airport restaurants have chosen not
to adopt the advertised low-prices.
Nevertheless, airport restaurants may differ from non-airport restaurants based on
other non-observable dimensions. Thus, the evidence is not as conclusive as the evidence on
the price patterns at restaurants which adopted the Dollar Menu.
4 Alternative Explanations
To further support our conjectures, we discuss alternative explanations for the patterns found
in the data and argue that these explanations are less plausible. We begin with alternative
explanations for the observed price patterns at non-airport restaurants which adopted the
Dollar Menu, and then discuss one alternative explanation why restaurants chose to adopt the
Dollar Menu which is not driven by the advertising campaign.
4.1 Alternative Explanations for the Price Patterns
Before discussing potential explanations for the pricing patterns found in the data, it should be
emphasized that using panel data with observations from the same geographic area enables us
to rule out alternative explanations which rely on time-invariant unobservable price determi-
nants. Thus, a possible alternative explanation should be based on a change in unobservables
affecting differently franchised and corporate-owned outlets. Indeed, a shortcoming of previous
empirical papers that have examined price and quality differences across corporate-owned and
franchised outlets was their dependence on cross-section data rather than on panel data. The
first alternative explanation below relates to the initial price difference between franchised out-
lets and corporate outlets. The latter two explanations relate to the change in prices between
1999 and 2006.
19

4.1.1 Higher costs at Franchised Outlets or Double Marginalization
To establish that the difference in prices across franchised outlets and corporate-owned outlets
is driven by the fact that franchisees have fewer incentives compared to the chain to inter-
nalize the price externality, one should rule out alternative explanations which are based on
franchised outlets incurring higher costs than corporate-owned outlets.47 Importantly, McDon-
ald’s franchisees and the chain purchase their inputs from the same certified suppliers and at
equal terms.48 One potentially important cost difference is the royalties franchisees pay to the
chain, which could result in a double mark-up and higher prices. Nevertheless, the royalties
are determined based on total sales rather than on per-item sales. Thus, it is hard to explain
the variation in the price premia across items solely on the basis of cost differences. Further-
more, any cost-based explanation for the higher prices at franchised outlets cannot explain the
variation across franchised outlets as illustrated by our empirical analysis using the secondary
set of proxies.
4.1.2 Decrease in The Demand for McDonald’s Products
The observed changes in prices between 1999 and 2006 might be the result of a drop in demand
for McDonald’s products, particularly its beef products. Presumably, such a drop could lead
to lower mark-ups for beef products, such as the Big-Mac Meal. In fact, over the past years,
McDonald’s has increased the variety of salads offered at its restaurants to fend off criticism
over its, presumably, unhealthy menu. This change, however, only explains an overall drop in
demand for McDonald’s restaurants and does not explain the differential change at corporate
and franchised restaurants, or the differences across franchised outlets characterized by the
secondary set of proxies.47Any cost explanation does not invalidate our interpretation that the advertising of low-priced items was the
reason franchisees adopted these items.48The 1968 U.S Supreme Court ruling in Siegel v. Chicken Delight bans chains from requiring franchisees
to purchase inputs exclusively from the chain. Moreover, Krueger (1991) found evidence that McDonald’s
corporate-owned outlets offer higher wages compared to franchised outlets.
20

4.1.3 Change In McDonald’s Franchisees’ Contractual Agreement
A third alternative explanation might be a change in the contractual agreement between Mc-
Donald’s and its franchisees: a decrease in the royalty fees charged by the chain may have
caused franchisees to lower the prices they set relative to the prices charged in corporate-
owned outlets. Franchisees confirm that there was no change in the contractual agreement
in past years affecting royalties, and industry news reports do not mention such a change.
Importantly, royalties are determined based on total sales rather than on on per item basis.
Thus, even if a reduction in royalties occurred it cannot explain the observed changes in price
premia across different items.
4.2 Why Did Franchisees adopt the Dollar Menu?
Imposing maximum price restraints or an explicit requirement by McDonald’s to adopt the
prices of Dollar menu campaign could have led to similar observable implications. Interestingly,
the ability of a franchisor and a franchisee to agree on items’ maximum resale price became legal
in 1997 after the U.S. Supreme Court decision in State Oil Company v. Khan.49 However,
since franchised contracts are valid for 20 years, the impact of the Supreme Court decision
may be limited. Indeed, conversations with McDonald’s franchisees and employees confirm
that McDonald’s does not impose maximum resale prices on its franchisees, despite the legal
change. Matthew Paull, McDonald’s Corporation CFO said during a McDonald‘s Earnings
Conference Call in January 2006: “bear in mind (that) we are required by law (not to) .. and
we never ever try to influence their (franchisees) pricing”.50
5 Discussion and Concluding Remarks
Economists and scholars from other fields devoted considerable effort to studying the relation-
ship between manufacturers and retailers. Indeed, the ability of a manufacturer to influence49In this decision, the U.S. Supreme Court overruled a previous decision from 1968 and determined that
maximum price restraints should be examined under the rule of reason standard and not be considered as illegal
per-se. For a detailed review of the legal history of maximum resale price restraints, see Blair and Lafontaine
(1999).50http://seekingalpha.com
21

retailers’ prices and to align their incentives with those of the manufacturer have a direct
impact on profitability and performance. In this paper, we analyze this relationship by in-
vestigating the largest franchising chain, McDonald’s, and its ability to influence the prices
at McDonald’s franchised outlets. Our main idea is that advertising can be used to inform
consumers about low-prices, thereby inducing franchisees to adopt the advertised low prices
and improving the chain’s control over its franchises.
The relationship between a chain and its franchisees is also a typical example of a
principal-agent relationship. Interestingly, the misalignment of incentives between a chain and
its franchisees can be described as an example of the model developed by Baker (1992). In his
model, the performance measure of the agent (franchisee’s profits) do not accurately reflect
the principal objective (the chain’s overall profit), and the principal cannot directly monitor
the agent’s behavior. Consequently, contractual inefficiencies can arise. Thus, our basic idea
on the role of advertising or, more generally, information-disseminating mechanisms, can be
generalized to other examples of principal-agent relationships, in which a third party disci-
plines the behavior of agents. For example, shipping companies post signs on their trucks
asking drivers to report their truck drivers if they are driving carelessly; retailers offer re-
wards to consumers who report cashiers’ misbehavior. Future research can examine the role of
these additional information-disseminating mechanisms in improving an organization ability
to monitor its agents.
To explore our idea in the context of the franchising industry, we examine how Mc-
Donald’s Dollar Menu advertising campaign affected prices at McDonald’s franchised and
corporate-owned outlets. We find that before McDonald’s Dollar Menu advertising campaign,
franchisees charged higher prices than corporate-owned outlets and that this price premium
has dropped only for items with good substitutes in the Dollar Menu. For example, in 1999
the price of the Big-Mac meal at franchised outlets was 12.4% higher than at corporate-owned
outlets and only 3.6% in 2006, whereas the price premium of the Fillet-O-Fish remained stable
over the same time period. We also show that the price differential between franchised and
corporate-owned outlets was larger near highways and that the price premium in these loca-
tions has fallen more, compared to locations at a distance from the highway. These findings
suggest that the advertised low-prices curtailed the profitability of franchisees’ free-riding be-
22

havior and that through advertising, the chain improved its control over franchisees’ pricing
behavior.
Hence, our results suggest that alternative theories which are commonly used to explain
how principals control the behavior of agents, even with no explicit incentives, such as efficiency
wages or self-enforcement theories, are not sufficient to ensure that franchisees adhere to the
chain’s optimal decisions.
Finally, our paper provides an example of the role of advertising in building a chain’s
reputation and in improving the chain’s control over its franchisees. Typical explanations for
the role of advertising focus on non-organizational motivations. Clearly, advertising campaigns
may entail strategic as well as organizational motivations, and the successful implementation
of such campaigns may depend on the reputation of the advertiser. It will be interesting to
explore how these conventional roles of advertising interact with the organizational role offered
here as well as how our empirical findings on the prices of advertised and non-advertised items
fit alternative theories of price-advertising.
References
Bagwell, K.: 2005, The economics analysis of advertising, mimeo, Columbia University .
Baker, G. P.: 1992, Incentive contracts and performance measurements, Journal of Political
Economy 100(3), 598–614.
Barron, J. M. and Umbeck, J. R.: 1984, The effects of different contractual arrangements: The
case of retail gasoline markets, Journal of Law and Economics 27(2), 313–328.
Blair, R. D. and Lafontaine, F.: 1999, Will khan foster or hinder franchising? an economic
analysis of maximum resale price maintenance, Journal of Public Policy and Marketing
18(1), 25–36.
Blair, R. D. and Lafontaine, F.: 2005, The economics of franchising, Cambridge University
Press .
Borenstein, S. and Zimmerman, M.: 1988, Market incentives for safe commercial airline oper-
ation, American Economic Review 78(5), 913–935.
23

Brickley, J. A.: 1999, Incetive conflicts and contractual restraints: Evidence from franchising,
Journal of Law and Economics 42(745-774).
Brickley, J. A. and Dark, F. H.: 1987, The choice of organizational form: The case of franchis-
ing, Journal of Financial Economics 18(2), 401–420.
Farris, P. W. and Albion, M. S.: 1980, The impact of advertising on the price of consumer
products, Journal of Marketing 44, 17–35.
Forbes, S. J. and Lederman, M.: 2007, Does vertical integration affect firm performance?
evidence from the airline industry, mimeo, University of California, San Diego, and Uni-
versity of Toronto .
Graddy, K.: 1997, Do fast-food chains price discriminate on the race and income characteristics
of an area, Journal of Business and Economic Statistics 15(4), 391–401.
Jin, G. and Leslie, P.: forthcoming, Reputational incentives for restaurant hygiene, American
Economic Journal: Microeconomics .
Kalnins, A.: 2003, Hamburger prices and spatial econometrics, Journal of Economics & Man-
agement Strategy 12, 591–616.
Klein, B. and Leffler, K. B.: 1981, The role of market forces in assuring contractual perfor-
mance, Journal of Political Economy 89(4), 615–641.
Klein, B. and Saft, L. F.: 1985, The law and economics of franchise tying contracts, Journal
of Law and Economics 28, 345–361.
Kreps, D. M. and Wilson, R. B.: 1982, Reputation and imperfect information, Journal of
Economic Theory 27, 253–279.
Krueger, A. B.: 1991, Ownership, agency, and wages: an examination of franchising in the fast
food industry, The Quarterly Journal of Economics 106(1), 75–101.
Lafontaine, F.: 1995, Pricing decision in franchised chains: A look at the restaurant and
fast-food industry, NBER Working Paper 5247 .
24

Lafontaine, F. and Shaw, K. L.: 2005, Targeting managerial control: Evidence from franchising,
RAND Journal of Economics 36(1), 131–150.
Lafontaine, F. and Slade, M.: 1997, Retail contracting: Theory and practice, Journal of
Industrial Economics 45(1), 1–25.
Lafontaine, F. and Slade, M.: 2007, Vertical integration and firm boundries: The evidence,
Jounral of Economic Literature pp. 631–687.
Milgrom, P. and Roberts, J.: 1982, Predation, reputation and entry deterrence, Journal of
Economic Theory 27, 280–312.
Milyo, J. and Waldfogel, J.: 1999, The effect of price advertising on prices: Evidence in the
wake of 44 liquormart, American Economic Review 89(5), 1081–1096.
Robinson, T., Borsekowski, D., Matheson, D. and Kraemer, H.: 2007, Effects of fast food
branding on young children’s taste preferences, Arch Pediatr Adolesc Med. 161(8), 792–
797.
Rubin, P. H.: 1978, The theory of the firm and the structure of the franchise contract, Journal
of Law and Economics 21, 223–233.
Steiner, R. L.: 1973, Does advertising lower consumer prices?, Journal of Marketing 37, 19–26.
Thomadsen, R.: 2005, The effect of ownership structure on prices in geographically differenti-
ated industries, RAND Journal of Economics 36(4), 908–929.
Thomadsen, R.: forthcoming, Product positioning and competition: The role of location in
the fast food industry, Marketing Science .
6 Appendix A - Theoretical Framework
The main objective of the framework is to illustrate how low-price advertising can impact the
prices charged by franchisees, in particular, the prices of franchisees who operate in markets
characterized by an intermediate level of incentive to internalize the demand externality. Ac-
cording to the suggested mechanism, the chain determines the level of advertising. Consumers
25
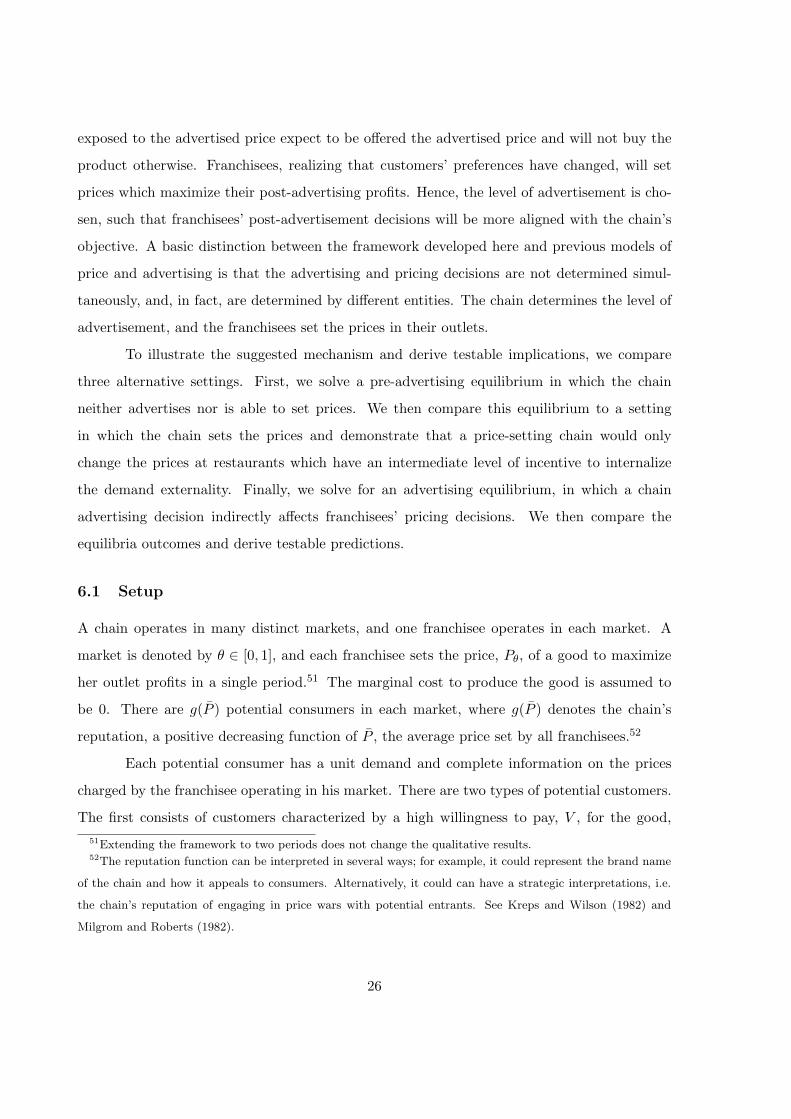
exposed to the advertised price expect to be offered the advertised price and will not buy the
product otherwise. Franchisees, realizing that customers’ preferences have changed, will set
prices which maximize their post-advertising profits. Hence, the level of advertisement is cho-
sen, such that franchisees’ post-advertisement decisions will be more aligned with the chain’s
objective. A basic distinction between the framework developed here and previous models of
price and advertising is that the advertising and pricing decisions are not determined simul-
taneously, and, in fact, are determined by different entities. The chain determines the level of
advertisement, and the franchisees set the prices in their outlets.
To illustrate the suggested mechanism and derive testable implications, we compare
three alternative settings. First, we solve a pre-advertising equilibrium in which the chain
neither advertises nor is able to set prices. We then compare this equilibrium to a setting
in which the chain sets the prices and demonstrate that a price-setting chain would only
change the prices at restaurants which have an intermediate level of incentive to internalize
the demand externality. Finally, we solve for an advertising equilibrium, in which a chain
advertising decision indirectly affects franchisees’ pricing decisions. We then compare the
equilibria outcomes and derive testable predictions.
6.1 Setup
A chain operates in many distinct markets, and one franchisee operates in each market. A
market is denoted by θ ∈ [0, 1], and each franchisee sets the price, Pθ, of a good to maximize
her outlet profits in a single period.51 The marginal cost to produce the good is assumed to
be 0. There are g(P ) potential consumers in each market, where g(P ) denotes the chain’s
reputation, a positive decreasing function of P , the average price set by all franchisees.52
Each potential consumer has a unit demand and complete information on the prices
charged by the franchisee operating in his market. There are two types of potential customers.
The first consists of customers characterized by a high willingness to pay, V , for the good,51Extending the framework to two periods does not change the qualitative results.52The reputation function can be interpreted in several ways; for example, it could represent the brand name
of the chain and how it appeals to consumers. Alternatively, it could can have a strategic interpretations, i.e.
the chain’s reputation of engaging in price wars with potential entrants. See Kreps and Wilson (1982) and
Milgrom and Roberts (1982).
26

and the others by a low willingness to pay customers, R, where (V > R). θ denotes the
proportion of the former type in a market and 1 − θ the proportion of low willingness to
pay customers. Consumers obtain their utility of the good minus the price if they buy and
0 otherwise. Franchisees cannot distinguish between consumers but know the distribution of
customers’ types in their market. ξg,P denotes the chain’s reputation elasticity with respect
to the average price, i.e. ξg,P = ∂g(p)∂p
pg(p) . The chain profits are determined as a fixed share of
the franchisees’ profits, and for simplicity, we assume that this share is equal to 1.53 Repeat
customers are comprised of two subgroups: a constant fraction of the repeat customers, β, will
return to the same outlet, and the remaining share of repeat customers, 1− β, will potentially
revisit other outlets of the chain. Thus, an outlet demand externality, or the impact on other
outlet sales is a function of (1 − β)(1 − θ), a decreasing function of θ. Thus, the larger is
θ, the smaller is the impact on other outlets sales, and indirectly on the chain profits. Since
incorporating β neither change the analysis nor the results, we ignore it in the analysis.
6.1.1 Pre-advertising Equilibrium
A franchisee considers the chain’s reputation to be given and maximizes profits by choosing the
optimal price given the proportion of low-willingness-to-pay customers she serves. Specifically,
she adopts the following decision rule:
Pθ =
R if θ ∈ [0, RV ]
V otherwise.
Let θf be the threshold market, i.e. the market in which a franchisee is indifferent
whether to set the price to V or R. Thus, θf = RV , the average price is given by: P =
Rθf + (1− θf )V = (R− V )θf + V , and the chain profits are:
Πf = g(P )∫ θf
0Rdθ + g(P )
∫ 1
θf
θV dθ (4)
53To capture the notion of demand externality in a particular market it is convenient to think of the proportion
of customers with a high willingness to pay, θ, as customers who are unlikely to repeat any of the chain outlets
and of 1−θ as the proportion of customers in a market whose decision to revisit the chain is affected by the price.
The two groups of customers can differ based on their search costs or based on the frequency they purchase the
good.
27
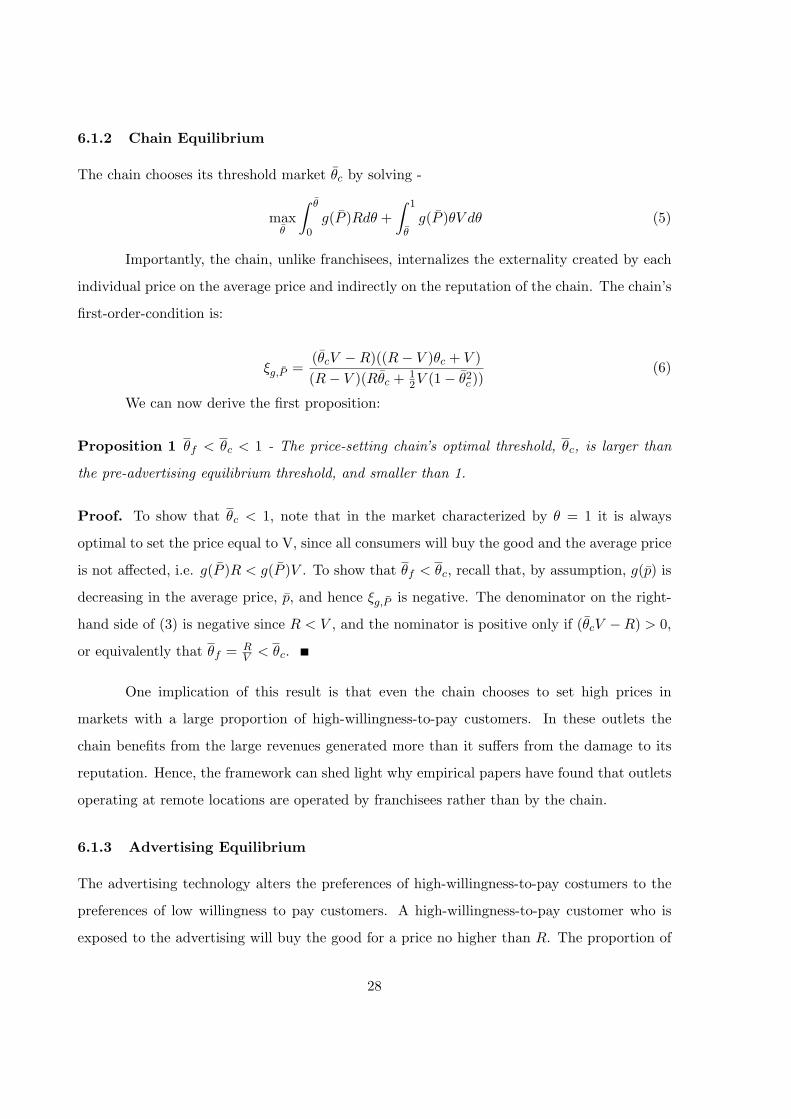
6.1.2 Chain Equilibrium
The chain chooses its threshold market θc by solving -
maxθ
∫ θ
0g(P )Rdθ +
∫ 1
θg(P )θV dθ (5)
Importantly, the chain, unlike franchisees, internalizes the externality created by each
individual price on the average price and indirectly on the reputation of the chain. The chain’s
first-order-condition is:
ξg,P =(θcV −R)((R− V )θc + V )(R− V )(Rθc + 1
2V (1− θ2c ))
(6)
We can now derive the first proposition:
Proposition 1 θf < θc < 1 - The price-setting chain’s optimal threshold, θc, is larger than
the pre-advertising equilibrium threshold, and smaller than 1.
Proof. To show that θc < 1, note that in the market characterized by θ = 1 it is always
optimal to set the price equal to V, since all consumers will buy the good and the average price
is not affected, i.e. g(P )R < g(P )V . To show that θf < θc, recall that, by assumption, g(p) is
decreasing in the average price, p, and hence ξg,P is negative. The denominator on the right-
hand side of (3) is negative since R < V , and the nominator is positive only if (θcV −R) > 0,
or equivalently that θf = RV < θc.
One implication of this result is that even the chain chooses to set high prices in
markets with a large proportion of high-willingness-to-pay customers. In these outlets the
chain benefits from the large revenues generated more than it suffers from the damage to its
reputation. Hence, the framework can shed light why empirical papers have found that outlets
operating at remote locations are operated by franchisees rather than by the chain.
6.1.3 Advertising Equilibrium
The advertising technology alters the preferences of high-willingness-to-pay costumers to the
preferences of low willingness to pay customers. A high-willingness-to-pay customer who is
exposed to the advertising will buy the good for a price no higher than R. The proportion of
28

converting customers, α, depends on the level of advertising, and the chain cannot advertise
in selected markets. We assume an interior solution for advertising, implying that a positive
level of advertising is profitable. To find the optimal level of α, we derive the optimal decision
rule of a franchisee given α, and utilize this decision rule in the chain’s advertising decision.
The franchisee decision rule is:
P θ(α) =
R if θ ∈ [0, RV (1−α) ]
V otherwise.
Let θa be the threshold advertising market, i.e. the market in which a franchisee in
an advertising equilibrium is indifferent about whether to set price to V or R. Note that
the choice of α, determines the threshold advertising market, θa = RV (1−α) ; the average price
P = Rθa + (1 − θa)V = (R − V )θa + V and the chain reputation. The advertising chain
objective function is given by:
maxθ
∫ θ
0g(P )Rdθ +
∫ 1
θg(P )θV (1− α)dθ − C(
V θ −R
V θ)
s.t. θ =R
(1− α)V
(7)
The advertising chain f.o.c is given by:
g′(P )R(R− V )(1 + θ2
2θ)− g(P )
R(1− θ2)2θ2
= C ′(1− R
θV)
R
θ2V(8)
We can now derive the second proposition:
Proposition 2 Πc(θc) > Πa(θa) > Πf (θf ) - The chain’s profits under the price-setting equi-
librium are larger than its profits under the advertising equilibrium, which are larger than the
profits under the pre-advertising equilibrium.
Proof. We prove the first inequality in three steps: First, we show that Πc(θ) > Πa(θ) ∀θ < 1.
This inequality holds because franchisees who charge V in the advertising equilibrium sell
only to (1 − α)θ consumers and generate less profit than the same franchisees in the price-
setting chain equilibrium who sell to θ consumers. By the optimality of the price setting
chain decision, we know also that Πc(θc) ≥ Πc(θa) and that θc < 1. Thus, we obtain that
Πc(θc) ≥ Πc(θa) > Πa(θa). Πa(θa) > Πf (θf ) holds for any interior advertising solution.
29

The implication of Proposition 2 is that advertising cannot completely eliminate fran-
chisees’ incentive problem, even if the cost of advertising is 0. The following proposition
establishes our testable predictions.
Proposition 3 θf < θa < 1 - The franchisee, who is indifferent to charging V or R in the
advertising equilibrium, operates in a market where the proportion of low-willingness-to-pay
customers is higher than θ = 1 and lower than θf , the threshold level in the pre-advertising
equilibrium.
Proof. The first inequality is a direct implication of our assumption that advertising is prof-
itable. To prove the second inequality, recall that θa = RV (1−α) , or alternatively that V θ−R
V θ = α.
Choosing θa > 1 is not profitable, since the chain can reduce its level of advertising and its
advertising costs, and at the same time its reputation, and franchisees’ pricing decisions will
not change. We prove that θa < 1 by contradiction. Assume that the advertising level induces
the franchisee operating in the market where θ = 1 to be indifferent between high and low
prices, implying θa = 1 or that V−RV = α. We show that by choosing α − ε < α, the chain
increases its profits. To observe that, note that the chain’s reputation will not change if only
the marginal franchisee charges a higher price. Moreover, the franchisee operating in the mar-
ket where θ = 1 is no longer indifferent between low and high prices and will profit more by
charging V. Finally, the cost of advertising also drops. Contradiction.
We derive two additional propositions. The first proposition shows that consumer
surplus under the advertising equilibrium is larger than the consumer surplus in the pre-
advertising equilibrium, and the second proposition contains the condition under which all the
franchisees benefit from advertising. For both propositions we maintain the assumption that
advertising is profitable, i.e. θa > θf which implies Pf > Pa
Proposition 4 Consumer surplus in the advertising equilibrium is larger than consumer sur-
plus in the pre-advertising equilibrium.
Proof. Note that the only consumers who obtain a positive utility are consumers with high
willing to pay who bought the good for the price of R. In the pre-advertising equilibrium, the
consumer surplus is given by∫ θf
0 (V −R)g(Pf )θdθ, whereas in the advertising equilibrium it is
30

given by∫ θa
0 (V −R)g(Pa)(1−α)θdθ. Using our pervious results that θf = RV and 1−α = R
θaV,
we can compare the two expressions for the consumer surplus and simplify the inequality to
θag(Pa) > RV g(Pf ). However, this inequality holds for θa > θf .
Proposition 5 Franchisees characterized by θ ≤ θf always benefit from advertising. All fran-
chisees characterized by θ > θf also gain from the advertising of low-prices if (1 − α)g(Pa) >
g(Pf ). Otherwise, some incur losses.
Proof. We consider first the lower interval of θ, θ ≤ θf . In the advertising equilibrium,
restaurants characterized by low θ will set the price, R, as they set in the pre-advertising
equilibrium but will sell to more consumers since the chain reputation increased g(Pa) > g(Pf ).
For restaurants characterized by θ ≥ θf we note that a franchisee profits in the pre-advertising
equilibrium are increasing in θ. Thus, we derive the condition under which the franchisee
who will lose the most, i.e. θ = 1 will still gain from advertising. In the pre-advertising
equilibrium, her profits are g(Pf )V . Once advertisement is introduced she still charges the
price V, and her profits are given by (1 − α)g(Pa)V. The advertising equilibrium profits are
higher if (1− α)g(Pa) > g(Pf ).
7 Appendix B - Survey Results
The survey was conducted among 104 undergraduate students at Stanford University in late
April 2007.54 The survey and a summary of the responses are presented in Figure 5 and Table
12.
Among the 56 respondents who chose Big Mac meal as their first choice, 46 (82.1%)
switched to a Dollar Menu option once it was offered to them. On the other hand, only 25
(53.1%) out of the 47 respondents who chose Chicken McNuggets switched to a Dollar Menu
option. We perform group mean comparison tests and reject in 1% significance level the null
hypothesis that the percentage of respondents who switch to Dollar Menu option is the same
for respondents that choose Big-Mac meal and for those who choose Chicken McNuggets.55
54To control for price changes in the Big-Mac meal and the Chicken McNuggets meal that occurred following
the introduction of the Dollar Menu we utilize prices from the only outlet in Santa Clara county that did not
introduce the Dollar Menu.55We reject the null hypothesis even when we test for mean difference over respondents that visit McDonald’s
31

Table 1: Ownership Structure and Exit/Entry Patterns
1999 Exit Entry 2006
Corp. Fran. Corp. Fran. Corp. Fran. Corp. Fran.
Jack-in-the-Box 29 6 1 2 2 2 30 6
McDonald’s 22 39 1 5 2 4 23 37
The Table presents entry and exit patterns of McDonald’s and Jack-In-the-Box in Santa Clara County,
divided into franchised and corporate-owned outlets.
Table 2: Outlet Characterization by Secondary Proxies - 2006
Proxy Corporate-Owned Outlets Franchised Outlets
Far from Highway 16 30
Playground 8 15
Wireless Service 19 27
All Proxies Combined 6 7
N 23 37
The Table presents the number of outlets characterized by the secondary set of proxies in 2006. Outlets
are divided by ownership structure. For example, in 2006 six out of the twenty three corporate-owned
outlets are located not near a highway, have playgrounds and have wireless connectivity. Furthermore,
only seven out of the thirty seven franchised outlets have all these properties.
at least few times a year.
32

Table 3: Summary Statistics - Big-Mac Meal Price in Santa Clara County
Santa Clara County (1999) Santa Clara County (2006)
Corporate Franchised Corporate Franchised
Mean 3.33 3.77 4.69 4.92
Std. 0.26 0.29 0.13 0.18
Min. 3.24 3.24 4.32 4.65
Max. 4.43 4.43 4.87 5.52
N 22 39 21 37
The Table presents descriptive statistics for the (with tax) nominal Big-Mac meal prices that were
collected in July 1999 and July 2006 from all McDonald’s outlets in Santa Clara County. Franchisee’s
price premium, defined as the difference between the average franchised price and the average corporate
price, decreased from 41 cents in 1999 to 22 cents in 2006. The standard deviation of the Big-Mac meal
price dropped from 24 cents and 27 cents in 1999 for corporate-owned and franchised outlets to 12 cents
and 17 cents in 2006, respectively.
33

Table 4: Franchisees’ Premium for the Big-Mac Meal - Full Estimation Results
Dependent Variable Big Mac
Meal
Dependent Variable Big Mac
Meal
D2006 0.348***
(0.016)
Median−Household−Income
0.0126
(0.063)
Dfranchised 0.1242***
(0.021)
Median − Contract −Rent
-0.059
(0.068)
D2006 ∗Dfranchised -0.0881***
(0.018)
Dineout − Spending −Potential − Index
0.0006**
(0.003)
Close− Competitors -0.0069
(0.011)
Seats 0.00001
(0.00001)
Far − Competitors -0.0017
(0.0068)
Mall -0.0762
(0.049)
Drive− Thru 0.0142
(0.012)
Playground -0.0108
(0.013)
R2 0.89 N 117
Standard errors are in parenthesis. Errors are clustered by outlet.
** significant at 5% confidence level, *** significant at 1% confidence level.
The Table contains the full set of estimators from specification 1. The dependent variable is the
logarithm of the Big-Mac meal price. It shows that the franchisee’s premium has significantly decreased
from 12.42% in 1999 to 3.61% in 2006. Moreover, the coefficients on the competition proxies, defined
as the number of chain affiliated hamburger outlets located within 0.1 mile and between 0.1 to 0.5 are
insignificant determinants of the Big-Mac meal price.
34

Table 5: Franchisees’ Premium
Dependent Variable Big Mac
Meal
Double
Quarter
Pounder
Meal
Quarter
Pounder
Meal
Fillet-O-
Fish
Meal
McNuggets
6 pc.
McNuggets
20 pc.
D2006 0.348***
(0.167)
0.26***
(0.014)
0.1***
(0.015)
0.247**
(0.011)
0.21***
(0.026)
0.11***
(0.011)
Dfranchised 0.1242***
(0.021)
0.074***
(0.017)
0.072***
(0.017)
0.026**
(0.012)
0.051***
(0.012)
0.021
(0.014)
D2006 ∗Dfranchised -0.0881***
(0.018)
-0.0461**
(0.019)
-0.0614***
(0.0182)
-0.012
(0.015)
0.006
(0.028)
0.0107
(0.013)
R2 0.89 0.88 0.53 0.91 0.84 0.78
N 117 96 96 113 90 93
Standard errors are in parenthesis. Errors are clustered by outlet.
** significant at 5% confidence level, *** significant at 1% confidence level.
The Table contains the coefficients of the franchisee’s premium in 1999 and the change in the premium
from 1999 to 2006 for all meals offered both in 1999 and in 2006. Each column presents regression
results using logarithm of a different meal price as the dependent variable. For all the meals, the
price at franchised outlets was significantly higher in 1999. The price premia across franchised and
corporate-owned outlets have fallen in 2006 only for a subset of the meals: the Big Mac meal; Quarter
Pounder meal and Double Quarter Pounder meal. For example, the price premium for the Big-Mac
meal has fallen by almost 9%. The price premium for the remaining meals (i.e. McNuggets meals and
the Fillet-O-Fish meal) have not significantly changed.
35

Table 6: Franchisees’ Premium for Jack-in-the-Box Signature Meal
Dependent Variable Jumbo
Jack Meal
D2006 0.195***
(0.005)
Dfranchised 0.0568***
(0.0204)
D2006 ∗Dfranchised -0.0581**
(0.024)
R2 0.94
N 71
Standard errors are in parenthesis. Errors are clustered by outlet.
** significant at 5% confidence level, *** significant at 1% confidence level.
The Table contains coefficients of franchisee’s premium in 1999 and the change in the premium from
1999 to 2006 using the logarithm of Jumbo Jack meal price as the dependent variable. Jumbo Jack
is Jack-in-the-Box signature dish, the equivalent to McDonald’s Big-Mac. The main finding is that
between 1999 and 2006 the price premium for the Jumbo Jack has disappeared. Jack-in-the-Box Value
meal (The Dollar menu equivalent) was introduced in late 2001.
36

Table 7: Big-Mac Meal Price Patterns by Secondary Proxies (1999)
Proxy Far From
Highway
Playground
Presence
Wireless
Service
All Proxies
Combined
Drepeat 0.036
(0.039)
0.033
(0.035)
0.048
(0.049)
0.061
(0.037)
Dfranchised 0.158***
(0.043)
0.146***
(0.03)
0.175***
(0.052)
0.149***
(0.025)
Drepeat ∗Dfranchised -0.049
(0.05)
-0.058
(0.045)
-0.066
(0.058)
-0.124**
(0.049)
R2 0.56 0.56 0.56 0.61
N 52 52 52 52
Standard errors are in parenthesis. Errors are clustered by outlet.
** significant at 5% confidence level, *** significant at 1% confidence level.
The Table presents the regression results examining how the 1999 Big-Mac meal price varied across
outlets characterized by the secondary set of proxies. Each column contains a separate regression
results using a different proxy, i.e. in the first column the dummy variable is equal to one if the outlet
is located at a distance from a highway; in the second if there is a playground on-site, and in the third
column if wireless service is available. The fourth column is a combination of all three proxies. When
we use the highway proxy, we obtain that franchisees’ prices were 15.8% higher than corporate-owned
outlets at outlets located near the highway, whereas only 10.9% higher at a distance from the highway.
We can reject the null hypothesis that the price differences are zero within location, and cannot reject
the hypothesis that the price premium across locations is the same. When we use the joint proxy,
the price premium is 14.9% at outlets not characterized by the proxy, and only 2.6% higher at outlets
characterized by the joint proxy. In this regression we can reject the null hypothesis that the price
premium is the same across outlets characterized and not characterized by the proxy. Likewise, when
we use the playground and wireless service proxies we get similar qualitative results.
37

Table 8: Big-Mac Meal Price Patterns by Secondary Proxies (1999 - 2006)
Proxy Distance
From
Highway
Playground
Presence
Wireless
Service
All Proxies
Combined
Drepeat, (γ1) 0.034
(0.026)
0.029
(0.039)
0.036
(0.024)
0.056
(0.057)
Dfranchised, (γ2) 0.161**
(0.031)
0.147**
(0.016)
0.154**
(0.021)
0.145***
(0.015)
D2006, (γ3) 0.37**
(0.005)
0.359**
(0.009)
0.378**
(0.014)
0.364***
(0.008)
Drepeat ∗Dfranchised, (γ4) -0.05
(0.042)
-0.062
(0.047)
-0.039
(0.036)
-0.105
(0.066)
Drepeat ∗D2006, (γ5) -0.035
(0.026)
-0.028
(0.039)
-0.035
(0.023)
-0.057
(0.055)
Dfranchised ∗D2006, (γ6) -0.115**
(0.03)
-0.103**
(0.015)
-0.12***
(0.022)
-0.104***
(0.014)
Drepeat ∗Dfranchised ∗D2006,
(γ7)
0.038
(0.041)
0.041
(0.044)
0.041
(0.032)
0.074
(0.056)
R2 0.90 0.89 0.89 0.91
N 108 117 110 110
Standard errors are in parenthesis. Errors are clustered by outlet. ** significant at 1% confidence level.
The Table presents the results of the difference-in-difference-in-difference regression. The dependent
variable is the Big-Mac meal price logarithm, and each column displays the results of a regression using
a different secondary proxy. For example, in the first column, the dummy variable is equal to 0 if an
outlet is located near a highway and 1 if it is located near a highway. The main finding derived from
the highway proxy regression analysis is that franchisees’ price premium for outlets located near the
highway dropped significantly from 16.1% (γ2) in 1999 to 4.6% (γ2 + γ6) in 2006. The price premium
for outlets located at a distance from the highway fell significantly from 11.1% (γ2 +γ4) in 1999 to 3.3%
(γ2 + γ4 + γ6 + γ7) in 2006. The results are demonstrated graphically in Figure 6. We can reject a joint
F test for the three following hypotheses: (γ2 > 0; γ2 + γ4 > 0; γ2 > γ2 + γ4) as well as for the following
joint test: (γ2 +γ6 > 0; γ2 +γ4 +γ6 +γ7 > 0; γ2 +γ6 > γ2 +γ4 +γ6 +γ7). Nevertheless, we cannot reject
each separate hypothesis. Similar qualitative results are obtained when we utilize the other proxies.
38

Table 9: Characteristics of Airport Restaurants
McDonald’s Burger-King
Fran. Corp. Fran. Corp.
Restaurants 38 3 7 2
Value Menu 0 0 0 2
Airport Employee
Discount
31 1 5 2
The Table presents characteristics of McDonald’s and Burger-King airport restaurants located in U.S.
airports. For example, there are 38 McDonald’s franchised outlets, none of which offers the Dollar Menu
and 31 offer an airport employee discount.
Table 10: Summary Statistics - Airport Restaurants
Big-Mac Meal Double Cheeseburger
Corp. Fran. Corp. Fran.
Mean 5.23 5.92 2.07 1.93
Std. 0.35 0.54 0.25 0.37
Min. 5.03 4.81 1.81 1.35
Max. 5.65 6.92 2.29 2.85
N 3 35 3 35
The Table presents descriptive statistics for the (with tax) nominal Big-Mac meal and the Double
Cheeseburger prices in McDonald’s restaurants located in U.S. airports during September 2007. None
of the airport restaurants offer the Dollar Menu and prices are significantly higher at airport restaurants
compared to non-airport restaurants as presented in Table 3.
39

Table 11: Survey Response
Big-
Mac
Meal
Chicken
Mc-
Nuggets
Double
Cheese-
burger
Dollar
Menu
Meal
McChicken
Dollar
Menu
Meal
Enlarged
Double
Cheese-
burger
Dollar
Menu
Meal
Enlarged
Mc-
Chicken
Dollar
Menu
Meal
Big-Mac
Meal
0.178 0 0.392 0.142 0.214 0.071
Chicken
Mc-
Nuggets
0 0.468 0.127 0.212 0.063 0.127
The Table contains a summary of the responses to the survey we conducted. The (i, j) entry of the table
is the proportion of respondents that chose option j from the extended menu conditional on choosing
option i from the base menu. While only 17.8% of the respondents that chose Big-Mac did not change
their choice after the Dollar Menu options were added, 46.8% of the respondents that chose McChicken
did not change their choice following the Dollar Menu options addition.
40
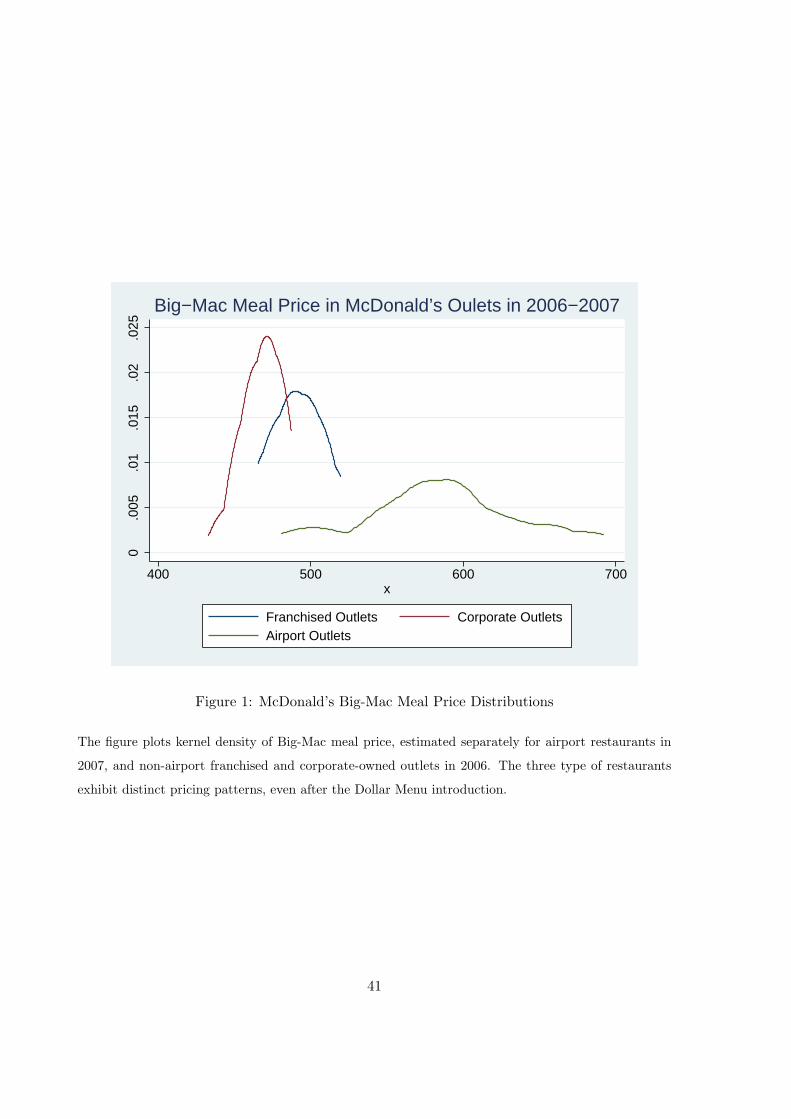
0.0
05.0
1.0
15.0
2.0
25
400 500 600 700x
Franchised Outlets Corporate OutletsAirport Outlets
Big−Mac Meal Price in McDonald’s Oulets in 2006−2007
Figure 1: McDonald’s Big-Mac Meal Price Distributions
The figure plots kernel density of Big-Mac meal price, estimated separately for airport restaurants in
2007, and non-airport franchised and corporate-owned outlets in 2006. The three type of restaurants
exhibit distinct pricing patterns, even after the Dollar Menu introduction.
41

05
1015
20D
ensi
ty
.9 1 1.1 1.2 1.3 1.4Normalized_Price
Franchised Outlets
Corporate Outlets
kernel = gaussian, bandwidth = .04
McDonald’s 1999 Big−Mac Meal Price Distributions
05
1015
20D
ensi
ty
.9 1 1.1 1.2 1.3 1.4Normalized_Price
Franchised Outlets
Corporate Outlets
kernel = gaussian, bandwidth = .03
McDonald’s 2006 Big−Mac Meal Price Distributions
Figure 2: McDonald’s Big-Mac Meal Price Distributions
The figure plots kernel density of Big-Mac meal normalized price, estimated separately for franchised
and corporate-owned outlets for the time periods 1999 and 2006. An outlet normalized price is the ratio
between the outlet nominal price and the average price set in corporate-owned outlets in the same year.
The figure illustrates well how the two price distributions approach each other from 1999 to 2006.
42
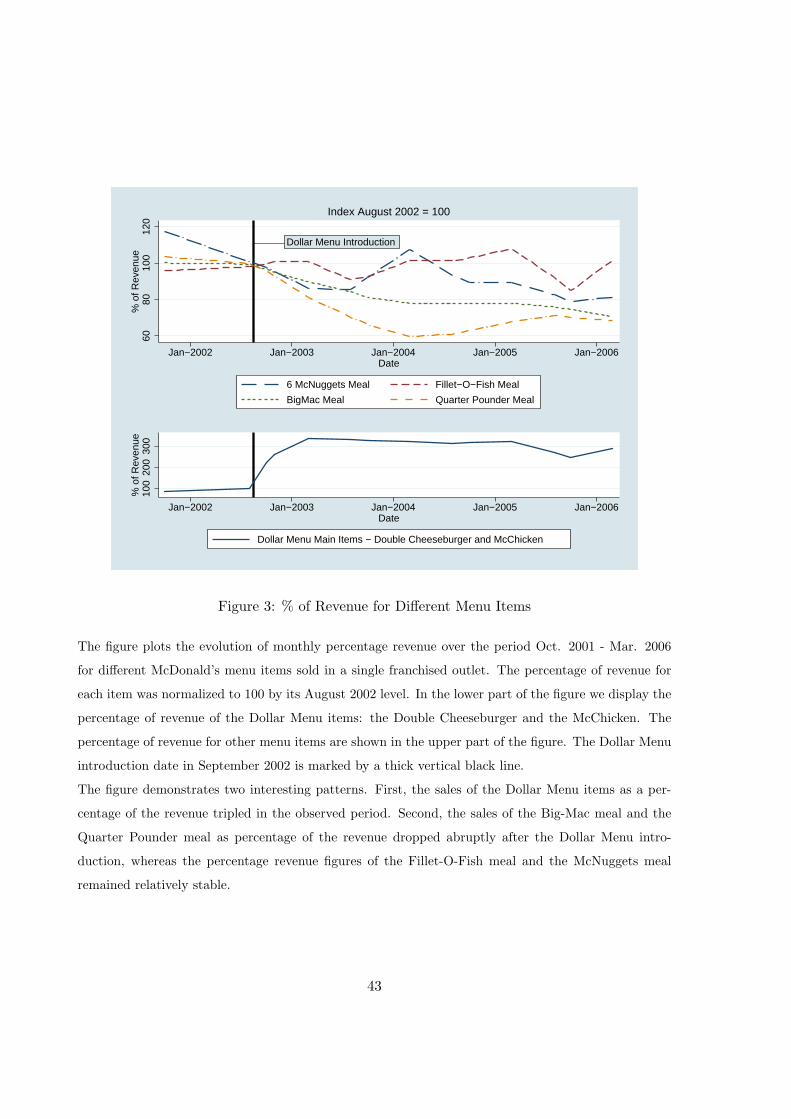
Dollar Menu Introduction
6080
100
120
% o
f Rev
enue
Jan−2002 Jan−2003 Jan−2004 Jan−2005 Jan−2006Date
6 McNuggets Meal Fillet−O−Fish Meal
BigMac Meal Quarter Pounder Meal
Index August 2002 = 100
100
200
300
% o
f Rev
enue
Jan−2002 Jan−2003 Jan−2004 Jan−2005 Jan−2006Date
Dollar Menu Main Items − Double Cheeseburger and McChicken
Figure 3: % of Revenue for Different Menu Items
The figure plots the evolution of monthly percentage revenue over the period Oct. 2001 - Mar. 2006
for different McDonald’s menu items sold in a single franchised outlet. The percentage of revenue for
each item was normalized to 100 by its August 2002 level. In the lower part of the figure we display the
percentage of revenue of the Dollar Menu items: the Double Cheeseburger and the McChicken. The
percentage of revenue for other menu items are shown in the upper part of the figure. The Dollar Menu
introduction date in September 2002 is marked by a thick vertical black line.
The figure demonstrates two interesting patterns. First, the sales of the Dollar Menu items as a per-
centage of the revenue tripled in the observed period. Second, the sales of the Big-Mac meal and the
Quarter Pounder meal as percentage of the revenue dropped abruptly after the Dollar Menu intro-
duction, whereas the percentage revenue figures of the Fillet-O-Fish meal and the McNuggets meal
remained relatively stable.
43

Dollar Menu Introduction
6080
100
120
% o
f Tra
nsac
tions
Jan−2002 Jan−2003 Jan−2004 Jan−2005 Jan−2006Date
6 McNuggets Meal Fillet−O−Fish Meal
BigMac Meal Quarter Pounder Meal
Index August 2002 = 100
100
200
300
% o
f Tra
nsac
tions
Jan−2002 Jan−2003 Jan−2004 Jan−2005 Jan−2006Date
Dollar Menu Items − Double Cheeseburger and McChicken
Figure 4: % of Transactions for Different Menu Items
The figure plots the percentage of transactions in which each of the items was purchased over the period
of Oct. 2001 - Mar. 2006 in a single franchised outlet. The percentage of transactions for each item
was normalized to 100 in August 2002. In the lower part of the figure we display the percentage of
transactions of the Dollar Menu items: the Double Cheeseburger and the McChicken. The percentage
of transactions for the regular menu items are shown in the upper part of the figure. The Dollar Menu
introduction date in September 2002 is marked by a thick vertical black line.
The figure demonstrates two interesting patterns. First, the sales of the Dollar Menu as a percentage of
the transactions tripled in the observed period. Second, the sales of the Big-Mac meal and the Quarter
Pounder meal as percentage of the transactions dropped abruptly after the Dollar Menu introduction,
whereas the percentage revenue figures of the Fillet-O-Fish meal and the McNuggets meal remained
relatively stable.
44

Hi Students,
We are running a study on individuals’ fast food preferences, and would highly appreciate your help in filling the short questionnaire below.
Note that there are no right or wrong answers, your participation is voluntary.
You enter a McDonald’s restaurant and need to choose among the following two available standard meals (each containing an entrée + medium fries + medium soda)
A. Big Mac Meal ($4.59) B. Chicken McNuggets (6 piece) Meal ($4.29)
1. Which one of the four meals above would you choose? ___
The next time you enter a McDonald’s outlet you discover that McDonald’s introduced two new Dollar Menu Meal options.
Dollar Menu Meal can be one of two options:
- Dollar Menu Meal - one small entrée + medium fries + medium soda for $3.00 - Enlarged Dollar Menu Meal - two small entrées + medium fries + medium soda for $4.00
Therefore, you now have the following six options to choose from (two regular meals and four Dollar Menu Meals):
A. Big Mac Meal ($4.59) B. Chicken McNuggets (6 piece) Meal ($4.29) C. Double Cheeseburger Dollar Menu Meal – Double Cheeseburger + medium fries + medium soda ($3.00)
D. McChicken Dollar Menu Meal - McChicken + medium fries + medium soda ($3.00) E. Enlarged Double Cheeseburger Dollar Menu Meal – Two Double Cheeseburgers + one medium fries + one medium soda ($4.00) F. Enlarged McChicken Dollar Menu Meal – Two McChicken + one medium fries + one medium soda ($4.00)
2. Which option would you choose? ____
3. In case your preferred option is not available, which other option would you choose instead? ______
4. How often do you eat at McDonald’s or other fast food chains?
1. Once a week or more 2. Once a month or more 3. A few times a year 4. Hardly ever or never
Answer: ____ Thank you for your cooperation!
Figure 5: Survey
45

1999 2006
F
C
F
C
Relative
Prices
16.1%
4.6%
F – Franchised outlet
C – Corporate outlet
11.1%
F
C
1999
3.3%
2006
Relative
Prices
F
C
Non-highway
Highway
Figure 6: Dif-in-Dif-in-Dif Regression using the Highway Proxy
The figure displays the relative prices of a Big-Mac meal offered at a franchised and at corporate-owned
outlets at a given year and a given location (near a highway or at a distance from the highway). The
relative prices are derived from the difference-in-difference-in-difference regression presented in Table
8. For example, in 1999, a Big-Mac meal price at a franchised outlet near the highway was 16.1% (γ2)
higher than a corporate-owned outlet near the highway. The difference has dropped to 4.6% (γ2 + γ6)
in 2006. At outlets located at a distance from the highway, the premium was 11.1% (γ2 + γ4) in 1999
and only 3.3% (γ2 + γ4 + γ6 + γ7) in 2006.
46