Presentazione Parigi 27Febbraio2013 - Biesse Group - …€¦ · Biesse key successful factors...
63
Transcript of Presentazione Parigi 27Febbraio2013 - Biesse Group - …€¦ · Biesse key successful factors...

our history1978 Realized the first numerical control boring machine for wood: Logic Control
1983 Rover: the first machining centre for the processing of wood is built
1987 Intermac is established: The company produces machining centres forprocessing and engeneering glass and stone
1991 HSD is established: the company realizes and sells mechanical componentsand numerical controls
1991 Biesse becomes international: the first foreign branches are opened
1992 Biesse starts “the acquisition period”: aimed operations in wood/glass&stone/components and distribution network areas
1994 Biesse Engineering is established: new business unit fully dedicated to project and realize entire lines and integrated systems
1998 Biesse group is formed. It’s composed of three divisions: wood, mechatronic, glass and stone
1999 “ Centro di Formazione e studi” (Biesse School) is established
2001 Biesse is quoted on the italian stock exchange (listed in STAR segment)
2006 Bre.Ma. is acquired: the company designs and realizes vertical numericalcontrol boring-inserting machine for the processing of wood
2007 AGM Inc (U.S.A.) is acquired: former distributor for glass & stone machinerybecomes Intermac U.S.A. subsidiary
2008 New plants for the wood division: Bangalore (India) first foreign production site
2009 Biesse Group incorporates Digipac brand - packaging technology –
2009 Biesse open new subsidiaries in Switzland and Duba i
2010 BiesseInside hosts for the first time 4 listed companies (Indesit-Elica-PrimaIndustrie-Sabaf) to meet the financial community during an internal open-house
2011 VIET - historic wood brand for calibration and sanding machines - added tothe Group
2012 Biesse acquires the majority of Korex Machinery Dongguan (China)
1
our world structure
Italy – Pesaro H.O.
U.K.Daventry
SuisseLucerna
SwedenJonkoping
RussiaMoscow
India
Bangalore
Indonesia
Jakarta
Malaysia
Kuala Lumpur
Australia
Sidney
Brisbane
Adelaide
Melbourne
Perth
New Zealand
22
our world structureGermanyElchingenLoehneGingen
FranceLyon
SpainBarcelona
PortugalSyntra
U.A.E.Dubai
New Zealand
Auckland
U.S.A. & Canada
Charlotte. N.C.
Ft. Lauderdale FL.
Toronto - Montreal
Asia
Singapore
China
Shanghai
Dongguan
Korea
Bucheon City
Gyunggido
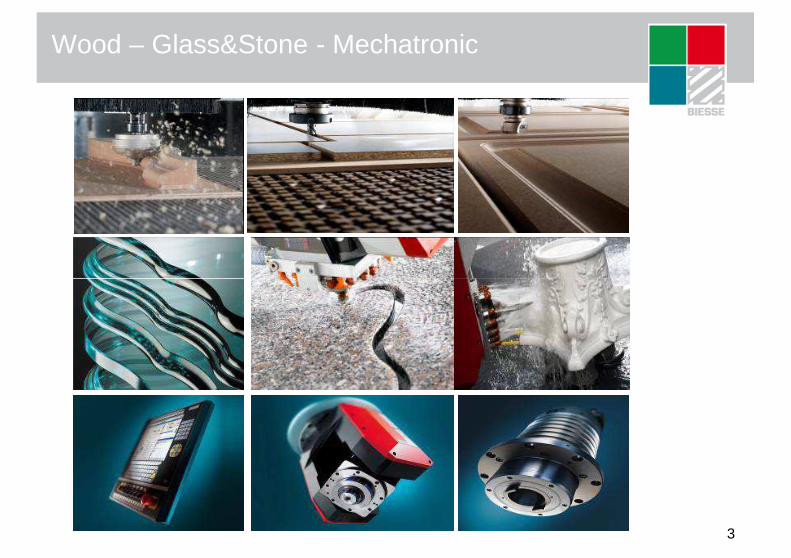
Wood – Glass&Stone - Mechatronic
3
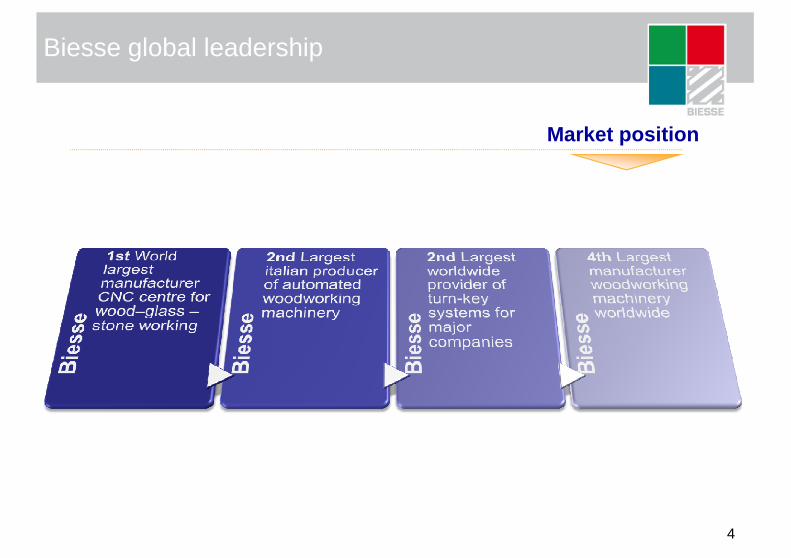
Biesse global leadership
Market position
4

Biesse key successful factors
Biesse produces machine tools and systems for the secondary processing of wood,glass and stone, together with associated numerical controls, motors, software andprecision components
Biesse has achieved operating excellence due to the following key factors:
Worldwide extensive directsales network & supportcapabilities
5
Strong commitment and investment in R&D
Flexible and slim business model – the lean company
One stop shop for superiorquality products
Integrated supply network
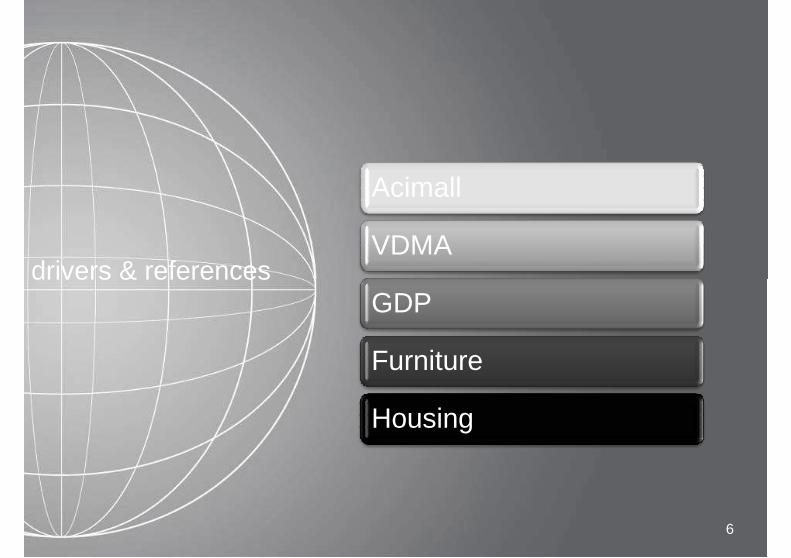
drivers & references
Acimall
VDMA
66
drivers & referencesGDP
Furniture
Housing
Acimall (Italy):
Estratto del comunicato stampa ACIMALL del 30 Gennaio 2013:
MACCHINE ITALIANE PER IL LEGNO: IL PRECONSUNTIVO 2012IL FATTURATO AI LIVELLI DI DUE ANNI FA; ANNULLATO IL “RIMBALZO ” DEL 2011
Il 2012 è stato contraddistinto dal segno meno per le tecnologie dedicate alla lavorazione del legno e dei suoi derivati. I datipreconsuntivi elaborati dall’Ufficio studi di Acimall confermano le difficoltà incontrate dall’industria italiana di settore che, nelcorso degli ultimi cinque anni, ha complessivamente perso circa il 30 per cento del proprio fatturato.
“Rispetto al 2011 la produzione è calata del 9,8 per cento , dato sul quale hanno pesato sia l’ulteriore compressione delmercato interno (meno 15 per cento) che la flessione delle esportazioni (meno 8 per cento)……”.“…….in Italia l’edilizia, il mobile e tutti i beni che nascono dal legno e dai suoi derivati registrino una dinamica negativa non
7
“…….in Italia l’edilizia, il mobile e tutti i beni che nascono dal legno e dai suoi derivati registrino una dinamica negativa nonpuò che bloccare qualsiasi investimento nei beni strumentali”.
Le esportazioni continuano a essere un capitolo di vitale importanza; la flessione dell’8 per cento, per quanto rilevante, valetta alla luce di un 2011 nel quale, come già ricordato, il “made in Italy” aveva registrato un momento particolarmentefavorevole.
Impossibile fare ipotesi su cosa ci riserva il 2013. I primi dati sembrano indicare un possibile consolidarsi della situazionenegativa, che determinerebbe una crisi di settore all’interno di una più globale crisi economica.

VDMA (Germany):
8

VDMA (Germany):
Orders intake Y/Y delta %:
9
-18%Woodworking

205,9
278,4
323,2
290,3
81
97,7
80,9
100,0
120,0
140,0
210
240
270
300
330
Group orders intake
€/mln
Group orders intake: quarterly trend 2009-2012
-10,2%
10
39,2 46,7
59,4 60,6
69,9 69,1 65,8
73,6
81
63,6
80,9
68,9
77,5
67,4
76,5
0,0
20,0
40,0
60,0
80,0
0
30
60
90
120
150
180
210
2009 IQ 2009 IIQ 2009 IIIQ 2009 IVQ 2010 IQ 2010 IIQ 2010 IIIQ 2010 IVQ 2011 IQ 2011 IIQ 2011 IIIQ 2011 IVQ 2012 IQ 2012 IIQ 2012 IIIQ 2012 IVQ
year quarters

Biesse : Group breakdown 2012 vs 2011
14,1%
29,9%
9,5%
18,9%
10,1%
by countries
Italy
Western E.
Eastern E.
U.S.A. - Canada
Asia Pacific
B.R.I.C. : 15,1%
Brazil=5,5%Russia=4,5%India= 0,7%China=4.4%
2011
11
17,5%
Rest of the W.
10,8%
28,8%
17,9%
10,9%
19,2%
12,4%
by countries
Italy
Western E.
Eastern E.
U.S.A. - Canada
Asia Pacific
Rest of the W.
B.R.I.C. : 19,4%
Brazil=8,0%Russia=4,6%India= 1,3%China=5,5%
2012
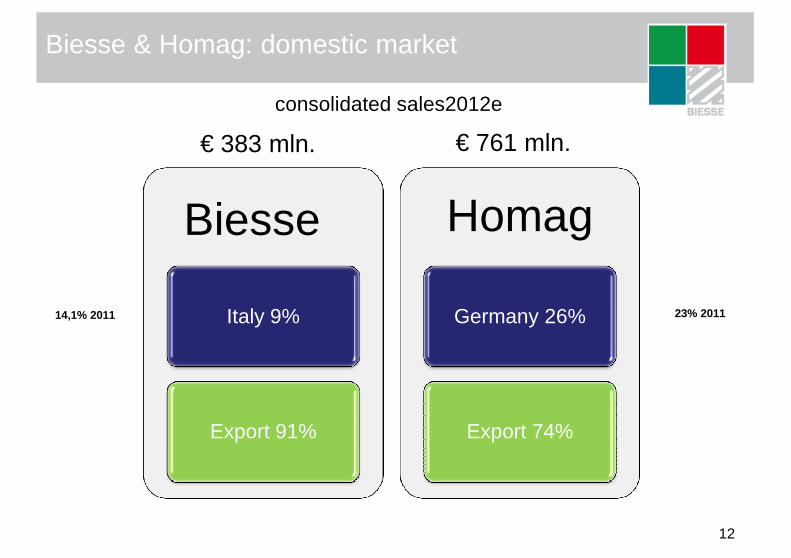
Biesse & Homag: domestic market
Biesse Homag
consolidated sales2012e
€ 383 mln. € 761 mln.
12
Italy 9%
Export 91%
Germany 26%
Export 74%
23% 201114,1% 2011
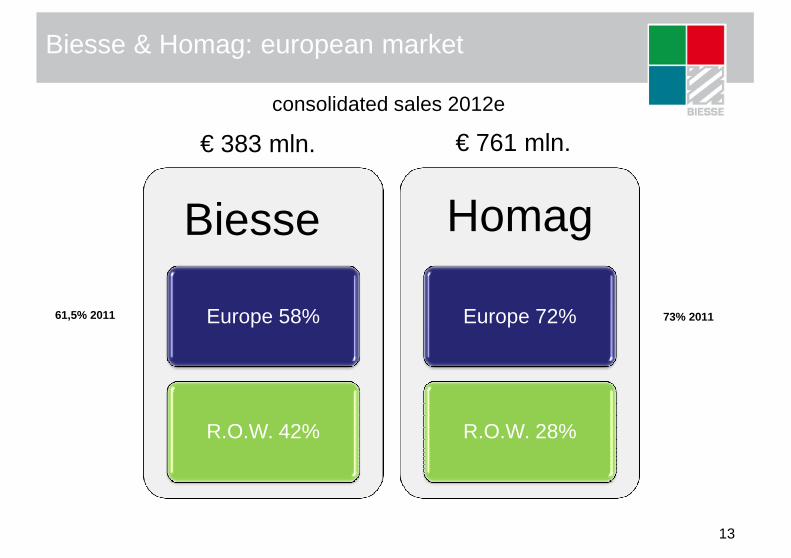
Biesse & Homag: european market
Biesse Homag
consolidated sales 2012e
€ 383 mln. € 761 mln.
13
Europe 58%
R.O.W. 42%
Europe 72%
R.O.W. 28%
61,5% 2011 73% 2011
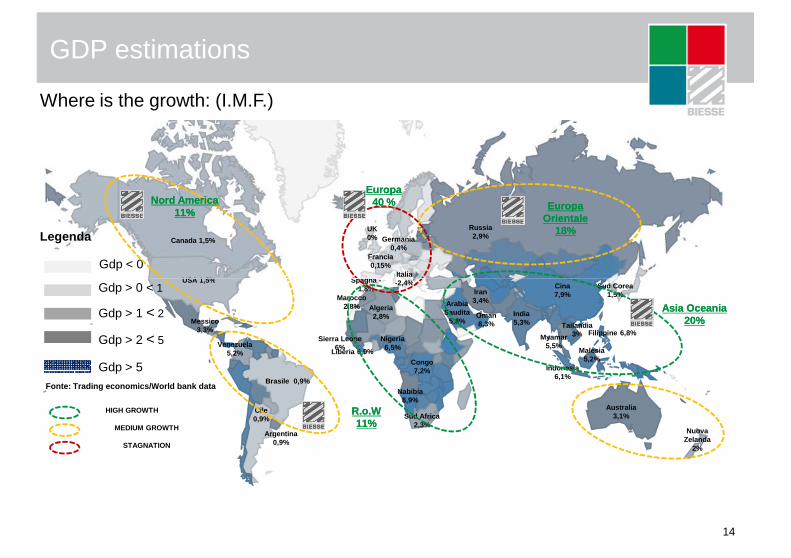
GDP estimations
Where is the growth: (I.M.F.)
Legenda
Gdp < 0USA 1,5%
Canada 1,5%
UK 0%
Francia 0,15%
Spagna -Italia -2,4%
Germania 0,4%
Russia2,9%
Europa Europa OrientaleOrientale
18%18%
EuropaEuropa40 %40 %Nord AmericaNord America
11%11%
14
Gdp > 0 < 1
Gdp > 1 < 2
Gdp > 2 < 5
Gdp > 5Fonte: Trading economics/World bank data
USA 1,5%
Messico 3,3%
Venezuela 5,2%
Brasile 0,9%
Argentina 0,9%
Cile 0,9%
Spagna -1,8%
-2,4% Cina7,9%
India5,3%
Indonesia6,1%
Malesia5,2%
Sud Corea 1,5%
Australia3,1%
Nuova Zelanda
2%
Filippine 6,8%Tailandia
3%Myamar5,5%
Iran3,4%
Oman8,3%
Arabia Saudita
5,8%
Sud Africa2,3%
Nigeria6,5%
Marocco2,8% Algeria
2,8%
Congo7,2%
Nabibia8,9%
Sierra Leone 6%
Liberia 6,9%
Asia OceaniaAsia Oceania20%20%
R.o.WR.o.W11%11%
HIGH GROWTH
MEDIUM GROWTH
STAGNATION

GDP - net sales - furniture - housing
5
15
25
5
10
15
delta % year -1
Furniture CAGR 2013-2015: +7,6%
F.M.I. GDP normalizzato (indice mondiale)CSIL furniture demand (indice mondiale)CRESME new housing (indice mondiale)
GDP CAGR 2013-2015:
Housing CAGR 2013-2015: +4,8%
15
-45
-35
-25
-15
-5
-15
-10
-5
0
2004 2005 2006 2007 2008 2009 2010 2011 2012e 2013e 2014e 2015e
GDP Housing Furniture Biesse - consolidated sales (dx)
GDP CAGR 2013-2015: +4%
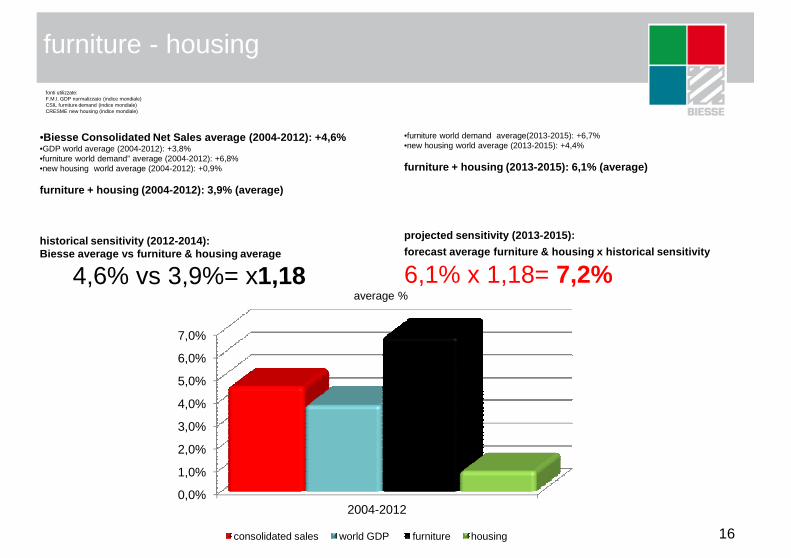
furniture - housing
fonti utilizzate:F.M.I. GDP normalizzato (indice mondiale)CSIL furniture demand (indice mondiale)CRESME new housing (indice mondiale)
•Biesse Consolidated Net Sales average (2004-2012): +4,6%•GDP world average (2004-2012): +3,8%•furniture world demand” average (2004-2012): +6,8%•new housing world average (2004-2012): +0,9%
furniture + housing (2004-2012): 3,9% (average)
historical sensitivity (2012-2014):Biesse average vs furniture & housing average
4,6% vs 3,9%= x1,18
•furniture world demand average(2013-2015): +6,7%•new housing world average (2013-2015): +4,4%
furniture + housing (2013-2015): 6,1% (average)
projected sensitivity (2013-2015):
forecast average furniture & housing x historical sensit ivity
6,1% x 1,18= 7,2%
16
4,6% vs 3,9%= x1,18 6,1% x 1,18= 7,2%
0,0%
1,0%
2,0%
3,0%
4,0%
5,0%
6,0%
7,0%
2004-2012
consolidated sales world GDP furniture housing
average %
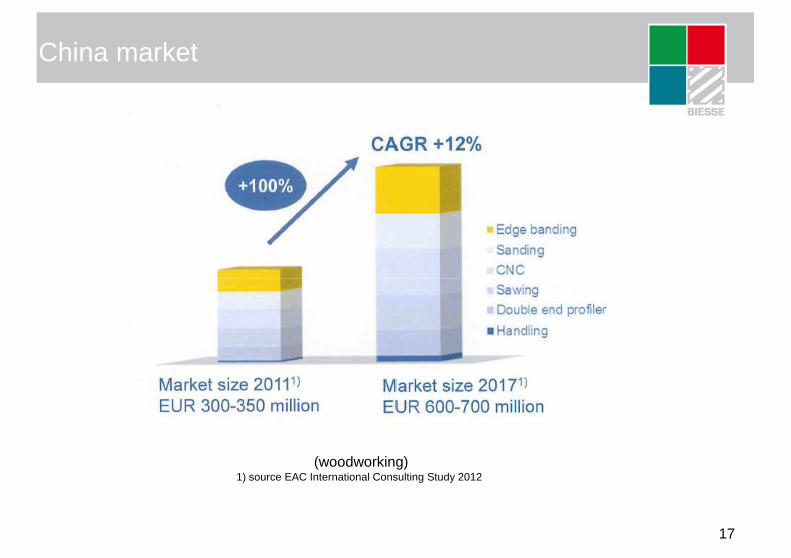
China market
17
(woodworking) 1) source EAC International Consulting Study 2012
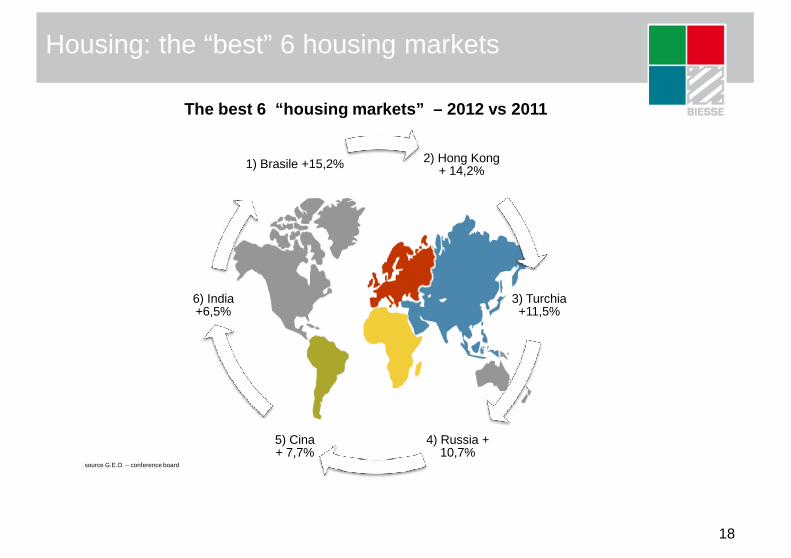
Housing: the “best” 6 housing markets
The best 6 “housing markets” – 2012 vs 2011
2) Hong Kong + 14,2%1) Brasile +15,2%
18
source G.E.O. – conference board
3) Turchia +11,5%
4) Russia + 10,7%
5) Cina + 7,7%
6) India +6,5%
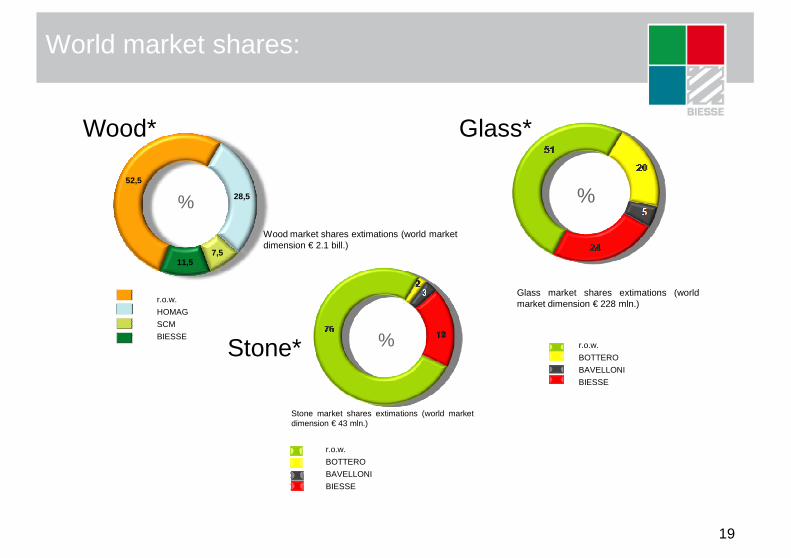
World market shares:
28,5
7,511,5
52,5
Wood market shares extimations (world market dimension € 2.1 bill.)
%
Wood*
%
Glass*
19
r.o.w.
HOMAG
SCM
BIESSEr.o.w.
BOTTERO
BAVELLONI
BIESSE
Glass market shares extimations (worldmarket dimension € 228 mln.)
r.o.w.
BOTTERO
BAVELLONI
BIESSE
Stone market shares extimations (world marketdimension € 43 mln.)
%Stone*

Strategy
Positioning
Mission
Three Years Business Plan
20
20
Positioning
Innovation – Technology -Products
India & China

Three Years Business Plan: Mission
Mission
Industrial identity
Biesse• Focus on our strength spots
• World leader for CNC machinery
• World player but “based” in Europe
• Strengthening of the world leadership in our corebusiness sectors(stand-alone and hi-tech groups)
• Focus to increase the growth of the europeanmarket shares (not only emerging markets)
• Entry level capillarity• Strengthening of the Systems sector
21
Mission Positioning
Innovation
BiesseD.N.A.
• Focus on our strength spotsto support the growth in different business segments
• new projects• technology• Products gamma

Three Years Business Plan: Strategy
Wastereduction
Operative
22
Increasemarginalityoverheadexpensesreduction
fixed costssobriety
Operative efficiency
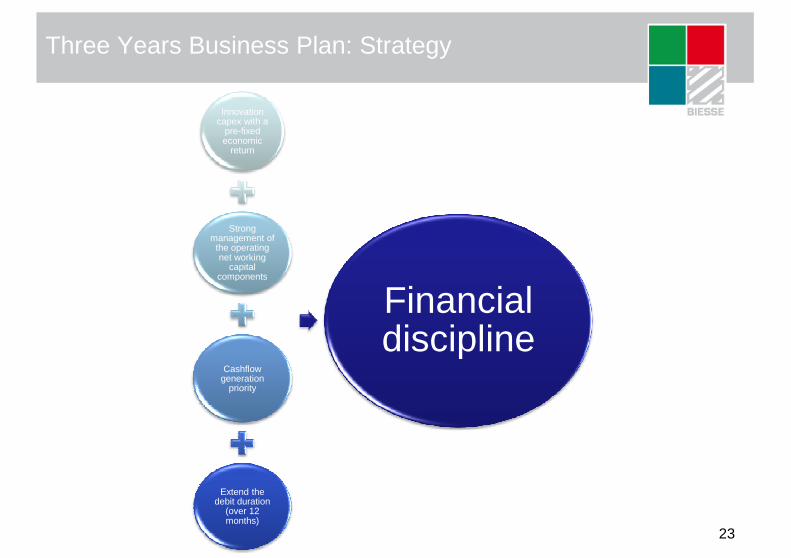
Three Years Business Plan: Strategy
Innovationcapex with a
pre-fixedeconomic
return
Strong management of
the operatingnet working
capital components
23
components
Cashflowgeneration
priority
Extend the debit duration
(over 12 months)
Financial discipline
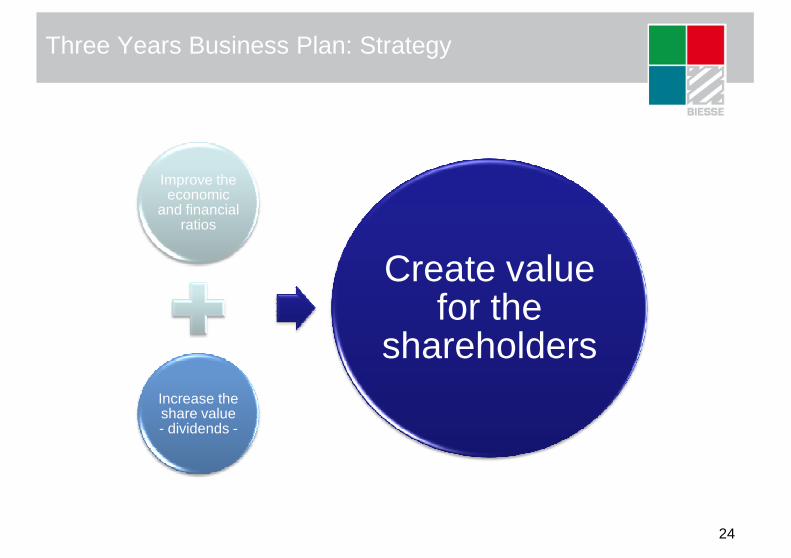
Three Years Business Plan: Strategy
Improve the economic
and financialratios
Create value
24
Increase the share value- dividends -
Create valuefor the
shareholders
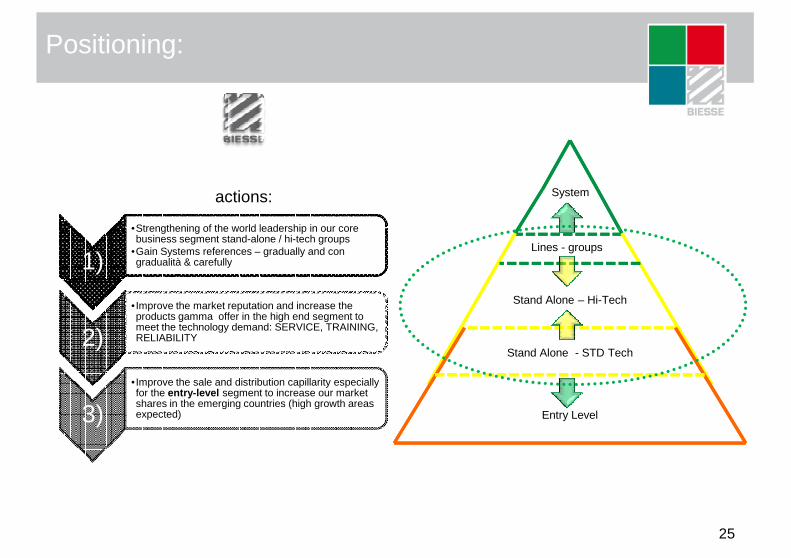
Positioning:
1)
•Strengthening of the world leadership in our corebusiness segment stand-alone / hi-tech groups
•Gain Systems references – gradually and con gradualità & carefully
System
Lines - groups
actions:
25
2)
• Improve the market reputation and increase the products gamma offer in the high end segment tomeet the technology demand: SERVICE, TRAINING, RELIABILITY
3)
• Improve the sale and distribution capillarity especiallyfor the entry-level segment to increase our market shares in the emerging countries (high growth areasexpected)
Stand Alone – Hi-Tech
Stand Alone - STD Tech
Entry Level
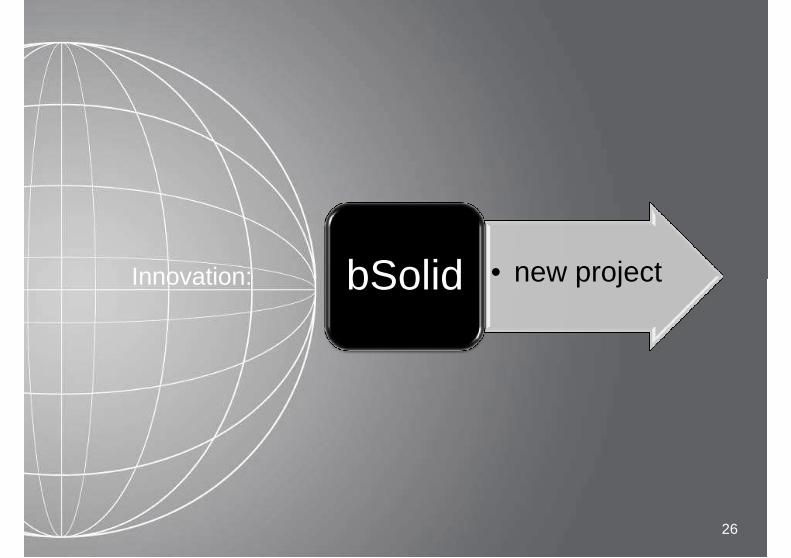
Innovation: • new projectbSolid
2626
Innovation: • new projectbSolid
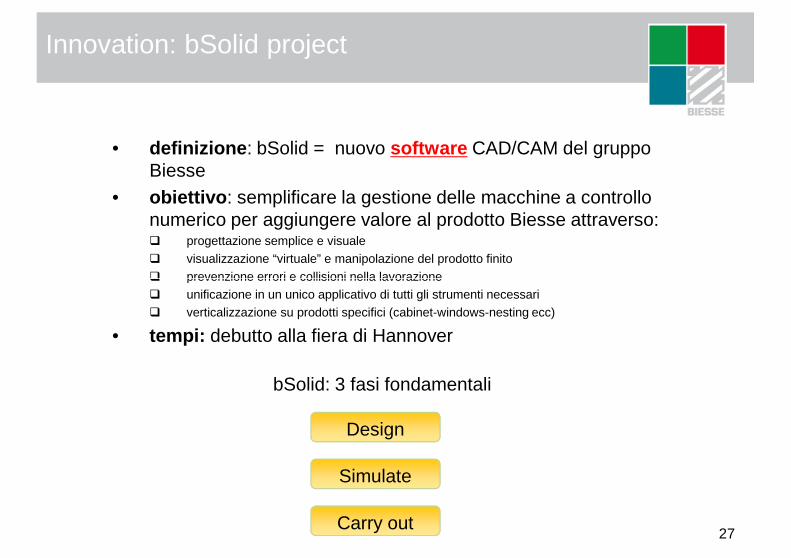
Innovation: bSolid project
• definizione : bSolid = nuovo software CAD/CAM del gruppo Biesse
• obiettivo : semplificare la gestione delle macchine a controllo numerico per aggiungere valore al prodotto Biesse attraverso:� progettazione semplice e visuale� visualizzazione “virtuale” e manipolazione del prodotto finito� prevenzione errori e collisioni nella lavorazione
27
bSolid: 3 fasi fondamentali
Design
Simulate
Carry out
� prevenzione errori e collisioni nella lavorazione� unificazione in un unico applicativo di tutti gli strumenti necessari� verticalizzazione su prodotti specifici (cabinet-windows-nesting ecc)
• tempi: debutto alla fiera di Hannover
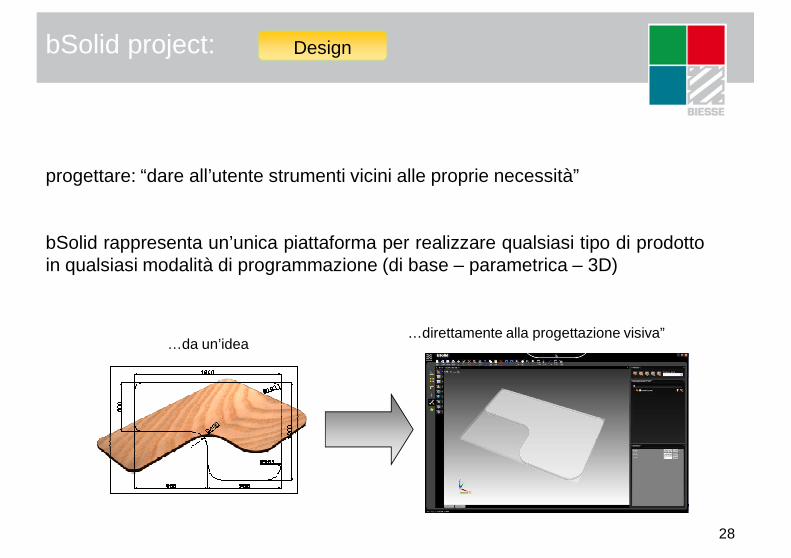
bSolid project: Design
progettare: “dare all’utente strumenti vicini alle proprie necessità”
bSolid rappresenta un’unica piattaforma per realizzare qualsiasi tipo di prodottoin qualsiasi modalità di programmazione (di base – parametrica – 3D)
28
…da un’idea…direttamente alla progettazione visiva”
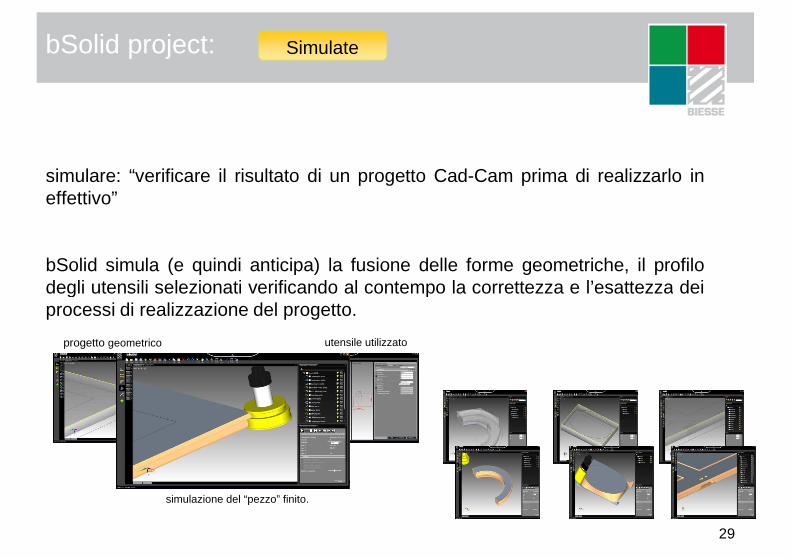
bSolid project: Simulate
simulare: “verificare il risultato di un progetto Cad-Cam prima di realizzarlo ineffettivo”
bSolid simula (e quindi anticipa) la fusione delle forme geometriche, il profilodegli utensili selezionati verificando al contempo la correttezza e l’esattezza dei
29
degli utensili selezionati verificando al contempo la correttezza e l’esattezza deiprocessi di realizzazione del progetto.
simulazione del “pezzo” finito.
utensile utilizzato progetto geometrico
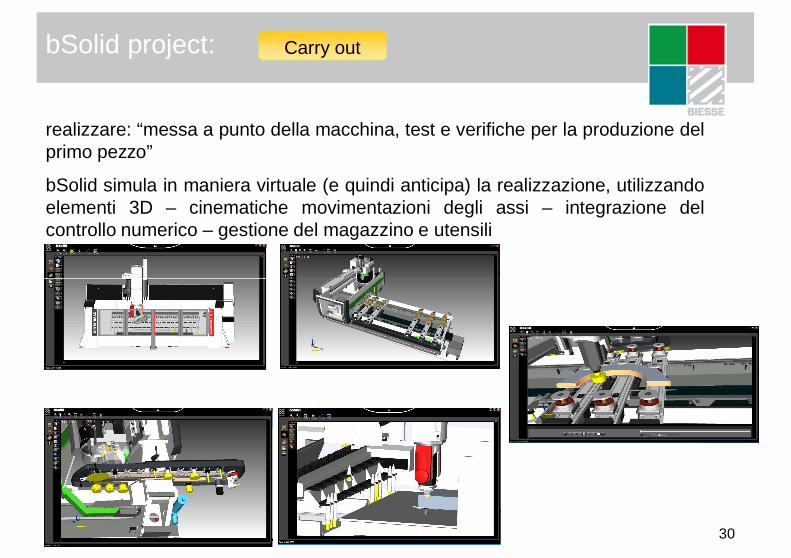
bSolid project: Carry out
realizzare: “messa a punto della macchina, test e verifiche per la produzione delprimo pezzo”
bSolid simula in maniera virtuale (e quindi anticipa) la realizzazione, utilizzandoelementi 3D – cinematiche movimentazioni degli assi – integrazione delcontrollo numerico – gestione del magazzino e utensili
30
Innovation: • new projectsSystems
3131
Innovation: • new projectsSystems
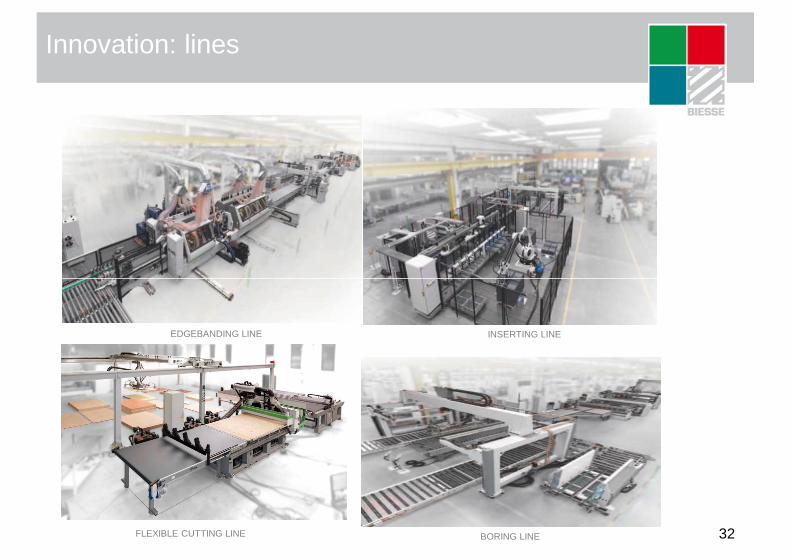
Innovation: lines
32
EDGEBANDING LINE INSERTING LINE
BORING LINEFLEXIBLE CUTTING LINE

Innovation: systems
Howdens: kitchen furniture industry
33
Knoll: office furniture industry
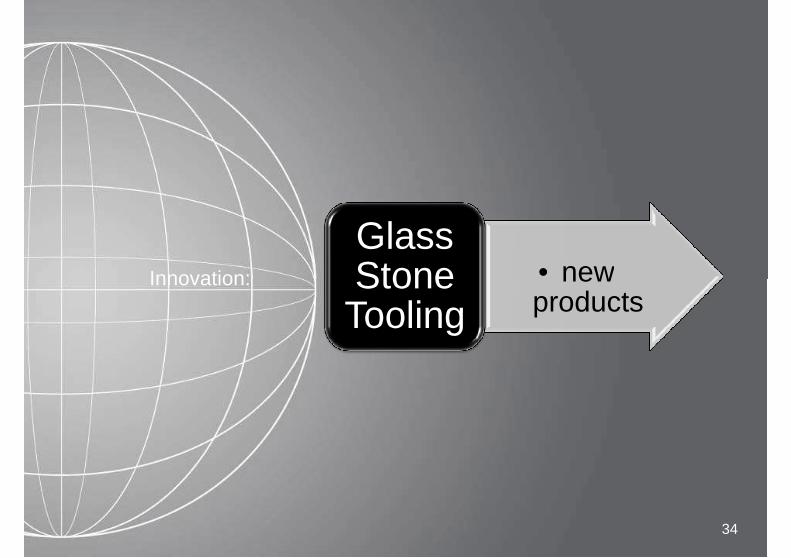
Innovation: • newGlass Stone
3434
Innovation: • newproducts
Stone Tooling
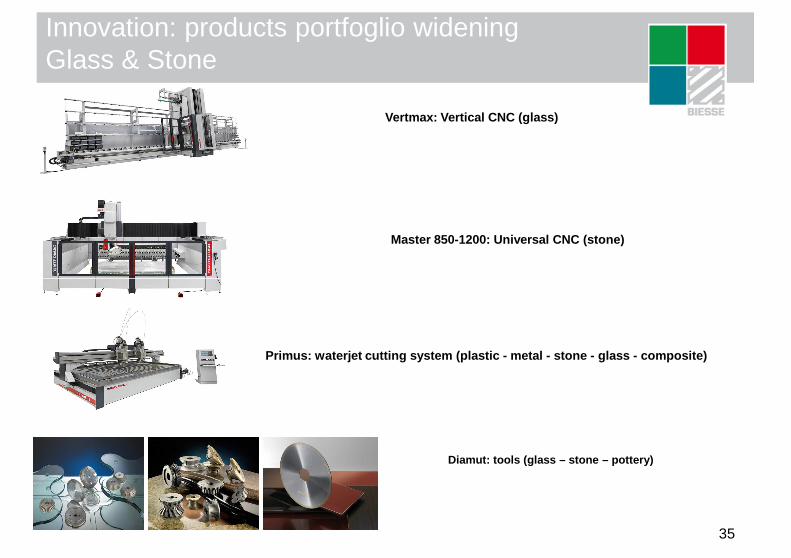
Vertmax: Vertical CNC (glass)
Master 850-1200: Universal CNC (stone)
Innovation: products portfoglio wideningGlass & Stone
35
Primus: waterjet cutting system (plastic - metal - ston e - glass - composite)
Diamut: tools (glass – stone – pottery)
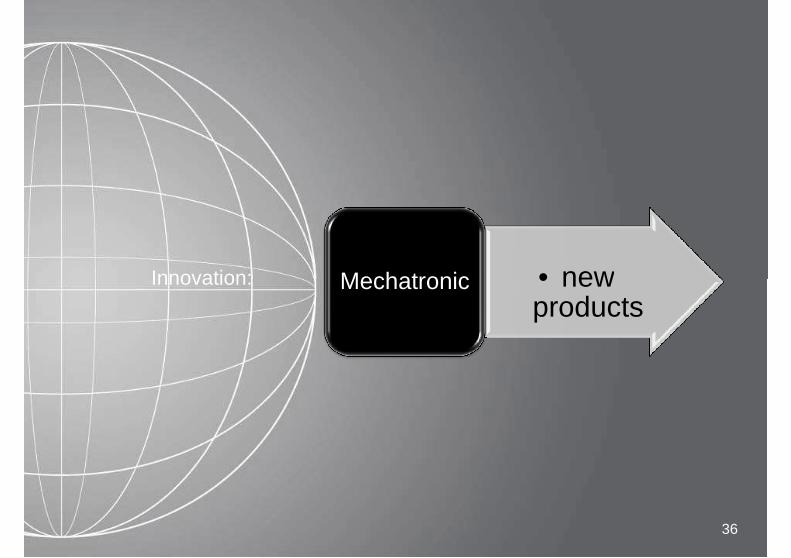
Innovation: • newMechatronic
3636
Innovation: • newproducts
Mechatronic
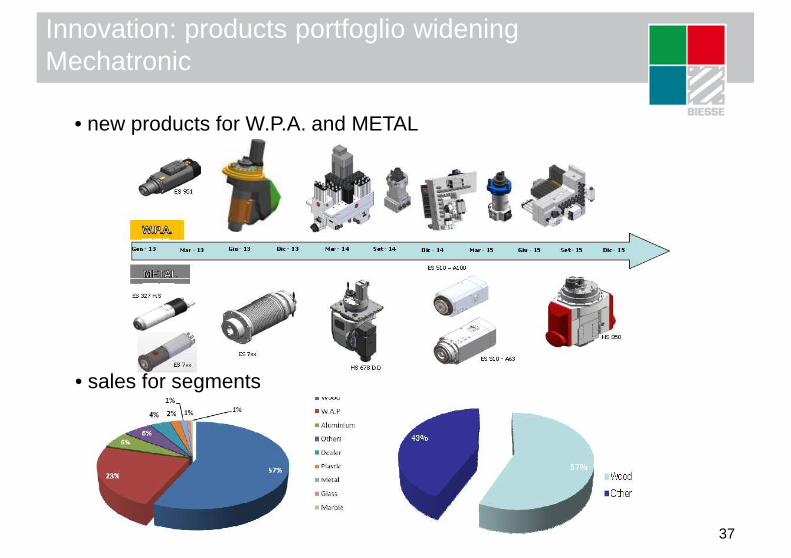
Innovation: products portfoglio wideningMechatronic
• new products for W.P.A. and METAL
37
• sales for segments
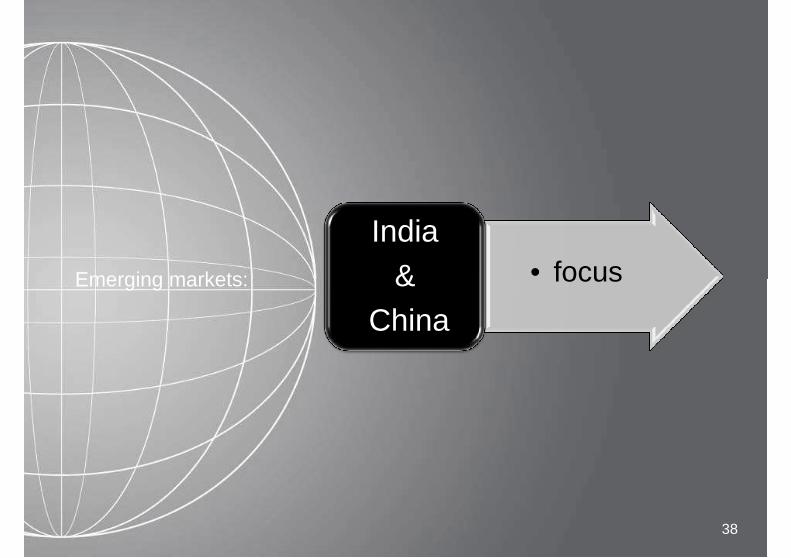
Emerging markets: • focusIndia
&
3838
Emerging markets: • focus&China
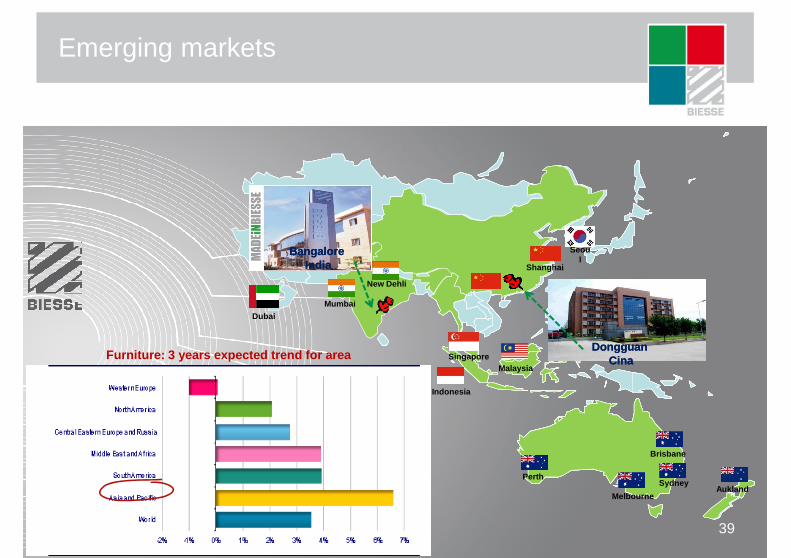
Emerging markets
Shanghai
New Dehli
BangaloreBangaloreIndiaIndia
Seoul
3939
New Dehli
Mumbai
Singapore
Indonesia
Malaysia
Perth
Melbourne
Sydney
Brisbane
Aukland
Furniture: 3 years expected trend for areaDongguanDongguan
CinaCina
Dubai

Emerging markets
Target ClientiTarget Clienti
System
Target ProdottiTarget Prodotti
Three bands strategy:
Three bands strategyThree bands strategy Italian designLocal production
40
Celle
Stand Alone – Hi-Tech
Stand Alone - Standard tech
Entry Level
ArtisanArtisan
Middle Middle sizesize
High quality & DesignHigh quality & Design
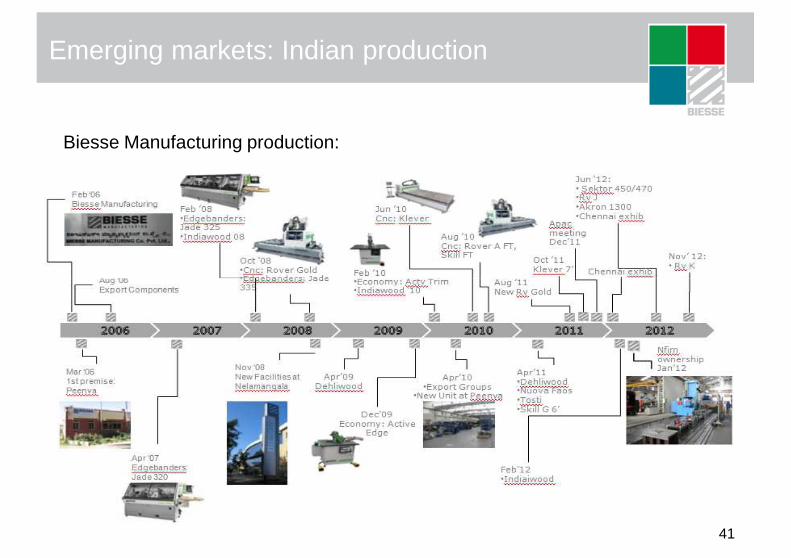
Emerging markets: Indian production
Biesse Manufacturing production:
41
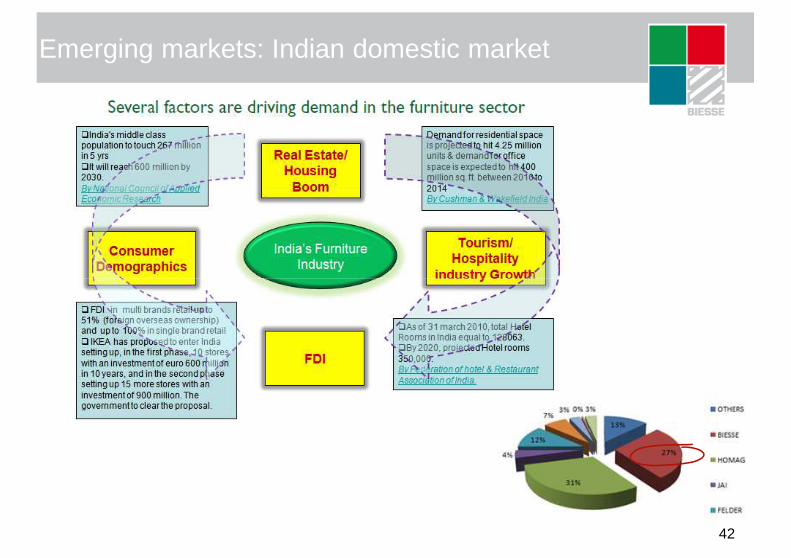
Emerging markets: Indian domestic market
42
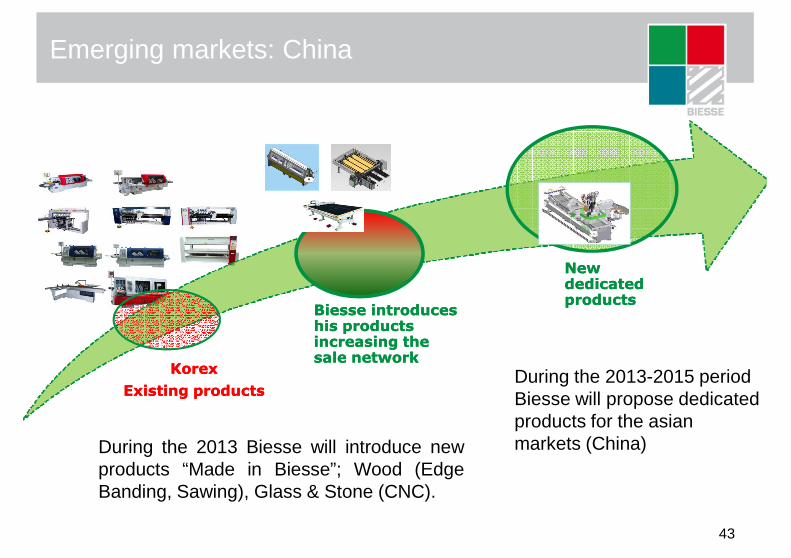
Emerging markets: China
New New dedicateddedicated
43
KorexKorex
ExistingExisting productsproducts
BiesseBiesse introducesintroduceshishis productsproductsincreasingincreasing the the sale networksale network
dedicateddedicatedproductsproducts
During the 2013 Biesse will introduce newproducts “Made in Biesse”; Wood (EdgeBanding, Sawing), Glass & Stone (CNC).
During the 2013-2015 periodBiesse will propose dedicatedproducts for the asianmarkets (China)
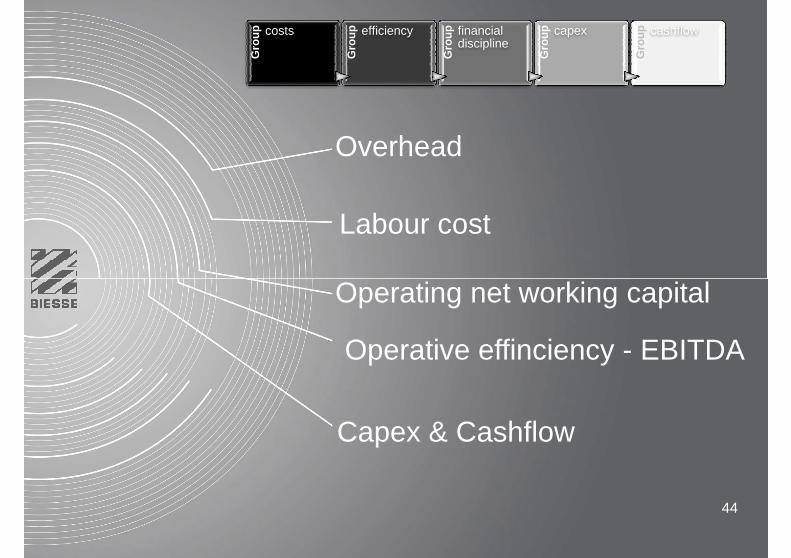
Labour cost
Operating net working capital
Overhead
Gro
up costs
Gro
up efficiency
Gro
up financialdiscipline
Gro
up capex
Gro
up cashflow
44
44
Operating net working capital
Operative effinciency - EBITDA
Capex & Cashflow
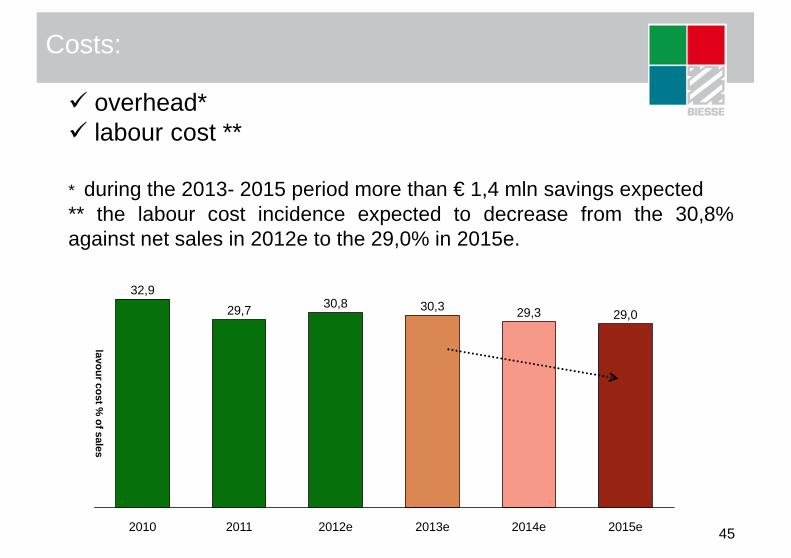
Costs:
� overhead*� labour cost **
* during the 2013- 2015 period more than € 1,4 mln savings expected** the labour cost incidence expected to decrease from the 30,8%against net sales in 2012e to the 29,0% in 2015e.
452015e
lavour cost % of sales
32,9
29,3
2013e
30,3
2012e
30,8
2011
29,7
2010
29,0
2014e
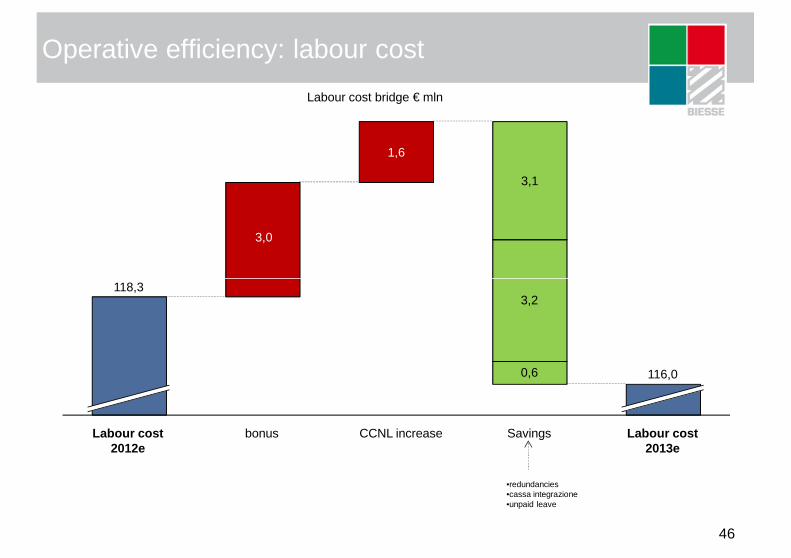
Operative efficiency: labour cost
3,0
1,6
3,1
Labour cost bridge € mln
46
Labour cost 2013e
116,0
Savings
0,6
3,2
CCNL increasebonusLabour cost 2012e
118,3
•redundancies•cassa integrazione•unpaid leave
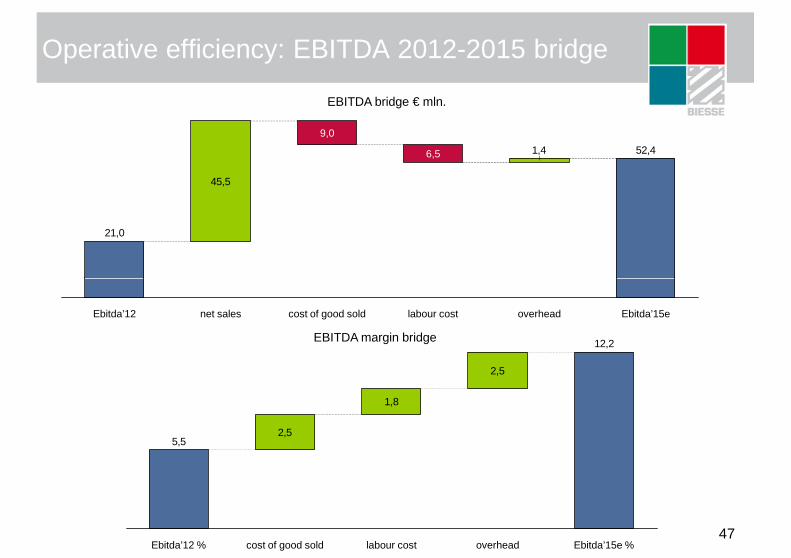
Operative efficiency: EBITDA 2012-2015 bridge
45,5
52,41,4
21,0
6,5
9,0
EBITDA bridge € mln.
47
Ebitda’15eoverheadlabour costcost of good soldnet salesEbitda’12
2,5
1,8
2,5
12,2
5,5
Ebitda’15e %overheadlabour costcost of good soldEbitda’12 %
EBITDA margin bridge
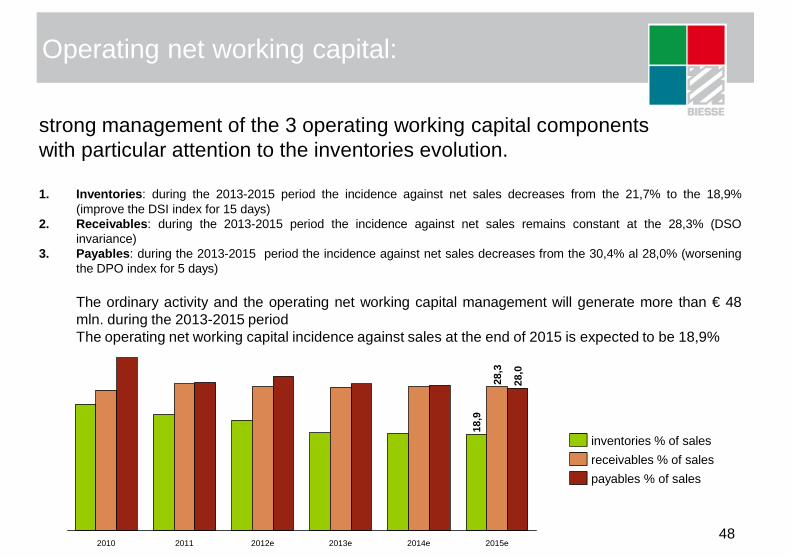
Operating net working capital:
strong management of the 3 operating working capital componentswith particular attention to the inventories evolution.
1. Inventories : during the 2013-2015 period the incidence against net sales decreases from the 21,7% to the 18,9%(improve the DSI index for 15 days)
2. Receivables : during the 2013-2015 period the incidence against net sales remains constant at the 28,3% (DSOinvariance)
3. Payables : during the 2013-2015 period the incidence against net sales decreases from the 30,4% al 28,0% (worseningthe DPO index for 5 days)
48
The ordinary activity and the operating net working capital management will generate more than € 48mln. during the 2013-2015 periodThe operating net working capital incidence against sales at the end of 2015 is expected to be 18,9%
2014e
28,0
28,3
18,9
2013e 2015e2012e20112010
receivables % of sales
payables % of sales
inventories % of sales

Capex
3,2
4,9
3,93,8
2,8
10
15
20
2,5
3,0
3,5
4,0
4,5
5,0
3,2€ %
49
0
5
0,0
0,5
1,0
1,5
2,0
2010 2015e2014e2013e2012e2011
total capex
capex % of sales
excluding the chinese acquisition, the total capex includesthe R&D capex and the maintenence capex only
P & N details
Net sales
Consolidated results
Three Years Plan
2013 - 2015
50
50
EBITDA & EBIT
Cashflow & operating net workingcapital
Net debt
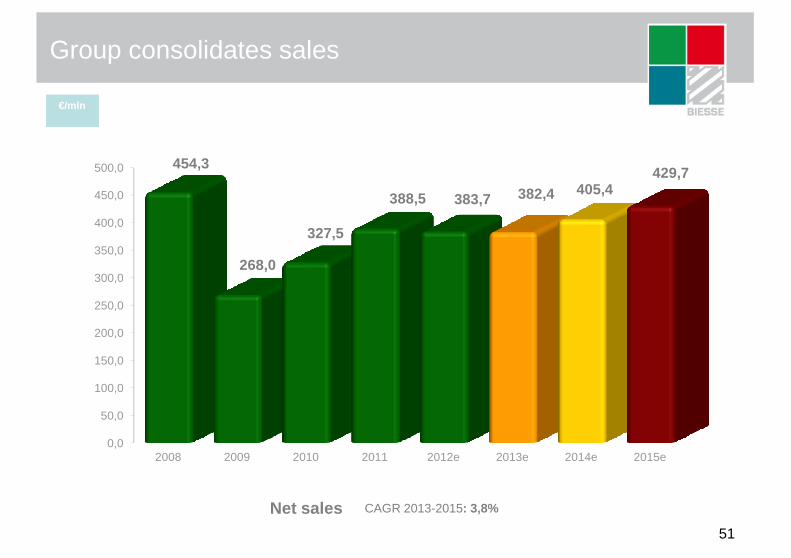
Group consolidates sales
€/mln
300,0
350,0
400,0
450,0
500,0 454,3
268,0
327,5
388,5 383,7 382,4 405,4429,7
51
Net sales
0,0
50,0
100,0
150,0
200,0
250,0
300,0
2008 2009 2010 2011 2012e 2013e 2014e 2015e
CAGR 2013-2015: 3,8%
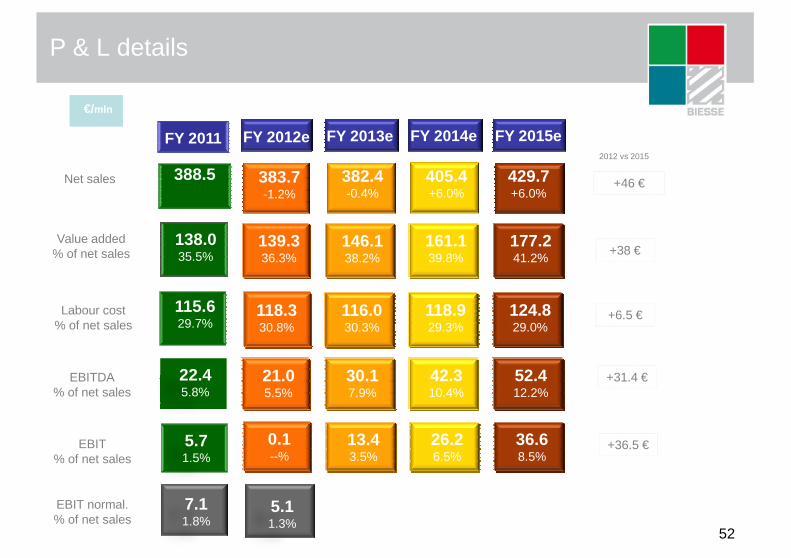
P & L details
€/mln
Net sales
Value added% of net sales
52.8
139.336.3%
146.138.2%
69.4
161.139.8%
FY 2012e FY 2013e FY 2014e FY 2015e
429.7+6.0%
177.241.2%
2012 vs 2015
+46 €383.7-1.2%
382.4-0.4%
405.4+6.0%
+38 €138.035.5%
FY 2011
327.5+22.2%
388.5
52
Labour cost% of net sales
EBIT% of net sales
EBITDA% of net sales
118.330.8%
0.1--%
21.05.5%
116.030.3%
13.43.5%
30.17.9%
118.929.3%
26.26.5%
42.310.4%
124.829.0%
36.68.5%
52.412.2%
+6.5 €
+31.4 €
+36.5 €
115.629.7%
5.71.5%
22.45.8%
EBIT normal.% of net sales
7.11.8%
5.11.3%
37,0%
31,5%
37,7%35,5% 36,3%
38,2%39,8%
41,2%
25,0%
35,0%
45,0%
140,0
190,0
Consolidated value added
€/MIL
53
-5,0%
5,0%
15,0%
25,0%
-10,0
40,0
90,0
140,0
2008 2009 2010 2011 2012e 2013e 2014e 2015e
value added incidence against net sales
24,5%
34,6%
32,9%
29,7%30,8% 30,3%
29,3% 29,0%
20,0%
30,0%
100,0
120,0
140,0
Consolidated labour cost
€/MIL
54
0,0%
10,0%
0,0
20,0
40,0
60,0
80,0
2008 2009 2010 2011 2012e 2013e 2014e 2015e
labour cost incidence against net sales

12,5%
7,9%
10,4%
12,2%
9,0%
11,0%
13,0%
15,0%
40,0
50,0
60,0
EBITDA
€/MIL
55
-3,1%
4,8%
5,8%5,5%
-5,0%
-3,0%
-1,0%
1,0%
3,0%
5,0%
7,0%
-10,0
0,0
10,0
20,0
30,0
2008 2009 2010 2011 2012e 2013e 2014e 2015e
EBITDA EBITDA margin
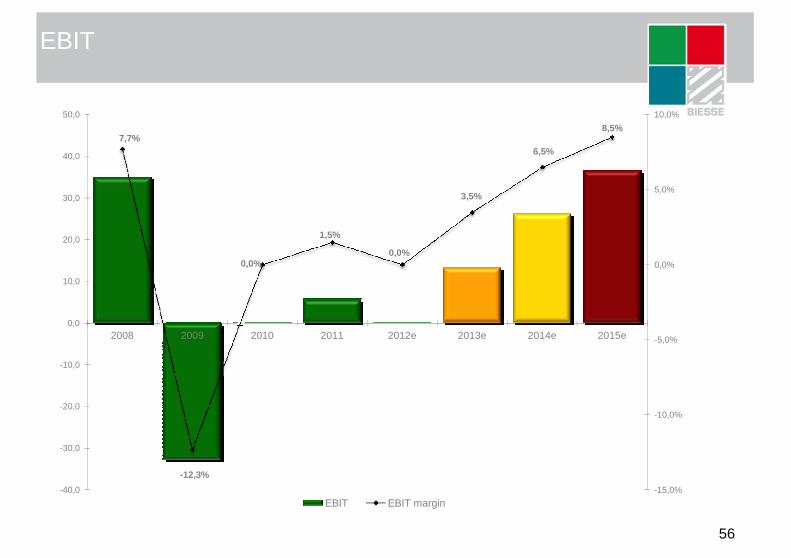
EBIT
€/MIL
7,7%
0,0%
1,5%
0,0%
3,5%
6,5%
8,5%
0,0%
5,0%
10,0%
10,0
20,0
30,0
40,0
50,0
56
-12,3%
-15,0%
-10,0%
-5,0%
-40,0
-30,0
-20,0
-10,0
0,0
10,0
2008 2009 2010 2011 2012e 2013e 2014e 2015e
EBIT EBIT margin
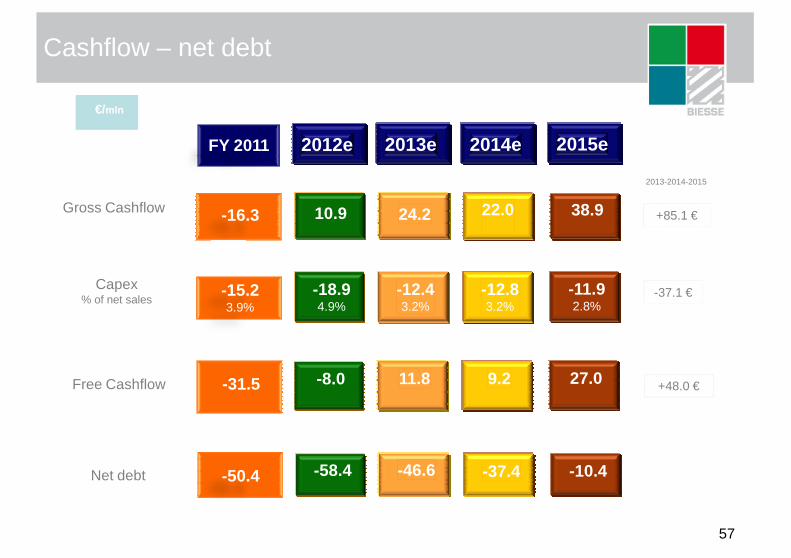
Cashflow – net debt
€/mln
2012e 2013e 2014e
22.0
2013-2014-2015
10.9 24.2 +85.1 €
2015e
38.9Gross Cashflow
Capex
FY 2011
-16.3
57
-8.0
-58.4
11.8
-46.6
-18.94.9%
-12.43.2%
-12.83.2%
9.2
-37.4
-37.1 €
+48.0 €
-11.92.8%
27.0
-10.4
Capex% of net sales
Free Cashflow
Net debt
-31.5
-50.4
-15.23.9%
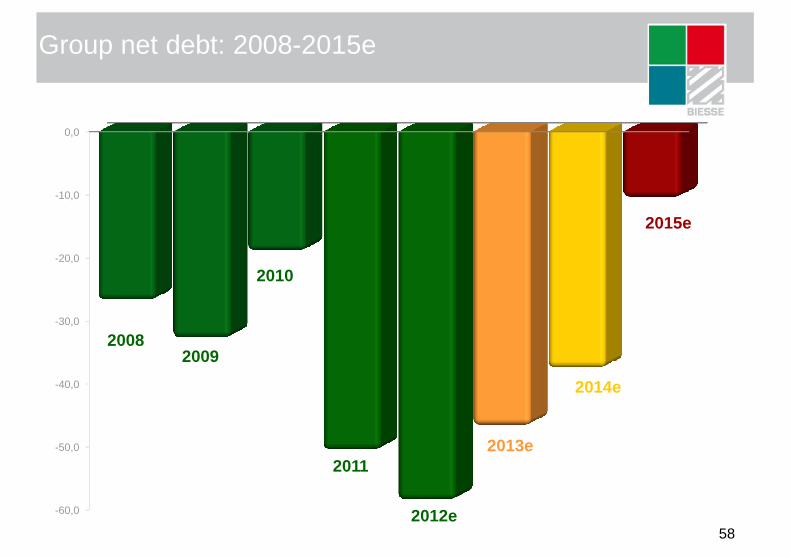
Group net debt: 2008-2015e
-20,0
-10,0
0,0
2015e
2010
58
-60,0
-50,0
-40,0
-30,0
20082009
2013e2011
2014e
2010
2012e

ratios
2011 2012e 2013e 2014e 2015e
Net Debt /Equity
Net Debt /EBITDA
0.42x
1.95x2.25x
0.52x
2.78x
0.49x
1.94x
0.45x
1.38x
0.36x
1.11x
59
R.O.E.before taxes
2.0% -4.1% 7.7% 17.2% 20.7%
Net result/Operatingnet working capital
-2.9% -11.0% 7.6% 16.8% 37.3%
EVA spread (ROCE – WACC)
-6.6% -8.6% -3.1% 1.9% 4.6%
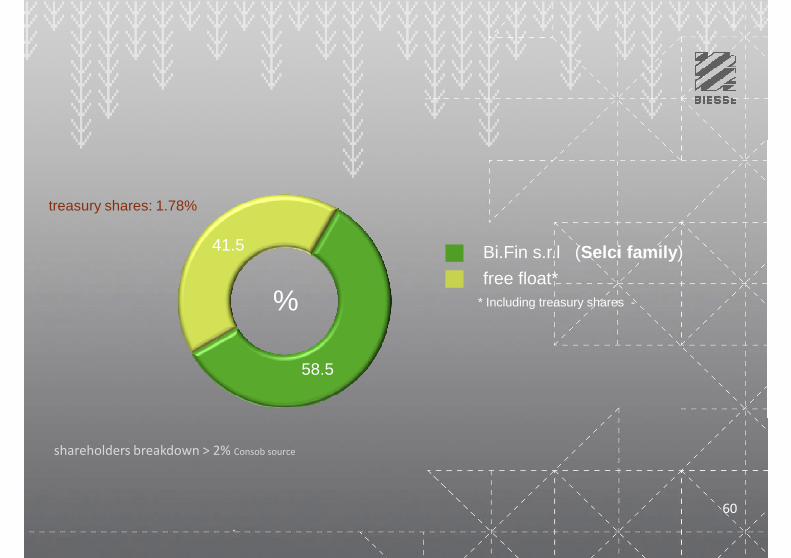
41.5 Bi.Fin s.r.l (Selci family )
free float*
treasury shares: 1.78%
60
58.5
%free float*
* Including treasury shares -
shareholders breakdown > 2% Consob source
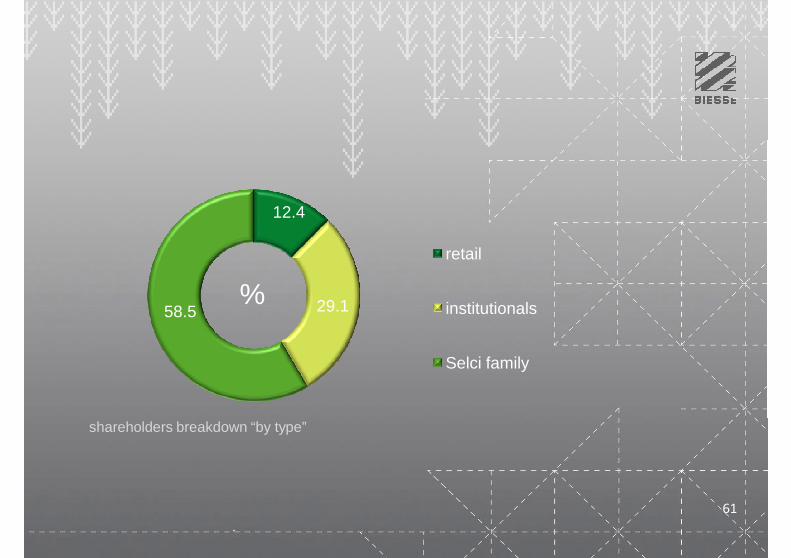
12.4
retail
%
shareholders breakdown “by type”
61
29.158.5 institutionals
Selci family
%
Alberto AmurriGroup Financial Manager
&
Head of Investor Relations Dept.Via Della Meccanica 16
61122 Pesaro
ITALY
http://www.biesse.com/Corporate/en/InvestorRelations.cms
Tel: +39 0721 439107 / Mob: +39 335 1219556
e-mail: [email protected]
62