Presentation to Oregon Board of Agriculture: 2018- 2019 ...
17
May 19, 2021 Hilary Foote Farm Forest Specialist Presentation to Oregon Board of Agriculture: 2018- 2019 Farm Forest Land Use Report
Transcript of Presentation to Oregon Board of Agriculture: 2018- 2019 ...

May 19, 2021
Hilary FooteFarm Forest Specialist
Presentation to Oregon Board of Agriculture: 2018-2019 Farm Forest Land Use Report

Goal 3 To preserve and maintain agricultural lands.

ORS 197.065: LCDC must submit a biennial report to the Legislature:• “analyzing applications
approved and denied” for certain land uses in exclusive farm use and forest zones, and
• “such other matters pertaining to protection of agricultural or forest land as the commission deems appropriate.”
The report must be submitted prior to the start of the legislative session
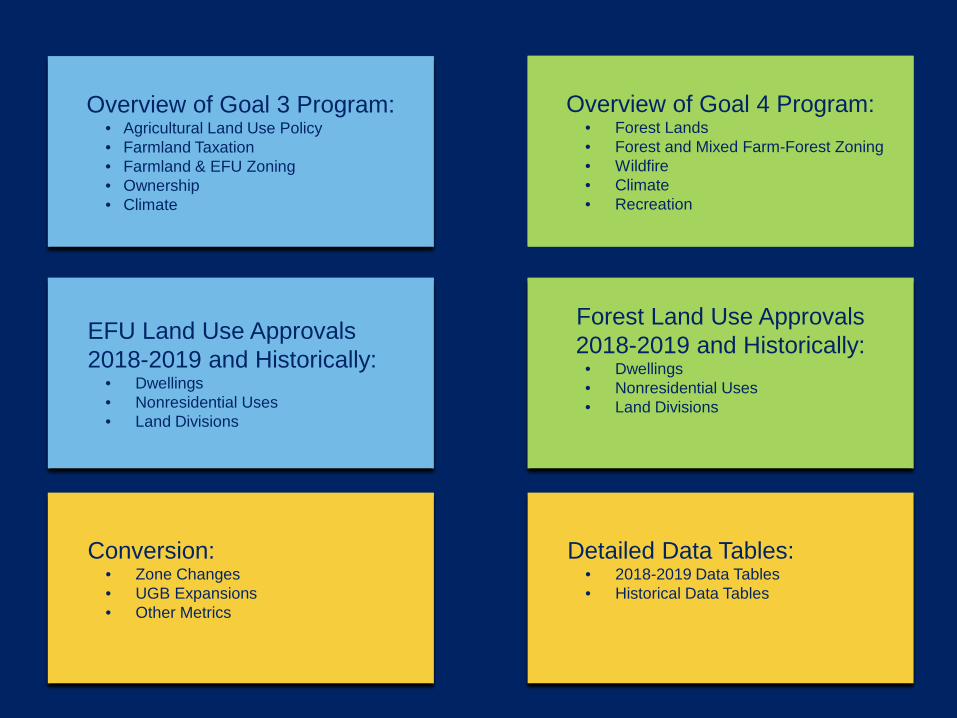
Overview of Goal 3 Program:• Agricultural Land Use Policy• Farmland Taxation• Farmland & EFU Zoning• Ownership• Climate
Overview of Goal 4 Program:• Forest Lands• Forest and Mixed Farm-Forest Zoning• Wildfire• Climate• Recreation
EFU Land Use Approvals 2018-2019 and Historically:
• Dwellings• Nonresidential Uses• Land Divisions
Forest Land Use Approvals 2018-2019 and Historically:
• Dwellings• Nonresidential Uses• Land Divisions
Conversion:• Zone Changes• UGB Expansions• Other Metrics
Detailed Data Tables:• 2018-2019 Data Tables• Historical Data Tables
Overview of Goal 3 Program:• Agricultural Land Use Policy• Farmland Taxation• Farmland & EFU Zoning• Ownership• Climate
Overview of Goal 4 Program:• Forest Lands• Forest and Mixed Farm-Forest Zoning• Wildfire• Climate• Recreation
EFU Land Use Approvals 2018-2019 and Historically:
• Dwellings• Nonresidential Uses• Land Divisions
Forest Land Use Approvals 2018-2019 and Historically:
• Dwellings• Nonresidential Uses• Land Divisions
Conversion:• Zone Changes• UGB Expansions• Other Metrics

DLCD Climate Actions 2021-2022
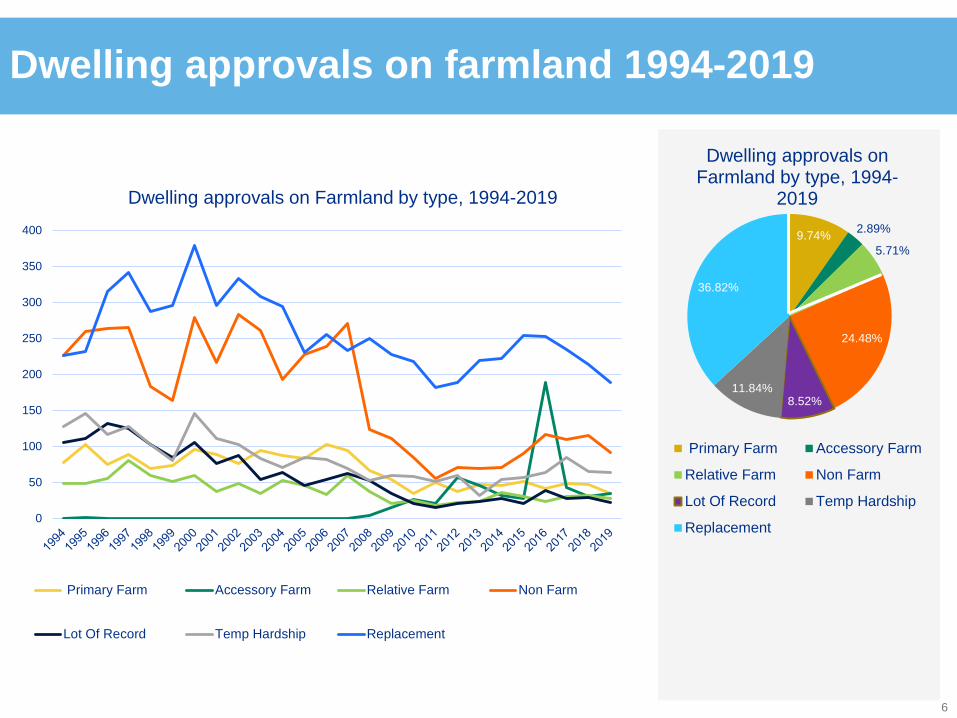
Dwelling approvals on farmland 1994-2019
6
0
50
100
150
200
250
300
350
400
Primary Farm Accessory Farm Relative Farm Non Farm
Lot Of Record Temp Hardship Replacement
Dwelling approvals on Farmland by type, 1994-2019
9.74% 2.89%
5.71%
24.48%
8.52%11.84%
36.82%
Dwelling approvals on Farmland by type, 1994-
2019
Primary Farm Accessory Farm
Relative Farm Non Farm
Lot Of Record Temp Hardship
Replacement

Dwelling approvals on farmland by county 1994-2019
7
0
500
1000
1500
2000
2500
Replacement Temp Hardship Lot Of Record Non Farm Relative Farm Accessory Farm Primary Farm
Dwelling approvals on farmland, all types, by county, 1994-2019

Soils Challenges
8
• In 2010 House Bill 3647 required DLCD completenessreview of soil assessments prepared by privateconsultants used in a land use proceeding.
• Typically used to support a nonfarm dwelling approval byre-classifying a portion of a property to a lower soilscapability class.
• 2012-2019 DLCD averaged 14 soils report a year forreview. 34 reviews were processed in 2020. 12 receivedto date in 2021.
• Over 40% of the requests received have been forproperties in Douglas County, which is consistent withthe higher number of nonfarm dwelling reviews in thatcounty.
05
10152025303540
12 13 14 15 16 17 18 19 20
County Reviews PercentDouglas 58 41%Jackson 20 14%Deschutes 14 10%Lane 12 9%Linn 11 8%Josephine 7 5%Marion 5 4%Wasco 3 2%Washington 3 2%Yamhill 3 2%Jefferson 2 1%Tillamook 2 1%Polk 1 1%

Use approvals on farmland: Top 5 Uses
9
0
20
40
60
80
100
120
140
160
180
2009 2010 2011 2012 2013 2014 2015 2016 2017 2018 2019
Top 5 Use Approvals 2009-2019
Home Occupation Commercial activities with farm use
Processing Solar power generating facility
Communication facilities
51%
14%
9%
14%
11%
1%
2018-2019 Selected Use Approvals
OtherHome OccupationCommercial activities with farm useProcessingSolar power generating facilityCommunication facilities
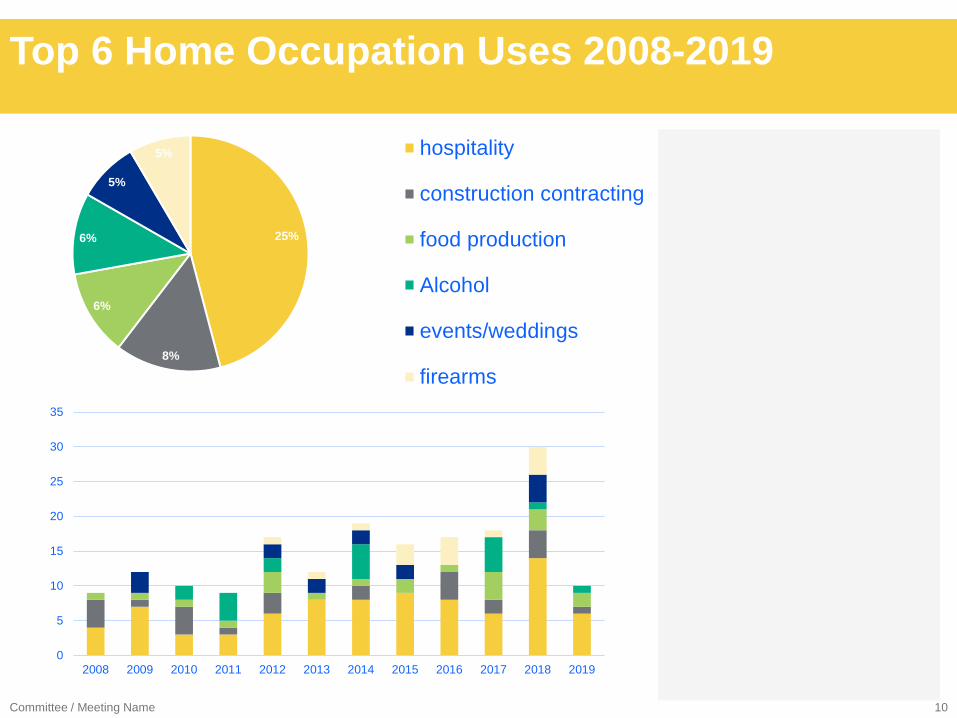
Top 6 Home Occupation Uses 2008-2019
Committee / Meeting Name 10
25%
8%
6%
6%
5%
5% hospitality
construction contracting
food production
Alcohol
events/weddings
firearms
0
5
10
15
20
25
30
35
2008 2009 2010 2011 2012 2013 2014 2015 2016 2017 2018 2019

Use approvals on farmland: Hemp & MJ
11
51%
14%
9%
14%
11%
1%
2018-2019 Selected Use Approvals
OtherHome OccupationCommercial activities with farm useProcessingSolar power generating facilityCommunication facilities
39%
4%4%
8%
25%
6%
2% 8%
4%
CACFU approvals 2018-2019, by sub type
alcohol equipment
feed fertilizer
hemp processing marijuana processing
milk other
seed
1%
12%
31%56%
Processing approvals 2018-2019, by subtype
cider processing
farm crop processing
Hemp processing
Marijuana and Hemp Processing Facilities 15% of all use approvals for Biennium

Use approvals on farmland: Renewable Energy
12
0
10
20
30
40
50
60
2008 2009 2010 2011 2012 2013 2014 2015 2016 2017 2018 2019
County Renewable Energy Approvals on EFU, by year, 2008-2019
Geothermal Solar Wind
Since 2008, 179 renewable energy facilities were permitted at the local level over 63,000 acres and 24 renewable energy facilities on 2,900 additional acres requiring a local Goal 3 exception.

Use approvals on farmland: ODOE EFSC
13
Since 2008, EFSC has issued nine Site Certificate approvals for solar and wind power projects involving Goal 3 exceptions under the Department of Energy’s Goal 3 exception process.
As of November 2020, EFSC currently has an additional six solar projects under review requiring Goal 3 exceptions.
ORS 469.504(2)The council may find goal compliance for a facility that does not otherwise comply with one or more statewide planning goals by taking an exception to the applicable goal. Notwithstanding the requirements of ORS 197.732 (Goal exceptions), the statewide planning goal pertaining to the exception process or any rules of the Land Conservation and Development Commission pertaining to an exception process goal, the council may take an exception to a goal if the council finds:…(c)The following standards are met:
(A)Reasons justify why the state policy embodied in the applicable goal should not apply;(B)The significant environmental, economic, social and energy consequences anticipated as a result of the proposed facility have been identified and adverse impacts will be mitigated in accordance with rules of the council applicable to the siting of the proposed facility; and(C)The proposed facility is compatible with other adjacent uses or will be made compatible through measures designed to reduce adverse impacts.

Agri-Tourism Approvals 2008-2019
USDA reports $16M in 2017 revenue from Oregon agri-tourism and recreational services.
This represents a 51% increase over 2012 revenues ($10.6M)0
10
20
30
40
50
60
70
80
2008 2009 2010 2011 2012 2013 2014 2015 2016 2017 2018 2019
Events Farm StandGuest ranch Bed & BreakfastWinery, Cidery, Tasting Room

Farmland zone changes and UGB expansions
DLCD KPIs:
99.8% of land zoned EFU in 1987 was still zoned EFU in 2019.
37% of land added to UGBs since 1987 has been zoned EFU.
15
Percent land retained in farm use, by county, 1997-2017 (USDA 2017)
2017 2007 1997 1987USDA NASS Acres in
Farm Use 15,962,322 16,399,647 17,658,213 17,809,165
DLCD EFU Zoning Acres 16,077,028 16,097,640 16,104,926 16,112,212
AFT ‘State of the States’ estimates 65,800 acres lost 2001-2016:
20,500 acres Nationally significant ag land
43,800 acres Other ag land
32,800 acres urban high density development
33,000 acres low density residential development

16
Forest & Mixed Farm-Forest zone changes and UGB expansions
DLCD KPIs:
11.8 M acres zoned forest &mixed farm-forest in 2019
• 99.9% of land zoned Forestin 1987 was still zonedForest in 2019.
• 8% of land added to UGBssince 1987 has been zonedForest or Mixed Farm-Forest.
Non-Federal Land remaining in forest, farm, and range use, 1974-2018 (ODF 2021)

Hilary Foote, Farm and Forest Lands [email protected] / 971-301-1849
Thank you!
View the Farm and Forest Report on our website at:https://www.oregon.gov/lcd/Publications/2018-2019_Farm_Forest_Report.pdf