Presentation to Governor Mapp - St. Thomas Source
65
Virgin Islands Water and Power Authority Presentation to Governor Mapp January 21, 2015
Transcript of Presentation to Governor Mapp - St. Thomas Source

Virgin Islands Water and Power Authority
Presentation to Governor Mapp
January 21, 2015

1Virgin Islands Water and Power Authority
Table of Contents
1 Overview of the Water and Power Authority
2 Strategic Partnerships & Other Developments
3 Impact of HOVENSA Refinery Closure
4 Key Capital Projects
5 Alternative Energy Initiatives & Updates
6 Financial Review
7 Summary of Outstanding Debt and Credit Ratings
8 Forward Outlook
Section 1
Overview of the Water and Power Authority

3Virgin Islands Water and Power Authority
General
● The Virgin Islands Water and Power Authority (the “Authority” or “WAPA”) was created in 1964 as an instrumentality of theGovernment of the U.S. Virgin Islands (USVI) for the purpose of developing an adequate electric and water supply system forthe Virgin Islands.
● The Authority owns, operates and maintains electric generation, transmission, distribution and general plant facilities thatprovide electric power to nearly 55,000 customers on St. Thomas, St. Croix, St. John, Water Island and Hassel Island.
‒ Except for a few commercial entities that produce electricity for their own use, the Authority is the only electric utilityserving the Virgin Islands.
● The Authority also operates and maintains a system to produce and supply potable water to over 12,000 customers in theUSVI, through reverse osmosis, a system of wells and desalination facilities. The Authority also purchases water, pursuant to awater purchase contract, for retail distribution.
‒ The Water System is accounted for and financed separately from the Electric System, although certain common facilitiesand costs necessary for the production of electricity and water, as well as for general administration, are shared by thetwo systems and allocated between them.
Governance
● The Authority is administered by a Governing Board of nine (9) members appointed by the Governor of the Virgin Islands, six(6) of whom require the consent of the USVI Legislature.
● Management of the Authority is vested in an Executive Director and senior management team. Hugo V. Hodge Jr. wasappointed Executive Director in January 2008.
Regulation
● The Authority’s electric and water rates and charges are regulated by the Virgin Islands Public Services Commission (“PSC”).
● The PSC is comprised of seven (7) members appointed by the Governor and confirmed by the Legislature.
The Authority – Overview
4Virgin Islands Water and Power Authority
The Authority – Senior Management Team
Hugo V. Hodge, Jr., Executive Director and Chief Executive Officer● Joined the Authority in January 2008 after serving as the Director of Griffin Power in Georgia where he was
responsible for strategic planning● Former board member of Electric Cities of Georgia● Experienced in alternative sources of generation
Julio A. Rhymer, Chief Financial Officer● Joined the Authority as CFO in July 2012● Former CFO of the Virgin Islands Housing Finance Authority and former Director of Business and Financial
Management at the Office of the Lt. Governor and the 25th Legislature of the Virgin Islands● 6 years of auditing experience
Gregory L. Rhymer, Chief Operating Officer● Direct oversight of Directors for Plant Production, Water Distribution and Corporate Services, Environmental Affairs
& Facilities Security● Over 25 years of service to the Authority including serving as Coordinator of Environmental Affairs, Manager of
Environmental Affairs, Director of System Planning and Environmental Affairs,● Prior experience includes oversight duties of the Virgin Islands environmental programs for the Virgin Islands
Department of Planning and Natural ResourcesClinton Hedrington, Director of Transmission and Distribution
● Over 14 years of service to the Authority including serving as Electrical Engineer I, II and III and System PlanningManager.
Lorelei M. Farrington, General Counsel● General Counsel and Officer in charge of the Authority’s legal division since February 2009.● Over 27 years of service as in-house counsel for other USVI governmental instrumentalities.
5Virgin Islands Water and Power Authority
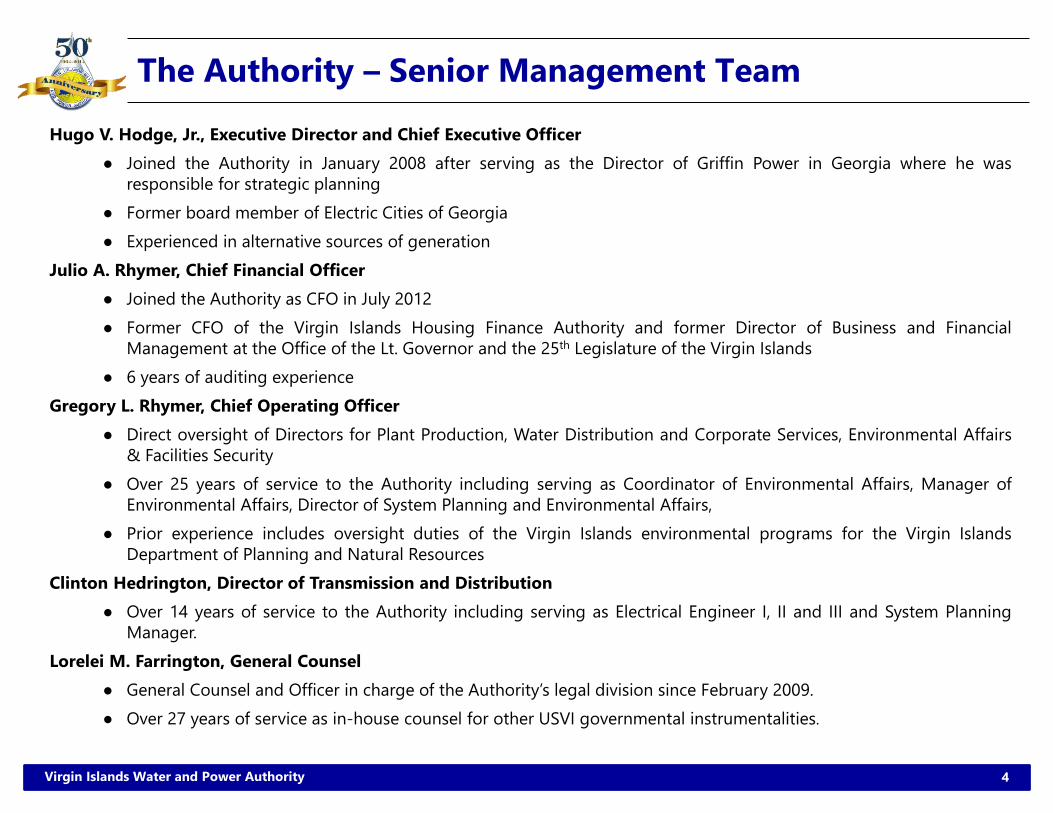
The Authority – Organizational Chart

6Virgin Islands Water and Power Authority
The Authority – Governing Board
Governmental Appointees
• To be determined
St. Thomas / St. John District
Juanita R. Young (Vice-Chairperson and Chair of Financeand Audit Committee)
– Appointed April 17, 2007 (Reconfirmed 2014)
Donald Francois, P.E.
– Appointed April 17, 2007 (Reconfirmed 2014)
Cheryl Boynes-Jackson
– Appointed March 10, 2004 (Reconfirmed 2014)
St. Croix District
Gerald Groner, Esq. (Chairperson)
– Appointed April 21, 2008 (Reconfirmed 2014)
Noel Loftus (Secretary)
– Appointed April 17, 2007 (Reconfirmed 2014)
Elizabeth A. Armstrong
– Appointed April 11, 2013
Note: A Governing Board member whose term has expired may continue to serve until his or her successor is confirmed.
7Virgin Islands Water and Power Authority
Electric System Service Area and Facilities
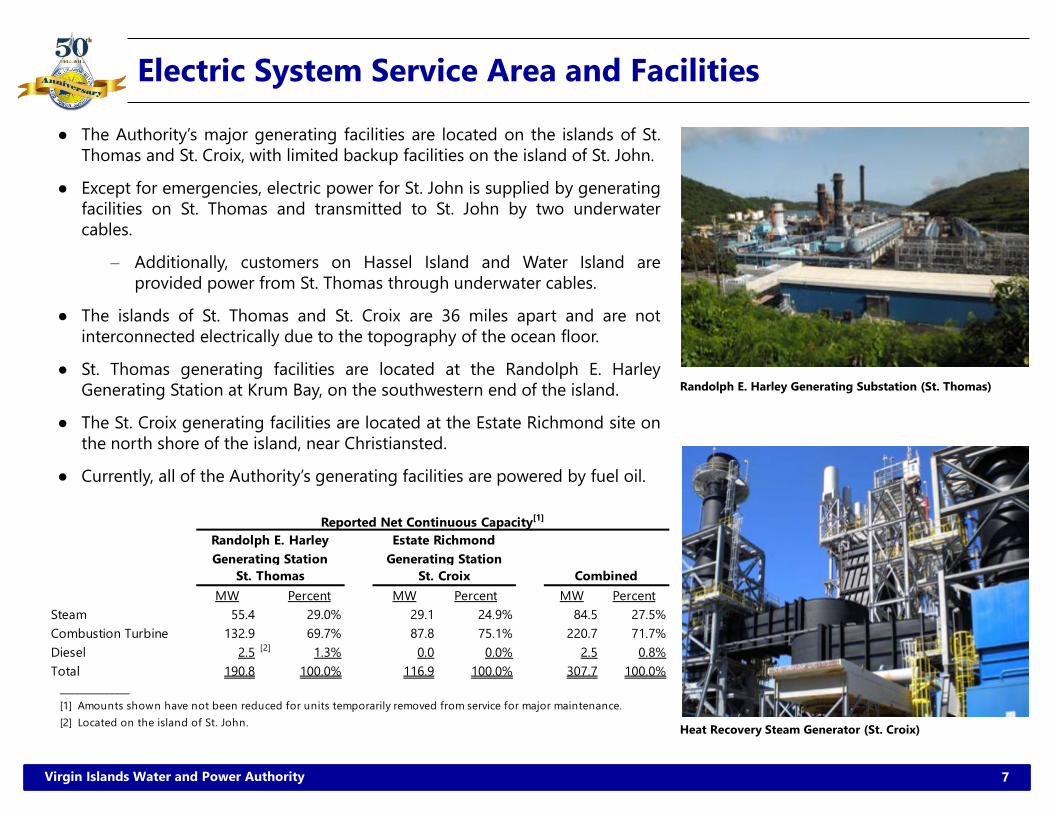
● The Authority’s major generating facilities are located on the islands of St.Thomas and St. Croix, with limited backup facilities on the island of St. John.
● Except for emergencies, electric power for St. John is supplied by generatingfacilities on St. Thomas and transmitted to St. John by two underwatercables.
– Additionally, customers on Hassel Island and Water Island areprovided power from St. Thomas through underwater cables.
● The islands of St. Thomas and St. Croix are 36 miles apart and are notinterconnected electrically due to the topography of the ocean floor.
● St. Thomas generating facilities are located at the Randolph E. HarleyGenerating Station at Krum Bay, on the southwestern end of the island.
● The St. Croix generating facilities are located at the Estate Richmond site onthe north shore of the island, near Christiansted.
● Currently, all of the Authority’s generating facilities are powered by fuel oil.
MW Percent MW Percent MW PercentSteam 55.4 29.0% 29.1 24.9% 84.5 27.5%Combustion Turbine 132.9 69.7% 87.8 75.1% 220.7 71.7%Diesel 2.5 [2] 1.3% 0.0 0.0% 2.5 0.8%Total 190.8 100.0% 116.9 100.0% 307.7 100.0%
Reported Net Continuous Capacity[1]
Randolph E. HarleyGenerating Station
St. Thomas
Estate Richmond Generating Station
St. Croix Combined
______________[1] Amounts shown have not been reduced for units temporarily removed from service for major maintenance.[2] Located on the island of St. John.
Randolph E. Harley Generating Substation (St. Thomas)
Heat Recovery Steam Generator (St. Croix)
8Virgin Islands Water and Power Authority
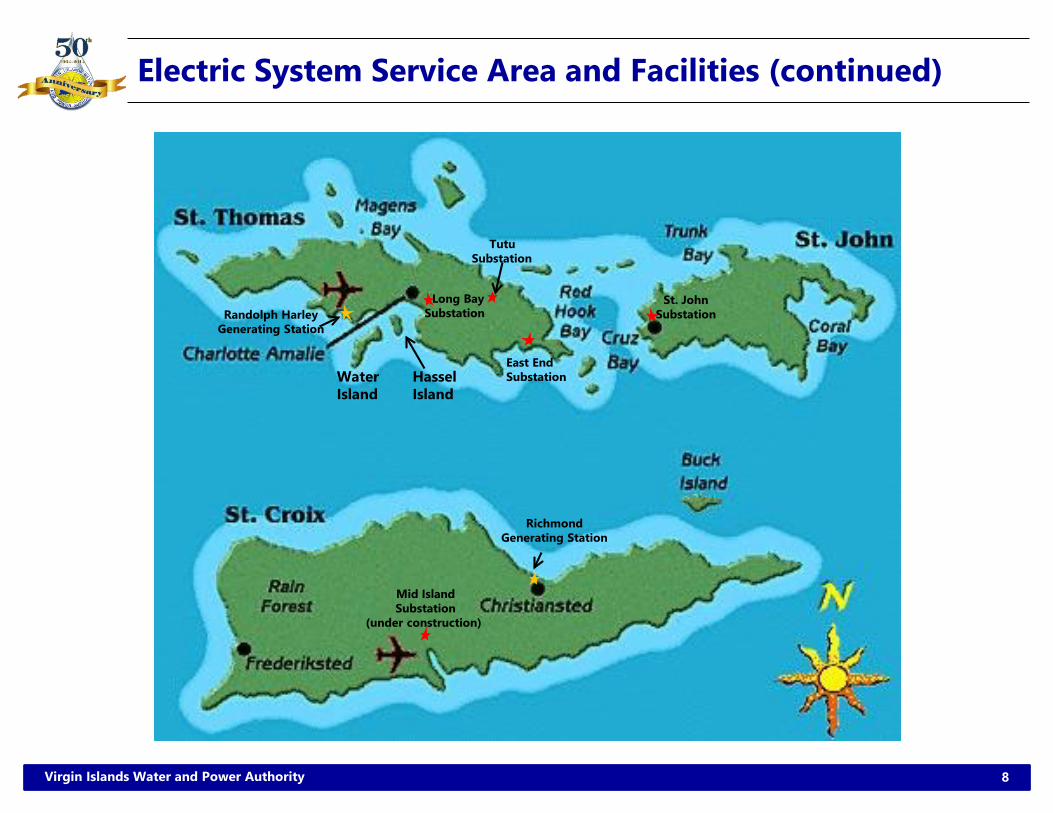
Electric System Service Area and Facilities (continued)
East End Substation
TutuSubstation
Long BaySubstationRandolph Harley
Generating Station
St. JohnSubstation
RichmondGenerating Station
Mid IslandSubstation
(under construction)
Water Island
Hassel Island
9Virgin Islands Water and Power Authority
Comparison of other Caribbean Islands
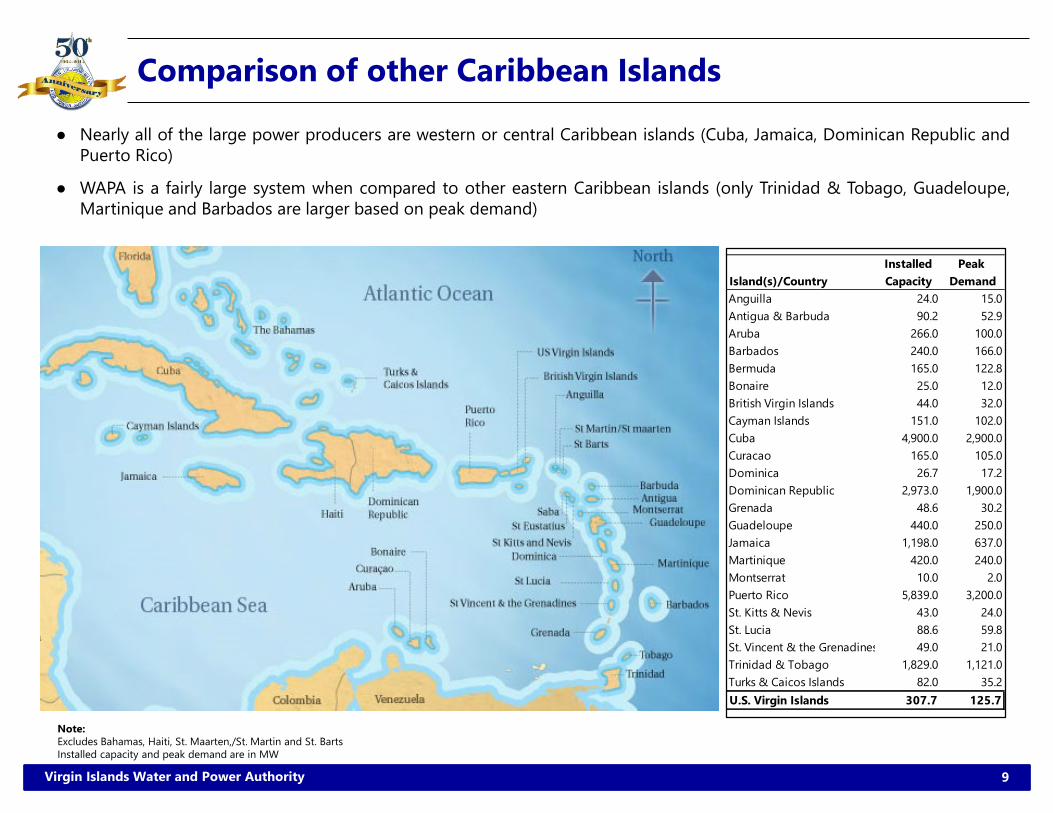
● Nearly all of the large power producers are western or central Caribbean islands (Cuba, Jamaica, Dominican Republic andPuerto Rico)
● WAPA is a fairly large system when compared to other eastern Caribbean islands (only Trinidad & Tobago, Guadeloupe,Martinique and Barbados are larger based on peak demand)
Note:Excludes Bahamas, Haiti, St. Maarten,/St. Martin and St. BartsInstalled capacity and peak demand are in MW
Installed Peak Island(s)/Country Capacity DemandAnguilla 24.0 15.0Antigua & Barbuda 90.2 52.9Aruba 266.0 100.0Barbados 240.0 166.0Bermuda 165.0 122.8Bonaire 25.0 12.0British Virgin Islands 44.0 32.0Cayman Islands 151.0 102.0Cuba 4,900.0 2,900.0Curacao 165.0 105.0Dominica 26.7 17.2Dominican Republic 2,973.0 1,900.0Grenada 48.6 30.2Guadeloupe 440.0 250.0Jamaica 1,198.0 637.0Martinique 420.0 240.0Montserrat 10.0 2.0Puerto Rico 5,839.0 3,200.0St. Kitts & Nevis 43.0 24.0St. Lucia 88.6 59.8St. Vincent & the Grenadines 49.0 21.0Trinidad & Tobago 1,829.0 1,121.0Turks & Caicos Islands 82.0 35.2U.S. Virgin Islands 307.7 125.7
10Virgin Islands Water and Power Authority
Overview of the Water System
● The Water system has over 12,000 customers with an average demand of nearly 2 million gallons of water per day (mgd)per district
● In April 2012, the Authority signed a 20-year agreement with Seven Seas Water Corporation to build, own and operate aseawater reverse osmosis plant (SWRO) on St. Thomas and St. Croix.
– Water is produced through reverse osmosis (RO) with the capability to provide approximately 3.3 mgd for eachdistrict (St. Thomas/St. John and St. Croix).
– Additionally, the switch to reverse osmosis for water production has decreased costs by 55%
● Because of the historical development of the Water System and certain characteristics unique to the U.S. Virgin Islands,the Water System serves only a small portion of the potential customers in the U.S. Virgin Islands.
– Until recently, the USVI building code required all new residential and commercial buildings have cisterns toaccumulate rainwater. Currently, new construction within the Water System no longer requires cisterns.
– The mountainous, rocky terrain, especially on the islands of St. Thomas and St. John, has made construction of thewater distribution system difficult and costly.
● The Water System’s rates are also under the jurisdiction of the Virgin Islands PSC, unlike many other municipal systems.
● The Electric System and Water System share certain costs of the Authority, which costs the Electric System pays and seeksreimbursement from the Water System.
– Expenses reimbursable to the Electric System are $8.9 million through the end of fiscal year 2014.
– Base rate increases approved by the PSC are expected to provide an additional $1.6 million annually to assist thewater system to meet Debt Service Coverage and basic operating cost.
– Allowed more efficient use of electric system generation facilities since steam production is no longer required toproduce water.
11Virgin Islands Water and Power Authority
Overview of the Water System (continued)
● Completed Water System Strategic Business Plan in 4th Quarter 2014
‒ Goal is to update the projected operating results associated with strategies to achieve financially viable and sustainable operations.
‒ Five year capital improvement plan developed with major emphasis on: o Reducing line losses, particularly on St. Croix o Evaluating areas for distribution system expansion to determine feasibility of serving new large users.
‒ Recent water system rate case resulted in a grant of an additional $0.9 million annually in revenues related to a Line Loss Reduction Capital Surcharge (or $0.71 per thousand gallons).
o Surcharge was granted to fund the proposed capital improvement plan.
‒ Major types of capital expenditures: o Pressure Management Phase II (St. Croix)o Water Line Upgradeso Meter Replacement and New Devices o Tank 2 Rehabilitation (Sara Hill)o Waterfront Main Rehabilitation (Charlotte Amalie)o Upgrade 12” to 24” Water Main from Kings Hill to Frederikstedo Renewal and Replacement of Lines

Section 2
Strategic Partnerships & Other Developments
13Virgin Islands Water and Power Authority
Strategic Partnerships (Public Sector)
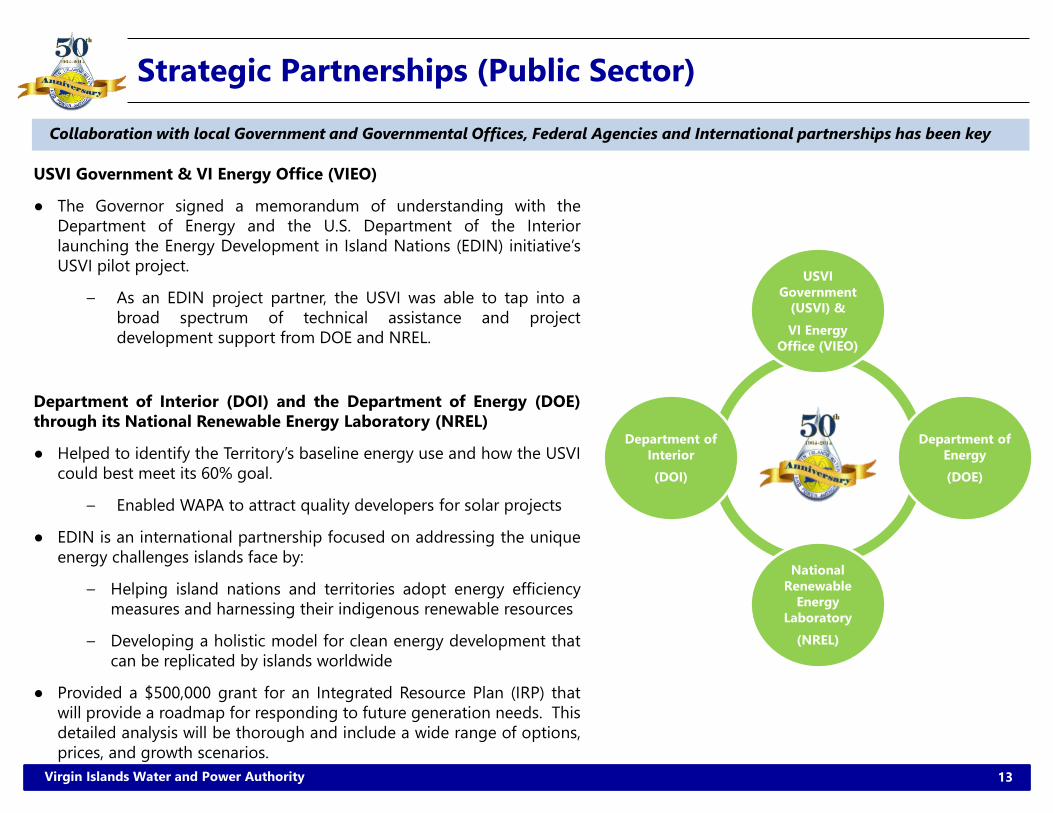
Collaboration with local Government and Governmental Offices, Federal Agencies and International partnerships has been key
USVI Government & VI Energy Office (VIEO)
● The Governor signed a memorandum of understanding with theDepartment of Energy and the U.S. Department of the Interiorlaunching the Energy Development in Island Nations (EDIN) initiative’sUSVI pilot project.
– As an EDIN project partner, the USVI was able to tap into abroad spectrum of technical assistance and projectdevelopment support from DOE and NREL.
Department of Interior (DOI) and the Department of Energy (DOE)through its National Renewable Energy Laboratory (NREL)
● Helped to identify the Territory’s baseline energy use and how the USVIcould best meet its 60% goal.
– Enabled WAPA to attract quality developers for solar projects
● EDIN is an international partnership focused on addressing the uniqueenergy challenges islands face by:
– Helping island nations and territories adopt energy efficiencymeasures and harnessing their indigenous renewable resources
– Developing a holistic model for clean energy development thatcan be replicated by islands worldwide
● Provided a $500,000 grant for an Integrated Resource Plan (IRP) thatwill provide a roadmap for responding to future generation needs. Thisdetailed analysis will be thorough and include a wide range of options,prices, and growth scenarios.
USVI Government
(USVI) &VI Energy
Office (VIEO)
Department of Energy(DOE)
National Renewable
Energy Laboratory
(NREL)
Department of Interior(DOI)
14Virgin Islands Water and Power Authority
Strategic Partnerships (Public Sector) continued
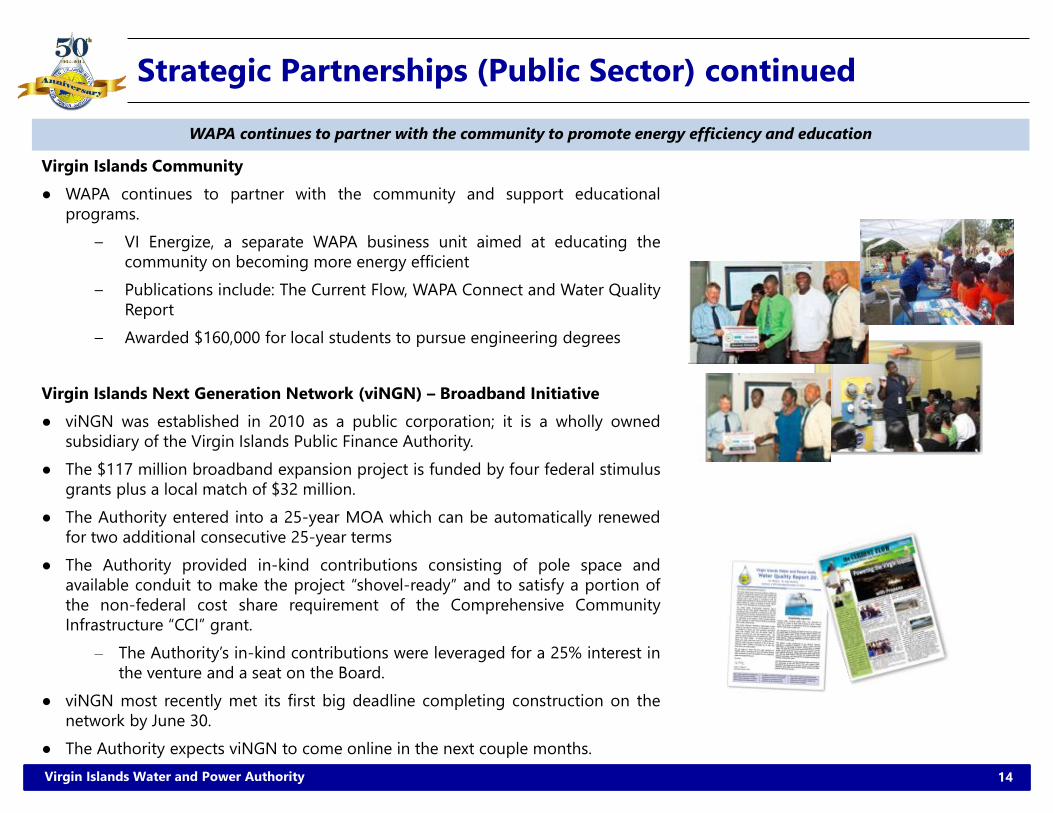
Virgin Islands Community● WAPA continues to partner with the community and support educational
programs.– VI Energize, a separate WAPA business unit aimed at educating the
community on becoming more energy efficient– Publications include: The Current Flow, WAPA Connect and Water Quality
Report– Awarded $160,000 for local students to pursue engineering degrees
Virgin Islands Next Generation Network (viNGN) – Broadband Initiative● viNGN was established in 2010 as a public corporation; it is a wholly owned
subsidiary of the Virgin Islands Public Finance Authority.● The $117 million broadband expansion project is funded by four federal stimulus
grants plus a local match of $32 million.● The Authority entered into a 25-year MOA which can be automatically renewed
for two additional consecutive 25-year terms● The Authority provided in-kind contributions consisting of pole space and
available conduit to make the project “shovel-ready” and to satisfy a portion ofthe non-federal cost share requirement of the Comprehensive CommunityInfrastructure “CCI” grant.
– The Authority’s in-kind contributions were leveraged for a 25% interest inthe venture and a seat on the Board.
● viNGN most recently met its first big deadline completing construction on thenetwork by June 30.
● The Authority expects viNGN to come online in the next couple months.
WAPA continues to partner with the community to promote energy efficiency and education
15Virgin Islands Water and Power Authority
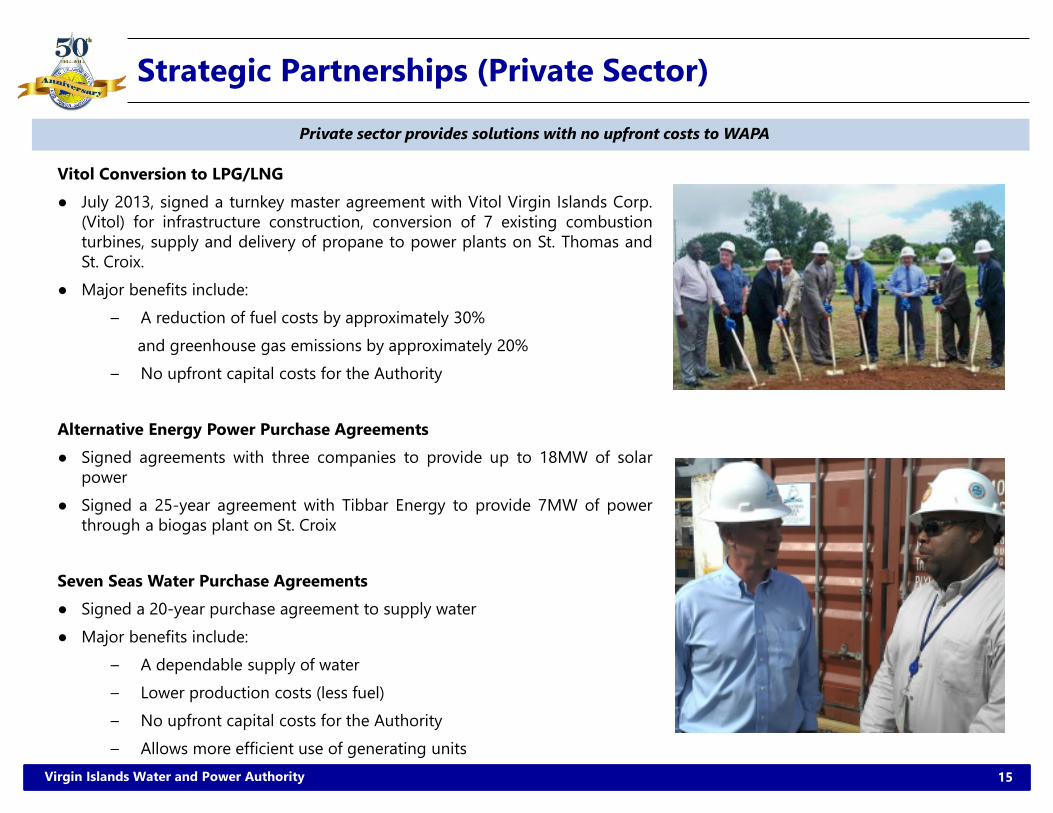
Strategic Partnerships (Private Sector)
Vitol Conversion to LPG/LNG● July 2013, signed a turnkey master agreement with Vitol Virgin Islands Corp.
(Vitol) for infrastructure construction, conversion of 7 existing combustionturbines, supply and delivery of propane to power plants on St. Thomas andSt. Croix.
● Major benefits include:– A reduction of fuel costs by approximately 30%
and greenhouse gas emissions by approximately 20%– No upfront capital costs for the Authority
Alternative Energy Power Purchase Agreements● Signed agreements with three companies to provide up to 18MW of solar
power● Signed a 25-year agreement with Tibbar Energy to provide 7MW of power
through a biogas plant on St. Croix
Seven Seas Water Purchase Agreements● Signed a 20-year purchase agreement to supply water● Major benefits include:
– A dependable supply of water– Lower production costs (less fuel)– No upfront capital costs for the Authority– Allows more efficient use of generating units
Private sector provides solutions with no upfront costs to WAPA
16Virgin Islands Water and Power Authority
$2,385,048
$2,836,942$2,571,524 $2,441,897
$2,829,834
$5,132,038
$4,321,130
$0
$2,000,000
$4,000,000
$6,000,000
FY 2008 FY 2009 FY 2010 FY 2011 FY 2012 FY 2013 FY 2014
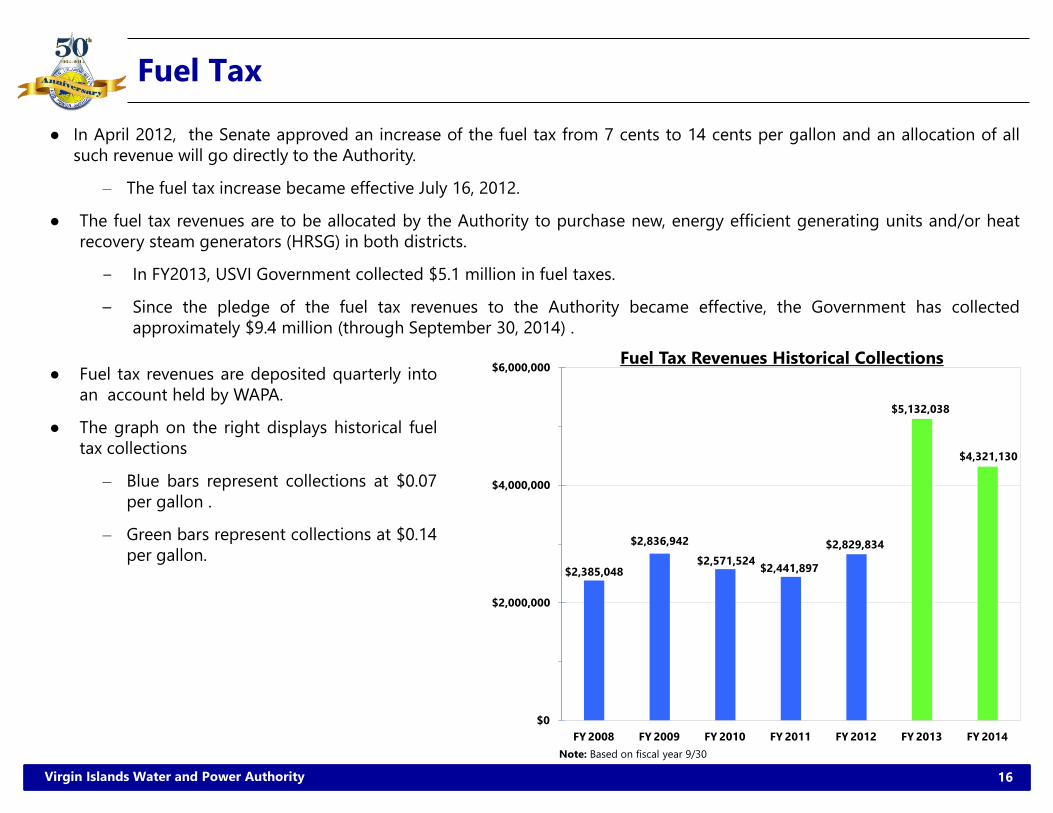
Fuel Tax
● In April 2012, the Senate approved an increase of the fuel tax from 7 cents to 14 cents per gallon and an allocation of allsuch revenue will go directly to the Authority.
– The fuel tax increase became effective July 16, 2012.
● The fuel tax revenues are to be allocated by the Authority to purchase new, energy efficient generating units and/or heatrecovery steam generators (HRSG) in both districts.
‒ In FY2013, USVI Government collected $5.1 million in fuel taxes.
– Since the pledge of the fuel tax revenues to the Authority became effective, the Government has collectedapproximately $9.4 million (through September 30, 2014) .
Note: Based on fiscal year 9/30
Fuel Tax Revenues Historical Collections● Fuel tax revenues are deposited quarterly into
an account held by WAPA.
● The graph on the right displays historical fueltax collections
– Blue bars represent collections at $0.07per gallon .
– Green bars represent collections at $0.14per gallon.
Section 3
Impact of HOVENSA Refinery Closure
18Virgin Islands Water and Power Authority
Impact on Closure of HOVENSA Terminal ● For decades until 2012, WAPA received all of its fuel needs for power generation directly from the HOVENSA Refinery
‒ HOVENSA sold the fuel oil essentially at cost‒ Savings to WAPA, and hence the ratepayer, of approximately $50 million per year realized in this incentive price‒ Assured supply, always available
● Closure of HOVENSA Refinery in 2012 forced WAPA to turn to the open oil market for its fuel supplies for power generation,hence exposing WAPA to complex logistics, and volatility, of the market
● WAPA has relied on HOVENSA’s Storage Terminal, which remained in operation, for three types of fuel‒ Gasoline‒ Ultra Low Sulfur Diesel (ULSD) road diesel for our vehicle fleet on St. Croix‒ Storage for WAPA’s current supplier of High Sulfur Diesel (HSD) No. 2 fuel oil for our power generating facilities in both
Districts
● WAPA received notice from HOVENSA that the supply of vehicle fuels on St. Croix would not be replenished if the V.I.Legislature did not approve the operating agreement for the refinery
‒ WAPA solicited proposals to address this supply cut-off and has engaged new supplier
● WAPA received notice from its current supplier of fuel oil for power generation that its supply contract would be terminatedFebruary 1, 2015
‒ WAPA solicited emergency proposals from the three finalists in our previous bid solicitation‒ Evaluation Committee, having completed its work, will recommend selection of new supplier‒ Price potentially $10-$15 per barrel lower than current price approved by Public Service Commission due to recent oil
market price decline, which will be passed on dollar-for-dollar to ratepayers, subject to PSC rate modification
Section 4
Key Capital Projects
20Virgin Islands Water and Power Authority
Key Recent and Near Term Capital Projects
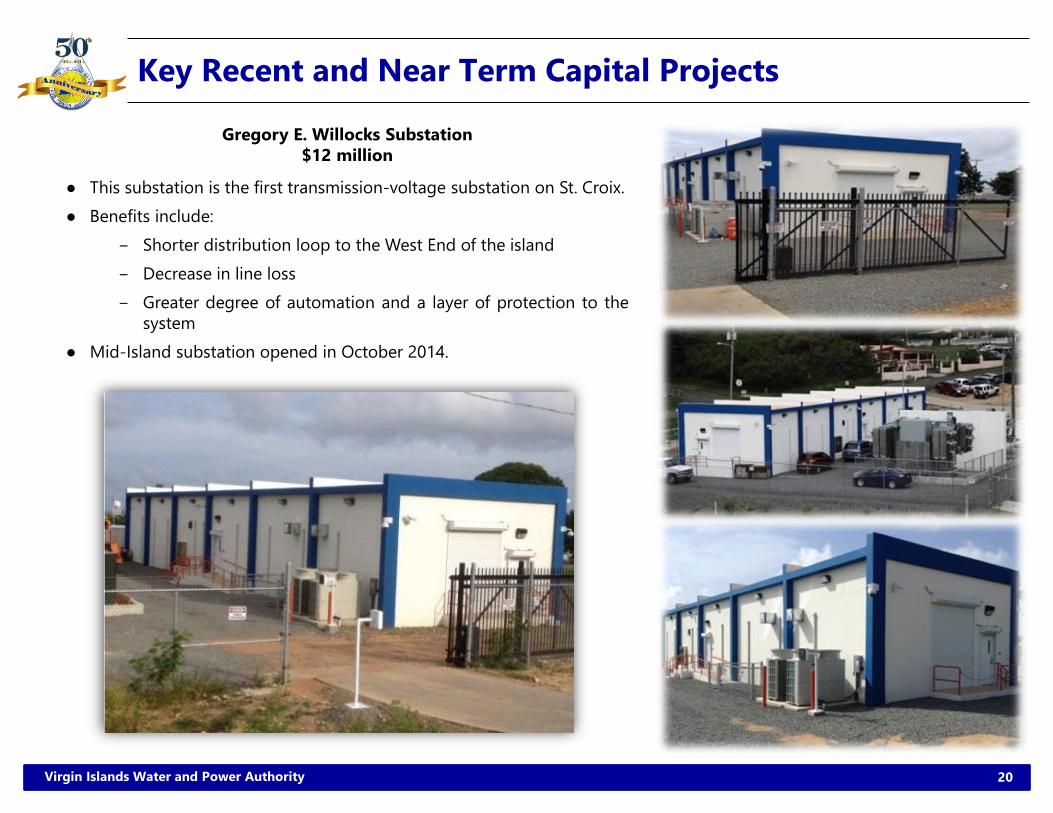
● This substation is the first transmission-voltage substation on St. Croix.● Benefits include:
‒ Shorter distribution loop to the West End of the island‒ Decrease in line loss‒ Greater degree of automation and a layer of protection to the
system● Mid-Island substation opened in October 2014.
Gregory E. Willocks Substation$12 million
21Virgin Islands Water and Power Authority
Key Recent and Near Term Capital Projects (continued)
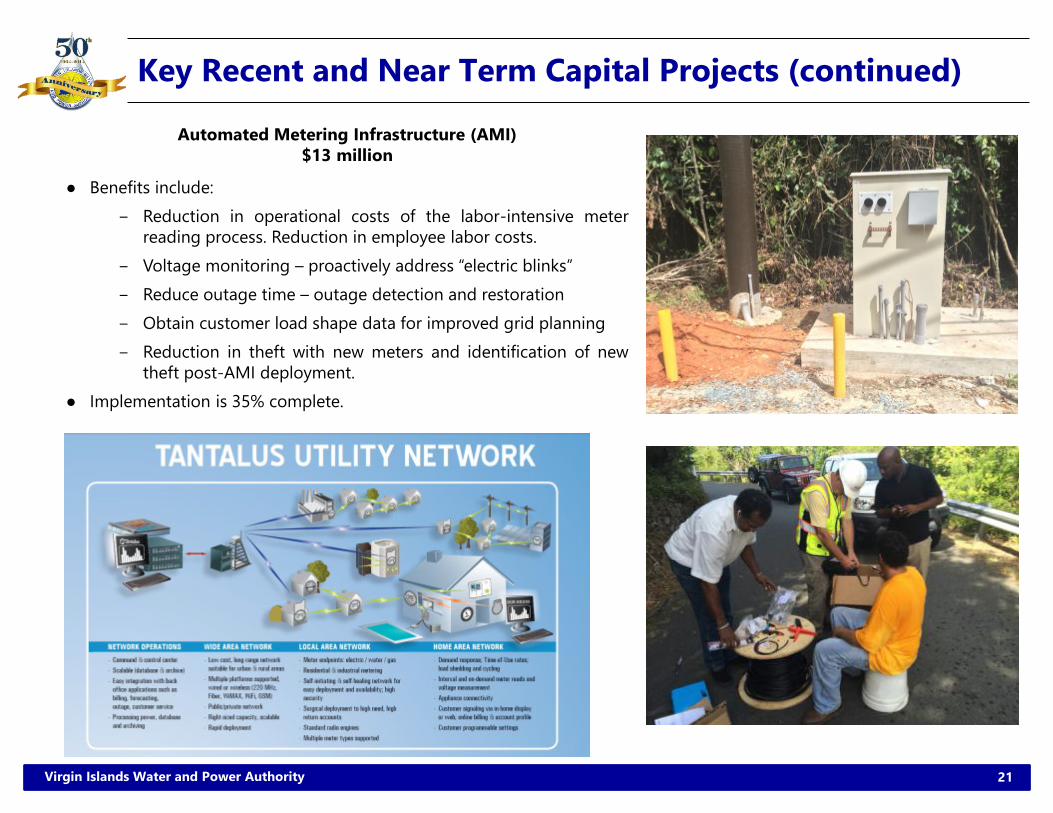
● Benefits include:‒ Reduction in operational costs of the labor-intensive meter
reading process. Reduction in employee labor costs.‒ Voltage monitoring – proactively address “electric blinks”‒ Reduce outage time – outage detection and restoration‒ Obtain customer load shape data for improved grid planning‒ Reduction in theft with new meters and identification of new
theft post-AMI deployment.● Implementation is 35% complete.
Automated Metering Infrastructure (AMI)$13 million
22Virgin Islands Water and Power Authority
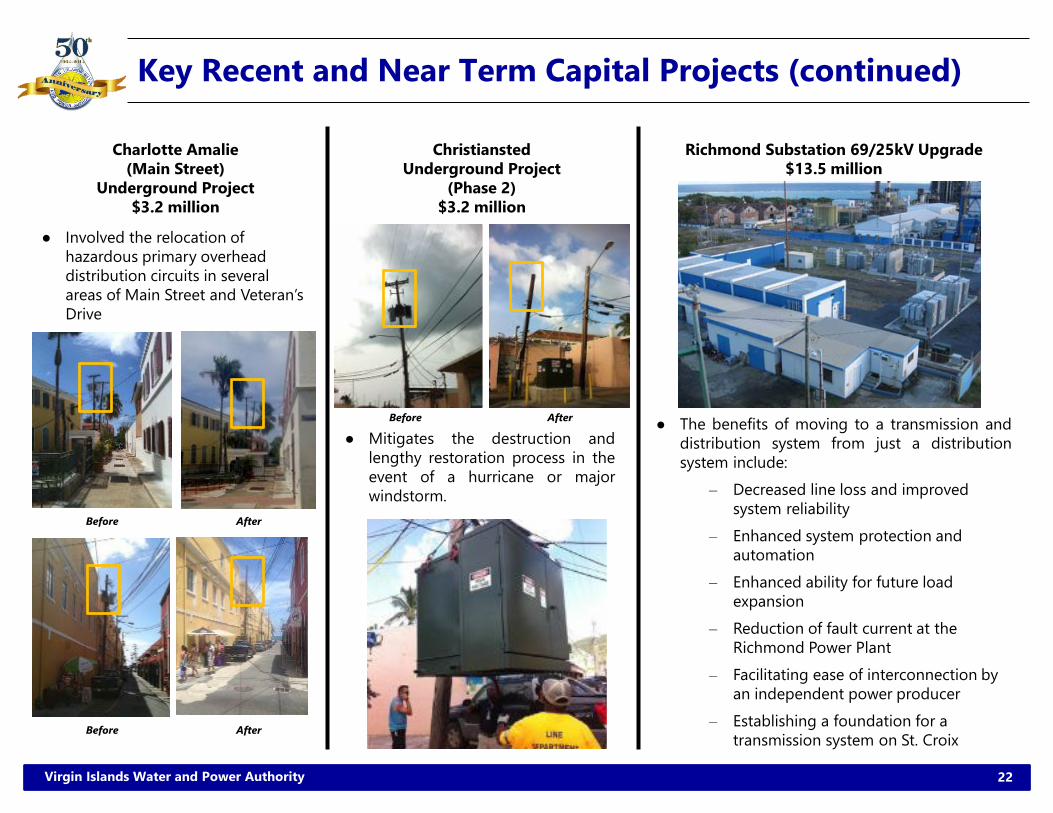
● Involved the relocation of hazardous primary overhead distribution circuits in several areas of Main Street and Veteran’s Drive
Charlotte Amalie (Main Street)
Underground Project$3.2 million
● The benefits of moving to a transmission anddistribution system from just a distributionsystem include:
– Decreased line loss and improved system reliability
– Enhanced system protection and automation
– Enhanced ability for future load expansion
– Reduction of fault current at the Richmond Power Plant
– Facilitating ease of interconnection by an independent power producer
– Establishing a foundation for a transmission system on St. Croix
Richmond Substation 69/25kV Upgrade$13.5 million
Christiansted Underground Project
(Phase 2)$3.2 million
● Mitigates the destruction andlengthy restoration process in theevent of a hurricane or majorwindstorm.
Before After
Before After
Before After
Key Recent and Near Term Capital Projects (continued)
23Virgin Islands Water and Power Authority
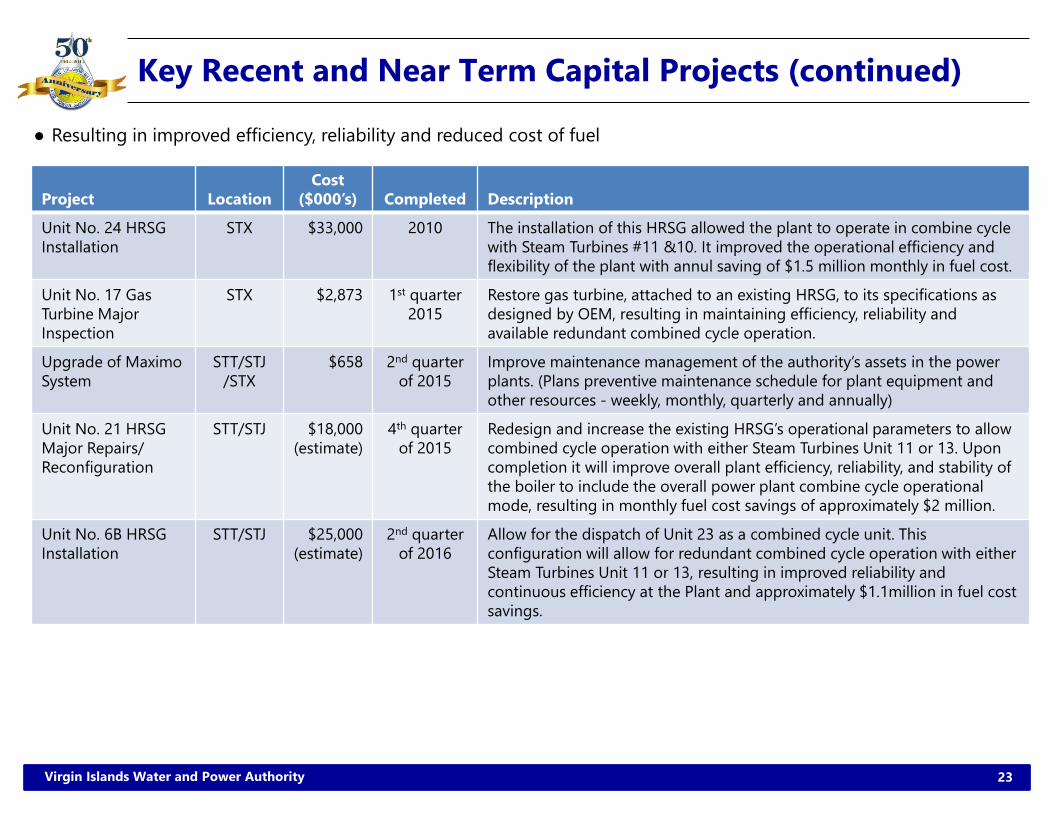
Project LocationCost
($000’s) Completed Description
Unit No. 24 HRSG Installation
STX $33,000 2010 The installation of this HRSG allowed the plant to operate in combine cycle with Steam Turbines #11 &10. It improved the operational efficiency and flexibility of the plant with annul saving of $1.5 million monthly in fuel cost.
Unit No. 17 Gas Turbine Major Inspection
STX $2,873 1st quarter 2015
Restore gas turbine, attached to an existing HRSG, to its specifications as designed by OEM, resulting in maintaining efficiency, reliability and available redundant combined cycle operation.
Upgrade of Maximo System
STT/STJ/STX
$658 2nd quarter of 2015
Improve maintenance management of the authority’s assets in the power plants. (Plans preventive maintenance schedule for plant equipment and other resources - weekly, monthly, quarterly and annually)
Unit No. 21 HRSG Major Repairs/Reconfiguration
STT/STJ $18,000 (estimate)
4th quarterof 2015
Redesign and increase the existing HRSG’s operational parameters to allow combined cycle operation with either Steam Turbines Unit 11 or 13. Uponcompletion it will improve overall plant efficiency, reliability, and stability of the boiler to include the overall power plant combine cycle operational mode, resulting in monthly fuel cost savings of approximately $2 million.
Unit No. 6B HRSG Installation
STT/STJ $25,000 (estimate)
2nd quarter of 2016
Allow for the dispatch of Unit 23 as a combined cycle unit. This configuration will allow for redundant combined cycle operation with either Steam Turbines Unit 11 or 13, resulting in improved reliability and continuous efficiency at the Plant and approximately $1.1million in fuel cost savings.
Key Recent and Near Term Capital Projects (continued)
● Resulting in improved efficiency, reliability and reduced cost of fuel
24Virgin Islands Water and Power Authority
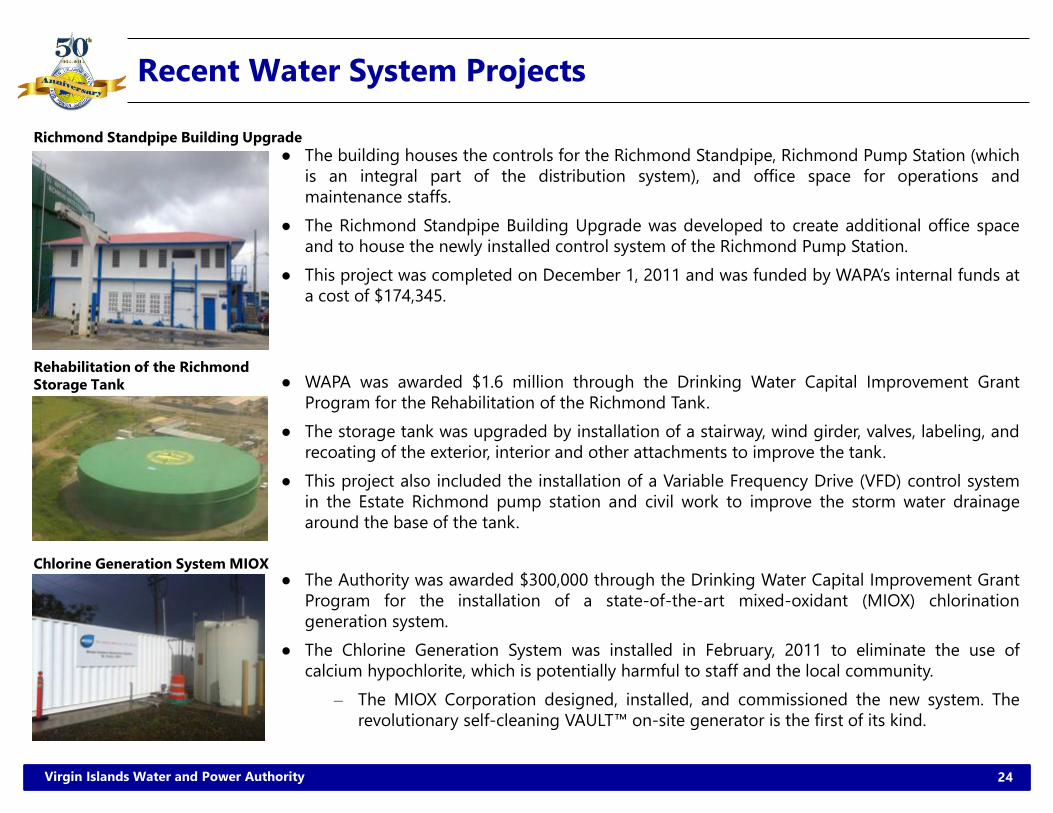
● The building houses the controls for the Richmond Standpipe, Richmond Pump Station (whichis an integral part of the distribution system), and office space for operations andmaintenance staffs.
● The Richmond Standpipe Building Upgrade was developed to create additional office spaceand to house the newly installed control system of the Richmond Pump Station.
● This project was completed on December 1, 2011 and was funded by WAPA’s internal funds ata cost of $174,345.
● WAPA was awarded $1.6 million through the Drinking Water Capital Improvement GrantProgram for the Rehabilitation of the Richmond Tank.
● The storage tank was upgraded by installation of a stairway, wind girder, valves, labeling, andrecoating of the exterior, interior and other attachments to improve the tank.
● This project also included the installation of a Variable Frequency Drive (VFD) control systemin the Estate Richmond pump station and civil work to improve the storm water drainagearound the base of the tank.
● The Authority was awarded $300,000 through the Drinking Water Capital Improvement GrantProgram for the installation of a state-of-the-art mixed-oxidant (MIOX) chlorinationgeneration system.
● The Chlorine Generation System was installed in February, 2011 to eliminate the use ofcalcium hypochlorite, which is potentially harmful to staff and the local community.
– The MIOX Corporation designed, installed, and commissioned the new system. Therevolutionary self-cleaning VAULT™ on-site generator is the first of its kind.
Recent Water System Projects
Rehabilitation of the Richmond Storage Tank
Richmond Standpipe Building Upgrade
Chlorine Generation System MIOX

Section 5
Alternative Energy Initiatives
26Virgin Islands Water and Power Authority
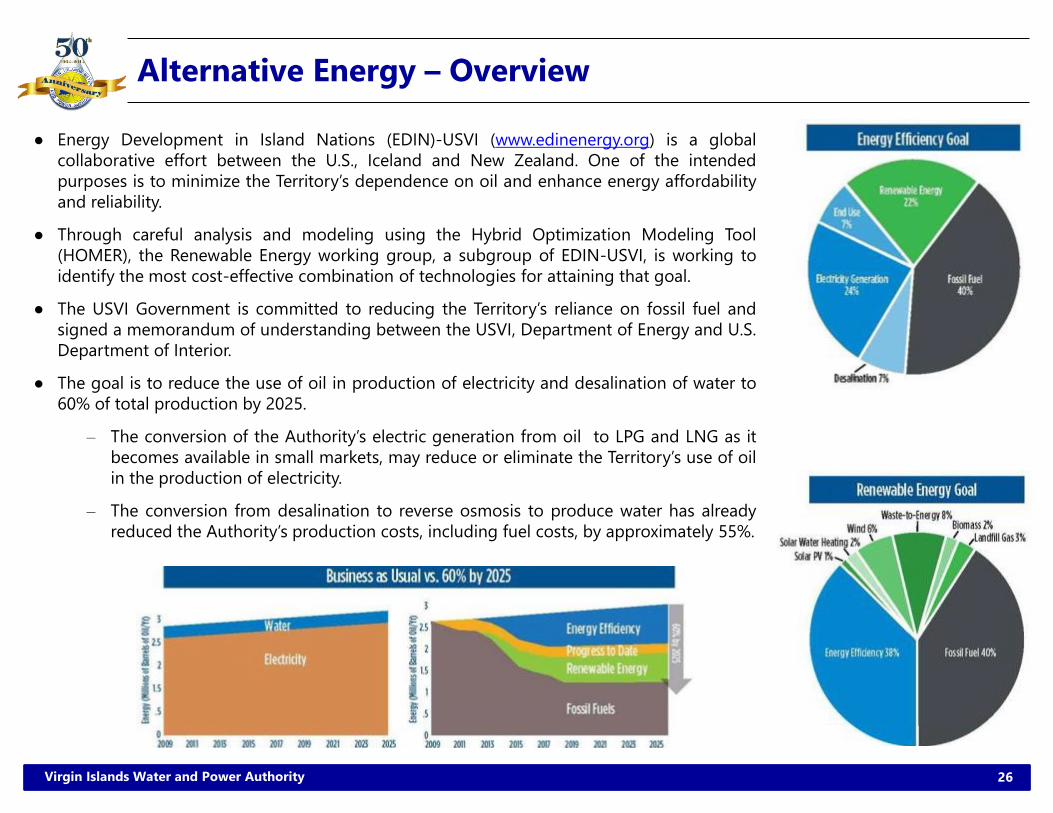
Alternative Energy – Overview
● Energy Development in Island Nations (EDIN)-USVI (www.edinenergy.org) is a globalcollaborative effort between the U.S., Iceland and New Zealand. One of the intendedpurposes is to minimize the Territory’s dependence on oil and enhance energy affordabilityand reliability.
● Through careful analysis and modeling using the Hybrid Optimization Modeling Tool(HOMER), the Renewable Energy working group, a subgroup of EDIN-USVI, is working toidentify the most cost-effective combination of technologies for attaining that goal.
● The USVI Government is committed to reducing the Territory’s reliance on fossil fuel andsigned a memorandum of understanding between the USVI, Department of Energy and U.S.Department of Interior.
● The goal is to reduce the use of oil in production of electricity and desalination of water to60% of total production by 2025.
– The conversion of the Authority’s electric generation from oil to LPG and LNG as itbecomes available in small markets, may reduce or eliminate the Territory’s use of oilin the production of electricity.
– The conversion from desalination to reverse osmosis to produce water has alreadyreduced the Authority’s production costs, including fuel costs, by approximately 55%.
27Virgin Islands Water and Power Authority
Liquefied Petroleum Gas (LPG) – Overview
● In July 2013, the Authority entered into a 7-year power purchase contract (now revised to 10-year contract) with Vitol.
– The project entails the conversion of 7 gas turbines, the supply of propane in conjunction with the design,construction and operation of the required infrastructure to receive, store, vaporize, measure and deliver LPG on theIslands of St. Thomas and St. Croix.
● Vitol is responsible for engineering, procurement, construction (EPC), and commissioning of the projects
● Project costs are approximately $150 million
● All upfront costs are paid by Vitol.
– WAPA repays Vitol over a 10-year amortization (option to repay in 7 years), built into the fuel cost.
● The switch to propane is expected to reduce fuel costs approximately 30% as well as reduce NOx, SOx, and CO2 emissions
● The 30% reduction in fuel cost is still expected based on agreed adjustments to the contract between WAPA and Vitol to boththe amortization (from 7 years to 10 years) and the decreased interest rate from 12.5% to 8.0%
28Virgin Islands Water and Power Authority
LPG Project Highlights
● First class project‒ Safety‒ Industry practices‒ Economics‒ Environmental benefits
● Economic benefits underpinned by the fuel savings derived from low propane prices compared to diesel and savings in working capital for WAPA as inventory is carried by Vitol
● As of December 2014, more than 200,768 man hours expended on both STT and STX, with approximately 130,000 hours of local USVI man hours.
● Project has contracted directly or indirectly numerous contractors for various parcels of scope.
‒ Grade All - Demolitions works STX and earthworks STT‒ Environmental Concepts - Lead Abatement and
Demolition STX‒ Pro-Mar - Pile Removal STX and installation temp
mooring at WAPA STT‒ O’Reilly - Sewer installation STX‒ APEX - Rebar Installation and building works STT‒ KER - Survey works STT and some on STX‒ Nations Industrial Services - Bullet installation STX,
structural pipe supports and foundations STX and STT‒ Patrick Senhouse - Earthworks and transportation STX‒ Tropical - Shipping and Logistics STT and STX
‒ CSC - Security on STT and STX‒ Bateman - Survey works STX and Off-Shore‒ Brian Mosely - Survey works STT‒ Julian Welding - Fencing STT‒ Marco STX - Transportation STX‒ Monarch - Transportation STX‒ STX Marine - Warehousing STX‒ UVI - Marine Survey Works for Off-Shore Mooring
System (Benthic Survey)‒ VIPA - Staging and Handling of LPG Storage Tanks‒ VIQC - Survey works and QA/QC surveys
29Virgin Islands Water and Power Authority
● Project actively recruiting local personnel for the operations and maintenance teams. ‒ 10 terminal operators and 2 supervisors selected for hire
● Procurement of long lead items completed: 80% delivered 20% in transit
● $100 Million invested by Vitol to date
● Contract signed with WAPA on July 2013
● Construction duration was scheduled at 12-14 months after initial FEED and permitting provided.
LPG Project Highlights (continued)

30Virgin Islands Water and Power Authority
LPG Project – Summary of Significant Changes
● Process & Engineering:‒ Changes in the process conditions; higher design pressures and temperatures required to meet the requirements for
Frame 6 Unit‒ Relocation of the STT mound to mitigate the volume of rock removal.
Relocation resulted in a reduction of 40 to 50 % of rock removal. Final number was still higher than foreseen in the estimates and budget.
‒ Redesign of the NW and NE Corners on STT
● Demolition & Earth Works‒ Significant additional works due to adverse soil conditions and unforeseen UG obstacle on STX‒ Removal of significant quantities of burned sugar cane‒ Lead abatement of the metal warehouse
● Civil Works‒ Local high prices for concrete, limited capacity to handle locally production of large volumes of concrete combined
with additional volumes of concrete for the slabs required to support the storage tanks ‒ Significant additional works due to adverse soil conditions ‒ Based on the FEED study it was determined that seismic zone requirements and soil conditions would require
significantly larger foundations to support the storage tanks
● Piling on STX‒ Design and installation of 900 piles and all associated earthworks
● Marine Works‒ Installation of additional fenders and bollards to moor the feeder vessels‒ Jetty works on STX - additional breasting dolphins
31Virgin Islands Water and Power Authority
LPG Project – Summary of Significant Changes (continued)
● Shipping and Installation of Storage Tanks‒ Additional logistics was required as bullets had to be landed first at storage location at STX, then mobilize by barges to
plant sites‒ Demobilization and mobilization of Mammoet
● Mechanical‒ Additional equipment not foreseen and required after completion of FEED studies, such as boilers, metering, and
higher pressure LPG pumps.
● Off-Shore Mooring System‒ Design, supply and installation of a single buoy mooring system for the VLGC
● GE services‒ Additional scope of work on turbine compartments and additional safety features to minimize and control any
potential hazards
32Virgin Islands Water and Power Authority
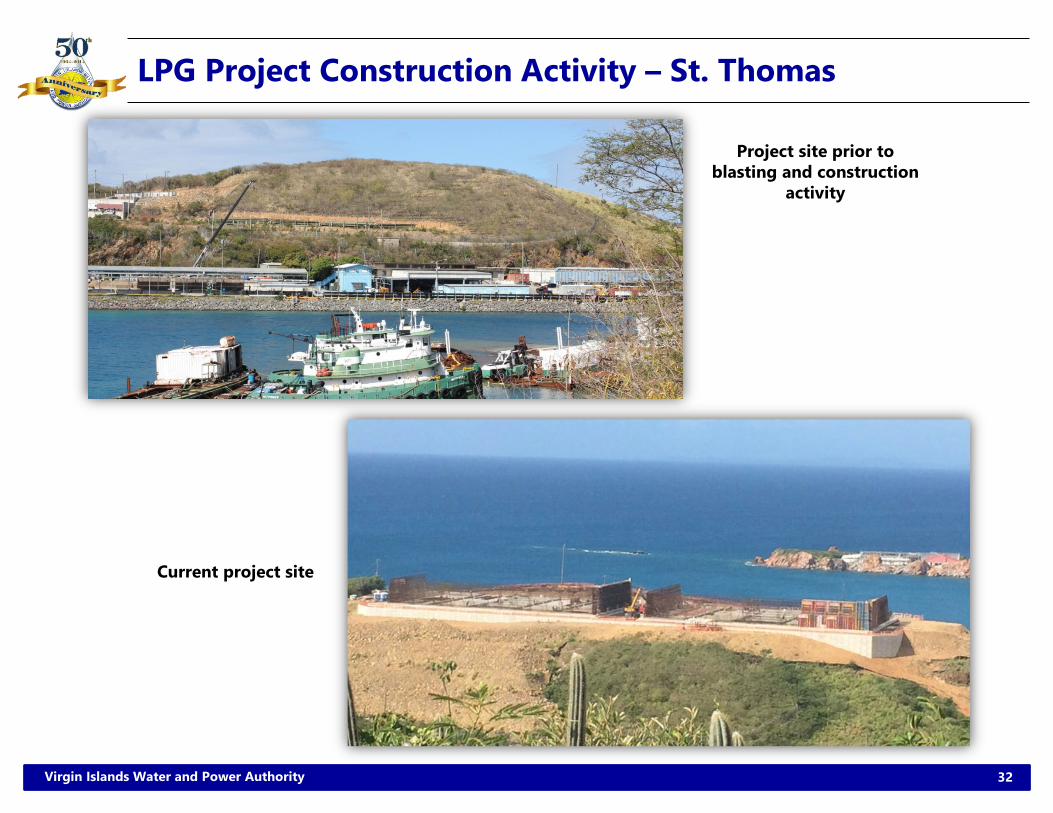
LPG Project Construction Activity – St. Thomas
Project site prior to blasting and construction
activity
Current project site
33Virgin Islands Water and Power Authority
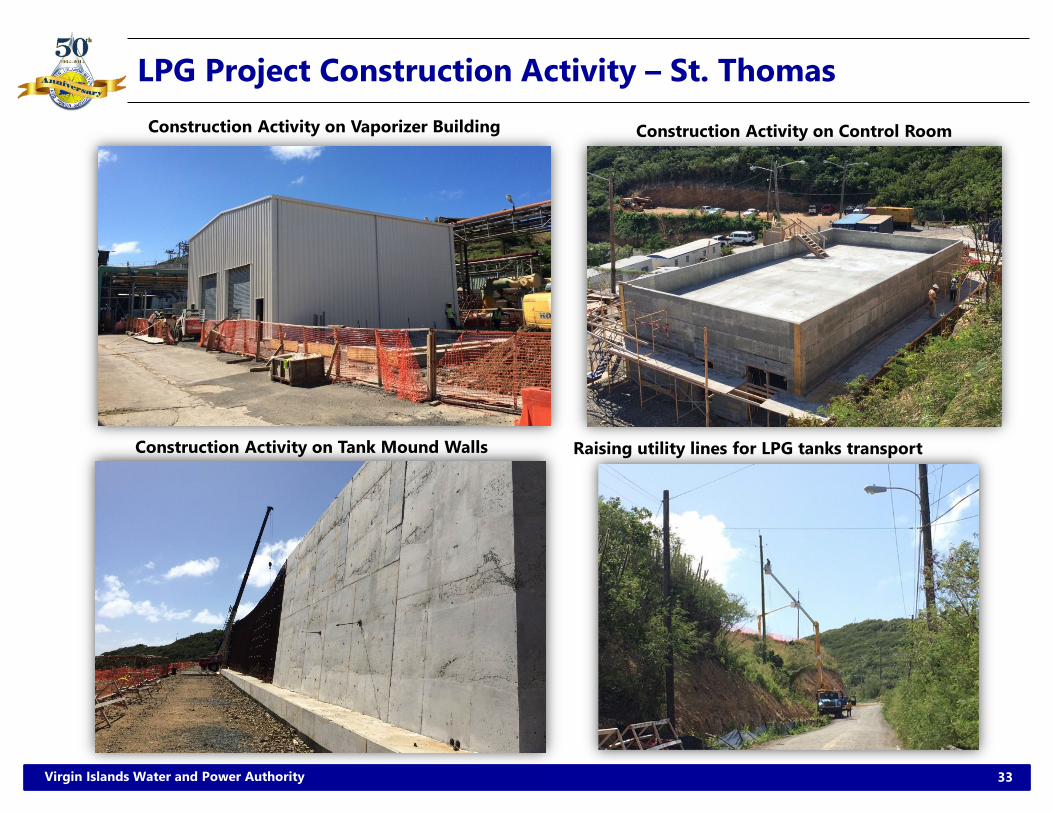
LPG Project Construction Activity – St. ThomasConstruction Activity on Control RoomConstruction Activity on Vaporizer Building
Construction Activity on Tank Mound Walls Raising utility lines for LPG tanks transport
34Virgin Islands Water and Power Authority
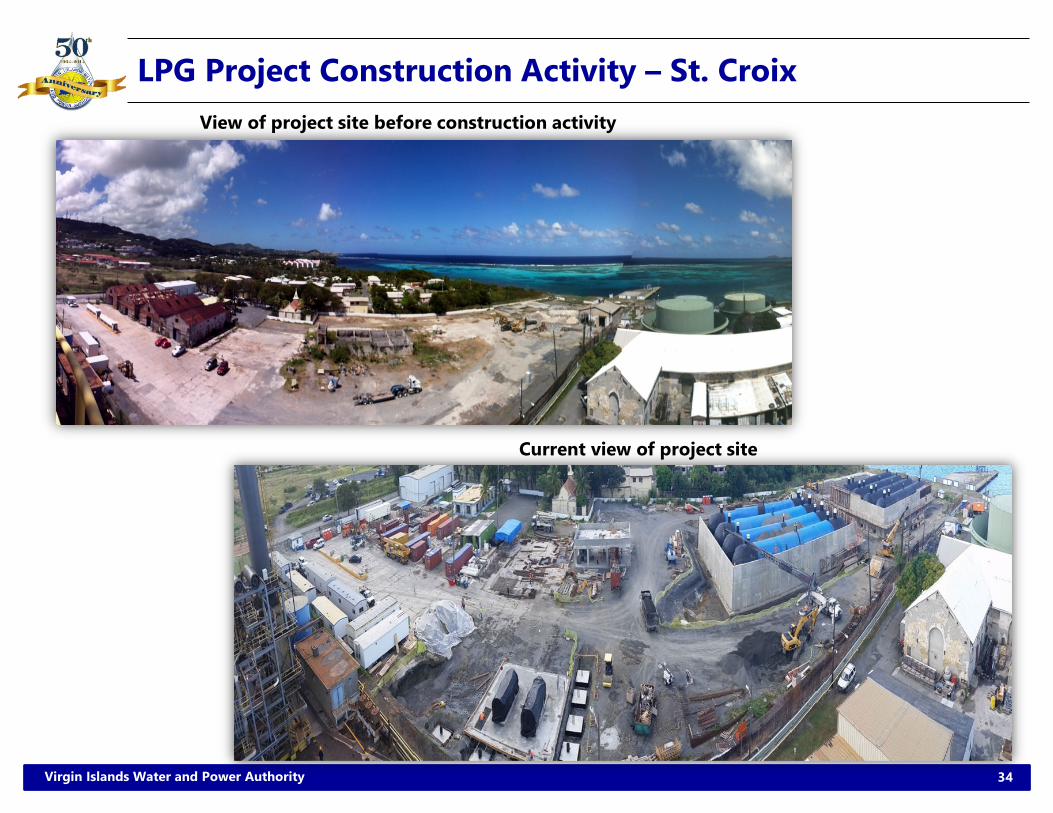
LPG Project Construction Activity – St. CroixView of project site before construction activity
Current view of project site
35Virgin Islands Water and Power Authority
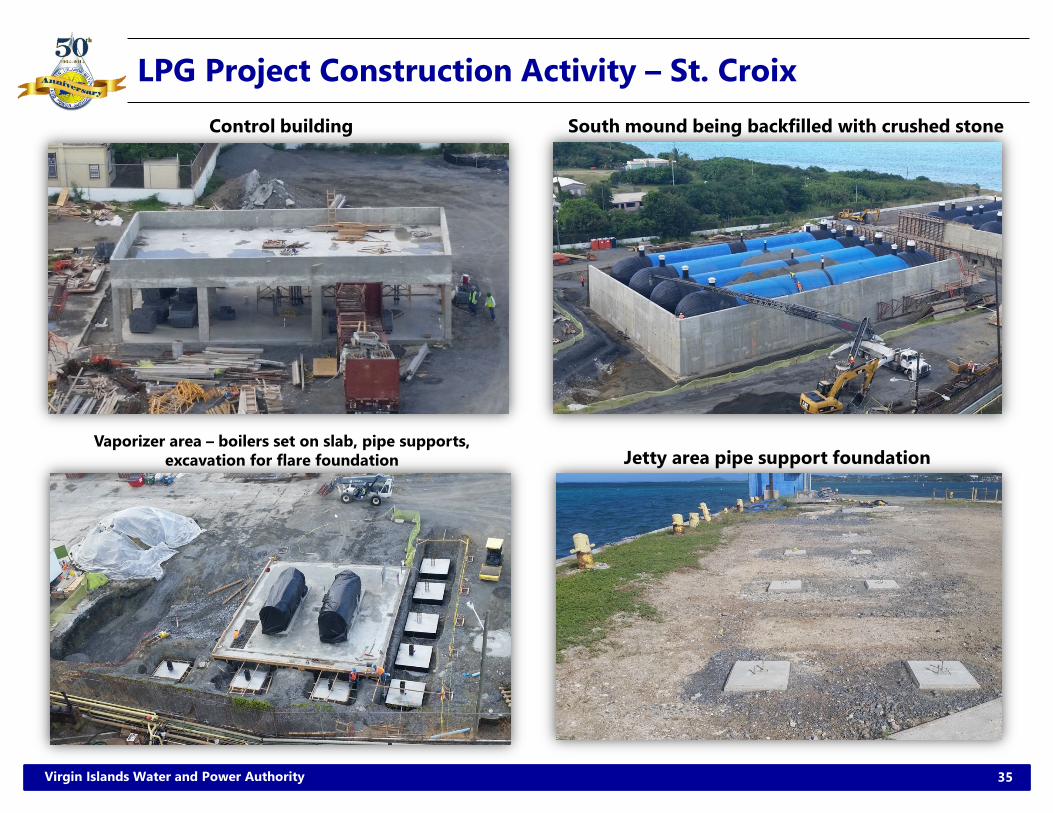
LPG Project Construction Activity – St. CroixControl building
Vaporizer area – boilers set on slab, pipe supports, excavation for flare foundation
South mound being backfilled with crushed stone
Jetty area pipe support foundation

36Virgin Islands Water and Power Authority
LPG Project Construction Activity – St. CroixNorth mound top wall forms and rebar
North mound west wall rebar installation
37Virgin Islands Water and Power Authority
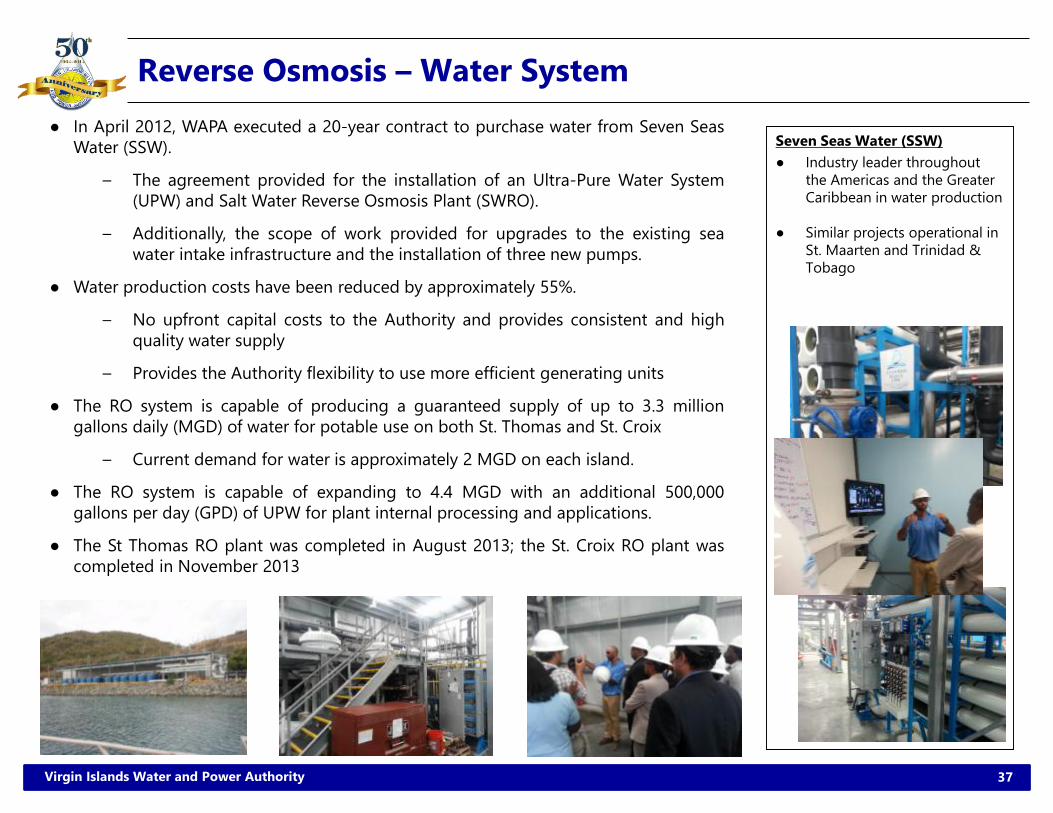
Reverse Osmosis – Water System● In April 2012, WAPA executed a 20-year contract to purchase water from Seven Seas
Water (SSW).
– The agreement provided for the installation of an Ultra-Pure Water System(UPW) and Salt Water Reverse Osmosis Plant (SWRO).
– Additionally, the scope of work provided for upgrades to the existing seawater intake infrastructure and the installation of three new pumps.
● Water production costs have been reduced by approximately 55%.
– No upfront capital costs to the Authority and provides consistent and highquality water supply
– Provides the Authority flexibility to use more efficient generating units
● The RO system is capable of producing a guaranteed supply of up to 3.3 milliongallons daily (MGD) of water for potable use on both St. Thomas and St. Croix
– Current demand for water is approximately 2 MGD on each island.
● The RO system is capable of expanding to 4.4 MGD with an additional 500,000gallons per day (GPD) of UPW for plant internal processing and applications.
● The St Thomas RO plant was completed in August 2013; the St. Croix RO plant wascompleted in November 2013
Seven Seas Water (SSW)● Industry leader throughout
the Americas and the Greater Caribbean in water production
● Similar projects operational in St. Maarten and Trinidad & Tobago
38Virgin Islands Water and Power Authority
● In June 1987, the responsibility of distributing potable water was transferred from the Department of Public Works toWAPA under Act 5265.
● With this transfer, WAPA inherited the water distribution system that was primarily comprised of cast iron and ductile ironpipes some of which were installed as early as in the 1930s.
● Many of these pipes have suffered extensive interior and exterior corrosion. Since WAPA took ownership of the waterdistribution, it has undertaken an aggressive capital improvement program to rehabilitate its aging water distributioninfrastructure.
● WAPA now replaces all of its corroded metal pipes with polyvinyl chloride (PVC) and high-density polyethylene pipe(HDPE).
● The replacement of the aged iron piping in the distribution system is the ultimate long term solution to the “coloredwater” being observed from time to time in limited areas.
● WAPA recently completed a Water Business Case and Five Year Capital Improvement Plan. Both the business Case andCapital Improvement Plan focused and addressing 5 key areas to provide residents with the highest quality of wateravailable.
● The areas of focus were public safety and health, water loss reduction, system efficiency and system expansion.
● WAPA’s current five year capital improvement plan for the water distribution systems in both districts are available.
Water Quality Mitigation Measures

39Virgin Islands Water and Power Authority
Water Quality Mitigation Measures (continued)● WAPA customers are experiencing discoloured water problems due to the presence of old, unlined cast iron pipe, which is
highly susceptible to corrosion and iron release.
● Hydraulic disturbances such as those caused by fire hydrant use, flushing, and water main breakage can cause red waterevents by dislodging iron from the pipe wall.
● Changes in distributed water quality can cause re-equilibration of existing scales, resulting in iron release and occurrenceof red water. This is because permeate from seawater desalination plants contains almost no minerals and is highlyaggressive in nature.
● When released into a distribution system, it may result in the dissolution of existing carbonate scales. Those scales maycontain iron, and exposing metallic pipe surfaces results in red water.
● Post-treatment of permeate is required to increase pH and alkalinity in the finished water, thereby reducing the corrosionpotential in the distribution system.
● After much consultation it was determined that the best approach to finding a solution in the near term make thepermeate less aggressive.
● The process involves increasing the alkalinity of the permeate by introducing lime (CaCO3) into the RO plant effluent.
● In order to increase the solubility of the CaCO3the pH must be lowered or made acidic. This is accomplished by theinjection of CO2. (From basic chemistry, CO2 + water makes a weak acid).
● The addition of CO2 is preferable to H2SO4, which would be adding more impurities to the water, is a much morehazardous, and more costly as well.
40Virgin Islands Water and Power Authority
Water Quality Mitigation Measures (continued)● The equipment needed include storage tanks for both carbon dioxide and calcium carbonate
● Injection skid for carbon dioxide (pumps and injection controller)
● Refrigeration system
● VIWAPA would need to supply the CaCO3 and CO2
● Bids were solicited to find a supplier of both products and the most competitive bidder selected
● Installation cost: $800,000.00
● Refrigeration rental: $750.00/month
● CO2tank rental: $750.00/month
● Last month the Governing Board approved the project which will allow Seven Seas to install calcium carbonateand carbon dioxide injection equipment at both Randolph Harley and Richmond Plants to mitigate the coloredwater in the Authority’s distribution system. Funding for the project will be through the water LEAC during thelast 10 years of the Authority’s water purchase agreement with Seven Seas at $0.15 per/1000 gallons.
● Additionally, the Authority is pursuing other avenues utilizing other procedures and technologies to help improvethe water quality to include the following:
– Aggressive flushing program at problem spots, particularly in low-lying and low-flow areas.
– Sleeving of pipes in distribution system with delicate walls until they can be replaced.
– Reline the pipes with smooth, protective coating.
– Perform system-wide analysis to determine which combination of programs would be most effective
– Bench testing chemicals for potable water system
41Virgin Islands Water and Power Authority
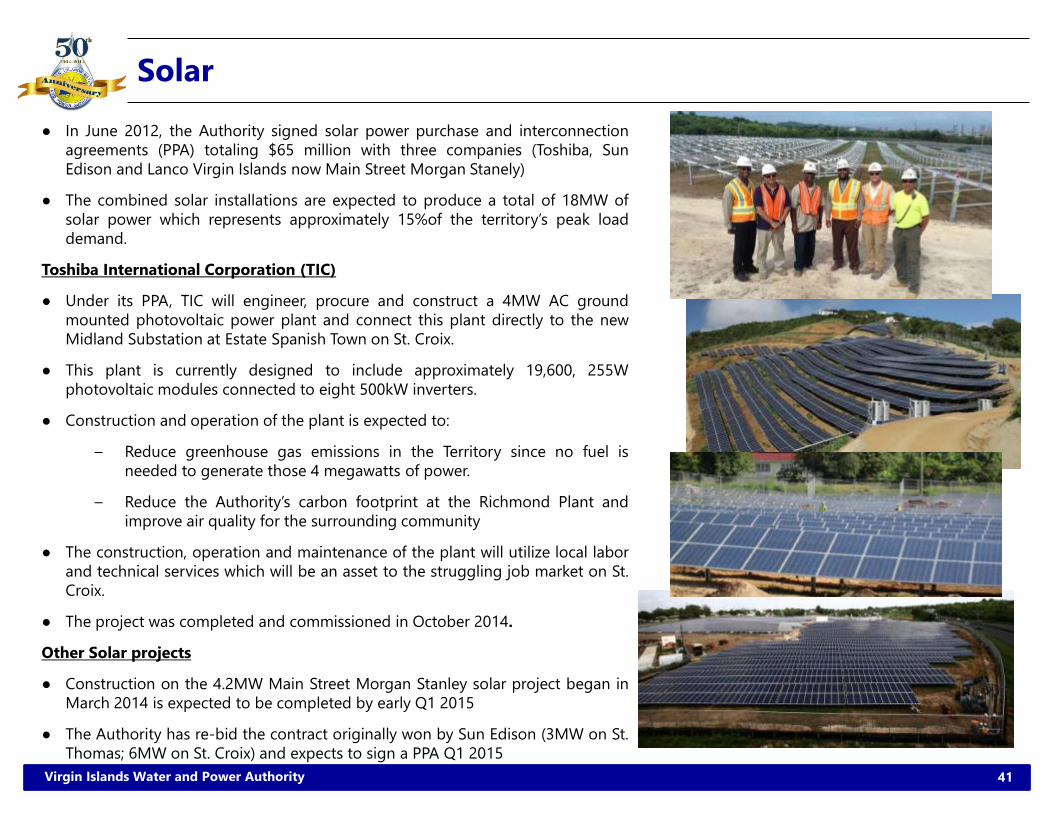
Solar ● In June 2012, the Authority signed solar power purchase and interconnection
agreements (PPA) totaling $65 million with three companies (Toshiba, SunEdison and Lanco Virgin Islands now Main Street Morgan Stanely)
● The combined solar installations are expected to produce a total of 18MW ofsolar power which represents approximately 15%of the territory’s peak loaddemand.
Toshiba International Corporation (TIC)
● Under its PPA, TIC will engineer, procure and construct a 4MW AC groundmounted photovoltaic power plant and connect this plant directly to the newMidland Substation at Estate Spanish Town on St. Croix.
● This plant is currently designed to include approximately 19,600, 255Wphotovoltaic modules connected to eight 500kW inverters.
● Construction and operation of the plant is expected to:
– Reduce greenhouse gas emissions in the Territory since no fuel isneeded to generate those 4 megawatts of power.
– Reduce the Authority’s carbon footprint at the Richmond Plant andimprove air quality for the surrounding community
● The construction, operation and maintenance of the plant will utilize local laborand technical services which will be an asset to the struggling job market on St.Croix.
● The project was completed and commissioned in October 2014.
Other Solar projects
● Construction on the 4.2MW Main Street Morgan Stanley solar project began inMarch 2014 is expected to be completed by early Q1 2015
● The Authority has re-bid the contract originally won by Sun Edison (3MW on St.Thomas; 6MW on St. Croix) and expects to sign a PPA Q1 2015
42Virgin Islands Water and Power Authority
Biomass
Tibbar Energy USVI LLC
● Tibbar Energy is a renewable energydevelopment company that focuses onbiomass projects that range in size from2 and 10MW.
● Other biomass projects completed byTibbar or its strategic partners include:
– Biokraft, Denmark (2MW)
– Kurana, Lithuania (4MW)
– Allter Power, Poland (1.6MW)
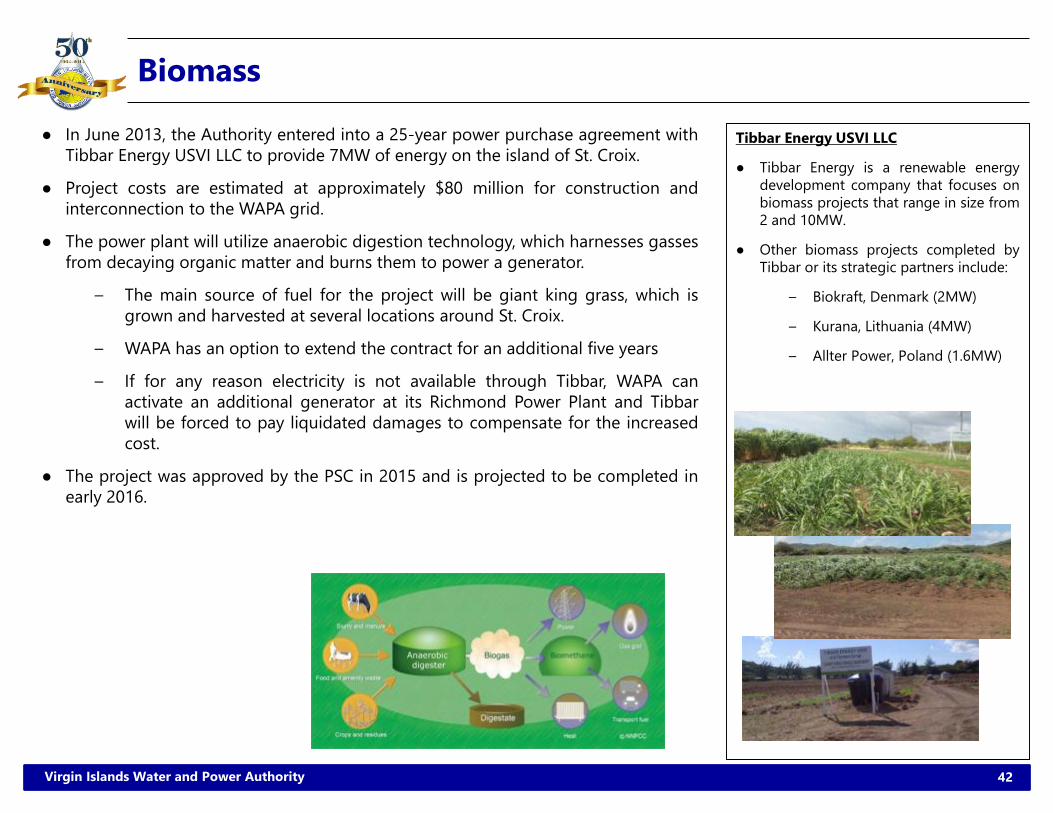
● In June 2013, the Authority entered into a 25-year power purchase agreement withTibbar Energy USVI LLC to provide 7MW of energy on the island of St. Croix.
● Project costs are estimated at approximately $80 million for construction andinterconnection to the WAPA grid.
● The power plant will utilize anaerobic digestion technology, which harnesses gassesfrom decaying organic matter and burns them to power a generator.
– The main source of fuel for the project will be giant king grass, which isgrown and harvested at several locations around St. Croix.
– WAPA has an option to extend the contract for an additional five years
– If for any reason electricity is not available through Tibbar, WAPA canactivate an additional generator at its Richmond Power Plant and Tibbarwill be forced to pay liquidated damages to compensate for the increasedcost.
● The project was approved by the PSC in 2015 and is projected to be completed inearly 2016.
43Virgin Islands Water and Power Authority
Interconnection (Puerto Rico USVI BVI)
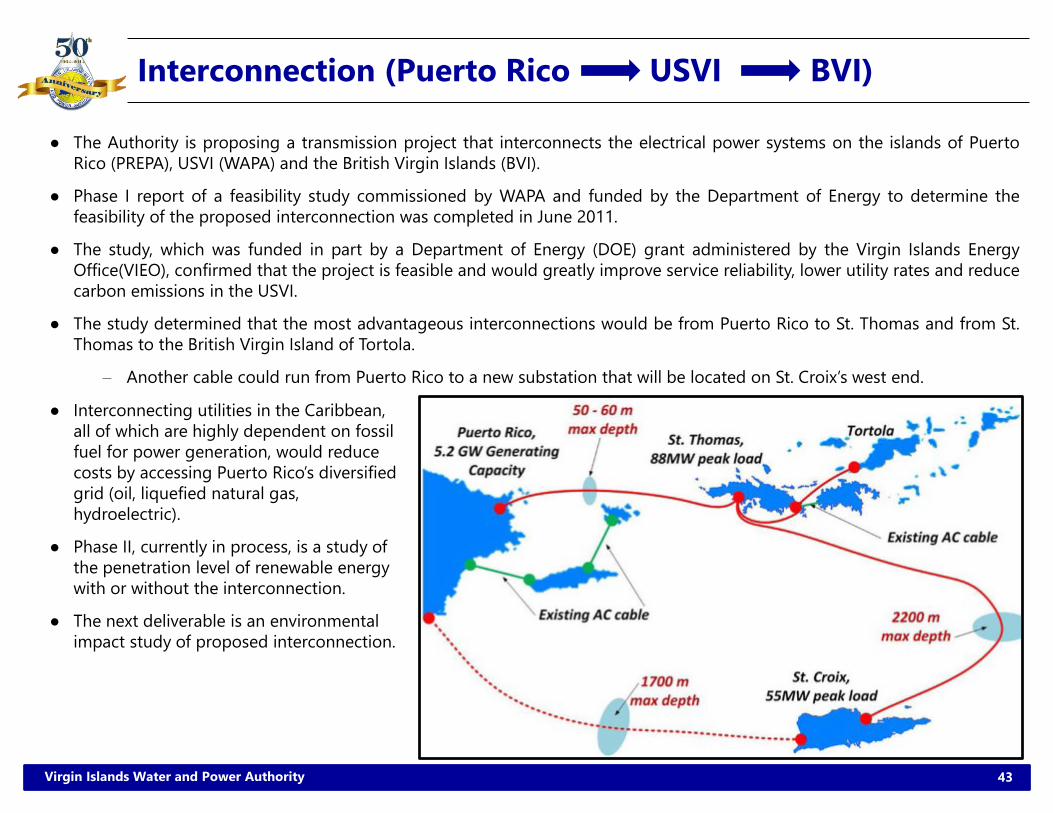
● The Authority is proposing a transmission project that interconnects the electrical power systems on the islands of PuertoRico (PREPA), USVI (WAPA) and the British Virgin Islands (BVI).
● Phase I report of a feasibility study commissioned by WAPA and funded by the Department of Energy to determine thefeasibility of the proposed interconnection was completed in June 2011.
● The study, which was funded in part by a Department of Energy (DOE) grant administered by the Virgin Islands EnergyOffice(VIEO), confirmed that the project is feasible and would greatly improve service reliability, lower utility rates and reducecarbon emissions in the USVI.
● The study determined that the most advantageous interconnections would be from Puerto Rico to St. Thomas and from St.Thomas to the British Virgin Island of Tortola.
– Another cable could run from Puerto Rico to a new substation that will be located on St. Croix’s west end.
● Interconnecting utilities in the Caribbean, all of which are highly dependent on fossil fuel for power generation, would reduce costs by accessing Puerto Rico’s diversified grid (oil, liquefied natural gas, hydroelectric).
● Phase II, currently in process, is a study of the penetration level of renewable energy with or without the interconnection.
● The next deliverable is an environmental impact study of proposed interconnection.
44Virgin Islands Water and Power Authority
Other Alternative Energy Updates
Wind
● The Authority has completed the feasibility study through the VI Energy Office
● Currently negotiating a power purchase agreement for 7.5MW for the St.Thomas/St. John district
Liquefied Natural Gas
● Conversion to tri-fuel capability will allow the use of LNG once it becomesavailable in small markets
Section 6
Financial Review
46Virgin Islands Water and Power Authority
Residential34.2%
Commercial17.7%
Large Power32.6%
Primary Service12.8%Streetlights
0.2%
Dept. of Finance
2.5%
Total Customers
Elec
tric
ity S
ales
(MW
h)
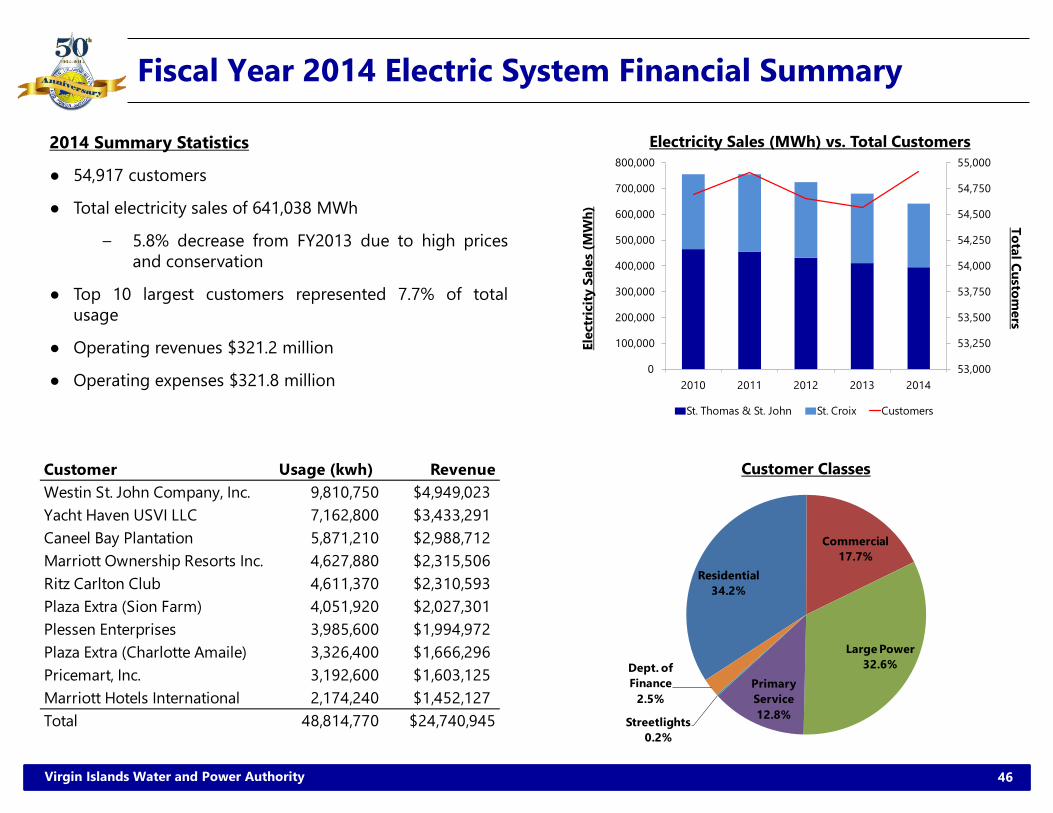
Fiscal Year 2014 Electric System Financial Summary
2014 Summary Statistics
● 54,917 customers
● Total electricity sales of 641,038 MWh
– 5.8% decrease from FY2013 due to high pricesand conservation
● Top 10 largest customers represented 7.7% of totalusage
● Operating revenues $321.2 million
● Operating expenses $321.8 million
Electricity Sales (MWh) vs. Total Customers
Customer Classes
53,000
53,250
53,500
53,750
54,000
54,250
54,500
54,750
55,000
0
100,000
200,000
300,000
400,000
500,000
600,000
700,000
800,000
2010 2011 2012 2013 2014
St. Thomas & St. John St. Croix Customers
Customer Usage (kwh) RevenueWestin St. John Company, Inc. 9,810,750 $4,949,023Yacht Haven USVI LLC 7,162,800 $3,433,291Caneel Bay Plantation 5,871,210 $2,988,712Marriott Ownership Resorts Inc. 4,627,880 $2,315,506Ritz Carlton Club 4,611,370 $2,310,593Plaza Extra (Sion Farm) 4,051,920 $2,027,301Plessen Enterprises 3,985,600 $1,994,972Plaza Extra (Charlotte Amaile) 3,326,400 $1,666,296Pricemart, Inc. 3,192,600 $1,603,125Marriott Hotels International 2,174,240 $1,452,127Total 48,814,770 $24,740,945
47Virgin Islands Water and Power Authority
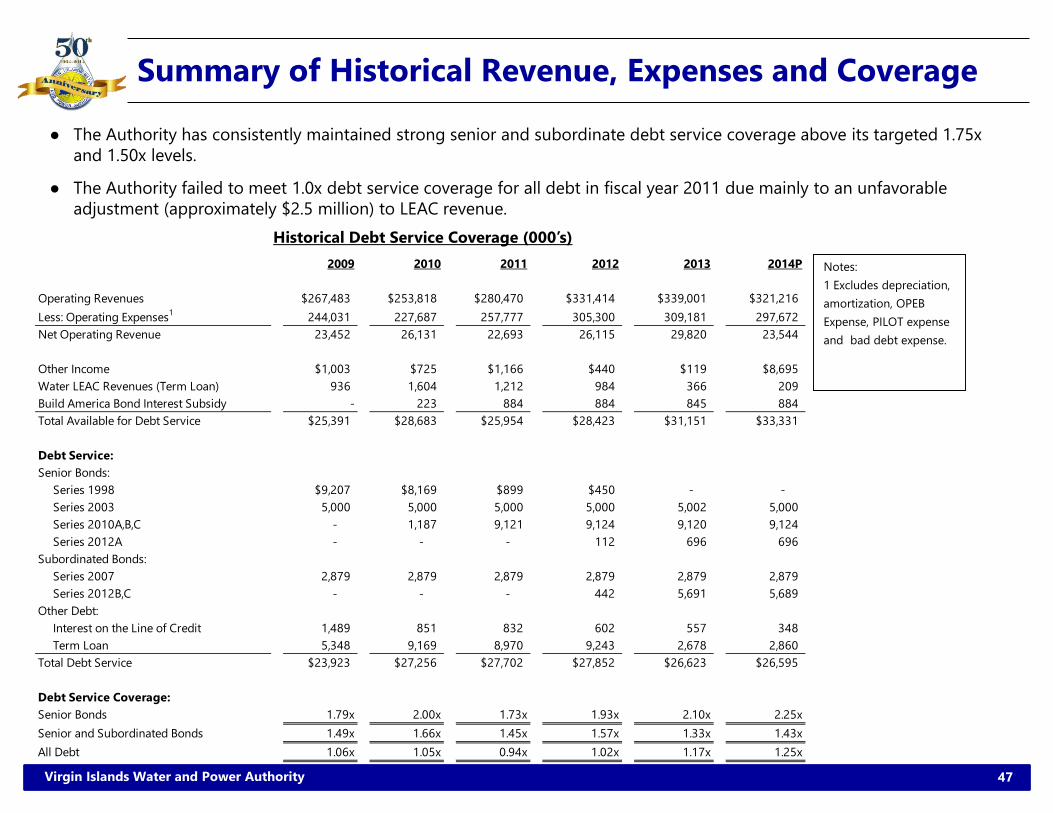
● The Authority has consistently maintained strong senior and subordinate debt service coverage above its targeted 1.75x and 1.50x levels.
● The Authority failed to meet 1.0x debt service coverage for all debt in fiscal year 2011 due mainly to an unfavorable adjustment (approximately $2.5 million) to LEAC revenue.
Summary of Historical Revenue, Expenses and Coverage
Notes:1 Excludes depreciation,amortization, OPEB Expense, PILOT expense and bad debt expense.
Historical Debt Service Coverage (000’s)2009 2010 2011 2012 2013 2014P
Operating Revenues $267,483 $253,818 $280,470 $331,414 $339,001 $321,216Less: Operating Expenses1 244,031 227,687 257,777 305,300 309,181 297,672Net Operating Revenue 23,452 26,131 22,693 26,115 29,820 23,544
Other Income $1,003 $725 $1,166 $440 $119 $8,695Water LEAC Revenues (Term Loan) 936 1,604 1,212 984 366 209Build America Bond Interest Subsidy - 223 884 884 845 884Total Available for Debt Service $25,391 $28,683 $25,954 $28,423 $31,151 $33,331
Debt Service:Senior Bonds: Series 1998 $9,207 $8,169 $899 $450 - - Series 2003 5,000 5,000 5,000 5,000 5,002 5,000 Series 2010A,B,C - 1,187 9,121 9,124 9,120 9,124 Series 2012A - - - 112 696 696Subordinated Bonds: Series 2007 2,879 2,879 2,879 2,879 2,879 2,879 Series 2012B,C - - - 442 5,691 5,689Other Debt: Interest on the Line of Credit 1,489 851 832 602 557 348 Term Loan 5,348 9,169 8,970 9,243 2,678 2,860Total Debt Service $23,923 $27,256 $27,702 $27,852 $26,623 $26,595
Debt Service Coverage:Senior Bonds 1.79x 2.00x 1.73x 1.93x 2.10x 2.25xSenior and Subordinated Bonds 1.49x 1.66x 1.45x 1.57x 1.33x 1.43xAll Debt 1.06x 1.05x 0.94x 1.02x 1.17x 1.25x

48Virgin Islands Water and Power Authority
Liquidity Position
● The Authority has gradually improved its liquidity position since 2010.
– Series 2012C bond proceeds were used to repay:
Working capital lines of credit (which were fully drawn for several years)
Overdraft line of credit
Fuel hedge line of credit
● The Authority has renewed and extended its working capital and capital lines of credit with Banco Popular and FirstBank.
● The Authority currently is averaging 19 days cash on hand vs 3-4 for the last several years.
– The goal is to get to 30 days cash on hand
Summary of Available Liquidity ($000’s)
(Preliminary) (Preliminary)6/30/2010 6/30/2011 6/30/2012 6/30/2013 6/30/2014 10/31/2014
Cash $4,115 $8,441 $9,674 $9,112 $10,826 $10,377Working Capital Line of Credit 0 0 8,000 8,000 2,000 2,000Overdraft Line of Credit 6,214 5,155 7,323 5,108 4,987 3,458Total Available Liquidity $10,329 $13,596 $24,997 $22,220 $17,813 $15,835
49Virgin Islands Water and Power Authority
1 Total deferred fuel figures include the Term Loan
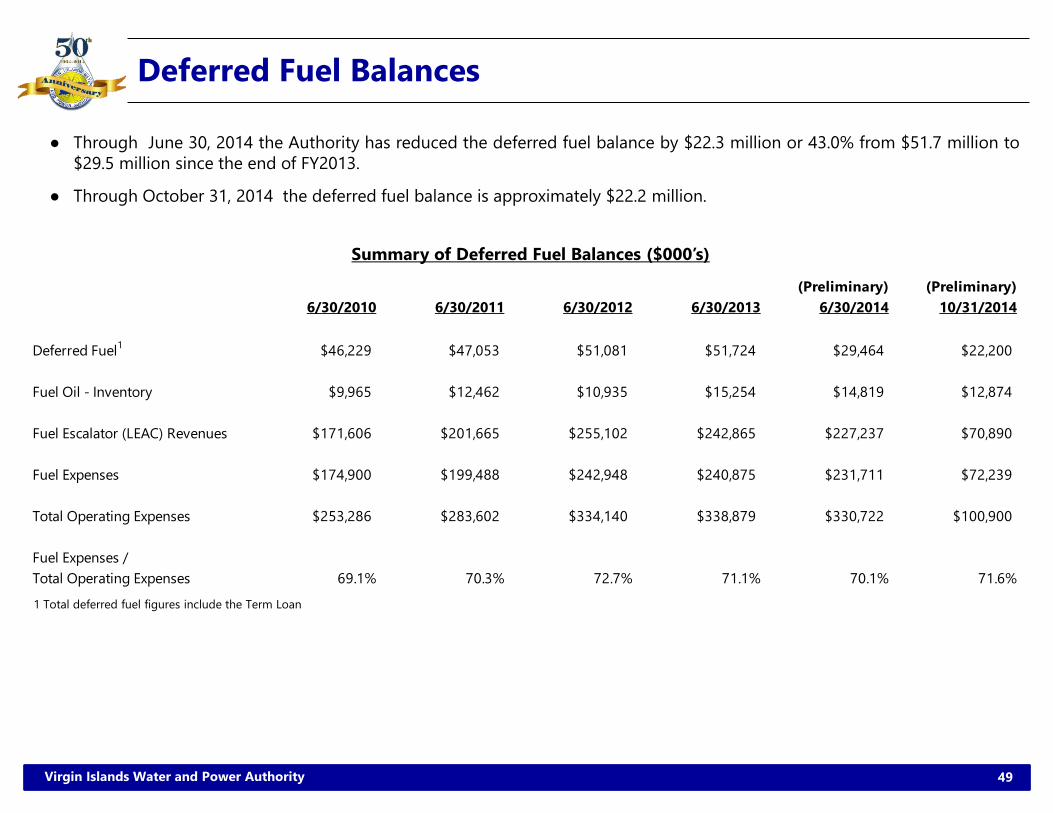
Deferred Fuel Balances
● Through June 30, 2014 the Authority has reduced the deferred fuel balance by $22.3 million or 43.0% from $51.7 million to$29.5 million since the end of FY2013.
● Through October 31, 2014 the deferred fuel balance is approximately $22.2 million.
Summary of Deferred Fuel Balances ($000’s)
(Preliminary) (Preliminary)6/30/2010 6/30/2011 6/30/2012 6/30/2013 6/30/2014 10/31/2014
Deferred Fuel1 $46,229 $47,053 $51,081 $51,724 $29,464 $22,200
Fuel Oil - Inventory $9,965 $12,462 $10,935 $15,254 $14,819 $12,874
Fuel Escalator (LEAC) Revenues $171,606 $201,665 $255,102 $242,865 $227,237 $70,890
Fuel Expenses $174,900 $199,488 $242,948 $240,875 $231,711 $72,239
Total Operating Expenses $253,286 $283,602 $334,140 $338,879 $330,722 $100,900
Fuel Expenses / Total Operating Expenses 69.1% 70.3% 72.7% 71.1% 70.1% 71.6%

50Virgin Islands Water and Power Authority
Accounts Receivables
● As of October 31, 2014, the Government receivables were $34.3 million.
– The largest components were street lighting ($13.4 million), Juan Luis Hospital ($8.4 million) and SchneiderHospital ($3.5 million)
● On July 16, 2014 the Senate approved a $50 million borrowing for the USVI Government of which $12 million wasused to pay a portion of the Government’s receivables ($5.25 million for each hospital and $1.5 million for theBureau of Corrections)
Summary of Accounts Receivables ($000’s)(Preliminary) (Preliminary)
6/30/2010 6/30/2011 6/30/2012 6/30/2013 6/30/2014 10/31/2014
Customer Receivables - St. Croix $5,109 $5,575 $5,134 $5,841 $5,279 $3,702 - St. Thomas 6,414 5,628 6,862 7,754 7,866 8,665Total $11,523 $11,203 $11,996 $13,595 $13,145 $12,367
Major VI Public Sector Receivables:Streetlights $8,742 $9,970 $6,079 $9,338 $9,990 $13,416Juan Luis Hospital 1,777 3,416 5,755 7,166 12,052 8,412Schneider Hospital 406 548 786 2,549 6,947 3,528Subtotal $10,924 $13,934 $12,620 $19,053 $28,988 $25,356
Total VI Public Sector Receivables $14,829 $19,130 $13,441 $25,459 $35,742 $34,318
Total Receivables $39,573 $43,539 $42,194 $52,159 $58,716 $55,365
VI Public Sector Receivables % of total 37.5% 43.9% 31.9% 48.8% 60.9% 62.0%

51Virgin Islands Water and Power Authority
Summary of Current Customer Electric ChargesCurrent Price: $0.391928/kWh
Base Rate $0.073599/kWh (18.8%)● Funds the cost of producing and delivering electricity plus investment in the power plants and facilities.
- Labor Expense $0.056702/kWh (14.5%)- Administrative Costs, Debt Service etc. $0.016897/kWh (4.3%)
Fuel Charge / LEAC: $0.279991/kWh (71.4%)● The cost of fuel consumption collected from customers and paid directly to the fuel supplier.
Line Loss Surcharge $0.002196/kWh (0.6%)● Funds projects geared towards reducing line loss.
Self Insurance Surcharge $0.001925/kWh (0.5%)● Funds the self insurance fund.
OPEB Surcharge $0.008668/kWh (2.2%)● Provides funds to cover the OPEB accrued liability.
Maintenance Surcharge $0.024863/kWh (6.3%)● Funds maintenance projects.
PILOT Surcharge $0.000686/kWh (0.2%)● Payment in Lieu of Taxes to VI Government

52Virgin Islands Water and Power Authority
Detailed Summary of Fuel Charge / LEAC
Fuel Charge / LEAC: $0.279991/kWh (71.4%)
● Fuel $0.209719/kWh (53.5%)
− Projected cost of fuel over the 3-month period
● LPG Infrastructure and O&M Fee $0.025123/kWh (6.4%)
● Finance / Regulatory Costs $0.005082/kWh (1.3%)
− Principal and interest on the Term Loan
− PILOT (credit) for any previous period of over collection
− PSC charges passed on to customers for LEAC related matters
− Working Capital Line of credit interest for fuel related expenses
● Renewble Energy Cost $0.003708/kWh (0.8%)
● UltraPure /RO Charge $0.003364/kWh (0.9%)
− Operating costs associated with RO production
● Rate Financing Mechanism $0.018000/kWh (4.6%)
− Operating costs of the leased emergency GE units and funds to serviceexisting units
● Under-recovery / Deferred Fuel $0.014995/kWh (3.8%)
− Amounts paid for fuel but not yet collected from customers
Note: Percentages are based on overall total electric price of $391928/kWh
53Virgin Islands Water and Power Authority
Residential (mg)
18.7%
Commercial (mg)
21.3%V.I. Gov't (mg)
18.8%
Incentive (mg)
14.8%
Other Gov't (mg)
25.9%
Standpipe 0.5%
Total CustomersW
ater
Sal
es (m
g)
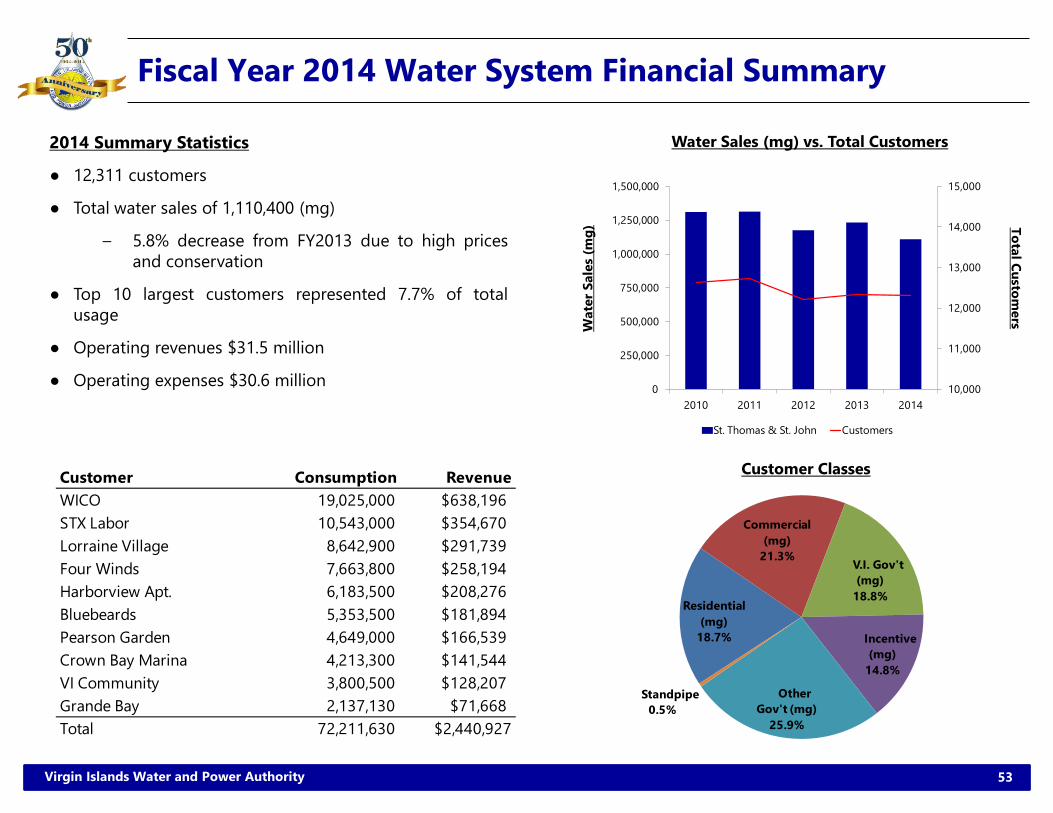
Fiscal Year 2014 Water System Financial Summary
2014 Summary Statistics
● 12,311 customers
● Total water sales of 1,110,400 (mg)
– 5.8% decrease from FY2013 due to high pricesand conservation
● Top 10 largest customers represented 7.7% of totalusage
● Operating revenues $31.5 million
● Operating expenses $30.6 million
Water Sales (mg) vs. Total Customers
Customer Classes
10,000
11,000
12,000
13,000
14,000
15,000
0
250,000
500,000
750,000
1,000,000
1,250,000
1,500,000
2010 2011 2012 2013 2014
St. Thomas & St. John Customers
Customer Consumption RevenueWICO 19,025,000 $638,196STX Labor 10,543,000 $354,670Lorraine Village 8,642,900 $291,739Four Winds 7,663,800 $258,194Harborview Apt. 6,183,500 $208,276Bluebeards 5,353,500 $181,894Pearson Garden 4,649,000 $166,539Crown Bay Marina 4,213,300 $141,544VI Community 3,800,500 $128,207Grande Bay 2,137,130 $71,668Total 72,211,630 $2,440,927
54Virgin Islands Water and Power Authority
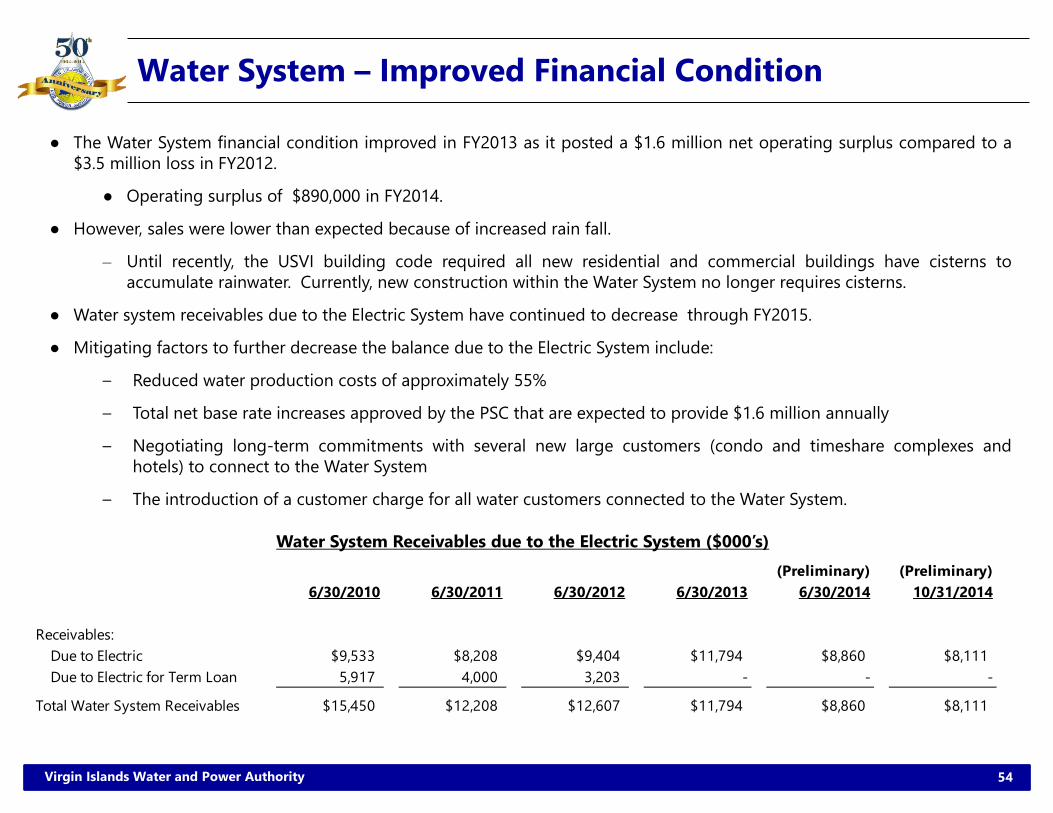
Water System – Improved Financial Condition
● The Water System financial condition improved in FY2013 as it posted a $1.6 million net operating surplus compared to a$3.5 million loss in FY2012.
● Operating surplus of $890,000 in FY2014.
● However, sales were lower than expected because of increased rain fall.
– Until recently, the USVI building code required all new residential and commercial buildings have cisterns toaccumulate rainwater. Currently, new construction within the Water System no longer requires cisterns.
● Water system receivables due to the Electric System have continued to decrease through FY2015.
● Mitigating factors to further decrease the balance due to the Electric System include:
– Reduced water production costs of approximately 55%
– Total net base rate increases approved by the PSC that are expected to provide $1.6 million annually
– Negotiating long-term commitments with several new large customers (condo and timeshare complexes andhotels) to connect to the Water System
– The introduction of a customer charge for all water customers connected to the Water System.
Water System Receivables due to the Electric System ($000’s)(Preliminary) (Preliminary)
6/30/2010 6/30/2011 6/30/2012 6/30/2013 6/30/2014 10/31/2014
Receivables: Due to Electric $9,533 $8,208 $9,404 $11,794 $8,860 $8,111 Due to Electric for Term Loan 5,917 4,000 3,203 - - -
Total Water System Receivables $15,450 $12,208 $12,607 $11,794 $8,860 $8,111
55Virgin Islands Water and Power Authority
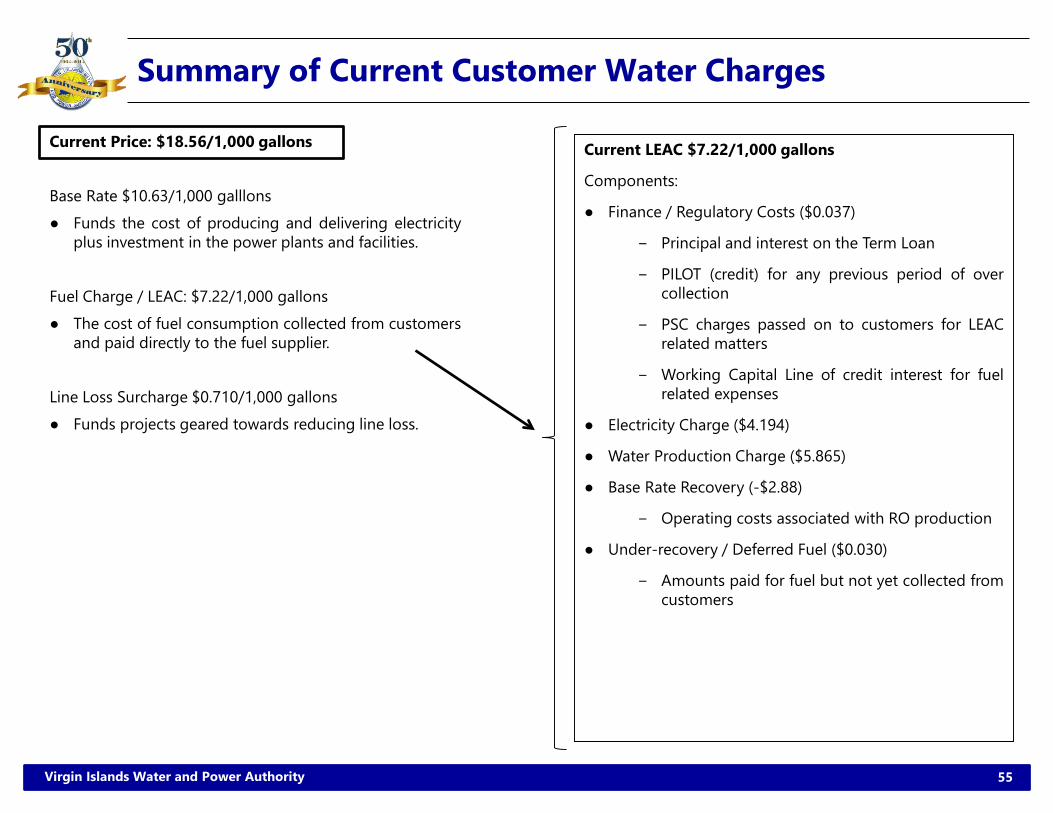
Summary of Current Customer Water Charges
Current Price: $18.56/1,000 gallons
Base Rate $10.63/1,000 galllons● Funds the cost of producing and delivering electricity
plus investment in the power plants and facilities.
Fuel Charge / LEAC: $7.22/1,000 gallons● The cost of fuel consumption collected from customers
and paid directly to the fuel supplier.
Line Loss Surcharge $0.710/1,000 gallons● Funds projects geared towards reducing line loss.
Current LEAC $7.22/1,000 gallons
Components:
● Finance / Regulatory Costs ($0.037)
− Principal and interest on the Term Loan
− PILOT (credit) for any previous period of overcollection
− PSC charges passed on to customers for LEACrelated matters
− Working Capital Line of credit interest for fuelrelated expenses
● Electricity Charge ($4.194)
● Water Production Charge ($5.865)
● Base Rate Recovery (-$2.88)
− Operating costs associated with RO production
● Under-recovery / Deferred Fuel ($0.030)
− Amounts paid for fuel but not yet collected fromcustomers

Section 7
Summary of Electric System Debt Outstanding
57Virgin Islands Water and Power Authority
$0
$5,000,000
$10,000,000
$15,000,000
$20,000,000
$25,000,000Senior Subordinate
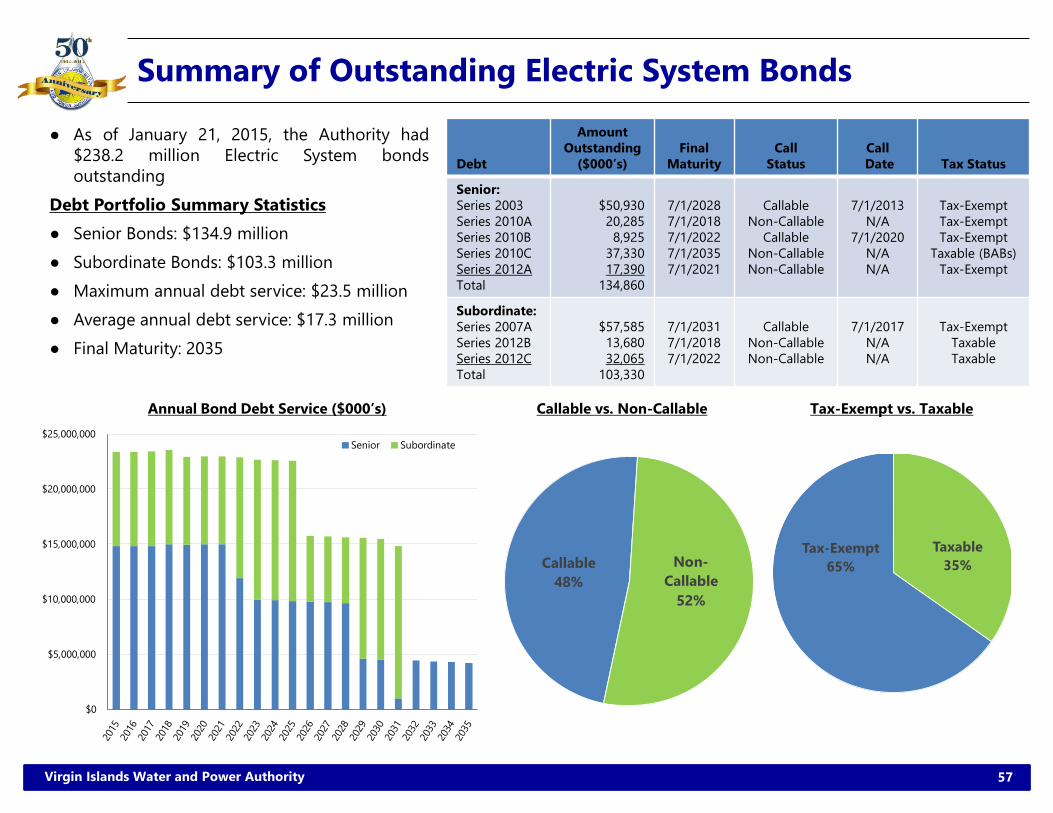
Summary of Outstanding Electric System Bonds
Debt
AmountOutstanding
($000’s)Final
MaturityCall
StatusCallDate Tax Status
Senior:Series 2003Series 2010ASeries 2010BSeries 2010C Series 2012ATotal
$50,93020,2858,925
37,33017,390
134,860
7/1/20287/1/20187/1/20227/1/20357/1/2021
CallableNon-Callable
CallableNon-CallableNon-Callable
7/1/2013N/A
7/1/2020N/AN/A
Tax-ExemptTax-ExemptTax-Exempt
Taxable (BABs)Tax-Exempt
Subordinate:Series 2007ASeries 2012BSeries 2012CTotal
$57,58513,68032,065
103,330
7/1/20317/1/20187/1/2022
CallableNon-CallableNon-Callable
7/1/2017N/AN/A
Tax-ExemptTaxableTaxable
● As of January 21, 2015, the Authority had$238.2 million Electric System bondsoutstanding
Debt Portfolio Summary Statistics● Senior Bonds: $134.9 million● Subordinate Bonds: $103.3 million● Maximum annual debt service: $23.5 million● Average annual debt service: $17.3 million● Final Maturity: 2035
Annual Bond Debt Service ($000’s) Callable vs. Non-Callable Tax-Exempt vs. Taxable
Tax-Exempt65%
Taxable35%Callable
48%Non-
Callable52%
58Virgin Islands Water and Power Authority
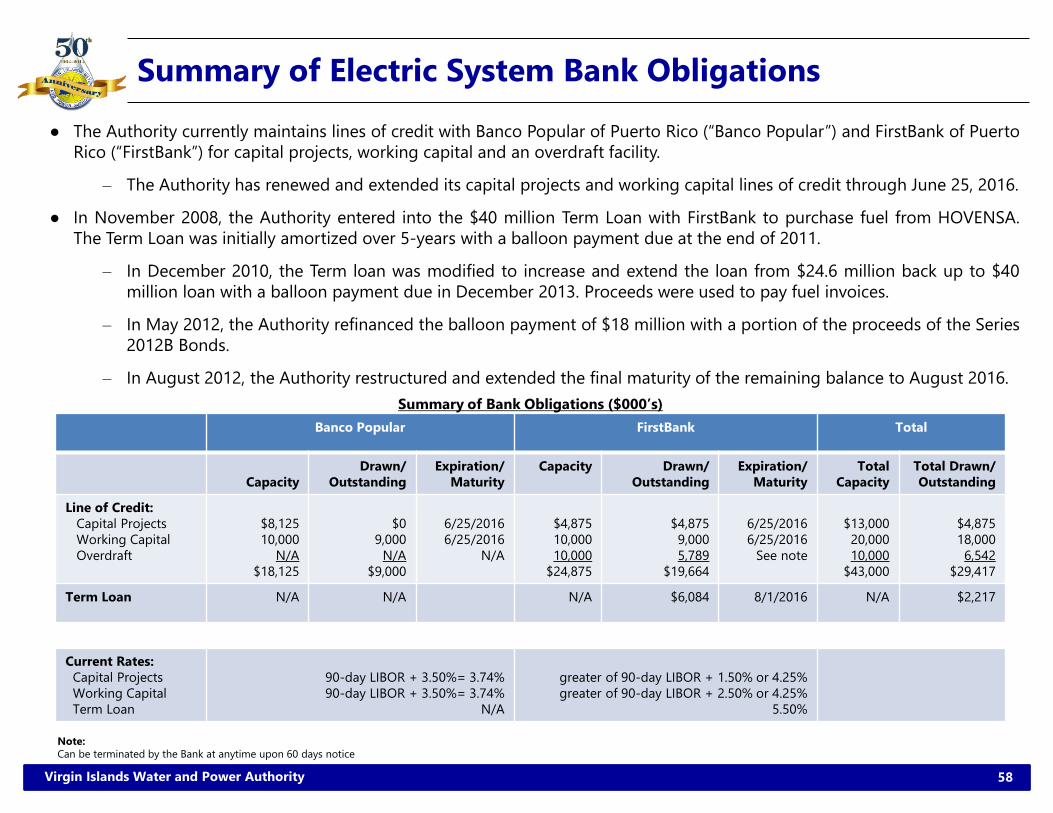
● The Authority currently maintains lines of credit with Banco Popular of Puerto Rico (“Banco Popular”) and FirstBank of PuertoRico (“FirstBank”) for capital projects, working capital and an overdraft facility.
– The Authority has renewed and extended its capital projects and working capital lines of credit through June 25, 2016.
● In November 2008, the Authority entered into the $40 million Term Loan with FirstBank to purchase fuel from HOVENSA.The Term Loan was initially amortized over 5-years with a balloon payment due at the end of 2011.
– In December 2010, the Term loan was modified to increase and extend the loan from $24.6 million back up to $40million loan with a balloon payment due in December 2013. Proceeds were used to pay fuel invoices.
– In May 2012, the Authority refinanced the balloon payment of $18 million with a portion of the proceeds of the Series2012B Bonds.
– In August 2012, the Authority restructured and extended the final maturity of the remaining balance to August 2016.
Banco Popular FirstBank Total
CapacityDrawn/
OutstandingExpiration/
MaturityCapacity Drawn/
OutstandingExpiration/
MaturityTotal
CapacityTotal Drawn/Outstanding
Line of Credit:Capital ProjectsWorking CapitalOverdraft
$8,12510,000
N/A$18,125
$09,000
N/A$9,000
6/25/20166/25/2016
N/A
$4,87510,00010,000
$24,875
$4,8759,0005,789
$19,664
6/25/20166/25/2016
See note
$13,00020,00010,000
$43,000
$4,87518,0006,542
$29,417
Term Loan N/A N/A N/A $6,084 8/1/2016 N/A $2,217
Current Rates:Capital Projects Working CapitalTerm Loan
90-day LIBOR + 3.50%= 3.74%90-day LIBOR + 3.50%= 3.74%
N/A
greater of 90-day LIBOR + 1.50% or 4.25%greater of 90-day LIBOR + 2.50% or 4.25%
5.50%
Summary of Bank Obligations ($000’s)
Note:Can be terminated by the Bank at anytime upon 60 days notice
Summary of Electric System Bank Obligations
59Virgin Islands Water and Power Authority
Tax-Exempt100%
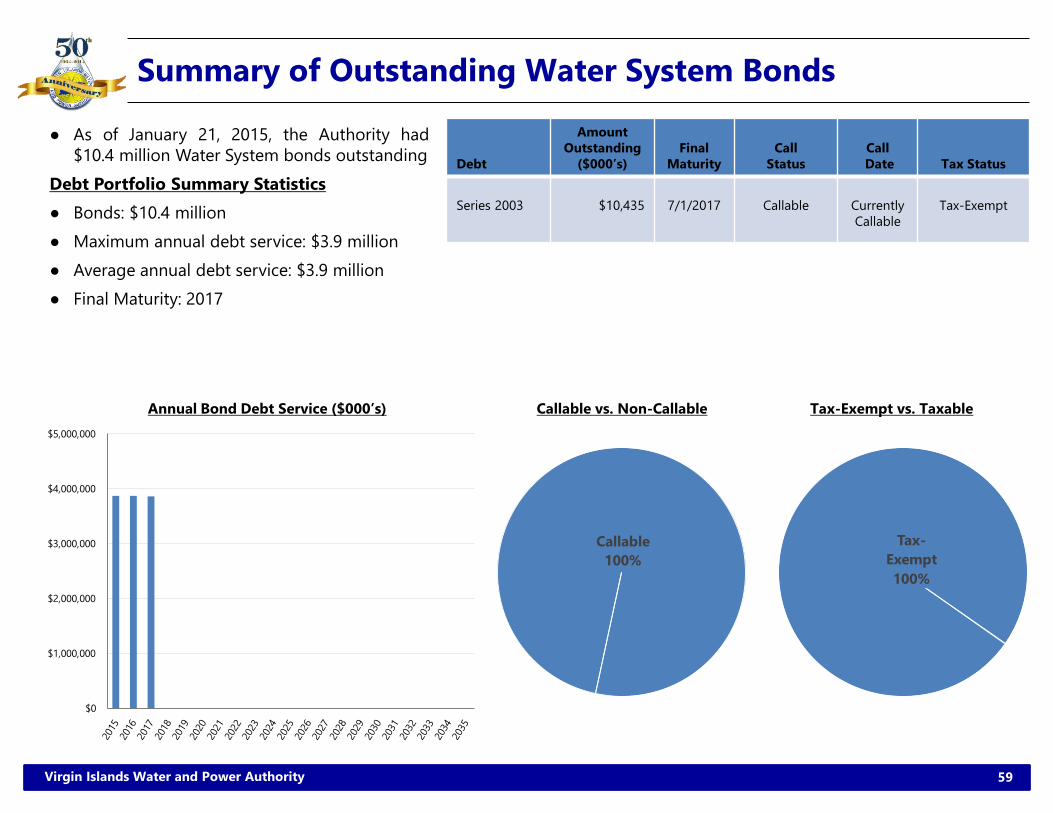
Summary of Outstanding Water System Bonds
Debt
AmountOutstanding
($000’s)Final
MaturityCall
StatusCallDate Tax Status
Series 2003 $10,435 7/1/2017 Callable CurrentlyCallable
Tax-Exempt
● As of January 21, 2015, the Authority had$10.4 million Water System bonds outstanding
Debt Portfolio Summary Statistics● Bonds: $10.4 million● Maximum annual debt service: $3.9 million● Average annual debt service: $3.9 million● Final Maturity: 2017
Annual Bond Debt Service ($000’s) Callable vs. Non-Callable Tax-Exempt vs. Taxable
$0
$1,000,000
$2,000,000
$3,000,000
$4,000,000
$5,000,000
Callable 100%

60Virgin Islands Water and Power Authority
Electric System Debt Service Fund
Electric System Debt Service Reserve Fund
Electric System Subordinated Debt Fund
Electric System Rebate Fund
Electric System Revenue Fund
Electric System General Fund
Water SystemRevenue Bond Debt Service
Senior Lien Resolution Flow of Funds
Operating Expenses (Monthly)
Subordinated Bond Debt Service Fund
Subordinated Bond Debt Service Reserve Fund
Subordinate Lien Resolution Flow of Funds
Line of CreditTerm Loan
Flow of Funds
61Virgin Islands Water and Power Authority
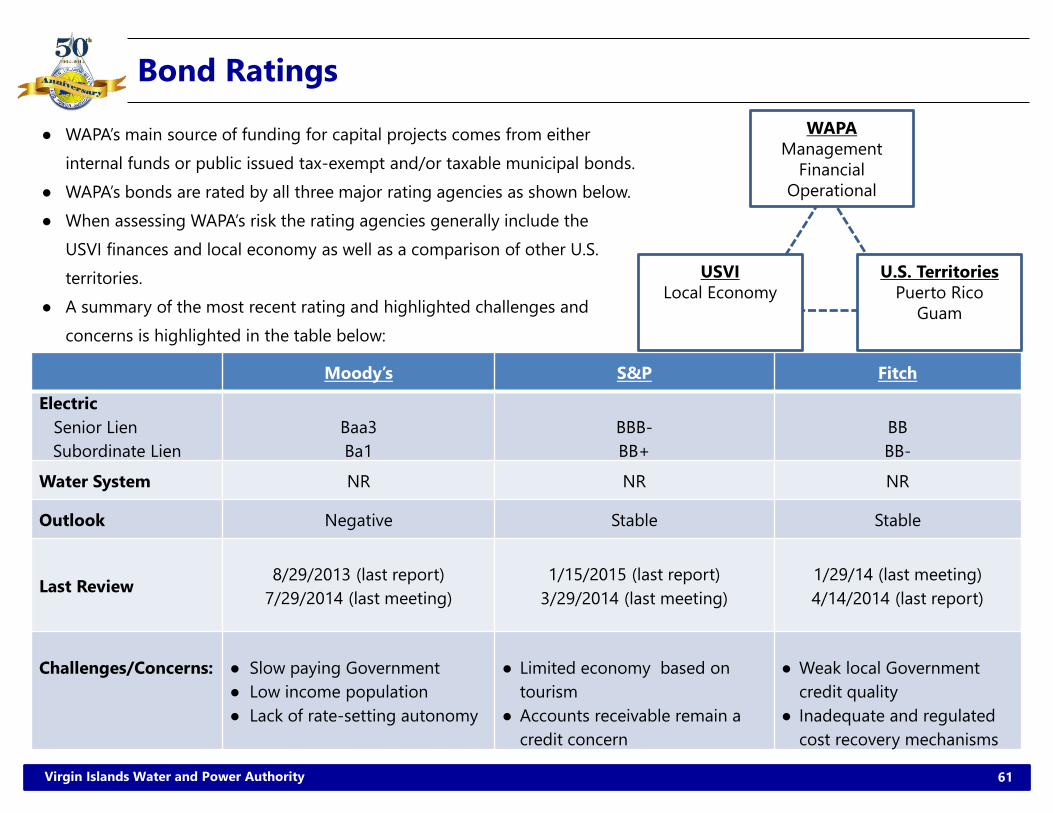
Bond Ratings
● WAPA’s main source of funding for capital projects comes from eitherinternal funds or public issued tax-exempt and/or taxable municipal bonds.
● WAPA’s bonds are rated by all three major rating agencies as shown below.● When assessing WAPA’s risk the rating agencies generally include the
USVI finances and local economy as well as a comparison of other U.S.territories.
● A summary of the most recent rating and highlighted challenges andconcerns is highlighted in the table below:
Moody’s S&P Fitch
Electric Senior LienSubordinate Lien
Baa3Ba1
BBB-BB+
BB BB-
Water System NR NR NR
Outlook Negative Stable Stable
Last Review 8/29/2013 (last report)7/29/2014 (last meeting)
1/15/2015 (last report)3/29/2014 (last meeting)
1/29/14 (last meeting)4/14/2014 (last report)
Challenges/Concerns: ● Slow paying Government● Low income population ● Lack of rate-setting autonomy
● Limited economy based on tourism
● Accounts receivable remain a credit concern
● Weak local Government credit quality
● Inadequate and regulated cost recovery mechanisms
WAPAManagement
Financial Operational
USVILocal Economy
U.S. TerritoriesPuerto Rico
Guam
Section 8
Recent Accomplishments & Goals and Forward Outlook
63Virgin Islands Water and Power Authority
Recent Achievements and Near Term Goals● The Authority’s primary objectives:
1. Restore internal liquidity Electric System full base rate increase case approved effective November 2013 and expected to provide $15.7 million
annually which includes new surcharges to cover OPEB, maintenance and self-insurance Renewed and extended the working capital lines of credit through June 2016 Recover prior year’s deferred fuel balances; reduced by over $21 million in FY2014 Reduce Government accounts receivables; legislation approved to provide WAPA $12 million toward receivables
2. Improve efficiency and reliability Line loss reduced from 6.9% in 2010 to 6.2% in 2013 on St. Thomas and from 12.5% in 2010 to 8.0% in 2013 on St.
Croix Conversion of water production from desalination to reverse osmosis (RO) Mid-Island substation became operational in 4th quarter 2014 (funded by 2010 Bonds) Advanced Metering Infrastructure projected to be funded by the end of 2014 (Rural Utilities Service loan) Ongoing major overhauls and upgrades of existing units Conversion of seven generating units to tri-fuel (oil, liquefied petroleum gas and liquefied natural gas) underway
3. Improve disclosure 2013 audit completed within 180 days (December 30, 2013) Compliance with continuing disclosure requirements
4. Diversify Fuel Mix Renewable energy sources (solar, wind, biofuel) 4MW of solar completed and operational October 2014 with another
4.2MW to be completed and operational in 1st quarter 2015 Conversion to tri-fuel capability; liquefied petroleum gas (LPG) projected to be completed and operational by the end
of first quarter 2015 Interconnection (Puerto Rico – U.S. Virgin Islands – British Virgin Islands) under negotiation to access Puerto Rico’s
diversified grid (oil, liquefied natural gas, hydroelectric), seeking funding for the final environmental study5. Address Water System cash flow deficiencies
Water purchase agreements for RO complete Reduce operating costs to permit more efficient operation of electric generating facilities and less efficient
generating units required for desalination will be “mothballed” or retired Permanent plants completed in August 2013 (St. Thomas) and November 2013 (St. Croix)
Water System full base rate case increase approved and expected to provide $1.6 million
64Virgin Islands Water and Power Authority
Forward Outlook
● The Authority is well positioned moving forward due to :
‒ Efforts to diversify the Authority’s operating efficiency and the Territory’s fuel sources
Addition and modification heat recovery steam generators (HRSG)
Solar
LPG coming online in 1st quarter 2015
Biomass coming online in 2015
Interconnection with Puerto Rico and British Virgin Islands
● Strong governmental support federally and locally
‒ Collaborations with the DOE, DOI, VIEO
● Strengthened finances:
– Funding through fuel tax revenues specifically allocated to purchase and/or finance newer generating units andbase rate increases which will allow the Authority to continue to implement its capital improvement plan
– Specific surcharges that provide funding for maintenance and line loss
– A stronger Water System that will continue to reduce its liability to the Electric System and provide greateroperational flexibility with its generating units after the switch to RO