Prepared for: Indiana Department of Transportation Department of Transportation . In preparing this...
34
Tolling Feasibility Study In Accordance with Indiana House Enrolled Act No. 1002 October 31, 2017 Prepared by: HDR, Inc. Prepared for: Indiana Department of Transportation
Transcript of Prepared for: Indiana Department of Transportation Department of Transportation . In preparing this...

Tolling Feasibility Study In Accordance with Indiana House Enrolled Act No. 1002
October 31, 2017
Prepared by: HDR, Inc.
Prepared for: Indiana Department of Transportation
In preparing this report, HDR relied, in whole or in part, on data and information provided by INDOT and third parties, which information has not been independently verified by HDR and which HDR has assumed to be accurate, complete, reliable, and current. Therefore, while HDR has utilized its best efforts in preparing this report, HDR does not warrant or guarantee the conclusions set forth in it.
This report and its contents were prepared for the sole use of INDOT and the State of Indiana, and not for the benefit of any third party. Use of this report or any information contained herein, if by any party other than INDOT and the State of Indiana, shall be at the sole risk of such party.
October 2017 i
Table of Contents This report assesses the feasibility of potentially tolling Indiana's Interstates ......................................................... 1
The rationale for studying a statewide tolling program is to explore options for mitigating anticipated decreases in fuel tax revenue .................................................................................................................................. 2
This study reflects best practices in traffic projections, economic analysis, and risk analysis ................................. 3
This is a feasibility study, designed to inform discussions about the potential impacts of a statewide Interstate tolling program .......................................................................................................................................................... 5
The biggest risk associated with the revenue calculations is the accuracy of heavy truck projections ................... 6
There is an 85% chance toll revenue exceeds $39 billion from 2021 to 2050, and a 50% chance it exceeds $53 billion ................................................................................................................................................... 7
Optimal toll rates could vary by Interstate ................................................................................................................ 8
I-64 toll revenue potential ......................................................................................................................................... 9
I-65 toll revenue potential ....................................................................................................................................... 11
I-69 toll revenue potential ....................................................................................................................................... 13
I-70 toll revenue potential ....................................................................................................................................... 15
I-74 toll revenue potential ....................................................................................................................................... 17
I-94 toll revenue potential ....................................................................................................................................... 19
ii
More than half of heavy truck traffic on Indiana's highways begins and ends in other states ............................... 21
The toll revenues presented in this report do not account for the costs of toll collections or insurance ................ 22
Economic impacts of a potential statewide tolling program ................................................................................... 23
It is important to consider implementation issues when assessing the feasibility of a potential statewide tolling program .................................................................................................................................................................. 24
Federal regulations allow Indiana to toll its Interstates .......................................................................................... 25
Federal regulations provide flexibility regarding toll discounts for local, commuter, and in-state travel ................. 26
Indiana has the ability to enter into monetization agreements or long-term contracts for tolling facilities, and has already done so ........................................................................................................................................ 27
Indiana could use its existing programs to encourage women-owned and minority-owned business enterprises to participate in a statewide tolling program ........................................................................................ 28
Geographic preferences are not permitted for federally-funded projects. However, market forces drive the use of Indiana workers and products for INDOT projects ................................................................................ 29
Overall feasibility of a statewide Interstate tolling program .................................................................................... 30
October 2017 1
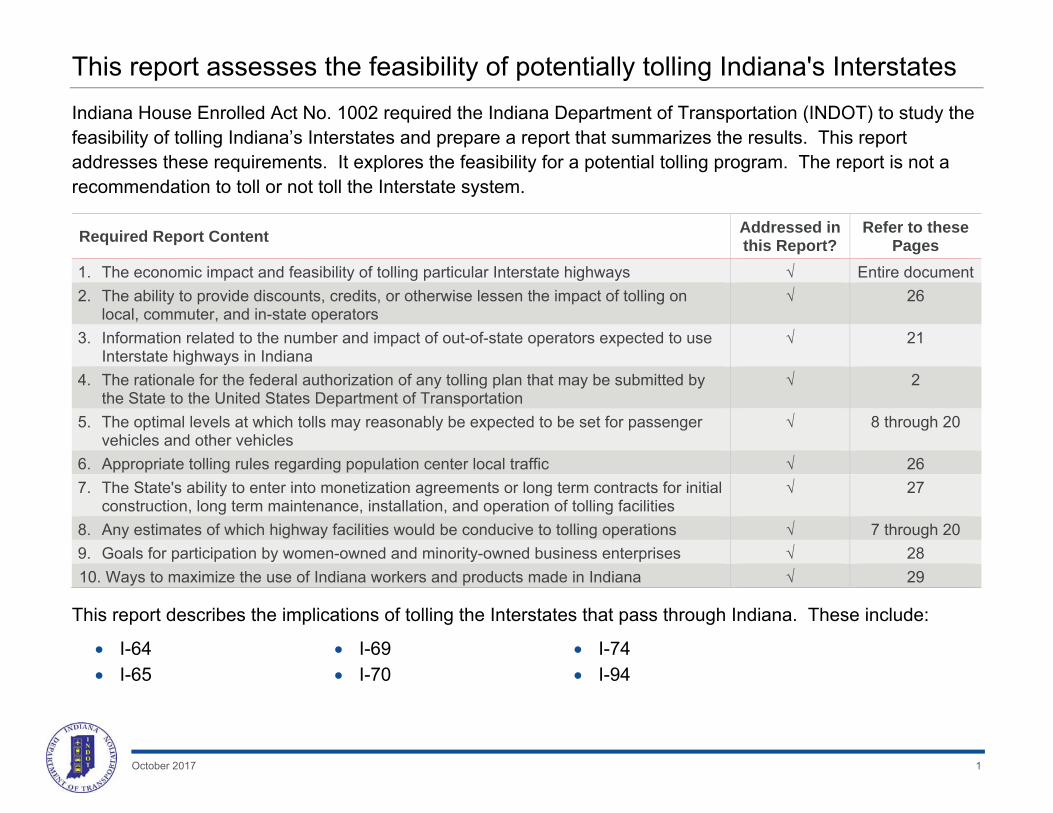
This report assesses the feasibility of potentially tolling Indiana's Interstates Indiana House Enrolled Act No. 1002 required the Indiana Department of Transportation (INDOT) to study the feasibility of tolling Indiana’s Interstates and prepare a report that summarizes the results. This report addresses these requirements. It explores the feasibility for a potential tolling program. The report is not a recommendation to toll or not toll the Interstate system.
Required Report Content Addressed in this Report?
Refer to these Pages
1. The economic impact and feasibility of tolling particular Interstate highways √ Entire document 2. The ability to provide discounts, credits, or otherwise lessen the impact of tolling on
local, commuter, and in-state operators √ 26
3. Information related to the number and impact of out-of-state operators expected to use Interstate highways in Indiana
√ 21
4. The rationale for the federal authorization of any tolling plan that may be submitted by the State to the United States Department of Transportation
√ 2
5. The optimal levels at which tolls may reasonably be expected to be set for passenger vehicles and other vehicles
√ 8 through 20
6. Appropriate tolling rules regarding population center local traffic √ 26 7. The State's ability to enter into monetization agreements or long term contracts for initial
construction, long term maintenance, installation, and operation of tolling facilities √ 27
8. Any estimates of which highway facilities would be conducive to tolling operations √ 7 through 20 9. Goals for participation by women-owned and minority-owned business enterprises √ 28 10. Ways to maximize the use of Indiana workers and products made in Indiana √ 29
This report describes the implications of tolling the Interstates that pass through Indiana. These include:
I-64 I-65
I-69 I-70
I-74 I-94

2
The rationale for studying a statewide tolling program is to explore options for mitigating anticipated decreases in fuel tax revenue
House Enrolled Act No. 1002 created a fuel tax structure that provides stable funding for Indiana’s roads and bridges. However, INDOT expects that fuel tax revenue will become less stable over time as fuel efficiency improves.
Vehicle manufacturers have made significant strides in improving fuel efficiency. This trend is expected to continue. While advances in fuel efficiency are good for consumers, they have a negative impact on road funding. As fuel consumption decreases, road funding derived from fuel taxes also decreases. INDOT’s 2015 funding study illustrated how improved fuel efficiencies will eventually make it difficult to adequately maintain the state’s roadways.1
While fuel consumption is expected to decrease, traffic on Indiana’s roadways is expected to increase.
A potential statewide tolling program could help Indiana prepare for the expected decrease in fuel consumption by tying transportation funding to the amount of travel on Indiana’s highways. An Interstate tolling program would enable Indiana to focus on the portion of the highway system that is the most heavily travelled and the most expensive to maintain. Tolling the Interstate system would also enable Indiana to capture revenue from the thousands of vehicles that pass through the state every day. While these vehicles may not pay any fuel taxes as they pass through, they cause a significant amount of wear and tear on Indiana’s roads and bridges.
1 INDOT, Study of Indiana Transportation Infrastructure Funding Mechanisms, October 2015.

3
This study reflects best practices in traffic projections, economic analysis, and risk analysis
Following is a list of key factors and assumptions used throughout this document:
INDOT has developed state-of-the-art traffic and economic models, and works continually to enhance them. This report takes advantage of INDOT’s models as they existed in June of 2017.
All financial figures are presented in constant 2017 dollars. The results have not been adjusted to reflect future year dollars.
The study team analyzed 5 toll rate scenarios. Each scenario included separate toll rates for passenger vehicles, medium trucks, and heavy trucks. The revenue projections and potential toll rates could be further refined by analyzing additional toll rate scenarios.
Toll rates reflect a constant cost per mile that increases each year by inflation. The rates were applied consistently to all vehicles within each of the three vehicle types regardless of origin or destination.
INDOT modeled the traffic volumes at the statewide level for each toll rate scenario. For example, one of the scenarios assumes a toll rate for passenger vehicles of $0.04 per mile. When INDOT analyzed this scenario, it applied this toll rate to all 6 interstates included in the study. The project team then analyzed the results for each Interstate separately.
The analysis assumes electronic toll collection so vehicles do not have to stop or slow down to pay tolls. It also assumes that the bulk of vehicles will have a toll transponder tied to an electronic account. Drivers without a transponder would pay an additional $2 surcharge to cover the cost of toll collection via mail. All results shown in this report include direct toll revenue and surcharge revenue.
4
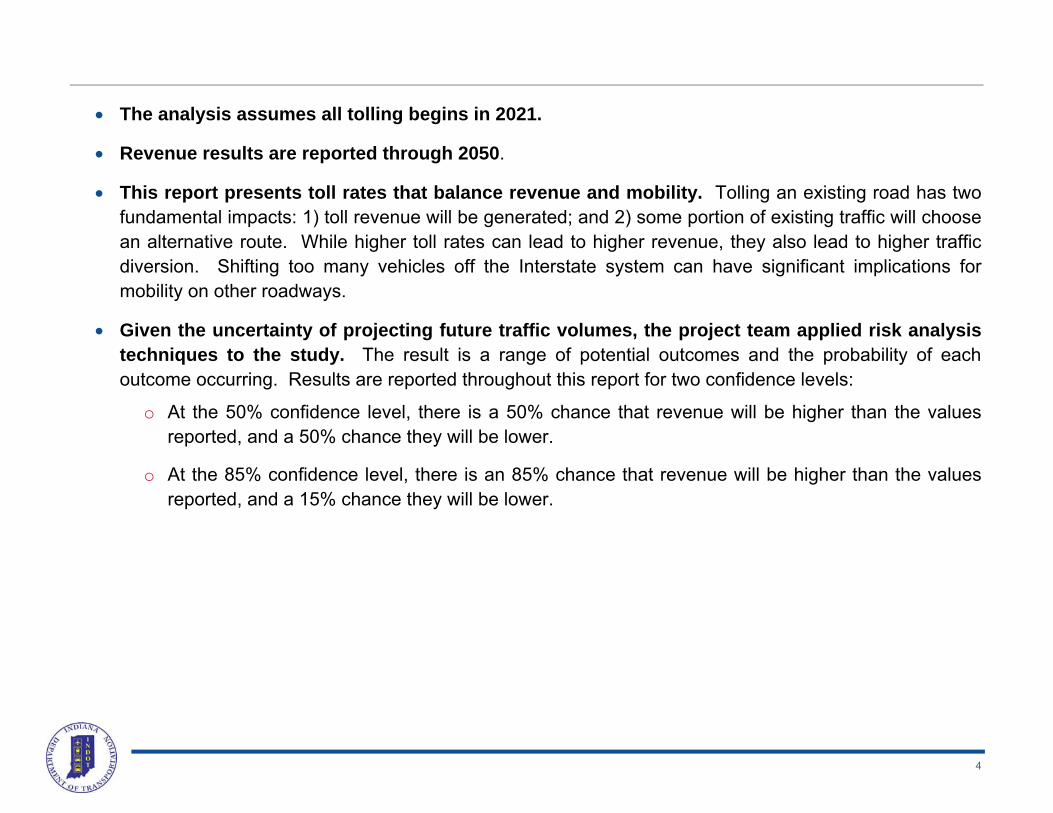
The analysis assumes all tolling begins in 2021.
Revenue results are reported through 2050.
This report presents toll rates that balance revenue and mobility. Tolling an existing road has two fundamental impacts: 1) toll revenue will be generated; and 2) some portion of existing traffic will choose an alternative route. While higher toll rates can lead to higher revenue, they also lead to higher traffic diversion. Shifting too many vehicles off the Interstate system can have significant implications for mobility on other roadways.
Given the uncertainty of projecting future traffic volumes, the project team applied risk analysis techniques to the study. The result is a range of potential outcomes and the probability of each outcome occurring. Results are reported throughout this report for two confidence levels:
o At the 50% confidence level, there is a 50% chance that revenue will be higher than the values reported, and a 50% chance they will be lower.
o At the 85% confidence level, there is an 85% chance that revenue will be higher than the values reported, and a 15% chance they will be lower.

5
This is a feasibility study, designed to inform discussions about the potential impacts of a statewide Interstate tolling program
Understanding the implications of a statewide tolling program requires looking into the future. Projecting future traffic volumes and the overall state of Indiana’s economy is complicated and full of uncertainty. For example, the amount of traffic on a tolled Interstate depends on a number of interrelated factors such as population growth, macroeconomic trends, fuel prices, the availability of alternate routes, and the traveling preferences of millions of individual drivers. Projecting these interactions is not an exact science.
Although the study team relied on best practices, industry standards, and INDOT’s models to conduct this analysis, the results are not guaranteed. This is a feasibility study, designed to inform discussions about the feasibility of a statewide tolling program. This study is not an investment-grade study that can be used to secure financing for a tolling project. Actual toll revenues, if such a program is pursued, will depend on future traffic volumes and on the details of how Indiana implements the program.

6
The biggest risk associated with the revenue calculations is the accuracy of heavy truck projections Given the uncertainty associated with projecting future traffic and revenue, the project team used risk analysis techniques to better understand the potential range of outcomes.
The team identified 12 key assumptions, developed a likely range of values for each, and applied Monte Carlo simulation to the calculations.2 As part of Monte Carlo analysis, the project team generated 10,000 versions of the revenue calculations. Each version reflects a random mix of values for the key assumptions.
The main outcomes of this analysis are the probability distribution graphs provided throughout this document. These graphs show the percent chance that the toll revenue will exceed a given value.
The analysis also identified the largest risks associated with the calculations. The largest risks related to the amount of heavy truck traffic once an Interstate is tolled. Heavy trucks are responsible for a significant portion of toll revenues. They are also the most likely to seek alternate free routes.
Although INDOT’s travel model reflects industry standards, work is needed to better model the relationship between toll rates and truck volumes. INDOT is currently working to enhance its traffic modeling capabilities. In the meantime the project team used an interim approach to adjust the truck projections for this analysis. As INDOT’s traffic model improves, this analysis should be revisited.
2 There could be additional uncertainty associated with factors such as the accuracy of the traffic and economic models. This uncertainty is not accounted for in the risk analysis
7
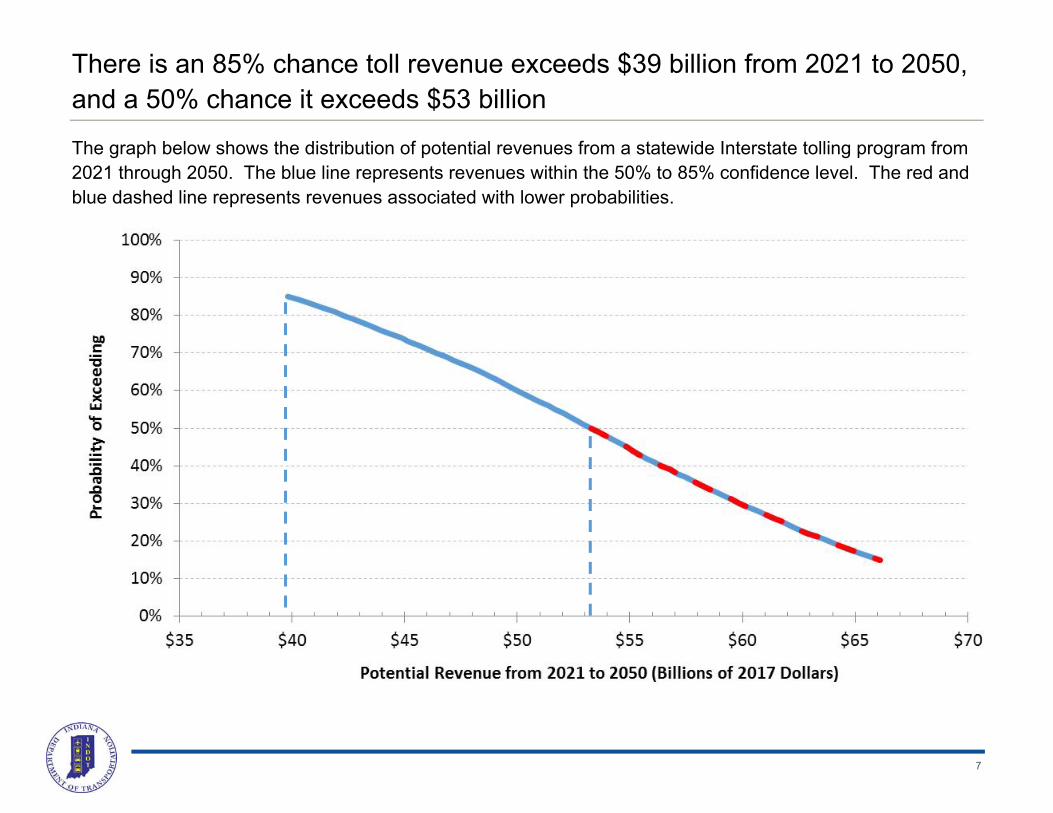
There is an 85% chance toll revenue exceeds $39 billion from 2021 to 2050, and a 50% chance it exceeds $53 billion
The graph below shows the distribution of potential revenues from a statewide Interstate tolling program from 2021 through 2050. The blue line represents revenues within the 50% to 85% confidence level. The red and blue dashed line represents revenues associated with lower probabilities.

8
Optimal toll rates could vary by Interstate
After analyzing 5 toll rate scenarios, the project team selected the scenario for each corridor that best balanced revenue and mobility. INDOT could significantly alter the revenue picture by modifying these rates. Also, more detailed corridor-level traffic modeling could be used to further explore the optimal tolling structures.
Interstate
Potential Toll Rate that Balances Revenue and Mobility (per mile) Example Trip
Auto Medium Trucks Heavy Trucks Route
Toll for an Auto with a Transponder
I-64 $0.06 $0.25 $0.63 New Albany to Illinois state line (123 miles)
$7.38
I-65 $0.04 $0.06 $0.19 Gary to Indianapolis (153 miles)
$6.12
I-69 $0.04 $0.06 $0.19 Ft Wayne to Indianapolis (105 miles)
$4.20
I-70 $0.04 $0.06 $0.19 Indianapolis to Illinois state line (81 miles)
$3.24
I-74 $0.04 $0.06 $0.19 Indianapolis to Ohio state line (84 miles)
$3.36
I-94 $0.04 $0.06 $0.19 State line to state line (45 miles)
$1.80
The following pages show more details for each Interstate corridor.

9
I-64 toll revenue potential
Auto Medium Truck
Heavy Truck
Daily miles traveled in 2015 1.3 M 0.06 M 1.0 M Potential toll rate per mile that balances revenue and mobility $0.06 $0.25 $0.63
Share of toll revenue through 2050 13% 1% 86% Change in traffic in 2050 due to tolling -22%
There is an 85% chance toll revenue would exceed $5.6 billion, and a 50% chance it would exceed $8.5 billion.
Length analyzed: 124 miles
10
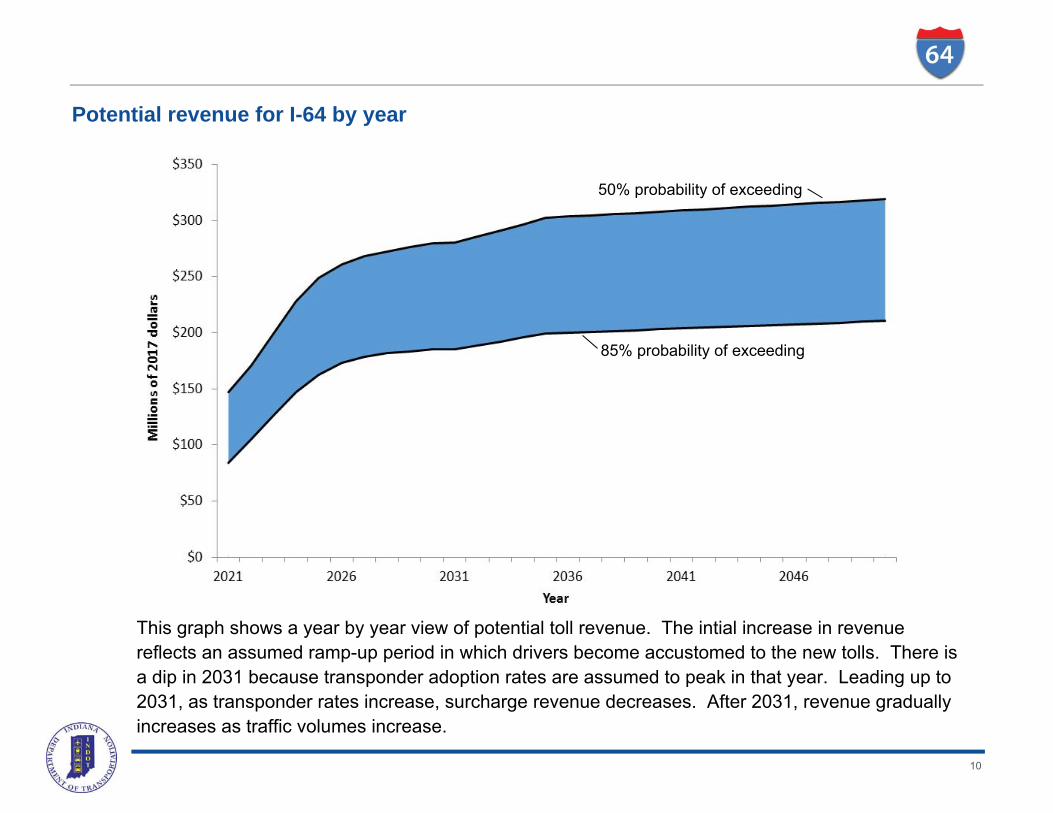
Potential revenue for I-64 by year
50% probability of exceeding
85% probability of exceeding
This graph shows a year by year view of potential toll revenue. The intial increase in revenue reflects an assumed ramp-up period in which drivers become accustomed to the new tolls. There is a dip in 2031 because transponder adoption rates are assumed to peak in that year. Leading up to 2031, as transponder rates increase, surcharge revenue decreases. After 2031, revenue gradually increases as traffic volumes increase.
11
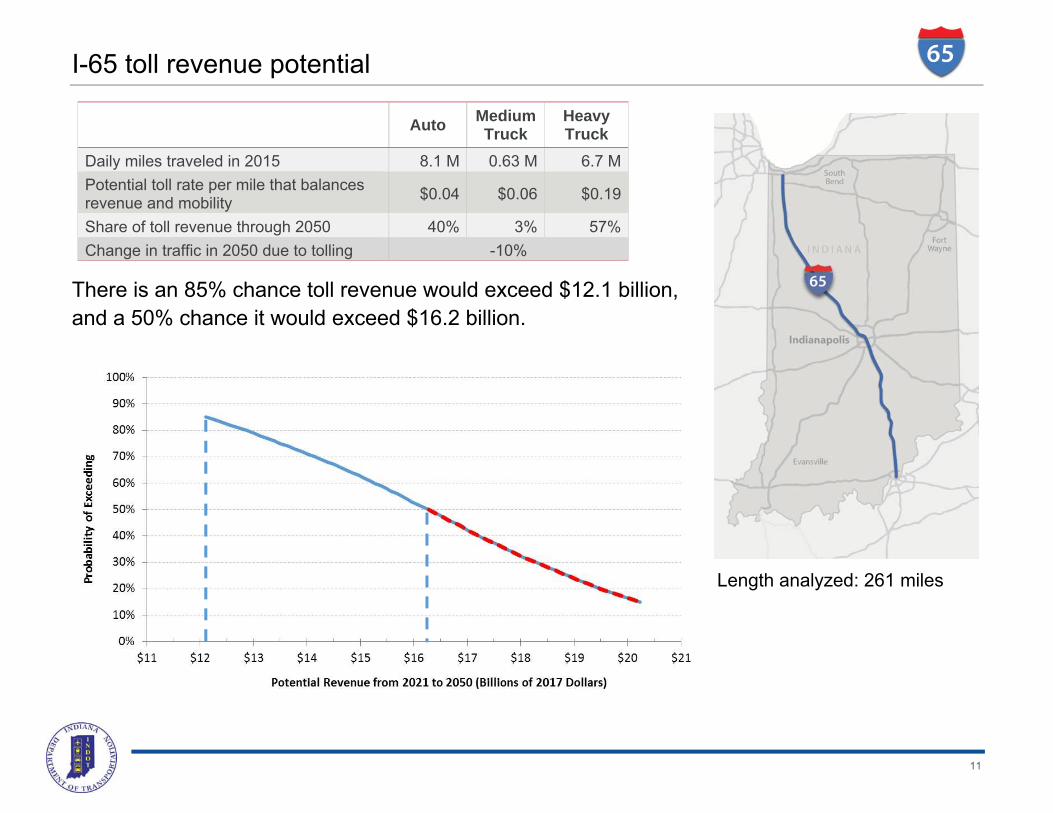
I-65 toll revenue potential
Auto Medium Truck
Heavy Truck
Daily miles traveled in 2015 8.1 M 0.63 M 6.7 M Potential toll rate per mile that balances revenue and mobility $0.04 $0.06 $0.19
Share of toll revenue through 2050 40% 3% 57% Change in traffic in 2050 due to tolling -10%
There is an 85% chance toll revenue would exceed $12.1 billion, and a 50% chance it would exceed $16.2 billion.
Length analyzed: 261 miles
12
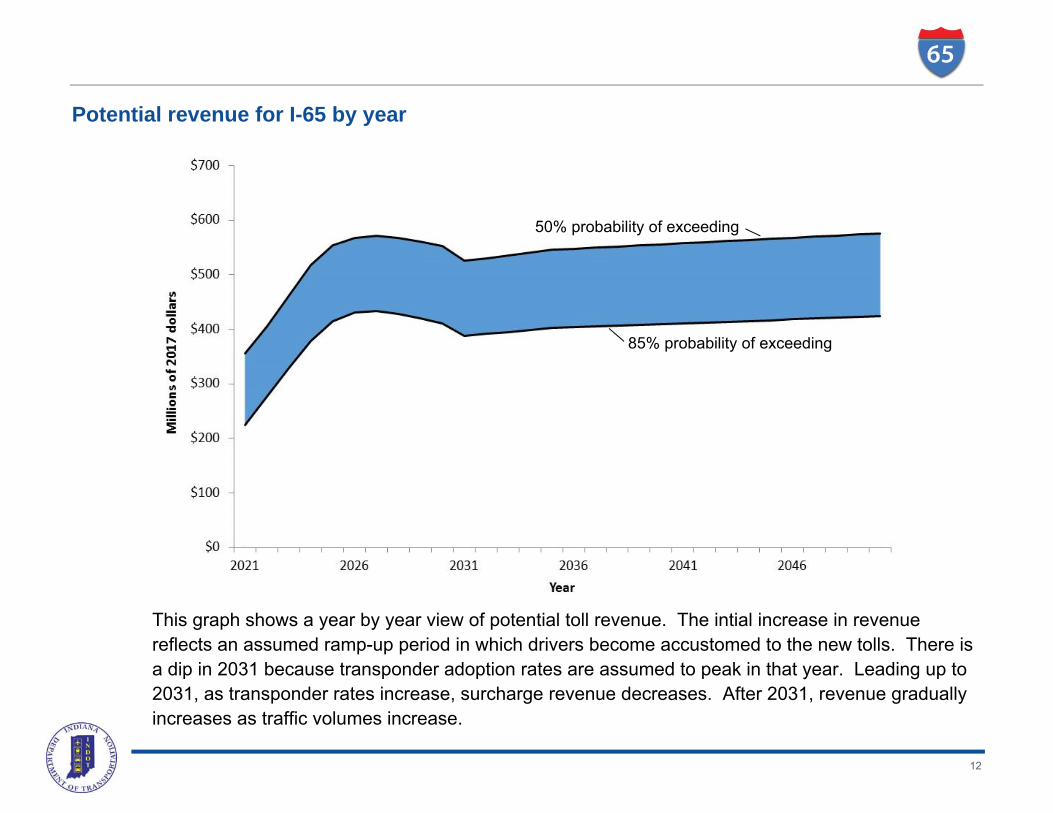
Potential revenue for I-65 by year
50% probability of exceeding
85% probability of exceeding
This graph shows a year by year view of potential toll revenue. The intial increase in revenue reflects an assumed ramp-up period in which drivers become accustomed to the new tolls. There is a dip in 2031 because transponder adoption rates are assumed to peak in that year. Leading up to 2031, as transponder rates increase, surcharge revenue decreases. After 2031, revenue gradually increases as traffic volumes increase.

13
I-69 toll revenue potential
Auto Medium Truck
Heavy Truck
Daily miles traveled in 2015 5.4 M 0.46 M 3.7 M Potential toll rate per mile that balances revenue and mobility $0.04 $0.06 $0.19
Share of toll revenue through 2050 41% 4% 55% Change in traffic in 2050 due to tolling -10%
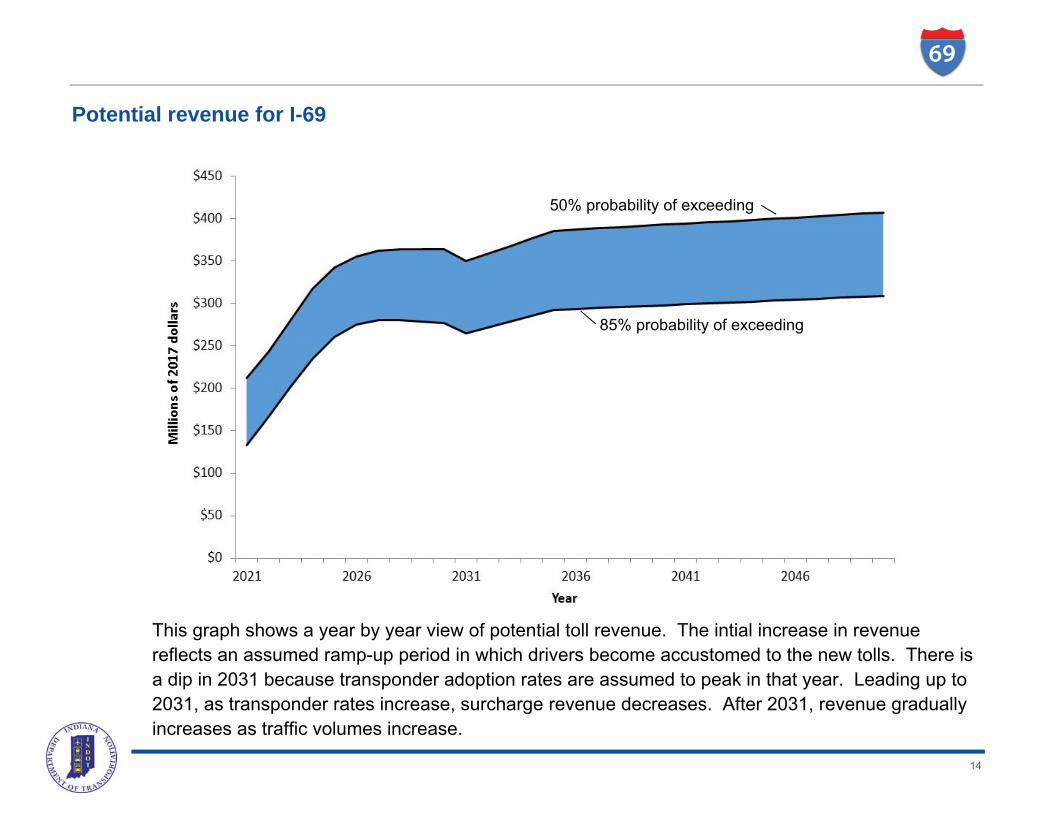
There is an 85% chance toll revenue would exceed $8.4 billion, and a 50% chance it would exceed $11 billion.
Length analyzed: 301 miles
14
Potential revenue for I-69
50% probability of exceeding
This graph shows a year by year view of potential toll revenue. The intial increase in revenue reflects an assumed ramp-up period in which drivers become accustomed to the new tolls. There is a dip in 2031 because transponder adoption rates are assumed to peak in that year. Leading up to 2031, as transponder rates increase, surcharge revenue decreases. After 2031, revenue gradually increases as traffic volumes increase.
85% probability of exceeding

15
I-70 toll revenue potential
Auto Medium Truck
Heavy Truck
Daily miles traveled in 2015 4.1 M 0.22 M 3.4 M Potential toll rate per mile that balances revenue and mobility $0.04 $0.06 $0.19
Share of toll revenue through 2050 31% 2% 67% Change in traffic in 2050 due to tolling -11%
There is an 85% chance toll revenue would exceed $6.9 billion, and a 50% chance it would exceed $9.1 billion.
Length analyzed: 153 miles

16
Potential revenue for I-70 by year
50% probability of exceeding
85% probability of exceeding
This graph shows a year by year view of potential toll revenue. The intial increase in revenue reflects an assumed ramp-up period in which drivers become accustomed to the new tolls. There is a dip in 2031 because transponder adoption rates are assumed to peak in that year. Leading up to 2031, as transponder rates increase, surcharge revenue decreases. After 2031, revenue gradually increases as traffic volumes increase.
17
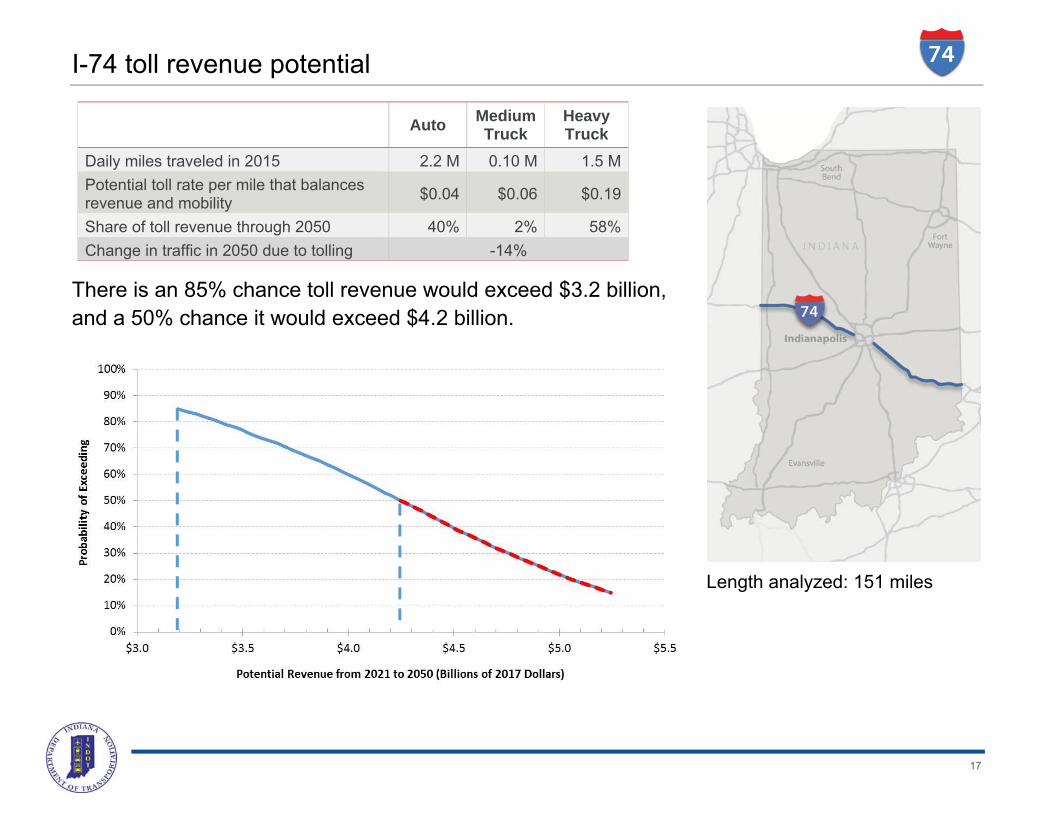
I-74 toll revenue potential
Auto Medium Truck
Heavy Truck
Daily miles traveled in 2015 2.2 M 0.10 M 1.5 M Potential toll rate per mile that balances revenue and mobility $0.04 $0.06 $0.19
Share of toll revenue through 2050 40% 2% 58% Change in traffic in 2050 due to tolling -14%
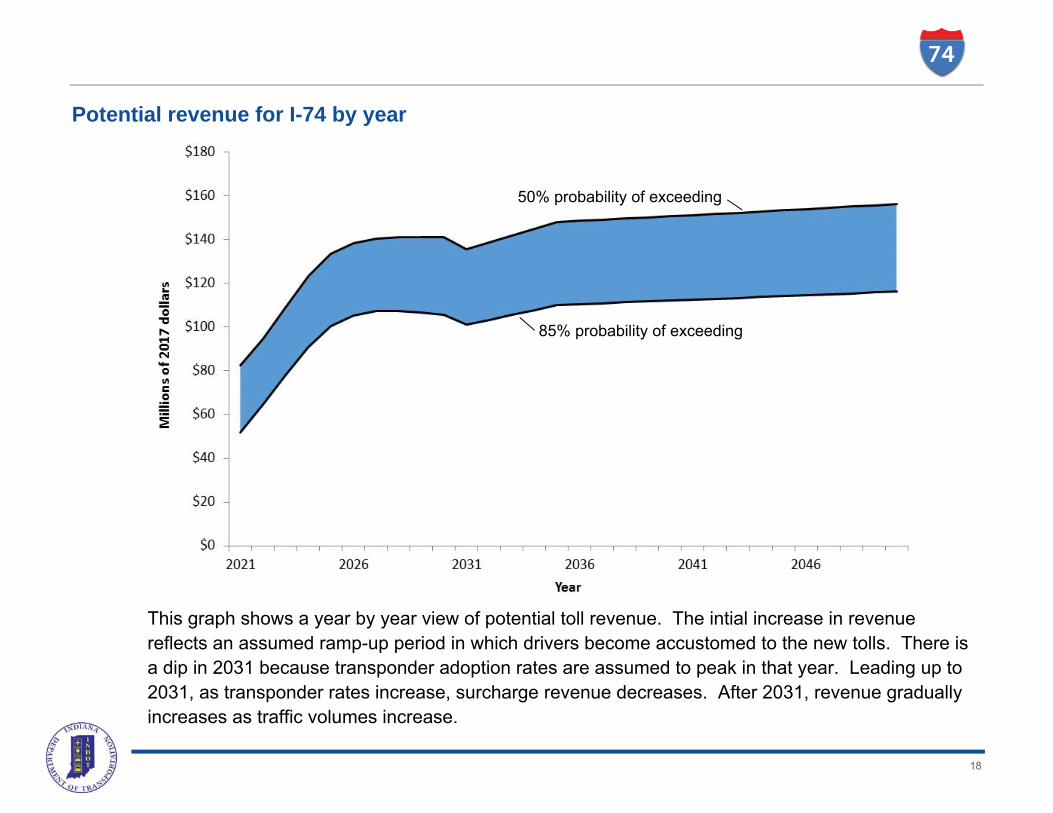
There is an 85% chance toll revenue would exceed $3.2 billion, and a 50% chance it would exceed $4.2 billion.
Length analyzed: 151 miles
18
Potential revenue for I-74 by year
50% probability of exceeding
85% probability of exceeding
This graph shows a year by year view of potential toll revenue. The intial increase in revenue reflects an assumed ramp-up period in which drivers become accustomed to the new tolls. There is a dip in 2031 because transponder adoption rates are assumed to peak in that year. Leading up to 2031, as transponder rates increase, surcharge revenue decreases. After 2031, revenue gradually increases as traffic volumes increase.

19
I-94 toll revenue potential
Auto Medium Truck
Heavy Truck
Daily miles traveled in 2015 2.0 M 0.27 M 1.5 M Potential toll rate per mile that balances revenue and mobility $0.04 $0.06 $0.19
Share of toll revenue through 2050 43% 6% 51% Change in traffic in 2050 due to tolling -9%
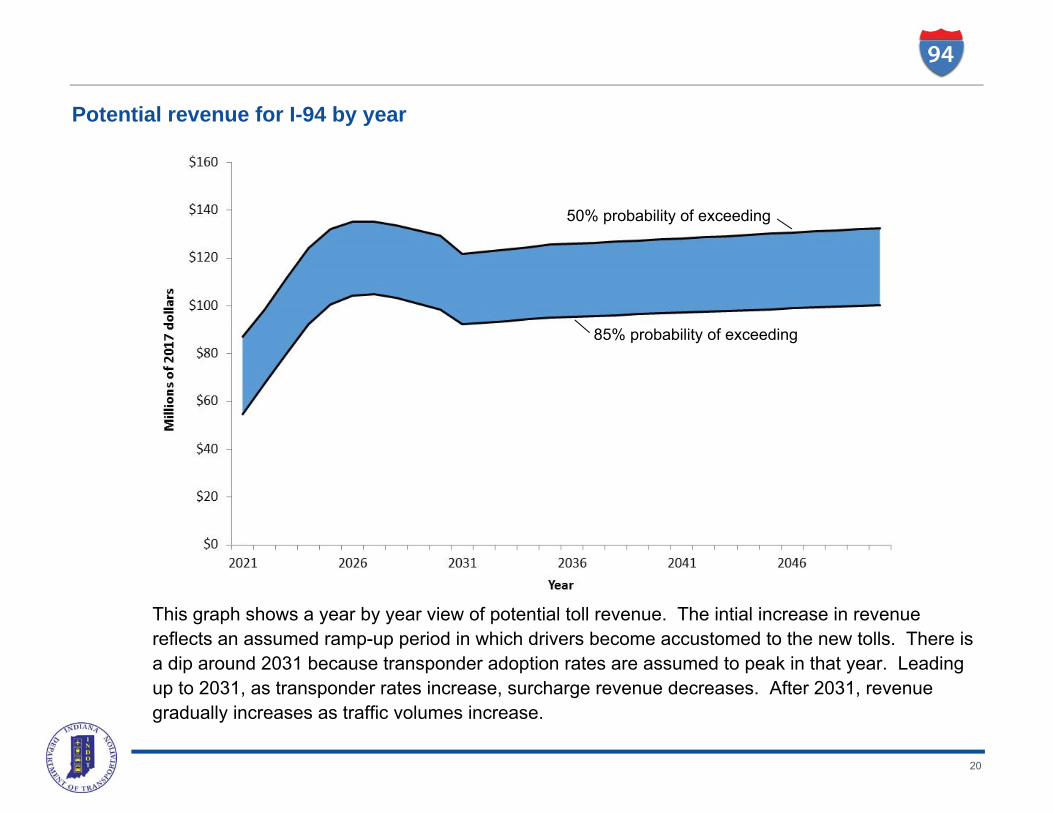
There is an 85% chance toll revenue would exceed $2.9 billion, and a 50% chance it would exceed $3.7 billion.
Length analyzed: 45 miles
20
Potential revenue for I-94 by year
50% probability of exceeding
85% probability of exceeding
This graph shows a year by year view of potential toll revenue. The intial increase in revenue reflects an assumed ramp-up period in which drivers become accustomed to the new tolls. There is a dip around 2031 because transponder adoption rates are assumed to peak in that year. Leading up to 2031, as transponder rates increase, surcharge revenue decreases. After 2031, revenue gradually increases as traffic volumes increase.
21
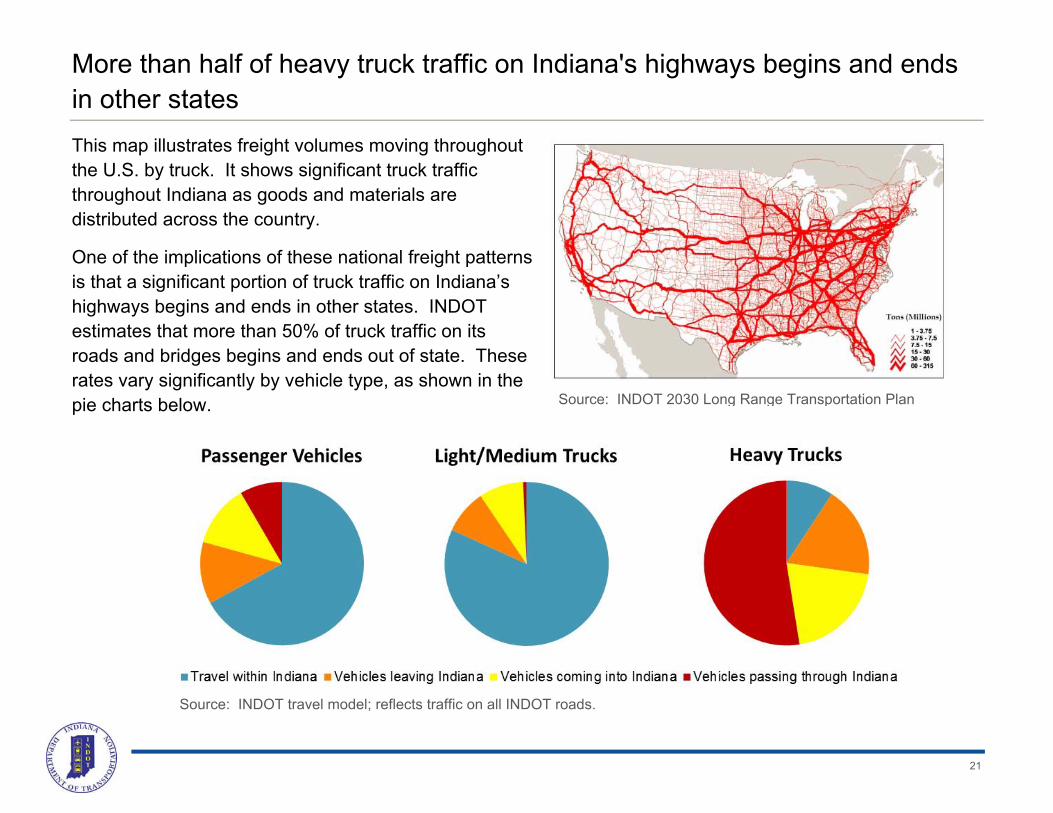
More than half of heavy truck traffic on Indiana's highways begins and ends in other states This map illustrates freight volumes moving throughout the U.S. by truck. It shows significant truck traffic throughout Indiana as goods and materials are distributed across the country.
One of the implications of these national freight patterns is that a significant portion of truck traffic on Indiana’s highways begins and ends in other states. INDOT estimates that more than 50% of truck traffic on its roads and bridges begins and ends out of state. These rates vary significantly by vehicle type, as shown in the pie charts below.
Source: INDOT travel model; reflects traffic on all INDOT roads.
Source: INDOT 2030 Long Range Transportation Plan
22
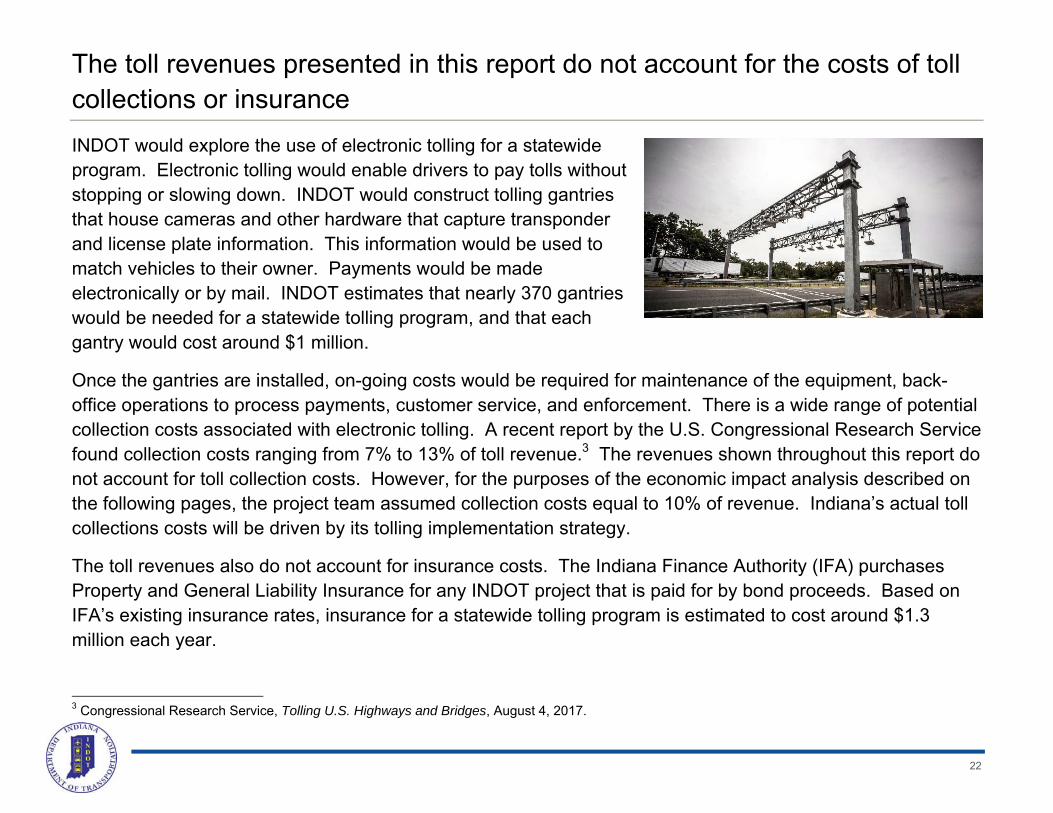
The toll revenues presented in this report do not account for the costs of toll collections or insurance INDOT would explore the use of electronic tolling for a statewide program. Electronic tolling would enable drivers to pay tolls without stopping or slowing down. INDOT would construct tolling gantries that house cameras and other hardware that capture transponder and license plate information. This information would be used to match vehicles to their owner. Payments would be made electronically or by mail. INDOT estimates that nearly 370 gantries would be needed for a statewide tolling program, and that each gantry would cost around $1 million.
Once the gantries are installed, on-going costs would be required for maintenance of the equipment, back-office operations to process payments, customer service, and enforcement. There is a wide range of potential collection costs associated with electronic tolling. A recent report by the U.S. Congressional Research Service found collection costs ranging from 7% to 13% of toll revenue.3 The revenues shown throughout this report do not account for toll collection costs. However, for the purposes of the economic impact analysis described on the following pages, the project team assumed collection costs equal to 10% of revenue. Indiana’s actual toll collections costs will be driven by its tolling implementation strategy.
The toll revenues also do not account for insurance costs. The Indiana Finance Authority (IFA) purchases Property and General Liability Insurance for any INDOT project that is paid for by bond proceeds. Based on IFA’s existing insurance rates, insurance for a statewide tolling program is estimated to cost around $1.3 million each year.
3 Congressional Research Service, Tolling U.S. Highways and Bridges, August 4, 2017.
23
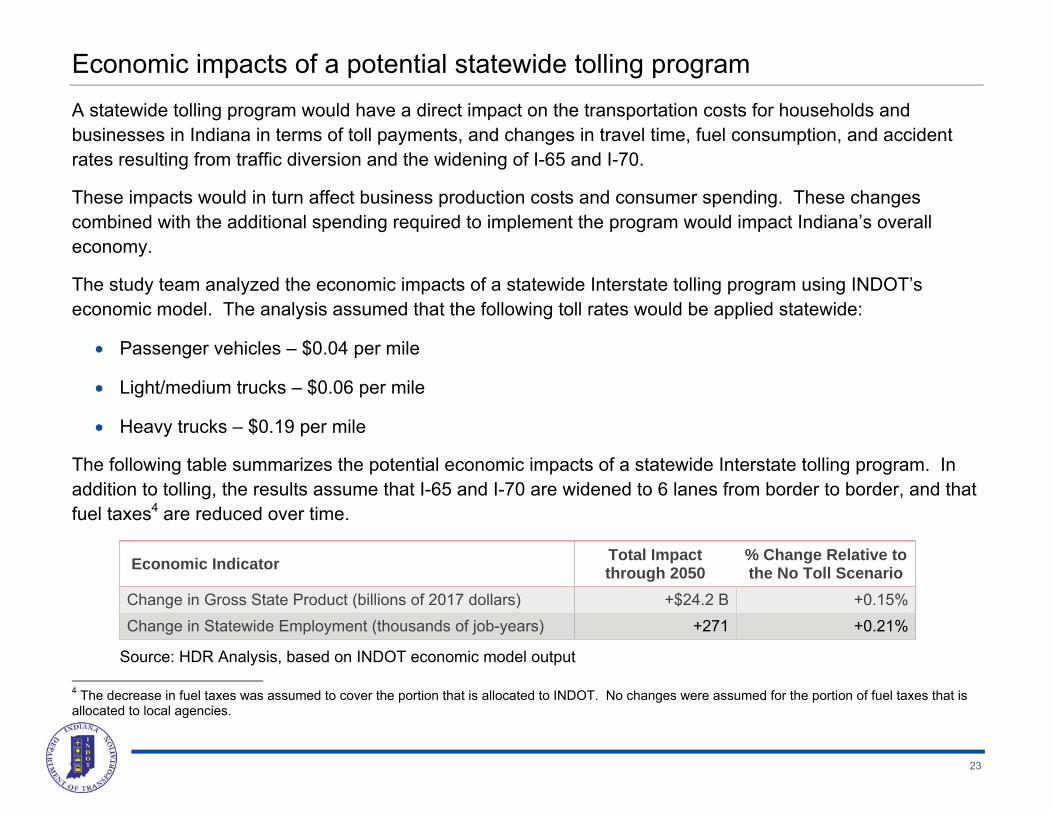
Economic impacts of a potential statewide tolling program A statewide tolling program would have a direct impact on the transportation costs for households and businesses in Indiana in terms of toll payments, and changes in travel time, fuel consumption, and accident rates resulting from traffic diversion and the widening of I-65 and I-70.
These impacts would in turn affect business production costs and consumer spending. These changes combined with the additional spending required to implement the program would impact Indiana’s overall economy.
The study team analyzed the economic impacts of a statewide Interstate tolling program using INDOT’s economic model. The analysis assumed that the following toll rates would be applied statewide:
Passenger vehicles – $0.04 per mile
Light/medium trucks – $0.06 per mile
Heavy trucks – $0.19 per mile
The following table summarizes the potential economic impacts of a statewide Interstate tolling program. In addition to tolling, the results assume that I-65 and I-70 are widened to 6 lanes from border to border, and that fuel taxes4 are reduced over time.
Economic Indicator Total Impact through 2050
% Change Relative to the No Toll Scenario
Change in Gross State Product (billions of 2017 dollars) +$24.2 B +0.15% Change in Statewide Employment (thousands of job-years) +271 +0.21%
Source: HDR Analysis, based on INDOT economic model output 4 The decrease in fuel taxes was assumed to cover the portion that is allocated to INDOT. No changes were assumed for the portion of fuel taxes that is allocated to local agencies.

24
It is important to consider implementation issues when assessing the feasibility of a potential statewide tolling program So far, this report has addressed several important questions regarding the feasibility of tolling Indiana’s Interstates, such as:
Which Interstates are conducive to tolling? How much revenue could be generated on them?
What toll rates best strike a balance between revenue and traffic diversion?
How much are Hoosiers willing to pay to lower their travel times?
How would tolls impact travel on the Interstates and other parallel routes?
What would be the impact of a tolling program on the Indiana’s economy?
The remainder of this report focuses on issues related to the implementation of a tolling program. It answers the following questions:
Do federal regulations allow Indiana to toll its Interstates?
Does Indiana have the flexibility to provide tolling discounts for local, commuter, and in-state traffic?
Does Indiana have the ability to enter into monetization agreements and long-term contracts for tolling facilities?
How could INDOT ensure participation in the program by women-owned and minority-owned businesses?
How could Indiana maximize the use of local workers and products on the tolling program?
25
Federal regulations allow Indiana to toll its Interstates The construction, maintenance and operations of federal-aid roadways are governed by Title 23 of the United States Code (23 U.S.C). The code provides four options for tolling these roadways:5
1. General Tolling Program. This program allows states to toll new highways and new lanes that are added to existing highways. It also enables states to convert existing toll-free bridges to toll bridges if they are reconstructed or replaced.
2. High Occupancy Vehicle (HOV)/High Occupancy Toll (HOT) Lanes Program. This program enables states to convert existing HOV lanes to tolled HOT lanes.
3. Interstate System Reconstruction and Rehabilitation Pilot Program. This program allows for up to three existing Interstate facilities to be tolled in order to pay for work that could not otherwise be funded. To participate in this program, Indiana would have to apply for one of the three pilot slots. The slots are for specific facilities. Therefore, if Indiana pursued this program, it would only enable tolling on a single Interstate.
4. Value Pricing Pilot Program. This program enables states to use variable tolls as a tool to reduce congestion. To participate in this program, Indiana would have to apply for one of 15 slots available throughout the U.S. and show that the tolling program would improve existing congested conditions.
Under Options 1, 2, and 4, toll revenue can be used for any federal fund-eligible activities once project obligations have been met. Under Option 3, toll revenue can only be used for work on the tolled facility.
INDOT is investigating the feasibility of Option 1, Option 3, and Option 4 as the basis for potential tolling. A statewide tolling program may rely on a mixture of these options. Option 2 is not relevant because there are currently no HOV lanes in Indiana.
5 FHWA Center for Innovative Finance Support, Federal Tolling Programs, https://www.fhwa.dot.gov/ipd/tolling_and_pricing/tolling_pricing/federal_tolling_programs.aspx
26
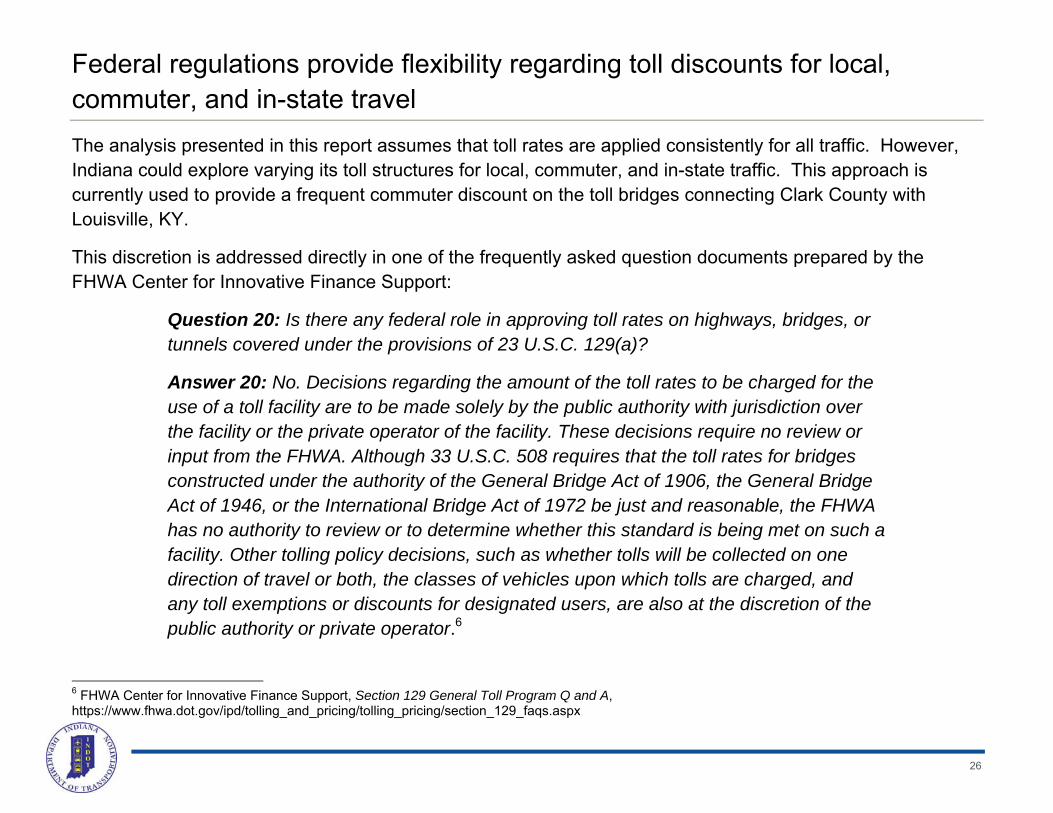
Federal regulations provide flexibility regarding toll discounts for local, commuter, and in-state travel The analysis presented in this report assumes that toll rates are applied consistently for all traffic. However, Indiana could explore varying its toll structures for local, commuter, and in-state traffic. This approach is currently used to provide a frequent commuter discount on the toll bridges connecting Clark County with Louisville, KY.
This discretion is addressed directly in one of the frequently asked question documents prepared by the FHWA Center for Innovative Finance Support:
Question 20: Is there any federal role in approving toll rates on highways, bridges, or tunnels covered under the provisions of 23 U.S.C. 129(a)?
Answer 20: No. Decisions regarding the amount of the toll rates to be charged for the use of a toll facility are to be made solely by the public authority with jurisdiction over the facility or the private operator of the facility. These decisions require no review or input from the FHWA. Although 33 U.S.C. 508 requires that the toll rates for bridges constructed under the authority of the General Bridge Act of 1906, the General Bridge Act of 1946, or the International Bridge Act of 1972 be just and reasonable, the FHWA has no authority to review or to determine whether this standard is being met on such a facility. Other tolling policy decisions, such as whether tolls will be collected on one direction of travel or both, the classes of vehicles upon which tolls are charged, and any toll exemptions or discounts for designated users, are also at the discretion of the public authority or private operator.6
6 FHWA Center for Innovative Finance Support, Section 129 General Toll Program Q and A, https://www.fhwa.dot.gov/ipd/tolling_and_pricing/tolling_pricing/section_129_faqs.aspx
27
Indiana has the ability to enter into monetization agreements or long-term contracts for tolling facilities, and has already done so FHWA encourages states to consider long-term contracts for construction, long-term maintenance, and operations of highway projects, including those that involve tolling. In addition, 23 U.S.C. 129(a) enables states to use toll revenue for the explicit purpose of providing “a reasonable return on investment of any private person financing the project.”7
At the state level, Indiana Code 8-15.5-1-2, Public-Private Agreements for Toll Road Projects, grants the Indiana Finance Authority (IFA) the authority to enter into long-term agreements to design, build, finance, operate and maintain transportation facilities.8
IC 8-15-2-1 was recently amended to read that the IFA may “construct, reconstruct, maintain, repair, and operate toll road projects at such locations as shall be approved by the governor.”9
The IFA, in cooperation with INDOT has successfully entered into long term public-private agreements on two tolled facilities. The Indiana Toll Road is operated, maintained and financed by a private company working under a 66-year lease concession. The Ohio River Bridges Project East End Crossing is currently in the 35-year maintenance period of a design, build, finance, operate and maintain contract. IFA and INDOT provide oversight for both of these facilities.
7 23 US Code 129. 8 Indiana Code 8-15.5. 9 Indiana Code 8-15-2-1.

28
Indiana could use its existing programs to encourage women-owned and minority-owned business enterprises to participate in a statewide tolling program Title 49, Part 26 of the US Code of Federal Regulations requires recipients of federal transportation funding to develop a Disadvantaged Business Enterprise (DBE) program. INDOT has established a DBE program that meets these requirements. It is the policy of INDOT to ensure that DBEs have an equal opportunity to receive and participate in contracts that use federal funds, without regard to race, color, national origin, or sex.
INDOT regularly submits a DBE goal and methodology report to the FHWA. The most recent report covers 2017 through 2019. While DBE goals often vary within the state based upon the availability of firms in a specific geographic area, INDOT’s overall goal for DBE participation is 10.9%. INDOT also has a program in place to certify companies as DBEs, consider DBE participation during procurement, and monitor actual DBE participation.
If only state funds were used for a tolling project, the goals for minorities, women and veterans would be set by the Indiana Department of Administration (IDOA). Currently, IDOA’s goals for construction projects are 7% minority participation and 5% women participation. In addition, by Executive Order of Governor Pence, all state-funded contracts contain a 3% veterans utilization goal. The IDOA tracks actual participation rates against these goals.
Indiana has two sets of goals and monitoring programs to encourage women-owned and minority-owned business enterprises to participate in highway projects. One set applies to projects that use federal funds, and the other applies to projects that use only state funds. Regardless of how Indiana might fund a statewide tolling program, INDOT could apply one of these two programs without change.
29
Geographic preferences are not permitted for federally-funded projects. However, market forces drive the use of Indiana workers and products for INDOT projects One of the potential economic benefits of a statewide tolling program would be an increase in design, construction, and operations projects throughout Indiana. Indiana House Enrolled Act No. 1002 directed INDOT to explore opportunities to maximize the use of Indiana workers and products in a tolling program.
In order to implement a statewide tolling program, INDOT would consider all available funding options. One of the tolling options INDOT is exploring would entail replacing numerous bridge decks throughout the state. It is anticipated that this work could be funded largely by federal funds.
Federal regulations require a Buy America provision for all federally-funded transportation projects. This provision requires that all permanent steel and iron products be manufactured in the US. Beyond this requirement, INDOT is prohibited from selecting contractors based on geographic preference when federal funds are used.
Although geographic preferences can not be explicitly considered for federally-funded transportation projects, natural market forces tend to drive the use of Indiana labor, materials, and products on INDOT’s projects. For example, in FY 2017, 65% of the value of INDOT’s consulting contracts went to Indiana firms. This share increased to 96% for construction contracts. It is anticipated that this dynamic would continue on any potential statewide tolling program.
30
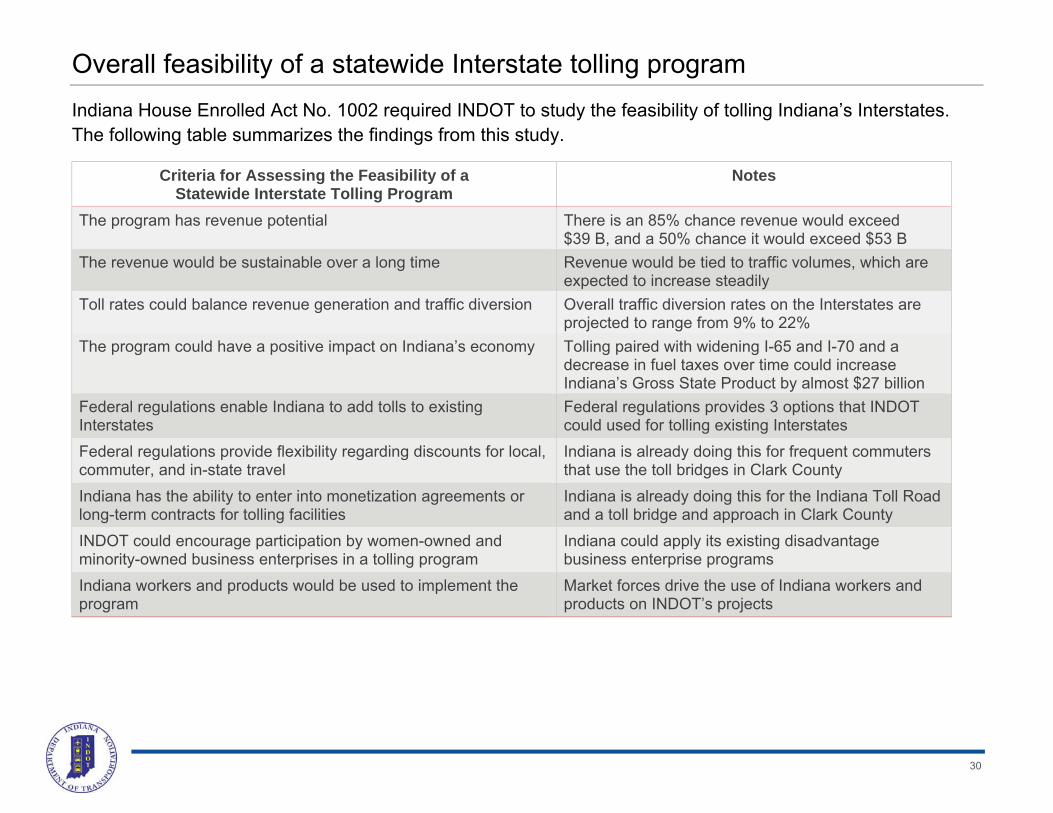
Overall feasibility of a statewide Interstate tolling program Indiana House Enrolled Act No. 1002 required INDOT to study the feasibility of tolling Indiana’s Interstates. The following table summarizes the findings from this study.
Criteria for Assessing the Feasibility of a Statewide Interstate Tolling Program
Notes
The program has revenue potential There is an 85% chance revenue would exceed $39 B, and a 50% chance it would exceed $53 B
The revenue would be sustainable over a long time Revenue would be tied to traffic volumes, which are expected to increase steadily
Toll rates could balance revenue generation and traffic diversion Overall traffic diversion rates on the Interstates are projected to range from 9% to 22%
The program could have a positive impact on Indiana’s economy Tolling paired with widening I-65 and I-70 and a decrease in fuel taxes over time could increase Indiana’s Gross State Product by almost $27 billion
Federal regulations enable Indiana to add tolls to existing Interstates
Federal regulations provides 3 options that INDOT could used for tolling existing Interstates
Federal regulations provide flexibility regarding discounts for local, commuter, and in-state travel
Indiana is already doing this for frequent commuters that use the toll bridges in Clark County
Indiana has the ability to enter into monetization agreements or long-term contracts for tolling facilities
Indiana is already doing this for the Indiana Toll Road and a toll bridge and approach in Clark County
INDOT could encourage participation by women-owned and minority-owned business enterprises in a tolling program
Indiana could apply its existing disadvantage business enterprise programs
Indiana workers and products would be used to implement the program
Market forces drive the use of Indiana workers and products on INDOT’s projects