
PRECARIOUS JOBS IN ONTARIO: MAPPING DIMENSIONS OF LABOUR ... · The dimensions of labour market...
60
PRECARIOUS JOBS IN ONTARIO: MAPPING DIMENSIONS OF LABOUR MARKET INSECURITY BY WORKERS’ SOCIAL LOCATION AND CONTEXT Vulnerable Workers and Precarious Work November 2011 Commissioned by the Law Commission of Ontario Prepared by Andrea M. Noack Leah F. Vosko The LCO commissioned this paper to provide background research for its Legal Capacity, Decision- Making and Guardianship project. The views expressed in this paper do not necessarily reflect the views of the LCO
Transcript of PRECARIOUS JOBS IN ONTARIO: MAPPING DIMENSIONS OF LABOUR ... · The dimensions of labour market...

PRECARIOUS JOBS IN ONTARIO:
MAPPING DIMENSIONS OF LABOUR
MARKET INSECURITY BY WORKERS’
SOCIAL LOCATION AND CONTEXT
Vulnerable Workers and Precarious Work
November 2011
Commissioned by the Law Commission of Ontario
Prepared by
Andrea M. Noack
Leah F. Vosko
The LCO commissioned this paper to provide background research for its Legal Capacity, Decision-
Making and Guardianship project. The views expressed in this paper do not necessarily reflect the views
of the LCO

Precarious Jobs in Ontario: Mapping Dimensions of Labour Market Insecurity by Workers’ Social Location and Context
Commissioned by the Law Commission of Ontario November 2011 ii
TABLE OF CONTENTS
I. INTRODUCTION ................................................................................................ 1
II. UNDERSTANDING PRECARIOUS JOBS .......................................................... 3
III. THE STRUCTURE OF THE LABOUR MARKET, 1999-2009 ............................. 7
IV. CHARACTERISTICS OF PRECARIOUS JOBS ................................................. 12
V. WHAT TYPES OF JOBS ARE PRECARIOUS? ................................................. 22
VI. WHO ARE WORKERS IN PRECARIOUS JOBS? .............................................. 27
VII. CONCLUSIONS AND RECOMMENDATIONS:
THE MORE THINGS CHANGE, THE MORE THEY STAY THE SAME ........... 33
A. Reducing precarious jobs in Ontario: Recommendations ............................ 35
1. Improve the wage packet in Ontario ............................................................... 35
2. Promote greater worker control over the labour process via
improved access to unionization and other workplace regulations
fostering labour market security .............................................................. 37
3. Expand the scope of employment standards (ES) and enforce them ............. 38
4. Improve the social measurement of job quality and precariousness ............... 40
APPENDIX A: DATA SOURCES AND ANALYSIS ..................................................... 43
APPENDIX B: PRECARIOUS EMPLOYMENT BY INDUSTRY AND OCCUPATION, 1999-2009 ............................................................................. 46 ENDNOTES ................................................................................................................ 48

Precarious Jobs in Ontario: Mapping Dimensions of Labour Market Insecurity by Workers’ Social Location and Context
Commissioned by the Law Commission of Ontario November 2011 iii
LIST OF TABLES
Table 2.1 Minimum wage, low-wage cutoffs and the low income measure........ 6
Table 4.1 Proportion of workers in precarious jobs,
by form of employment, 2008 ........................................................ 17
Table 4.2 Socio-demographic characteristics of employees,
by form of employment, 2008 ........................................................ 20
Table 5.1 Proportion of workers who have precarious jobs,
by industry, 1999-2009 .................................................................. 46
Table 5.2 Proportion of workers who have precarious jobs,
by occupation, 1999-2009.............................................................. 47
Table 6.1 Proportions of workers in precarious jobs,
by socio-demographic characteristics, 2008 .................................. 28
LIST OF FIGURES
Figure 4.1 Overlap between indicators of precarious jobs, 2008 ........................ 14
Figure 4.2 Overlap between indicators of precarious jobs,
by full/part-time status, employees, 2008 ...................................... 18
Figure 4.3 Overlap between indicators of precarious jobs,
by employment form, employees, 2008 ......................................... 19

Precarious Jobs in Ontario: Mapping Dimensions of Labour Market Insecurity by Workers’ Social Location and Context
Commissioned by the Law Commission of Ontario November 2011 iv
LIST OF GRAPHS
Graph 3.1 Labour force characteristics, 1999-2009 ............................................ 8
Graph 3.2 Proportions of full-time (permanent/temporary) and part-time
(permanent/temporary) work among employees, 1999-2009 ........ 9
Graph 3.3 Reasons for part-time work, by gender, 1999-2009 ........................... 11
Graph 4.1 Prevalence of measures of precarious jobs, 1999-2009 .................... 13
Graph 4.2 Prevalence of precarious jobs in Ontario and Quebec, 2001-2009 .... 16
Graph 5.1 Proportion of precarious workers in full and part-time jobs
in the public and private sectors, 2001-2009 ................................. 23
Graph 6.1 Proportion of all workers in precarious jobs, by gender, 1999-2009 .. 29
Graph 6.2 Proportion of full-time permanent workers in precarious jobs,
by gender, 1999-2009 .................................................................... 29
Graph 6.3 Proportion of all workers in precarious jobs,
by racialization and gender, 1999-2009 ......................................... 30
Graph 6.4 Proportion of full-time permanent workers in precarious jobs,
by racialization and gender 1999-2009 .......................................... 30
Graph 6.5 Proportion of all workers in precarious jobs,
by immigrant status and gender, 1999-2009 ................................. 31
Graph 6.6 Proportion of full-time permanent workers in precarious jobs,
by immigrant status and gender, 1999-2009 ................................. 31
Graph 6.7 Proportion of all workers in precarious jobs,
by education, 1999-2009 ............................................................... 32

Precarious Jobs in Ontario: Mapping Dimensions of Labour Market Insecurity by Workers’ Social Location and Context
Commissioned by the Law Commission of Ontario November 2011 v
Graph 6.8 Proportion of full-time permanent workers in precarious jobs,
by education, 1999-2009 ............................................................... 32

Precarious Jobs in Ontario: Mapping Dimensions of Labour Market Insecurity by Workers’ Social Location and Context
Commissioned by the Law Commission of Ontario 1 November 2011
I. INTRODUCTION
In this report, we use data from Statistics Canada’s Survey of Labour and Income
Dynamics (SLID) to map the prevalence of precarious jobs in Ontario’s labour market
over the decade long period between 1999 and 2009.2 Many current labour regulations
and policies are premised on the norm of a standard employment relationship (SER)
defined by a full-time continuous employment relationship where the worker has one
employer, works on the employer’s premises and has access to extensive social
benefits and statutory entitlements from that employer. Research shows, however, that
this employment model, and particularly its associated securities, is waning.3 In contrast
to the SER, precarious jobs are characterized by specific features of labour market
insecurity. They tend to be clustered in part-time and temporary forms of employment,
although on account of the lowering of the bottom of the labour market during the post-
1980 period, features of precariousness are also increasingly found in full-time
permanent jobs.
To date, studies of Canada as a whole have shown that precarious jobs are most
often held by workers in certain social locations, especially women, immigrants, and
racialized people4 and in certain sectors, industries and occupations, such as in the
private sector and sales and services in particular.5 Yet with the exception of studies of
Quebec,6 there is a dearth of analysis of the dynamics of precarious employment in
provincial labour markets even though the provinces represent a significant site of
labour regulation since the Federal Labour Code covers just ten per cent of all workers
in Canada. At the provincial level, there is limited awareness of the different
permutations and combinations of key features of labour market insecurity identified

Precarious Jobs in Ontario: Mapping Dimensions of Labour Market Insecurity by Workers’ Social Location and Context
Commissioned by the Law Commission of Ontario 2 November 2011
with different employment statuses (e.g., self-employment or paid employment) and
forms of employment (e.g., part-time or full-time, temporary or permanent paid
employment) and their prevalence among differently situated workers, both workers in
different industries and occupations and in different social locations. This report aims to
fill this knowledge gap, and thus is a necessary step towards correcting the disjuncture
between labour market realities and the model upon which many provincial labour
regulations and policies are premised. To this end, in the analysis that follows, we aim
to answer four questions about precarious jobs in Ontario:
i. How has the structure of the Ontario labour market changed from
1999-2009, particularly in relation to the prevalence of part-time
and temporary forms of paid employment and solo self-
employment, forms of employment which are typically identified
with precarious jobs?
ii. How prevalent are the different features of labour market insecurity
in the Ontario’s labour market, and how has their prevalence
changed from 1999-2009?
iii. In what sectors, industries and occupations are precarious jobs
most prevalent?
iv. What are the socio-demographic characteristics (gender, ethnicity,
immigration status) of people who hold precarious jobs and how
has this changed from 1999-2009?

Precarious Jobs in Ontario: Mapping Dimensions of Labour Market Insecurity by Workers’ Social Location and Context
Commissioned by the Law Commission of Ontario 3 November 2011
Methodological details about the objectives, data collection, sampling and coverage
limitations, and analysis of the Survey of Labour and Income Dynamics, the principal
survey upon which the report relies, are found in Appendix A.
II. UNDERSTANDING PRECARIOUS JOBS
We conceptualize precarious jobs as forms of work for remuneration which have
one or more dimensions of labour market insecurity that make them substantially
different from the “functions”7 of the SER – specifically, its association with access to
training, regulatory protections and social benefits, decent wages, and a social wage.8
In particular, precarious jobs are characterized typically by high levels of uncertainty,
low income, a lack of control over the labour process, and limited access to regulatory
protections. The presence of one or more of these dimensions of labour market
insecurity results in these jobs being of undesirable quality. There is a relationship
between workers and jobs too; those workers who remain in precarious jobs may
themselves be or become marginalized or perceived as precarious in relation to the
larger society (e.g., on account of sex/gender divisions of labour or citizenship status);
hence, the relationship between precarious jobs and so-called vulnerable workers.9
However, this report centres on jobs, rather than workers.
One aspect of our analysis focuses on various forms of employment. Building on
previous empirical findings for Canada and elsewhere, we take solo self-employment
(without employees) to be more precarious than employer self-employment.10 Without
the protection of a larger and/or more diverse company, this subset of the self-employed
are much more vulnerable to economic pressures; even a brief downturn in business

Precarious Jobs in Ontario: Mapping Dimensions of Labour Market Insecurity by Workers’ Social Location and Context
Commissioned by the Law Commission of Ontario 4 November 2011
can lead to unemployment or poverty.11 Further, many solo self-employed are, in
practice, workers, including independent or dependent contractors who have been
deemed to be self-employed in order to limit their access to equivalent levels of
workplace protections and benefits as employees.12 We also understand temporary
forms of employment, which are diverse and include contract/term, seasonal, casual
and on-call employment, to be more precarious than permanent forms of employment
as they are uncertain by definition.13 As employers pursue ‘flexibility-enhancing’ labour
strategies, temporary or contract employment also affords them the opportunity to
reduce their labour costs by eliminating workers, without the need to provide cause for
termination or severance pay. Increasingly, employees are given multiple, recurring
temporary contracts; although the positions they hold may have become a permanent
part of the organization, theseworkers are required to periodically reapply for their jobs.
Many temporary employees are also excluded from a full range of workplace benefits,
including health benefits and pension plans.14 We also take part-time to typically be
more precarious than full-time employment since, like temporary as opposed to
permanent workers, those that are part-time often have less job security (e.g., due to
seniority rules), fewer social benefits and statutory entitlements (as they may fail to
meet minimum hours thresholds) and less influence in their work environment. We
therefore include an analysis of part-time and temporary paid employment and solo self-
employment in this paper. At the same time, we recognize that precarious employment
is not synonymous with non-standard employment. Rather, some non-standard
employment is relatively secure and some full-time permanent employment is
precarious. Precariousness can cut across all kinds of work for remuneration – much

Precarious Jobs in Ontario: Mapping Dimensions of Labour Market Insecurity by Workers’ Social Location and Context
Commissioned by the Law Commission of Ontario 5 November 2011
depends on the nature and organization of labour market regulations.15 For this reason,
we pursue an integrated analysis that places dimensions of labour market insecurity on
a par with forms of employment.
The dimensions of labour market insecurity examined in this paper include low
income, a lack of control over the labour process, and limited access to regulatory
protections. As in all research using secondary data, we are limited by the indicators
available to us in the dataset. As indicators of low income, we use jobs which pay low
wages and have little to no non-wage compensation. We define a ‘low wage’ job as one
in which a worker makes less than 1.5 times the minimum wage. The minimum wage is
designed to set a basic minimum standard of living for workers. In fact, many wage
rates are tied to the minimum wage; often workers gain wage increases for seniority or
supervisory duties relative to the minimum wage. Table 2.1 shows the progression of
minimum wage in Ontario and how it relates to the ‘low wage’ cut-off used here.16 The
Low-Income Measure (LIM) is a conceptual benchmark established by Statistics
Canada that adopts a more nuanced approach to measuring poverty than the Low-
Income Cutoff (LICO). The LIM is an internationally comparable benchmark that
represents a fixed percentage (50%) of the median adjusted household income,
adjusted to account for household size and location.17 The LIM, shown as a reference
point in Table 2.1, is for a single person in Canada living in a large urban area; more
than half of Ontarians live in large urban areas. Based on this reference, our cutoff of
1.5 times the minimum wage provides a reasonable, indexed measure for identifying
workers in low wage jobs.

Precarious Jobs in Ontario: Mapping Dimensions of Labour Market Insecurity by Workers’ Social Location and Context
Commissioned by the Law Commission of Ontario 6 November 2011
Table 2.1: Minimum Wage, Low-Wage Cutoffs and the Low Income Measure
Year
Ontario
Minimum Wage
Low Wage
Cutoff
(1.5 times the
minimum wage)
Maximum yearly
gross income of
full-time, workers
using this low-
wage cutoff*
Low-income
measure for a
single Canadian
living in a large
urban area**
1999 $6.85 $10.28 $21,372 $19,949
2000 $6.85 $10.28 $21,372 $20,929
2001 $6.85 $10.28 $21,372 $22,204
2002 $6.85 $10.28 $21,372 $23,099
2003 $6.85 $10.28 $21,372 $24,438
2004 $7.15 $10.73 $22,308 $25,302
2005 $7.45 $11.18 $23,244 $26,479
2006 $7.75 $11.63 $24,180 $27,657
2007 $8.00 $12.00 $24,960 $28,888
2008 $8.75 $13.13 $27,300 $30,064
2009 $9.50 $14.25 $29,640 $30,250
* Based on working 40 hours per week, 52 weeks a year
** Based on before tax income for those living in a CMA of 500,000 or more;18
Adjusted from 1992 dollars
using the Bank of Canada’s inflation calculator
Another measure of precariousness is having little non-wage compensation.
Based on the measures available, we use the presence or absence of an employer
pension plan as an indicator of this dimension of labour market insecurity. Although the
presence or absence of extended health, vision or dental benefits provides another
indicator of non-wage compensation, these data are not available.
We also contend that jobs that lack a full range of labour protections are more
likely to be precarious. This situation applies to the self-employed, and is also more
likely to apply to those who work in small firms, where the scope of employment
standards may be less comprehensive than in large firms (e.g., provisions for
termination and severance may be better for workers who are part of a mass layoff in
large firm as is the case in British Columbia) and their application and enforcement
tends to be more lax,19 and where employers are not required to abide by equal pay and
employment equity legislation.20 In this analysis, we consider those who work in firms of
less than twenty people to be precarious along this dimension. Small firms are also

Precarious Jobs in Ontario: Mapping Dimensions of Labour Market Insecurity by Workers’ Social Location and Context
Commissioned by the Law Commission of Ontario 7 November 2011
more likely to be subject to economic fluctuations, leading to layoffs and or termination
of workers in times of economic downturn. Finally, jobs in which workers have limited
control over the labour process tend to be more precarious. In this analysis, these jobs
are identified as those which are not unionized and/or where workers are not covered
by a collective agreement.
Ultimately, we combine these four measures (low income, no pension plan, small
firm size, and no union coverage) to create a composite measure of precariousness.
Although we recognize the existence of a continuum of precarious jobs,21 this composite
measure, which does not prioritize one dimension over another and thus rejects the
idea of weighting dimensions, deems that workers who indicate that their job has at
least three of these four features have precarious jobs.
A substantial literature indicates that people from socially disadvantaged groups
are more likely to be found in precarious jobs as are workers in particular industries and
occupations, leaving them vulnerable to economic uncertainty and restructuring.22 For
this reason, we elevate social relations of gender and migration and processes of
racialization in the analysis through the use of the indicators of sex,23 visible minority
status, ethnic background, and immigration status as well as examining sectoral,
industrial, and occupational patterns.
III. THE STRUCTURE OF THE LABOUR MARKET, 1999-2009
Over the past decade, a variety of forces have worked to shape Ontario’s labour
market. These include the development of a globalized labour force throughout the
1990s, the implementation of neoliberal employment policies during the mid-1990s, and
the effects of a global recession starting in 2007. The overall proportion of Ontario’s

Precarious Jobs in Ontario: Mapping Dimensions of Labour Market Insecurity by Workers’ Social Location and Context
Commissioned by the Law Commission of Ontario 8 November 2011
population that is in labour force has remained constant during the past decade, though
the proportion of those in the labour force who hold multiple jobs, an indicator of low
wage work, has shown a steady increase to a high of 12.8% in 2007, and then dropped
again to 1999 levels (see Graph 3.1). The unemployment rate in Ontario has fluctuated
from a low of 5.8% (in 2000), to the most recent high of 9% in 2009 (See Graph 3.1).24
Interestingly, the proportion of both self-employed employers, and solo self-
employed workers has remained relatively constant throughout the past decade, though
one might expect some fluctuation in relation to changing levels of employment and
unemployment. Overall, about 85% of the labour force are employees, with only about
15% who are self-employed (about 5% are self-employed employers, and 10% are solo
self-employed.25 It is possible that the quality of self-employment work has changed, as
many of the self-employed are now defined by law as either independent or dependent
contractors – indicating one marked change from the common perception of the self-
employed worker as a small business owner-operator.26 Changes in the quality of self-
employment are not possible to assess, however, with the data that are available.
Graph 3.1: Labour Force Characteristics, 1999-2009

Precarious Jobs in Ontario: Mapping Dimensions of Labour Market Insecurity by Workers’ Social Location and Context
Commissioned by the Law Commission of Ontario 9 November 2011
Trends in relation to the types of people who are self-employed are also
consistent across time. Among the solo self-employed, women are less likely to be self-
employed then men and, among self-employed women, solo self-employment, much of
it delivering low-income, is most common.27 Similarly, the level of education of self-
employed workers has also remained relatively consistent, suggesting that the levels of
socially recognized skills among the self-employed have remained relatively stable; that
is, there does not appear to have been a substantial growth or decline in so-called high-
skill professional self-employment, performed typically by workers with higher levels of
education, nor a substantial growth or decline in forms of self-employment characterized
by manual labour (e.g., cleaning, construction etc.) that are performed typically by
workers with lower levels of education.
Graph 3.2: Proportions of full-time (permanent/temporary) and part
time (permanent/temporary) work among employees, 1999-2009
Much like self-employment, the proportion of part-time employment in Ontario’s
labour force has also remained relatively constant across time (see Graph 3.2),

Precarious Jobs in Ontario: Mapping Dimensions of Labour Market Insecurity by Workers’ Social Location and Context
Commissioned by the Law Commission of Ontario 10 November 2011
suggesting that it has been a consistent feature of the labour market over the last
decade. Again, women are more likely to hold part-time employment, and this has not
changed substantially during the past decade. Similarly, workers with lower levels of
education are more likely to hold part-time forms of employment, but this trend has also
not varied substantially. In 2008, about a third of workers without a high school
education (34.4%) worked in part time jobs, compared to only 11.7% of workers with a
university degree.
Since in 2001, workers have been asked about the reasons why they were not
employed full-time in the previous year. The most common reason for part-time
employment reported is attending school. The next most common reason for part-time
employment is the inability to find full-time employment. With some yearly variation,
about a third of employees work fewer than 30 hours each week because they are
unable to find more work (see Graph 3.3). Not surprisingly, women are more likely to
report taking part-time employment because of the need to care for children; in 2008,
9.3% of women gave this reason for working part-time, compared to just 0.8% of men.
In contrast, men are more likely to report working part time because they are students;
37.2% of men gave this as a reason for working part time in 2008, compared to only
28.5% of women. Among men, however, we see a steady decline from 1999-2009 in
the proportion who work part time because they are students and a corresponding
increase in the proportion who could not find full-time jobs. In part, this might reflect an
increase in the barriers to accessing post-secondary education; whereas previously
those who could not find work may have found it easy to return to school, they may now
encounter substantial difficulties financing an education and/or gaining admission in an

Precarious Jobs in Ontario: Mapping Dimensions of Labour Market Insecurity by Workers’ Social Location and Context
Commissioned by the Law Commission of Ontario 11 November 2011
increasingly competitive post-secondary environment. Interestingly, this trend does not
appear for women, which provides further support for the notion that the factors that
influence women’s labour force decisions are different than those that influence men’s.
Graph 3.3: Reasons for part-time work, by gender, 2001-2009
MEN WOMEN
Overall, these results suggest a remarkable stability in the overall structure of the
Ontario labour force during the period from 1999-2009. Despite the economic recession
in 2007, the distribution of forms of employment has not changed substantially, though it
may be too soon for its effects to be apparent. These results also suggest that the
changes associated with the implementation of neo-liberal policies may have stabilized
by the turn of the millennium, creating a period of relative stasis which might be
identified as persistent precarity.

Precarious Jobs in Ontario: Mapping Dimensions of Labour Market Insecurity by Workers’ Social Location and Context
Commissioned by the Law Commission of Ontario 12 November 2011
IV. CHARACTERISTICS OF PRECARIOUS JOBS
In the conceptualization of precarious jobs, recall that we use four key indicators of
dimensions of labour market insecurity: low wages, no pension, no union coverage (i.e.,
either by a union or a collective agreement), and small firm size. Considering the labour
force as a whole, amongst these four indicators, no union coverage is the most
predominant in Ontario (see Graph 4.1). In 2008,28 approximately three out of every four
workers (73.5%) lacked union coverage. This trend has remained relatively consistent
across the past decade, despite changes to legislation weakening collective bargaining
overall.29
The next most prevalent indicator of precariousness is the absence of a pension
plan. Just slightly less than half of workers report that they have no access to an
employer sponsored pension plan, and this proportion has remained relatively
consistent over time. The fact that half of all workers lack pension plan coverage makes
the current concerns over the Canadian Pension Plan, also asserted by a 2008
provincial taskforce on pension reform,30 even more pressing, as many retiring workers
will not have access to additional retirement income beyond their own savings.
Following closely behind the lack of access to an employer sponsored pension
plan, about a third of all workers are consistently in low-wage jobs, despite the changes
in the minimum wage (and consequently a changing assessment of low-wage work)
across the past decade.
The least prevalent measure of precariousness is working in a small firm –
indeed, only about one in five employees work in firms of fewer than twenty people in

Precarious Jobs in Ontario: Mapping Dimensions of Labour Market Insecurity by Workers’ Social Location and Context
Commissioned by the Law Commission of Ontario 13 November 2011
Ontario. Again, the proportion of Ontarians working in small firms has remained
consistent across the past decade.
Graph 4.1: Prevalence of measures of precarious jobs, 1999-2009
One element key to understanding and mitigating precarious employment
involves discerning how these different factors cluster together. In 2008, about one in
five workers (20.3%) held jobs characterized by none of these indicators of
precariousness. The Venn diagram shown in Figure 4.1 shows the (non-proportional)
overlap between different aspects of precariousness for individual jobs/workers in 2008.
The darkest area in the middle of the Venn diagram shows that 8.3% of all workers are
in a job with all four indicators of precariousness; that is, their job has low wages, no
pension, no union, and is in a small firm. The most common indicator of precariousness
in isolation from the others is no union coverage; about 20% of workers overall have no
union coverage, but have relatively high wages, a pension plan and work in a large firm
(see Figure 4.1). In contrast, workers who are in a small firm are likely to also have no

Precarious Jobs in Ontario: Mapping Dimensions of Labour Market Insecurity by Workers’ Social Location and Context
Commissioned by the Law Commission of Ontario 14 November 2011
pension and no union coverage. Similarly, workers who earn low wages are likely to
also have no pension and no union coverage. Interestingly, it is rare for workers to only
have no pension; this phenomenon is most common in conjunction with the absence of
union coverage and/or low wages.
Figure 4.1: Overlap between indicators of precarious jobs, 2008
Overall, workers with three or more characteristics of precariousness are
deemed here to be in precarious jobs. These overlapping areas are indicated by the two
darkest shades in the Venn diagram in Figure 4.1. We can see that the most common
combination leading to a designation of a ‘precarious job’ is having a low wage, no

Precarious Jobs in Ontario: Mapping Dimensions of Labour Market Insecurity by Workers’ Social Location and Context
Commissioned by the Law Commission of Ontario 15 November 2011
union coverage, and no pension (13.3%). The next most common combination is having
a no union coverage, no pension, and working in a small firm (10.8%), followed by
having all four indicators (8.4%). In 2008, about a third of workers (33.1%) – more than
one-third of Ontario’s labour force – had a precarious job.
An inter-provincial comparison between Ontario and Quebec also shows a
remarkable consistency in the proportion of workers in precarious jobs across the past
decade in both contexts (see Graph 4.2).31 The consistency of precarious jobs is not
surprising for Ontario, given the erosion of collective bargaining and hence workers’
greater reliance on relatively weaker employment standards regulation since the early
1990s32 but is more surprising for Quebec given the slower decline of unionization in
that context33 and given especially improved employment standards regulations,
including those pertinent to wage levels, adopted partly to compensate for growing
precariousness in the early 2000s.34 These results suggest that, in the context of a
persistently structured labour force, labour regulations alone may not reduce the
prevalence of precarious jobs, particularly in circumstances where workers lack control
over the labour process through the limited provision of mechanisms for collective
representation.35

Precarious Jobs in Ontario: Mapping Dimensions of Labour Market Insecurity by Workers’ Social Location and Context
Commissioned by the Law Commission of Ontario 16 November 2011
Graph 4.2: Prevalence of Precarious Jobs in Ontario and Quebec, 1999-2009
Given the historical development of labour regulations in the context of the SER, it is not
surprising that form of employment is strongly linked to whether or not a job is
precarious. Full-time employees are less likely to be in precarious jobs than part-time
employees. Similarly, permanent workers are less likely to be in precarious jobs than
temporary workers. Table 4.1 shows the differing proportions of workers in each form of
employment who are in precarious jobs, with full-time permanent workers the least likely
to be precarious, and temporary part-time workers the most likely to be precarious.
Figure 4.2 provides more context to this trend, with higher proportions of workers falling
in the outer segment of the diagram depicting full-time workers as opposed to higher
proportions of workers falling near the centre of the diagram depicting part-time
workers.

Precarious Jobs in Ontario: Mapping Dimensions of Labour Market Insecurity by Workers’ Social Location and Context
Commissioned by the Law Commission of Ontario 17 November 2011
Table 4.1: Proportion of workers in precarious jobs,
by form of employment, 2008 % in
Precarious
Jobs
Overall 33.1
Full-time workers 25.4
Part-time workers 66.3
Permanent workers 27.6
Temporary workers 55.2
Permanent, full-time workers 21.9
Temporary, full-time workers 46.3
Permanent, part-time workers 62.4
Temporary, part-time workers 68.3
About a third of part-time workers (33.1%) are in jobs that have low wages, no
union, and no pension, compared to only 8.9% of full-time workers in this situation. Full-
time workers are much more likely to be in a job where the only indicator of
precariousness is the absence of a union. In a stark contrast, about one in five full-time
workers are in jobs without a single indicator of precariousness, whereas about the
same proportion of part-time workers are found in jobs characterized by all four
measures of precariousness.
The precariousness of jobs outside of the SER is even more evident when
permanent and temporary forms of paid employment are also taken into account. Figure
4.3 shows the relatively low levels of precariousness for workers in full-time permanent
jobs; about a quarter of such workers have no indicators of precariousness (24.8%),
and a further quarter of workers (28%) lack union coverage alone. Among workers in
full-time and part-time employment respectively, those in temporary jobs are more likely
to experience high levels of labour market insecurity than those in permanent jobs.

Precarious Jobs in Ontario: Mapping Dimensions of Labour Market Insecurity by Workers’ Social Location and Context
Commissioned by the Law Commission of Ontario 18 November 2011
Figure 4.2: Overlap between indicators of precarious jobs, by full/part-time status,
employees, 2008
Full-Time Workers Part-Time Workers
Part-time temporary workers are the most likely to hold precarious jobs, with fully a
quarter (26%) experiencing all four indicators of precariousness, and an additional third
(32.1%) experiencing low wages, no union coverage, and no pension. Overall, it is clear
that form of employment is strongly linked precariousness in a clear continuum; workers
in full-time permanent jobs, in a relationship which most closely resembles the SER, are
the least likely to precarious, while workers in part-time temporary jobs are the most
likely to be precarious.
The relationship between dimensions of labour market insecurity and form of
employment is particularly important because socio-demographic groups are unevenly
distributed across all four forms of employment (see Table 4.2). For instance, women
are much more likely to be engaged in part-time employment. Although women make

Precarious Jobs in Ontario: Mapping Dimensions of Labour Market Insecurity by Workers’ Social Location and Context
Commissioned by the Law Commission of Ontario 19 November 2011
Figure 4.3: Overlap between indicators of precarious jobs, by employment form,
employees, 2008
FULL-TIME WORKERS PART-TIME WORKERS
PE
RM
AN
EN
T W
OR
KE
RS
TE
MP
OR
AR
Y W
OR
KE
RS
up only about half of employees in Ontario, they constitute 72% of permanent, part-time
employees. Single parents (a group also comprised mainly of women) are also more
likely to be engaged in part-time temporary employment, which has the highest
likelihood of being precarious.

Precarious Jobs in Ontario: Mapping Dimensions of Labour Market Insecurity by Workers’ Social Location and Context
Commissioned by the Law Commission of Ontario 20 November 2011
Table 4.2: Socio-demographic characteristics of employees, by form of employment, 2008
Full-time employees Part-time employees
All
employees
(82.8%) (17.2%)
Permanent Temporary Permanent Temporary
(70.7%) (12.1%) (10.4%) (6.7%) (100%)
Women 45.1% 45.4% 71.5% 59.9% 49.4%
Visible Minorities 23.5% 23.8% 22.0% 30.3% 23.8%
Visible minority group
Chinese 23.9% 20.2% 8.9% 18.0% 21.3%
South Asian 20.1% 14.5% 20.1% 18.2% 19.4%
Black 16.3% 20.6% 18.0% 10.3% 16.4%
Southeast Asian 16.6% 11.3% 19.7% 19.7% 16.7%
Other visible minority 23.1% 33.4% 33.3% 33.8% 26.2%
Gender and Visible Minority Status
Non-visible minority Men 41.1% 43.8% 20.3% 26.4% 37.7%
Non-visible minority Women 35.3% 32.4% 57.7% 43.3% 38.1%
Visible minority Men 13.3% 11.7% 6.8% 11.9% 12.5%
Visible Minority Women 10.2% 12.1% 15.2% 18.4% 11.8%
Recent Immigrant (less than 10 yrs in Can) 9.2% 10.1% 9.3% 15.9% 9.8%
Gender and Immigration Status
Non-recent or non-immigrant Men 49.4% 51.5% 26.7% 32.0% 45.6%
Non-recent or non-immigrant Women 41.4% 38.4% 64.0% 52.1% 44.6%
Recent immigrant Men 5.2% 4.2% 1.4% 7.0% 4.7%
Recent immigrant Women 4.0% 5.9% 7.9% 8.9% 5.0%
Education
No high school diploma 8.9% 9.6% 19.5% 23.4% 11.2%
High school diploma 26.2% 39.9% 35.3% 38.1% 29.3%
College/trade certificate or diploma 36.3% 23.2% 28.2% 18.8% 33.1%
University degree 28.6% 27.4% 17.0% 19.7% 26.5%
Family Type
Couple without children 20.0% 15.3% 15.4% 11.9% 18.5%
Couple with children under 25 40.5% 39.3% 50.9% 49.8% 42.3%
Single parent with children under 25 5.6% 6.5% 8.8% 10.8% 6.4%
Unattached individual 13.9% 13.6% 6.9% 6.2% 12.5%
Other family type 20.0% 25.2% 17.9% 21.3% 20.3%
Overall, racialized workers are more likely to hold part-time temporary
employment, which has the highest likelihood of being precarious. Among racialized
workers, those of Chinese origin are most likely to be in full-time forms of employment,
and those from Southeast Asia are most likely to be found in part-time forms of

Precarious Jobs in Ontario: Mapping Dimensions of Labour Market Insecurity by Workers’ Social Location and Context
Commissioned by the Law Commission of Ontario 21 November 2011
employment. These findings reflect the social stratification of the labour market by race,
whereby workers from some racialized background tend to be clustered in certain types
of employment, both as a result of outright discrimination and the means by which group
members access the labour force (e.g., via employment agencies etc.). These results
also reflect how well established different cohorts of immigrants are in Canada.
Recent immigrants are more likely to be found in temporary, part-time work. Just
less than one in ten employees is a recent immigrant (9.8%), and yet recent immigrants
constitute 15.9% of temporary, part-time employees. The clustering of recent
immigrants in temporary forms of employment might reflect the difficulty of entering the
labour market in a new country, especially with foreign credentials and work experience.
There is some re-assurance in finding that established immigrants have job outcomes
relatively similar to their Canadian-born counterparts, but it is difficult to estimate the
effects of selection bias, that is, those immigrants who are not successful in entering
into the labour market are more likely to re-settle in another country or return to their
countries of origin.
Workers without a high school diploma are also likely to hold part-time jobs;
almost a quarter (23.4%) of part-time, temporary employees do not have a high school
diploma, and another 38.1% of these employees have only a high-school diploma. In
total, more than three out of every five part-time, temporary workers (61.5%) do not
have a post-secondary credential. This finding suggests that part-time temporary
employment is primarily held by workers who lack the formal credentials needed to
access other forms of employment.

Precarious Jobs in Ontario: Mapping Dimensions of Labour Market Insecurity by Workers’ Social Location and Context
Commissioned by the Law Commission of Ontario 22 November 2011
Though many of the preceding results are predictable given previous research
findings, this analysis highlights clearly the continued relationship between form of
employment and indicators of precariousness. It also highlights the continued need to
reduce precarious jobs by advancing labour regulations that promote the principles of
parity and inclusivity.36 By labour regulations fostering parity, we mean those that
address the diverse needs and situations of workers in different forms of employment
rather than prorating protections to the SER. For example, regulations that take into
account both working time over the lifecycle and total work, that is, paid and unpaid
work,37 rather than penalizing workers engaged in part-time employment due to, among
other reasons, responsibilities for care giving. By labour regulations supporting
inclusivity, we mean adopting comprehensive standards for all workers rather than
permitting exceptions by form of employment; for example, instead of regulations
excluding workers in temporary jobs from protections due to their limited job tenure,
provide for regulatory protections and social benefits beyond a single job.
V. WHAT TYPES OF JOBS ARE PRECARIOUS?
In addition to differences in the presence and absence of labour market insecurity
related to forms of employment, there are differences in the prevalence of precarious
jobs across the public and private sectors as well as by industry and occupation. These
differences also intersect with form of employment and socio-demographic
characteristics. As expected, in Canada (as in most other industrial nations), jobs in the
public sector, and especially full-time public sector jobs, are least likely to be precarious
(See Graph 5.1). In part, the security associated with public sector employment flows
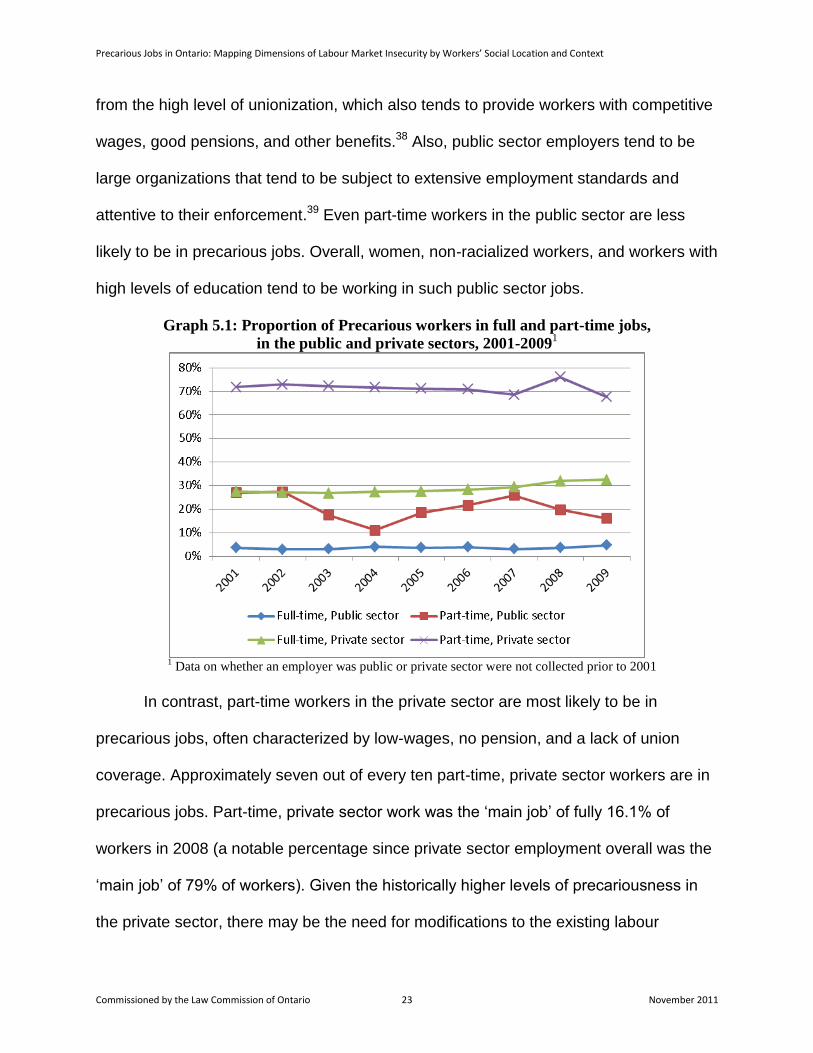
Precarious Jobs in Ontario: Mapping Dimensions of Labour Market Insecurity by Workers’ Social Location and Context
Commissioned by the Law Commission of Ontario 23 November 2011
from the high level of unionization, which also tends to provide workers with competitive
wages, good pensions, and other benefits.38 Also, public sector employers tend to be
large organizations that tend to be subject to extensive employment standards and
attentive to their enforcement.39 Even part-time workers in the public sector are less
likely to be in precarious jobs. Overall, women, non-racialized workers, and workers with
high levels of education tend to be working in such public sector jobs.
Graph 5.1: Proportion of Precarious workers in full and part-time jobs,
in the public and private sectors, 2001-20091
1 Data on whether an employer was public or private sector were not collected prior to 2001
In contrast, part-time workers in the private sector are most likely to be in
precarious jobs, often characterized by low-wages, no pension, and a lack of union
coverage. Approximately seven out of every ten part-time, private sector workers are in
precarious jobs. Part-time, private sector work was the ‘main job’ of fully 16.1% of
workers in 2008 (a notable percentage since private sector employment overall was the
‘main job’ of 79% of workers). Given the historically higher levels of precariousness in
the private sector, there may be the need for modifications to the existing labour

Precarious Jobs in Ontario: Mapping Dimensions of Labour Market Insecurity by Workers’ Social Location and Context
Commissioned by the Law Commission of Ontario 24 November 2011
regulations in order to further protect workers in these jobs from less-than-ideal
conditions.
Our analysis of precarious jobs by industry and occupation substantiates these
claims, with industries and occupations in the public sector (such as public
administration and utilities) characterized by low levels of precariousness. An analysis
of precarious jobs by industry shows that employment in accommodation and food
services industries is the most likely to be precarious, and that about three-quarters of
workers in that industry hold jobs that are precarious (see Appendix B, Table 5.1). This
finding reflects industry norms around low-wages and the lack of non-wage
remuneration. The typical worker in accommodation and food services is a woman, who
has schooling amounting to a high-school diploma or less. Racialized women, and
workers from South Asian and Filipino backgrounds, are also overrepresented in this
industry. Women who have immigrated to Canada in the past ten years are also
overrepresented in the accommodation and food services industries. Of all of the
industries, accommodation and food services has the highest proportion of part-time
employees (44%), about a third of whom (13.5% overall) are temporary.
The industry with the next highest level of precariousness over the past decade
is agriculture, though the proportion of agricultural workers in precarious jobs as a whole
appears to have declined, from a high of 80.5% in 1999 to a low of 64.7% in 2008.40 In
contrast to accommodation and food services, the typical worker in agriculture is a man,
with a college or trade certificate or diploma.41 Although agricultural workers tend to be
full-time, almost two in five workers (37.1%) are temporary full-time employees, and
thus are likely to lack the non-wage benefits and statutory entitlements that accrue to

Precarious Jobs in Ontario: Mapping Dimensions of Labour Market Insecurity by Workers’ Social Location and Context
Commissioned by the Law Commission of Ontario 25 November 2011
those that are permanent (e.g., access to employment insurance and employer pension
plans where they exist). This outcome reflects the seasonal nature of agricultural work,
which requires full (or more than full)-time work in peak planting and harvesting
seasons.
The industries with the next highest levels of precariousness are both service
industries: ‘other services’ (including repair and maintenance services, personal care
and laundry, and civic and professional organizations) and business, building and other
support services.42 Those working in ‘other services’ tend to be women, with a college
or trade certificate or diploma – in part reflecting the relatively low value placed on
service work associated with so-called women’s skills, such as personal care and
caregiving.43 Women who have recently immigrated to Canada and racialized workers,
especially those from Black and Southeast Asian backgrounds, are also over-
represented among workers in ‘other services’. Workers in building and business
support services are overwhelmingly men, with a high-school diploma. Overall, these
industry-specific results demonstrate the relative precariousness of service industries
assumed to be ancillary,44 and the stability of ‘core’ services such as education, public
administration, and utilities.
Paralleling the industry-specific findings, the occupations characterized by the
highest levels of labour market insecurity are also in the service sector (see Appendix B,
Table 5.2). The occupational group experiencing the highest degree of precariousness
is chefs, cooks and other workers in the food and beverage industry – primarily
restaurant servers.45 The occupational group with the second highest degree of
precariousness is retail sales clerks and cashiers. The profiles of workers in both of

Precarious Jobs in Ontario: Mapping Dimensions of Labour Market Insecurity by Workers’ Social Location and Context
Commissioned by the Law Commission of Ontario 26 November 2011
these occupational groups are quite similar: both groups are comprised overwhelmingly
of high-school educated women. Recent immigrants and racialized workers are over-
represented in sales and service occupations, though underrepresented among chefs,
cooks and other food and beverage workers. Both occupations are characterized by
high levels of part-time employment; almost half of all workers in food services (45%)
and the majority of workers in retail services (52.4%) are part-time. Retail services also
has a high proportion of temporary part-time employment (15.9%) overall, reflecting the
use of temporary staff in this sector as a way to deal with seasonal fluctuations in the
business cycle.
The occupational areas with the next highest level of precariousness are in
primary industries, including forestry and primary resource extraction, as well as some
agricultural occupations (excluding labourers). This occupational group consists
primarily of white men, although workers in this group have a diverse range of
educational backgrounds. Similar to workers in the agricultural industry described
above, these occupations are characterized by a high level of full-time temporary
employment, reflecting the seasonal nature of much of this work.
An analysis of work by industry and occupation shows how the features of some
forms of work – such as service and agricultural work – converge with those identified
with precariousness. Furthermore, the gendered and racialized nature of work in these
industries and occupations, intersect with the form of employment to result in a situation
where some social groups are more likely to be situated in precarious jobs than others.

Precarious Jobs in Ontario: Mapping Dimensions of Labour Market Insecurity by Workers’ Social Location and Context
Commissioned by the Law Commission of Ontario 27 November 2011
VI. WHO ARE WORKERS IN PRECARIOUS JOBS?
Workers’ social location clearly intersects with form of work to result in an
employment advantage or disadvantage for some groups of workers. In the analysis
below, we provide an analysis of how precarious employment is unevenly distributed
based on workers’ gender, immigration status, ethnicity, education and family status.
Overall, you can see that precarious jobs are not distributed evenly throughout the
labour force, with women, racialized women, recent immigrants, single parents and
those with less than a high-school education much more likely to be in jobs which are
insecure in some way (see Table 6.1). In the discussion that follows, graphs on the left
hand side show the proportion of all workers in precarious jobs whereas graphs on the
right hand side show the proportion of full-time permanent workers in precarious jobs.
Overall, it is clear that women are much more likely to be in precarious jobs than
men (see Graph 6.1), although this gender disparity has remained relatively stable over
the decade long period covered in this study. This trend relates primarily to women’s
greater tendency to work in part-time and/or temporary forms of employment, which
have more features of precariousness, than men’s. For some, engaging in part-time or
temporary employment may be a strategy responding to the increased demands of child
care which often fall to women. Even among full-time permanent workers, however,
women are more likely to hold precarious jobs than men (see Graph 6.2): women are
more likely to earn low wages (36.7% of women compared to 22.7% of men), to lack a
pension plan (58.7% of women compared to 52.6% of men), and to work in small firms
(23.5% of women compared to 19.6% of men).

Precarious Jobs in Ontario: Mapping Dimensions of Labour Market Insecurity by Workers’ Social Location and Context
Commissioned by the Law Commission of Ontario 28 November 2011
Table 6.1: Proportion of workers in precarious jobs,
by sociodemographic characteristics, 2008
% in
Precarious
Jobs
Overall 33.1%
Gender
Men 28.3%
Women 39.1%
Visible Minority Status
Non-Visible Minority 31.3%
Visible Minority 34.4%
Visible minority group
Chinese 38.2%
South Asian 34.6%
Arab 34.6%
Southeast Asian 30.0%
Black 29.5%
Gender and Visible Minority Status
Non-visible minority Men 26.9%
Non-visible minority Women 35.7%
Visible minority Men 26.5%
Visible Minority Women 43.1%
Immigration Status
Non-recent immigrant or non-immigrant 31.4%
Recent Immigrant (less than 10 yrs in Can) 40.7%
Gender and Immigration Status
Non-recent or non-immigrant Men 26.5%
Non-recent or non-immigrant Women 36.5%
Recent immigrant Men 32.7%
Recent immigrant Women 48.1%
Education
No high school diploma 61.4%
High school diploma 42.7%
College/trade certificate or diploma 27.5%
University degree 17.1%
Family Type
Couple without children 24.4%
Couple with children under 25 36.1%
Single parent with children under 25 51.7%
Unattached individual 27.1%
Other family type 34.7%

Precarious Jobs in Ontario: Mapping Dimensions of Labour Market Insecurity by Workers’ Social Location and Context
Commissioned by the Law Commission of Ontario 29 November 2011
Graph 6.1: Proportion of all workers in precarious
jobs, by gender, 1999-2009
Graph 6.2: Proportion of full-time permanent
workers in precarious jobs, by gender, 1999-2009
Single parents are also more likely than people in other family configurations to be in
precarious jobs. This finding flows clearly from gender relations; single parents are
much more likely to be women than men, and thus more likely to be in precarious jobs.
Although the effect of gender is most substantial, racialized workers tend to be
slightly more likely to be in precarious jobs than their same-gender counterparts (see
Graphs 6.3 & 6.4). In the period from 2002-2007 in particular, workers from Arab
backgrounds were considerably more likely to hold precarious jobs. In part, this trend
might reflect the overall increase in discrimination against those from Arab backgrounds
as a result of the cultural discourses and practices related to race which emerged
following the attacks on the World Trade Centre in September 2001. Among full-time
permanent workers, members of racialized groups are more likely to earn low wages
(22.9% compared to 14.0% for non-racialized workers). Racialized women are at a
particular wage disadvantage, with a third of racialized women (33.2%) reporting low
wages, compared to 18.7% of non-racialized women. Low wages are also notably
prevalent among workers from Chinese and Filipino backgrounds, with about a third of
full-time, permanent employees in each of these racialized groups earning low wages.

Precarious Jobs in Ontario: Mapping Dimensions of Labour Market Insecurity by Workers’ Social Location and Context
Commissioned by the Law Commission of Ontario 30 November 2011
Graph 6.3: Proportion of all workers in precarious
jobs, by racialization and gender, 1999-2009
Graph 6.4: Proportion of full-time permanent
workers in precarious jobs, by racialization and
gender, 1999-2009
Racialized workers are also less likely to work in unionized workplaces and less
likely to have a pension plan. Four out of five racialized workers (79.9%) work in non-
unionized workplaces, and almost half of racialized workers (47.1%) lack a pension plan
(compared to the still high 68.4% non-racialized workers who work in non-unionized
workplaces, and 42.0% who lack a pension plan). Workers from Chinese backgrounds
are especially likely to lack both union coverage and pension plans compared to
workers from other ethnic backgrounds. Although racialized workers are less likely to be
employed in small firms overall, a gender analysis shows that racialized women are
more likely to work in small firms, whereas racialized men are less likely to work in small
firms.
In general, recent immigrants to Canada are more likely to be in precarious jobs;
in 2008, 40.7% of immigrants who had been in Canada less than 10 years were in
precarious work, compared to only 31.4% of workers who were Canadian born or who
had immigrated 10 or more years ago. The integration of a gender analysis shows that
women who have recently immigrated are more likely to be in precarious jobs than

Precarious Jobs in Ontario: Mapping Dimensions of Labour Market Insecurity by Workers’ Social Location and Context
Commissioned by the Law Commission of Ontario 31 November 2011
women who are not recent immigrants (see Graph 6.5), whereas for men the trend is
less clear. A notable finding is that the proportion of workers in precarious jobs is
relatively consistent for non-immigrants and non-recent immigrants. In contrast, there is
much more variation in the proportion of recent immigrants with precarious jobs over
time. Although some of this result can be explained by the smaller sample size of recent
immigrants, it also suggests that recent immigrants are more susceptible to fluctuations
in the labour market than their more established counterparts.
Graph 6.5: Proportion of all workers in precarious
jobs, by immigrant status & gender, 1999-2009
Graph 6.6: Proportion of full-time permanent
workers in precarious jobs, by immigrant status and
gender, 1999-2009
Women who have recently immigrated to Canada are especially likely to be in low
wage jobs. Even among full-time permanent workers, almost half (46.6%) of women
who have recently immigrated were working in low wage jobs. Women who have
recently immigrated are also more likely to being working in a job with no pension;
60.9% of recent immigrant women report having no pension, compared to just over 40%
of recent immigrant men, and non-recent or non-immigrant women and men.
There is also a clear relationship between level of education and being precariously
employed in Ontario. As expected, those with lower levels of education are more likely
to be in precarious jobs. Notably, the service sector and agricultural jobs most likely to

Precarious Jobs in Ontario: Mapping Dimensions of Labour Market Insecurity by Workers’ Social Location and Context
Commissioned by the Law Commission of Ontario 32 November 2011
be precarious are also those that require relatively low levels of education. Once again,
however, even among those in full-time permanent jobs, those with lower levels of
education are more likely to be in precarious forms of employment. Workers with less
than a high school education are more likely to have each of the four indicators of
precarious employment used in this analysis. For example, in 2008, 59.9% of those
without a high school diploma made low wages, compared to only 13.8% of those with a
university degree. Similarly, 77.5% of those without a high school diploma lack an
employer pension plan, compared to 42.1% of those with a university degree.
Graph 6.7: Proportion of all workers in precarious
jobs, by education, 1999-2009
Graph 6.8: Proportion of full-time permanent
workers in precarious jobs, by education, 1999-2009
Overall, these analyses show clear relationship between form of employment, socio-
demographic characteristics and precarious jobs. Notably, however, even among full-
time permanent employees, some groups of workers are more likely to be
disadvantaged. Women, visible minority women, workers from Chinese backgrounds,
recent immigrants – and especially recently immigrated women, and workers with lower
levels of education are more likely to hold precarious jobs than others.

Precarious Jobs in Ontario: Mapping Dimensions of Labour Market Insecurity by Workers’ Social Location and Context
Commissioned by the Law Commission of Ontario 33 November 2011
VII. CONCLUSIONS AND RECOMMENDATIONS: THE MORE THINGS CHANGE, THE
MORE THEY STAY THE SAME
The foremost conclusion of this investigation into the dynamics of precarious
employment in Ontario is continuity: over the last decade, even though there were
changes in the labour market, such as continued decline in manufacturing, recession,
and decollectivization, measured statistically the magnitude and nature of precarious
jobs persisted.
Echoing previous research findings centering on Canada as a whole, in Ontario a
continuum of precarious forms of employment exists, whereby full-time permanent jobs
exhibit the fewest and part-time temporary jobs exhibit the greatest dimensions of
labour market insecurity. Part-time temporary jobs are characterized by the largest
number of features of labour market insecurity followed by jobs that are part time and
other jobs that are temporary. Furthermore, the forms of employment characterized
most by precariousness are also those in which many women and single parents (part-
time forms) as well as members of particular ethnic groups (full- and part-time
temporary forms) participate.
Precarious jobs also tend to cluster in the private rather than the public sector,
where accommodation and food services industries, agriculture, and ‘other services’
tend to be host to those that are most insecure. Occupational groups experiencing high
levels of insecurity include chefs, cooks and other workers in the food and beverage
industry, and retail sales clerks and cashiers, as well as workers in occupations in the
primary industry. For these occupational groups, low levels of education are correlated
with precarious jobs, except for some women in certain types of service work, where the

Precarious Jobs in Ontario: Mapping Dimensions of Labour Market Insecurity by Workers’ Social Location and Context
Commissioned by the Law Commission of Ontario 34 November 2011
educational qualifications of those in service oriented careers may be undervalued. In
addition to women, racialized women, and workers from particular ethnic backgrounds
tend to be concentrated in industries occupational groups in which many jobs are
characterized by dimensions of labour market insecurity; for example, Southeast Asian
and Filipino workers in accommodation and food services industries.
Workers in precarious jobs in Ontario are also much more likely to be women
than men due largely to women’s concentration in part-time and temporary forms of
employment. Sharp gender disparities nevertheless exist in full-time permanent jobs
indicative of the ‘feminization of employment norms’46 or a gendered ‘harmonizing down’
in which more jobs in the labour market resemble so-called ‘women’s work’ deviating
from the SER47– i.e., not all jobs resembling the dominant form of the SER are
characterized access to training, regulatory protections and social benefits, decent
wages, and a social wage. Other findings pertinent to gender relations reinforce this
conclusion, including that workers who are single parents, a majority of whom are
women, are more likely than workers in other family forms to be in precarious jobs.
Racialized workers also tend to be more likely to be in precarious jobs than their
same-gender counterparts. Workers of Chinese decent in particular tend to be located
in jobs with low wages, no pensions, and no union representation even though many
hold full-time jobs. Give that people from Chinese backgrounds are the largest ethnic
group in the Ontario labour force, this is a particularly worrisome finding. These results
reflect those of another recent survey conducted by the Chinese Interagency Network in
Toronto, which found that many Chinese workers were not aware of their workplace
rights or labour regulations.48

Precarious Jobs in Ontario: Mapping Dimensions of Labour Market Insecurity by Workers’ Social Location and Context
Commissioned by the Law Commission of Ontario 35 November 2011
A. Reducing precarious jobs in Ontario: Recommendations
A number of recommendations for legal reform flow logically from these findings. We
make four interrelated proposals below, selecting but a few that are potentially of high
impact should they be taken up in combination by law- and policy-makers. We call for
an integrated approach to limiting precarious employment in Ontario since our analysis
underscores the multidimensional nature of problem, highlighting the necessity of
multipronged solutions.
1. Improve the wage package in Ontario
Our findings suggest that in 2008, among those with no union coverage and no pension
plan, a quarter of workers made $10 or less and half made $14 or less. Our profile of
precarious jobs in Ontario demonstrates that more is at work than simply low wages,
and yet adjustments in wages are crucial to pulling workers out of precarious jobs. To
this end, raising the minimum wage such that everyone who is engaged in ongoing full-
time employment (40 hours a week, 52 weeks a year), which could be drawn from
multiple jobs, should earn enough to be above the LIM for a single person in an urban
area is crucial.49 This corresponds to a minimum wage of $14.55 an hour. This sum
reflects a “low income” line (as opposed to a poverty line) consistent with a fair minimum
wage policy to protect workers against inflation (i.e., providing for a cost-of-living
increase and thus financial stability for workers in Ontario). The LIM provides a useful
measure here because it is a relative measure; that is, it is based on 50% of the median
adjusted family income, and recalculated annually. As a result, it fluctuates based on
changes in the population economic family income, without being tied to more volatile

Precarious Jobs in Ontario: Mapping Dimensions of Labour Market Insecurity by Workers’ Social Location and Context
Commissioned by the Law Commission of Ontario 36 November 2011
measures, such as the inflation rate. In addition, the LIM is calculated separately for
families living in rural areas and cities of different sizes. As a result, it is more sensitive
to the context of income than many other low income measures. Using this adjusted
minimum wage, single workers living in an urban area would need to work
approximately 27-28 hours a week to fall above Statistics Canada's Low-Income Cut-Off
line, a de facto poverty line calculated on the basis of spending a higher than average
proportion of income on necessities like food, shelter and clothing. This would ensure
that part-time workers especially, were less likely to live in poverty. This is particularly
important, given the unequal distribution of part-time work throughout the labour force,
and the clustering of some disadvantaged groups (women, recent immigrants) in part-
time work.
In addition, measures encouraging employers to augment the wage package are
required; one indirect mechanism, which forms the basis for our second linked
recommendation, involves legislative changes supporting unionization in light of the
union wage premium evident in Ontario as well as unionized workers’ greater access to
social benefits, such as pensions. In particular, the higher proportion of racialized
workers in jobs with no pension and no unionization is worrying, in that it suggests that
racialized workers are less likely to be hired into jobs where workers have a modicum of
control over the labour process, reflecting continued and systemic discrimination.50 With
regard to the wage package, one strategy for counteracting this systemic discrimination
is by providing structural incentives for more employers to provide access to pension
plans, and thus decreasing inequity for current workers, and ultimately, for retirees.
Unionization provides one avenue for increasing worker control and providing access to

Precarious Jobs in Ontario: Mapping Dimensions of Labour Market Insecurity by Workers’ Social Location and Context
Commissioned by the Law Commission of Ontario 37 November 2011
more social benefits, but similar effects could be achieved with other models of worker
organization, government-sponsored incentives or legislation.
2. Promote greater worker control over the labour process via improved access to
unionization and other workplace regulations fostering labour market security
By far, the most common dimension of labour market insecurity characterizing
precarious jobs in Ontario is a lack of control over the labour process, measured in this
report as the absence of union coverage or coverage under a collective agreement.
This conclusion underscores the need to not only redress continued de-collectivization
and/or stagnation of labour relations in Ontario51 but to reverse this trend. As indicated
above, this recommendation is linked to the need to improve pensions and wages
among workers in precarious jobs since unions representing workers collectively, as
opposed to individual workers negotiating singly, are more likely to secure such social
benefits as well as better wages. Other vehicles for improving worker control are also,
however, important to pursue. Foremost is perhaps improving workplace regulations
benefiting union and non-union workers, specifically widening the scope of coverage
under employment standards legislation and improving their enforcement, which brings
us to our third recommendation.
Additionally, it is high time to introduce mechanisms of broader-based bargaining
for self-employed and other workers in precarious paid employment who face
challenges to unionizing and/or, at a minimum, to benefiting from collectively agreed
standards. Meeting the former challenge necessitates, among other things, providing
for regional or geographical and/or occupational unionisms through legislation and

Precarious Jobs in Ontario: Mapping Dimensions of Labour Market Insecurity by Workers’ Social Location and Context
Commissioned by the Law Commission of Ontario 38 November 2011
policy (e.g., permitting multi-employer agreements applicable to a given sector); such
measures would respond to problems created by majority unionism now in operation
and inhibiting organizing among the precariously employed, especially in small
workplaces. Overcoming the latter hurdle could involve juridical extension of labour
relations and standards of the sort operating in Quebec’s decree system, which allows
for the extension of the terms of a collective agreement across a sector to cover both
unionized and non-unionized workers although a quite significant limitation is that it
does not regulate a system of representation for workers.52
3. Expand the scope of employment standards (ES) and enforce them
The preceding analysis by form of employment reveals a relationship between
certain inclusions and exclusions from minimum employment standards in Ontario and
the persistently high numbers of workers in part-time and temporary jobs. As illustrated
above, although precarious employment is not synonymous with non-standard
employment, much depends on the nature and organization of labour market
regulations. In Ontario, for instance, many solo self-employed workers are excluded
from protection because of their employment status, that is, they are either treated as
dependent or independent contractors unlike in the province’s Occupational Health and
Safety Act which extends protection to the many self-employed workers in precarious
jobs by defining a worker as “a person who I paid to perform work or supply service”
and thus covers more workers dependent on their capacity to work.53 Similarly, workers
in different types of temporary employment lack full coverage under the Employment
Standards Act (e.g., seasonal workers, especially in agriculture and workers with
insufficient job tenure do not benefit fully from termination and severance provisions and

Precarious Jobs in Ontario: Mapping Dimensions of Labour Market Insecurity by Workers’ Social Location and Context
Commissioned by the Law Commission of Ontario 39 November 2011
provisions for joint and several liability required by temporary agency workers are
limited) yet there is no principled reason why the Act could not be modified to apply fully
to these workers, nor is their justification for tying other statutory and employer social
benefits to tenure in a single employee-employer relationship.54 Finally, part-time
workers do not benefit from provisions for equal treatment with workers in other forms of
employment doing similar work, an omission that could be rectified by drawing on
provisions contained in parallel legislation in Quebec. These are but a few ways in
which the scope of ES should be reformulated that could reduce the by no means
necessary correlation between so-called non-standard forms of employment and
precariousness that respond to the new structure of the labour force.
At the same time, also consistent with our leading premise that some full-time
permanent jobs can be precarious and the overarching conceptualization of precarious
employment as a multidimensional phenomenon, our investigation highlights the
erosion of the full-time permanent job for certain groups of workers, such as women,
including racialized women, recent immigrants, as well as among workers with relatively
low levels of education. These are workers who have faced labour market discrimination
of various sorts historically, and are experiencing obstacles to accessing good jobs and
a full range of labour protections at present. For these workers, ostensibly covered fully
by ES, as well as workers in other forms of employment, their enforcement is essential.
This conclusion is borne out in a parallel study on ES and OHS enforcement in Ontario
included in this working paper series, which finds deterioration in both enforcement
regimes through policy analysis and a review of administrative practices. Indeed, in the
case of ES, this study documents a backlog in complaints, insufficient numbers of
Precarious Jobs in Ontario: Mapping Dimensions of Labour Market Insecurity by Workers’ Social Location and Context
Commissioned by the Law Commission of Ontario 40 November 2011
labour inspectors, an overly narrow approach to labour inspection, and limitations in the
governance of penalties for violators and collections processes as well as highlights
larger problems with a complaint-based ES system, especially during an economic
downturn (i.e., workers are reluctant to complain for fear of job loss, with little certainty
that they will obtain sufficient representation, and/or without any guarantee they will
receive the compensation they deserve).
Collectively, such findings reflect our conclusion that ‘the more things change the
more they stay the same.’ They help explain why it is that, from a statistical vantage
point, precarious jobs in Ontario can look somewhat similar (or only marginally worse) in
2009 to what they were in 1999 despite the deterioration that has occurred in labour
market regulations.
4. Improve the social measurement of job quality and precariousness
Worsening conditions for many workers may not be visible statistically because
of limitations in the way the data are collected (sampled) and the ways that job quality is
measured. As a result, many national surveys related to job quality provide only an
incomplete picture, which makes it difficult to develop comprehensive and effective
policy recommendations. Politically, the limited knowledge available about job quality
makes it easier to ignore or discount changes in people’s working conditions, and
harder for advocates to track declines and lobby for improvements.
One clear limitation of using national survey data to measure job quality is the
reliance on household telephone sampling, which does not capture the most marginal
workers. Research on the United States shows that young people, people living in

Precarious Jobs in Ontario: Mapping Dimensions of Labour Market Insecurity by Workers’ Social Location and Context
Commissioned by the Law Commission of Ontario 41 November 2011
poverty, and renters are much more likely to have only cell phones.55 These groups are
also more likely to be in precarious jobs, but their experiences are not captured in
telephone surveys. Similarly, people living in transient or communal housing
arrangements (such as migrant workers) are unlikely to have a household telephone. In
order to capture the experiences of these more marginal workers accurately, non-
probability sampling approaches should also be used in conjunction with these
probability sampling methods.
In addition, most national labour surveys, such as the SLID, ask questions about
the structure of jobs, but collect little information about respondents’ perceptions of job
quality. The indicators used here – low wages, no pensions plan, no union coverage,
and being in a small firm – are commonly used because they constitute so-called
‘objective’ measures of job quality. They fail to capture sufficiently the complex, and
multi-faceted experience of working in a precarious or poor quality job. The addition of
some ‘subjective’ measures of job quality would help to unearth more fully workers
perceptions of their working conditions and their integration into their workplace. For
instance, questions about how long workers expect to be in their current job, whether
their skills are valued in their current position, and whether they feel their work could be
done by others in their establishment would provide good indicators of job stability of
precariousness. Another potentially useful measure of job stability could be the amount
of training that an employee receives when starting their job, since this represents the
amount of investment an employer makes in a new employee (and also factors into the
potential cost of replacing them). More comprehensive measures of job quality in
quantitative surveys– such as information about sense of control, efficacy, work

Precarious Jobs in Ontario: Mapping Dimensions of Labour Market Insecurity by Workers’ Social Location and Context
Commissioned by the Law Commission of Ontario 42 November 2011
scheduling, and the enforcement of labour standards - would also help to better
evaluate how the experience of working in Ontario is changing.56 More broadly, of
course, a balance between quantitative and qualitative research is required such that
the latter is developed to respond to predictable limits of the former.
Precarious Jobs in Ontario: Mapping Dimensions of Labour Market Insecurity by Workers’ Social Location and Context
Commissioned by the Law Commission of Ontario 43 November 2011
APPENDIX A: DATA SOURCES AND ANALYSIS
The above analysis relies on Statistics Canada’s Survey of Labour and Income
Dynamics (SLID; 1999-2009). The SLID was introduced in 1993 in order to improve
understandings of the economic well-being of Canadians over time, and provides
information on people’s labour force experiences, human capital and demographic
characteristics.
The SLID sample is composed of two panels of respondents (roughly 30,000
adults in 15,000 households), and each panel is surveyed annually for a six year period,
with a new panel being selected every three years.57 The SLID sample is selected from
the monthly Labour Force Survey, which uses a two-stage sampling process, first
selecting a sample of geographic areas, and then a sample of dwellings from each
area.58 Residents of institutions and persons living on Indian reserves or in military
barracks are excluded from the SLID sample. The longitudinal nature of the SLID is
particularly useful for understanding how household income changes over time, but also
makes it difficult to capture the experiences of migrant workers, or people who move
often. Each successive wave within a panel has declining response rates and
respondents who miss responding to two subsequent years of a survey are treated as
non-respondents.59 Thus, those who move frequently are unlikely to be included in later
waves of the survey. For instance, a demographic analysis shows that young people
have lower response rates to the SLID than those who are middle-aged and seniors,60
in part because this group is more difficult to trace than more established households
and household members. The variation in response based on age is compensated for
by Statistics Canada’s weighting system, and so accurate population estimates can still

Precarious Jobs in Ontario: Mapping Dimensions of Labour Market Insecurity by Workers’ Social Location and Context
Commissioned by the Law Commission of Ontario 44 November 2011
be made, but concerns remain about the SLIDs effectiveness in capturing highly mobile
populations.
The SLID uses Computer-Assisted Telephone interviewing for data collection,
using the basic contact information for each household established in the LFS. Access
to the public-use SLID microdata from 1999-2008 for this research was obtained under
a license agreement from Statistics Canada, data from 2009 was accessed using the
SLIDRet remote retrieval system. Data were analyzed using SPSS 18, using the
appropriate population weights.
The primary population of interest in this analysis is people residing in Ontario
who were members of the labour force in the relevant year. For the majority of the
analysis, the focus is on those who were employees (i.e. not self-employed). The
analysis is based on respondents’ ‘main’ job in the reference year, that is, the job in
which they had the most scheduled hours (or if scheduled hours are equal in more than
one job, the job with the highest earnings). Thus, this analysis provides an assessment
of precariousness in workers’ main jobs, and not in auxiliary or secondary jobs.
It is important to note that the variables used in this analysis of precarious work
are based on employee reporting, and not employer reports. For instance, workers were
asked: “In your job with [employer], did you have an employer pension plan?” and “How
many persons were employed at the location where you worked for [employer]?” (or all
locations, if the employer has more than one location). Respondents’ hourly wages are
based on the amount paid at the end of the reference year (or the end of the job) and
includes tips, bonuses and commissions. For respondents who did not report an hourly
wage amount, the implicit hourly wage is calculated using income, months, weeks and

Precarious Jobs in Ontario: Mapping Dimensions of Labour Market Insecurity by Workers’ Social Location and Context
Commissioned by the Law Commission of Ontario 45 November 2011
hours worked. Proxy reporting is allowed in the SLID; that is, household respondents
can answer for others in the household provided they are knowledgable and willing to
do so.
The results presented above are based on yearly, cross-sectional estimates.
That is, the trajectory of individual workers and/or households is not tracked over time,
but the aggregate results from each year are compared to those of previous years, in
order to show change or stability over time.

Precarious Jobs in Ontario: Mapping Dimensions of Labour Market Insecurity by Workers’ Social Location and Context
Commissioned by the Law Commission of Ontario 46 November 2011
APPENDIX B: PRECARIOUS EMPLOYMENT BY INDUSTRY AND OCCUPATION, 1999-2009
Table 5.1a: Proportion of workers who have precarious jobs, by industry, 1999-2009
Year
Accomm-
odation &
Food Services Agriculture Other Services
Business,
Building, &
Other Support
Services Trade Construction
Information,
Culture, &
Recreation
Professional,
Scientific, &
Technical
Services
1999 78.2% 80.5% 59.2% 50.9% 54.5% 41.0% 33.4% 37.4%
2000 76.4% 84.0% 52.8% 54.0% 48.5% 37.7% 37.5% 30.7%
2001 74.0% 78.1% 49.6% 45.3% 48.9% 40.5% 37.4% 26.9%
2002 76.1% 76.9% 57.1% 44.8% 47.7% 36.0% 29.6% 24.2%
2003 74.1% 68.1% 59.3% 47.4% 45.2% 37.7% 31.7% 25.2%
2004 74.3% 68.1% 61.4% 43.8% 48.3% 43.0% 29.0% 28.9%
2005 76.0% 69.9% 58.1% 50.9% 44.7% 36.9% 37.3% 28.8%
2006 72.3% 65.1% 52.7% 44.8% 45.0% 42.9% 43.2% 29.4%
2007 73.4% 68.6% 50.7% 39.3% 47.0% 39.1% 34.7% 25.0%
2008 76.0% 64.7% 61.6% 61.5% 50.6% 42.6% 38.0% 32.4%
2009 68.3% 74.0% 55.4% 60.1% 46.6% 47.5% 38.5% 35.8%
Table 5.1b: Proportion of workers who have precarious jobs, by industry, 1999-2009
Year
Health Care &
Social
Assistance
Transportation
&
Warehousing
Forestry,
Fishing,
Mining, Oil &
Gas
Finance,
Insurance, Real
Estate &
Leasing Manufacturing
Educational
Services
Public
Administration Utilities
1999 24.2% 24.0% 11.9% 21.1% 18.1% 12.4% 12.0% 6.4%
2000 21.3% 20.6% 16.1% 18.2% 15.5% 9.3% 6.9% 3.1%
2001 20.4% 18.0% 14.4% 17.3% 15.9% 12.0% 7.5% 1.5%
2002 20.9% 17.2% 14.3% 14.5% 12.9% 14.4% 3.5% 0.0%
2003 20.5% 20.2% 17.6% 14.4% 14.6% 8.4% 4.3% 0.0%
2004 17.3% 18.1% 14.8% 13.9% 12.0% 9.5% 4.4% 4.3%
2005 19.2% 14.0% 16.5% 18.4% 13.1% 8.8% 5.1% 0.9%
2006 23.9% 19.8% 17.6% 12.9% 13.8% 13.4% 2.8% 3.3%
2007 20.1% 17.3% 32.6% 17.2% 16.5% 14.3% 2.2% 2.2%
2008 25.7% 18.8% 28.1% 14.6% 16.1% 13.6% 5.1% 1.7%
2009 24.6% 28.4% 21.2% 16.7% 16.7% 12.5% 3.1% 3.9%

Precarious Jobs in Ontario: Mapping Dimensions of Labour Market Insecurity by Workers’ Social Location and Context
Commissioned by the Law Commission of Ontario 47 November 2011
Table 5.2a: Proportion of workers in precarious jobs, by occupation, 1999-2009
Year
Chefs,
Cooks,
Food &
Beverage
Service
Retail
Sales,
Clerks &
Cashiers
Primary
Industry
Sales &
Service
Cons-
truction
Trades
Art,
Culture,
Recreation
& Sport
Child
Care &
Home
Support
Trades,
Helpers,
Cons-
truction &
Transport
Process-
ing,
Manu-
facturing
& Utilities
Transport
&
Equip-
ment
Operators
Financial,
Secretarial
& Admin.
Other
Trades
1999 83.3% 72.9% 61.6% 63.1% 44.6% 38.4% 42.9% 39.0% 36.4% 31.9% 26.7% 25.0%
2000 80.3% 67.3% 59.6% 56.3% 37.4% 47.5% 38.9% 37.4% 29.0% 32.5% 30.5% 22.6%
2001 73.5% 67.8% 59.9% 54.5% 37.8% 39.1% 43.5% 37.9% 30.3% 28.1% 31.7% 23.7%
2002 74.7% 67.4% 66.4% 55.0% 39.7% 31.7% 49.0% 35.6% 31.6% 30.5% 27.9% 25.8%
2003 80.4% 62.0% 59.1% 53.8% 43.8% 34.8% 38.8% 32.6% 42.1% 30.5% 26.2% 23.8%
2004 73.8% 64.0% 54.9% 57.5% 41.6% 38.4% 24.0% 46.0% 36.2% 25.9% 30.0% 26.6%
2005 71.3% 60.4% 64.2% 62.4% 36.2% 42.4% 31.4% 37.2% 36.1% 24.4% 30.8% 23.8%
2006 69.2% 65.9% 63.0% 53.8% 48.4% 38.6% 41.6% 36.1% 30.7% 28.4% 31.0% 23.9%
2007 69.3% 59.5% 53.9% 59.8% 46.6% 37.6% 38.3% 37.2% 40.0% 35.4% 32.3% 25.7%
2008 80.8% 67.0% 59.4% 60.2% 46.7% 46.8% 34.1% 39.6% 32.6% 37.1% 26.8% 26.9%
2009 77.3% 64.0% 63.7% 54.9% 53.9% 46.5% 42.6% 52.0% 23.5% 34.9% 33.1% 26.1%
Table 5.2b: Proportion of workers in precarious jobs, by occupation, 1999-2009
Year Clerical
Technical,
Assist. &
Related
Occ. in
Health
Technical,
Insurance,
Real
Estate
Sales, &
Grain
Buyers
Machine
Operators
&
Assemb.
in Manu-
facturing
Protective
Services
Other
Manage-
ment
Con-
tractors &
Super-
visors in
Trades &
Transport
Senior
Manage-
ment
Prof.Occ.
in
Business
& Finance
Natural &
Applied
Sciences
Teachers
&
Professors
Prof.Occ.
in Health,
Nurse
Super-
visors &
Registered
Nurses
1999 30.8% 26.2% 27.8% 18.8% 23.9% 17.7% 18.0% 25.2% 11.8% 13.1% 11.6% 10.1%
2000 27.1% 22.1% 22.7% 15.7% 18.5% 14.4% 17.1% 15.5% 11.8% 11.1% 5.7% 8.6%
2001 26.3% 22.1% 22.7% 17.2% 11.2% 17.3% 24.4% 9.6% 7.6% 7.4% 7.2% 6.6%
2002 20.5% 22.9% 19.3% 14.7% 13.9% 12.2% 15.2% 13.5% 10.4% 8.2% 8.0% 4.5%
2003 21.8% 23.2% 19.7% 14.5% 13.4% 14.9% 10.8% 4.7% 8.0% 8.6% 5.2% 6.2%
2004 17.6% 18.2% 20.4% 12.9% 9.7% 16.3% 12.9% 6.4% 13.5% 10.5% 4.7% 4.7%
2005 23.3% 22.5% 17.4% 15.2% 13.9% 15.1% 12.8% 6.5% 16.4% 9.1% 5.4% 4.7%
2006 23.3% 24.7% 17.9% 18.2% 17.7% 12.4% 12.8% 6.3% 12.7% 11.9% 7.8% 6.1%
2007 24.2% 17.4% 15.2% 17.9% 13.4% 16.7% 15.5% 2.7% 8.2% 12.5% 7.5% 5.5%
2008 31.2% 28.7% 27.2% 19.6% 15.9% 14.2% 5.1% 25.0% 11.3% 11.6% 9.0% 6.8%
2009 28.6% 26.3% 32.8% 22.2% 28.9% 15.0% 21.1% 13.3% 9.5% 12.5% 7.3% 10.2%

Precarious Jobs in Ontario: Mapping Dimensions of Labour Market Insecurity by Workers’ Social Location and Context
Commissioned by the Law Commission of Ontario 48 November 2011
ENDNOTES 1 Authorship is alphabetical to reflect equal contribution.
2 This analysis is based on Statistics Canada Microdata files which contain anonymized data collected
from 1999-2009 Survey of Labour and Income Dynamics. All computations on these microdata were
prepared by Andrea Noack (Ryerson University), and the responsibility for the use and interpretation of
these data is entirely that of the author(s).
3 Ulrich Mückenberger, “Non-standard Forms of Employment in the Federal Republic of Germany: The
Role and Effectiveness of the State” in Gerry Roberts & Janine Rogers, eds., Precarious Jobs in Labour
Market Regulation: The Growth of Atypical Employment in Western Europe (Geneva: International
Institute for Labour Studies, 1989) 167; C.S. Bütchetmann & S. Quack, “How Precarious is ‘Non-Standard
Employment? Evidence for West Germany” (1990) 14 Cambridge Journal of Economics 315.
4 See, for example: Cynthia J. Cranford and Leah F. Vosko, “Conceptualizing Precarious Employment:
Mapping Wage Work across Social Location and Occupational Context” in Leah F. Vosko, ed.,
Precarious Employment: Understanding Labour Market Insecurity in Canada (Montreal and Kingston:
McGill-Queen’s University Press, 2006) 43; Tania Das Gupta, “Union Renewal and Precarious
Employment: A Case Study of Hotel Workers” in Leah F. Vosko, ed., Precarious Employment:
Understanding Labour Market Insecurity in Canada (Montreal: McGill-Queens University Press, 2006)
318; Leah F. Vosko and Nancy Zukewich, “Precarious by Choice? Gender and Self-Employment” in Leah
F. Vosko, ed., Precarious Employment: Understanding Labour Market Insecurity in Canada (Montreal and
Kingston: McGill-Queen’s University Press, 2006) 67; Grace Edward Galabuzi, “Racializing the Division of
Labour: Neoliberal Restructuring and the Economic Segregation of Canada’s Racialized Groups” in Jim
Stanford and Leah F. Vosko, ed., Challenging the Market: The Struggle to Regulate Work and Income
(Montreal and Kingston, McGill-Queen’s University Press, 2004) 175.
5 See, for example: Pat Armstrong & Kate Laxer, “Precarious Work, Privatization, and the Health-Care
Industry” in Leah F. Vosko, ed., Precarious Employment: Understanding Labour Market Insecurity in
Canada (Montreal and Kingston: McGill-Queen’s University Press, 2006) 115.
6 Jean Bernier, Guylaine Vallée & Carol Jobin, “Les Besoins de Protection Sociale des Personnes en
Situation de Travail Non Tradtionnelle” Rapport final (Quebec: Ministére du Travail, 2003); Vallée,

Precarious Jobs in Ontario: Mapping Dimensions of Labour Market Insecurity by Workers’ Social Location and Context
Commissioned by the Law Commission of Ontario 49 November 2011
Towards Enhancing the Employment Conditions of Vulnerable Workers: A Public Policy Perspective
(Ottawa: Canadian Policy Research Networks, 2005); Stephanie Bernstein, “Mitigating Precarious
Employment in Quebec: The Role of Minimum Employment Standards Legislation” in Leah F. Vosko, ed.,
Precarious Employment: Understanding Labour Market Insecurity in Canada (Montreal & Kingston:
McGill-Queen’s University Press, 2006) 221; Katherine Lippel, “Precarious Employment and Occupational
Health and Safety Regulation in Quebec” in Leah F. Vosko, ed., Precarious Employment: Understanding
Labour Market Insecurity in Canada (Montreal and Kingston: McGill-Queen’s University Press, 2006) 241.
7 Gerhard Bosch, “Towards a New Standard Employment Relationship in Western Europe” (2004) 42:2
British Journal of Industrial Relations 617 at 618.
8 See, for example: Bütchetmann & Quack, note 1 at 51; Gerry Rodgers, “Precarious Work in Western
Europe: The State of the Debate” in Gerry Rodgers and Janine Rodgers, eds., Precarious Jobs in Labour
Market Regulation: The Growth of Atypical Employment in Western Europe (Belgium: International
Institute for Labour Studies, 1989) 1; Judy Fudge, “Little Victories and Big Defeats: The Rise and Fall of
Collective Bargaining Rights for Domestic Workers in Ontario” in Abigail Bess Bakan & Daiva K. Stasiulis,
eds., Not One of the Family: Foreign Domestic Workers in Canada (Toronto, Buffalo and London:
University of Toronto Press, 1997) 119; Vosko, Temporary Work: The Gendered Rise of a Precarious
Employment Relationship (Toronto: University of Toronto Press, 2000).
9 Wallace Clement, Sophie Mathieu, Steven Prus and Emre Uckardesler, “Precarious Lives in the New
Economy: Comparative Intersectional Analysis” in Leah F. Vosko, Martha MacDonald & Iain Campbell,
eds., Gender and the Contours of Precarious Employment (London; New York, NY: Routledge, 2009)
240.
10 See, for example: Fudge, Eric Tucker & Vosko, The Legal Concept of Employment: Marginalizing
Workers Report (Toronto: Law Commission of Canada, 2002); Cynthia J. Cranford, Fudge, Tucker &
Vosko, Self-Employed Workers Organize: Law Policy and Unions (Montreal and Kingston: McGill-
Queen’s University Press, 2005) at 208; Karen D. Hughes, Female Enterprise in the New Economy
(Toronto: University of Toronto Press, 2005); Vosko, Managing the Margins: Gender, Citizenship and the

Precarious Jobs in Ontario: Mapping Dimensions of Labour Market Insecurity by Workers’ Social Location and Context
Commissioned by the Law Commission of Ontario 50 November 2011
International Regulation of Precarious Employment (Politics and Business Series) (Oxford, UK: Oxford
University Press, 2010).
11 Zhengxi Lin, Janice Yates and Garnett Picot, Rising Self-employment in the Midst of High
Unemployment: An Empirical Analysis of Recent Developments in Canada (Ottawa: Analytical Studies
Branch, Statistics Canada, 1999). Online: Statistics Canada ,
< http://www.statcan.gc.ca/pub/11f0019m/11f0019m1999133-eng.pdf> (last accessed: 18 September
2011)
12 See, for example: Judy Fudge, “A New Gender Contract?: Work-life Balance and Working-time
Flexibility” in Joanne Conaghan & Kerry Rittich, eds., Labour Law, Work and Family: Critical and
Comparative Perspectives (Oxford; New York: Oxford University Press, 2005) 261; Eric Tucker, “Star
Wars: Newspaper Distribution Workers and the Possibilities and Limits of Collective Bargaining” in
Cynthia J. Cranford, Judy Fudge, Eric Tucker & Leah F. Vosko eds., Self-Employed Workers Organize:
Law, Policy, and Unions (Montréal: McGill-Queens University Press, 2005) 29.
13 Sylvia Fuller and Vosko, “Temporary Employment and Social Inequality in Canada: Exploring
Intersections of Gender, Race and Migration” (2008) 88:1 Social Indicators Research 31.
14 See, for example: Vosko, note 6 at 52; Katherine Stone, From Widgets to Digits: Employment
Regulation for the Changing Workplace (Cambridge: Cambridge University Press, 2004); Fuller & Vosko,
note 11 at 53.
15 Based on research examining trends in Canada, Australia, the United States and the EU 15, elsewhere
Vosko (2010) also shows that when we conflate precarious employment and non-standard employment
we risk obscuring and reinforcing the very problems that need to be addressed – namely, the SER-centric
nature of labour regulation (Vosko, note 8 at 52).
16 In this analysis, we rely on the reported hourly wage for the main job at the end of the reference year
(or at the end of the job, if it concluded before the reference year). This is compared to the low wage
cutoff of 1.5 times the minimum wage at the end of the reference year.
17 Statistics Canada, Low Income Lines, 2009-2010, Income Research Paper Series, Income Statistics
Division, Catalogue no. 75F0002M, no. 002 (Ottawa: Minister of Industry, 2011).
18 Ibid

Precarious Jobs in Ontario: Mapping Dimensions of Labour Market Insecurity by Workers’ Social Location and Context
Commissioned by the Law Commission of Ontario 51 November 2011
19
On Ontario, see especially: J. O’Grady, “Beyond the Wagner Act, What Then?” in D. Drache, ed.,
Getting on Track (Montreal and Kingston: McGill-Queen’s University Press, 1991) 153; Fudge, Meeting
the Needs of Vulnerable Workers: Proposals for Improved Employment Legislation and Access to
Collective Bargaining for Domestic Workers and Industrial Homeworkers submitted by Ontario District
Council of the International Ladies' Garment Workers' Union and Intercede. (Toronto: Intercede, Toronto
Organization for Domestic Workers' Rights, 1993); Mary Gellatly, John Grundy, Kiran Mirchandani, Adam
Perry, Mark Thomas & Vosko, “‘Modernizing’ Employment Standards? Administrative Efficiency, Market
Regulation and the Production of the Illegitimate Claimant in Ontario, Canada” (2011) 22:2 Economic and
Labour Relations Review 81.
20 P. Armstrong and Hugh Armstrong, The Double Ghetto: Canadian Women and their Segregated Work
(Toronto: Oxford University Press, 2001).
21 Cranford, Vosko, & Zukewich, “The Gender of Precarious Employment in Canada” (2003) 58:3
Relations Industrielles/ Industrial Relations, 454.
22 For instance, in the Canadian context and elsewhere, Vosko (2000, 2006 & 2010), Fudge & Vosko
(2001a and b), Cranford & Vosko (2006), Tucker (2006), and Fuller & Vosko (2008) show that women,
immigrants and people of colour are more likely to hold jobs characterized by dimensions of labour
market insecurity. (Vosko, note 16 at 53; Vosko, ed., Precarious Employment: Understanding Labour
Market Insecurity in Canada (Montreal and Kingston: McGill-Queen’s University Press, 2006); Vosko,
note 8 at 52; Fudge & Vosko “Gender, Segmentation and the Standard Employment Relationship in
Canadian Labour Law and Policy.” (2001a) 22:2 Economic and Industrial Democracy 271; Fudge &
Vosko, “By Whose Standards? Re-Regulating the Canadian Labour Market” (2001b) 22:3 Economic and
Industrial Democracy, 327; Cranford & Vosko, note 3 at 51; Tucker, note 10 at 52; Fuller & Vosko, note
11 at 58).
23 Age is another prominent dimension of labour market inequality. We do not develop an age-based
analysis here, however, as this dimension is being addressed more fully in the Law Commission’s series
on young workers.
24 Statistics Canada, Labour Force Historical Review 2009 (table 86), Catalogue No. 71F0004XVB
(Ottawa: Minister of Industry, 2010).

Precarious Jobs in Ontario: Mapping Dimensions of Labour Market Insecurity by Workers’ Social Location and Context
Commissioned by the Law Commission of Ontario 52 November 2011
25
Shifts in the industrial and occupational composition of the solo self-employed and the employer self-
employed may accompany this apparent constancy but tracking these patterns is beyond the scope of
our analysis.
26 Fudge, Tucker & Vosko, note 8 at 52; Hughes, “Pushed or Pulled? Women’s Entry into Self-
Employment and Small Business Ownership” (2003) 10:4 Gender, Work and Organization, 433.
27 Vosko, “The Challenge of Expanding EI Coverage: Charting Exclusions and Partial
Exclusions on the Bases of Gender, Immigration Status, Age, and Place of Residence and
Exploring Avenues for Inclusive Policy Redesign,” monograph prepared for Mowat Commission
on Unemployment Insurance (Toronto: Mowat Centre for Public Policy, Toronto, 2011).
28 Throughout this analysis, we use data from 2008 as the primary reporting year. At the time of
submission, there was only limited access to the 2009 data through a remote access system. Wherever
possible, we have included data from 2009 in order to show changes over time.
29 Timothy J. Bartkiw, “Manufacturing Descent?: Labour Law and Union Organizing in the Province of
Ontario” (2008) 34:1 Canadian Public Policy, 111.
30Harry Arthurs, "A Fine Balance: Safe Pensions, Affordable Plans, Fair Rules” (Ontario, Report of the
Expert Commission on Pensions, 2007).
31 The minimum wage cut-off has been adjusted to reflect provincial minimum wages each year.
32 Mark P. Thomas, Regulating Flexibility: The Political Economy of Employment Standards (Montréal:
McGill Queen’s University Press, 2009); Gellatly et al, note 17 at 53.
33 Andrew Jackson, “Forum: Reorganizing Unions: Solidarity Forever? Trends in Canadian Union Density”
(2004) 74 Studies in Political Economy, 124 at 141; Sharanjit Uppal, “Unionization, 2010”, Catalogue no.
75-001-X (Ottawa: Statistics Canada, October 2010) at 18.
34 Bernstein, note 4 at 51.
35 See also Gellatly et al, note 17 at 53.
36 Fudge & Vosko 2001b, note 20.
37 Antonella Picchio, “Wages as a Reflection of Socially Embedded Production and Reproduction
Processes” in Linda Clarke, Peter de Gijsel & Jorn Janssen, eds., The Dynamics of Wage Relations in the
New Europe (London: Kluwer, 1998) 195.

Precarious Jobs in Ontario: Mapping Dimensions of Labour Market Insecurity by Workers’ Social Location and Context
Commissioned by the Law Commission of Ontario 53 November 2011
38
Ernest B. Akyeampong, “Collective Bargaining Priorities” (2005) 17:3 Perspectives on Labour and
Income, 41 at 44.
39 Patrice A. Dutil and Ronald Saunders, New Approaches in Achieving Compliance with Statutory
Employment Standards (Ottawa: Canadian Policy Research Networks; Toronto: Institute of Public
Administration of Canada, July 2005).
40 This apparent decline should be interpreted with caution as it may be the result of precarious jobs in
agriculture being increasingly filled by temporary foreign workers, whose experiences are unlikely to be
reported in this survey. The household telephone sampling methodology used in the SLID relies on land-
line telephones, which are unlikely to be used in the temporary or group living accommodations used by
some foreign workers. Further, temporary foreign workers – especially those with limited English skills –
may be less likely to respond to telephone survey requests.
41 Data on the racial and ethnic composition, as well as the immigrants status, of the agricultural industry
in Ontario is suppressed by Statistics Canada because of small cell sizes, which pose a threat to the
confidentiality of the data.
42 For more information on the industry classifications used in this analysis and the specific jobs which
they include, please see: <http://www.statcan.gc.ca/subjects-sujets/standard-norme/naics-
scian/2002/naics-scian02l-eng.htm> (last accessed: 18 September, 2011).
43 Jane Jenson, “The Talents of Women, the Skills of Men” in Stephan Wood, ed., The Transformation of
Work? Skill Flexibility and the Labour Process (London: Unwin Hyman, 1989) 141; Sylvia Walby,
“Flexibility and the Changing Sexual Division of Labour” in Stephan Wood, ed., The Transformation of
Work? Skills, Flexibility and Labour Process (London: Unwin Hyman, 1989) 127.
44 P. Armstrong & Laxer, note 7 at 52.
45 For more information on the occupational classifications used in this analysis and the specific jobs
which they include, please see: <http://www.statcan.gc.ca/subjects-sujets/standard-norme/soc-
cnp/2001/noc2001-cnp2001-menu-eng.htm> (last accessed, 18 September, 2011).
46 Vosko, Temporary Work: The Gendered Rise of a Precarious Employment Relationship (Toronto:
University of Toronto Press, 2000).

Precarious Jobs in Ontario: Mapping Dimensions of Labour Market Insecurity by Workers’ Social Location and Context
Commissioned by the Law Commission of Ontario 54 November 2011
47
P. Armstrong, “The Feminization of the Labour Force: Harmonizing Down in a Global Economy” in
Isabelle Bakker, ed., Rethinking Restructuring: Gender and Change in Canada (Toronto, Buffalo, NY:
University of Toronto Press, 1996) 29.
48 Chinese Interagency Network “Chinese Workers are not protected by ESA”, (August 2010) online:
Chinese Canadian Council Toronto Chapter <http://www.ccnctoronto.ca/?q=node/343> (last accessed: 13
September 2011).
49 More than 80% of Ontario’s population lives in a metropolitan area (Census Data, Statistics Canada,
2006) Online: accessed via University of Toronto SDA < http://sda.chass.utoronto.ca/sdaweb/index.html>
50 Das Gupta, note 2 at 51.
51 Bartkiw 2008, note 27 at 54; Uppal 2010, note 31 at 55.
52 Vallée and Jean Charest "Globalization and the Transformation of State Regulation of Labour: the
Case of Recent Amendments to the Quebec Collective Agreement Decrees Act," (2001) 17:1
International Journal of Comparative Labour Law and Industrial Relations, Kluwer Law International, 79;
Michel Grant, “Deregulating Industrial Relations in the Apparel Sector: The Decree System in Quebec” in
Jim Stanford & Leah F. Vosko, eds., Challenging the Market: The Struggle to Regulate Work and Income
(Montréal: McGill-Queens University Press, 2004), 135. See also Cranford, Fudge, Tucker & Vosko, Self-
Employed Workers Organize: Law Policy and Unions (Montreal and Kingston: McGill-Queen’s University
Press, 2005) at 186-192.
53 Fudge, Tucker & Vosko 2002, note 8 at 52.
54 Fudge & Vosko 2001a, note 20; Vosko 2010, note 8 at 52.
55 Stephen J. Blumberg & Julian V. Luke , Wireless Substitution: Early Release of Estimates Based on the
National Health Interview Survey, July-December 2006 (Atlanta, GA: U.S. Centers for Disease Control
and Prevention, 14 May 2007).
56 Although large national surveys must necessarily strike a balance between the breadth and depth of
content, the integration of better measures of job quality into one or more national surveys would signal a
policy commitment to improving job quality in Canada. There are several international models for
improving survey data related to job quality; for instance, the Household, Income and Labour Dynamics in
Australia (HILDA) survey includes twelve items assessing subjective psychosocial characteristics of work,

Precarious Jobs in Ontario: Mapping Dimensions of Labour Market Insecurity by Workers’ Social Location and Context
Commissioned by the Law Commission of Ontario 55 November 2011
which appear to reflect three general components of job quality: job demands and complexity, job control
and job security (Liana Leach, Peter Butterworth, Bryan Rodgers & Lyndall Strazdins 2010). In order to
better capture the situation of workers in precarious jobs, we would also recommend sponsoring research
that specifically captures the experiences of workers who are likely to be underrepresented in randomly-
selected telephone surveys. More diverse sampling strategies and measurements of job quality will allow
policy makers to make better informed decisions. (Liana Leach, Peter Butterworth, Brayn Rodgers &
Lyndall Strazdins, “Deriving an Evidence-Based Measure of Job Quality from the HILDA Survey” (July 1,
2010) No. 9 Australian Social Policy Journal 67.)
57 Statistics Canada, Survey of Labour and Income Dynamics (SLID) – 2009 Survey Overview, Cat. No
75F0011X (Ottawa: Statistics Canada 2010b) Online:
<http://www.statcan.gc.ca/pub/75f0011x/75f0011x2011001-eng.htm> (last accessed: 18 September,
2011)
58 Statistics Canada, Methodology of the Canadian Labour Force Survey (Ottawa, ON: Ministry of
Industry 2008) Online: <http://www.statcan.gc.ca/pub/71-526-x/71-526-x2007001-eng.pdf> (last
accessed: 18 September, 2011).
59 Bastien, Jean-François, Data Quality for the 2009 Survey of Labour and Income Dynamics (SLID)
(Ottawa: Statistics Canada, 2009) Online: <http://www.statcan.gc.ca/imdb-
bmdi/document/3889_D13_T2_V3-eng.pdf> (last accessed: 18 September, 2011).
60 Ibid