PowerPoint Presentation · OSM results (especially mode amplitudes) - NO LONGER AN ISSUE.
21
Imagination at work. Manu Parashar, Ph.D. NASPI Workgroup Meeting, Atlanta GA March 2016 Grid Software Solutions Built –in Data Quality
Transcript of PowerPoint Presentation · OSM results (especially mode amplitudes) - NO LONGER AN ISSUE.

Imagination at work.
Manu Parashar, Ph.D. NASPI Workgroup Meeting, Atlanta GAMarch 2016
Grid Software SolutionsBuilt –in Data Quality

Data Quality in WAMS
Addressing data accuracy and data availability issues requires evaluating the end-to-end system.
Need to look at each component dataflow chain:− Detect data quality issues close to its source.− Preserve & communicate this information to downstream applications.
PMUs: Data Quality Status flags in C37.118 stream (GPS Lock, Data Error)
PDCs: Monitor and track latency, dropped communications, etc.
Historians: Preserve data integrity when archiving data.
Applications: Data quality needs and tolerance is application dependent.
IMPORTANT: LEAVE THE DATA QUALITY HANDLING TO THE APPLICATIONS

PDC Processing

PDC Processing
• Preserve the integrity of the incoming data stream.
• Support a redundant architecture.− Duplicate Data:
For example, data sent through redundant communication paths.
− Redundant Data:Data sent by alternate devices.
− PDC selects data either based on first-arrived or validity
• Monitor incoming data quality statistics (live & historical)

WAMS System Architecture at PG&E
Courtesy: Vahid Madani, PG&E
Architecture Supports both Redundant and Duplicate Data
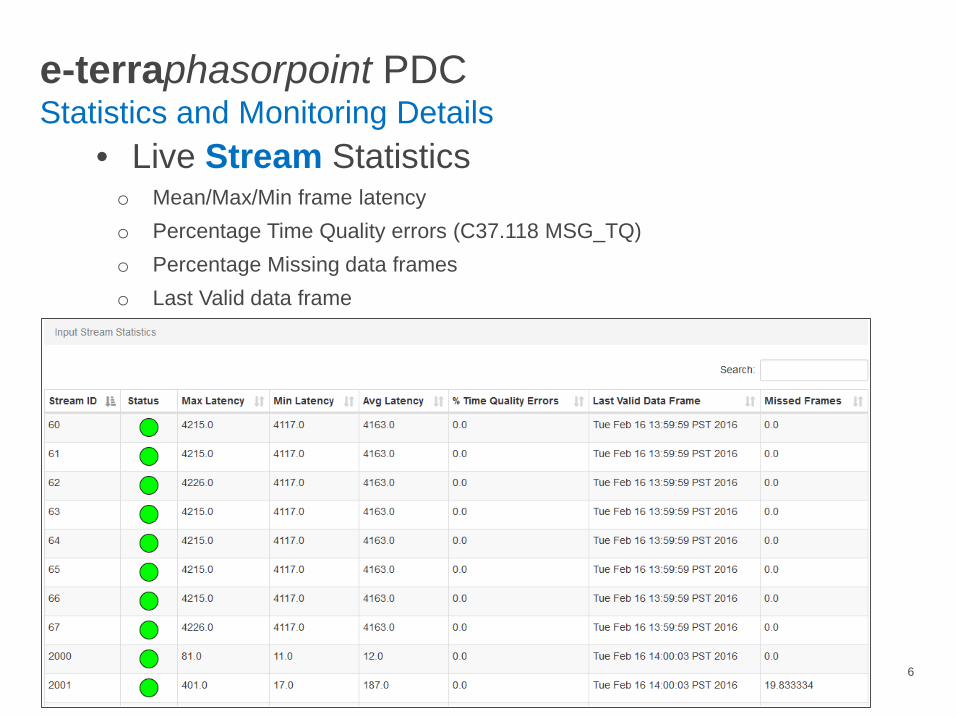
e-terraphasorpoint PDCStatistics and Monitoring Details
• Live Stream Statistics o Mean/Max/Min frame latencyo Percentage Time Quality errors (C37.118 MSG_TQ)o Percentage Missing data frameso Last Valid data frame
ONS WAMS | JAN 2016 6

e-terraphasorpoint PDCStatistics and Monitoring Details
• Live PMU Statistics (1 minute rolling data)o Percentage of GPS Locko Percentage of Valid datao Percentage of Data Erroro Percentage of Missing data
7
WAMS CC-PMS
Applications
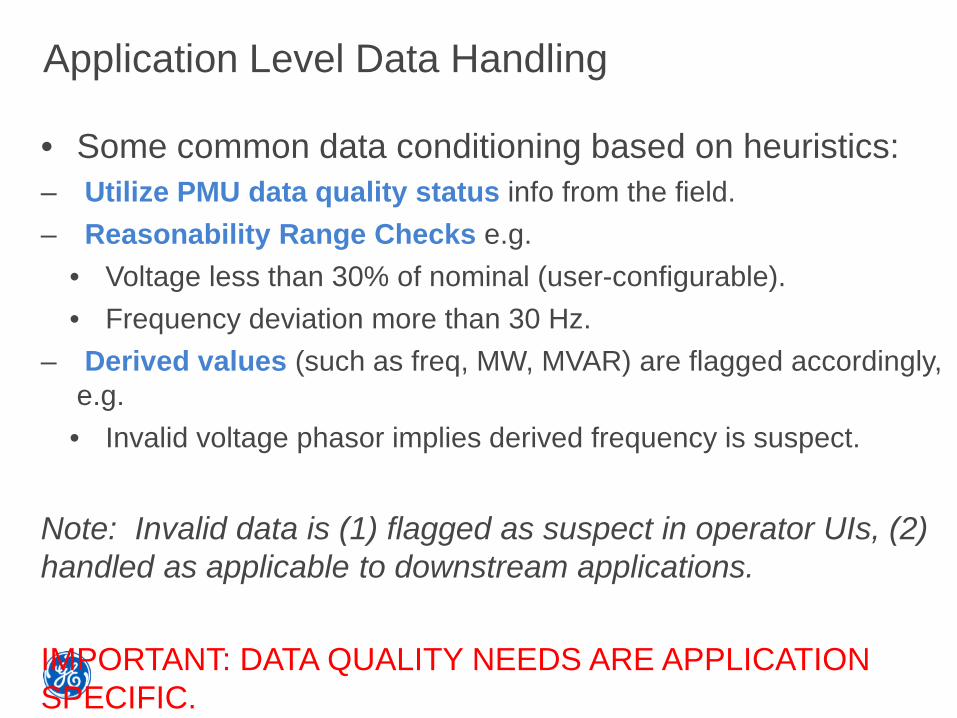
Application Level Data Handling
• Some common data conditioning based on heuristics:– Utilize PMU data quality status info from the field.– Reasonability Range Checks e.g.
• Voltage less than 30% of nominal (user-configurable).• Frequency deviation more than 30 Hz.
– Derived values (such as freq, MW, MVAR) are flagged accordingly, e.g.• Invalid voltage phasor implies derived frequency is suspect.
Note: Invalid data is (1) flagged as suspect in operator UIs, (2) handled as applicable to downstream applications.
IMPORTANT: DATA QUALITY NEEDS ARE APPLICATION SPECIFIC.
Example: Reference Angle

Reference Handling in Operator Displays
REFERENCE
• Operators are used to having the reference angle as 0 degrees.
• Need to ensure the reference is always available ⇒ Ref. Priority List

Angle Reference Processing
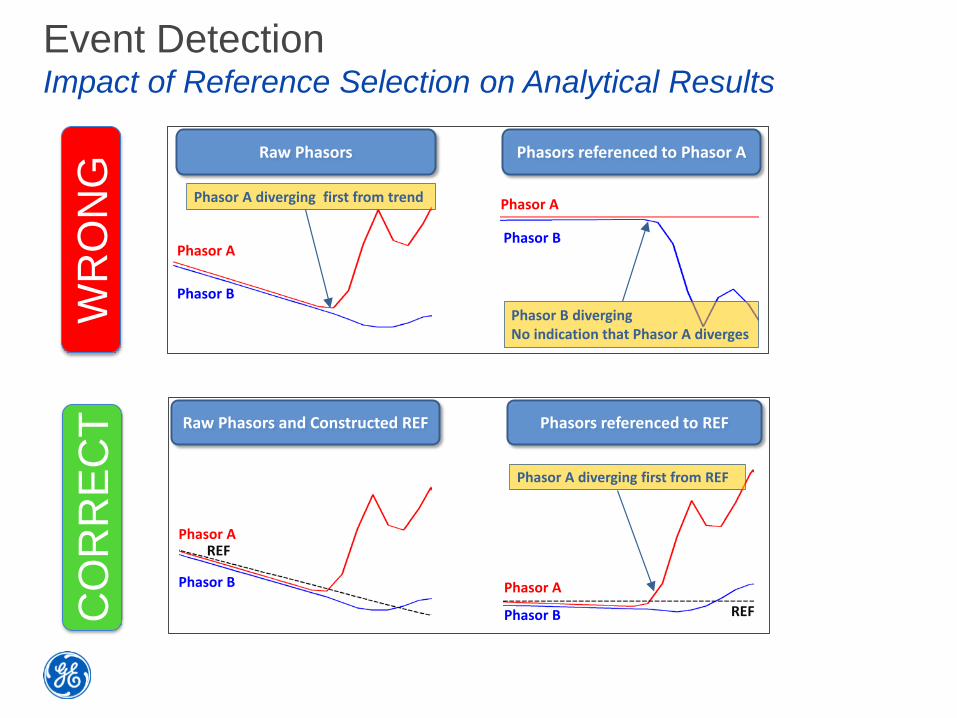
Raw Phasors Phasors referenced to Phasor A
Phasor A diverging first from trend
Phasor B
Phasor A
Phasor B
Phasor B diverging No indication that Phasor A diverges
Phasor A
Raw Phasors and Constructed REF Phasors referenced to REF
Phasor A
Phasor B Phasor A
Phasor B
REF
REF
Phasor A diverging first from REF
Event DetectionImpact of Reference Selection on Analytical Results
WR
ON
GC
OR
RE
CT
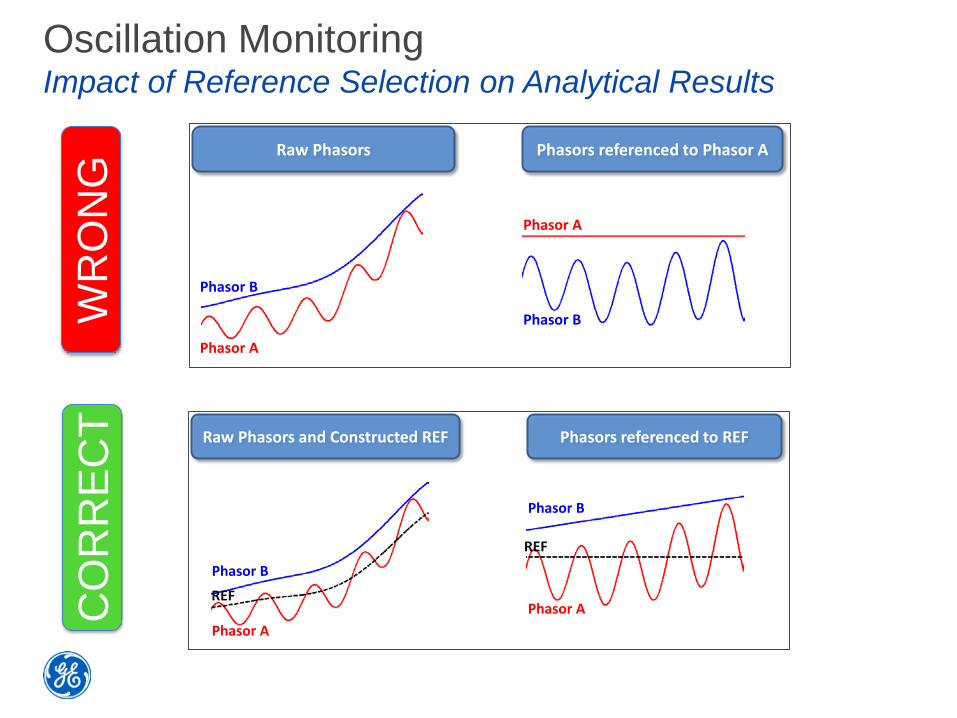
Oscillation MonitoringImpact of Reference Selection on Analytical Results
Raw Phasors Phasors referenced to Phasor A
Phasor A
Phasor B
Phasor A
Phasor B
Raw Phasors and Constructed REF Phasors referenced to REF
Phasor A
Phasor B
Phasor A
Phasor B
REF
REF
WR
ON
GC
OR
RE
CT

BUILT IN DATA HANDLING: SOME
APPLICATION EXAMPLES
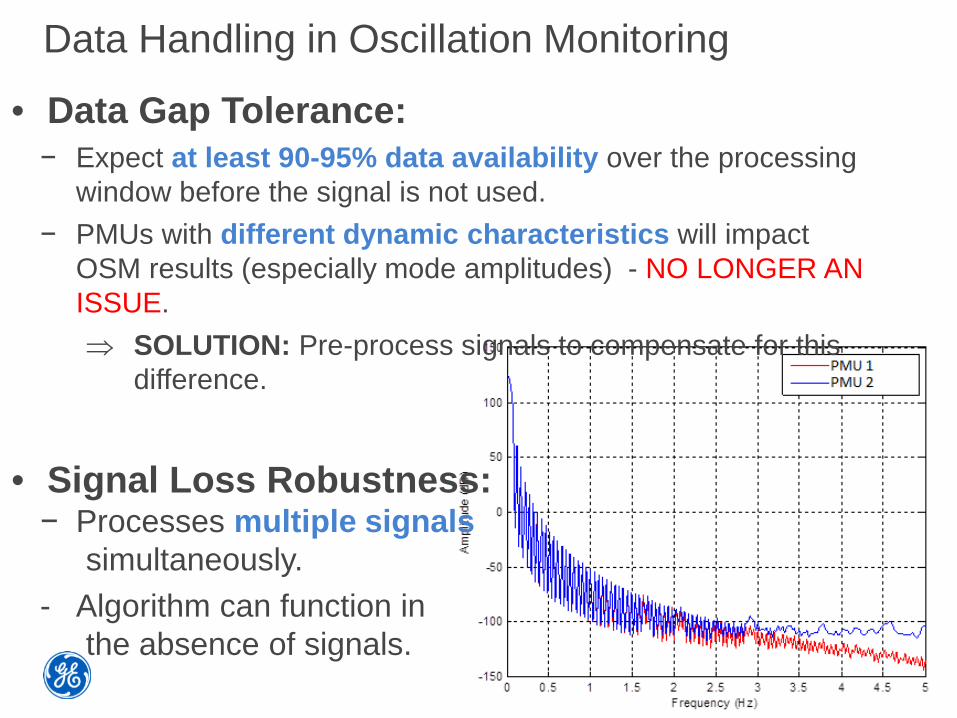
Data Handling in Oscillation Monitoring
• Data Gap Tolerance:− Expect at least 90-95% data availability over the processing
window before the signal is not used.− PMUs with different dynamic characteristics will impact
OSM results (especially mode amplitudes) - NO LONGER AN ISSUE.⇒ SOLUTION: Pre-process signals to compensate for this
difference.
• Signal Loss Robustness:− Processes multiple signals
simultaneously.- Algorithm can function in
the absence of signals.

Data Handling for Hybrid State Estimation
Pre-Processing: Down-sample PMU data to 1 sample/second (i.e. SCADA scan rates).
Focus is on data completeness than precise time alignment with SCADA data.
Several different down-sampling approaches supported by PDC:- Pick the most complete data frame within the second.- Data averaged within the second.- Low-pass filtering using moving time window.

Addressing Data Accuracy
0
5
10
15
20
25
30
35
40
1 2 3 4 5 6 7 8 9 10 11 12 13 14 15 16 17 18 19 20 21 22 23 24 25 26 27 28 29 30 31
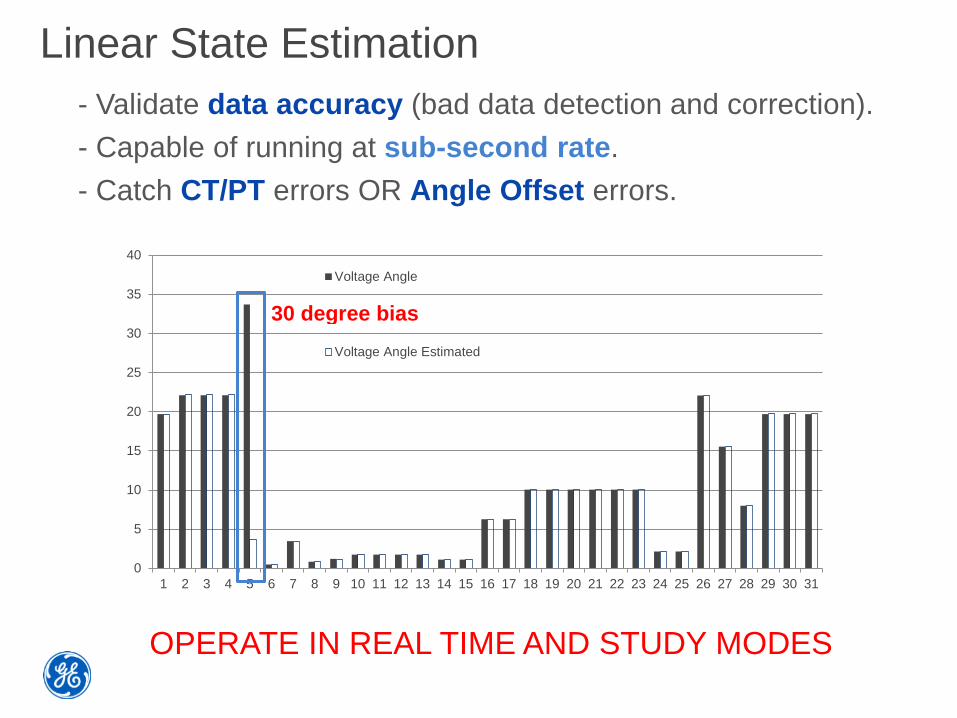
Voltage Angle
Voltage Angle Estimated
30 degree bias
Linear State Estimation- Validate data accuracy (bad data detection and correction).- Capable of running at sub-second rate.- Catch CT/PT errors OR Angle Offset errors.
OPERATE IN REAL TIME AND STUDY MODES

Voltage Angle Estimates
LSE corrected the Angle Measurements (solid is measured; dotted is estimated)
Example: Phase Angle Offset Detection & Correction.

THANK YOU