PowerPoint Presentation€’L6S DMAIC Methodology ... • 20 Minute Template ... – Integration of...
21
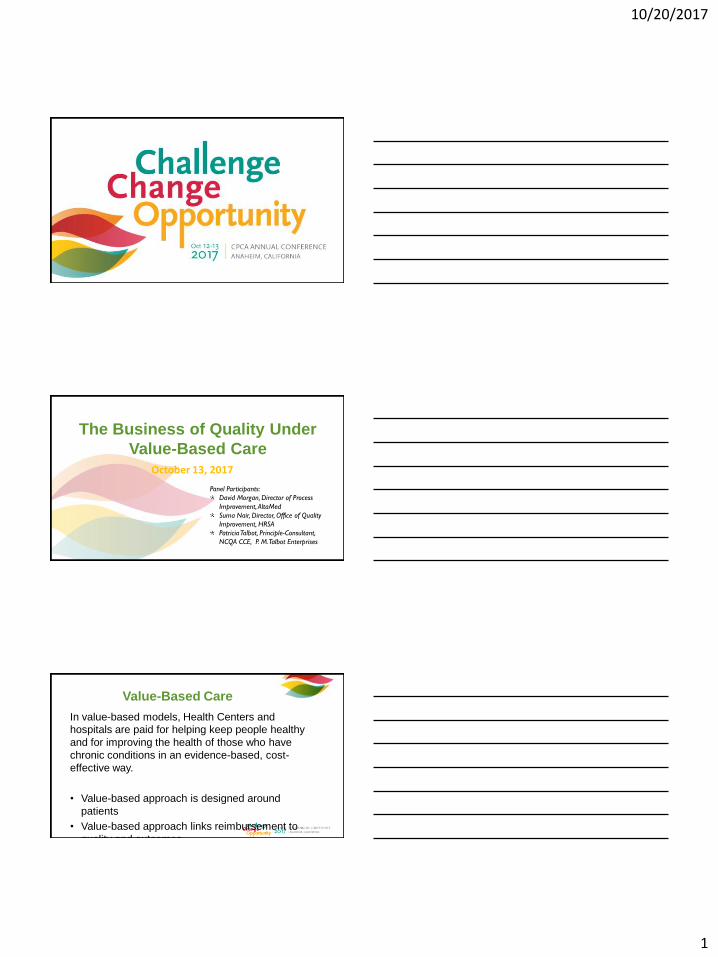
10/20/2017 1 The Business of Quality Under Value-Based Care October 13, 2017 Panel Participants: David Morgan, Director of Process Improvement, AltaMed Suma Nair, Director, Office of Quality Improvement, HRSA Patricia Talbot, Principle-Consultant, NCQA CCE, P. M.Talbot Enterprises Value-Based Care In value-based models, Health Centers and hospitals are paid for helping keep people healthy and for improving the health of those who have chronic conditions in an evidence-based, cost- effective way. • Value-based approach is designed around patients • Value-based approach links reimbursement to quality and outcomes
Transcript of PowerPoint Presentation€’L6S DMAIC Methodology ... • 20 Minute Template ... – Integration of...
10/20/2017
1
The Business of Quality Under
Value-Based Care
October 13, 2017
Panel Participants:
David Morgan, Director of Process
Improvement, AltaMed
Suma Nair, Director, Office of Quality
Improvement, HRSA
Patricia Talbot, Principle-Consultant,
NCQA CCE, P. M. Talbot Enterprises
Value-Based Care
In value-based models, Health Centers and
hospitals are paid for helping keep people healthy
and for improving the health of those who have
chronic conditions in an evidence-based, cost-
effective way.
• Value-based approach is designed around
patients
• Value-based approach links reimbursement to
quality and outcomes
10/20/2017
2
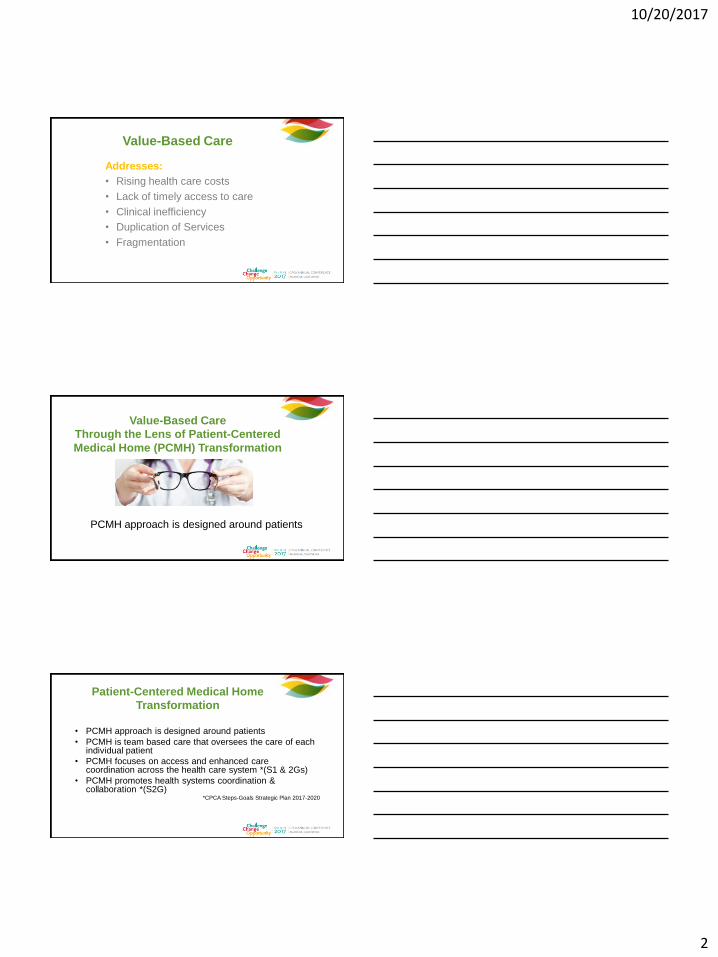
Value-Based Care
Addresses:
• Rising health care costs
• Lack of timely access to care
• Clinical inefficiency
• Duplication of Services
• Fragmentation
Value-Based Care
Through the Lens of Patient-Centered
Medical Home (PCMH) Transformation
PCMH approach is designed around patients
Patient-Centered Medical Home
Transformation
• PCMH approach is designed around patients
• PCMH is team based care that oversees the care of each individual patient
• PCMH focuses on access and enhanced care coordination across the health care system *(S1 & 2Gs)
• PCMH promotes health systems coordination & collaboration *(S2G)
*CPCA Steps-Goals Strategic Plan 2017-2020
10/20/2017
3
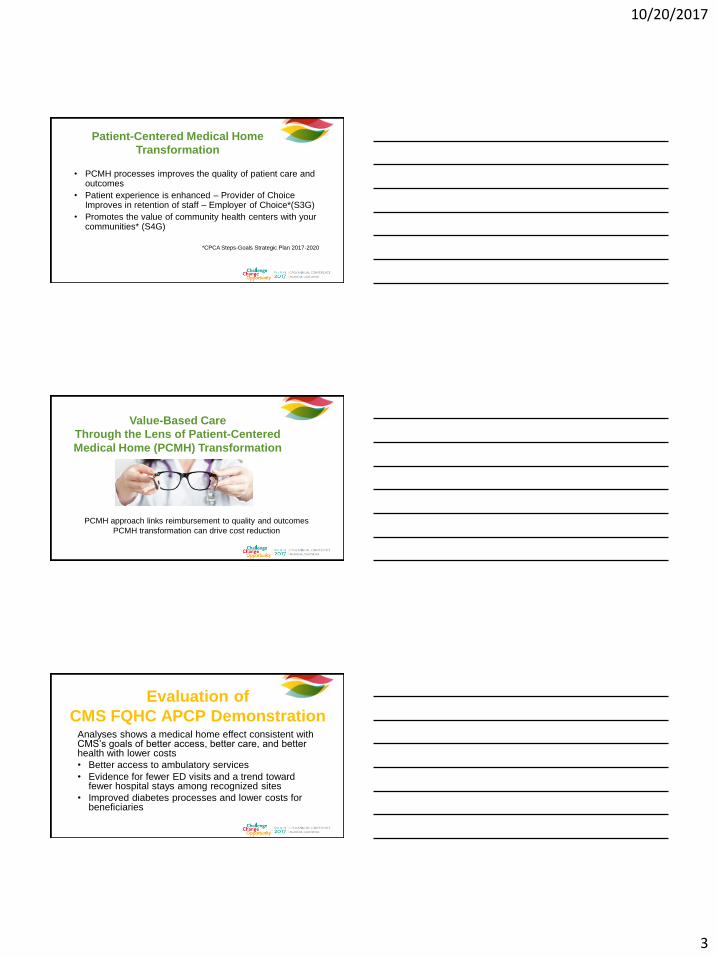
Patient-Centered Medical Home
Transformation
• PCMH processes improves the quality of patient care and outcomes
• Patient experience is enhanced – Provider of Choice Improves in retention of staff – Employer of Choice*(S3G)
• Promotes the value of community health centers with your communities* (S4G)
*CPCA Steps-Goals Strategic Plan 2017-2020
Value-Based Care
Through the Lens of Patient-Centered
Medical Home (PCMH) Transformation
PCMH approach links reimbursement to quality and outcomes
PCMH transformation can drive cost reduction
Analyses shows a medical home effect consistent with CMS’s goals of better access, better care, and better health with lower costs
• Better access to ambulatory services
• Evidence for fewer ED visits and a trend toward fewer hospital stays among recognized sites
• Improved diabetes processes and lower costs for beneficiaries
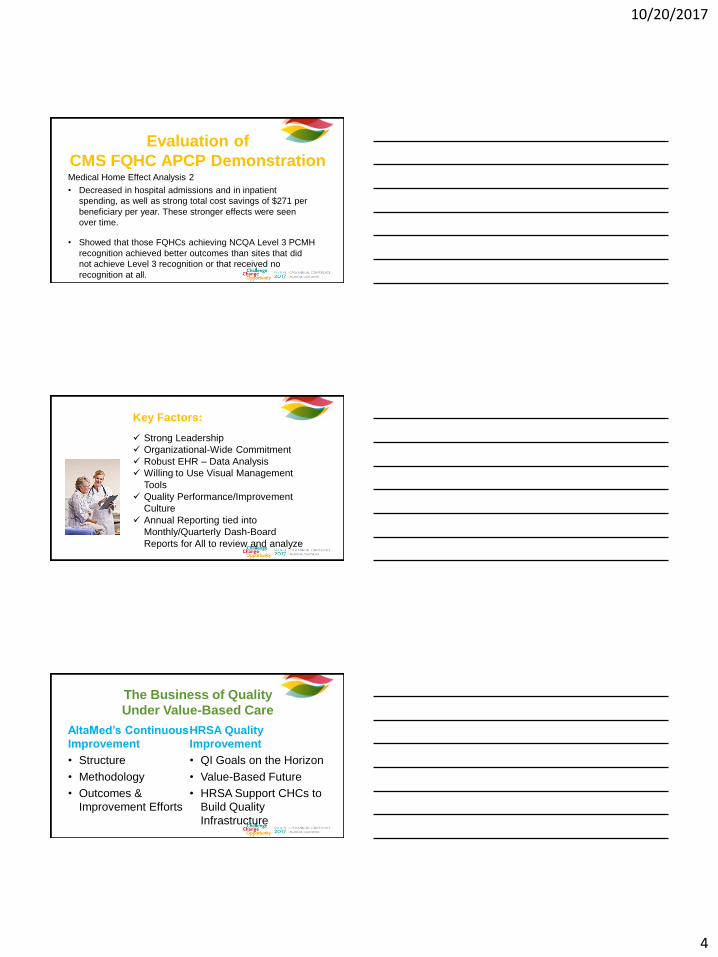
Evaluation of
CMS FQHC APCP Demonstration
10/20/2017
4
Medical Home Effect Analysis 2
• Decreased in hospital admissions and in inpatient
spending, as well as strong total cost savings of $271 per
beneficiary per year. These stronger effects were seen
over time.
• Showed that those FQHCs achieving NCQA Level 3 PCMH
recognition achieved better outcomes than sites that did
not achieve Level 3 recognition or that received no
recognition at all.
Evaluation of
CMS FQHC APCP Demonstration
Key Factors:
Strong Leadership
Organizational-Wide Commitment
Robust EHR – Data Analysis
Willing to Use Visual Management
Tools
Quality Performance/Improvement
Culture
Annual Reporting tied into
Monthly/Quarterly Dash-Board
Reports for All to review and analyze
The Business of Quality
Under Value-Based Care
AltaMed’s Continuous
Improvement
• Structure
• Methodology
• Outcomes &
Improvement Efforts
HRSA Quality
Improvement
• QI Goals on the Horizon
• Value-Based Future
• HRSA Support CHCs to
Build Quality
Infrastructure
10/20/2017
5
Continuous Improvement at AltaMed Health Services
October 13, 2017
David R. Morgan, MAOM, L6S MBB Director – Process Improvement AltaMed Health Services, Inc.
Agenda
Continuous Process Improvement
15
• Overview of AltaMed’s Process Improvement History
• Highlights of the Continuous Improvement Structure
– CAPE Requirements
• Becoming Process-Focused
• Results Oriented
– Lean Six Sigma Methodology
• Outcomes from Process Maturity and Improvement Efforts
10/20/2017
6
16
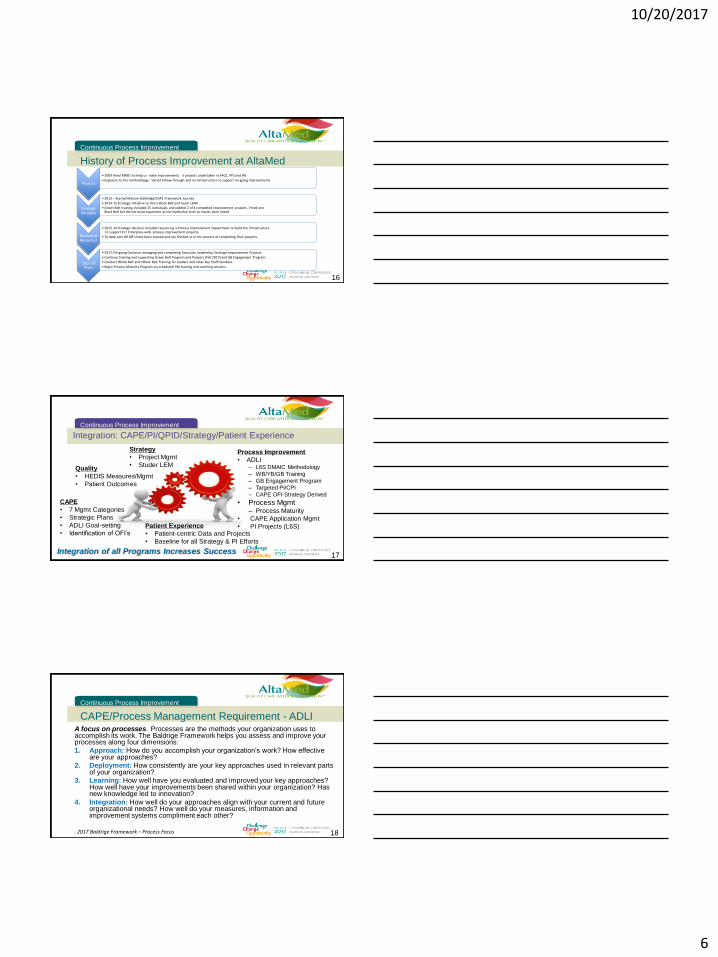
Projects
• 2009 Hired MBB’s to help us make improvements. 5 projects undertaken in PACE, PFS and HR
• Exposure to the methodology. Varied follow-through and no infrastructure to support on-going improvements
Strategic Initiative
• 2013 – Started Malcom Baldridge/CAPE Framework Journey
• 2014-15 Strategic Initiative to hire a Black Belt and teach LEAN
• Green Belt training included 25 individuals and yielded 2 of 4 completed improvement projects. Hired one Black Belt but did not build awareness at the leadership level so results were mixed.
Dedicated Resources
• 2015-16 Strategic decision included resourcing a Process Improvement Department to build the infrastructure to support ELT Enterprise-wide process improvement projects.
• To date over 80 GB’s have been trained and are finished or in the process of completing their projects.
2017-18 Plans
• 2017-On-going Continue managing and completing Executive Leadership Strategic Improvement Projects
• Continue training and supporting Green Belt Program and Projects (Fall 2017) and GB Engagement Program
• Conduct White Belt and Yellow Belt Training for Leaders and other key Staff members
• Begin Process Maturity Program via scheduled PM training and coaching sessions.
History of Process Improvement at AltaMed
Continuous Process Improvement
Integration: CAPE/PI/QPID/Strategy/Patient Experience
Continuous Process Improvement
17 Integration of all Programs Increases Success
Process Improvement
• ADLI ‒ L6S DMAIC Methodology
‒ WB/YB/GB Training
‒ GB Engagement Program
‒ Targeted PI/CPI
‒ CAPE OFI-Strategy Derived
• Process Mgmt ‒ Process Maturity
• CAPE Application Mgmt
• PI Projects (L6S)
CAPE
• 7 Mgmt Categories
• Strategic Plans
• ADLI Goal-setting
• Identification of OFI’s Patient Experience
• Patient-centric Data and Projects
• Baseline for all Strategy & PI Efforts
Strategy
• Project Mgmt
• Studer LEM Quality
• HEDIS Measures/Mgmt
• Patient Outcomes
CAPE/Process Management Requirement - ADLI
Continuous Process Improvement
18
A focus on processes. Processes are the methods your organization uses to accomplish its work. The Baldrige Framework helps you assess and improve your processes along four dimensions:
1. Approach: How do you accomplish your organization’s work? How effective are your approaches?
2. Deployment: How consistently are your key approaches used in relevant parts of your organization?
3. Learning: How well have you evaluated and improved your key approaches? How well have your improvements been shared within your organization? Has new knowledge led to innovation?
4. Integration: How well do your approaches align with your current and future organizational needs? How well do your measures, information and improvement systems compliment each other?
- 2017 Baldrige Framework – Process Focus
10/20/2017
7
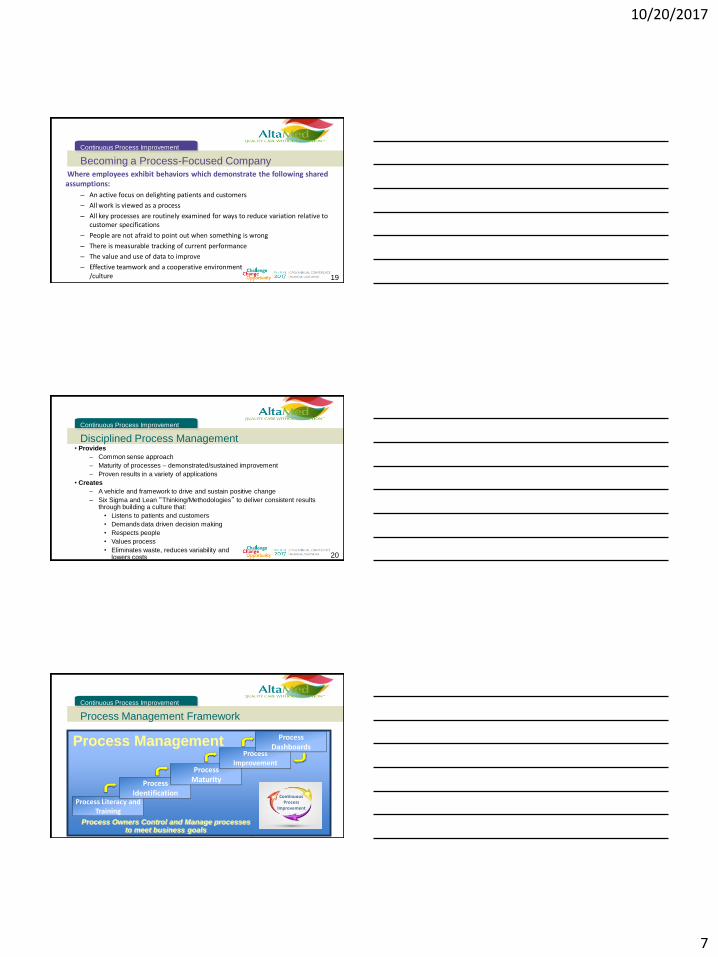
Becoming a Process-Focused Company
Continuous Process Improvement
19
Where employees exhibit behaviors which demonstrate the following shared assumptions:
– An active focus on delighting patients and customers
– All work is viewed as a process
– All key processes are routinely examined for ways to reduce variation relative to customer specifications
– People are not afraid to point out when something is wrong
– There is measurable tracking of current performance
– The value and use of data to improve
– Effective teamwork and a cooperative environment /culture
Disciplined Process Management
Continuous Process Improvement
20
• Provides
– Common sense approach
– Maturity of processes – demonstrated/sustained improvement
– Proven results in a variety of applications
• Creates
– A vehicle and framework to drive and sustain positive change
– Six Sigma and Lean “Thinking/Methodologies” to deliver consistent results through building a culture that:
• Listens to patients and customers
• Demands data driven decision making
• Respects people
• Values process
• Eliminates waste, reduces variability and lowers costs
Process Management Framework
Continuous Process Improvement
Process Management
Process Literacy and Training
Process Identification
Process Maturity
Process Improvement
Process Dashboards
Continuous Process
Improvement
Process Owners Control and Manage processes to meet business goals
10/20/2017
8
22
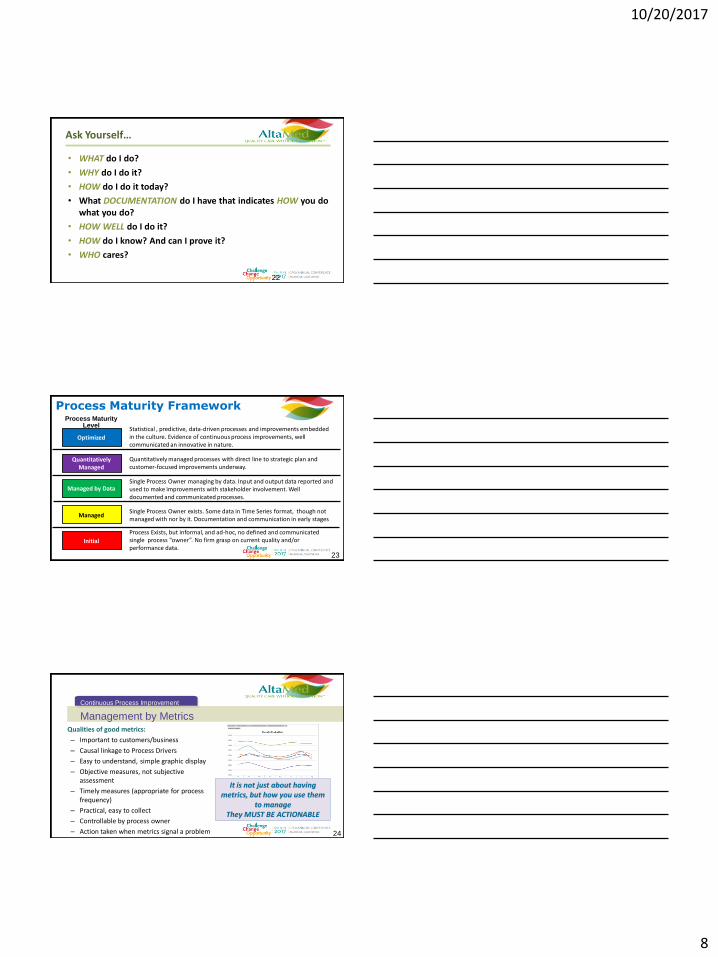
Ask Yourself…
• WHAT do I do?
• WHY do I do it?
• HOW do I do it today?
• What DOCUMENTATION do I have that indicates HOW you do what you do?
• HOW WELL do I do it?
• HOW do I know? And can I prove it?
• WHO cares?
Process Maturity Framework Process Maturity
Level
Optimized
Quantitatively Managed
Managed by Data
Managed
Initial
Process Exists, but informal, and ad-hoc, no defined and communicated single process “owner”. No firm grasp on current quality and/or performance data.
Single Process Owner exists. Some data in Time Series format, though not managed with nor by it. Documentation and communication in early stages
Single Process Owner managing by data. Input and output data reported and used to make improvements with stakeholder involvement. Well documented and communicated processes.
Quantitatively managed processes with direct line to strategic plan and customer-focused improvements underway.
Statistical , predictive, data-driven processes and improvements embedded in the culture. Evidence of continuous process improvements, well communicated an innovative in nature.
23
Management by Metrics
Continuous Process Improvement
24
Qualities of good metrics:
– Important to customers/business
– Causal linkage to Process Drivers
– Easy to understand, simple graphic display
– Objective measures, not subjective assessment
– Timely measures (appropriate for process frequency)
– Practical, easy to collect
– Controllable by process owner
– Action taken when metrics signal a problem
It is not just about having metrics, but how you use them
to manage They MUST BE ACTIONABLE
10/20/2017
9
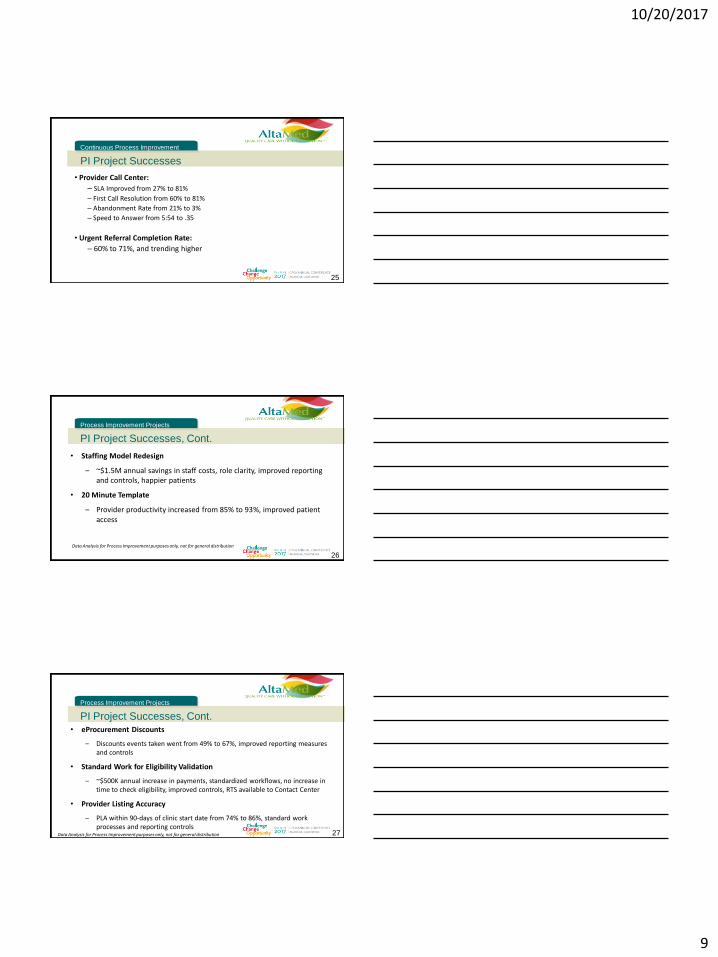
PI Project Successes
Continuous Process Improvement
25
• Provider Call Center:
– SLA Improved from 27% to 81%
– First Call Resolution from 60% to 81%
– Abandonment Rate from 21% to 3%
– Speed to Answer from 5:54 to .35
• Urgent Referral Completion Rate:
– 60% to 71%, and trending higher
Process Improvement Projects
PI Project Successes, Cont.
26
Data Analysis for Process Improvement purposes only, not for general distribution
• Staffing Model Redesign
‒ ~$1.5M annual savings in staff costs, role clarity, improved reporting and controls, happier patients
• 20 Minute Template
‒ Provider productivity increased from 85% to 93%, improved patient access
Process Improvement Projects
PI Project Successes, Cont.
27 Data Analysis for Process Improvement purposes only, not for general distribution
• eProcurement Discounts
‒ Discounts events taken went from 49% to 67%, improved reporting measures and controls
• Standard Work for Eligibility Validation
‒ ~$500K annual increase in payments, standardized workflows, no increase in time to check eligibility, improved controls, RTS available to Contact Center
• Provider Listing Accuracy
‒ PLA within 90-days of clinic start date from 74% to 86%, standard work processes and reporting controls

10/20/2017
10
CAPE Results
Continuous Process Improvement
28
• CAPE Silver Awarded in 2015 and 2016, working towards Gold for 2018
• Integration with L6S as the Improvement Methodology to address identified Strategic Improvement Projects for PI
• GB Training, Certification and Engagement Programs Deployed
• Development and Deployment of the Process Management System, to include process identification, maturity and integration with CAPE
Summary
Continuous Process Improvement
29
• CAPE/PI/OpEx/Quality/Patient Experience Efforts: – Integration of Quality systems, approaches and learnings (Knowledge Management,
Capture and Sharing Across Multiple Strategic Efforts)
• Leads to reduction of multiple, redundant efforts, improving outcomes, organizational
effectiveness and cost savings
• Single process owners creates accountability and single-point of information, measures
and performance
– Process Management and Maturity
• Clear roles and responsibilities, transparent performance across the enterprise
– Targeted, Quality Improvement System: Goal of better health outcomes, patient and
provider satisfaction, and reduced costs leading to higher CMS Star ratings
Process Improvement
Continuous Process Improvement
30
10/20/2017
11
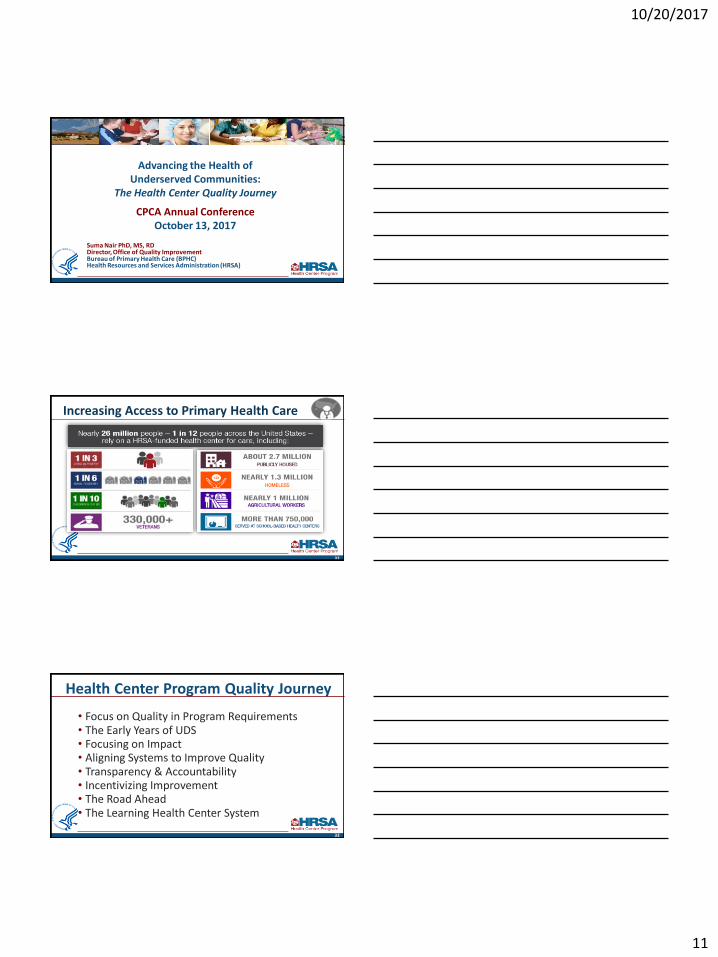
Advancing the Health of Underserved Communities:
The Health Center Quality Journey
CPCA Annual Conference October 13, 2017
Suma Nair PhD, MS, RD Director, Office of Quality Improvement Bureau of Primary Health Care (BPHC) Health Resources and Services Administration (HRSA)
Increasing Access to Primary Health Care
32
Health Center Program Quality Journey
• Focus on Quality in Program Requirements • The Early Years of UDS • Focusing on Impact • Aligning Systems to Improve Quality • Transparency & Accountability • Incentivizing Improvement • The Road Ahead • The Learning Health Center System
33
10/20/2017
12
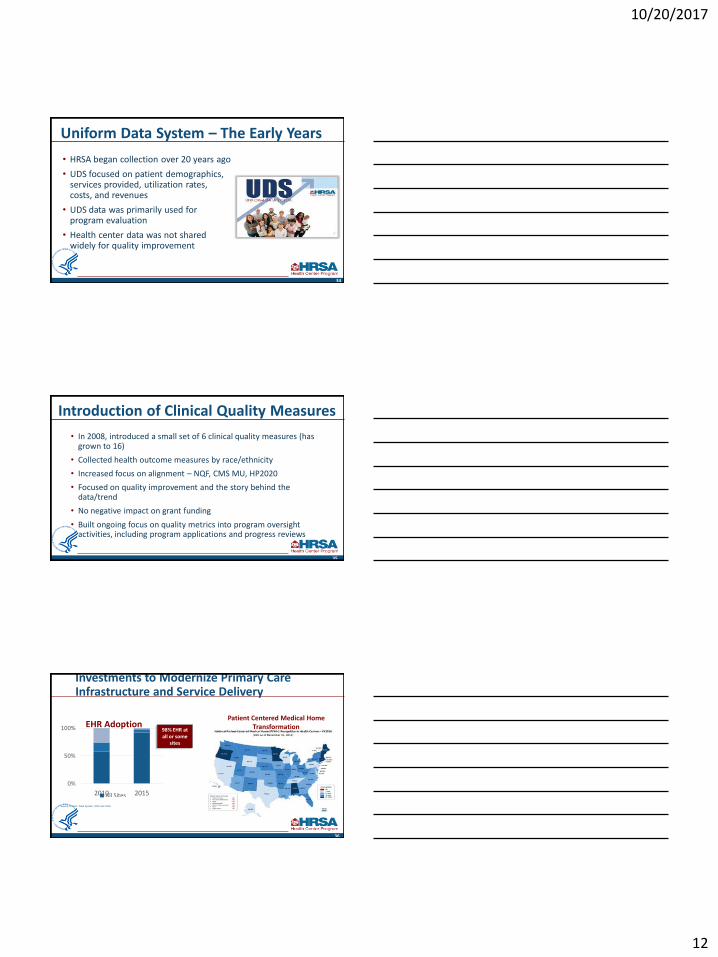
Uniform Data System – The Early Years
• HRSA began collection over 20 years ago
• UDS focused on patient demographics, services provided, utilization rates, costs, and revenues
• UDS data was primarily used for program evaluation
• Health center data was not shared widely for quality improvement
34
Introduction of Clinical Quality Measures
• In 2008, introduced a small set of 6 clinical quality measures (has grown to 16)
• Collected health outcome measures by race/ethnicity
• Increased focus on alignment – NQF, CMS MU, HP2020
• Focused on quality improvement and the story behind the data/trend
• No negative impact on grant funding
• Built ongoing focus on quality metrics into program oversight activities, including program applications and progress reviews
35
Investments to Modernize Primary Care Infrastructure and Service Delivery
Source: Uniform Data System, 2010 and 2015.
36
0%
50%
100%
2010 2015
EHR Adoption
All Sites
98% EHR at all or some
sites
Patient Centered Medical Home Transformation
10/20/2017
13
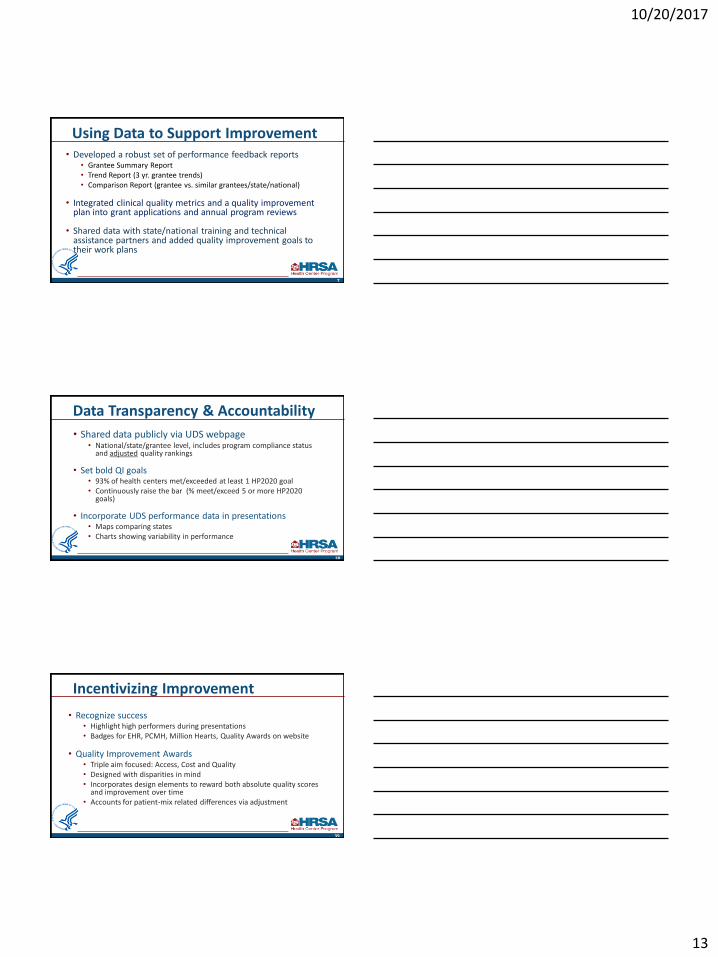
Using Data to Support Improvement • Developed a robust set of performance feedback reports
• Grantee Summary Report • Trend Report (3 yr. grantee trends) • Comparison Report (grantee vs. similar grantees/state/national)
• Integrated clinical quality metrics and a quality improvement plan into grant applications and annual program reviews
• Shared data with state/national training and technical assistance partners and added quality improvement goals to their work plans
7
Data Transparency & Accountability
• Shared data publicly via UDS webpage • National/state/grantee level, includes program compliance status
and adjusted quality rankings
• Set bold QI goals • 93% of health centers met/exceeded at least 1 HP2020 goal • Continuously raise the bar (% meet/exceed 5 or more HP2020
goals)
• Incorporate UDS performance data in presentations • Maps comparing states • Charts showing variability in performance
38
Incentivizing Improvement
• Recognize success • Highlight high performers during presentations • Badges for EHR, PCMH, Million Hearts, Quality Awards on website
• Quality Improvement Awards • Triple aim focused: Access, Cost and Quality • Designed with disparities in mind • Incorporates design elements to reward both absolute quality scores
and improvement over time • Accounts for patient-mix related differences via adjustment
39
10/20/2017
14
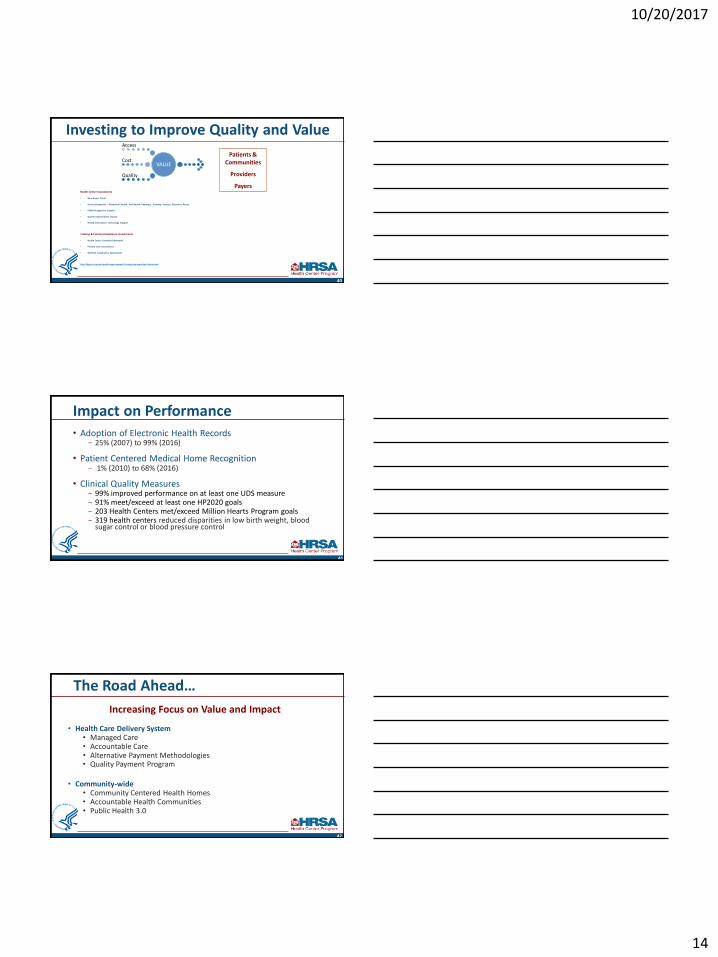
Investing to Improve Quality and Value
Health Center Investments
• New Access Points
• Service Expansions – Behavioral Health, Oral Health, Pharmacy, Enabling Services, Substance Abuse
• PCMH Recognition Support
• Quality Improvement Awards
• Health Information Technology Support
Training & Technical Assistance Investments
• Health Center Controlled Networks
• Primary Care Associations
• National Cooperative Agreements
http://bphc.hrsa.gov/qualityimprovement/strategicpartnerships/index.html
40
VALUE
Access
Cost
Quality
Patients & Communities
Providers
Payers
Impact on Performance • Adoption of Electronic Health Records
- 25% (2007) to 99% (2016)
• Patient Centered Medical Home Recognition - 1% (2010) to 68% (2016)
• Clinical Quality Measures - 99% improved performance on at least one UDS measure - 91% meet/exceed at least one HP2020 goals - 203 Health Centers met/exceed Million Hearts Program goals - 319 health centers reduced disparities in low birth weight, blood
sugar control or blood pressure control
41
The Road Ahead…
Increasing Focus on Value and Impact
• Health Care Delivery System • Managed Care • Accountable Care • Alternative Payment Methodologies • Quality Payment Program
• Community-wide • Community Centered Health Homes • Accountable Health Communities • Public Health 3.0
42
10/20/2017
15
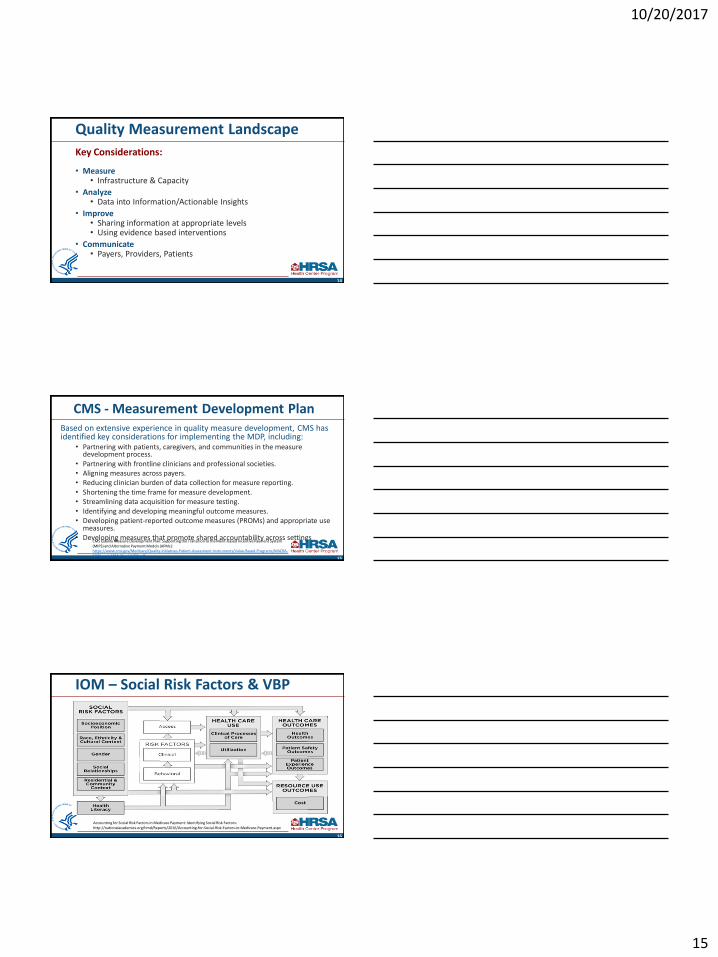
Quality Measurement Landscape
Key Considerations:
• Measure • Infrastructure & Capacity
• Analyze • Data into Information/Actionable Insights
• Improve • Sharing information at appropriate levels • Using evidence based interventions
• Communicate • Payers, Providers, Patients
14
CMS - Measurement Development Plan Based on extensive experience in quality measure development, CMS has identified key considerations for implementing the MDP, including:
• Partnering with patients, caregivers, and communities in the measure development process.
• Partnering with frontline clinicians and professional societies. • Aligning measures across payers. • Reducing clinician burden of data collection for measure reporting. • Shortening the time frame for measure development. • Streamlining data acquisition for measure testing. • Identifying and developing meaningful outcome measures. • Developing patient-reported outcome measures (PROMs) and appropriate use
measures. • Developing measures that promote shared accountability across settings
15
CMS Quality Measure Development Plan: Supporting the Transition to the Merit-based Incentive Payment System (MIPS) and Alternative Payment Models (APMs): https://www.cms.gov/Medicare/Quality-Initiatives-Patient-Assessment-Instruments/Value-Based-Programs/MACRA-MIPS-and-APMs/Final-MDP.pdf
IOM – Social Risk Factors & VBP
16
Accounting for Social Risk Factors in Medicare Payment: Identifying Social Risk Factors: http://nationalacademies.org/hmd/Reports/2016/Accounting-for-Social-Risk-Factors-in-Medicare-Payment.aspx
10/20/2017
16
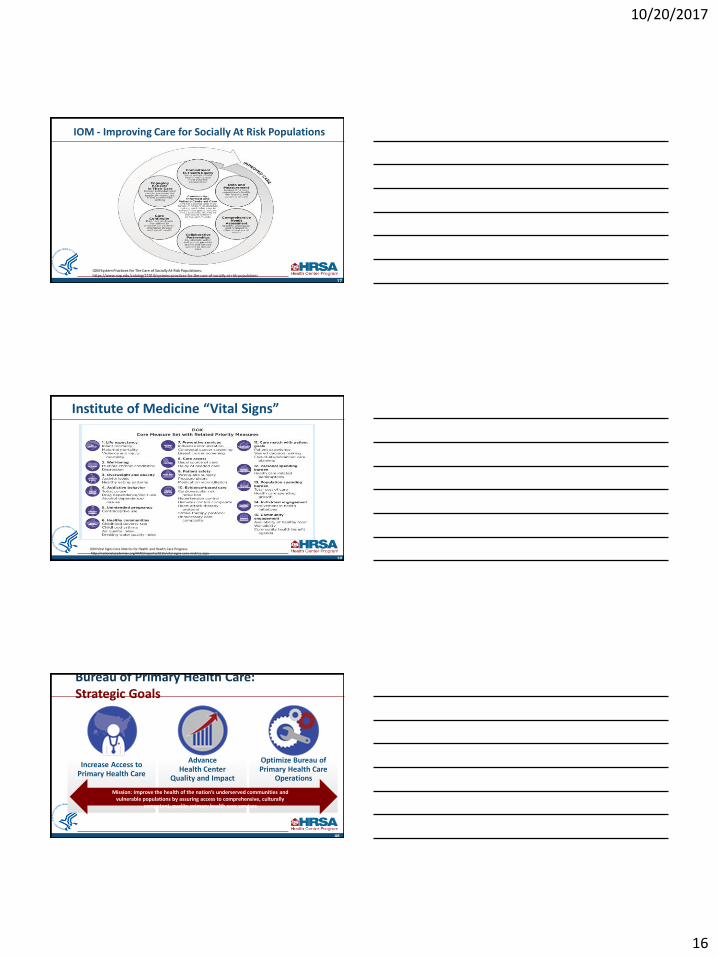
IOM - Improving Care for Socially At Risk Populations
17
IOM System Practices for The Care of Socially At-Risk Populations: https://www.nap.edu/catalog/21914/systems-practices-for-the-care-of-socially-at-risk-populations
Institute of Medicine “Vital Signs”
18
IOM Vital Signs Core Metrics for Health and Health Care Progress: http://nationalacademies.org/HMD/reports/2015/vital-signs-core-metrics.aspx
Bureau of Primary Health Care: Strategic Goals
Increase Access to Primary Health Care
Advance Health Center
Quality and Impact
Optimize Bureau of Primary Health Care
Operations
48
Mission: Improve the health of the nation’s underserved communities and vulnerable populations by assuring access to comprehensive, culturally
competent, quality primary health care services
10/20/2017
17
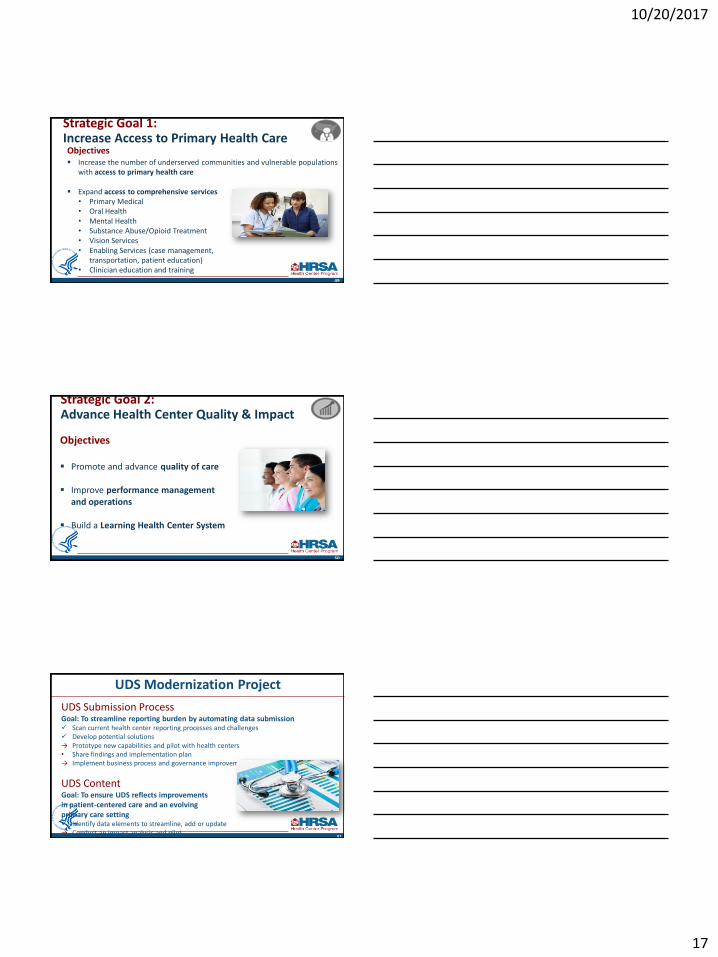
Strategic Goal 1: Increase Access to Primary Health Care
49
Objectives
Increase the number of underserved communities and vulnerable populations with access to primary health care
Expand access to comprehensive services • Primary Medical • Oral Health • Mental Health • Substance Abuse/Opioid Treatment • Vision Services • Enabling Services (case management,
transportation, patient education) • Clinician education and training
Strengthen health center capacity to respond to urgent and emergent issues
Strategic Goal 2: Advance Health Center Quality & Impact
50
Objectives Promote and advance quality of care
Improve performance management
and operations
Build a Learning Health Center System
UDS Modernization Project
51
UDS Submission Process Goal: To streamline reporting burden by automating data submission Scan current health center reporting processes and challenges Develop potential solutions → Prototype new capabilities and pilot with health centers • Share findings and implementation plan → Implement business process and governance improvements
UDS Content Goal: To ensure UDS reflects improvements in patient-centered care and an evolving primary care setting Identify data elements to streamline, add or update → Conduct an impact analysis and pilot • Share findings and implementation plan
10/20/2017
18
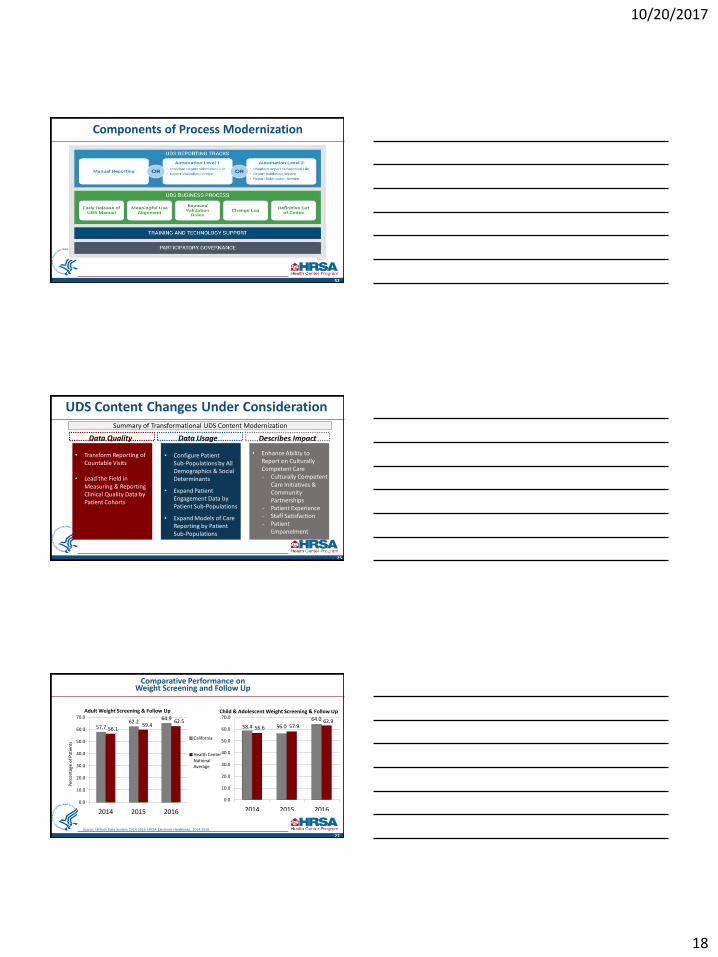
Components of Process Modernization
52
UDS Content Changes Under Consideration
53
Data Quality Describes Impact Data Usage
• Transform Reporting of Countable Visits
• Lead the Field in
Measuring & Reporting Clinical Quality Data by Patient Cohorts
• Configure Patient Sub-Populations by All Demographics & Social Determinants
• Expand Patient Engagement Data by Patient Sub-Populations
• Expand Models of Care Reporting by Patient Sub-Populations
• Enhance Ability to Report on Culturally Competent Care - Culturally Competent
Care Initiatives & Community Partnerships
- Patient Experience - Staff Satisfaction - Patient
Empanelment
Summary of Transformational UDS Content Modernization
25
Low Birth Weight
58.4 56.0
64.0
56.6 57.9 62.9
0.0
10.0
20.0
30.0
40.0
50.0
60.0
70.0
2014 2015 2016
27
Comparative Performance on Weight Screening and Follow Up
Source: Uniform Data System, 2014-2016. HRSA Electronic Handbooks, 2014-2016.
Child & Adolescent Weight Screening & Follow Up Adult Weight Screening & Follow Up
57.7 62.2
64.9
56.1 59.4
62.5
0.0
10.0
20.0
30.0
40.0
50.0
60.0
70.0
2014 2015 2016
California
Health Center National Average
Per
cen
tage
of
Pat
ien
ts
10/20/2017
19
6.8 0.6
6.9
99.1 100.0 100.0
32.6 29.8 32.9
0.0
20.0
40.0
60.0
80.0
100.0
120.0
2014 2015 2016 Highest performing Health Center
Lowest performing Health Center
55
33.7
24.1
38.4
33.5
37.3 38.3
32.0
0.0
5.0
10.0
15.0
20.0
25.0
30.0
35.0
40.0
45.0
American Indian/ Alaska
Native
Asian Black/ African American
Hispanic or Latino
Native Hawaiian
Other Pacific Islander
White (NonHispanic/
Latino)
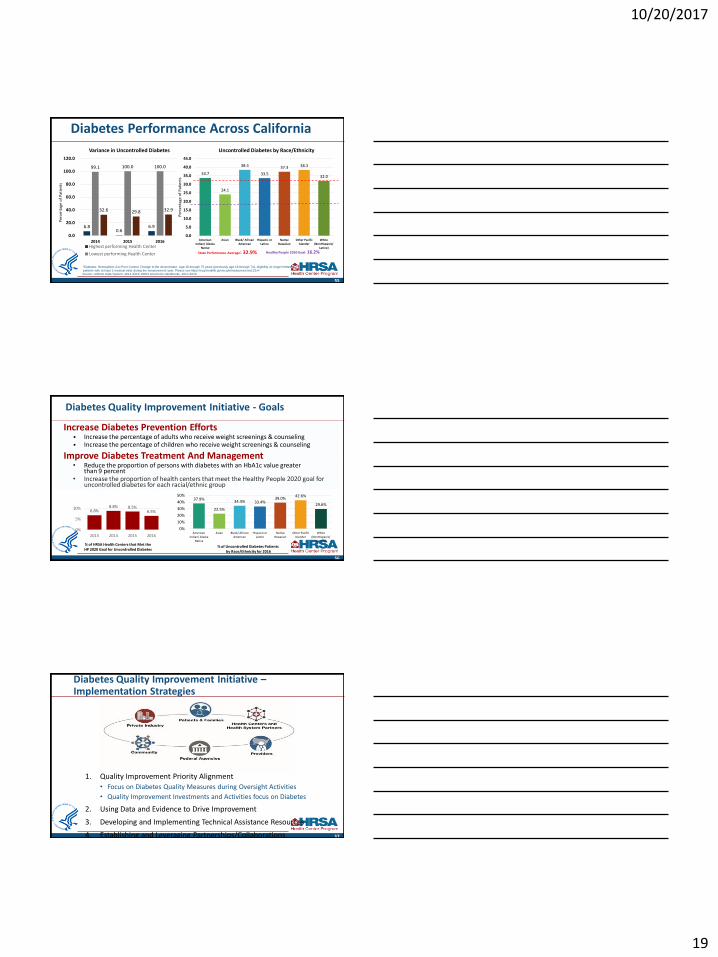
Healthy People 2020 Goal: 16.2%
Uncontrolled Diabetes by Race/Ethnicity Variance in Uncontrolled Diabetes
*Diabetes: Hemoglobin A1c Poor Control: Change to the denominator: Age 18 through 75 years (previously age 18 through 74), eligibility no longer limited to
patients with at least 2 medical visits during the measurement year. Please see https://ecqi.healthit.gov/ecqm/measures/cms122v4 Source: Uniform Data System, 2014-2016. HRSA Electronic Handbooks, 2014-2016.
Per
cen
tage
of
Pat
ien
ts
State Performance Average: 32.9%
Diabetes Performance Across California
Per
cen
tage
of
Pat
ien
ts
Diabetes Quality Improvement Initiative - Goals
Increase Diabetes Prevention Efforts • Increase the percentage of adults who receive weight screenings & counseling • Increase the percentage of children who receive weight screenings & counseling
Improve Diabetes Treatment And Management • Reduce the proportion of persons with diabetes with an HbA1c value greater
than 9 percent • Increase the proportion of health centers that meet the Healthy People 2020 goal for
uncontrolled diabetes for each racial/ethnic group
56
6.8% 8.8% 8.5%
6.5%
0%
5%
10%
2013 2014 2015 2016
% of HRSA Health Centers that Met the HP 2020 Goal for Uncontrolled Diabetes
37.9%
22.5%
34.4% 33.4% 39.0%
42.6%
29.6%
0%
10%
20%
30%
40%
50%
American Indian/ Alaska
Native
Asian Black/ African American
Hispanic or Latino
Native Hawaiian
Other Pacific Islander
White (NonHispanic/
Latino)
% of Uncontrolled Diabetes Patients by Race/Ethnicity for 2016
Diabetes Quality Improvement Initiative – Implementation Strategies
1. Quality Improvement Priority Alignment
• Focus on Diabetes Quality Measures during Oversight Activities
• Quality Improvement Investments and Activities focus on Diabetes
2. Using Data and Evidence to Drive Improvement
3. Developing and Implementing Technical Assistance Resources
4. Establishing and Leveraging Partnerships/Collaborations 57
10/20/2017
20
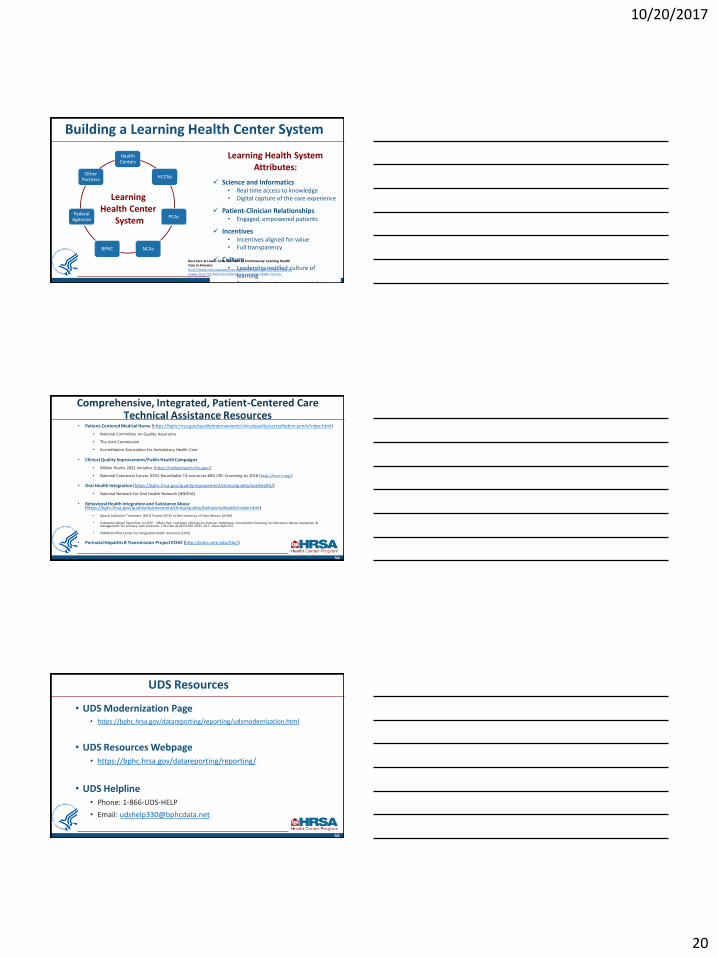
Building a Learning Health Center System
Learning Health System Attributes:
Science and Informatics • Real time access to knowledge • Digital capture of the care experience
Patient-Clinician Relationships • Engaged, empowered patients
Incentives • Incentives aligned for value • Full transparency
Culture • Leadership instilled culture of
learning • Supportive system competencies
28
Best Care at Lower Cost: The Path to Continuously Learning Health Care in America http://www.nationalacademies.org/hmd/Reports/2012/Best-Care-at-Lower-Cost-The-Path-to-Continuously-Learning-Health-Care-in-America.aspx
Health Centers
HCCNs
PCAs
NCAs BPHC
Federal Agencies
Other Partners
Learning Health Center
System
Comprehensive, Integrated, Patient-Centered Care Technical Assistance Resources
• Patient-Centered Medical Home (https://bphc.hrsa.gov/qualityimprovement/clinicalquality/accreditation-pcmh/index.html)
• National Committee on Quality Assurance
• The Joint Commission
• Accreditation Association for Ambulatory Health Care
• Clinical Quality Improvement/Public Health Campaigns
• Million Hearts 2022 Initiative (https://millionhearts.hhs.gov/)
• National Colorectal Cancer (CRC) Roundtable TA resources 80% CRC Screening by 2018 (http://nccrt.org/)
• Oral Health Integration (https://bphc.hrsa.gov/qualityimprovement/clinicalquality/oralhealth/)
• National Network for Oral Health Network (NNOHA)
• Behavioral Health Integration and Substance Abuse (https://bphc.hrsa.gov/qualityimprovement/clinicalquality/behavioralhealth/index.html)
• Opioid Addiction Treatment (OAT) Project ECHO at the University of New Mexico (UNM)
• Substance Abuse Warmline at UCSF - offers free, real-time clinician-to-clinician telephone consultation focusing on Substance Abuse evaluation & management for primary care clinicians. Toll-Free at (855) 300-3595, M-F, 10am-6pm EST.
• SAMHSA-HRSA Center for Integrated Health Solutions (CIHS)
• Perinatal Hepatitis B Transmission Project ECHO (http://echo.unm.edu/hbv/)
59
UDS Resources
• UDS Modernization Page • https://bphc.hrsa.gov/datareporting/reporting/udsmodernization.html
• UDS Resources Webpage • https://bphc.hrsa.gov/datareporting/reporting/
• UDS Helpline • Phone: 1-866-UDS-HELP
• Email: [email protected]
60

10/20/2017
21
Health Center Program Resources
BPHC Helpline: hrsa.gov/about/contact/bphc EHB questions/issues FTCA inquiries
BPHC Project Officer:
Address specific questions about your health center’s grant or look-alike designation
National Cooperative Agreements & Primary Care Associations: bphc.hrsa.gov/qualityimprovement/strategicpartnerships
61
Website: bphc.hrsa.gov Includes many Technical Assistance (TA) resources
Weekly E-Newsletter: Primary Health Care Digest Sign up online to receive up-to-date information
Thank You! Suma Nair PhD, MS, RD
Director, Office of Quality Improvement
Bureau of Primary Health Care (BPHC)
Health Resources and Services Administration (HRSA)
62
[email protected] 301 594 0818
www.bphc.hrsa.gov
facebook.com/HHS.HRSA @HRSAgov