POWERING THE FUTURE OF HEALTHCARE€¦ · catalyzed a movement “inside” healthcare for...
64
Transcript of POWERING THE FUTURE OF HEALTHCARE€¦ · catalyzed a movement “inside” healthcare for...


POWERING THE FUTURE OF HEALTHCARE
Financial and Operational Resilience:
A Combined Heat and Power Guide for Massachusetts Hospital Decision Makers
© 2013 Health Care Without Harm

This report was produced for the Boston Green Ribbon Commission and Health Care Without Harm by Meister Consultants Group, Inc. This report was made possible thanks to support from the Barr Foundation.
Report Authors The lead authors on this report are Andrew Belden, Neil Veilleux, Jon Crowe and Kathryn Wright. Editorial guidance was provided by Bill Ravanesi of Health Care Without Harm.
About Health Care Without Harm Health Care Without Harm (www.noharm.org) has been in existence for seventeen years. During this period, we have catalyzed a movement “inside” healthcare for environmental health, sustainability and energy efficiency initiatives, and built a web of partnerships that have moved these issues from the periphery to the mainstream of healthcare reform. During this time, we have developed a number of strategies to scale the innovations across the sector. In the spring of 2012, HCWH joined with our membership organization, Practice Greenhealth (www.practicegreenhealth.org), and thirteen large and influential healthcare systems to launch the Healthier Hospitals Initiative (www.healthierhospitals.org), a three-year campaign to enroll up to 2,000 hospitals in at least one of six sustainability challenges (leadership, energy, chemicals, food, waste, purchasing).
About The Barr Foundation The Barr Foundation is guided by a vision for a vibrant, just, and sustainable world with hopeful futures for children. Barr’s domestic work is centered on programs in education, climate, and arts and culture. Its goal in education is to close the opportunity gaps in Boston so that public school achievement is no longer predicted by demographics or address. Barr’s environmental work is focused on mitigating climate change, helping Boston and Massachusetts become national models for reducing greenhouse gas emissions. In arts and culture, the foundation works to enhance the cultural vitality of Boston by strengthening mid-sized organizations and youth arts. Since 2010, the foundation has been exploring opportunities for global investments, and it has built a portfolio of projects, predominantly in rural areas in sub-Saharan Africa, Haiti, and India, that seek to improve the lives of children and families in poverty. For more information, visit: www.barrfoundation.org.
About Meister Consultants Group Meister Consultants Group, Inc. (MCG) is an international sustainability consulting firm based in Boston. MCG works with clients to create sustainability initiatives in the network society. To this end, MCG operates at the intersection of markets, policy, and civil society, leveraging participation and dialogue tools to create sustainability strategies and manage change for businesses, governments, and institutions.
Acknowledgements The authors would like to thank the following individuals for their contribution to this report:
John Ballam, Massachusetts Department of Energy Resources John Baker, UMass Medical School Robert Biggio, Boston Medical Center Tom Bourgeois, Northeast Clean Energy Applications Center David Burson, Spaulding Hospital John Cleveland, Boston Green Ribbon Commission David Gibbons, National Grid Louis Graziano, South Shore Hospital Frank Gundel, NSTAR Paul Lipke, Health Care Without Harm Sam Lines, Metrus Energy John Messervy, Partners Healthcare John Moynihan, Cogen Power Technologies
Bill Ravanesi, Health Care Without Harm, Editor

Contents 1 Executive Summary ......................................................................................................................................................... 1
2 Combined Heat and Power Market and Technology Review ........................................................................................ 3
2.1 Combined Heat and Power Market and Potential .................................................................................................. 3
2.2 Technology Overview: CHP System Components ................................................................................................... 5
2.3 CHP System Types, Sizes, and Performance Considerations .................................................................................. 6
2.4 Site Feasibility for Hospitals .................................................................................................................................. 20
3 CHP Development Process ............................................................................................................................................ 23
3.1 The EPA CHP Project Development Process ......................................................................................................... 23
3.2 The Utility Interconnection Process ...................................................................................................................... 24
4 CHP and Health Care Facility Resiliency ........................................................................................................................ 25
5 Massachusetts CHP Financing Options, Incentives and Financial Analysis................................................................... 27
5.1 Federal Tax Benefits of CHP Ownership ............................................................................................................... 27
5.2 State and Utility CHP Incentives............................................................................................................................ 27
5.3 Financing Options ................................................................................................................................................. 32
5.4 CHP System Financial Analysis .............................................................................................................................. 33
6 Health and Environmental Benefits of CHP Technologies ........................................................................................... 36
6.1 Greenhouse Gas Savings Potential ....................................................................................................................... 36
6.2 Health and Societal Benefits ................................................................................................................................. 36
7 Policy and Regulatory Barriers to CHP Market Growth ............................................................................................... 38
8 Lessons Learned from Massachusetts Healthcare CHP Facilities ................................................................................. 40
9 Conclusion ..................................................................................................................................................................... 47
Works Cited ........................................................................................................................................................................... 48
Appendix 1. Selected Resources for Further Reading .......................................................................................................... 52
Appendix 2. CHP System Case Studies .................................................................................................................................. 53

1
1 Executive Summary Combined Heat and Power (CHP) 1 generation is a well-established technology for producing both electricity and thermal
energy directly on-site instead of relying on power from the electricity grid. A well-designed CHP system can significantly
lower greenhouse gas emissions, reduce energy costs and improve the passive survivability of heath care facilities during
emergencies. These important benefits have led to an increased interest in CHP amongst hospitals, state and federal
regulators as well as utilities. There are currently a range of generous incentives available to health care facilities
interested in installing CHP technologies that can lower investment paybacks to as little as four years. Given these available
incentives, and an increased recent interest by hospitals in both improving their environmental footprint and increasing
facility resilience, CHP is becoming an attractive option for health care facilities of all types and sizes. A model cash flow
analysis of a 1 MW microturbine CHP system (full model available in Section 5 of this report) at non-profit hospital
produced at least $700,000 in cash flows annually. Additionally, high energy costs in Massachusetts, coupled with
aggressive efforts by hospitals to reduce operating costs have made CHP development in the Commonwealth particularly
attractive. CHP includes a range of technologies, from large gas turbines that can serve loads of 50 megawatts or more, to
small reciprocating engines designed to serve loads of 20 kW or smaller. Hospitals throughout Massachusetts have
strategically deployed CHP to support a number of goals including:
Significantly reducing grid power purchases,
Avoiding utility peak demand charges,
Meeting facility emergency preparedness goals by providing off grid operations capability,
Substantially mitigating greenhouse gas emissions,
Reducing pollutant emissions that impact the health and welfare of local residents.
Table 1 below shows some key performance parameters as well as currently available incentives for CHP systems in
Massachusetts. While CHP systems can vary widely in technology type, cost and performance, the table provides
illustrative examples of potential system parameters.
Table 1. Representative CHP System Characteristics and Available Incentives
Average Potential Greenhouse Gas Savings 18 percent
Typical System Sizes 25kW to 50 MW
Potential System Payback As little as 4 years
Utility Incentives Up to $1,200 per kW
Federal Tax Credit 10 percent of system cost
State Alternative Portfolio Standard Credit Up to $21.43 per MWh in energy savings
In 2009, Governor Patrick signed both the Global Warming Solutions Act (GWSA) as well as the Green Communities Act
(GCA). These landmark pieces of legislation have fundamentally changed energy efficiency and renewable energy markets
in the Commonwealth and allowed Massachusetts to gain a national leadership position in climate change policy
implementation. The GWSA established aggressive targets of reducing statewide greenhouse gas emissions by 25 percent
1 Combined Heat and Power (CHP) systems are sometime referred to as cogeneration facilities. These terms can be used interchangeably, however the term CHP will be used throughout this report.

2
by 2020 and 80 percent by 2050, while the elements of the GCA provided the regulatory framework and funding
mechanisms needed to start meeting those goals.
One critical provision of the GCA was the addition of CHP systems as an eligible technology under utility efficiency
programs. Additionally, the GCA created a new incentive mechanism to require utilities to purchase credits generated
from CHP systems, further incentivizing the technology. These two policies have resulted in significantly improved CHP
project economics in Massachusetts and a substantial expansion of the Massachusetts CHP market.
With long operating hours and large onsite energy consumption, many hospitals are excellent candidates for CHP
installations, and some of the most successful installations in the country are at health care facilities. Sponsored by
Healthcare Without Harm and the Boston Green Ribbon Commission, this guide is focused on CHP development in the
Massachusetts hospital market. The City of Boston has set aggressive community-wide targets for reducing greenhouse
gas emissions, and many local hospitals have been active and engaged in efforts to reduce energy consumption to help
meet Mayor Menino’s 25 percent emissions reduction target by 2020 and 80 percent by 2050. CHP has already been
adopted by several Boston area hospitals as a part of their comprehensive energy reduction plans and others are currently
exploring the technology.
This paper provides a primer for facility mangers and C-level hospital executives on CHP technologies, their application in
the health care field, and the policy frameworks that currently support CHP in Massachusetts.
Section 2 reviews CHP technologies and applications from gas turbines and microturbines to reciprocating engines
and fuel cells.
The next section provides a brief overview of the CHP development process and also discusses utility
interconnection procedures.
Section 4 discusses CHP and hospital resilience, an increasingly important topic given recent events related to
SuperStorm Sandy.
Section 5 reviews the current Massachusetts state and utility incentives for CHP and provides a representative pro
forma for a 1 MW CHP installation.
The sixth section discusses the health and environmental benefits of CHP installations.
Sections 7 and 8 review current barriers to wider CHP deployment and lessons learned from local hospitals that
have installed CHP.
The appendices to this document contain a list of resources with further information about CHP and three case
studies of hospitals currently deploying CHP in the Greater Boston region.

3
2 Combined Heat and Power Market
and Technology Review
2.1 Combined Heat and Power Market and Potential
The U.S. Department of Energy and U.S. Environmental Protection Agency have identified CHP as an underutilized
technology with significant potential to reduce near-term U.S. greenhouse gas emissions while saving energy consumers
billions of dollars annually. If reached, the 40 GW goal proposed by President Obama in a recent executive order would
lower U.S. energy consumption by one quadrillion BTUs annually, reduce national greenhouse gas emissions by more than
150 million metric tons and save consumers $10 billion annually (U.S. DOE and EPA, 2012).
Combined heat and power is a well-established technology that has been used for more than a century in the United
States to serve onsite power and thermal loads. The U.S. Department of Energy estimates that the current installed U.S.
CHP capacity consists of roughly 82 gigawatts at 3,700 facilities. The majority of this capacity is located at chemical,
petroleum refining and other industrial facilities, however CHP has been effectively implemented at a diverse range of
facility types. Figure 1 shows the total national CHP
capacity by facility. While CHP facilities have
typically been deployed most effectively at
industrial facilities in the United States, the market
for CHP technologies in other parts of the world is
significantly more diverse. For instance Sweden has
one of the most robust CHP markets in the world,
with more than 10 percent of national electricity
being generated by distributed CHP technologies
(Virk, 2011).
CHP investment in the United States has lagged
recently due to regulatory changes that have
discouraged the development of systems intended
to supply power to wholesale power markets. This
trend is largely the result of electricity market
deregulation in many states across the country. In
spite of this, recent significant declines in natural
gas costs, along with improved state-level incentives to support CHP investment have improved the economics of CHP
systems nationwide. Some analysts are predicting that low-cost natural gas supply will continue for the foreseeable future,
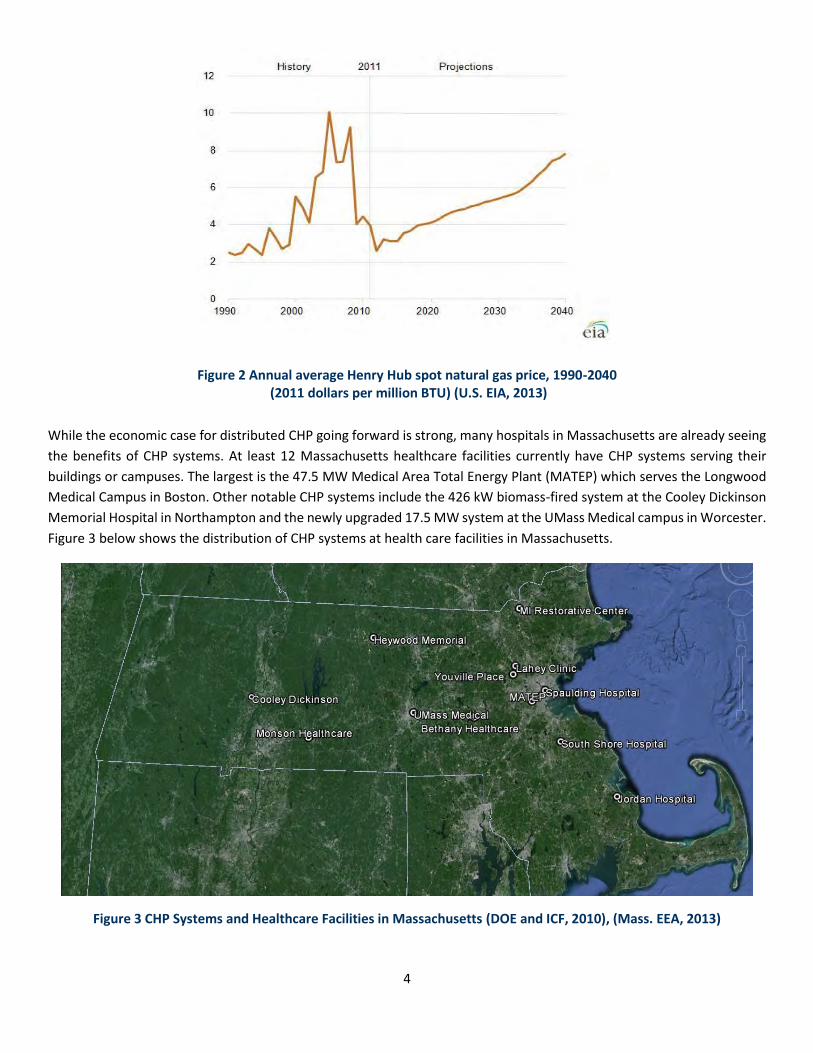
which means that CHP will continue to be an attractive long-term technology investment opportunity. Figure 2 shows the
historic and projected Henry Hub price of natural gas, the primary fuel used by distributed CHP systems. As the figure
illustrates, the U.S. Energy Information Administration (EIA) is expecting natural gas prices to remain relatively low for
many years to come.
Figure 1 Distribution of Existing CHP Capacity by Facility Type in the United States (U.S. DOE and EPA, 2012)
Metals5%
Other Industrial
6%
Other Mfg7%
Food8%
Commercial & Institutional
13%
Paper14%
Refining18%
Chemicals29%
4
Figure 2 Annual average Henry Hub spot natural gas price, 1990-2040 (2011 dollars per million BTU) (U.S. EIA, 2013)
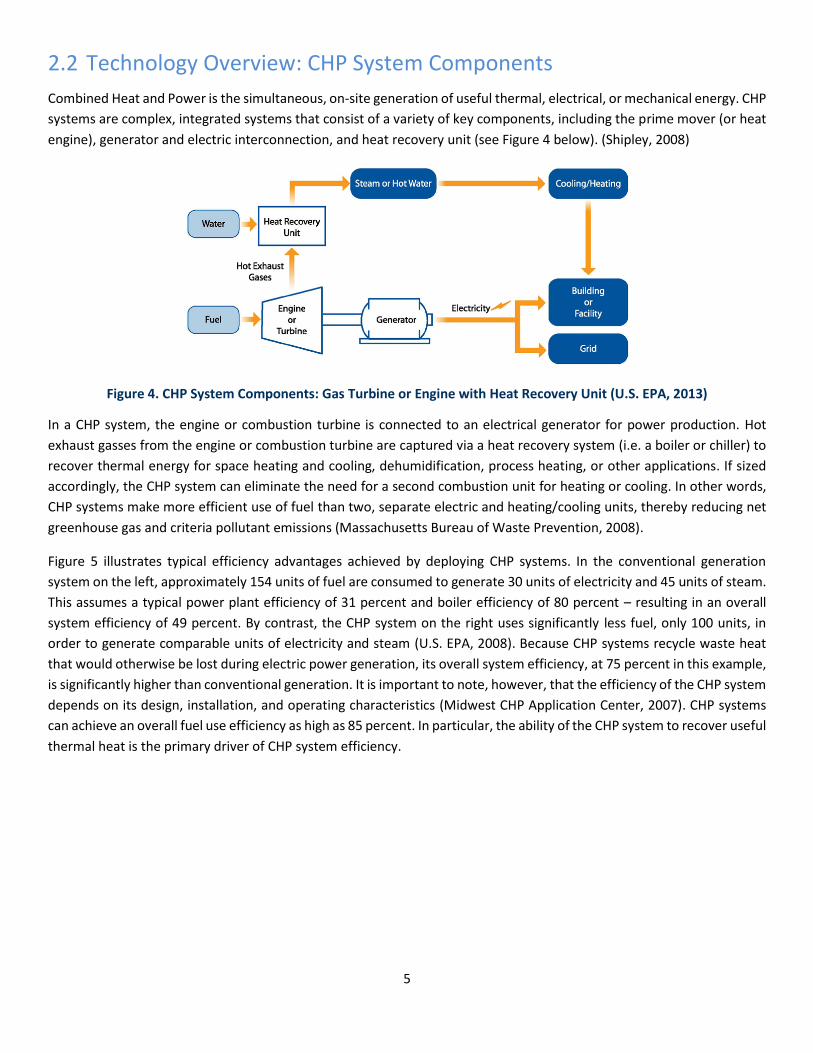
While the economic case for distributed CHP going forward is strong, many hospitals in Massachusetts are already seeing
the benefits of CHP systems. At least 12 Massachusetts healthcare facilities currently have CHP systems serving their
buildings or campuses. The largest is the 47.5 MW Medical Area Total Energy Plant (MATEP) which serves the Longwood
Medical Campus in Boston. Other notable CHP systems include the 426 kW biomass-fired system at the Cooley Dickinson
Memorial Hospital in Northampton and the newly upgraded 17.5 MW system at the UMass Medical campus in Worcester.
Figure 3 below shows the distribution of CHP systems at health care facilities in Massachusetts.
Figure 3 CHP Systems and Healthcare Facilities in Massachusetts (DOE and ICF, 2010), (Mass. EEA, 2013)
5
2.2 Technology Overview: CHP System Components
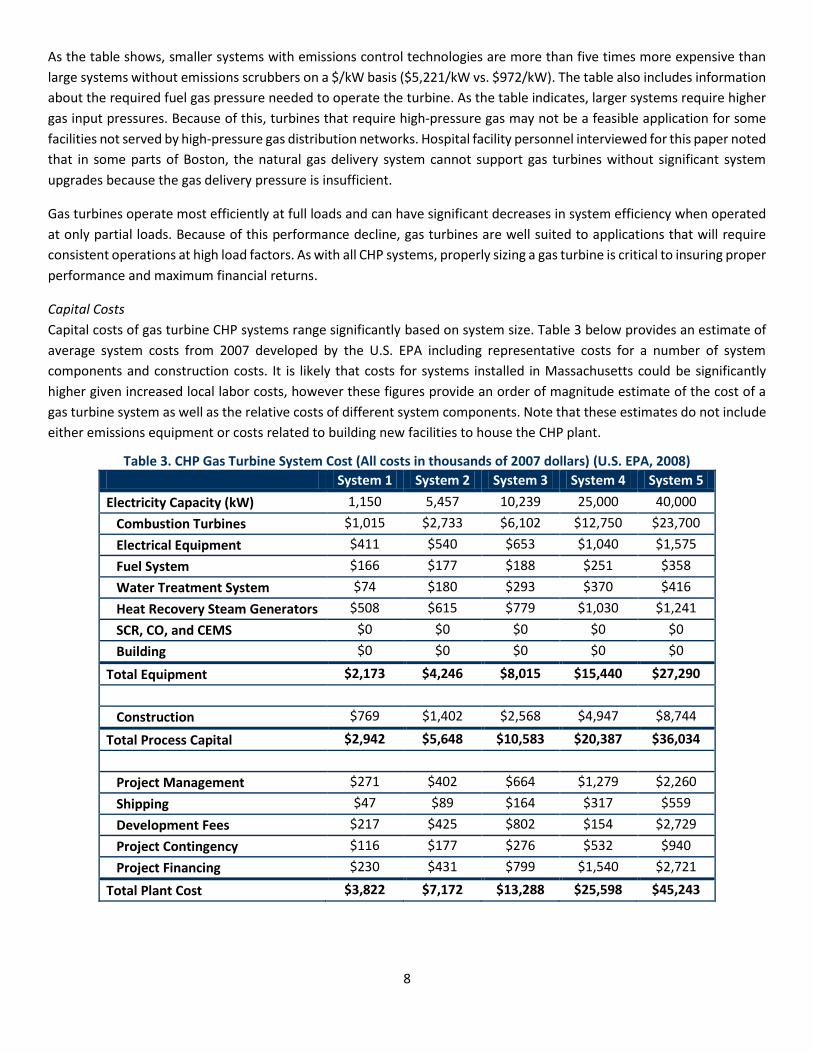
Combined Heat and Power is the simultaneous, on-site generation of useful thermal, electrical, or mechanical energy. CHP
systems are complex, integrated systems that consist of a variety of key components, including the prime mover (or heat
engine), generator and electric interconnection, and heat recovery unit (see Figure 4 below). (Shipley, 2008)
Figure 4. CHP System Components: Gas Turbine or Engine with Heat Recovery Unit (U.S. EPA, 2013)
In a CHP system, the engine or combustion turbine is connected to an electrical generator for power production. Hot
exhaust gasses from the engine or combustion turbine are captured via a heat recovery system (i.e. a boiler or chiller) to
recover thermal energy for space heating and cooling, dehumidification, process heating, or other applications. If sized
accordingly, the CHP system can eliminate the need for a second combustion unit for heating or cooling. In other words,
CHP systems make more efficient use of fuel than two, separate electric and heating/cooling units, thereby reducing net
greenhouse gas and criteria pollutant emissions (Massachusetts Bureau of Waste Prevention, 2008).
Figure 5 illustrates typical efficiency advantages achieved by deploying CHP systems. In the conventional generation
system on the left, approximately 154 units of fuel are consumed to generate 30 units of electricity and 45 units of steam.
This assumes a typical power plant efficiency of 31 percent and boiler efficiency of 80 percent – resulting in an overall
system efficiency of 49 percent. By contrast, the CHP system on the right uses significantly less fuel, only 100 units, in
order to generate comparable units of electricity and steam (U.S. EPA, 2008). Because CHP systems recycle waste heat
that would otherwise be lost during electric power generation, its overall system efficiency, at 75 percent in this example,
is significantly higher than conventional generation. It is important to note, however, that the efficiency of the CHP system
depends on its design, installation, and operating characteristics (Midwest CHP Application Center, 2007). CHP systems
can achieve an overall fuel use efficiency as high as 85 percent. In particular, the ability of the CHP system to recover useful
thermal heat is the primary driver of CHP system efficiency.

6
Figure 5. CHP versus Separate Heat and Power Production (EPA, 2008)
2.3 CHP System Types, Sizes, and Performance Considerations
CHP systems are characterized by the prime mover used in the system. Prime movers include reciprocating engines,
combustion or gas turbines, steam turbines, micro-turbines, and fuel cells (U.S. EPA, 2008). Operational, maintenance,
and performance characteristics of different prime movers can vary. For example, depending on the system, prime movers
can use a variety of fuels – including natural gas, coal, or oil, as well as some alternative fuels like biomass chips or pellets.
Natural gas is the most commonly used CHP fuel, representing 50 to 80 percent of annual CHP capacity additions since
1990. Additionally, size of CHP systems may vary considerably, ranging from 20 kW to 250 MW or more. The appropriate
type of CHP system for any facility depends on customer goals and motivation as well as building and technical
requirements. The following sections review key aspects of several common CHP technologies.
2.3.1 Gas Turbines
Gas turbines have been used since the 1930s to generate power at centralized power plants (U.S. EPA, 2008). These
turbine types can also be used for distributed power generation and are typically most appropriate for larger on-site
applications such as hospital campuses or large universities. Turbines are manufactured by a number of companies and
range in size from 500kW to 250 MW. High efficiency and low emissions make gas turbines an ideal technology for large
healthcare facilities interested in CHP systems.
In a gas turbine, atmospheric gas is heated by combustion with natural gas and is passed through the turbine at high
pressures. The force created by the expanding gas as it exits the turbine rotates a generator to produce electricity. High
temperature exhaust gasses (800-900oF) can be recovered through a heat recovery steam generator (HRSG) to produce
steam or hot water for heating, cooling or domestic hot water needs (U.S. EPA, 2008). Figure 6 shows a schematic diagram
of a gas turbine CHP system.

7
- Figure 6. CHP Gas Turbine Schematic Diagram 2 (U.S. EPA, 2008)
While most turbines use natural gas supplied via the gas distribution grid, they can operate using other fuels such as syn
gas, landfill gas, biogas, propane or fuel oil. Gas turbine pollutant emissions are typically low compared to other on-site
fossil generating technologies such as diesel generators, however some gas turbines may need to include emissions
scrubbing technologies including selective catalytic reduction (SCR) in order to further reduce NOx pollution or oxidative
catalysts in order to reduce carbon monoxide (Clarke Energy, 2012). Local air quality conditions and regulations will
typically dictate whether CHP systems require installation of these emissions technologies. Unlike diesel generation,
natural gas combustion does not result in significant sulfur dioxide emissions that contribute to acid rain and smog
formation.
System Performance
Gas turbine CHP systems are typically more cost effective at larger size ranges. This is due to the greater efficiency of large
systems as well as the economies of scale that can be leveraged with increasing system size. Table 2 below provides an
overview of modeled system characteristics for a range of gas turbine system sizes.
Table 2. Gas Turbine Typical Performance Parameters (U.S. EPA, 2008)
System Parameter System 1 System 2 System 3 System 4 System 5
Electricity Capacity (kW) 1,150 5,457 10,239 25,000 40,000
Basic Installed Cost (2007 $/kW) $3,324 $1,314 $1,298 $1,097 $972
Complex Installation with SCR (2007$/kW) $5,221 $2,210 $1,965 $1,516 $1,290
Electric Heat Rate (Btu/kWh), Higher Heating Value (HHV)
16,047 12,312 12,001 9,945 9,220
Electrical Efficiency (percent), HHV 21% 28% 28% 34% 37%
Fuel Input (MMBtu/hr) 18.5 67.2 122.9 248.6 368.8
Required Fuel Gas Pressure (psig) 82.6 216 317.6 340 435
Steam Output (MMBtu/hr) 8.31 28.26 49.1 90.34 129.27
Total CHP Efficiency (percent), HHV 66.3% 69.8% 68.4% 70.7% 72.1%
2 Note: This diagram shows both a single cycle and combined cycle turbine configuration. In a combined cycle configuration, exhaust heat is used to turn a steam turbine, generating excess electricity. This configuration is typically used for large utility-scale electricity production and is less common in smaller CHP applications.
8
As the table shows, smaller systems with emissions control technologies are more than five times more expensive than
large systems without emissions scrubbers on a $/kW basis ($5,221/kW vs. $972/kW). The table also includes information
about the required fuel gas pressure needed to operate the turbine. As the table indicates, larger systems require higher
gas input pressures. Because of this, turbines that require high-pressure gas may not be a feasible application for some
facilities not served by high-pressure gas distribution networks. Hospital facility personnel interviewed for this paper noted
that in some parts of Boston, the natural gas delivery system cannot support gas turbines without significant system
upgrades because the gas delivery pressure is insufficient.
Gas turbines operate most efficiently at full loads and can have significant decreases in system efficiency when operated
at only partial loads. Because of this performance decline, gas turbines are well suited to applications that will require
consistent operations at high load factors. As with all CHP systems, properly sizing a gas turbine is critical to insuring proper
performance and maximum financial returns.
Capital Costs
Capital costs of gas turbine CHP systems range significantly based on system size. Table 3 below provides an estimate of
average system costs from 2007 developed by the U.S. EPA including representative costs for a number of system
components and construction costs. It is likely that costs for systems installed in Massachusetts could be significantly
higher given increased local labor costs, however these figures provide an order of magnitude estimate of the cost of a
gas turbine system as well as the relative costs of different system components. Note that these estimates do not include
either emissions equipment or costs related to building new facilities to house the CHP plant.
Table 3. CHP Gas Turbine System Cost (All costs in thousands of 2007 dollars) (U.S. EPA, 2008)
System 1 System 2 System 3 System 4 System 5
Electricity Capacity (kW) 1,150 5,457 10,239 25,000 40,000
Combustion Turbines $1,015 $2,733 $6,102 $12,750 $23,700
Electrical Equipment $411 $540 $653 $1,040 $1,575
Fuel System $166 $177 $188 $251 $358
Water Treatment System $74 $180 $293 $370 $416
Heat Recovery Steam Generators $508 $615 $779 $1,030 $1,241
SCR, CO, and CEMS $0 $0 $0 $0 $0
Building $0 $0 $0 $0 $0
Total Equipment $2,173 $4,246 $8,015 $15,440 $27,290
Construction $769 $1,402 $2,568 $4,947 $8,744
Total Process Capital $2,942 $5,648 $10,583 $20,387 $36,034
Project Management $271 $402 $664 $1,279 $2,260
Shipping $47 $89 $164 $317 $559
Development Fees $217 $425 $802 $154 $2,729
Project Contingency $116 $177 $276 $532 $940
Project Financing $230 $431 $799 $1,540 $2,721
Total Plant Cost $3,822 $7,172 $13,288 $25,598 $45,243

9
System Maintenance
As with all power generation technologies, gas turbines require regular ongoing maintenance in order to operate at peak
efficiency. Daily maintenance for gas turbines can include routine monitoring of system performance. More extensive
system inspections are suggested every 4,000 operating hours with major system overhauls required between 25,000 and
50,000 hours of operation (U.S. EPA, 2008). Gas turbine vendors will typically provide maintenance contracts that can
cover a range of services, from complete system operation and maintenance contracts to less frequent services. Table 4
below shows estimated maintenance costs for gas turbines developed by the U.S. EPA. As the table indicates, there are
significant economies of scale in O&M costs for gas turbines as the size of the turbine increases from 1 MW to 40 MW.
Table 4. 2007 National Maintenance Cost Estimates for Gas Turbine CHP Systems (U.S. EPA, 2008)
System 1 System 2 System 3 System 4 System 5
Electricity Capacity, kW 1,000 5,000 10,000 25,000 40,000
Variable (service contract),$/kWh $0.0060 $0.0060 $0.0060 $0.0040 $0.0035
Variable (consumables),$/kWh $0.0001 $0.0001 $0.0001 $0.0001 $0.0001
Fixed, $/KW-yr $40.0 $10.0 $7.5 $6.0 $5.0
Fixed, $/KW-yr @ 8,000 hrs/yr $0.0050 $0.0013 $0.0009 $0.0008 $0.0006
Total O&M Costs, $/kWh $0.0111 $0.0074 $0.0070 $0.0049 $0.0042
2.3.2 Microturbines
Though based on similar designs, microturbines are a much newer technology than traditional gas turbines. First
introduced commercially in the early part of the last decade, microturbines typically range from 25 to 250 kW (The
California Energy Commission, 2003). While individual turbine sizes are small compared to the needs of a typical hospital,
vendors have developed packaged microturbine systems that combine multiple microturbines into an aggregated systems
ranging up to 1 MW of total capacity (Capstone Turbine Corporation, 2010). Like gas turbines, waste heat from
microturbines can be used for a number of applications including space heating and cooling, domestic hot water and
industrial steam generation. Figure 7 below shows a schematic diagram of a typical microturbine. Microturbines will
frequently include a component know as a recuperator which takes hot exhaust gasses exiting the turbine and uses it to
pre-heat the air entering the turbine intake. This pre-heating can significantly improve overall system efficiency, however
this configuration does lower overall exhaust waste heat available for other purposes (U.S. EPA, 2008).
Figure 7. Microturbine CHP System Configuration (U.S. EPA, 2008)
10
Microturbines can run on a range of fuel types including biogas from anaerobic digesters, syn gases, landfill gas as well as
traditional natural gas (Ingersoll Rand, 2013). As with traditional gas turbines, microturbines are notable for their low
criteria pollutant emissions as well as their high relative efficiency (U.S. EPA, 2008). The actual efficiency of microturbines
is lower than standard gas turbines due a lower compression ratio. Microturbines are also suitable as emergency
generators and can be configured to provide quick-start capabilities.
System Performance
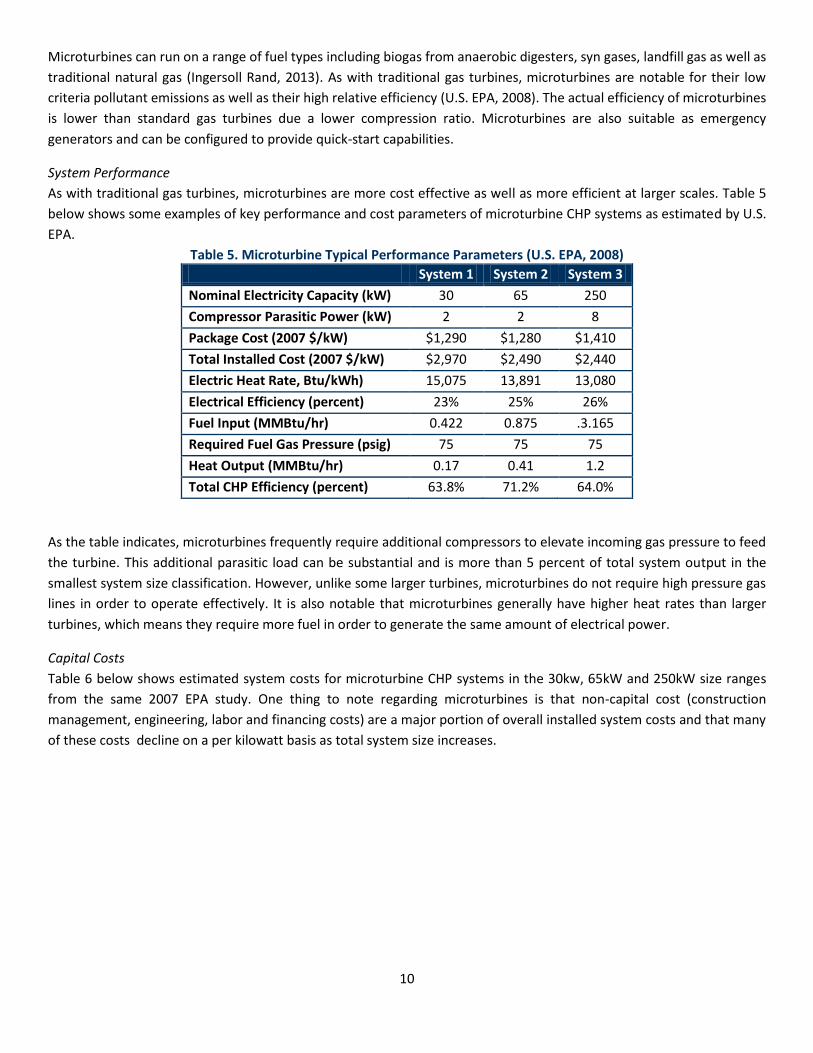
As with traditional gas turbines, microturbines are more cost effective as well as more efficient at larger scales. Table 5
below shows some examples of key performance and cost parameters of microturbine CHP systems as estimated by U.S.
EPA.
Table 5. Microturbine Typical Performance Parameters (U.S. EPA, 2008)
System 1 System 2 System 3
Nominal Electricity Capacity (kW) 30 65 250
Compressor Parasitic Power (kW) 2 2 8
Package Cost (2007 $/kW) $1,290 $1,280 $1,410
Total Installed Cost (2007 $/kW) $2,970 $2,490 $2,440
Electric Heat Rate, Btu/kWh) 15,075 13,891 13,080
Electrical Efficiency (percent) 23% 25% 26%
Fuel Input (MMBtu/hr) 0.422 0.875 .3.165
Required Fuel Gas Pressure (psig) 75 75 75
Heat Output (MMBtu/hr) 0.17 0.41 1.2
Total CHP Efficiency (percent) 63.8% 71.2% 64.0%
As the table indicates, microturbines frequently require additional compressors to elevate incoming gas pressure to feed
the turbine. This additional parasitic load can be substantial and is more than 5 percent of total system output in the
smallest system size classification. However, unlike some larger turbines, microturbines do not require high pressure gas
lines in order to operate effectively. It is also notable that microturbines generally have higher heat rates than larger
turbines, which means they require more fuel in order to generate the same amount of electrical power.
Capital Costs
Table 6 below shows estimated system costs for microturbine CHP systems in the 30kw, 65kW and 250kW size ranges
from the same 2007 EPA study. One thing to note regarding microturbines is that non-capital cost (construction
management, engineering, labor and financing costs) are a major portion of overall installed system costs and that many
of these costs decline on a per kilowatt basis as total system size increases.

11
Table 6. National 2007 Microturbine System Costs per Kilowatt (U.S. EPA, 2008)
System 1 System 2 System 3
Nominal Capacity (kW) 30 65 250
Equipment
Gen Set Package $1,290 $1,280 $1,410
Heat Recovery and other equipment $430 $340 $190
Total Equipment $1,720 $1,620 $1,600
Labor/Materials $710 $360 $350
Total Process Capital $2,430 $1,980 $1,950
Project and Construction Management $210 $200 $190
Engineering and Fees $210 $200 $190
Project Contingency $90 $80 $80
Project Financing (interest during construction) $30 $30 $30
Total Plant Cost $ $2,970 $2,490 $2,440
System Maintenance
Microturbine systems have limited maintenance needs and a number of vendors can provide services under long-term
maintenance contracts. Capstone, one of the leading manufacturers of microturbine CHP systems recommends the
following maintenance schedule for their products (U.S. EPA, 2008):
8,000 Hours of Operation: Replace air filters, fuel filters and igniters
20,000 Hours of Operation: Replace injectors, thermocouples and battery packs
40,000 Hours of Operation: Recommended engine replacement
U.S. EPA estimates that service contracts for CHP microturbine systems should be in the ranges provided in Table 7 below.
Table 7. Estimated Microturbine CHP System O&M Contract Costs (U.S. EPA, 2008)
System 1 System 2 System 3
Nominal Capacity (kW) 30 65 250
O&M Costs - Service Contract, $/kWh $0.015 - $0.025
$0.013 - $0.022
$0.012 - $0.020
2.3.3 Reciprocating Engines
The reciprocating internal combustion engine is commonly used across North America for a variety of applications,
including automobiles, trucks, as well as a wide range of power generation uses. Stationary units range in size from several
kilowatts up to five MW. It is not uncommon to aggregate multiple units in a facility, to serve capacities as large as 30 MW.
For CHP, reciprocating engines typically provide hot water and large multi-megawatt systems can also produce low
pressure steam.
Two basic types of reciprocating engines serve CHP applications: the spark ignition (SI) and compression ignition (CI)
engine. SI engines primarily use natural gas, though they can also run on propane, gasoline, or landfill gas. CI engines

12
typically use diesel (and are commonly referred to as diesel engines), though they can also be set up in a dual-fuel
configuration, burning natural gas with a small amount of diesel fuel.
Historically, diesel engines have been the most popular system for large and small power applications. However, due to
recent environmental concerns, diesel engines are increasingly used only for standby or other limited use applications. As
a result, natural gas fueled SI engines are currently the system of choice for reciprocating engine CHP installations. The
remainder of this section focuses on natural-gas fired SI systems only.
System Performance
Natural gas reciprocating engines provide customers with fast start-up, proven reliability (if properly maintained),
excellent load-following characteristics, and significant heat recovery potential. Systems typically range from 100 kW to 5
MW. Electric efficiencies range from 30 percent for small engines to over 40 percent for large engines (i.e. greater than
three MW).3 Waste heat recovered from the engine’s exhaust as well as the engine cooling systems may be used for hot
water or low pressure steam. Overall efficiencies of SI reciprocating engine CHP systems typically range from 65 percent
to 80 percent. Table 8 below summarizes performance characteristics for systems within the 100 kW to 5 MW size range.
As engine size increases, electrical efficiency also tends to increase. The quantity of thermal energy available on a per-unit
of power output basis tends to decrease as engine size increases. Accordingly, as system capacity increases, the power to
heat ratio for the CHP system generally increases (e.g. more electrical power is provided relative to thermal power). This
is important to note, as changing power to heat ratios will likely impact project economics, influencing the decisions that
customers make in terms of CHP acceptance, sizing, and the desirability of selling power.
Table 8. Reciprocating Energy Performance Parameters (U.S. EPA, 2008)
System Parameter System 1 System 2 System 3 System 4 System 5
Electricity Capacity (kW) 100 300 800 3,000 5,000
Total Installed Cost (2007 $/kW) $2,210 $1,940 $1,640 $1,130 $1,130
Electric Heat Rate (Btu/kWh), HHV 1,200 9,866 9,760 9,492 8,758
Electrical Efficiency (percent), HHV 28% 35% 35% 36% 39%
Fuel Input (MMBtu/hr) 1.2 4.93 9.76 28.48 43.79
Required Fuel Gas Pressure (psig) <3 <3 <3 43 65
Total Heat Recovered (MMBtu/hr) 0.61 2.16 4.3 10.53 15.23
Total CHP Efficiency (percent), HHV 79% 79% 79% 73% 74%
System efficiency is also influenced by operating characteristics. At part load operation, reciprocating engines (like other
engines) experience efficiency losses. As illustrated in Figure 8 below, at 50% part load operation, gas reciprocating engines
typically experience efficiency losses in the range of 8-10% relative to full load operation. The curve steepens as load
decreases further.

13
Figure 8. Part Load Operating Efficiency from Natural Gas Reciprocating Engine (U.S. EPA, 2008)
Relative to gas turbines (which experience efficiency losses of 15-25% at half load conditions), reciprocating engines
perform favorably. As a result, multiple reciprocating engines may be preferable to a single large unit in order to minimize
efficiency losses associated with partial load operation.
Reciprocating engines additionally have excellent availability and black-start capabilities. In the event of electrical outages,
they require minimal auxiliary power inputs to start, and are usually operational with only batteries. Reciprocating engines
have also historically demonstrated availability in excess of 95 percent.
Capital Costs
Though system costs can range significantly based on system size, reciprocating engines generally have relatively low
upfront costs. Table 9 below illustrates installation costs based on estimates collected by the U.S. EPA in 2007. Typical
systems range from $1,130 to $2,210 per kW installed capacity. Systems installed in Massachusetts will likely have higher
system costs due to higher local labor costs.4 Nonetheless, these figures provide an order of magnitude estimate of the
cost of a SI reciprocating engine system as well as the relative costs of different system components.
Costs in Table 9 reflect estimates for CHP systems producing hot water and include heat recovery equipment, process
heat exchangers, circulation pumps, controllers, and piping. The engines are all assumed to have low emission, lean-burn
technology – with the exception of the 100 kW system, which is assumed to be a rich-burn engine that requires three-way
catalyst for most urban installations. Labor, construction, and financing costs are also included in the estimates.
4 Stakeholders interviewed in the development of this report estimated median system costs in Massachusetts to be around $2,500 per kW.

14
Table 9. Reciprocating Engine Cost Parameters (all costs in 2007 dollars). (U.S. EPA, 2008)
System Parameter System 1 System 2 System 3 System 4 System 5
Nominal Capacity (kW) 100 500 1,000 3,000 5,000
Cost ($/kW)
Equipment
Gen Set Package $1,000 $880 $760 $520 $590
Heat Recovery $110 $240 $190 $80 $50
Interconnect/Electrical $260 $60 $40 $30 $20
Total Equipment $1,370 $1,180 $990 $630 $660
Labor/Materials $340 $300 $250 $240 $250
Total Process Capital $1,710 $1,480 $1,240 $870 $910
Project and Construction Management $200 $180 $150 $90 $70
Engineering Fees $200 $180 $150 $90 $70
Project Contingency $70 $60 $50 $30 $30
Project Financing $30 $40 $50 $50 $30
Total Plant Cost ($/kW) $2,210 $1,940 $1,640 $1,130 $1,130
System Maintenance
Reciprocating engines require regular ongoing maintenance in order to operate at peak efficiency. Recommended services
include routine inspections and adjustments as well as periodic replacement of engine oil, filter, and spark plugs (typically
every 500 to 2,000 hours). In order to monitor and minimize engine wear, oil analyses are also recommended as part of
the preventative maintenance program. A top-end overhaul (including cylinder head and turbocharger rebuild) is
recommended every 8,000 to 30,000 operating hours. A major overhaul is generally performed after 30,000 to 72,000
hours of operation, usually requiring piston/line replacement, crankshaft inspection and replacement of bearings and
seals.
Maintenance costs can vary, though manufacturer service contract costs are estimated in Table 10 below. These are also
based on U.S. EPA estimates from 2007, assuming 8,000 annual operating hours and including routine inspections and
scheduled overhauls of the generator set.

15
Table 10. Natural Gas Reciprocating Engine Operating Cost (all values in 2007 dollars) (U.S. EPA, 2008)
System Parameter System 1 System 2 System 3 System 4 System 5
Nominal Capacity (kW) 100 300 800 3,000 5,000
Variable (service contract), 2007 $/kWh 0.02 0.015 0.012 0.01 0.009
Variable (consumables), 2007 $/kWh 0.00015 0.00015 0.00015 0.00015 0.00015
Fixed, 2007 $/kW-yr 15 7 5 2 1.5
Fixed, 2007 $/kWh @ 8000 hrs/yr 0.0019 0.0009 0.0006 0.0003 0.0002
Total O&M Costs, 2007 $/kWh 0.022 0.016 0.013 0.01 0.009
2.3.4 Fuel Cells
Relative to the other prime movers discussed in this paper, fuel cells represent a fundamentally different technology.
Unlike the other technologies described in this report, fuel cells do not combust fuel to generate heat and electricity.
Instead, like batteries, they create an electric current through an electrochemical process.
The diagram below illustrates how a typical fuel cell works. Hydrogen fuel is channeled into a fuel cell’s anode, where a
catalyst splits hydrogen into positive ions and negatively charged electrons. Because the electrolyte (separating the anode
and cathode) permits only the positively charged ions to travel through it, the negatively charged electrons must travel an
external circuit, creating an electrical power current. At the cathode, the electrons and positively charged hydrogen ions
combine with oxygen to form water, which flows out of the cell.
Figure 9. Hydrogen Fuel Cell System Diagram (U.S. DOE, 2013b)
Five types of fuel cells are currently available: phosphoric acid (PAFC), proton exchange membrane (PEMFC), molten
carbonate (MCFC), solid oxide (SOFC), and alkaline (AFC). System characteristics for each fuel cell type are described in

16
Table 11 below. All five fuel cell types offer the potential for clean, quiet, and efficiency power generation. Because
hydrogen fuel reacts electrochemically to generate electricity (and is not combusted), all five types of fuel cells offer
virtually emission-free power generation.
Table 11. Characteristics of Major Fuel Cell Types (U.S. EPA, 2008)
Heat recovered from fuel cells can serve low temperature processes, space heating, and domestic hot water needs. SOFC
and MCFC technologies can also provide low-pressure steam (up to 150 psig). Due to low operating temperatures (usually
below 200 degrees Fahrenheit), PEMFC technologies can provide only low quality heat, making it less useful for space or
process heating applications.
Due to their operational and aesthetic characteristics, fuel cells are attractive to many premium power market customers.
Fuel cells are able to provide low emissions, vibration, and noise; high availability; good power quality; and compatibility
with zoning restrictions. As fuel cells continue to mature, they are expected to be recognized as one of the most reliable
technologies available, due to the fact that they require few moving parts to operate. Additionally, fuel cells can be
designed to operate safely both indoors and outdoors and in close proximity to people, animals, or sensitive environments.
System Performance
Most fuel cell systems are composed of three subsystems: (i) the fuel stack, which generates the electric current, (ii) the
fuel processor, which converts natural gas into a hydrogen-rich feed stream, and (iii) the power conditioner, which
processes electric energy into alternating or regulated direct current. Because fuel cell systems consist of these chemical,
electrochemical, and electronic subsystems, optimizing electrical efficiency and performance characteristics can be
challenging. Performance is also driven by the type and capacity of the fuel cell. Heat generation varies considerably across
fuel cell types, with operating temperatures range from near ambient temperatures to 1,800 degrees Fahrenheit.
Similarly, electrical efficiency can range considerably across fuel cells, from 30 percent to 50 percent. As a result,
performance characteristics, advantages, and challenges vary considerably across fuel cells.
Table 12 below provides a general summary of the performance characteristics of typical natural gas fuel cell CHP systems,
ranging in size from 10 kW to 2 MW. As the table illustrates, as capacity and fuel cell operating temperatures increase,
electrical efficiency also increases. As electricity efficiency increases, the quantity of thermal energy available on a per-

17
unit of power output basis tends to decrease. Accordingly, as system capacity increases, the power to heat ratio for the
CHP system generally increases (e.g. more electrical power is provided relative to thermal power). This is important to
note, as changing power to heat ratios impacts project economics, influencing the decisions that customers make in terms
of CHP acceptance, sizing, and the desirability of selling power.
Table 12. Fuel Cell Performance Parameters (U.S. EPA, 2008)
System Parameter System 1 System 2 System 3 System 4 System 5 System 6
Fuel Cell Type PAFC PEM PEM MVFC MCFC SOFC
Nominal Electricity Capacity (kW) 200 10 200 300 1,200 125
Electric Heat Rate (Btu/kWh) 9,480 11,370 9,750 8,022 8,022 8,024
Electrical Efficiency (percent), HHV 33% 30% 35% 43% 43% 43%
Fuel Input (MMBtu/hr) 1.9 0.1 2 2.4 9.6 1
Power/Heat Ratio 0.8 0.85 0.95 2.13 2.16 1.25
Heat Output (MMBtu/hr) 0.85 0.04 0.72 0.48 1.9 0.34
Total CHP Efficiency (percent), HHV 81% 65% 72% 62% 62% 77
Importantly, however, fuel cell efficiency does not change considerably at full or part load operation. Table 10 below
shows the part load efficiency curve for a market entry PAFC system in comparison to a typical lean natural gas engine.
Efficiency losses for the fuel cell are low; at half load, the fuel cell efficiency is within 2% of full load operation. As load
decreases further, the efficiency loss curve becomes steeper – due in large part to the inefficiencies of air blowers and the
fuel processor. This compares favorably to natural gas engines, which experience much more significant efficiency losses
at part load operation.
Figure 10. Comparison of Part Load Efficiency Derate (U.S. EPA, 2008)
Capital Costs
Installation costs for fuel cells can vary significantly, depending upon geographic area, competitive market conditions, site
requirements, prevailing labor rates, and new construction or retrofit applications. System costs estimates from EPA’s
2007 report are unlikely to reflect current market prices or even relative prices between fuel cell technologies as the

18
market for fuel cell CHP systems has changed dramatically over the last several years. An estimate by the U.S. Department
of Energy found that average medium-scale (100kW to 3 MW) fuel cell CHP systems ranged from $3,500 to $5,500 per kW
in 2010 (U.S. DOE, 2011b). Federal government researchers have a target goal of reducing this cost to $1,500 per kW by
2020.
Maintenance
Maintenance requirements for fuel cells vary depending on the fuel cell type, size, and maturity. Recommended service
includes routine interval inspections and adjustments as well as periodic replacement of filters (projected at intervals of
2,000 to 4,000 hours). Major overhauls include shift catalyst replacement every three to five years, reformer replacement
every five years, and stack replacement every four to eight years. Maintenance can be performed by either in-house
personnel or under service contracts with manufacturers or dealers (U.S. EPA, 2008). The limited life spans of major fuel
cell components have hampered the wide-spread adoption of the technology to date (Fehrenbacher, 2011).
CHP Technologies Summary
Table 13 provides an overview of some of the key characteristics of different CHP technologies.

19
Table 13. CHP Technologies and Performance Considerations (EPA, 2008) Prime Mover Typical Size Fuels Thermal Uses Advantages Disadvantages
Gas Turbine 500 kW to 250 MW Natural gas, biogas, propane, oil
Heat; Hot water; steam (low- or high-pressure)
High reliability
Low emissions
High grade heat available
No cooling required
Requires high pressure gas or in-house gas compressor
Poor efficiency at low loading
Output falls as ambient temperature rises
Microturbines 20 kW to 250 kW Natural gas, biogas, propane, oil
Heat; Hot water; steam (low-pressure)
Small number of moving parts
Compact size and lightweight
Low emissions
No cooling required
High upfront costs
Relatively low mechanical efficiency
Limited to low temperature cogeneration applications
Reciprocating Engine (Spark Ignition)
< 5 MW in DG applications
Natural gas, biogas, propane, landfill gas
Hot water; steam (low- or high-pressure)
High power efficiency with part-load operational flexibility
Fast start-up
Relatively low investment costs
Can be used in island mode and have good load following capability
Can be overhauled on-site with normal operators
Operate on low pressure gas
High maintenance costs
Limited to lower temperature cogeneration applications
Relatively high air emissions
Must be cooled even if recovered heat is not used
High levels of low frequency noise
Reciprocating Engine (Compression Ignition)
4 MW to 75 MW (low speed); < 4 MW (high speed)
Natural gas, biogas, propane, landfill gas
Hot water; steam (low- or high-pressure)
Fuel Cells 5 kW to 2 MW Hydrogen, natural gas, propane, methanol
Hot water; steam (low- or high-pressure)
Low emissions and low noise
High efficiency over load range
Modular design
High upfront costs
Low durability and power density
Fuels requiring processing unless pure hydrogen is used

2.4 Site Feasibility for Hospitals
CHP provides a number of benefits to hospitals. For example, CHP systems can help hospitals manage operational budgets
to address growing utility costs, reduce greenhouse gas emissions, access reliable (and redundant) power, and address air
quality concerns, among others (Midwest CHP Application Center, 2007). However, CHP is not appropriate for every
hospital site. The following section describes key characteristics that decision-makers may consider when initially
evaluating CHP for their facility.
2.4.1 Good Thermal and Power Coincidence
To achieve high efficiency in a CHP system, facilities should have significant demand for heating (or cooling) and electricity
at the same time. This is known as thermal and power coincidence. The greater the ability of a facility to use available
exhaust thermal energy from the prime mover, the greater the system efficiency and the greater the energy saving
achieved by the CHP system. As a general rule of thumb, experts suggest that 50 percent or more of annual available
thermal energy from the prime mover should be used to make a system economically viable. Hospitals make good
candidates for CHP systems because they tend to have fairly significant coincident electric and thermal loads over the
course of the day.
Data from Boston-area hospitals suggest that health care facilities have a diverse range of electric and thermal loads.
Energy demand at some facilities is almost evenly split between electric and thermal consumption while other hospitals
use substantially more electric energy than thermal energy. Given this wide range of hospital energy profiles, a carefully
tailored approach to CHP project implementation is critical to project success.
2.4.2 High Cost of Grid Electricity and Significant Spark Spread
The cost differential between the cost of grid-based electricity and the cost of generating electricity from the CHP fuel is
known as the spark spread. U.S. EPA provides a helpful spark spread calculator (available at www.epa.gov/chp), which
takes into account the cost of the CHP fuel, local electricity costs, cost of capital, and expected fuel usage and energy
demand, among other variables. A numerically positive spark spread indicates that the CHP project returns more than its
total system cost (i.e. fuel, capital and maintenance costs). Overall, the greater the spark spread, the greater the potential
return on investment (U.S. EPA, 2013). Because Massachusetts electricity prices tend to be high for commercial customers
such as hospitals, and natural gas prices are currently low, CHP generally has an attractive spark spread. Table 14 below
provides an example calculation of a spark spread for a Massachusetts hospital CHP facility.

21
Table 14. Spark Spread Calculation for Representative Massachusetts Hospital CHP System5
CHP Spark Spread Calculation
Operating Cost to Generate
CHP Fuel Costs, $/kWh $0.105 Total annual cost of CHP fuel divided by the total
annual kWh of electricity
Thermal Credit, $/kWh -$0.055 Value of annual savings from recovered heat
expressed in $/kWh
Incremental O&M, $/kWh $0.010 Total annual O&M costs divided by annual kWh
generation
MA APS Cash Flow Credit -$.030 APS cash flow per kWh. Number is representative
of current market.
Operating Costs to Generate Power, $/kWh $0.030
Capital Charge, $/kWh $0.024 Total annual capital expenses divided by annual
kWh generation
Total Costs to Generate Power, $/kWh $0.054 Sum of the $/kWh operating and capital costs
Current Average Electricity Price, $/kWh $0.131
Spark Spread, $/kWh $0.077 Difference between electricity costs from the grid
and electricity generated from CHP
In the example provided above, the spark spread shows a 58 percent savings for electricity generated on-site via a CHP
system. It is important to note, that spark spreads are highly sensitive to factors such as current market prices for natural
gas and electricity. Given that prices for these commodities can be volatile, spark spreads can change over the life of a
CHP system based on market conditions. A spark spread analysis should be used as part of an early stage evaluation of
CHP system viability, however a more advanced analysis that incorporates future expected commodity prices as well as
project-specific capital costs should be undertaken as part of the project evaluation process.
2.4.3 Long Operating Hours
Experts report that CHP systems should be utilized for at least 6,000 hours per year – with a minimum of 50 percent usage
of recycled heat (on an annual basis) – for payback to be sufficient. However, the operation time for a CHP system to be
financially viable depends in large part on system design characteristics. For example, in some cases, CHP plants are
operated only at times when the system spark spread is economically advantageous. It is generally advisable though to
design and operate CHP systems to get maximum utilization of thermal energy in order to achieve high system efficiency,
maintain a low emission profile, and achieve the fastest return on investment (New York City Department of Buildings,
2010). Hospitals are typically good candidates because they run all or most of the time, with a fairly stable need for thermal
and electric energy. This means that a variety of operational strategies may be explored to operate a CHP system cost-
effectively.
5 Note: numbers for this analysis are for illustrative purposes only and are based on default numbers supplied by the U.S. EPA for hospitals in Massachusetts. Facilities interested in exploring CHP should visit www.epa.gov/chp to calculate the spark spread for their facility based on real-world values.

22
2.4.4 Adequate Space for Installation
CHP equipment comes in a variety of shapes and sizes, which require adequate space for installation. Microturbines, for
example, are relatively compact and lightweight. Steam turbines, on the other hand, tend to be large and bulky. In general,
most CHP systems require access to air for combustion, gas lines (or other fuel supply), meters, electric access, building
HVAC systems, as well as stacks to carry away waste products from combustion. Access to these systems is not always
confined to one room within a building and may require significant space for development.
2.4.5 Planned Building Renovations or Retrofits
CHP systems are significant capital investments. Costs can run from hundreds of thousands of dollars for smaller systems
to the tens of millions of dollars for larger facilities. They also must be integrated into the existing electric, thermal and
HVAC distribution systems operating at the facility. As a result, the best time to install a CHP system is when considering
energy efficiency improvements, the replacement of aging equipment, or other major facility upgrades (University of
Illinois-Chicago & Midwest CHP Application Center, 2009).

23
3 CHP Development Process
3.1 The EPA CHP Project Development Process
The U.S. EPA’s Combined Heat and Power Partnership has developed a step-by-step process for evaluating CHP site
feasibility. Their online guide to exploring CHP technology is a useful resource for any property manager or other hospital
employee interesting in championing a CHP system at their facility. (U.S. EPA, 2013). This multi-stage process includes the
following steps.
Stage 1. Qualification
During this stage, a high level review of the facility is conducted to evaluate if CHP is a reasonable option. This stage
is a simple checklist of questions that evaluate whether CHP may be economically feasible given local utility
regulations, state and federal incentives and power costs
Stage 2. Level 1 Feasibility Analysis
During this project development phase, project proponents evaluate potential project barriers. A multi-factor
screening process evaluates elements such as current energy costs, thermal and electrical load coincidence and a
review of existing HVAC equipment. This evaluation stage will also provide a preliminary return on investment for the
project. EPA offers free assistance with completing a Level 1 Feasibility Analysis (U.S. EPA, 2013).
Stage 3. Level 2 Feasibility Analysis
This next project phase requires a more in depth engineering analysis of the proposed CHP system. This feasibility
study will typically include 20 or 30 percent design drawings, an in-depth project pro forma with estimated project
pricing and financial returns as well as a detailed evaluation of on-site energy consumption load profiles. During this
project stage, project financing options and ownership structures will also be evaluated. This type of engineering
analysis can cost between $10,000 and $100,000 depending on the size and complexity of the proposed system. The
project team will also need to address permitting concerns during this project phase (i.e. noise and air quality).
Stage 4. Procurement
During this project stage the facility owner procures a contractor through typical facility procurement methods.
Project proponents without in-house expertise in CHP systems may wish to hire an owner’s engineer to assist with
development of technical specifications, procurement advertising, bid review and contract negotiations.
Stage 5. Operations & Maintenance
During this project phase, the CHP system is operated to provide power and thermal energy to the host facility. EPA
estimates that ongoing maintenance costs for CHP systems typically range between $0.005 and $0.015 per kWh.
The U.S. Department of Energy’s Northeast Clean Energy Applications Center has many free resources available for facility
owners exploring CHP technologies and can assist with early stage site feasibility analysis.6 As a facility progresses through
the project development phases, utility programs may have funds available to help pay for a portion of more in depth
feasibility studies. Regardless of where a facility is in the project development pathway, it is important to contact both the
local gas and electric utility early in the process to ensure that the site is not constrained by any issues with the available
local utility service.
6 Contact information and resources provided by the center can be found at: http://www.northeastcleanenergy.org/home/home.php
24
3.2 The Utility Interconnection Process
Given the complexity of the electrical grid and the critical importance of ensuring the reliability of electricity delivery for
all customers, the utilities have stringent guidelines for interconnecting customer-sited generators onto the electricity
system. The timeline for receiving utility approval to interconnect was noted by some stakeholders interviewed for this
report as one issue that delayed the commissioning of their CHP project. As previously noted, it is critical to begin
discussions with the local electric utility early in the CHP development process in order to identify potential project fatal
flaws early on.
The first step in the interconnection process for CHP systems is to file a Pre-Application Report with the local utility.7 This
online application is a simple questionnaire that provides the utility with key information about the size and location of
the proposed system as well as key characteristics about the generator type and existing onsite utility accounts. From this
application, the utilities will provide feedback to the owner of the proposed system regarding potential issues that could
impact the installation. While this is not a full engineering analysis, the pre-screening can identify problems that are useful
to understand before investing further in engineering analysis.
The next phase of the interconnection process after the system has been designed and the owner wishes to proceed with
the installation is to file an interconnection application. This document includes elements such as:
A four-page application document
Stamped electric one-line drawings
A site diagram
An application fee ($4.50/ per kW with a maximum charge of $7,500) (National Grid, 2013)
Once the application is submitted, the utilities may require follow-on engineering studies to determine how the proposed
generator might impact the grid. Utilities are mandated to review applications within time frames specified by either an
expedited or simplified review track. The utilities will provide the system owner with a price quote for any engineering
study which must be paid by the project owner in order to move forward with an interconnection. If the results of an
engineering study require upgrades to the utility infrastructure in order to interconnect the system, these are also borne
by the project owner. After all studies are completed and any system upgrades are made, the utility will provide an
interconnection agreement that authorizes the owner to connect to the electricity grid. Once the system is
interconnected, the utilities require a witness test in order to activate the system. In total, the utilities have up to 150
days to complete all relevant studies, however system upgrades can lengthen this timeline (National Grid, 2013). In
addition to approvals to interconnect from the utility, some larger systems may require studies by ISO-New England, the
regional electricity grid operator. In the event that an ISO-New England study is required, the timeline for interconnection
may be substantially longer (Massachusetts DOER, 2006).
The Massachusetts Department of Energy Resources hosts a website that provides information about utility
interconnection of distributed generations systems. This site has links to interconnection resources for each of the
Massachusetts electric utilities and also tracks interconnection applications to allow applicants to monitor their projects
through the process. It is available at: https://sites.google.com/site/massdgic/
7 The NSTAR pre-application report is available here: http://www.nstar.com/business/rates_tariffs/interconnections/preapplication.asp

25
4 CHP and Health Care Facility Resiliency Recent grid failure events such as SuperStorm Sandy and the New England ice storm of 2011 have put a renewed focus on
electricity system reliability, particularly with respect to critical public health and safety infrastructure. Additionally,
experience from the 2003 Northeast Blackout highlighted the vulnerability of hospital facilities that had traditional
emergency generators. During that grid failure, backup generators at half of New York City’s 58 hospitals were unable to
perform properly (U.S. EPA, 2013). Combined heat and power systems have an established track record of providing
reliable, off-grid power to hospitals and other campus-type facilities during major grid failure events. CHP systems can be
designed to provide a number of emergency support features including blackstart capability, independent operations from
the grid and seamless transitions from on- to off-grid power (U.S. DOE, 2011).
While CHP systems have proven reliable at keeping hospitals powered during grid failure events, CHP systems cannot be
considered adequate emergency power for life critical power needs (Midwest CHP Application Center, 2007). Because
CHP systems typically rely on off-site fuel being continuously delivered to the site, there is a risk that fuel delivery could
be disrupted, resulting in system failure. Additionally, CHP systems may not have the rapid starting capabilities needed
for emergency power systems. While these limitations prevent CHP systems from serving as a sole provider of on-site
emergency power, they can be an important addition to hospital resiliency plans. If designed to operate during a grid
failure event, CHP systems may be used for extended periods of time, whereas emergency generators may be limited to
only several hours of run time. Because CHP systems are typically designed to support a major proportion of hospital and
thermal needs, CHP systems can allow hospitals to run at higher capacities than would be possible solely using emergency
generators. For this reason, CHP systems should be used to augment existing on-site emergency generators, effectively
displacing the need to start and operate these diesel powered generators under most scenarios. Table 15 below compares
and contrasts CHP system with typical on-site emergency generators.
Table 15. Comparison of Typical Emergency Generators to CHP Systems (Midwest CHP Application Center, 2007)
Emergency Generators CHP System
Minimum requirement, sized to meet “life critical loads”
Hospitals are installing larger generators to protect more and more hospital loads
Diesel fueled-high emissions & limited amount of stored fuel (hours vs. days of operation)
Not designed or capable of continuous operation for long periods of time
Financial payback only in times of emergency
Sized to meet thermal or electric loads – operates continuously to meet those loads
Natural gas fueled – low emissions
Does not replace emergency generator set for “life critical” loads
Reduces overall size and capacity of emergency generator sets
Emergency generator sets become backup to the backup; much higher reliability
Good financial return
A number of hospitals have recently been recognized for the performance of their CHP systems during SuperStorm Sandy
in October of 2012. The 11 MW CHP system at the Montefiore Medical Center in the Bronx, New York used its five internal
combustion engines and one combustion turbine to serve more than 95 percent of the hospital’s typical load during the
extended blackout. This system allowed the hospital to provide critical medical services to the region during the grid failure
emergency and even allowed the hospital to take in patients from other hospitals that were unable to operate due to the
storm (U.S. DOE, 2013).
The South Coast Hospital in Amityville, New York is another example of a CHP application providing critical backup
generating capacity during the extended blackout the followed SuperStorm Sandy. Located on Long Island in the territory
of the Long Island Power Authority (LIPA), the South Oaks Hospital is a 245 bed facility that operates five 250kW natural

26
gas reciprocating engines. Designed to operate independently from the grid in the event of a blackout, the system was
able to support the hospital’s electricity and thermal needs for two weeks before LIPA allowed the facility to re-connect
to the grid. Like the Montefiore Medical Center, the South Oaks Hospital became a regional emergency service hub,
accepting patients from other facilities (ICF International, 2013).
.
5 Massachusetts CHP Financing Options,
Incentives and Financial Analysis
Combined heat and power technologies are well supported through federal, state and utility programs and policies in
Massachusetts. This section will review some of the potential incentives CHP owners can leverage to improve the
economic returns of owning a CHP system. The first section will review the federal tax benefits of CHP ownership. The
second will discuss several state and utility incentives Massachusetts electricity customers can access. The final section
reviews financing and CHP system ownership models that can be used to install systems. These include both direct
ownership approaches and third-party ownership models.
5.1 Federal Tax Benefits of CHP Ownership
The federal government currently provides two tax benefits for CHP system owners: the Business Energy Investment Tax
Credit (ITC) and 5-Year Accelerated Depreciation. Combined, these two tax benefits can provide a substantial benefit for
system owners in the form of reduced federal tax liability. Unfortunately, not-for-profit health care institutions that do
not have federal tax liability are unable to benefit from these incentives, meaning that these institutions may need to
pursue non-traditional, third-party ownership structures to monetize these incentives. Third party ownership and other
means of monetizing tax benefits are discussed below.
5.1.1 Federal Business Investment Tax Credit
Section 26 of the U.S. Code provides a ten percent investment tax credit for investments in CHP technologies. This credit
is available for systems up to 50MW, however the full ten percent tax credit is not available for systems over 15MW.
Qualifying systems that do not use biomass-derived fuels must exceed 60 percent total system efficiency threshold.
Systems that are fueled by biomass are not subject to this requirement as long as 90 percent of the system’s fuel is derived
from biomass (DSIRE, 2013).
5.1.2 Federal 5-Year MACRS Depreciation
The U.S. Tax Code allows business owners to depreciate qualifying CHP equipment using the five-year Modified
Accelerated Cost Recovery System (MACRS). Well-designed and maintained CHP systems can last decades, so allowing
system owners to depreciate the costs of their systems over a compressed five-year period can be a significant tax benefit.
(DSIRE, 2013). In addition to allowing qualifying CHP systems to be depreciated using a five-year asset life, systems placed
into service before the end of 2013 also qualify for 50 percent bonus depreciation (The Library of Congress, 2012).
5.2 State and Utility CHP Incentives
Massachusetts has a robust suite of state and utility incentives to support the development of CHP projects. At the state
level, this includes the Alternative Energy Portfolio Standard while the state’s investor owned utilities administer rebates
and other incentives as part of their energy efficiency initiatives.

28
5.2.1 Alternative Energy Portfolio Standard
The Massachusetts Alternative Energy Portfolio Standard (APS) requires investor owned utilities and other load serving
entities to purchase a portion of their annual power sales from qualifying energy technologies. These technologies include
a range of power generation and storage technologies including CHP. Under current regulations, utilities will be required
to increase purchases from APS qualified systems on an annual basis. Table 16 below shows the cumulative proportion of
required power sales under current APS regulations. As the table shows, the requirement is estimated to add around 27
MW on new CHP to the Massachusetts grid annually over the next decade.
Table 16. APS Requirement 2009-2020 (Mass. DOER, 2009)
Compliance Year
Cumulative Minimum
Percentage of Power from Qualified APS
Generators
Estimated MW of Installed CHP (Cumulative)
2009 1.00
2010 1.50 64
2011 2.00 92
2012 2.50 121
2013 3.00 148
2014 3.50 177
2015 3.75 205
2016 4.00 215
2017 4.25 226
2018 4.50 237
2019 4.75 249
2020 5.00 261
In order meet the requirements of the APS, load serving entities must purchase Alternative Energy Credits (AECs) from
qualified systems. One AEC is the equivalent of one MWh of net source fuel savings. AECs are calculated based on a
formula that determines the energy savings from a CHP system compared against the alternative of purchasing power
from the grid and using on-site thermal units to provide heating (or cooling) at a site. (Ballam, 2012). AECs generation
must be verified by an independent entity based on the metered CHP system fuel use as well as thermal and electrical
output. Hospitals can monetize their AECs through a broker that can bundle credits from a single or multiple projects and
sell them to utilities.
Massachusetts regulations cap the maximum value of AECs at around $21.41 per MWh. Calculating the potential AECs
incentive value for any CHP system is complex and requires accurate estimates of AECs market values, electricity
generation efficiency, CHP system overall efficiency and estimated full load run hours. DOER has developed a calculator
that allows potential CHP system owners to estimate AECs incentive values based on these and other factors.8
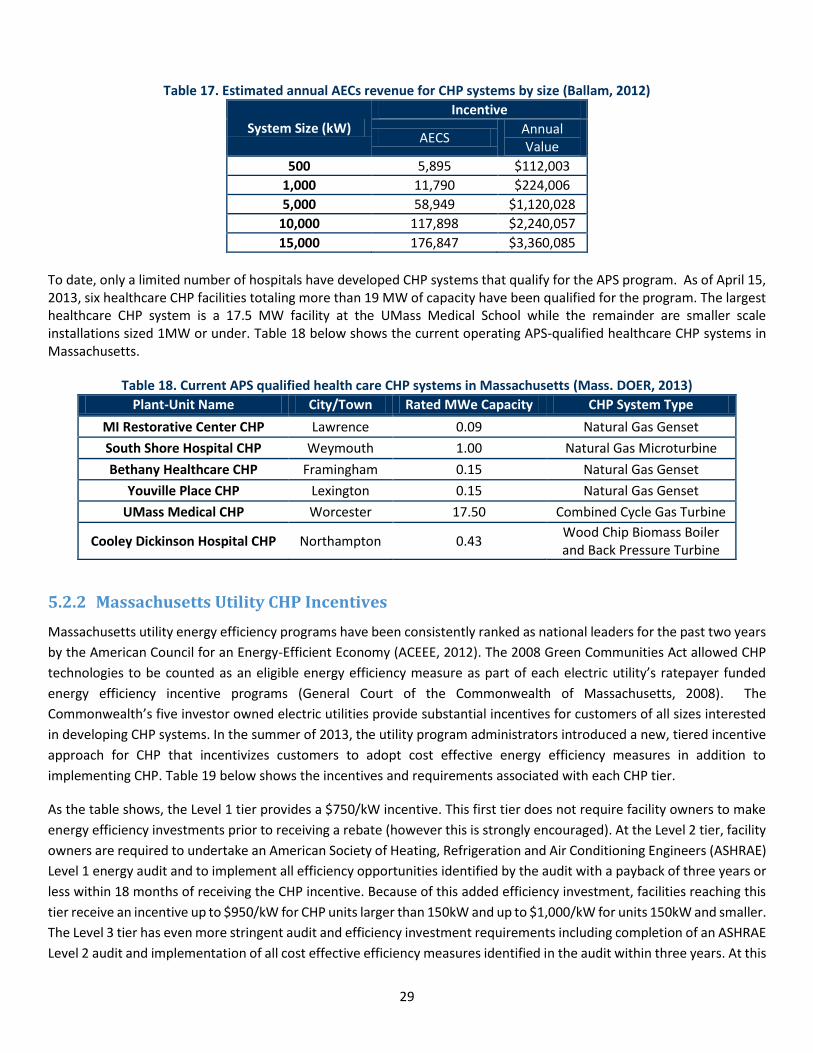
Table 17 below provides an estimated annual incentive amount by CHP system size for representative CHP systems. As
noted by DOER, these values equate to roughly $0.02 per MWh and should cover a substantial portion of the annual
maintenance costs of a typical CHP system (Ballam, 2012).
8 This calculator can be found at: http://bit.ly/15VXIFA
29
Table 17. Estimated annual AECs revenue for CHP systems by size (Ballam, 2012)
System Size (kW)
Incentive
AECS Annual Value
500 5,895 $112,003
1,000 11,790 $224,006
5,000 58,949 $1,120,028
10,000 117,898 $2,240,057
15,000 176,847 $3,360,085
To date, only a limited number of hospitals have developed CHP systems that qualify for the APS program. As of April 15, 2013, six healthcare CHP facilities totaling more than 19 MW of capacity have been qualified for the program. The largest healthcare CHP system is a 17.5 MW facility at the UMass Medical School while the remainder are smaller scale installations sized 1MW or under. Table 18 below shows the current operating APS-qualified healthcare CHP systems in Massachusetts.
Table 18. Current APS qualified health care CHP systems in Massachusetts (Mass. DOER, 2013)
Plant-Unit Name City/Town Rated MWe Capacity CHP System Type
MI Restorative Center CHP Lawrence 0.09 Natural Gas Genset
South Shore Hospital CHP Weymouth 1.00 Natural Gas Microturbine
Bethany Healthcare CHP Framingham 0.15 Natural Gas Genset
Youville Place CHP Lexington 0.15 Natural Gas Genset
UMass Medical CHP Worcester 17.50 Combined Cycle Gas Turbine
Cooley Dickinson Hospital CHP Northampton 0.43 Wood Chip Biomass Boiler and Back Pressure Turbine
5.2.2 Massachusetts Utility CHP Incentives
Massachusetts utility energy efficiency programs have been consistently ranked as national leaders for the past two years
by the American Council for an Energy-Efficient Economy (ACEEE, 2012). The 2008 Green Communities Act allowed CHP
technologies to be counted as an eligible energy efficiency measure as part of each electric utility’s ratepayer funded
energy efficiency incentive programs (General Court of the Commonwealth of Massachusetts, 2008). The
Commonwealth’s five investor owned electric utilities provide substantial incentives for customers of all sizes interested
in developing CHP systems. In the summer of 2013, the utility program administrators introduced a new, tiered incentive
approach for CHP that incentivizes customers to adopt cost effective energy efficiency measures in addition to
implementing CHP. Table 19 below shows the incentives and requirements associated with each CHP tier.
As the table shows, the Level 1 tier provides a $750/kW incentive. This first tier does not require facility owners to make
energy efficiency investments prior to receiving a rebate (however this is strongly encouraged). At the Level 2 tier, facility
owners are required to undertake an American Society of Heating, Refrigeration and Air Conditioning Engineers (ASHRAE)
Level 1 energy audit and to implement all efficiency opportunities identified by the audit with a payback of three years or
less within 18 months of receiving the CHP incentive. Because of this added efficiency investment, facilities reaching this
tier receive an incentive up to $950/kW for CHP units larger than 150kW and up to $1,000/kW for units 150kW and smaller.
The Level 3 tier has even more stringent audit and efficiency investment requirements including completion of an ASHRAE
Level 2 audit and implementation of all cost effective efficiency measures identified in the audit within three years. At this

30
incentive level, facility owners are eligible for an incentive of up to $1,100/kW for systems larger than 150kW and
$1,200/kW for systems less than or equal to 150kW.
All systems receiving an incentive must pass the utility’s cost effectiveness test. Under this test, the lifetime benefit to
utility ratepayers of the system must exceed the lifetime costs. In order to calculate this ratio, utilities evaluate elements
such as:
The kW output of the CHP system
Net source expected lifetime fuel costs
The annual net kWh generated
Installed cost of the equipment
Ongoing annual maintenance costs
Quantity and type of fuel being displaced by system
Timing of power production (Mass Save, 2010).
In order to receive a utility incentive, a CHP system must also have a combined overall efficiency of 60 percent or greater.
The utilities suggest that facilities interested in exploring CHP systems should contact them early in the project
development process in order to ensure that the final project design is able to meet incentive program eligibility criteria
(Mass Save, 2010).

Table 19. Massachusetts Utility Efficiency Program Incentive Tiers
Level 1 Level 2 Level 3
Basic Moderate Advanced
Co
nd
itio
ns
Efficiency Opportunities
Efficiency opportunities to be identified prior to determining proper size of CHP
system
ASHRAE Level 1 audit by utility approved vendor of qualified engineering firm
required
ASHRAE Level 2 audit by utility approved vendor or qualified engineering firm
required
Audit Cost / Incentives
- Cost of audit and associated incentives at discretion of Program Administrators
Cost of audit and associated incentives at discretion of Program Administrators
Efficiency Measures
-
All identified cost-effective measures with simple payback < 3 years within 18 months of utility incentive commitment
of CHP system
All identified cost-effective measures to be implemented within 3 years of utility incentive commitment for CHP system
Savings Goals - -
Total site energy use to be reduced by > 10% through electrical and/or thermal
measure. Measures installed within previous 2 years can be applied towards
10% goal
CH
P S
yste
m
Sizing Size must not exceed thermal and/or
electrical load of the building assuming implementation of efficiency measures
Sized to follow thermal loads of the building post implementation of all efficiency measures with a simple
payback <= 3 years
Sized to follow thermal loads of the building post implementation of all efficiency measures with a simple
payback <= 3 years
Efficiency - Annual estimated efficiency > 60% Annual estimated efficiency > 65%
Cost-effectiveness
Must pass program cost-effectiveness test to be eligible for incentives
Must pass program cost-effectiveness test to be eligible for incentives
Must pass program cost-effectiveness test to be eligible for incentives
Ince
nti
ves
$ per kW $750 per kW Up to $950 per kW for units > 150kW or Up to $1,000 per kW for units <= 150 kW
Up to $1,100 per kW for units > 150kW or Up to $1,200 per kW for units <= 150
kW
Total Incentives
Not to exceed 50% of total project costs Not to exceed 50% of total project costs Not to exceed 50% of total project costs
Approval Final incentive amounts are at the discretion of the associated utility
Final incentive amounts are at the discretion of the associated utility
Final incentive amounts are at the discretion of the associated utility

5.3 Financing Options
Hospitals have a number of options for financing CHP systems. These range from cash and traditional debt to more
sophisticated third-party financing arrangements. Each of these options have different costs and benefits. Traditional
financing techniques may provide health care facilities with the lowest cost capital and the greatest financial return,
however this approach may require facilities to take on additional project risk. Third-party ownership options may result
in a lowered overall project financial return, however these financing arrangements reduce project performance risk to
the health care facility. Given the scale of typical CHP projects, healthcare facilities should explore a number of financing
options before moving forward with a project. While each CHP project is unique, the following sections review some of
the potential costs and benefits of typical CHP financing models.
5.3.1 Direct Ownership Financing Options
Hospitals and other health care facilities may be able to incorporate CHP systems into traditional capital budgeting
processes. Under this scenario, the system would be financed as any typical capital project, either through cash payments,
bank loans or bond financing. Hospitals may able to command competitive interest rates for their capital projects.
Financing costs are a considerable part of CHP system economics, and hospitals with access to low-cost, tax exempt capital
may find this strategy the most cost-effective means of financing CHP systems.
Under this financing method, the owners of the health care facility retain ownership over all federal and state incentives.
This could create challenges for some not-for-profit hospitals, as a federal tax incentives cannot be effectively monetized
by entities without tax liability. As discussed in the previous sections, both the federal Investment Tax Credit (ITC) and the
5-year MACRS depreciation benefit can considerably improve CHP project economics and leaving these benefits un-used,
can make CHP project returns unattractive for non-profit entities. This problem is, in part, obviated by the fact that not-
for-profit hospitals can access tax-exempt bond markets that can substantially lower financing costs for capital
improvements compared to taxable entities. MassDevelopment has recently supported financing of CHP projects and may
be able to assist hospitals with arranging tax-exempt financing.
5.3.2 Third Party Ownership (TPO)
Third party ownership of CHP systems includes several financing structures, from traditional operating leases to Power
Purchase Agreements and hybrid structures. Under these models, a hospital would not have an ownership interest in the
CHP system, but would still benefit from the power and heat generated from the installation. Lease and PPA financing is
typically structured to allow the third party system owner to take advantage of federal tax incentives and may also be
designed to allow the third-party owner to benefit from state-level incentives such the Massachusetts APS.
5.3.2.1 Lease Financing
Lease financing is a traditional method of financing equipment in many industries. Leases are typically characterized as
either operating leases or capital leases, depending on the structure of the agreement. Under an operating lease,
ownership interest in the leased property would remain with the lessor, entitling them to any tax benefits associated with
owning the property (U.S. EPA). Operating leases have been described as “off-balance sheet financing” as they do not
appear as debt obligations on the leasee’s financial statements.9 This arrangement may be attractive to hospitals with
substantial existing debt that are unable to take on new debt obligations, but that still want to move forward with a CHP
system installation. Capital leases are another potential CHP financing structure. Unlike operating leases, under a capital
9 It is important to note that expected changes to U.S. standard accounting practices are expected to change the treatment of operating leases, potentially impacting their status as “off balance sheet.” (Meister, 2012)

33
lease, the lessee would be able to monetize any tax benefits associated with the ownership of a CHP system, benefiting
hospitals that would have federal tax liabilities.
5.3.2.2 Energy Service Agreements (ESAs) and Power Purchase Agreements (PPAs)
Other potential third-party ownership models include Energy Service Agreement and Power Purchase Agreements. Under
these structures a third party finances, builds, owns and operates a CHP system at a facility. The hospital signs a long-term
contract with the system owner to purchase heat and power from the system. This arrangement may be attractive to a
hospital with limited experience with CHP systems, as the third-party owner would typically be responsible for operating
and maintaining the system. This ownership model also can be structured to transfer system performance risk as the
hospital only pays for power and heat that is delivered on the site. If the system does not perform as expected, the hospital
can purchase power from the grid, limiting potential financial losses. PPAs and ESAs are increasingly popular structures
for funding the development of solar power systems and energy efficiency projects, however experience with CHP projects
under this ownership model are more limited. Given the success of these financing structures in other energy
technologies, they may become an important tool for developing CHP projects in the coming years.
Table 20. Pros and Cons of Third Party Owners vs. Direct Ownership
Pros Cons
Direct Ownership May be best option if able to monetize all benefits
Hospitals may be able to benefit from lower cost financing than under third party model
Takes on system performance risk
May require debt on balance sheet if not paid for in cash
Day-to-day operations likely in-house
Must have own service contract for long-term maintenance
Third Party Ownership Can benefit from tax incentives even if a non-profit
O&M handled by system owners
Contracts typically have guaranteed production minimums
Lower overall system financial benefits to hospital in some cases
Many third-party owners are new entities with limited track records
5.4 CHP System Financial Analysis
Many hospital decision makers may be accustomed to making investment decisions based on simple payback calculations.
Massachusetts healthcare stakeholders interviewed for this paper reported that simple paybacks are the primary
investment analysis metric used at their facilities to evaluate the financial viability of capital improvement projects. While
some interviewees reported that hospital CFOs were able to make concessions for CHP systems that were marginally
outside typical investment payback windows, others noted that CHP systems proposed at their facilities were not able to
meet corporate payback hurdles.
It is important to note that CHP systems and other energy efficiency projects are often cash-flow positive investments,
meaning that total revenue resulting from system operations typically exceed debt-service requirements by comfortable
margins. Given this, and that CHP systems and other efficiency measures are carefully engineered systems with highly
predictable cash flows, net revenues from CHP investments may be viewed as less speculative than other competing
investments. CFOs and other financial decision makers may wish to account for this reduced cash-flow risk when
evaluating CHP projects by raising project payback hurdle rates.

34
CHP system returns are a function of a number of project elements and calculating the financial return of any project
requires accurate estimates of elements such as:
System capital costs (including costs related to system design, utility interconnection and commissioning)
Construction financing costs
Long term financing costs
Ongoing operations and maintenance charges
Spark spread over the life of the system (i.e. the difference between the cost of grid power and the cost to self-generate)
Operating strategy (i.e. base load, peaking, seasonal, etc.)
Overall system efficiency (including electricity generation efficiency and thermal utilization rates)
Federal, state and utility incentives
Required debt-service coverage ratios
Potential benefits associated with facility uptime during grid emergencies
Each of these project parameters will be highly specific to the individual installation and will vary considerably for different
project technologies, system sizes and even utility territories within the Commonwealth. Before proceeding with any CHP
project, a full cash flow analysis should be performed in order to make sure the system meets or exceeds corporate risk-
return requirements.
Table 21 below shows the first ten years of a representative simplified cash flow analysis for a 1 MW Capstone
microturbine CHP system at a non-profit hospital facility. The total system cost is estimated at $3.25 million and receives
a $750,000 utility incentive. Sixty percent of the remaining capital costs were assumed to be financed through a 12-year
bond at 7.5 percent with the remainder of the costs coming from cash. The system is assumed to have a 15-year life and
to operate as a base-load generating plant with 90 percent uptime. Total system efficiency and exhaust heat output were
derived from Capstone system specs (Capstone Turbine Corporation, 2008). Payments for AECs from the state Alternative
Portfolio standard were derived from DOER estimates (Ballam, 2012) and annual O&M costs were estimated from values
published by the U.S. EPA (U.S. EPA, 2008). Utility rates are based on current Massachusetts electricity and gas rates and
are assumed to escalate at 1.5 percent per year.
As the chart shows, the system has a net positive cash flow of more than $700,000 per year. Total net present value of
the system over the 15 year life at a 10 percent discount rate is estimated at over $4.5 million with a simple payback of
less than four years. Given the above financing assumptions, the system would be cash-flow positive from day one if
financed with 100 percent debt. Because this simplified example is for a non-profit institution, federal tax benefits are not
included in the analysis, however system economics would likely improve if federal tax credits could be monetized in
addition to the utility and state incentives reviewed in the case below.
As this case shows, properly designed CHP system can be an attractive investment opportunity for hospitals that can
access low-cost, long-term debt. Under the right conditions and with proper design, a CHP system can provide significant
first-year cash flow that can increase over time as utility rates from grid power increase over the life of the project.
Effectively monetizing incentives from both the utility energy efficiency programs and the state alternative portfolio
standard are critical to project economics.

Table 21. 1 MW Microturbine CHP System Cash Flow Analysis
Year 0 1 2 3 4 5 6 7 8 9 10
A Total Electricity Generated (MWh)
7,884 7,884 7,884 7,884 7,884 7,884 7,884 7,884 7,884 7,884
B Electricity Rate ($/kWh) $0.13 $0.13 $0.13 $0.14 $0.14 $0.14 $0.14 $0.14 $0.15 $0.15
C Total Value of Electricity (A*B*1000)
$1,024,920 $1,040,294 $1,055,898 $1,071,737 $1,087,813 $1,104,130 $1,120,692 $1,137,502 $1,154,565 $1,171,883
D Total Gas Consumption (MMBtu)
24,913 24,913 24,913 24,913 24,913 24,913 24,913 24,913 24,913 24,913
E Total Useable Waste Heat (MMBtu)
9,461 9,461 9,461 9,461 9,461 9,461 9,461 9,461 9,461 9,461
F Net Gas Consumption (MMBtu) (D-E)
15,453 15,453 15,453 15,453 15,453 15,453 15,453 15,453 15,453 15,453
G Natural Gas Rate ($/MMBtu) $9.90 $10.05 $10.20 $10.35 $10.51 $10.67 $10.83 $10.99 $11.15 $11.32
H Net Gas Cost ($)(FXG) -$153,016 -$155,311 -$157,641 -$160,005 -$162,405 -$164,842 -$167,314 -$169,824 -$172,371 -$174,957
I Total Value of CHP Generation (C)
$1,024,920 $1,040,294 $1,055,898 $1,071,737 $1,087,813 $1,104,130 $1,120,692 $1,137,502 $1,154,565 $1,171,883
J Net Gas Cost (H) -$153,016 -$155,311 -$157,641 -$160,005 -$162,405 -$164,842 -$167,314 -$169,824 -$172,371 -$174,957
K Total Value of AECs $224,006 $224,006 $224,006 $224,006 $224,006 $224,006 $224,006 $224,006 $224,006 $224,006
L Annual O&M Expense -$157,680 -$157,680 -$157,680 -$157,680 -$157,680 -$157,680 -$157,680 -$157,680 -$157,680 -$157,680
M Total Year Annual Cash flow From Operations (I+J+K+L)
$938,230 $951,309 $964,583 $978,057 $991,733 $1,005,614 $1,019,704 $1,034,004 $1,048,520 $1,063,252
N Total Plant Costs -$3,500,000
O Utility Incentive $750,000
P Net Plant Cost (N+O) -$2,750,000
Q Debt Issuance/Debt Service $1,650,000 -$213,308 -$213,308 -$213,308 -$213,308 -$213,308 -$213,308 -$213,308 -$213,308 -$213,308 -$213,308
S Net Annual Cash Flow (M+Q+R)
-$1,100,000 $724,922 $738,000 $751,275 $764,749 $778,425 $792,306 $806,395 $820,696 $835,211 $849,944
Cumulative Project Cash Flow
-$1,100,000 -$375,078 $362,922 $1,114,197 $1,878,946 $2,657,371 $3,449,677 $4,256,072 $5,076,768 $5,911,979 $6,761,923

6 Health and Environmental Benefits
of CHP Technologies The financial benefits alone of CHP systems are a compelling reason for health care institutions to invest in co-generation
installations. Additionally, many hospitals have explored CHP as a part of a broader, mission-driven strategy to improve
public health. The efficiency benefits from CHP systems when compared to grid-provided power and on-site thermal
generation can result in lowered emissions of pollutants that not only affect global climate but also local health. The
following section discusses the emissions benefits of CHP systems.
6.1 Greenhouse Gas Savings Potential
CHP systems can be a significant component of health care facility greenhouse gas reduction strategies. As previously
mentioned, onsite power and thermal energy generation is inherently more efficient than traditional offsite power and
on-site heat generation leading to lower overall source fuel combustion. Medical facilities can reduce fuel consumption
and greenhouse gas emissions in excess of 25 percent for well-designed and maintained systems. The Massachusetts
Department of Energy Resources estimates that that average CHP system reduces net source greenhouse gas emissions
by roughly 18 percent (Ballam, 2012).
For instance, the installation of a 7.5 MW CHP system at the New York Presbyterian Hospital/Weill Cornell Medical Center
reduced overall fuel consumption for the hospital by 27 percent, and lowered overall greenhouse gas emissions by an
estimated 21,500 tons per year. Similarly, the 47.5 MW MATEP CHP system in Boston’s Longwood Medical and Academic
Area has been estimated to reduce total fuel consumption for participating facilities by 24 percent leading to an estimated
greenhouse gas reduction of 117,500 tons of CO2 annually (U.S. DOE, 2013). Without the greenhouse gas savings from the
MATEP CHP facility, Boston’s community-wide greenhouse gas emissions would be roughly 2 percent higher annually.10 A
more widespread adoption of CHP technologies at large institutions in Boston could significantly aid the City in reaching
its goal of reducing greenhouse gas emissions by 25 percent by 2020.
It should be noted, that proper CHP system design is critical to realizing greenhouse gas savings. CHP systems are generally
inefficient electricity generators compared to central grid power plants, therefore high waste-heat utilization is key to
ensuring that the system runs efficiently and results in overall life cycle emissions reductions. Typical hospital settings are
able to effectively utilize most of a properly-sized system’s excess heat, ensuring efficient overall system operations.
Purposely undersizing a CHP system for a given current and future expected site loads (e.g., prospective energy efficiency
initiatives, etc.) is one strategy to ensure that the system operates at peak efficiency. However, this practice also means
that the full potential for greenhouse gas reductions is not realized.
6.2 Health and Societal Benefits
In addition to greenhouse gas savings, the reduction in fossil fuel combustion from CHP systems has notable community
health benefits. Healthcare Without Harm has been a national leader in highlighting the benefits of energy efficiency and
renewable energy with respect to public health. Emissions of SO2, NOx, particulate matter and mercury have well
established negative impacts on public health (U.S. EPA). Table 22 below shows the estimated health and societal benefits
of a 15 MW CHP system in the Northeast U.S. This analysis assumed that the system resulted in a 25 percent reduction in
10 Boston’s 2011 Greenhouse Gas inventory estimated total community GHG emissions of 6,776,000 metric tons of CO2 equivalent. Report available at: http://www.cityofboston.gov/images_documents/updatedversionghg1_tcm3-38142.pdf
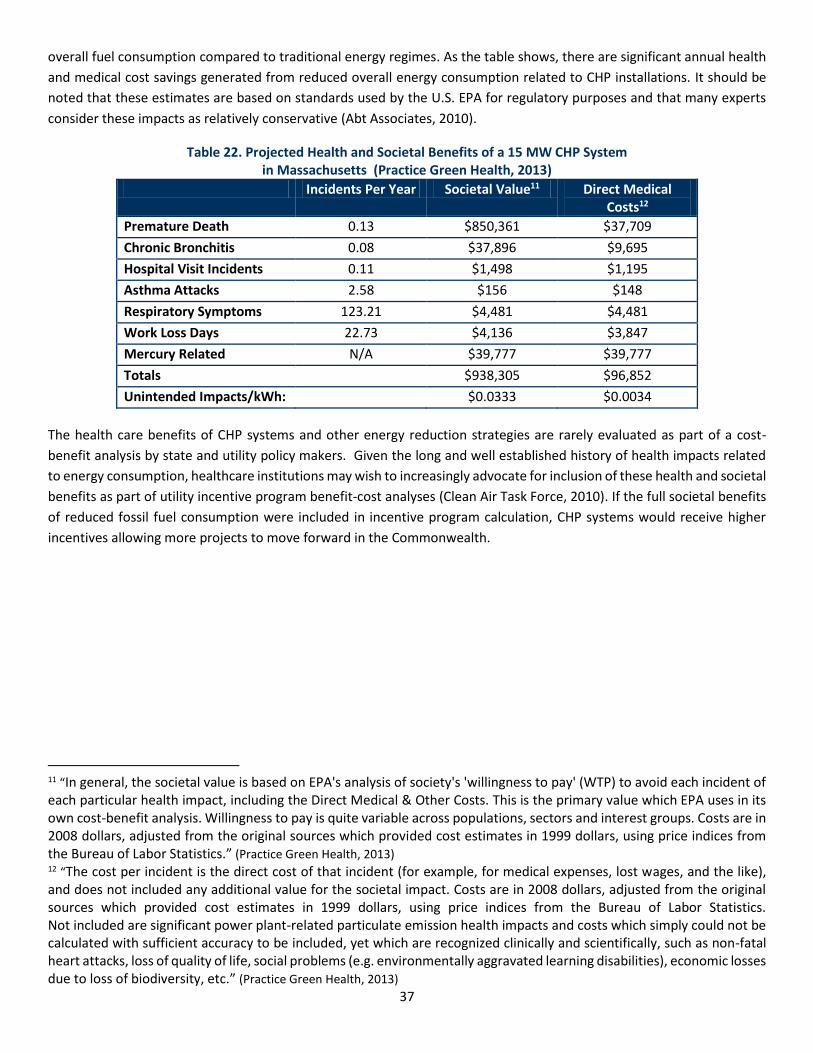
37
overall fuel consumption compared to traditional energy regimes. As the table shows, there are significant annual health
and medical cost savings generated from reduced overall energy consumption related to CHP installations. It should be
noted that these estimates are based on standards used by the U.S. EPA for regulatory purposes and that many experts
consider these impacts as relatively conservative (Abt Associates, 2010).
Table 22. Projected Health and Societal Benefits of a 15 MW CHP System in Massachusetts (Practice Green Health, 2013)
Incidents Per Year Societal Value11 Direct Medical Costs12
Premature Death 0.13 $850,361 $37,709
Chronic Bronchitis 0.08 $37,896 $9,695
Hospital Visit Incidents 0.11 $1,498 $1,195
Asthma Attacks 2.58 $156 $148
Respiratory Symptoms 123.21 $4,481 $4,481
Work Loss Days 22.73 $4,136 $3,847
Mercury Related N/A $39,777 $39,777
Totals $938,305 $96,852
Unintended Impacts/kWh: $0.0333 $0.0034
The health care benefits of CHP systems and other energy reduction strategies are rarely evaluated as part of a cost-
benefit analysis by state and utility policy makers. Given the long and well established history of health impacts related
to energy consumption, healthcare institutions may wish to increasingly advocate for inclusion of these health and societal
benefits as part of utility incentive program benefit-cost analyses (Clean Air Task Force, 2010). If the full societal benefits
of reduced fossil fuel consumption were included in incentive program calculation, CHP systems would receive higher
incentives allowing more projects to move forward in the Commonwealth.
11 “In general, the societal value is based on EPA's analysis of society's 'willingness to pay' (WTP) to avoid each incident of each particular health impact, including the Direct Medical & Other Costs. This is the primary value which EPA uses in its own cost-benefit analysis. Willingness to pay is quite variable across populations, sectors and interest groups. Costs are in 2008 dollars, adjusted from the original sources which provided cost estimates in 1999 dollars, using price indices from the Bureau of Labor Statistics.” (Practice Green Health, 2013) 12 “The cost per incident is the direct cost of that incident (for example, for medical expenses, lost wages, and the like), and does not included any additional value for the societal impact. Costs are in 2008 dollars, adjusted from the original sources which provided cost estimates in 1999 dollars, using price indices from the Bureau of Labor Statistics. Not included are significant power plant-related particulate emission health impacts and costs which simply could not be calculated with sufficient accuracy to be included, yet which are recognized clinically and scientifically, such as non-fatal heart attacks, loss of quality of life, social problems (e.g. environmentally aggravated learning disabilities), economic losses due to loss of biodiversity, etc.” (Practice Green Health, 2013)
38
7 Policy and Regulatory Barriers to
CHP Market Growth Stakeholders report that Massachusetts has one of the most favorable regulatory environments for CHP systems amongst
U.S. states. With incentives available through both the federal and state governments, along with utility program direct
financial support, properly sited and well-designed CHP systems can achieve paybacks of four years, or less in
Massachusetts. While this incentive and regulatory environment is highly favorable for CHP investment, state and local
policy makers could pursue several regulatory options to improve CHP project viability in the Commonwealth. Several of
these options are discussed in detail below.
Access to Low-cost Capital While CHP systems are a well-established technology with a lengthy track record, many potential project financiers are
unfamiliar with CHP systems. Because of this, financial decision makers may be hesitant to provide capital to fund these
systems at competitive interest rates. State and local government policy makers may be able to help alleviate this problem
by developing incentive programs to support CHP system financing. Loan guarantees and loan loss reserves are popular
tools that have been used by both state and local governments to aid in the development of new clean energy markets.
The Commonwealth or the City of Boston could explore developing such a credit support mechanism to reduce lender risk
and facilitate CHP finance in Massachusetts. Additionally, a number of innovative, and potentially market-transforming
CHP financing models are currently being developed across the country, the Commonwealth or the City could begin a
dialogue with potential CHP system host, project developers and the financial community to understand if and how
government entities could usefully intervene to support this nascent market.
Expanded Incentives beyond Utility the Benefit-Cost Test Under current law, utilities are unable to provide incentives for CHP systems that do not meet DPU-established benefit-
cost ratios. Given this requirement, and the critical nature of utility incentives in developing a CHP system, developing
large-scale CHP systems that do not meet utility benefit-cost test is a challenge in Massachusetts. While financial benefits
may be a primary consideration for hospital decision makers, the resiliency and environmental benefits discussed in this
paper may also be a key consideration in CHP system development. Given these added benefits, as well as the potential
community wide benefits that result from more resilient healthcare facilities, the ability to pass a utility benefit-cost test
may not be the best determinant of whether a hospital CHP system should go forward. Because hospital CHP systems can
provide community benefits that go beyond traditional cost-benefit analyses, a market that is heavily dependent on utility
program funding may not fully achieve all the potential societal benefits of CHP systems.
Electric Utility Interconnection CHP systems run in parallel with the existing electrical grid, with power exported to the grid during periods of over-
production and power imported from the grid during periods of under-production. Massachusetts utilities have an
obligation to protect their electric distribution infrastructure from any potential threat to system stability. Because of this
mandate, utilities frequently require CHP systems to undergo engineering studies to ensure that interconnecting to the
local electric grid can be accomplished without risking the electric distribution system. In some regions of the grid, known
as area networks, utilities are particularly reluctant to interconnect distributed generation generators. Much of the
downtown Boston electricity grid is in an area network grid configurations, meaning that CHP system integration may not
be economically feasible under current utility interconnection guidelines.

39
High Pressure Natural Gas
For some larger CHP systems, high-pressure gas is required for efficient turbine operations. If high pressure gas lines are
not available, the CHP system will typically need to compress the gas before it can be combusted. The added parasitic
electrical load required in order to compress the gas can significantly lower the efficiency of the overall CHP installation.
Coupled with the increased capital costs of adding equipment to increase the gas pressure, not having access to high-
pressure gas lines can be an insurmountable project hurdle. At least one major potential CHP project in Boston has been
impacted by this issue. Table 23 below shows representative natural gas pressure requirements for gas turbine CHP
systems and the expected additional load needed to increase various gas supply pressures to meet minimum pressure
requirements. It should be noted that these will vary considerably based on individual system specifications.
Table 23. Natural Gas Pressure requirements for Gas Turbines and Associated Power Compressor Requirements (U.S. EPA, 2008)
System 1 System 2 System 3 System 4 System 5
Turbine Electric Capacity (kW) 1,000 5,000 10,000 25,000 40,000
Turbine Pressure Ratio13 6.5 10.9 17.1 23.1 29.6
Required Compression Power (kW)
55 psig gas supply pressure 8 82 198 536 859
150 psig gas supply pressure N/A 35 58 300 673
250 psig gas supply pressure N/A N/A 22 150 380
Given that high pressure gas lines are not available in portions of Boston where hospital CHP systems would otherwise
make sense, city and state policy makers may wish to consider how to incentivize investments in new gas delivery
infrastructure in order to meet the potential demand from these systems.
The barriers discussed in this section present a few of the issues potentially limiting the growth of the CHP market in
Massachusetts. While the Commonwealth has some of the most favorable regulations and incentives in the country for
CHP market expansion, issues surrounding financing, steam net metering, utility interconnection and incentives that do
not fully account for all the benefits of CHP systems could be areas for further focus by Massachusetts state and local
policy makers.
13Turbine pressure ratios are a measure of the difference between gas pressures entering and exiting a turbine.

8 Lessons Learned from Massachusetts Healthcare
CHP Facilities Several hospital personnel from facilities with operating CHP systems were interviewed as part of the development of this
report in order to identify critical lessons learned from the development and performance of their systems. This section
reviews several of the key insights identified during this interview project.
System Financing and Capital Plans
Interviewees noted that the most effective means of winning funding for a hospital CHP installation may to be integrate
the installation into a large facility upgrade project or long-term capital plan. While the economics of CHP systems can be
attractive on their own, financing a system along with other major capital expenditures has a high likelihood of winning
the lowest possible cost of capital for the project. It was also noted that CHP are best integrated into long-term capital
budgeting plans.
Traditional Hurdle Rates May not Apply
Hospital CHP systems may not be able to reach traditional investment hurdle return rates, however interviewees noted
that the environmental and reliability benefits of CHP systems can be a useful argument to hospital CFOs in order to relax
return on investment standards. One hospital facility manager noted that their CFO typically required a 6 year simple
payback for energy projects, but that they were willing to extend this payback threshold to 8 years given the added
resiliency benefits of the proposed CHP system.
Operating Cost Reductions are a Major Concern for Hospitals
All interviewees noted that reducing costs at their facilities was a major driver for the development of their CHP systems.
Hospitals are increasingly under pressure to reduce operating costs in order to maintain service and CHP technologies
were viewed as a substantial driver of operational costs savings. This factor was deemed by all interviews as the leading
driver of their hospital’s interest in CHP over and above resiliency or environmental benefits.
Early Engagement with Local Utilities is Critical
Cooperative and productive utility relationships are critical to the success of any CHP project. Utilities are vital to a number
of project aspects including electric distribution grid integration, natural gas supply and cash incentives. Because of this,
facility managers interviewed as part of this research stressed the importance of engaging with both the local gas and
electric utilities early in the project development process. Utilities can provide potential CHP system owners with critical
information about potential hurdles to system development such as network electricity grids issues and access to high-
pressure gas distribution lines. These and other issues can fundamentally change project economics or even derail
potentially promising CHP installations, so learning about these potential problems early in the process is critical.
Work with a Knowledgeable Owner’s Engineer
CHP is a niche technology and many hospitals may not have in-house capacity to adequately staff a CHP procurement.
Using an outside owner’s engineer with experience in CHP procurement can speed the procurement process and assist
with ensuring that contracts and system warranties meet industry standards.

UMass Medical School Co-Gen Power Plant
CHP System Type
Gas Turbine
CHP System Capacity
7.8 MW
Construction Time
2.5 Years
Completion Date
December 2011
Facility Description
The Medical School and UMass Memorial University Campus are served by a natural gas-fired co-
generation power plant. The co-gen plant produces 100 percent of the steam required for space heating
on the main campus in winter, 100 percent of the chilled water used for air conditioning in summer, and
about half of the electricity used on campus. By generating heating and cooling centrally instead of
through building-specific HVAC systems, the university reduces energy consumption by an estimated 15%.
The facility has been in operation for over 35 years, with prior efficiency improvements in 2002. In 2011
the campus completed a major expansion of the system with the addition of a 7.8 MW gas turbine system.
Project Details Manufacturer and Model
Solar Turbine Taurus 70
The Taurus 70 gas turbine mechanical drive package which can be combined with one or more centrifugal gas compressors to form a complete compressor set. Designed specifically for industrial service, Taurus 70 packages are compact, lightweight units requiring minimal floor space for installation.
Project Team Developer
UMBA, PMA, Waldron Engineering & Sakanska
System Cost & Incentives
Construction Cost: $30 Million
Incentives: $7 million National Grid incentive
Load Served
Increased power production and chiller capacity for the 500,000 square foot Sherman Center and was designed to support future construction at the hospital. The new turbine also provides redundancy for the hospital’s existing central plant.

Location
The CHP system was installed as part of a $48 million expansion to the campus’s existing central plant.
Previous System
UMass Medical had an existing and sophisticated central plant that provided steam and power to the
entire campus. The addition of the new 7.8 MW turbine was intended to support the campus’s existing
electrical loads and provide additional cooling capacity. The system was also designed with enough
capacity to support future expected construction at the campus.
Financials System Benefits
Annual Electricity Savings: 58,000 MWh Total Financial Benefits: $6.2 million in annual savings
Financing
The system was financed as part of a $450 million campus capital campaign. Financing for the CHP system was integrated into the planned expansion project. The system had been integrated into the hospital’s long-term master plan for several years before construction. Including the system as part of a larger capital project and integrating CHP into plans for new construction allowed UMass Medical to capitalize on low-cost financing and also ensured a fully integrated implementation approach.
Payback Period
Less than 3 years
Challenges and Lessons Learned The project was undertaken to accommodate UMass Medical’s growing campus, specifically the energy
needs of the recently-completed Albert Sherman Center, a $400 million 512,000 square foot research
and education facility that opened in January 2013.
Challenges
The central plant at the UMass Medical campus is a complex and sophisticated system of multiple
technologies. Effectively integrating the new gas turbine into this systems and optimizing system-wide
performance was a complicated engineering task.
Additionally, given the scale of the system, interconnecting the CHP unit into the local electrical grid was
a challenge. UMass Medical staff had significant experience working with National Grid on previous
projects and were able to work closely with utility representatives to meet all interconnection
requirement.
Lessons Learned
Hospital staff noted that incorporating the CHP system into the early planning phase of the hospital’s long-
term master plan was a major reason for the success of the project. This long-term view of CHP project
development allowed the hospital to take a careful and considered approach to CHP system planning.
Staff also noted that a close working relationship with utility staff was a critical success factor for the
project.

Spaulding Rehabilitation Hospital
CHP System Type
Gas fired reciprocating engine
CHP System Capacity
250 kW
Construction Time
<1 year
Completion Date
Completed in 2012 Operational in 2013
Facility Description Spaulding rehab is a 260,000 square foot, 132-bed rehabilitation hospital in Boston, Mass. This newly
constructed building in the Charlestown Navy Yard was opened in April 2013. Partner’s Healthcare has
aggressively pursued energy efficiency and renewable energy opportunities in its facilities and has
deployed CHP to both reduce operating costs and mitigate greenhouse gas emissions. The Spaulding
facility is one of the most energy efficient hospital facilities in the United States.
Project Details Manufacturer and Model
Dresser Rand CHP-250
The Dresser Rand CHP-250 is a 250kWe gas fired reciprocating engine. Overall system efficiencies can reach as high as 90% when operated at full load. The system is designed to produce up to 1.35MMBTU of hot water per hour.1 System dimensions are 20’ X 11.5’ X 9’ (L X W X H) with a total operating weight of more than 10 tons.
Developer
Prime: Walsh Brother (walshbrothers.com)
Subcontractor: Dresser Rand (dresser-rand.com)
System Cost & Incentives
Construction Cost: Approximately $950,000
Load Served
The system serves provides steam and domestic hot water along with electricity. The CHP unit is designed to operate at full loads and to provide backup power in the event of emergencies.
1 http://www.dresser-rand.com/literature/CHP/2229_CHP250.pdf

Location
The system is located on the on the 9th floor roof deck. The Spaulding Hospital was designed with all critical mechanical equipment enclosed in a two-story roof mechanical penthouse. As a property near the coast, this location was chosen to protect against potential future storm surge.
Previous System (if any)
The CHP system was installed to supplement existing hospital systems and, as such, did not replace any
existing HVAC systems. The system is designed to provide backup power during periods when electricity
from the grid is unavailable.
Financials Payback Period
7 years
Financing
System cost were included in the hospital construction costs. Wrapping the costs into the larger capital construction led to competitive financing rates.
Motivations and Challenges Motivations for the Project
One major reason for installing the CHP system was to improve the passive survivability of the facility.
Additionally, the reduced facility-wide operating costs were another primary driver for the investment in
CHP technologies. Partners Healthcare has recently made a significant push to lower system-wide
greenhouse gas emissions while reducing onsite energy demand.
Challenges
Negotiating a vendor contract to service the system resulted in delays in running the CHP unit. Eventually,
an agreement was reached with an O&M vendor and the system is now online.

South Shore Hospital
CHP System Type
Microturbine
CHP System Capacity
1MW
Construction Time
10 Months
Completion Date
April 2012
Facility Description South Shore Hospital is an 800,000 square foot, 318-bed acute care hospital in Weymouth, Mass. The non-
profit hospital is a leading regional provider of acute, outpatient, home health, and hospice care to the
approximately 725,000 residents of Southeastern Massachusetts. It is the largest independently operated
hospital in Eastern Massachusetts, with the second largest emergency center and maternity center. South
Shore Hospital recently completed the $43 million, 40-foot building Emerson expansion, creating the
necessary clinical space to meet the needs of the growing number of patients.
Project Details Manufacturer and Model
Capstone C1000
The Capstone C1000 Power Package is a unit of five 200kW microturbines. Designed for low emissions and low maintenance, the C1000 has an overall electrical efficiency of 33%. The system is designed to produce 6.75 million BTU/hr in exhaust energy.1
Developer
EMCOR (www.emcorgroup.com)
System Cost & Incentives
Construction Cost: $3 Million
Incentives: National Grid
Load Served
The CHP system supports a range of load for the hospital including heating, cooling cooking, hot water and steam. The system covers roughly 30% of the hospital’s electricity load and between 5 and 50% of the hospital’s thermal load depending on the season.
1 http://www.e-finity.com/c1000/C1000%20HPNG_331044B.pdf

Location
The generators are located outdoors next to the hospital’s existing boiler plant with heat recovery
equipment installed inside the building on a mezzanine above the facility’s existing boilers.
Previous System (if any)
The CHP system was installed to supplement existing hospital systems and, as such, did not replace any
existing HVAC systems.
Financials Financial Benefits (estimated)
Avoided Natural Gas Costs: $400,000 annually (29% reduction)
Avoided Electricity Costs: $120,000 annually (30% reduction)
Sale of Alternative Energy Credits (AECs): $150,000 annually
Total Financial Benefits: Up to $670,000 annually
Financing
The system was financed through direct ownership as typical capital improvements are made. The hospital briefly explored third-party models, however the benefits of the model were deemed insufficient to move forward. South Shore Hospital received a significant incentive from National Grid to support the project. As a major National Grid customer, the hospital negotiated the custom incentive payment over the course of several months.
Payback Period
4 years (excluding utility incentives)
Challenges and Lessons Learned Energy savings and financial considerations were the primary driver for the development to the system.
South Shore Hospital explored adding equipment to allow the CHP system to island during grid power
outages, allowing for extended power generation during emergencies. This option was not pursued as it
would have made the project uneconomic.
Challenges
The system has taken more than a year to become fully operational since installation. With five separate
microturbines, one or more of the units has had mechanical problems at any given time. Over the course
of the first year, two of the five units needed to be replaced. Capstone has been diligent in fixing failed
equipment and the hospital has been satisfied with their level of service.
Additionally, hospital staff noted that obtaining interconnection approval was lengthy process and that
sufficient time should be budgeted into the installation schedule in order to account for engineering
assessments and interconnection delays.
Hospital representatives noted that project engineering and preparation were a substantial portion of the
total construction time.
Lessons Learned
Hospital staff noted that project delays for these types of projects are commonplace and that hospitals
should be sure to develop realistic timelines for CHP projects. Additionally, staff noted that it was
important to work closely with the local utility both to negotiate incentive payments as well as to ensure
the system is designed in a way that ensures a smooth interconnection process.

9 Conclusion Combined Heat and Power is a well-established energy technology that has been successfully used by health care facilities
across the United States. In Massachusetts, a limited but growing number of hospitals have installed CHP systems to lower
their energy bills, reduce their environmental footprints and improve their operational resiliency. Massachusetts has some
of the most generous CHP incentives in the nation and Massachusetts utilities have actively supported the development
of the CHP marketplace over the past several years with direct financial incentives. With the recent increased focus on
both energy system resiliency and climate change mitigation, CHP technologies should become an increasingly important
part of the energy landscape for Massachusetts health care facilities.

Works Cited Abt Associates. (2010, July). Technical Support Document for the Powerplant Impact Estimator Software Tool. Retrieved
from http://www.catf.us/resources/publications/files/Abt-
Technical_Support_Document_for_the_Powerplant_Impact_Estimator_Software_Tool.pdf
ACEEE. (2012). ACEEE 2012 State Energy Efficiency Scorecard Ranking. Retrieved from http://aceee.org/energy-
efficiency-sector/state-policy/aceee-state-scorecard-ranking
Ballam, J. (2012). Aspects of Planning CHP Projects for Greater Boston Hospitals. Retrieved from
http://www.greenribboncommission.org/downloads/Planning_Incentives_Ballam_DOER.pdf
Ballam, John. (2012, February). Use of an Alternative Energy Portfolio Standard by Mass for Support of CHP. Retrieved
from Massachusetts Department of Energy Resources:
http://www.energy.ca.gov/2012_energypolicy/documents/2012-02-
16_workshop/presentations/11_Ballam_Mass_DER.pdf
Capstone Turbine Corporation. (2008, October). C1000 Megawatt Power Package Natural Gas. Chatsworth, CA.
Retrieved from http://www.e-finity.com/c1000/C1000%20HPNG_331044B.pdf
Capstone Turbine Corporation. (2010, January 7). Microturbine Perspective on SB 412 Implementation. Retrieved from
http://www.cpuc.ca.gov/NR/rdonlyres/2E7234D6-7562-477D-90A8-
DE05EE8BB6A2/0/Presentation5aiimicroturbines.pdf
Capstone Turbine Corporation. (2013). Capstone Turbine Corporation Coporate Site. Retrieved from
www.capstoneturbine.com
Clarke Energy. (2012). Selective Catalytic Reduction for CHP Plants. Retrieved from http://www.clarke-energy.com/gas-
engines/selective-catalytic-reduction-scr/
Clean Air Task Force. (2010, September). The Toll from Coal, An Updated Record of Death and Disease from America's
Dirtiest Energy Source. Boston. Retrieved from
http://www.catf.us/resources/publications/files/The_Toll_from_Coal.pdf
ConEdison. (2012). Customer Sited Supply Pilot Program. Retrieved from
http://www.coned.com/dg/presentations/08_Viemeister_and_Khurrum_Con_Edison.pdf
Depertment of Energy and ICF International. (2010). Combined Heat and Power Units in Massachusetts. Retrieved 2013,
from http://www.eea-inc.com/chpdata/States/MA.html
DOE and ICF. (2010). Combined Heat and Power Units in Massachusetts. Retrieved 2013, from http://www.eea-
inc.com/chpdata/States/MA.html
DOER, M. (2006). Massachusetts DG Collaborative Report. Boston.
DOER, Massachusetts. (2012, February). Use of an Alternative Energy Portfolio Standard by Mass for Support of CHP.
Retrieved from http://www.energy.ca.gov/2012_energypolicy/documents/2012-02-
16_workshop/presentations/11_Ballam_Mass_DER.pdf

49
DSIRE. (2013, January 3). Federal Business Energy Investment Tax Credit. Retrieved from
http://www.dsireusa.org/incentives/incentive.cfm?Incentive_Code=US02F&re=1&ee=1
DSIRE. (2013, January 3). Federal Modified Accelerated Cost-Recovery System (MARCs)+Bonus Depreciation. Retrieved
from http://www.dsireusa.org/incentives/incentive.cfm?Incentive_Code=US06F
Energy and Environment Analysis. (n.d.). Technology Characterization: Microturbine. Washington D.C. Retrieved from
http://www.epa.gov/chp/documents/catalog_chptech_microturbines.pdf
Fehrenbacher, K. (2011). The pain pont for Bloom Energy and fuel cell makers. Retrieved from Gigaom:
http://gigaom.com/2011/08/07/the-pain-point-for-bloom-energy-fuel-cell-makers/
General Court of the Commonwealth of Massachusetts. (2008). Chapter 169 - An Act Relative to Green Communities.
Retrieved from https://malegislature.gov/Laws/SessionLaws/Acts/2008/Chapter169
ICF International. (2013, March). Combined Heat and Power: Enabling Resilient Infrastructure for Critical Facilities.
Retrieved from https://www1.eere.energy.gov/manufacturing/distributedenergy/pdfs/chp_critical_facilities.pdf
Ingersoll Rand. (2013). What fuels can a microturbine use? Retrieved from http://www.ingersollrandproducts.com/am-
en/products/microturbines-and-recuperators/microturbines-and-microturbine-systems/what-fuels-can-a-
microturbine-use
Mass Save. (2010). Combined Heat and Power (CHP) Program Guidebook for Submitting CHP Applications for an Energy
Efficiency Initiaitve in Massachusetts. Mass Save. Retrieved from
http://www.masssave.com/~/media/Files/Business/Applications%20and%20Rebate%20Forms/CHP%20Incentiv
e%20Guidebook%20-%20dated%2011-18-10.ashx
Mass. DOER. (2009, March 12). Alternative Energy Portfolio Standards (APS). Retrieved from
http://www.mass.gov/eea/docs/doer/rps/rps-225-cmr16-mar-12-2009.pdf
Mass. DOER. (2013, April). Qualified Generation Units. Retrieved from http://www.mass.gov/eea/energy-utilities-clean-
tech/renewable-energy/rps-aps/qualified-generation-units.html
Mass. EEA. (2013, April 15). APS Qualified Alternative Energy Units. Retrieved 2013, from
http://www.mass.gov/eea/docs/doer/rps-aps/aps-qualified-units.xls
Massachusetts Bureau of Waste Prevention. (2008). Background Info Document and Proposed Ammendments for Public
Hearings and Comments. Bureau Compliance Division.
Massachusetts Department of Energy Resources. (2012, October 19). Massachusetts Policies for Combined Heat and
Power (CHP) Alternative Portfolio Standard and the Energy Efficiency Rebates. Retrieved from
http://ccap.org/assets/Massachusetts-Policies-for-CHP_CCAP-Breger-Oct-2012.pdf
Massachusetts DOER. (2006). Massachusetts DG Collaborative Report. Boston.
Meister. (2012). Accounting Standards and Potetial Constraints to Scaling Energy Efficiency Finance in Boston. Retrieved
from Boston Green Ribbon Commission: http://www.greenribboncommission.org/downloads/MCG%20-
%20Accounting%20Standards%20and%20Energy%20Efficiency%20Finance.pdf

50
Midwest CHP Application Center. (2007). Combined Heat and Power (CHP) Resource guide for Hospital Applications.
Midwest CHP Application Center. Retrieved from
https://www1.eere.energy.gov/manufacturing/distributedenergy/pdfs/chp_hospital_guidebook_2007.pdf
National Grid. (2013, April 23). DG Interconnection and Net Metering Seminar. Retrieved from
http://www.nationalgridus.com/non_html/MA_DG_Intro_Slides.pdf
New York City Department of Buildings. (2010). Installing Combined Heat and Power (CHP) Systems. A Guide to Required
Permits, Inspections, and Available Incentive Programs for Property Owners and the Construction Industry. New
York. Retrieved from http://www.nyc.gov/html/dob/downloads/pdf/combined_heat_and_power_systems.pdf
Practice Green Health. (2013). Energy Impact Calculator. Retrieved from https://practicegreenhealth.org/tools-
resources/energy-impact-calculator
Shipley, A. e. (2008). Combined Heat and Power Effective Energy Solutions for a Sustainable Future. Oak Ridge,
Tennessee: Oak Ridge National Laboratory.
The California Energy Commission. (2003). California Distributed Energy Resource Guide- Microturbines. Retrieved from
http://www.energy.ca.gov/distgen/equipment/microturbines/microturbines.html
The Library of Congress. (2012). Bill Text- 112th Congress (2011-2012) H.R.8.ENR. Retrieved from
http://thomas.loc.gov/cgi-bin/query/z?c112:H.R.8.ENR:
U.S. Department of Energy. (2013). Calculating Reliability. (U. D. Partnership, Producer) Retrieved from
http://www.epa.gov/chp/basic/benefits.html#fn1
U.S. Department of Energy. (2013). Current Winners, Combined Heat and Power Partnership. (U. D. Partnership,
Producer) Retrieved from http://www.epa.gov/chp/partnership/current_winners.html#two
U.S. Department of Energy. (2013). Is My Facility a Good Candidate for CHP? (U. D. Partnership, Producer) Retrieved
from http://www.epa.gov/chp/project-development/qualifier_form.html
U.S. DOE. (2011, July). Hospitals Discover Advantages to Using CHP Systems. Retrieved from Building Technologies
Program: http://apps1.eere.energy.gov/buildings/publications/pdfs/alliances/hea_chp_fs.pdf
U.S. DOE. (2011b). DOE Hydrogen and Fuel Cells Program Record. Retrieved from
http://www.hydrogen.energy.gov/pdfs/11014_medium_scale_chp_target.pdf
U.S. DOE. (2013). Current Winners, Combined Heat and Power Partnership. (U. D. Partnership, Producer) Retrieved from
http://www.epa.gov/chp/partnership/current_winners.html#two
U.S. DOE. (2013b). How Fuel Cells Work. Retrieved from http://www.fueleconomy.gov/feg/fcv_pem.shtml
U.S. DOE and EPA. (2012). Combined Heat and Power, A Clean Energy Solution. Washington D.C.: U.S. Department of
Energy. Retrieved from
http://www1.eere.energy.gov/manufacturing/distributedenergy/pdfs/chp_clean_energy_solution.pdf
U.S. EIA. (2013, May 2). Market Trends- Natural Gas. Retrieved July 2013, from
http://www.eia.gov/forecasts/aeo/MT_naturalgas.cfm#natgas_prices

51
U.S. EPA. (2008). Catalog of CHP Technologies. Washington D.C.: U.S. EPA Combined Heat and Power Partnership.
Retrieved from http://www.epa.gov/chp/documents/catalog_chptech_full.pdf
U.S. EPA. (2008). Technology Characterization: Gas Turbines. Washington D.C.: U.S. EPA Climate Protection Partnership
Division. Retrieved from http://www.epa.gov/chp/documents/catalog_chptech_gas_turbines.pdf
U.S. EPA. (2013). Calculating Reliability. (U. D. Partnership, Producer) Retrieved from
http://www.epa.gov/chp/basic/benefits.html#fn1
U.S. EPA. (2013, April 10). Combined Heat and Power Basic Information. Retrieved from Environmental Protection
Agency : http://www.epa.gov/chp/basic/index.html
U.S. EPA. (2013). Project Development, What You Need to Know. (U. D. Partnership, Producer) Retrieved from
http://www.epa.gov/chp/project-development/index.html
U.S. EPA. (2013). Spark Spread Estimator. Washington D.C. Retrieved from http://www.epa.gov/chp/
U.S. EPA. (n.d.). Human Health and Environmental Effects of Emissions from Power Generation. Retrieved from
http://www.epa.gov/captrade/documents/power.pdf
U.S. EPA. (n.d.). Procurement Guide: CHP Financing. Retrieved from
http://www.epa.gov/chp/documents/pguide_financing_options.pdf
University of Illinois-Chicago & Midwest CHP Application Center. (2009, May). Combined Heat and Power (CHP) Is It Right
For Your Facility? Retrieved from http://www1.eere.energy.gov/manufacturing/pdfs/webcast_2009-
0514_chp_in_facilities.pdf
Virk, M. (2011). Importance of Swedish Cogeneration Plants for the Domestic Energy System and European Power
Exchange. Gothenburg, Sweden: Chalmers University of Technology. Retrieved from
http://publications.lib.chalmers.se/records/fulltext/152455.pdf

52
Appendix 1. Selected Resources
for Further Reading CHP Project Development Handbook U.S. Environmental Protection Agency This resource provides a step-by-step guide to developing a CHP project. This guide includes checklists for early-stage fatal flaw analysis, estimates of development timelines and engineering costs, and key recommendations for system procurement. It is available at: http://www.epa.gov/chp/documents/chp_handbook.pdf Northeast Clean Energy Applications Center Website The Northeast Clean Energy Applications Center is a U.S. DOE funded institution, headquartered in Massachusetts, which supports the development of CHP in New England and New York. The Center’s website includes case studies on operating CHP systems, reviews on existing state incentives and a regularly updated calendar on CHP events throughout the Northeast. The Center also provides independent technical assistance to property owners interested in exploring CHP projects. Their website can be found at: http://www.northeastcleanenergy.org MassSAVE CHP Program Description Massachusetts Energy Efficiency Program Administrators The Massachusetts energy efficiency program administrators have a guide book that provides a detailed review of their CHP incentive program, the application process and other requirements. Buildings owners interested in developing CHP systems should carefully consult this resource in order to ensure their project will qualify for utility incentives. This guide is available at: http://www.masssave.com/~/media/Files/Business/Applications%20and%20Rebate%20Forms/CHP%20Incentive%20Guidebook%20-%20dated%2011-18-10.ashx DOER Alternative Energy Portfolio Standard Program Massachusetts Department of Energy Resources The Massachusetts credits sold into the Massachusetts Alternative Portfolio Standard market are a significant revenue source for new CHP systems in the state. A detailed review of the program and instructions regarding how to register CHP systems to generate tradable credits can be found here: http://www.mass.gov/eea/energy-utilities-clean-tech/renewable-energy/rps-aps/
Catalog of CHP Technologies U.S. Environmental Protection Agency The U.S. EPA has developed a detailed technical catalog of available CHP technologies, their costs and performance characteristics. This document is a useful guide for individuals interested in a more technical review of CHP technologies. It can be found at: http://www.epa.gov/chp/documents/catalog_chptech_full.pdf

Appendix 2. CHP System Case Studies

1 CHP in Hospitals C O M M U N I T Y E N E R G Y B R I E F July 2013
Properly designed combined heat and power (CHP) or cogen-eration systems can provide power, hot water, and space heating and cooling more reliably, more efficiently, and at lower costs than traditional systems. In addition, CHP systems can allow buildings to operate independent of the grid during periods of electric power blackouts. Hospitals make ideal hosts for CHP systems, and are often able to take advantage of the full suite of CHP benefits. Several of the nation’s top hospitals already benefit from installed CHP systems (see table at right).
PracticalHospitals operate 24 hours per day, 7 days per week, and have significant needs for both electric power and heating and cooling. Hospitals are one of the most energy intensive types of business in the commercial sector, consuming more than two times the energy per square foot as average commercial build-ings. Consistent demand for high quality, highly reliable power make hospitals ideal candidates for CHP. Hospitals and medical campuses that have installed CHP systems enjoy reduced operating costs and higher reliability of continued service during both instantaneous and lengthy electric service outages.
ProvenMore than 200 hospitals and medical campuses nationwide currently operate CHP systems. It is a proven, well under-stood application that is easily maintained with existing trained staff. CHP systems have an established operating performance history, and hospitals investing in these applica-tions can expect a well-designed system to perform at very high rates of reliability over long service lives.
Combined Heat and Power in HospitalsPractical, Proven, Economic, Reliable, and Clean
Community Energy Brief
R A N K HOSP I TA L S TAGE
1 Johns Hopkins 15 MW installed system
2 Massachusetts General 15 MW system study in progress
3 Mayo Clinic 5.2 MW installed system
4 Cleveland Clinic Steam power supplied by local plant
7 NY Presbyterian 7.5 MW installed system
14 NYU Langone 8 MW system under construction
16 Indiana University Steam power supplied by local plant
Rankings According to US News’ 2013-2014 Honor Roll of the Nation’s Top 18 Hospitals
ClimateUrban Alternative energyEnergy E�ciency Fuels

2 CHP in Hospitals C O M M U N I T Y E N E R G Y B R I E F July 2013
EconomicEfficient CHP systems operating in areas with high electric rates and lower natural gas costs have proved very attractive invest-ments. In the Northeast, customers pay the highest electric rates in the nation. High electric costs mean that producing power on-site can be less expensive than buying it from the local utility. This leads to a better return on investment for CHP in the Northeast than virtually anywhere else in the country. With a large spread between electric rates and natural gas rates, as is presently the case in large parts of the Northeast, and with existing state and federal incentives, a CHP investment in a hospital can yield a full payback on investment in 5 years or less. The CHP system’s net present value offers even greater financial rewards after the payback period. When properly designed and operated, a CHP system will run reliably for up to 15 years, providing energy cost savings well after the first 5 years, when the initial investment has paid for itself.
ReliableRecent extreme weather events, from Hurricane Irene and the October snowstorm that battered New England in 2011 to the devastation caused by Superstorm Sandy in New York and New Jersey in 2012, have turned attention to energy reliability and business continuity. These powerful storms and other events that disrupt electric distribution systems have exposed fragili-ties in our back-up power systems. Emergency generators may not operate as expected over the full duration of an outage, and backup power supplies may be limited by on-site fuel storage. Longer duration outages only increase the probability that emergency generators will fail to operate as specified.
In contrast, several facilities with CHP systems in the Northeast were able to maintain both power and heat during Superstorm Sandy. The majority of the New York University campus,1 One Penn Plaza (Manhattan), Princeton University (New Jersey), Salem Community
College2 (New Jersey), and Fairfield University (Connecticut) all maintained their electricity and heat from their CHP systems. Unlike emergency generators, which are “dead assets” only to be employed in critical instances, the CHP plant is a “dynamic asset,” which provides economic returns while running every day.
CleanHigh efficiency, low emissions CHP systems have been recog-nized as the centerpiece of sustainability strategies at premier hospital and university campuses such as New York Presbyterian, Yale School of Medicine & Yale-New Haven Hospital, Princeton University, Cornell University, New York University, and the University of Texas. Analysis by the Massachusetts Department of Energy Resources indicates that CHP plants that qualify for the State’s Alternative Energy Credit, on average, can expect to generate a 19 percent reduction in net greenhouse gas emissions. A hospital can reduce its greenhouse gas impacts by almost 20 percent with a single investment in high efficiency CHP.
Well designed, appropriately configured CHP systems can provide an extensive list of benefits to hospitals. Such systems increase reliability and resiliency, better assure business conti-nuity, offer deep energy efficiency reductions, and importantly, save on operating expenses and allow more resources to be devoted to patient care.
Endnotes1. Unfortunately, New York University’s Langone Medical Center does not yet
operate a CHP system, though a CHP system installation is being planned.2. Salem Community College functions as a Red Cross Disaster Relief Shelter.
The Pace Energy and Climate Center is a legal and policy think tank seeking practical solutions to our energy and climate challenges. Our mission is to protect the earth’s environment through solutions that transform the ways society supplies and consumes energy so as to mitigate climate change, minimize pollution, and enhance society’s resilience to unavoidable climate change. www.energy.pace.edu
For More Information
For more information on CHP applications and operating experience, please contact:
Tom Bourgeois
Executive Director, U.S. DOE Northeast Clean Energy Application Center Deputy Director, Pace Energy & Climate Center 914.422.4013 • [email protected]
A Life-Saving Energy Solution
In the wake of Superstorm Sandy’s energy disruptions, Long Island’s South Oaks Hospital campus operated its CHP system from October 28 through November 13. Although LIPA was able to restore power to the facility 5 days after the storm, the grid remained unstable and LIPA requested South Oaks to remain off-grid. Ultimately, South Oaks operated for 15 days isolated from the grid, supplying all necessary thermal and electric power to the 300,000 square foot healthcare facility during that time.

1
Recent extreme weather events have caused unprecedented infrastructure damage and disrupted daily life for communities in the Northeast. Most recently, Superstorm Sandy proved to be one of the most expensive natural disasters in U.S. history. At its worst, 2.1 million commercial and industrial businesses, healthcare facilities, multifamily buildings, and homes were without power in New York State, 2.6 million in New Jersey, and an additional 630,000 in Connecticut.1 To aid recovery efforts, the federal government has appropriated $60 billion for Sandy relief.2
In the wake of Superstorm Sandy, Tropical Storm Irene, and the Halloween Nor’easter of 2011, large numbers of customers suffered through extended power outages. Prolonged, widespread outages of this sort put great stress on critical facilities that serve vulnerable populations and provide essential social services – for example, hospitals, nursing homes, prisons, and similar facilities. Business owners and residents were not only inconvenienced, they suffered significant monetary losses due to production and sales downtime, lost inventory, and spoiled goods.
Powering Through StormsCombined Heat and Power Delivers Business Continuity, Risk Reduction, and Critical Infrastructure Resiliency Benefits
ClimateUrban Alternative energyEnergy E�ciency FuelsCommunity Energy Brief
Powering Through the Storms C O M M U N I T Y E N E R G Y B R I E F May 2013
What is CHP?
Combined heat and power (CHP) is a highly efficient alter-native to traditional electric generation. CHP systems produce electricity and capture waste heat to use for hot water, space heating or cooling, or for industrial use. Unlike traditional electricity generation, CHP systems are sited at or near end users, which avoids the losses associ-ated with transmitting electricity over long distances. Appropriately designed and operated CHP systems are a cost-effective, efficient, environmentally superior and reliable energy solution.
TRADITIONAL SYSTEM
45% EFFICIENCY 80% EFFICIENCY
CHP SYSTEM
Power Plant
Boiler
Electricity
Heat
CHP

2 Powering Through the Storms C O M M U N I T Y E N E R G Y B R I E F July 2013
Widespread grid failure also impacts the regional transportation sector. In the wake of Sandy, a combination of electrical short-ages and storm damage led to a near total disruption in mass transit systems and a widespread shortage in gasoline supplies. Parts of northern New Jersey and southern New York experi-enced limited rail service and gasoline rationing for more than one week after the storm.
The storm damage has galvanized policymakers to consider policy responses and solutions that will lessen the impacts of future storms of this magnitude in the Northeast. Care must be taken to fashion policies that are both effective, sustainable, and cost efficient.
One such response calls for strategically targeting and devel-oping greater numbers of technically proven, economically viable, and environmentally superior combined heat and power systems across our region. CHP systems generate power and provide thermal energy (hot water, heating, cooling) at the site where power and energy is consumed. Where such systems are appropriately designed and configured, they can and do continue to operate through natural catastrophes as powerful as the recent Superstorm Sandy.
This storm has exposed the fragility of our current backup power systems. Hospitals must operate to provide critical life and safety services and nursing homes must continue to serve vulnerable and frail populations, especially during times of emergency. However, conventional emergency generator backup systems have proven insufficient in some instances. The limitations of hospital emergency generators were previously observed and reported in the wake of the 2003 blackout. Approximately half of New York City hospitals’ generators malfunctioned during the blackout3, and many other hospitals were unable to sterilize equipment due to insufficient steam pressure.4
Hospitals and nursing homes, in combination with police stations, fire stations, centers of refuge, prisons, and waste-water treatment facilities, form the network of “critical infrastructure” facilities that provide the essential services
that communities rely on during times of emergency. Reliable, appropriately designed CHP systems can offer improved power reliability at these critical locations. Data centers, financial services firms, telecommunications companies, and other industries also place a premium on extremely reliable power to ensure business continuity. The CHP system at a Sikorsky plant in Connecticut, for example, not only enabled the manufacturer to produce helicopters in the wake of Superstorm Sandy, but also kept the 9,000 Sikorsky employees who had lost power in their homes supplied with hot showers, meals, and medical treatment.5
Similarly, South Oaks Hospital’s6 CHP system, designed to operate when the grid is down, provided uninterrupted service over a full 15 day period until the grid was stabilized. The CHP system kept the hospital and nursing home open, able to accept patients from other locations and to serve the community.
Endnotes1. Hurricane Sandy – Nor’easter Emergency Situation Reports. Office of
Electricity Delivery and Energy Reliability. Available: http://www.oe.netl.doe.gov/named_event.aspx?ID=68
2. http://www.bloomberg.com/news/2013-01-15/house-supports-17-billion-in-hurricane-sandy-relief.html
3. http://www.epa.gov/chp/basic/benefits.html4. New York City Emergency Response Task Force. (October 28, 2003). Enhancing
New York City’s Emergency Preparedness: A Report to Mayor Michael R. Bloomberg. Available: http://www.nyc.gov/html/om/pdf/em_task_force_final_10_28_03.pdf.
5. http://www.energyefficiencymatters.org/opportunities-and-successes-in-industrial-energy-efficiency-and-chp/
6. detailed review of South Oaks Hospital’s CHP system and its performance during Superstorm Sandy can be found at energy.pace.edu/publications/South_Oaks
The Pace Energy and Climate Center is a legal and policy think tank seeking practical solutions to our energy and climate challenges. Our mission is to protect the earth’s environment through solutions that transform the ways society supplies and consumes energy so as to mitigate climate change, minimize pollution, and enhance society’s resilience to unavoidable climate change. www.energy.pace.edu
For More Information
For more information on ways that CHP can make our communities more resilient, please contact:
Tom Bourgeois
Executive Director, U.S. DOE Northeast Clean Energy Application Center Deputy Director, Pace Energy & Climate Center 914.422.4013 • [email protected]
NYU Lights the Way
New York University’s 13.4MW combined heat and power plant remained operational throughout Hurricane Sandy and its aftermath, while virtually the entire rest of lower Manhattan was without power. NYU’s CHP facility, which opened in 2012 at 251 Mercer Street, provides electricity, heat, and hot water to key buildings at the Washington Square campus.


© 2013 Health Care Without Harm
Health Care Without Harm (www.noharm.org)Healthier Hospitals Initiative (www.healthierhospitals.org)
Practice Greenhealth (www.practicegreenhealth.org)12355 Sunrise Valley Dr., Suite 680
Reston, VA 20191
Contact:Bill Ravanesi MA,MPH
Health Care Without HarmSenior Director of Health Care
Green Building and Energy [email protected]
413-565-2315