Powering our future - bryanleyland.co.nz
8
Powering our future Bryan Leyland MSc, DistFEngNZ, FIMechE, FIEE(rtd), MRSNZ Vital Statistics.. 7,000 MW peak 43,000 GWh pa DC Link 220 kV 1000 MW DC link Remaining hydro potential 3000 MW The DC Link By 1950 NI Hydro was running out NI coal was the MWD option… Bill Latta’s bold concept Develop SI Hydropower & Transmit to NI How to get it across the Cook Strait? HVDC?? 1952 Gotland 20 MW, 100kV 1962 Cook Strait 600 (1200) MW +/-250 kV Upgraded to 1400 MW Could we make such a bold decision now? Load growth 1930 - 2004 820 GWh pa 40,000 GWh NZ generation 1970-1998 40,000 GWh
Transcript of Powering our future - bryanleyland.co.nz
Powering our futureBryan Leyland
MSc, DistFEngNZ, FIMechE, FIEE(rtd), MRSNZ
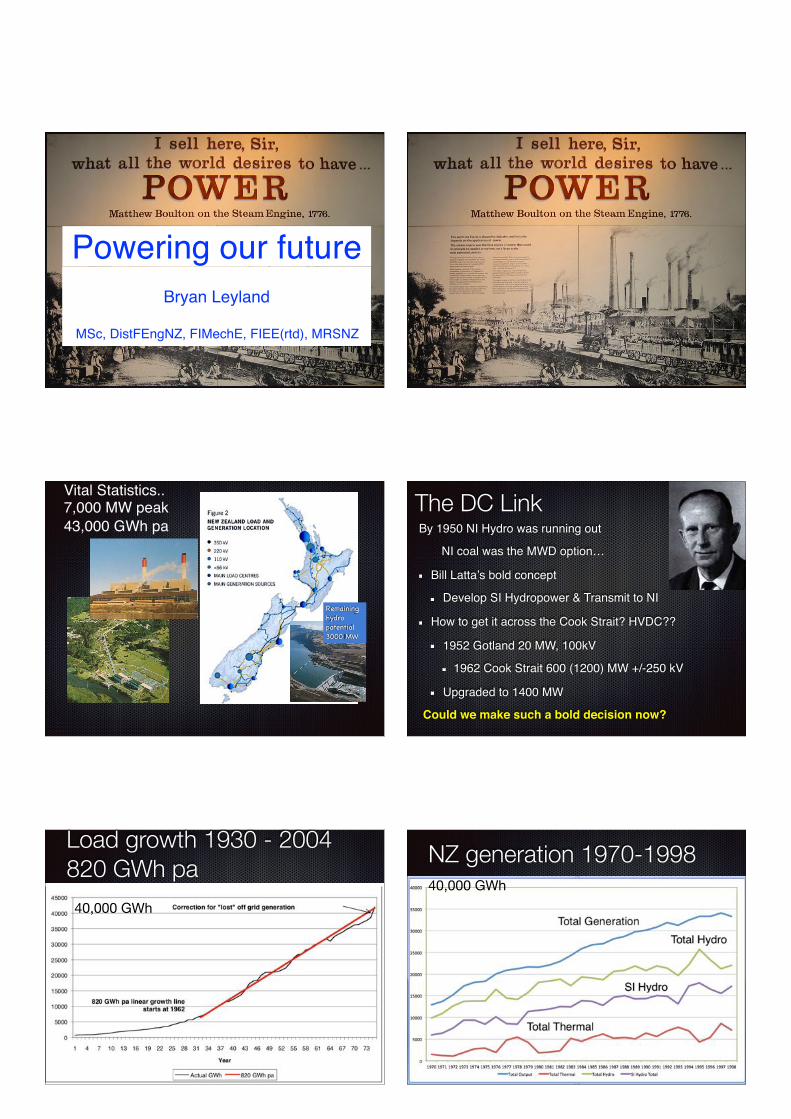
Vital Statistics..7,000 MW peak 43,000 GWh pa
DC Link220 kV
1000 MWDC link
Hydro
Remaining hydropotential3000 MW
The DC LinkBy 1950 NI Hydro was running out
NI coal was the MWD option…
Bill Latta’s bold concept
Develop SI Hydropower & Transmit to NI
How to get it across the Cook Strait? HVDC??
1952 Gotland 20 MW, 100kV
1962 Cook Strait 600 (1200) MW +/-250 kV
Upgraded to 1400 MW
Could we make such a bold decision now?
Load growth 1930 - 2004 820 GWh pa
40,000 GWh
NZ generation 1970-199840,000 GWh

Where our power comes from
978 MW of geothermal generates a
lot more than 690 MW of
gas!
What our load looks like
Fuel Dry yearsNZED power planning
must survive a dry year without a shortage
In a 1:20 dry hydro generation dropped by 3600 MW
The old Meremere coal-fired station and the Huntly coal-fired station were built to provide extra generation in a dry year.
With wind and solar added to the system, the dry year problem is even worse
Transpower has pointed out that we are at risk of shortages in dry years in a few years
No alternative to a coal stockpile!
Less wind in a dry year?
-
0.10
0.20
0.30
0.40
0.50
0.60
0.70
0.80
0.90
1.00
17/04/17
17/05/17
17/06/17
17/07/17
17/08/17
17/09/17
17/10/17
17/11/17
17/12/17
17/01/18
NZwindCapacityfactor2017
Long term average
And then came the Electricity Reforms..

Before and afterBefore
The Electricity Department and MOW had a monopoly on building lines and power stations (Bad)
Both were over manned and under political control (Bad)Planned long term (Good)
Two CEO’s paid at Public service rates (Good)Mostly managed by engineers (Good)
Before and after...After
Monopoly replaced by ogliopoly (Bad)No long term planning (Bad)6 highly paid CEO’s and management (Bad)10%+ of staff are “traders” (Bad)Regulated by the EA which is under the Minister’s thumb (Bad)High and unpredictable prices (Bad)Asset values racked up regularly (Bad)
The reforms were based on..
These (dodgy) assumptions:
electricity is a commodity like any othersupply and demand will balance at a price that is politically acceptable
five generators acting in their selfish interests = “the public good”
They ignored the need for reliable peak capacity and a supply of reserve energy for dry years
Power prices 1993 - 2017
We once had some of the
cheapest power in the world..
New Zealand
Wind and solar industriesExist only because of large direct and indirect subsidies
Subsidies exist because governments believe that they are a cheap and effective way of reducing man-made CO2
they aren’t
When the subsidies are abandoned, development stops
Can be useful when conventional options are expensive
e.g. supplying small loads in isolated situations17

The Royal Society of New Zealand has failed to produce evidence supporting this hypothesis
yet it continues to promote “climate change”To my knowledge, the evidence does not exist
It could be the biggest hoax in the history of the world
There is nothing abnormal or unusual about the temperature record since 1900.There is convincing evidence that global cooling could soon start.
Man-made global warming is not supported by the evidence
New renewables cost - $2,500 billion!Capital $2,000 bn, Subsidies ~$500 bn ($88 bn/yr)
Capital cost $3000/kWCapacity factor 25%Effective cost $9000/kW
Annual capital$billion
Wind and solar make a trivial contribution
Primary energy percentages: Oil - 33% Gas - 28% Coal - 24% Nuclear - 4.5% Hydro - 7% Wind, Solar etc - 3%
2009 data Doubled since then
Storage the “Achilles Heel” of RELarge scale wind, wave and marine power cannot exist without
long term, low cost, efficient, energy storage energy generated when the wind is blowing and the sun is shining must be stored so that it can be used when it is needed
No economic technology exists and it is not even on the horizon all we have is expensive long term pumped storage and very expensive batteries
So we use inefficient open cycle gas turbines and diesels
Producing lots of CO2
21

7 o’clock would you like
22
Nuclear fuel 2 MWh
0.5 c/kWh
Coal 6 MWh5c/kWh
6 drums Oil
1 MWh
30c/kWh
~2 c/kWhHydro 1 MWh
Batteries 1MWh~50 c/kWh
Storage sizes and cost of storing 1 kWh
0c/kWh
1000 elect water
heaters 1MWh
~$2million
STORAGE
7 o’clock would you like
22
Nuclear fuel 2 MWh
0.5 c/kWh
Coal 6 MWh5c/kWh
6 drums Oil
1 MWh
30c/kWh
~2 c/kWhHydro 1 MWh
Batteries 1MWh~50 c/kWh
Storage sizes and cost of storing 1 kWh
0c/kWh
1000 elect water
heaters 1MWh
~$2million
STORAGE
Wind power: Technology and costsTechnology is stable • no significant technological improvements in the last
20 years • variable speed operation becoming more common
• as time goes on, unit size increases with a small decrease in costs/kW
• O&M costs are high due to problems with blades, bearings, gearboxes and generators
Costs are dropping only slowly • currently ~$NZ 2100/kW - equivalent to Geothermal
at $6500/kW
23
Cost of wind powerInternational Renewable Energy Agency
Capital Cost $NZ2100/kW
Energy Cost 8.2 cents at 35% capacity factor
Operation and Maintenance ~2 c/kWh – increases as time goes on
Exclude subsidies and include reserve plant etc
Energy cost
Onshore 15.1 c/kWh
Offshore 19.2 c/kWh
Combined cycle GT ~ $NZ 1400/kW and ~7cents/kWh24
Aussie wind farms April 12 Output over peak ~75 MW - in spite of being widely spread!
Installed capacity 2500 MW
100%
750 MW
25
75 MW
StatusExpensive and intermittent
Relies on a belief that it is an effective and cheap method of reducing man-made CO2 • it isn’t
Costs not decreasing
Serious O&M problems
Not a good investment26

Solar powerCost is ~$2000/kW - at 10-20% capacity factor • ~ $3000/kW for rooftop installations
Maximum power in the middle of summer • none during most NZ system peaks
Rapid drop in output when a cloud crosses the sun
Solar companies are going broke • Solyndra defaulted on a $500 m loan • Suntech - bankrupt owing $1.6 billion • SunEdison, the “world’s largest green energy company,”
• broke - owes $11 billion 27
Olmedilla Solar Voltaic Farm60 MW for $US530 million
$US8800/kW ~87.5 GWh pa ~60c/kWh Loses 60% output on a cloudy day and 100% every night Subsidy: ~6 times market price for 25 years! A lot of glass to clean!
Spain
28
Wind, solar and wave powerThese technologies exist only because governments have chosen to subsidise them
at the expense of consumers and taxpayers
Because they are intermittent, unpredictable and have a low capacity factor they load considerable additional costs on to the power system
paid for by consumers
With present technologies, they have no prospect of competing with conventional generation on an equal basis.
The Harbour Bridge lighting - the promise
The reality
Transpower has concluded that grid connected batteries are not economic
StatusExpensive and intermittent
Costs not decreasing
Share prices have collapsed
Not a good investment
Workers needed to produce the same amount of electricity: coal - 1; natural gas - 2; wind - 12; solar -79 32

Wave power750 kW Pelamis: Average output 100 kW
Weight 1300t - 700t of machinery +600t of sandCompany went bust in 2014
33At $5000/t, cost is ~$9000/kW
Sea WaveA new concept Under development
Great potential
34
StatusExpensive
Technically difficult
Costs are high
Sea Wave could be a breakthrough • watch this space..
35
Why wind and solar power?If the objective is • reducing CO2
• nuclear is far better and cheaper • or converting from coal to gas
• low cost power • CCGT and coal wins every time
But if the objective is transferring wealth from the poor to the rich • Subsidised wind and solar will do it!
36
37
Nuclear power
The safest and most environmentally friendly form of power generationUranium resources
proven:~80 years supply
expected:~250 years supply
1000+ years with breeder reactors!
Energy from thorium
3 times as abundant as uranium ~750 years supply
37
Nuclear power
The safest and most environmentally friendly form of power generationUranium resources
proven:~80 years supply
expected:~250 years supply
1000+ years with breeder reactors!
Energy from thorium
3 times as abundant as uranium ~750 years supply
Nuclear power could supply all the energy the world needs for more than 500
years

Scenarios for the futureRational scenario
Continue to build hydro and geothermal
Stop building uneconomic wind and solar power
Keep nuclear power under review
Set up a market for dry year reserve energy
Set up a market for those who:
provide reliable power over peak demand periods
manage demand over peak demand periods
Outcome: a reliable and economic supply
Scenarios for the future..Likely scenario
Continue with geothermal developmentEncourage/subsidise the construction of wind and solar power Avoid hydropowerShut down HuntlyRun down gas supplies
Outcome:High prices and frequent shortagesLoss of energy intensive industries such as wood processingExtreme difficulty in matching the fluctuations of wind and solar power
no gas for open cycle gas turbinesfrequent under frequency load shedding
–Johnny Appleseed
“Type a quote here.”
Questions