Power Gen Products - GE | The Digital Industrial … Suisse Investor Day...Powering the world now &...
15
Power Gen Products Vic Abate President & CEO - Power Generation Products Credit Suisse Global Industrials Conference December 2, 2014
-
Upload
truongdien -
Category
Documents
-
view
217 -
download
2
Transcript of Power Gen Products - GE | The Digital Industrial … Suisse Investor Day...Powering the world now &...
Power Gen Products
Vic Abate
President & CEO - Power Generation Products
Credit Suisse Global Industrials Conference
December 2, 2014
Power Gen Products Credit Suisse Global Industrials Conference
December 2, 2014
2
Forward-Looking Statements:
This document contains “forward-looking statements” – that is, statements related to future, not past, events. In this context, forward-looking statements often address our expected future
business and financial performance and financial condition, and often contain words such as “expect,” “anticipate,” “intend,” “plan,” “believe,” “seek,” “see,” “will,” “would,” or “target.” Forward-
looking statements by their nature address matters that are, to different degrees, uncertain, such as statements about expected income; earnings per share; revenues; organic growth;
margins; cost structure; restructuring charges; cash flows; return on capital; capital expenditures, capital allocation or capital structure; dividends; and the split between Industrial and GE
Capital earnings. For us, particular uncertainties that could cause our actual results to be materially different than those expressed in our forward-looking statements include: current economic
and financial conditions, including interest and exchange rate volatility, commodity and equity prices and the value of financial assets; the impact of conditions in the financial and credit
markets on the availability and cost of General Electric Capital Corporation’s (GECC) funding, GECC’s exposure to counterparties and our ability to reduce GECC’s asset levels as planned; the
impact of conditions in the housing market and unemployment rates on the level of commercial and consumer credit defaults; pending and future mortgage securitization claims and litigation
in connection with WMC, which may affect our estimates of liability, including possible loss estimates; our ability to maintain our current credit rating and the impact on our funding costs and
competitive position if we do not do so; the adequacy of our cash flows and earnings and other conditions which may affect our ability to pay our quarterly dividend at the planned level or to
repurchase shares at planned levels; GECC’s ability to pay dividends to GE at the planned level, which may be affected by GECC's cash flows and earnings, financial services regulation and
oversight, and other factors; our ability to convert pre-order commitments/wins into orders; the price we realize on orders since commitments/wins are stated at list prices; customer actions or
developments such as early aircraft retirements or reduced energy demand and other factors that may affect the level of demand and financial performance of the major industries and
customers we serve; the effectiveness of our risk management framework; the impact of regulation and regulatory, investigative and legal proceedings and legal compliance risks, including the
impact of financial services regulation; adverse market conditions, timing of and ability to obtain required bank regulatory approvals, or other factors relating to us or Synchrony Financial that
could prevent us from completing the Synchrony split-off as planned; our capital allocation plans, as such plans may change including with respect to the timing and size of share repurchases,
acquisitions, joint ventures, dispositions and other strategic actions; our success in completing announced transactions, such as the proposed transactions and alliances with Alstom, and our
ability to realize anticipated earnings and savings; our success in integrating acquired businesses and operating joint ventures; the impact of potential information technology or data security
breaches; and the other factors that are described in “Risk Factors” in our Annual Report on Form 10-K for the year ended December 31, 2013. These uncertainties may cause our actual future
results to be materially different than those expressed in our forward-looking statements. We do not undertake to update our forward-looking statements.
This document includes certain forward-looking projected financial information that is based on current estimates and forecasts. Actual results could differ materially.
“This document may also contain non-GAAP financial information. Management uses this information in its internal analysis of results and believes that this information may be informative to
investors in gauging the quality of our financial performance, identifying trends in our results and providing meaningful period-to-period comparisons. For a reconciliation of non-GAAP
measures presented in this document, see the accompanying supplemental information posted to the investor relations section of our website at www.ge.com.”
In this document, “GE” refers to the Industrial businesses of the Company including GECC on an equity basis. “GE (ex-GECC)” and/or “Industrial” refer to GE excluding Financial Services.”
GE’s Investor Relations website at www.ge.com/investor and our corporate blog at www.gereports.com, as well as GE’s Facebook page and Twitter accounts, contain a significant amount of
information about GE, including financial and other information for investors. GE encourages investors to visit these websites from time to time, as information is updated and new information
is posted.
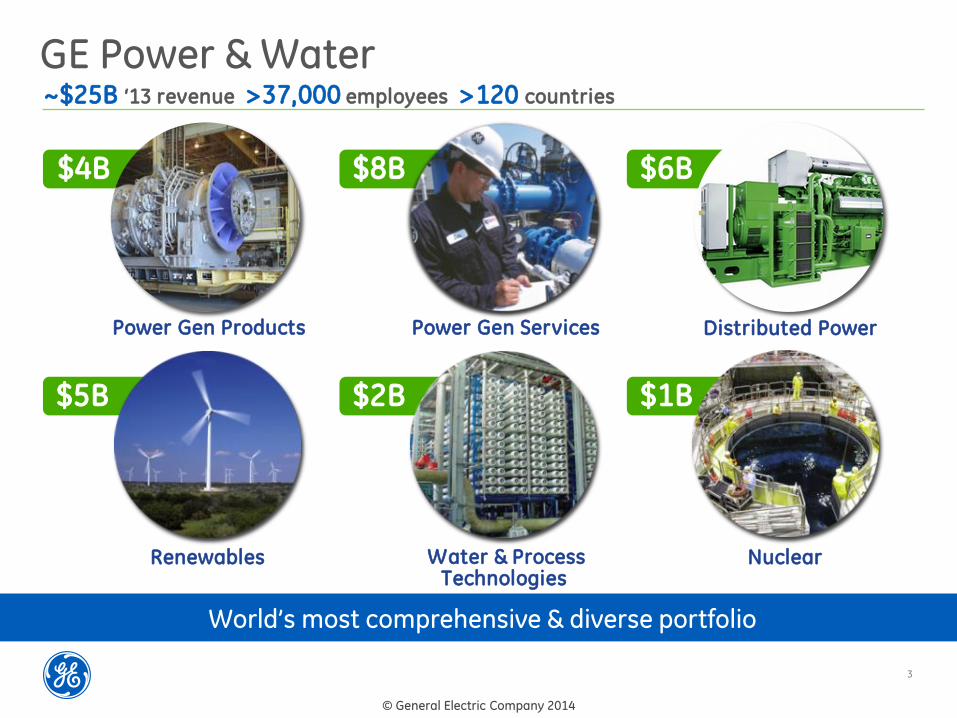
$1B $2B $5B
$6B $8B
GE Power & Water ~$25B ‘13 revenue >37,000 employees >120 countries
Renewables Water & Process Technologies
Power Gen Products
Nuclear
Power Gen Services Distributed Power
$4B
© General Electric Company 2014
3
World’s most comprehensive & diverse portfolio
Powering the world now & for the future
4
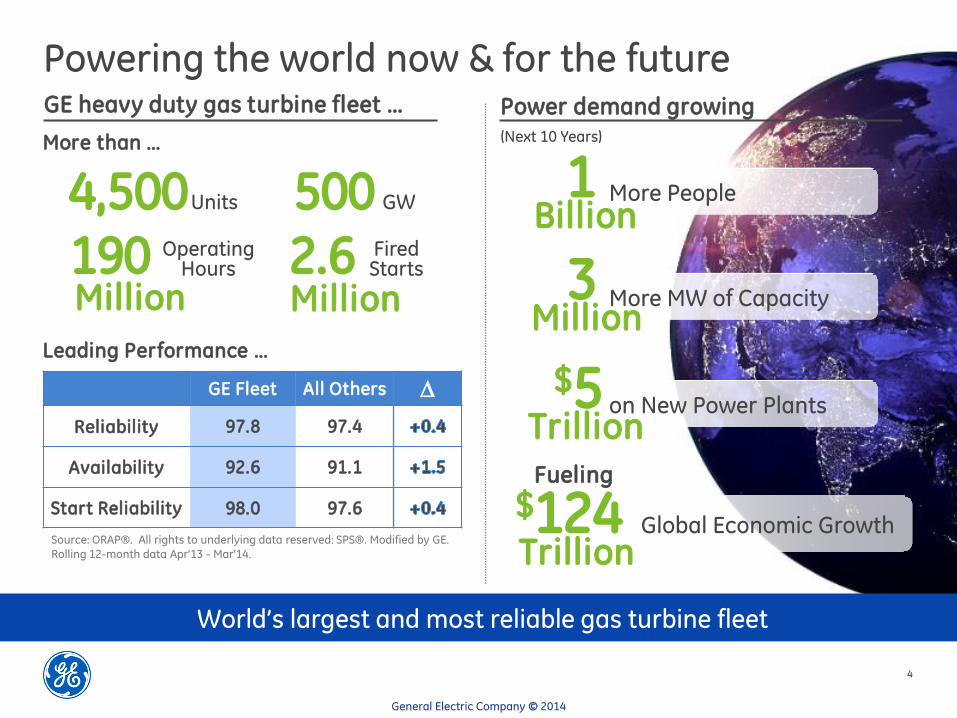
World’s largest and most reliable gas turbine fleet
GE heavy duty gas turbine fleet … Power demand growing (Next 10 Years)
More People
More MW of Capacity
on New Power Plants
1 Billion
3 Million
$5 Trillion
$124 Fueling
Global Economic Growth
Trillion
GE Fleet All Others
Reliability 97.8 97.4
Availability 92.6 91.1
Start Reliability 98.0 97.6
Source: ORAP®. All rights to underlying data reserved: SPS®. Modified by GE. Rolling 12-month data Apr'13 - Mar'14.
4,500 Units 500 GW
Leading Performance …
General Electric Company © 2014
More than …
190 2.6 Operating Hours
Fired Starts
Million Million
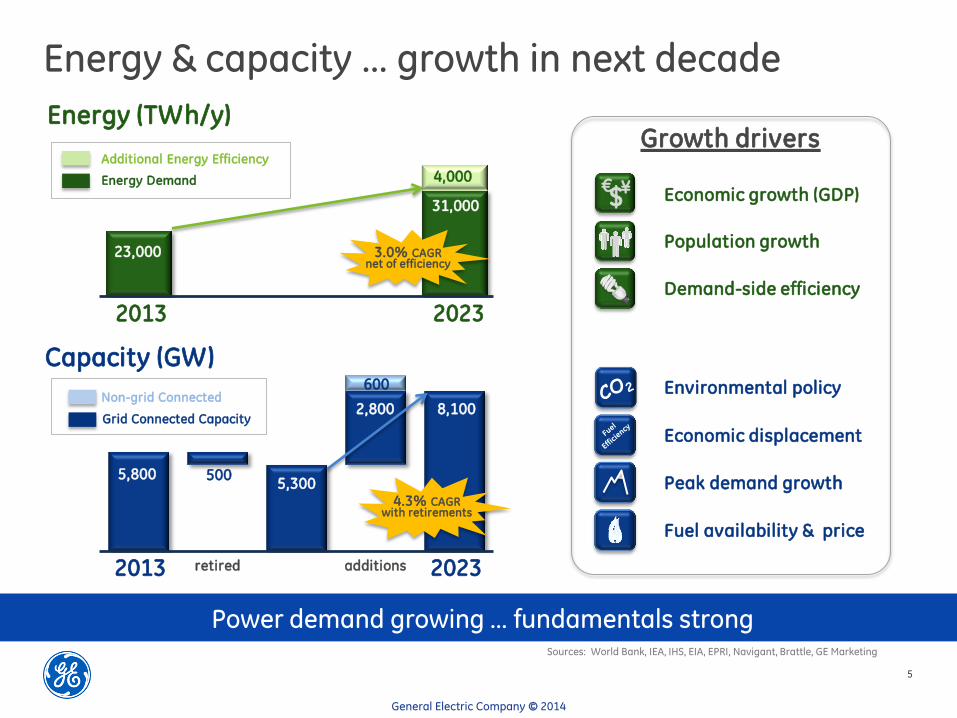
Energy & capacity … growth in next decade
Population growth
Economic growth (GDP)
Demand-side efficiency
Environmental policy
Economic displacement
Growth drivers Energy (TWh/y)
23,000
31,000
500 5,300
retired additions
Capacity (GW)
5,800
8,100
2023
2023 2013
2013
General Electric Company © 2014
Peak demand growth
4,000
Fuel availability & price
$ € ¥
2,800
Sources: World Bank, IEA, IHS, EIA, EPRI, Navigant, Brattle, GE Marketing
5
600
Additional Energy Efficiency
Energy Demand
Power demand growing … fundamentals strong
Non-grid Connected
Grid Connected Capacity
4.3% CAGR with retirements
3.0% CAGR net of efficiency
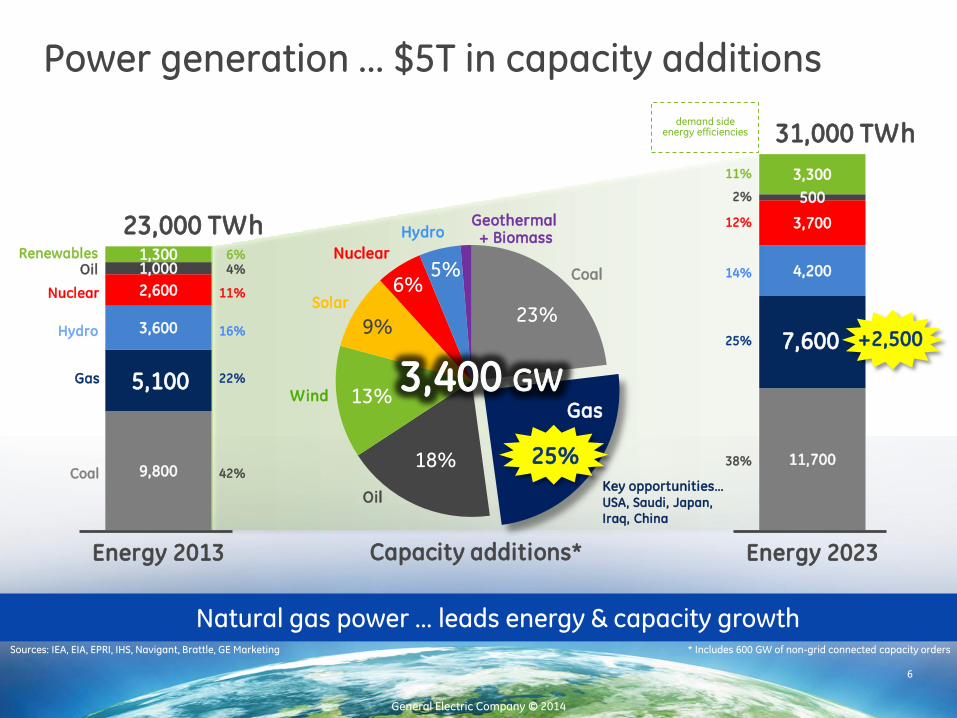
9,800 11,700
3,600
4,200
2,600
3,700
1,000
500
1,300
3,300
Energy 2013 Energy 2023
Power generation … $5T in capacity additions
General Electric Company © 2014
23%
25% 18%
13%
9%
6% 5%
Wind
Oil
Geothermal + Biomass
Coal
Hydro
Gas
Nuclear
Solar
3,400 GW
23,000 TWh
31,000 TWh
Coal
Gas
Hydro
Nuclear
Oil Renewables
Natural gas power … leads energy & capacity growth
5,100
7,600
25%
+2,500
6% 4%
11%
16%
22%
42%
11%
2%
12%
14%
25%
38%
Sources: IEA, EIA, EPRI, IHS, Navigant, Brattle, GE Marketing
6
Key opportunities… USA, Saudi, Japan,
Iraq, China
Capacity additions*
* Includes 600 GW of non-grid connected capacity orders
demand side energy efficiencies
General Electric Company © 2014
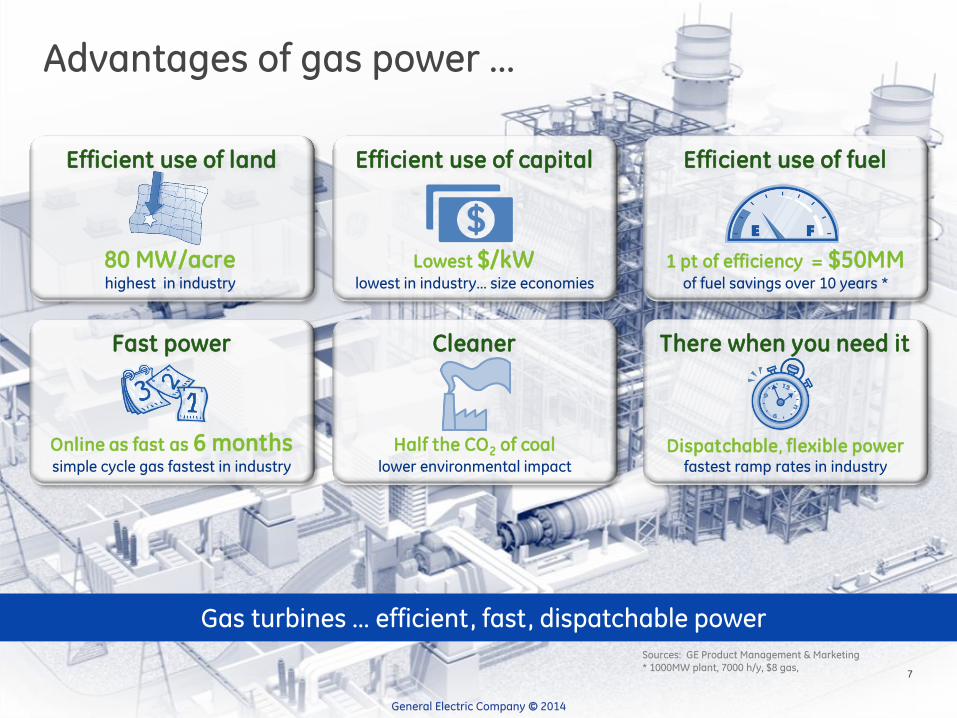
Gas turbines … efficient, fast, dispatchable power Sources: GE Product Management & Marketing * 1000MW plant, 7000 h/y, $8 gas,
Advantages of gas power …
7
7
Efficient use of land
80 MW/acre highest in industry
Efficient use of capital Efficient use of fuel
Fast power Cleaner There when you need it
1 pt of efficiency = $50MM of fuel savings over 10 years *
Lowest $/kW lowest in industry… size economies
Online as fast as 6 months simple cycle gas fastest in industry
Dispatchable, flexible power fastest ramp rates in industry
Half the CO2 of coal lower environmental impact
.03
.01
.03
.03
.04
.05
.01
.02
.03
.03
.05
.01
.02
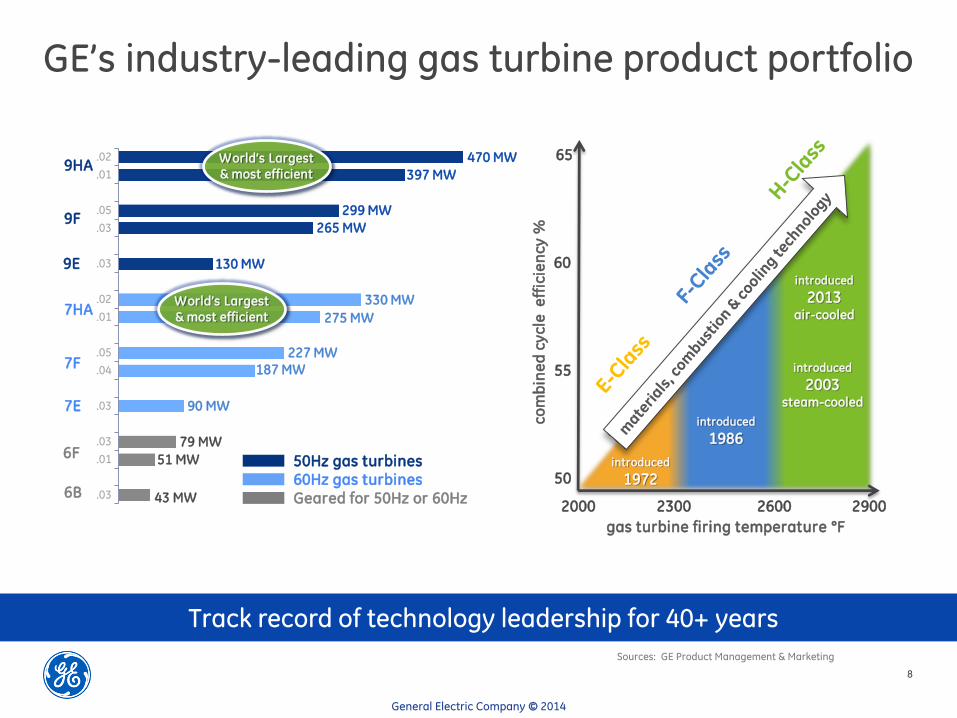
GE’s industry-leading gas turbine product portfolio
World’s Largest
& most efficient
Geared for 50Hz or 60Hz 60Hz gas turbines 50Hz gas turbines
43 MW
79 MW
90 MW
187 MW
227 MW
130 MW
265 MW
299 MW
470 MW
275 MW
397 MW 9HA
9F
9E
7HA
7F
6F
6B
7E
330 MW
51 MW
Track record of technology leadership for 40+ years
General Electric Company © 2014
Sources: GE Product Management & Marketing
8
gas turbine firing temperature °F co
mb
ine
d c
yc
le e
ffic
ien
cy
%
introduced
1972
introduced
2003 steam-cooled
introduced
2013 air-cooled
50
55
60
introduced
1986
World’s Largest
& most efficient
2300 2600 2000 2900
65
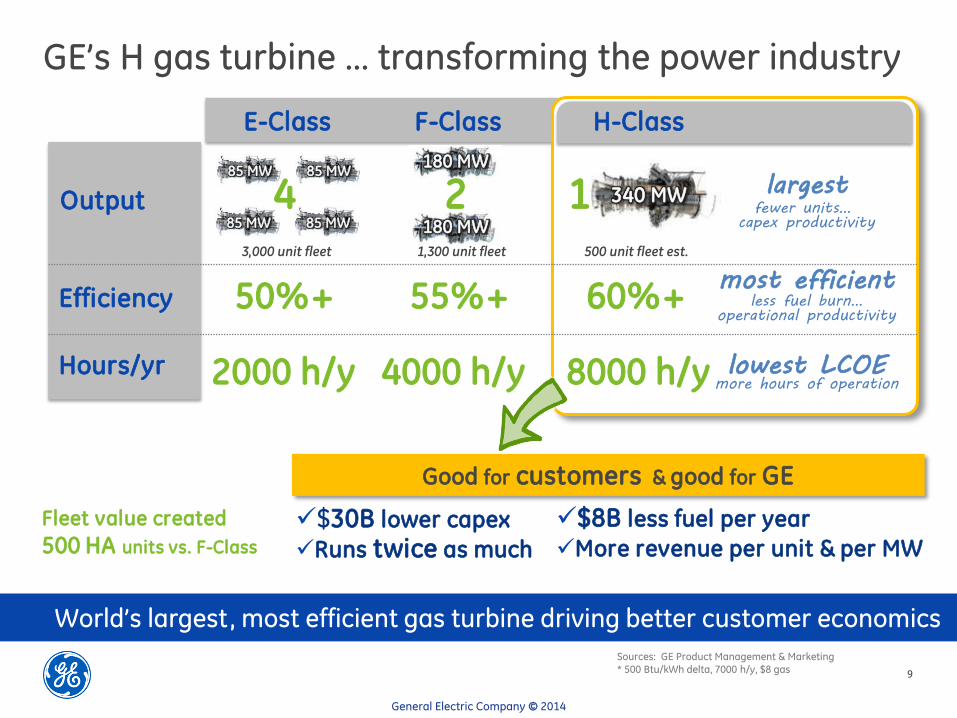
GE’s H gas turbine … transforming the power industry
World’s largest, most efficient gas turbine driving better customer economics
9
E-Class
4
F-Class
2 1
Runs twice as much
$30B lower capex
Good for customers & good for GE
Output
Efficiency
Hours/yr
50%+ 55%+ 60%+
2000 h/y 4000 h/y 8000 h/y
$8B less fuel per year
85 MW
85 MW 85 MW
85 MW 180 MW
180 MW
340 MW
3,000 unit fleet 1,300 unit fleet 500 unit fleet est.
largest fewer units…
capex productivity
most efficient less fuel burn…
operational productivity
lowest LCOE more hours of operation
Fleet value created
500 HA units vs. F-Class
General Electric Company © 2014
More revenue per unit & per MW
H-Class
Sources: GE Product Management & Marketing * 500 Btu/kWh delta, 7000 h/y, $8 gas
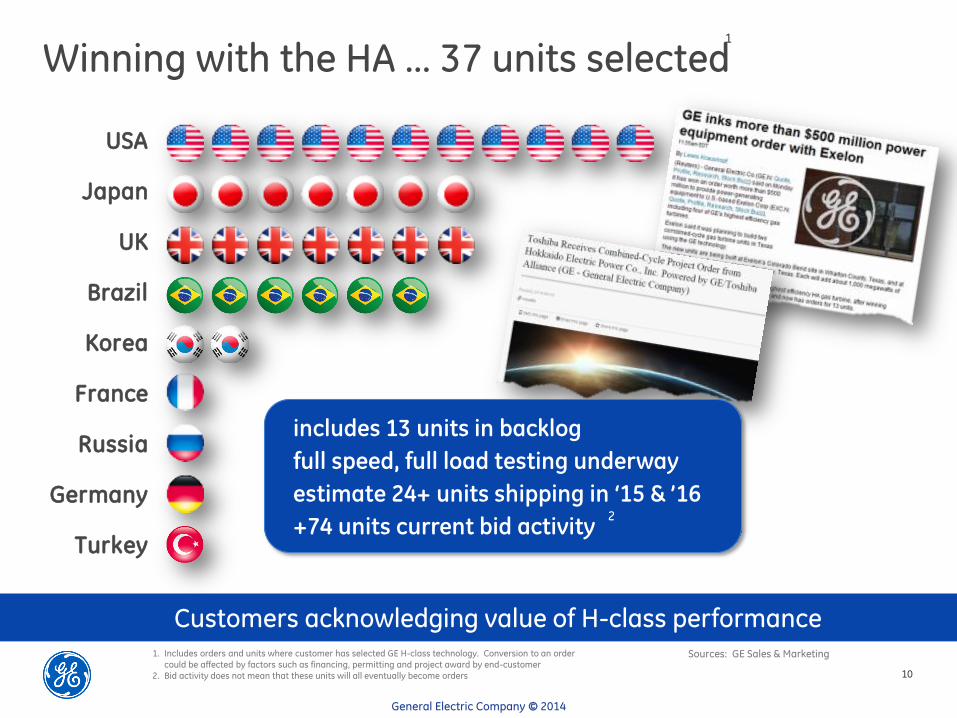
Winning with the HA … 37 units selected
General Electric Company © 2014
Sources: GE Sales & Marketing
10
USA
Japan
UK
Brazil
Korea
France
Russia
Germany
Turkey
1
1. Includes orders and units where customer has selected GE H-class technology. Conversion to an order
could be affected by factors such as financing, permitting and project award by end-customer
2. Bid activity does not mean that these units will all eventually become orders
Customers acknowledging value of H-class performance
includes 13 units in backlog
full speed, full load testing underway
estimate 24+ units shipping in ‘15 & ’16
+74 units current bid activity 2
© 2014, General Electric Company. Proprietary . All rights reserved.
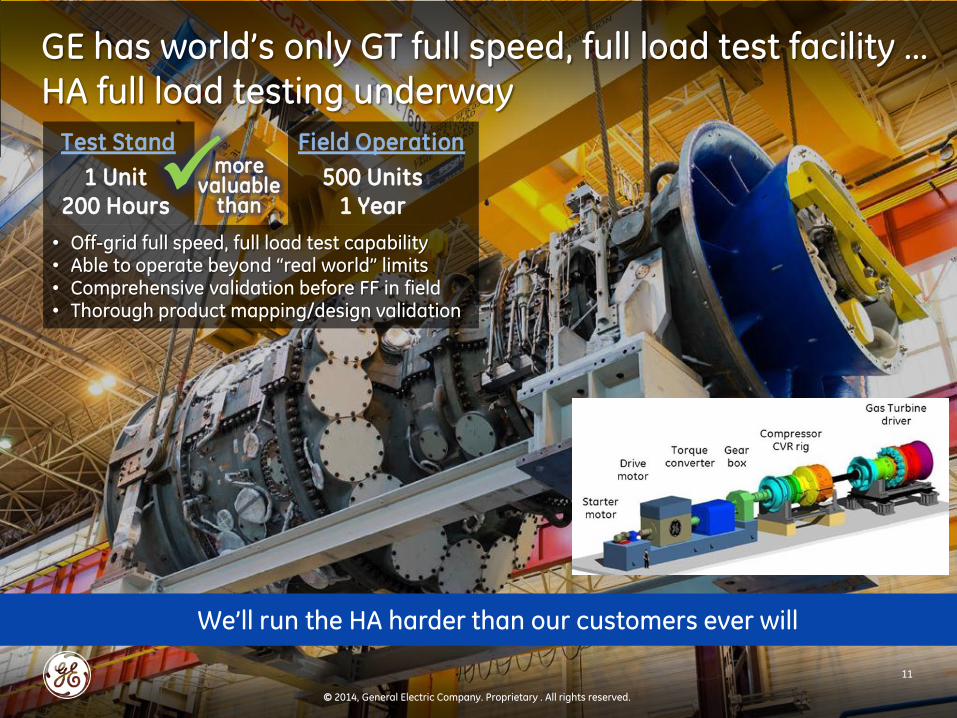
GE has world’s only GT full speed, full load test facility … HA full load testing underway
We’ll run the HA harder than our customers ever will
11
Test Stand
1 Unit 200 Hours
more valuable
than
• Off-grid full speed, full load test capability • Able to operate beyond “real world” limits • Comprehensive validation before FF in field • Thorough product mapping/design validation
Field Operation
500 Units 1 Year
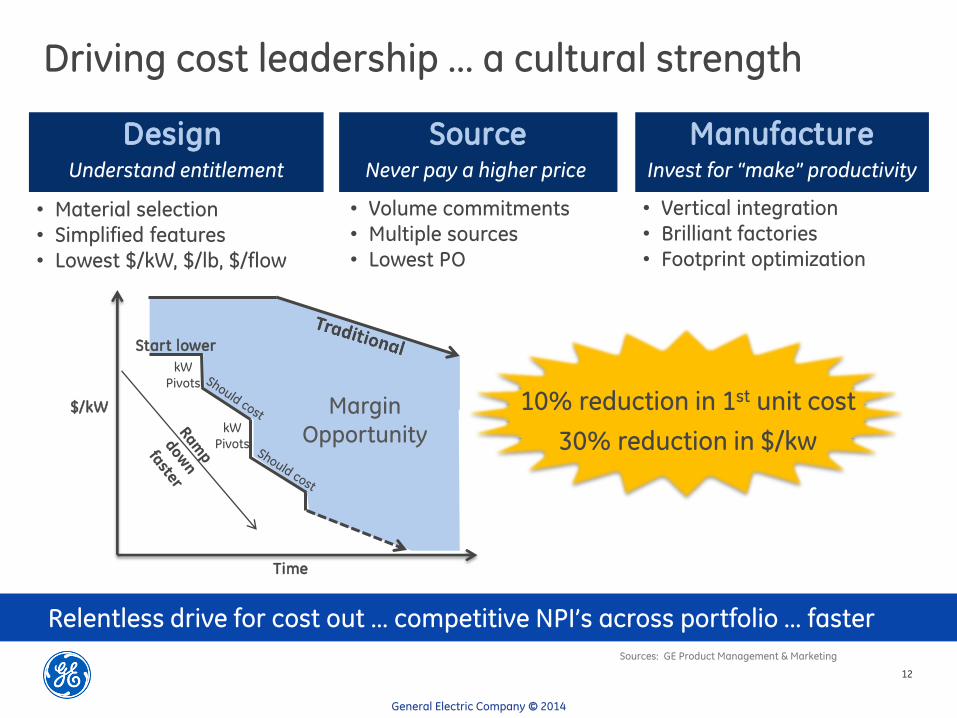
Driving cost leadership … a cultural strength
General Electric Company © 2014
Sources: GE Product Management & Marketing
• Material selection
• Simplified features
• Lowest $/kW, $/lb, $/flow
• Vertical integration • Brilliant factories
• Footprint optimization
• Volume commitments
• Multiple sources
• Lowest PO
Design Understand entitlement
Manufacture Invest for “make” productivity
Source Never pay a higher price
Relentless drive for cost out … competitive NPI’s across portfolio … faster
12
Margin Opportunity
Start lower
kW
Pivots
kW
Pivots
$/kW
Time
10% reduction in 1st unit cost
30% reduction in $/kw
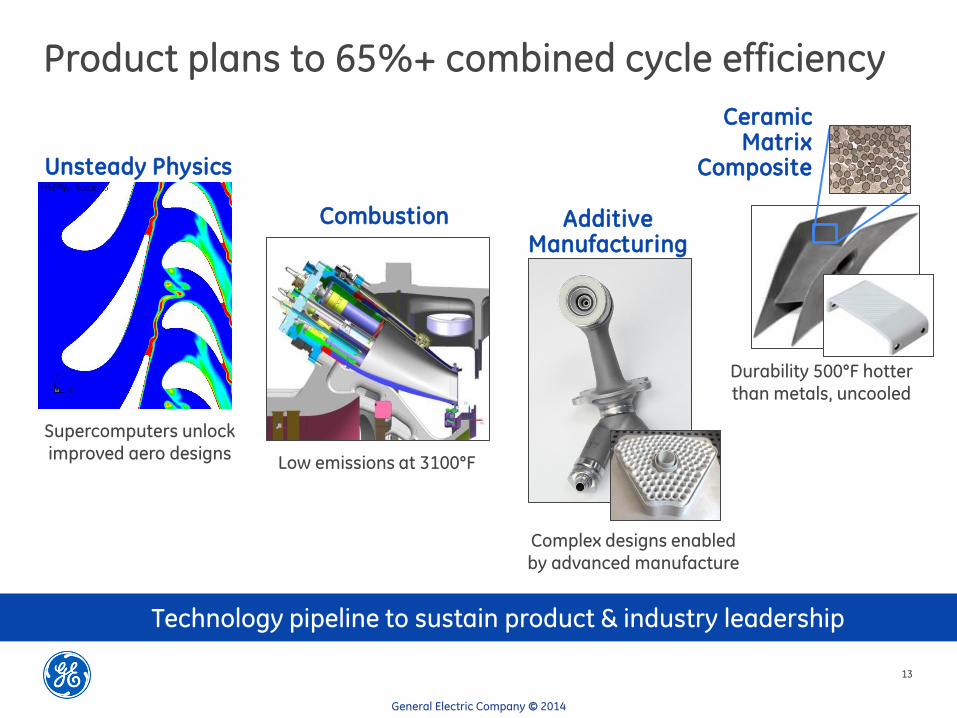
Supercomputers unlock improved aero designs
Unsteady Physics
Ceramic Matrix
Composite
Durability 500°F hotter than metals, uncooled
Additive Manufacturing
Complex designs enabled by advanced manufacture
Low emissions at 3100°F
Combustion
Product plans to 65%+ combined cycle efficiency
Technology pipeline to sustain product & industry leadership
13
General Electric Company © 2014
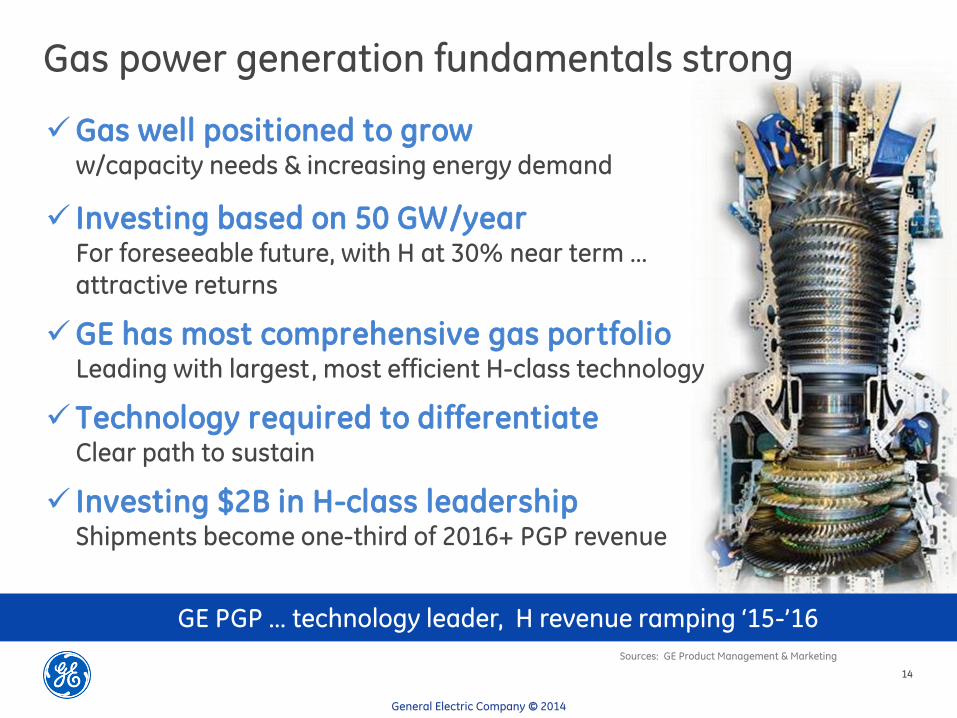
Gas power generation fundamentals strong
GE PGP … technology leader, H revenue ramping ‘15-’16
14
Gas well positioned to grow w/capacity needs & increasing energy demand
Investing based on 50 GW/year For foreseeable future, with H at 30% near term … attractive returns
GE has most comprehensive gas portfolio Leading with largest, most efficient H-class technology
Technology required to differentiate Clear path to sustain
Investing $2B in H-class leadership Shipments become one-third of 2016+ PGP revenue
General Electric Company © 2014
Sources: GE Product Management & Marketing

15