GE Power & Water Ocean Logistics - breakbulk.com · GE Energy Infra GE Capital ... GE Power & Water...
20
GE Power & Water Ocean Logistics May 2014 GE Power & Water
Transcript of GE Power & Water Ocean Logistics - breakbulk.com · GE Energy Infra GE Capital ... GE Power & Water...

GE Power & Water Ocean Logistics
May 2014
GE Power & Water

General Electric

3
GE …Divisions
GE Energy Infra GE Capital
Home & Business Solutions
Oil & Gas
Energy Management
Healthcare
Aviation
Transportation
GE Technology Infra Power & Water
Oil & Gas
Energy Management
Healthcare
Aviation
Transportation
Capital
Home & Business Solutions
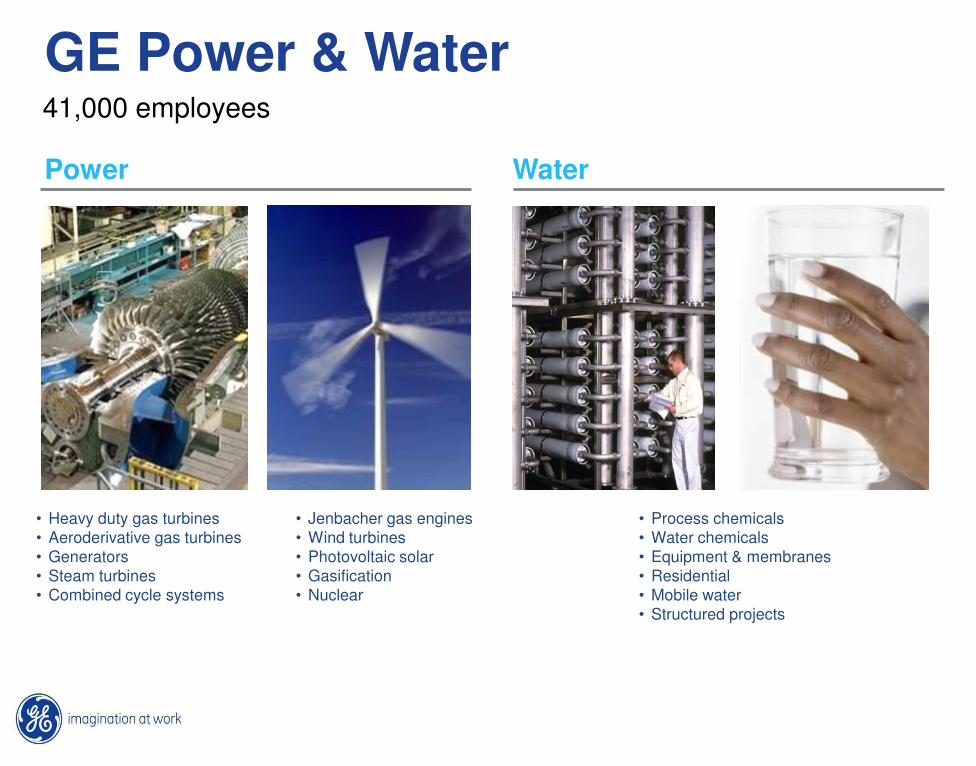
GE Power & Water
• Heavy duty gas turbines
• Aeroderivative gas turbines
• Generators
• Steam turbines
• Combined cycle systems
• Jenbacher gas engines
• Wind turbines
• Photovoltaic solar
• Gasification
• Nuclear
Power Water
• Process chemicals
• Water chemicals
• Equipment & membranes
• Residential
• Mobile water
• Structured projects
41,000 employees

5
Let‘s start with the basics...Megawatt (MW): • A measure of electric power
• One MW can power 250 – 300 homes
Residential Utility/IPP
500 MW+
5 KW
9FA+e
9E
7FA+e
7EA
LM6000
LM2000
6B LM6000S
TM2500
LMX
Wind
9H
7H
SOFC Hybrid
GE5 GE10
6FA+e
6C
52E GE15
7FB
9FB
Heat A10
POWERING
250,000 HOMES
Power Generation … Product Lines

Globally installed equipment
Gas turbines:
Dry Low NOX systems:
Steam turbines:
Gas Engines:
Wind turbines:
Gasification:
Nuclear:
Controls & condition monitoring systems:
Fabric filters:
Gas turbine inlet systems:
>10,200 units
>1,750 units
>3,980 units
>8,000 units
>8,850 units
62 facilities, 25 capturing CO2
62 plants
7.5 million
2,500
50,000 installations
>25% Power Generated Globally Comes from GE Technology

Logistics Management

Power & Water Logistics Management
Quality / EHS
Carrier Audits
Crisis Management
Significant Events
Loading & Handling Specs
Chemicals Compliance
Sourcing
Logistics Contracts
Logistics Supplier Approvals
Market Analysis
NPI and ITO Support
Landed Cost Analysis
Operations
P&L Strategy Management
Shipment Execution
Tracking & Tracing
Supplier Performance
Polar and Regional Teams

• Correlating business needs with industry capabilities
• Forecasting demand vs supply and subsequent implications
• Identify best in class solutions for business segments
• Drive contractual and legal frame work agreements
Ocean Sourcing

• Execution of the sourcing strategy
• Liaison between business units and ocean carrier
• Adherence of carrier to agreed terms & conditions
• Auditing of billing against agreements
Ocean Operations

• Initial ocean carrier audits operationally, legally and financially
• Periodic audits and incident driven audits
• Development of handling specifications in concert with engineering development
• Lead team on corrective actions
Ocean Quality/EHS

12 Presenter and Event
5/20/2014
Transportation Request
Transportation Planning
Transportation Execution
Freight Payment
and Claims
Logistics Operations Process
Carriers
Rates
Lanes
Service Levels
• EDI
• Web
• Manual
• Need Dates
• Dims & Weights
• Where to Where
• Options
• Cost
• Contract / Spot
• Transport PO
• Status
• POD
• Invoice
• Attachments
• Payments

Supplier Relationship Management

0
0.5
1
1.5
2
2.5
3
3.5
4
4.5
5
Performance
Performance
• Accountable
• Bold
• Simple
Carrier Expectations

Accountability
Bold
Simple
Expectations
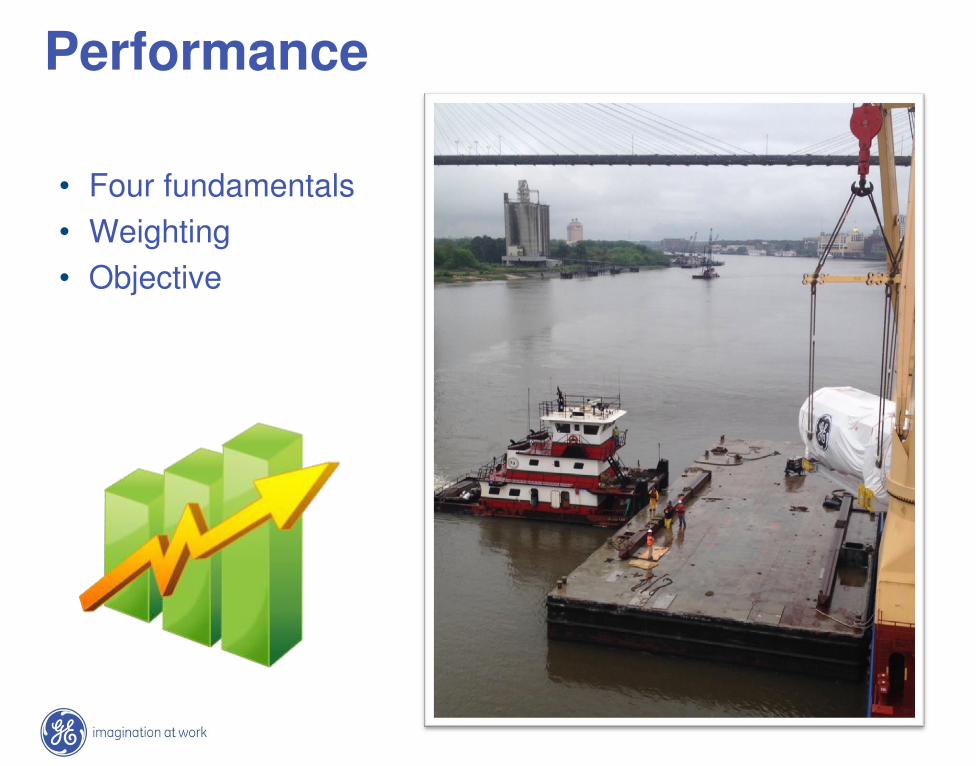
• Four fundamentals
• Weighting
• Objective
Performance

Compliance
Delivery
Quality
Price
Key Criteria

Communication

19
• Formal and informal
• Constructive feedback
• Quarterly performance reviews
Communication

$5,050,000
21,000
$5,000,000
20,000
Rate Per CBM
Freight
Invoiced
CBM Shipped
Booked Amount
CBM Booked
Dollar Variance
CBM Variance
Shipment Summary
Number of Shipments 22
$50,000
1000
Import Arrival Analysis On Time Comparative Assessment
Group Three includes 4 Carriers with 10 to 18 Shipments
$0
$500,000
$1,000,000
$1,500,000
$2,000,000
$2,500,000
$3,000,000
$3,500,000
$4,000,000
Qtr1 Qtr2 Qtr3 Qtr 4
8 Shipments
3 Shipments 3 Shipments
8 Shipments Lane Rate
Asia-Asia $50
Asia-North America $100
Europe-Asia $150
North America-Asia $100
Project Freight
Cost CBM
Aero
Asia 177 $26,277 250
Inbound Shipment #1 $35,577 339
Inbound Shipment #2 $76,564 729
Inbound Shipment #3 $52,261 498
Inbound Shipment #4 $35,470 341
Inbound Shipment #5 $64,830 438
Inbound Shipment #6 $35,470 338
USA 194 $200,320 1,066
Centro
Asia 189 $52,253 475
Digital Energy
USA 211 $124,192 642
SWA
USA 205 $1,362,000 1,979
USA 206 $2,138,906 3,172
SWA
Asia 173 $202,565 1,496
Project Freight
Cost CBM
Greenfield
Asia 175 $293,480 2,487
XPO
Asia 179 $57,572 885
EU 148 $497,000 3,091
EU 155 $199,230 1,245
Imperial
Asia 187 $24,256 231
Utah
Asia 192 $9,705 92
Zulu
Asia 193 $111,690 1,064
Nuclear
Asia 172 $92,050 568
Grand Total $5,691,668 21,425
82%
72%
0%
20%
40%
60%
80%
100%
Rickmers Avg Group 3
Carrier X - Scorecard
Carrier