Positive Surgical Margin and Perioperative Complication...
15
Platinum Priority – Review – Prostate Cancer Editorial by Quoc-Dien Trinh, Khurshid R. Ghani and Mani Menon on pp. 16–18 of this issue Positive Surgical Margin and Perioperative Complication Rates of Primary Surgical Treatments for Prostate Cancer: A Systematic Review and Meta-Analysis Comparing Retropubic, Laparoscopic, and Robotic Prostatectomy Ashutosh Tewari a, *, Prasanna Sooriakumaran a,b , Daniel A. Bloch c , Usha Seshadri-Kreaden d , April E. Hebert d , Peter Wiklund b a Institute of Prostate Cancer and LeFrak Center for Robotic Surgery, James Buchanan Brady Foundation Department of Urology, Weill Cornell Medical College–New York Presbyterian Hospital, New York, NY, USA; b Department of Molecular Medicine and Surgery, Karolinska University Hospital, Solna, Sweden; c Department of Health Research and Policy, Stanford University School of Medicine, Stanford, CA, USA; d Department of Clinical Affairs, Intuitive Surgical Inc., Sunnyvale, CA, USA EUROPEAN UROLOGY 62 (2012) 1–15 available at www.sciencedirect.com journal homepage: www.europeanurology.com Article info Article history: Accepted February 14, 2012 Published online ahead of print on February 24, 2012 Keywords: Robotics Laparoscopy Retropubic Prostatectomy Complications Prostate cancer Margins Please visit www.eu-acme.org/ europeanurology to read and answer questions on-line. The EU-ACME credits will then be attributed automatically. Abstract Context: Radical prostatectomy (RP) approaches have rarely been compared adequately with regard to margin and perioperative complication rates. Objective: Review the literature from 2002 to 2010 and compare margin and perioper- ative complication rates for open retropubic RP (ORP), laparoscopic RP (LRP), and robot- assisted LRP (RALP). Evidence acquisition: Summary data were abstracted from 400 original research articles representing 167 184 ORP, 57 303 LRP, and 62 389 RALP patients (total: 286 876). Articles were found through PubMed and Scopus searches and met a priori inclusion criteria (eg, surgery after 1990, reporting margin rates and/or perioperative complications, study size >25 cases). The primary outcomes were positive surgical margin (PSM) rates, as well as total intra- and perioperative complication rates. Secondary outcomes included blood loss, transfusions, conversions, length of hospital stay, and rates for specific individual compli- cations. Weighted averages were compared for each outcome using propensity adjustment. Evidence synthesis: After propensity adjustment, the LRP group had higher positive surgical margin rates than the RALP group but similar rates to the ORP group. LRP and RALP showed significantly lower blood loss and transfusions, and a shorter length of hospital stay than the ORP group. Total perioperative complication rates were higher for ORP and LRP than for RALP. Total intraoperative complication rates were low for all modalities but lowest for RALP. Rates for readmission, reoperation, nerve, ureteral, and rectal injury, deep vein thrombosis, pneumonia, hematoma, lymphocele, anastomotic leak, fistula, and wound infection showed significant differences between groups, generally favoring RALP. The lack of randomized controlled trials, use of margin status as an indicator of oncologic control, and inability to perform cost comparisons are limitations of this study. Conclusions: This meta-analysis demonstrates that RALP is at least equivalent to ORP or LRP in terms of margin rates and suggests that RALP provides certain advantages, especially regarding decreased adverse events. # 2012 European Association of Urology. Published by Elsevier B.V. All rights reserved. * Corresponding author. Institute of Prostate Cancer and LeFrak Center for Robotic Surgery, James Buchanan Brady Foundation Department of Urology, Weill Cornell Medical College–New York Presbyterian Hospital, 525 East 68th Street, Box 94, New York, NY 10065, USA. Tel. +1 212 746 9343. E-mail address: [email protected] (A. Tewari). 0302-2838/$ – see back matter # 2012 European Association of Urology. Published by Elsevier B.V. All rights reserved. doi:10.1016/j.eururo.2012.02.029
Transcript of Positive Surgical Margin and Perioperative Complication...

E U R O P E A N U R O L O G Y 6 2 ( 2 0 1 2 ) 1 – 1 5
ava i lable at www.sciencedirect .com
journal homepage: www.europeanurology.com
Platinum Priority – Review – Prostate CancerEditorial by Quoc-Dien Trinh, Khurshid R. Ghani and Mani Menon on pp. 16–18 of this issue
Positive Surgical Margin and Perioperative Complication Rates of
Primary Surgical Treatments for Prostate Cancer: A Systematic
Review and Meta-Analysis Comparing Retropubic, Laparoscopic,
and Robotic Prostatectomy
Ashutosh Tewari a,*, Prasanna Sooriakumaran a,b, Daniel A. Bloch c, Usha Seshadri-Kreaden d,April E. Hebert d, Peter Wiklund b
a Institute of Prostate Cancer and LeFrak Center for Robotic Surgery, James Buchanan Brady Foundation Department of Urology, Weill Cornell Medical
College–New York Presbyterian Hospital, New York, NY, USA; b Department of Molecular Medicine and Surgery, Karolinska University Hospital, Solna,
Sweden; c Department of Health Research and Policy, Stanford University School of Medicine, Stanford, CA, USA; d Department of Clinical Affairs, Intuitive
Surgical Inc., Sunnyvale, CA, USA
Article info
Article history:
Accepted February 14, 2012Published online ahead ofprint on February 24, 2012
Keywords:
Robotics
Laparoscopy
Retropubic
Prostatectomy
Complications
Prostate cancer
Margins
Please visit
Abstract
Context: Radical prostatectomy (RP) approaches have rarely been compared adequatelywith regard to margin and perioperative complication rates.Objective: Review the literature from 2002 to 2010 and compare margin and perioper-ative complication rates for open retropubic RP (ORP), laparoscopic RP (LRP), and robot-assisted LRP (RALP).Evidence acquisition: Summary data were abstracted from 400 original research articlesrepresenting 167 184 ORP, 57 303 LRP, and 62 389 RALP patients (total: 286 876). Articleswere found through PubMed and Scopus searches and met a priori inclusion criteria (eg,surgery after 1990, reporting margin rates and/or perioperative complications, study size>25cases).Theprimaryoutcomeswerepositivesurgicalmargin(PSM)rates,aswellastotalintra- and perioperative complication rates. Secondary outcomes included blood loss,transfusions, conversions, length of hospital stay, and rates for specific individual compli-cations. Weighted averages were compared for eachoutcome using propensity adjustment.Evidence synthesis: After propensity adjustment, the LRP group had higher positivesurgical margin rates than the RALP group but similar rates to the ORP group. LRP andRALP showed significantly lower blood loss and transfusions, and a shorter length ofhospital stay than the ORP group. Total perioperative complication rates were higher forORP and LRP than for RALP. Total intraoperative complication rates were low for allmodalities but lowest for RALP. Rates for readmission, reoperation, nerve, ureteral, andrectal injury, deep vein thrombosis, pneumonia, hematoma, lymphocele, anastomoticleak, fistula, and wound infection showed significant differences between groups,generally favoring RALP. The lack of randomized controlled trials, use of margin status
ncologic control, and inability to perform cost comparisons areudy.ta-analysis demonstrates that RALP is at least equivalent to ORP or
www.eu-acme.org/
europeanurology to read andlimitations of this stConclusions: This me
as an indicator of o
rgin rates and suggests that RALP provides certain advantages,decreased adverse events.
sociation of Urology. Published by Elsevier B.V. All rights reserved.
answer questions on-line.
The EU-ACME credits will
then be attributed
LRP in terms of maespecially regarding
# 2012 European As
automatically.* Corresponding author. Institute of Prostate Cancer and LeFrak Center for Robotic Surgery, JamesBuchanan Brady Foundation Department of Urology, Weill Cornell Medical College–New YorkPresbyterian Hospital, 525 East 68th Street, Box 94, New York, NY 10065, USA. Tel. +1 212 746 9343.E-mail address: [email protected] (A. Tewari).
0302-2838/$ – see back matter # 2012 European Association of Urology. Published by Elsevier B.V. All rights reserved. doi:10.1016/j.eururo.2012.02.029

E U R O P E A N U R O L O G Y 6 2 ( 2 0 1 2 ) 1 – 1 52
1. Introduction
Prostate cancer is the most common nondermatologic cancer
in Western men [1]. More than 90% of cases are diagnosed
when the disease is organ confined and potentially curable by
radical prostatectomy (RP) [2]. This was traditionally
performed by open retropubic RP (ORP), although minimally
invasive surgery (MIS; conventional laparoscopic and robot-
assisted laparoscopic RP, LRP and RALP, respectively) has
become popular recently. There is substantial evidence of
lower bleeding rates for MIS [3–6] but no good evidence of an
overall benefit for one modality over another, and it is
uncertain whether MIS, especially robotics, justifies its
increased costs and training requirements [7].
The most important outcomes to assess when comparing
ORP, LRP, and RALP are cancer control, complications, urinary
continence, and sexual potency. Unfortunately, biochemical
recurrences, metastases, and survival statistics, as well as
continence and potency, require long-term follow-up to
assess and can be subject to significant reporting and
interpretational biases. Positive surgical margin (PSM) and
perioperative complication rates thus remain early outcome
measures of importance in comparing surgical modalities.
Accrual to randomized controlled studies (RCTs) has been
notoriously poor [3] with only one such trial reported
comparing ORP and LRP [8]. In addition, of the thousands of
Table 1 – Study design
Patients Patients undergoing RALP, LRP, or RRP fo
Literature search Keyword search in PubMed and Scopus
Databases PubMed and Scopus
Limits Published from January 2002 to Decemb
Humans
In English
Keywords Retropubic radical prostatectomy
Open prostatectomy
RRP
Laparoscopic assisted radical prostatecto
Laparoscopic radical prostatectomy
LRP
Endoscopic extraperitoneal radical prost
EERPE
Robotic assisted radical prostatectomy
Robotic assisted laparoscopic prostatecto
RALP
Search details for sample
PubMed search of EERPE
EERPE[All Fields] AND (‘‘humans’’[MeSH
Eligibility criteria Full-text article (no abstracts)
Unique publication (no duplicate articles
Reported on outcomes of interest (surgic
Reported on at least 25 patients
Original report as determined from read
not used because they are not consisten
review articles, or meta-analyses)
Outcome reported in a usable form (each
confounding treatments, no missing or u
and tables
Reported on surgical approaches of inter
Exclusion criteria
(see Appendix 2 and 3,
available online)
Duplicate patient population, where som
on the same parameters (prevents doubl
Surgery prior to 1990 when minimally in
Early case experience (prevents bias tow
papers published on the surgical treatment of prostate cancer
with radical prostatectomy, there have been relatively few
comparative studies. A recent review found 37 comparative
studies: 23 ORP and LRP, 10 ORP and RALP, and 4 LRP and
RALP [9]. Meta-analyses based solely on comparative
articles [9–11], although informative, do not represent
most of the literature available in this area, which are single
cohort studies. Also, these reports do not adequately adjust
for differences between surgical cohorts. Therefore we
performed a meta-analysis of all of the available peer-
reviewed observational studies, controlling for differences
between ORP, LRP, and RALP cohorts with propensity score
adjustments [12,13], a technique used by other authors
[14–17].
2. Evidence acquisition
The methods used in reporting this meta-analysis follow
those outlined in the Preferred Reporting Items for System-
atic Reviews and Meta-Analyses (PRISMA) statement [18]
(see Appendix 1, available online). The study design, search
strategy, data abstraction, and excluded studies (with
justification) are detailed in Table 1, Figure 1 [19–22],
Appendix 2 (citations for excluded studies, available online),
and Figure 2 (early experience analysis). PubMed and Scopus
(2002–2010, English) were searched for original research
r the primary treatment of localized prostate cancer
er 2010 (no limits on article type)
my
atectomy
my
Terms] AND English[lang] AND (‘‘2002/01/01’’[PDAT]: ‘‘2010/12/31’’[PDAT]))
)
al margins, complications)
ing the abstract or if necessary the full text; PubMed classifications were
tly available (no letters to the editor, editorials, comments, news articles,
surgical approach was reported as a separate cohort, no additional
nreliable data; could not have >10% difference in values between text
est (no perineal prostatectomy)
e or all of the same patients were included in a different study reporting
e counting)
vasive surgery became first available (prevents bias toward RRP)
ard approaches with more experienced surgeons)

Data abstraction Articles needed to report only on a single outcome of interest to be included in the analysis. For articles that
reported on a cohort of interest (ORP, LRP, RALP) as well as on other treatments (eg, cryoablation, HIFU), only the
cohorts of interest were included
Data were uniformly abstracted by four individuals into a custom electronic database with a predetermined list
of variables. Each individual was responsible for the review and abstraction of approximately 25% of the articles
under consideration. The data for 25% of the articles was double-entered by a second individual, and any
discrepancies were resolved through repeated review and discussion prior to data analysis. The consistency and
accuracy of data abstractions was independently verified for a random sampling of 40% of the articles, with an error
rate <1% and no systematic errors. All errors found were corrected before analysis. All primary outcomes were
then double-checked and any discrepancies resolved
Four types of variables were abstracted from each study: those necessary to determine inclusion and exclusion
criteria, surgical approach, baseline patient characteristics, and clinical outcomes
Primary outcomes Positive surgical margins (overall, pT2, and pT3)
Total intraoperative and total perioperative complication rates
Secondary outcomes Estimated blood loss
Blood transfusion rates
Conversion rates
Length of hospital stay
Individual complication rates
Deaths
Readmission
Reoperation
Neurovascular injuries
Organ injuries
Ileus
Thromboembolism
Pneumonia
Myocardial infarction
Hematoma
Lymphocele
Anastomotic leakage
Fistula
Bladder neck/anastomotic stricture
Sepsis
Wound infection
Controls for bias due to selective
reporting within a study
(outcome level)
In instances where a variable was reported in subgroups, such as Gleason score (<7, 7, >7), intraoperative and
postoperative complications, or pT2 and pT3 PSM rates, only articles reporting data for all subgroups were
included to control for selective reporting within studies and to ensure that comparisons between surgical
modalities and meaningful interpretation of the results could be made
Controls for bias due to differences
in discharge criteria
Length of hospital stay was analyzed separately for studies performed in the United States and for studies
performed outside the United States
Controls for differences in
complication reporting
Calculated complication rates for each paper based on the number of patients experiencing at least one complication
rather than on the number of complications. For example, a patient experiencing no intraoperative complications
and multiple postoperative complications was counted once in the total perioperative complication rate and not
at all in the intraoperative rate. A patient experiencing at least one intraoperative complication and at least one
postoperative complication was counted once in the total intraoperative rate and once in the total perioperative
complication rate, and each complication would also be included in the respective individual complication rate
(if it was one of the ones on the list of individual complications). All injury complications were considered
intraoperative and if this injury (eg, rectal injury) also resulted in a new postoperative complication (eg, ileus),
that patient would qualify to be counted in both the intraoperative rate and in the perioperative rate
Calculated complication rate based on all data given and specific criteria rather than using author-provided
complication rates
Limited complications included in this meta-analysis to those reported for the perioperative period, excluding
those identified as late complications (occurring after 30 d) for consistency in reporting (only 23/400 [5.75%]
of papers reported complications beyond 30 d)
Reported individual complications to address some of the issues with pooling overall complication rates
Publication bias Included all studies published for each surgical approach; did not limit publications to high-volume centers
or centers of excellence
Performed a funnel plot analysis (see Fig. 4)
Control for bias when surgical
modality outcomes are compared
Performed propensity score adjustments to account for differences in patient characteristics
HIFU = high-intensity focused ultrasound; PSM = positive surgical margin; ORP = open retropubic radical prostatectomy; RALP = robot-assisted laparascopic
prostatectomy; LRP = laparoscopic radical prostatectomy; RRP = retropubic radical prostatectomy.
Table 1 (Continued)
E U R O P E A N U R O L O G Y 6 2 ( 2 0 1 2 ) 1 – 1 5 3

[(Fig._1)TD$FIG]
Articles from searches, n = 1424
Articles from bibliography of
reviews, n = 5
Articles from searches, n = 1252
Articles from bibliography of
reviews, n = 6
Retropubic radical
prostatectomy
Laparoscopic radical
prostatectomy
Robot-assisted
laparoscopic prostatectomy
Did not meet inclusion criteria
Duplicate articles
No outcomes of interestb
Study size <25
Not a primary sourcec
Outcomes not in usable formd
Did not meet inclusion criteria
Duplicate articles
No outcomes of interestb
Study size <25
Not a primary sourcec
Outcomes not in usable formd
Did not meet inclusion criteria
Duplicate articles
No outcomes of interestb
Study size <25
Not a primary sourcec
Outcomes not in usable formd
Potentially relevant full-text articles
n = 130
Potentially relevant full-text articles
n = 153
Potentially relevant full-text articles
n = 272
Excludede
Duplicate patient populationf
Surgery prior to 1990g
Early case experienceh
−2
−31
−1
Excludede
Duplicate patient populationf
Surgery prior to 1990g
Early case experienceh
−17
–
−19
Excludede
Duplicate patient populationf
Surgery prior to 1990g
Early case experienceh
−65
–
−20
Articles included from search
n = 96
Articles included from search
n = 117
Articles included from search
n = 187
n = 400
Total no. of articles in meta-analysis
Total no. of surgical cohorts
n = 168
Total no. of surgical cohorts
n = 127
Total no. of surgical cohorts
n = 166
Total no. of patients
n = 167 184
Total no. of patients
n = 57 303
Total no. of patients
n = 62 389
Articles from searches, n = 2501
Articles from bibliography of
reviews, n = 3
−632
−1230
−131
−255
−126
−518
−454
−85
−200
−19
−192
−358
−109
−277
−50
Keyword search in PubMed and Scopus
Limited by humans, in English, published from January 2002 to December2010a
Fig. 1 – Flowchart outlining the literature search and article evaluation process.aAll inclusion and exclusion criteria were applied to each search in a uniform manner.bThe last search was completed in March 2011.cRepresents articles that did not report on outcomes of prostate cancer treatment, articles that reported on alternative treatments for prostate cancer,and articles that did not report on margin or complication rates.dIncludes letters to the editor, editorials, comments, news articles, review articles, and meta-analyses.eIncludes articles in which outcomes were not stratified by surgical approach, articles with additional confounding treatments, and articles withincomplete or erroneous data (these controls were also applied at the level of outcomes). See Appendix 2 (available online) for a list of excluded studies.fExcluded articles where some or all of the same patients were included in a different study reporting on the same parameters.gExcluded articles where the surgery took place prior to 1990 when minimally invasive surgery was first available.hExcluded articles that reported on the early experience of a surgeon. We defined early experience as the first 75 cases for a surgeon for each approachbased on reports of the number of cases required to reach a base level of competence with the robotic approach [19–22] and confirmed with a post hocanalysis of positive margin rates as a function of the number of robot-assisted laparoscopic prostatectomy, laparoscopic radical prostatectomy, orretropubic radical prostatectomy cases performed that showed a decrease in the variability of outcomes after 75 cases (see Fig. 2).
E U R O P E A N U R O L O G Y 6 2 ( 2 0 1 2 ) 1 – 1 54
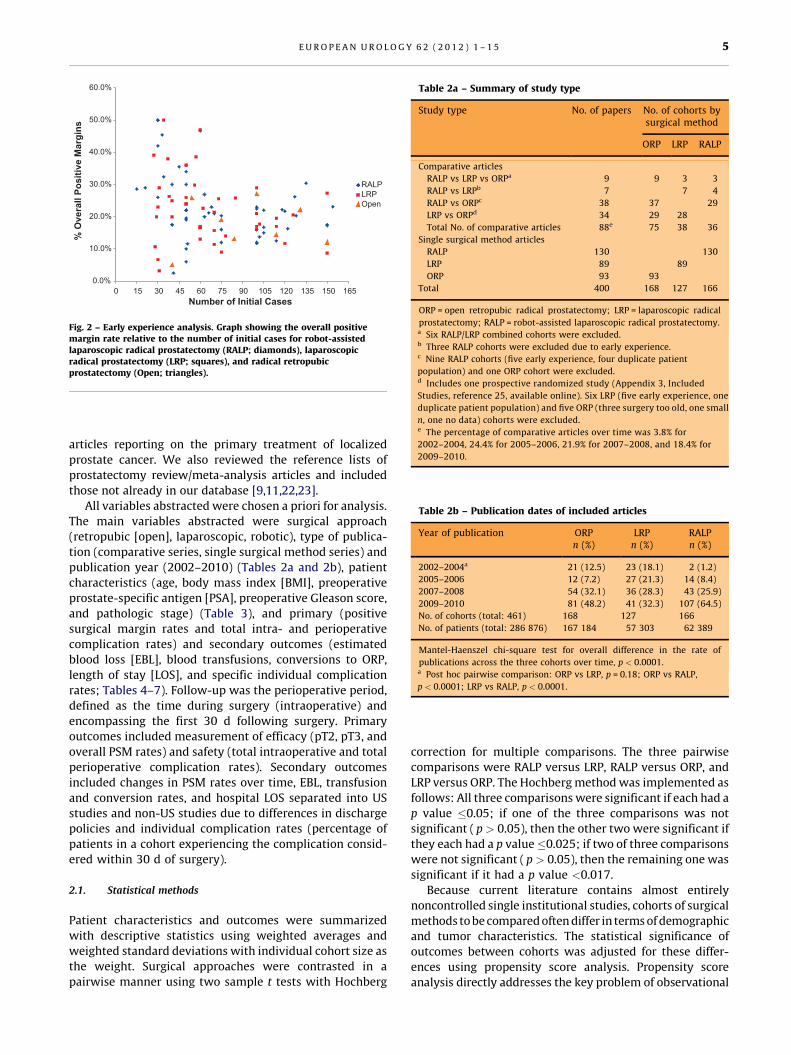
Table 2a – Summary of study type
Study type No. of papers No. of cohorts bysurgical method
ORP LRP RALP
Comparative articles
RALP vs LRP vs ORPa 9 9 3 3
RALP vs LRPb 7 7 4
RALP vs ORPc 38 37 29
LRP vs ORPd 34 29 28
Total No. of comparative articles 88e 75 38 36
Single surgical method articles
RALP 130 130
LRP 89 89
ORP 93 93
Total 400 168 127 166
ORP = open retropubic radical prostatectomy; LRP = laparoscopic radical
prostatectomy; RALP = robot-assisted laparoscopic radical prostatectomy.a Six RALP/LRP combined cohorts were excluded.b Three RALP cohorts were excluded due to early experience.c Nine RALP cohorts (five early experience, four duplicate patient
population) and one ORP cohort were excluded.d Includes one prospective randomized study (Appendix 3, Included
Studies, reference 25, available online). Six LRP (five early experience, one
duplicate patient population) and five ORP (three surgery too old, one small
n, one no data) cohorts were excluded.e The percentage of comparative articles over time was 3.8% for
2002–2004, 24.4% for 2005–2006, 21.9% for 2007–2008, and 18.4% for
2009–2010.
[(Fig._2)TD$FIG]
0.0%
10.0%
20.0%
30.0%
40.0%
50.0%
60.0%
0 15 30 45 60 75 90 105 120 135 150 165
% O
vera
ll Po
sitiv
e M
argi
ns
Number of Initial Cases
RALPLRPOpen
Fig. 2 – Early experience analysis. Graph showing the overall positivemargin rate relative to the number of initial cases for robot-assistedlaparoscopic radical prostatectomy (RALP; diamonds), laparoscopicradical prostatectomy (LRP; squares), and radical retropubicprostatectomy (Open; triangles).
Table 2b – Publication dates of included articles
Year of publication ORPn (%)
LRPn (%)
RALPn (%)
2002–2004a 21 (12.5) 23 (18.1) 2 (1.2)
2005–2006 12 (7.2) 27 (21.3) 14 (8.4)
2007–2008 54 (32.1) 36 (28.3) 43 (25.9)
2009–2010 81 (48.2) 41 (32.3) 107 (64.5)
No. of cohorts (total: 461) 168 127 166
No. of patients (total: 286 876) 167 184 57 303 62 389
Mantel-Haenszel chi-square test for overall difference in the rate of
publications across the three cohorts over time, p < 0.0001.a Post hoc pairwise comparison: ORP vs LRP, p = 0.18; ORP vs RALP,
p < 0.0001; LRP vs RALP, p < 0.0001.
E U R O P E A N U R O L O G Y 6 2 ( 2 0 1 2 ) 1 – 1 5 5
articles reporting on the primary treatment of localized
prostate cancer. We also reviewed the reference lists of
prostatectomy review/meta-analysis articles and included
those not already in our database [9,11,22,23].
All variables abstracted were chosen a priori for analysis.
The main variables abstracted were surgical approach
(retropubic [open], laparoscopic, robotic), type of publica-
tion (comparative series, single surgical method series) and
publication year (2002–2010) (Tables 2a and 2b), patient
characteristics (age, body mass index [BMI], preoperative
prostate-specific antigen [PSA], preoperative Gleason score,
and pathologic stage) (Table 3), and primary (positive
surgical margin rates and total intra- and perioperative
complication rates) and secondary outcomes (estimated
blood loss [EBL], blood transfusions, conversions to ORP,
length of stay [LOS], and specific individual complication
rates; Tables 4–7). Follow-up was the perioperative period,
defined as the time during surgery (intraoperative) and
encompassing the first 30 d following surgery. Primary
outcomes included measurement of efficacy (pT2, pT3, and
overall PSM rates) and safety (total intraoperative and total
perioperative complication rates). Secondary outcomes
included changes in PSM rates over time, EBL, transfusion
and conversion rates, and hospital LOS separated into US
studies and non-US studies due to differences in discharge
policies and individual complication rates (percentage of
patients in a cohort experiencing the complication consid-
ered within 30 d of surgery).
2.1. Statistical methods
Patient characteristics and outcomes were summarized
with descriptive statistics using weighted averages and
weighted standard deviations with individual cohort size as
the weight. Surgical approaches were contrasted in a
pairwise manner using two sample t tests with Hochberg
correction for multiple comparisons. The three pairwise
comparisons were RALP versus LRP, RALP versus ORP, and
LRP versus ORP. The Hochberg method was implemented as
follows: All three comparisons were significant if each had a
p value �0.05; if one of the three comparisons was not
significant ( p > 0.05), then the other two were significant if
they each had a p value�0.025; if two of three comparisons
were not significant ( p > 0.05), then the remaining one was
significant if it had a p value <0.017.
Because current literature contains almost entirely
noncontrolled single institutional studies, cohorts of surgical
methods to be compared often differ in terms of demographic
and tumor characteristics. The statistical significance of
outcomes between cohorts was adjusted for these differ-
ences using propensity score analysis. Propensity score
analysis directly addresses the key problem of observational

Table 3 – Patient characteristics
Characteristic ORP LRP RALP p valuea
Age, yr
Cohorts (patients), n 150 (128 197) 111 (48 654) 155 (61 310) 0.72
Mean (SD) 61.8 (2.1) 61.7 (2.4) 60.6 (1.6) <0.0001*
95% CI 61.5–62.1 61.3–62.1 60.3–60.9 <0.0001*
BMI (kg/m2)
Cohorts (patients), n 47 (28 828) 40 (21 150) 100 (40 154) 0.009*
Mean (SD) 27.3 (0.9) 26.7 (1.2) 27.3 (1.0) 1.00
95% CI 27.0–27.6 26.3–27.1 27.1–27.5 0.003*
Preoperative PSA, ng/ml
Cohorts (patients), n 120 (68 470) 107 (49 571) 135 (54 613) 0.25
Mean (SD) 7.5 (2.9) 7.9 (2.3) 6.3 (1.7) <0.0001*
95% CI 7.0–8.0 7.5–8.3 6.0–6.6 <0.0001*
Preoperative Gleason score, %
<7
Cohorts (patients), n 74 (63 095) 43 (30 596) 79 (40 884) 0.06
Mean (SD) 58.9 (13.1) 54.3 (11.4) 52.8 (15.9) 0.01*
95% CI 55.9–61.9 50.9–57.7 49.3–56.3 0.55
=7
Cohorts (patients), n 74 (63 095) 43 (30 596) 79 (40 884) 0.05
Mean (SD) 34.1 (11.9) 38.4 (9.7) 39.9 (14.0) 0.007*
95% CI 31.4–36.8 35.5–41.3 36.8–43.0 0.49
>7
Cohorts (patients), n 74 (63 095) 43 (30 596) 79 (40 884) 0.74
Mean (SD) 7.0 (4.7) 7.3 (4.6) 7.3 (6.4) 0.74
95% CI 5.9–8.1 5.9–8.7 5.9–8.7 1.00
Pathologic stage, %b
pT2
Cohorts (patients), n 111 (79 193) 105 (47 802) 113 (43 558) 0.12
Mean (SD) 68.8 (8.8) 70.9 (10.9) 78.8 (9.1) <0.0001*
95% CI 67.2–70.4 68.8–73.0 77.1–80.5 <0.0001*
pT3
Cohorts (patients), n 111 (79 193) 104 (47 235) 112 (43 273) 0.10
Mean (SD) 28.6 (7.5) 26.8 (8.4) 20.1 (7.5) <0.0001*
95% CI 27.2–30.0 25.2–28.4 18.7–21.5 <0.0001*
ORP = open retropubic radical prostatectomy; LRP = laparoscopic radical prostatectomy; RALP = robot-assisted laparoscopic radical prostatectomy;
SD = standard deviation; CI = confidence interval; BMI = body mass index; PSA = prostate-specific antigen.a The p values are reported in the following order: ORP vs LRP, ORP vs RALP, LRP vs RALP.b pT2 and pT3 values do not include pT0 or pT4.* Significant at 5% level after adjusting for multiple comparisons (Hochberg correction).
E U R O P E A N U R O L O G Y 6 2 ( 2 0 1 2 ) 1 – 1 56
group comparisons: that of differences in patient selection
criteria. First, covariates were selected that might distinguish
between the surgical cohorts to be compared and have a
relationship with outcome variables. Overall PSM rates were
adjusted for preoperative Gleason score, preoperative PSA,
and pathologic stage; pT2 and pT3 PSM rates were adjusted
for preoperative Gleason score and preoperative PSA; all
perioperative outcomes and complication rates were adjust-
ed for age, BMI, preoperative Gleason score, preoperative PSA,
and pathologic stage. A multivariate logistic regression
modeling of the probability of being in a cohort treated
with either of two surgical methods to be compared (there
are three such pairwise models) yielded estimated propen-
sity scores, where the propensity score was defined as the
probability of being in either type of surgical cohort,
conditioned on the average covariate values for that cohort.
Second, study cohort propensity scores (from both surgical
methods) were ordered from smallest to largest and adjacent
scores grouped into strata. Depending on the number of
cohorts available to make comparisons, up to five strata were
formed, usually sufficient to remove 90% of the selection bias
[12]. Within each derived stratum, surgical methods were
compared using a difference in average outcome. Propensity
score analysis yielded covariate distributions that are similar
across cohorts to be compared within each stratum [13]. A
Cochran-Mantel-Haenszel weight was then calculated for
each stratum. The adjusted summary measure of difference
between surgical methods was computed as the weighted
average of differences of the surgical methods across strata.
The weighted standard error across strata was also
calculated, and pairwise comparisons were evaluated
using standard normal theory. For each outcome for each
surgical method, two different adjusted rates were
calculated because the value of the adjusted rate depends
on the pair of surgical methods being compared. The size of
the adjustment was larger when there was a larger
difference in preoperative characteristics included in the
propensity score model. Because the adjusted rates were
not unique and inferences were based on the (uniquely)
adjusted difference between pairs of surgical methods,
only the differences in rates were reported after propensity
score adjustment.
For a given surgical type, the I2 statistic was used to
quantify the percentage of variability in outcomes due to

Table 4 – Primary outcomes: comparison of positive surgical margin and overall complication rates
Primary outcome Unadjusted estimates Propensity-adjusted estimates
Weighted averages Unadjusted p value Adjusted differencesa Adjusted p value
ORP LRP RALP ORP vsLRP
ORP vsRALP
LRP vsRALP
ORP minusLRP
ORP minusRALP
LRP minusRALP
ORP vsLRP
ORP vsRALP
LRP vsRALP
PSM rate
Overall PSM, %
Cohorts (patients), n 61 (47 103) 81 (33 180) 73 (28 950)0.007* <0.0001* <0.0001* 2.24 0.29 3.02
0.13 0.79 0.002*
Mean (SD) 24.2 (9.8) 20.4 (5.0) 16.2 (5.6) �0.7 to 5.2 �1.9 to 2.4 1.1–5.0
95% CI 21.7–26.6 19.3–21.5 14.9–17.5
pT2 PSM, %
Cohorts (patients), n 61 (47 103) 81 (33 180) 73 (28 950)0.004* <0.0001* 0.002* 0.15 0.17 2.54
0.57 0.86 0.01*
Mean (SD) 16.6 (8.8) 13.0 (4.4) 10.7 (4.7) �1.7 to 2.0 �1.7 to 2.0 0.5–4.6
95% CI 14.4–18.8 12.0–14.0 9.7–11.7
pT3 PSM, %
Cohorts (patients), n 61 (47 103) 81 (33 180) 73 (28 950)0.16 0.016* 0.10
�2.97 �3.91 3.340.07 0.03 0.05
Mean (SD) 42.6 (14.4) 39.7 (8.8) 37.2 (10.2) �6.2 to 0.2 �7.3 to �0.5 0.05–6.6
95% CI 39.0–46.2 37.8–41.6 34.7–39.5
Complication rates
Total intraoperative
Cohorts (patients), n 39 (16 647) 57 (16 389) 42 (14 309)0.79 0.0005* <0.0001* �0.32 1.15 1.10
0.93 <0.0001* <0.0001*
Mean (SD) 1.5 (1.6) 1.6 (1.9) 0.4 (0.5) �1.0 to 0.4 0.7–1.6 0.7–1.5
95% CI 1.0–2.0 1.1–2.1 0.4–0.7
Total perioperative
Cohorts (patients), n 39 (16 647) 57 (16 389) 42 (14 309)0.0008* <0.0001* 0.04* 5.24 13.76 6.74
0.08 <0.0001* 0.002*
Mean (SD) 17.9 (9.1) 11.1 (9.6) 7.8 (6.3) �0.7 to 11.1 9.5–18.0 2.6–10.9
95% CI 15.0–20.8 8.6–13.6 5.9–9.7
ORP = open retropubic radical prostatectomy; LRP = laparoscopic radical prostatectomy; RALP = robot-assisted laparoscopic radical prostatectomy; PSM = positive surgical margin; SD = standard deviation; CI = confidence
interval; pT2 = organ-confined cancer (not including pT0); pT3 = non–organ-confined cancer (not including pT4).a Overall PSM values were adjusted for preoperative Gleason score, preoperative PSA, and pathologic stage; the pT2 and pT3 PSM values were adjusted for preoperative Gleason and preoperative PSA; complication rates were
adjusted for age, BMI, preoperative Gleason score, preoperative PSA, and pathologic stage.* Significant at 5% level after adjusting for multiple comparisons (Hochberg correction).
EU
RO
PE
AN
UR
OL
OG
Y6
2(
20
12
)1
–1
57

Table 5 – Overall positive surgical margin rates over time
Year of publication ORP LRP RALP
2002–2004 24.9 (12.5) 21.3 (4.2) 22.1 (1.0)
2005–2006 13.0 (4.8) 22.8 (5.6) 14.6 (4.4)
2007–2008 23.7 (11.0) 19.7 (5.6) 14.6 (3.5)
2009–2010 25.0 (6.7) 19.7 (4.7) 16.8 (6.0)
Overall positive
surgical margins
24.2 (9.8) 20.4 (5.0) 16.2 (5.6)
p value* 0.38 0.66 0.38
ORP = retropubic radical prostatectomy; LRP = laparoscopic radical prostatec-
tomy; RALP = robot-assisted laparoscopic radical prostatectomy.
Data are mean rates % (standard deviation).* Jonckheere-Terpstra test.
E U R O P E A N U R O L O G Y 6 2 ( 2 0 1 2 ) 1 – 1 58
differences between cohorts. This measure is based on the Q
statistic, a weighted average of squared deviations of each
cohort’s outcome from the mean of their outcomes. The I2
index quantifies the relative amount of heterogeneity
between outcome values by comparing the value of the Q
statistic with its expected value assuming homogeneity.
Additional analyses included a Mantel-Haenszel chi-
square test to make an overall comparison and Fisher exact
tests to check for pairwise differences in publications by
year between surgical approaches. The Jonckheere-Terpstra
test was used to check for changes in positive margin rates
over time. Funnel plot analysis was performed on overall
PSM and total perioperative complication rates to check for
publication bias (Fig. 4). All analyses were performed using
SAS v.9.2.1 (SAS Institute, Cary, NC, USA).
[(Fig._3)TD$FIG]
Fig. 3 – Modified forest plot showing propensity-adjusted differences (X) and 95primary outcomes. The asterisks mark values that are significant after Hochbe=0.05; if one of three comparisons is not significant ( p > 0.05), then the othercomparisons are not significant ( p > 0.05), then the other one is significant if iLRP = laparoscopic radical prostatectomy; Open = radical retropubic prostatectopT3 = postoperative stage T3; RALP = robot-assisted laparoscopic radical prosta
Summary data were abstracted from 400 studies
(Appendix 3, available online) that reported on 168 ORP,
127 LRP, and 166 RALP cohorts representing 167 184 ORP, 57
303 LRP, and 62 389 RALP patients (total: 286 876 patients).
3. Evidence synthesis
There were differences in the rate of publications across the
three cohorts over time ( p < 0.0001). Specifically, a
statistically significantly greater proportion of ORP and
LRP cohorts came from early publications (2002–2004)
compared with RALP (12.5% and 18.1% vs 1.2%; ORP vs LRP,
p = 0.18; ORP vs RALP, p < 0.0001; LRP vs RALP, p < 0.0001)
(Tables 2a and 2b). There were differences in preoperative
PSA between surgical cohorts, with the RALP cohort having
a significantly lower average preoperative PSA than the ORP
and LRP cohorts ( p < 0.0001 for both comparisons) (Table 3).
There were no significant differences in the percentage of
high-grade disease (Gleason score >7) between the surgical
approaches, although the ORP cohort (28.6%) and the LRP
cohort (26.8%) had a significantly higher percentage of
patients with pT3 disease than the RALP cohort (20.1%)
( p < 0.0001 for both comparisons).
3.1. Primary outcomes (Fig. 3)
The overall PSM rates were 24.2% ORP, 20.4% LRP, and 16.2%
RALP; pT2 PSM rates were 16.6% ORP, 13.0% LRP, and 10.7%
RALP with only RALP versus LRP comparisons for overall
and pT2 rates attaining significance after propensity score
% confidence intervals (horizontal lines and numbers in brackets) for therg correction (all three comparisons are significant if each has a p valuetwo are significant if they each have a p value =0.025; if two of threet has a p value <0.017).my; PSM = positive surgical margin; pT2 = postoperative stage T2;
tectomy.

Table 6 – Comparisons of perioperative outcomes
Perioperative outcomes Weighted average Propensity-adjusted estimates
Unadjusted estimates Unadjusted p values Adjusted differencesa Adjusted p value
ORP LRP RALP ORP vsLRP
ORP vsRALP
LRP vsRALP
ORP minusLRP
ORP minusRALP
LRP minusRALP
ORP vsLRP
ORP vsRALP
LRP vsRALP
Estimated blood loss, ml
Cohorts (patients), n 94 (31 492) 80 (24 688) 112 (41 672)
Mean (SD) 745.3 (396.0) 377.5 (206.8) 188.0 (86.5) <0.0001* <0.0001* <0.0001* 363.1 562.5 127.8 <0.0001* <0.0001* <0.0001*
95% CI 665.4–825.6 332.2–423.0 174.1–204.5 272.4–453.8 485.2–639.8 95.4–160.2
Blood transfusions, %
Cohorts (patients), n 85 (84 848) 79 (25 610) 70 (5849)
Mean (SD) 16.5 (12.5) 4.7 (6.7) 1.8 (1.8) <0.0001* <0.0001* 0.006* 8.89 18.10 1.02 <0.0001* <0.0001* 0.07
95% CI 13.9–19.1 3.2–6.0 1.5–2.3 4.8–13.0 14.6–21.6 �0.1 to 2.1
Conversions to open, %
Cohorts (patients), n 62 (19 707) 49 (23 232)
Mean (SD) NA 0.7 (1.3) 0.3 (0.6) NA NA 0.11 NA NA 0.45 NA NA 0.26
95% CI 0.4–1.0 0.2–0.6 �0.3 to 1.2
LOS, United States, d
Cohorts (patients), n 28 (32 970) 18 (5409) 48 (20 393)
Mean (SD) 3.1 (0.5) 2.1 (0.3) 1.4 (0.4) <0.0001* <0.0001* <0.0001* 0.97 1.69 0.78 <0.0001* <0.0001* <0.0001*
95% CI 2.9–3.3 2.0–2.2 1.3–1.5 0.8–1.2 1.5–1.9 0.7–0.9
LOS, non–United States, d
Cohorts (patients), n 36 (9319) 48 (16 654) 29 (4679)
Mean (SD) 9.9 (4.6) 6.3 (3.0) 4.0 (1.3) <0.0001* <0.0001* <0.0001* 1.83 3.65 1.04 0.008* <0.0001* 0.005*
95% CI 8.4–11.4 5.5–7.2 3.5–4.4 0.5–3.2 2.8–4.5 0.3–1.8
ORP = open retropubic radical prostatectomy; LRP = laparoscopic radical prostatectomy; RALP = robot-assisted laparoscopic radical prostatectomy; SD = standard deviation; CI = confidence interval; NA = not applicable;
LOS = length of stay in hospital.a All perioperative outcomes adjusted for age, body mass index, preoperative Gleason score, preoperative prostate-specific antigen, and pathologic stage.* Significant at 5% level after adjusting for multiple comparisons (Hochberg correction).
EU
RO
PE
AN
UR
OL
OG
Y6
2(
20
12
)1
–1
59

Table 7 – Intra- and perioperative complication rates
Complication, % Unadjusted estimates Unadjusted Propensity-adjusted estimates
(weighted average) p values Adjusted differencea Adjusted p value
ORP LRP RALP ORP vsLRP
ORP vsRALP
LRP vsRALP
ORP minusLRP
ORP minusRALP
LRP minusRALP
ORP vsLRP
ORP vsRALP
LRP vsRALP
Deaths
Cohorts (patients), n 43 (26 261) 48 (12 558) 26 (12 286)
Mean (SD) 0.1 (0.1) 0.04 (0.14) 0.04 (0.1) 0.02* 0.02* 1.00 0.03 0.01 �0.008 0.40 0.62 0.80
95% CI 0.07–0.13 0.03–0.05 0.001–0.08 �0.04 to 0.08 �0.04 to 0.06 �0.07 to 0.05
Readmission
Cohorts (patients), n 6 (7548) 4 (725) 7 (4680)
Mean (SD) 3.0 (2.6) 11.3 (6.0) 3.5 (2.2) 0.02* 0.71 0.01* �9.45 4.16 6.77 0.006* <0.0001* 0.0003*
95% CI 0.9–5.1 5.4–17.2 1.9–5.1 �16.2 to 2.7 2.3–6.0 3.1–10.4
Reoperation
Cohorts (patients), n 31 (15 401) 32 (12 380) 28 (14 459)
Mean (SD) 2.3 (1.3) 1.9 (1.1) 0.9 (1.0) 0.19 <0.0001* 0.0005* 0.35 0.30 0.97 0.33 0.32 0.0001*
95% CI 1.8–2.8 1.5–17.2 1.9–5.1 �0.4 to 1.1 �0.3 to 0.9 0.5–1.5
Vessel injury
Cohorts (patients), n 7 (4595) 28 (12 196) 15 (10 567)
Mean (SD) 0.04 (0.2) 0.4 (0.8) 0.08 (0.1) 0.04 0.63 0.05 �0.22 0.03 0.29 0.12 0.44 0.17
95% CI �0.1 to 0.2 0.1–0.7 0.03–0.1 �0.50 to 0.06 �0.05 to 0.11 �0.12 to 0.71
Nerve injuryb
Cohorts (patients), n 14 (10 222) 25 (12 255) 21 (7015)
Mean (SD) 0.4 (0.4) 2.0 (5.3) 0.4 (0.7) 0.15 1.00 0.15 �2.18 �0.006 8.70 0.18 0.98 0.0006*
95% CI 0.2–0.6 �0.08 to 4.1 0.1–0.7 �5.3 to 1.0 �0.5 to 0.5 3.7–13.7
Ureteral injury
Cohorts (patients), n 18 (13 496) 30 (16 112) 16 (7402)
Mean (SD) 1.5 (1.9) 0.2 (0.3) 0.1 (0.2) 0.01* 0.006* 0.24 0.68 1.74 0.10 0.02* 0.012* 0.19
95% CI 0.6–2.4 0.1–0.3 0.002–0.2 0.1–1.3 0.4–3.1 �0.05 to 0.2
Bladder injury
Cohorts (patients), n 6 (4306) 16 (7803) 12 (6190)
Mean (SD) 0.05 (0.3) 0.4 (0.8) 0.07 (0.2) 0.15 0.87 0.13 �0.63 �0.03 0.06 0.07 0.63 0.74
95% CI �0.2 to 0.3 0.008–0.8 –0.04 to 0.2 �1.3 to 0.05 �0.2 to 0.09 �0.03 to 0.4
Rectal injury
Cohorts (patients), n 35 (28 023) 52 (19 860) 29 (9453)
Mean (SD) 0.5 (0.6) 1.0 (0.8) 0.3 (0.4) 0.002* 0.12 <0.0001* �0.58 0.04 0.44 0.0002* 0.76 0.0002*
95% CI 0.3–0.7 0.8–1.2 0.2–0.4 �0.9 to �0.3 �0.2 to 0.3 0.2–0.7
Bowel injuryc
Cohorts (patients), n 5 (4206) 18 (11 798) 16 (11 606)
Mean (SD) 0 (0) 0.07 (0.1) 0.09 (0.1) 0.009* 0.003* 0.56 �0.08 �0.09 �0.05 0.09 0.03 0.10
95% CI – 0.02–0.1 0.04–0.14 �0.1 to 0.01 �0.2 to �0.1 �0.1 to 0.01
Ileus
Cohorts (patients), n 21 (7336) 35 (11 932) 32 (10 665)
Mean (SD) 0.8 (1.4) 0.9 (1.0) 0.8 (0.9) 0.76 1.00 0.67 0.40 �0.23 0.40 0.14 0.36 0.11
95% CI 0.2–1.4 0.6–1.2 0.5–1.1 �0.1 to 0.9 �0.7 to 0.3 �0.08 to 0.9
Deep vein thrombosis
Cohorts (patients), n 26 (12 989) 27 (13 346) 27 (9753)
Mean (SD) 1.0 (0.6) 0.5 (0.4) 0.3 (0.4) 0.0007* <0.0001* 0.06 0.39 0.55 0.35 0.02* 0.008* 0.003*
95% CI 0.8–1.2 0.4–0.6 0.1–0.5 0.06–0.7 0.1–1.0 0.1–0.6
EU
RO
PE
AN
UR
OL
OG
Y6
2(
20
12
)1
–1
51
0

Pulmonary embolism
Cohorts (patients), n 26 (12 767) 27 (99 996) 25 (10 415)
Mean (SD) 0.5 (0.4) 0.4 (0.4) 0.3 (0.5) 0.37 0.12 0.43 �0.02 0.24 0.08 0.88 0.08 0.53
95% CI 0.3–0.7 0.2–0.6 0.1–0.5 �0.2 to 0.2 �0.02 to 0.5 �0.2 to 0.3
Pneumonia
Cohorts (patients), n 11 (8035) 13 (5426) 12 (5265)
Mean (SD) 0.5 (0.6) 0.1 (0.2) 0.05 (0.1) 0.06 0.03 0.43 0.45 0.38 0.13 0.006* 0.26 0.21
95% CI 0.1–0.9 �0.008 to 0.2 �0.006 to 0.1 0.1–0.8 �0.3 to 1.0 �0.07 to 0.3
Myocardial infarction
Cohorts (patients), n 17 (15 007) 20 (8043) 20 (7688)
Mean (SD) 0.2 (0.2) 0.1 (0.2) 0.2 (0.3) 0.14 1.00 0.22 �0.02 0.007 �0.07 0.75 0.92 0.18
95% CI 0.1–0.3 0.01–0.2 0.07–0.33 �0.2 to 0.1 �0.1 to 0.1 �0.2 to 0.03
Hematoma
Cohorts (patients), n 18 (9912) 36 (13 817) 21 (7407)
Mean (SD) 1.6 (1.5) 1.1 (1.0) 0.7 (1.2) 0.21 0.04 0.18 0.01 0.78 0.39 0.98 0.002* 0.24
95% CI 0.9–2.3 0.8–1.4 0.2–1.2 �0.9 to 0.9 0.3–1.3 �0.3 to 1.0
Lymphoceled
Cohorts (patients), n 34 (17 724) 28 (12 775) 28 (10 226)
Mean (SD) 3.2 (3.3) 1.7 (1.2) 0.8 (1.3) 0.02* 0.0003* 0.009* 1.29 1.92 0.26 0.08 0.0003* 0.30
95% CI 2.1–4.3 1.3–2.1 0.3–1.3 �0.2 to 2.8 0.9–3.0 �0.3 to 0.7
Anastomotic leakagee
Cohorts (patients), n 37 (15 544) 47 (14 192) 47 (19 925)
Mean (SD) 10.0 (9.6) 3.7 (3.3) 3.5 (3.5) <0.0001* <0.0001* 0.78 6.33 5.18 0.39 <0.0001* <0.0001* 0.61
95% CI 6.9–13.0 2.8–4.6 2.5–4.5 3.2–9.5 3.6–6.8 �1.1 to 1.9
Fistula
Cohorts (patients), n 22 (23 134) 42 (15 422) 16 (5173)
Mean (SD) 0.07 (0.2) 0.3 (0.6) 0.03 (0.1) 0.03 0.42 0.007* �0.27 0.04 0.13 0.01* 0.49 0.04
95% CI �0.01 to 0.2 0.1–0.5 �0.02 to 0.08 �0.5 to �0.05 �0.06 to 0.1 0.01–0.3
Bladder neck/Anastomotic stricture
Cohorts (patients), n 25 (12 449) 32 (11 899) 36 (17 011)
Mean (SD) 2.2 (3.6) 0.8 (1.1) 0.9 (0.8) 0.07 0.09 0.65 1.02 0.67 �0.48 0.04 0.31 0.08
95% CI 0.8–3.6 0.4–1.2 0.6–1.2 0.03–2.0 �0.6 to 2.0 �1.0 to 0.04
Sepsis
Cohorts (patients), n 13 (7432) 14 (6327) 15 (5920)
Mean (SD) 0.2 (0.3) 0.2 (0.2) 0.1 (0.3) 1.00 0.39 0.30 0.07 0.11 0.13 0.36 0.17 0.03
95% CI 0.03–0.4 0.1–0.3 �0.05 to 0.25 �0.07 to 0.2 �0.04 to 0.3 0.01–0.3
Wound infection
Cohorts (patients), n 29 (12 968) 18 (7967) 23 (8495)
Mean (SD) 2.8 (2.5) 0.7 (1.3) 0.7 (0.8) 0.0005* 0.0001* 1.00 1.35 1.61 0.40 0.01* 0.0009* 0.25
95% CI 1.9–3.7 0.1–1.3 0.4–1.0 0.3–2.4 0.7–2.6 �0.3 to 1.1
RALP = robot-assisted laparoscopic radical prostatectomy; LRP = laparoscopic radical prostatectomy; ORP = open retropubic radical prostatectomy; SD = standard deviation; CI = confidence interval.a All perioperative outcomes adjusted for age, body mass index, preoperative Gleason score, preoperative prostate-specific antigen, and pathologic stage.b Nerve injuries include injuries to the obturator and ulnar nerves and reports of neurapraxia, nerve palsy, ulnar neuropathy, and axonal degeneration.c Bowel injuries include injuries to the duodenum, jejunum, ileum, cecum, colon, and sigmoid (all bowel except the rectum).d Lymphoceles were either symptomatic or asymptomatic, and rates were calculated using overall study size.e Anastomotic leakage includes urine leakage, urine extravasation, and urinoma; complication rates do not include transfusions because they are reported separately.* Significant at 5% level after adjusting for multiple comparisons (Hochberg correction).
EU
RO
PE
AN
UR
OL
OG
Y6
2(
20
12
)1
–1
51
1

[(Fig._4)TD$FIG]
Fig. 4 – Funnel plot analysis. Scatter plots of treatment effect (overall positive margin rate or total perioperative complication rate) by study size are shownfor robot-assisted laparoscopic radical prostatectomy (RALP), laparoscopic radical prostatectomy (LRP), and radical retropubic prostatectomy (Open).Vertical dotted lines represent the weighted averages. Solid lines are visual aids for identifying symmetry versus asymmetry, with a symmetric shapeindicative of a ‘‘well-behaved’’ data set in which publication bias is unlikely.
E U R O P E A N U R O L O G Y 6 2 ( 2 0 1 2 ) 1 – 1 512
adjustment and Hochberg correction (overall PSM p = 0.002;
pT2 PSM p = 0.01). The rates for pT3 cancers (42.6% ORP, 39.7%
LRP, and 37.2% RALP) were not significantly different after
propensity adjustment and Hochberg correction. Total
intraoperative complication rates were significantly higher
for ORP (1.5%) versus RALP (0.4%) ( p < 0.0001) and for LRP
(1.6%) versus RALP (0.4%) ( p < 0.0001). For total periopera-
tive complication rates (17.9% ORP, 11.1% LRP, and 7.8% RALP),
RALP versus ORP ( p < 0.0001) and versus LRP ( p = 0.002)
were significant. Testing for heterogeneity with Q statistics
yielded p < 0.0001 in all cases, and the percentage of total
variance attributable to heterogeneity of outcomes between
studies as measured with the I2 statistic varied from 59.7% to
98.7%. Funnel plot analysis demonstrated a lack of publication
bias for overall PSM and an inconclusive finding for total
perioperative complication rates (Fig. 4).
3.2. Secondary outcomes
The overall PSM rates did not significantly decrease with
time for any cohorts (Table 5). The EBL and transfusion rates
for ORP (745.3 ml; 16.5%) were higher than for LRP
(377.5 ml; 4.7%) and RALP (188.0 ml; 1.8%). RALP had the
shortest hospital stay, both in the US studies (1.4 d) and in

E U R O P E A N U R O L O G Y 6 2 ( 2 0 1 2 ) 1 – 1 5 13
the non-US studies (4.0 d), with LRP intermediate (2.1 d US,
6.3 d non-US), and ORP having the longest length of stay
(3.1 d US, 9.9 d non-US). All pairwise comparisons were
statistically significant except for the LRP versus RALP
transfusion rate comparison ( p = 0.07) (Table 6). Conver-
sion rates were low for both LRP (0.7%) and RALP (0.3%) and
not significantly different between the modalities (Table 6).
Rates of mortality were low between groups (0.1% ORP,
0.04% LRP, and 0.04% RALP), with no significant differences
after propensity score adjustments (Table 7). Although the
unadjusted readmission rate for ORP (3.0%) was lower than
RALP (3.5%), upon adjustment the readmission rate for ORP
was estimated to be 4.2% higher than RALP ( p� 0.0001), and
the LRP rate (11.3%) was significantly higher than both the
ORP and RALP rates ( p = 0.006 and p = 0.0003, respectively).
The reoperation rate for RALP (0.9%) was significantly lower
than for LRP (1.9%; p = 0.0001). Vessel and bladder and bowel
(not including rectal) injuries were reported infrequently or
not at all for all three surgical modalities (<1%), with no
significant differences after propensity score adjustments.
Nerve injuries were significantly higher for LRP (2.0%)
compared with RALP (0.4%; p = 0.0006), and ureteral injuries
were statistically higher for ORP (1.5%) compared with RALP
(0.1%; p = 0.012) and LRP (0.2%; p = 0.02). There was a
significantly higher rectal injury rate for LRP (1.0%) versus
RALP (0.3%; p = 0.0002) and versus ORP (0.5%; p = 0.0002).
The rates of ileus, pulmonary embolism, myocardial infarc-
tion, bladder neck/anastomotic stricture, and sepsis were not
significantly different between the groups. The rates of deep
vein thrombosis were lowest for RALP (0.3%), intermediate
for LRP (0.5%), and highest for ORP (1.0%) with all pairwise
comparisons significant ( p = 0.02, p = 0.008, and p = 0.003,
respectively). Rates of pneumonia were significantly lower in
the LRP group (0.1%) when compared with ORP (0.5%, 0.006)
and were not significantly different than RALP rates (0.05%).
RALP rates of hematoma (0.7%) and lymphocele (0.8%) were
significantly lower than for ORP (hematoma: 1.6%, p = 0.002;
lymphocele: 3.2%, p = 0.0003). Anastomotic leakage and
wound infection rates were lower in both minimally invasive
cohorts when compared with ORP. Finally, perioperative
fistula rates were significantly higher for LRP (0.3%) than for
ORP (0.07%; p = 0.01).
4. Conclusions
This study represents the largest compilation of radical
prostatectomy patients to date, and it serves as a systematic
review and meta-analysis of this vast body of literature.
However, due to the lack of RCTs, differences in patient
characteristics between surgical cohorts might explain
differences in outcomes between treatment groups. These
differences cannot be fully corrected with statistical meth-
ods. Additionally, unknown differences in certain attributes
of the patients and physicians themselves and/or the
administered treatments could contribute to the highly
heterogeneous outcomes between studies. We thus caution
readers to interpret the findings of this meta-analysis within
the context of the considerations just described. Further-
more, due to the large numbers of patients included in this
meta-analysis, results that reach statistical significance may
not necessarily be clinically meaningful.
Although there were significant differences between all
three surgical approaches for the unadjusted overall and pT2
PSM rates, after propensity adjustment, the only significant
differences were lower overall and pT2 PSM rates for RALP
compared with LRP. This finding is not explained by
differences in preoperative Gleason score or PSA because
these parameters were included in the propensity adjust-
ment. Interestingly, the crude difference in overall PSM rates
for ORP and RALP of 8.0% (24.2% ORP; 16.2% RALP) was largely
eliminated by the propensity adjustment. Given only slight
differences between the groups in terms of preoperative
Gleason score, much of this effect can be attributed to the
higher preoperative PSA and pathologic stage averages of the
ORP cohorts (7.5 ng/ml PSA, 28.6% pT3) compared with the
RALP cohorts (6.3 ng/ml PSA, 20.1% pT3). The propensity-
adjusted pT3 rates were not statistically different for all three
surgical modalities after applying Hochberg corrections,
which is not surprising because this is a function of the
biology of the disease. A recent publication of 950 patients
found higher PSM rates for RALP compared with ORP in
contrast to our finding of equivalency. However, that study
was a head-to-head single case series comparison of only one
ORP and one robotic surgeon and not a comparison of a large
number of surgeons as in this meta-analysis [24]. Other
reviews have found lower PSM rates for RALP compared with
LRP and/or ORP [9,25]. However, neither of those studies nor
others included in this meta-analysis were able to account for
potential inconsistencies in the pathologic processing of the
specimen, such as whole mount versus standard processing;
thus it is not clear how RALP’s equivalence with ORP or
superiority over LRP for PSM rates will translate into longer
term oncologic results. However, a few recent reports have
shown equivalent early (1–3 yr) [26,27] and midterm (5-yr)
biochemical recurrence (BCR) rates for RALP, LRP, and ORP
[28,29]. Specifically, one recent report on 2132 patients by
Barocas et al. (2010) showed similar 3-yr BCR rates for ORP
(83.5%) and RALP (84.0%; p = 0.19) [27], and another paper by
Drouin et al. (2009) demonstrated equivalent oncologic
outcomes at 5 yr between the three surgical modalities (5-yr
BCR-free rates: 87.8% ORP, 88.1% LRP, and 89.6% RALP;
p = 0.93) [29].
Total intraoperative complication rates and mortality
rates were low for all surgical modalities, suggesting that
radical prostatectomy is a safe procedure. The finding of
reduced blood loss and transfusion rates in the LRP and RALP
groups, with RALP causing the least bleeding, is commonly
reported in the literature for MIS [3–6]. Our results also show
that recovery as measured by hospital LOS was quickest for
RALP, intermediate for LRP, and slowest for ORP. Along with
lower readmission, reoperation, and total perioperative
complication rates, this supports the notion of lower
morbidity for RALP. Other studies have also confirmed a
shorter overall convalescence period for RALP in terms of
return to work, social activities, and activities of daily living
[30,31]. It must be kept in mind that the complications
reported in this meta-analysis were abstracted from articles
that in the main (339 of 400; 85%) did not report

E U R O P E A N U R O L O G Y 6 2 ( 2 0 1 2 ) 1 – 1 514
complications using a standardized method such as the
Clavien classification system [32], and therefore it is possible
that differential reporting of complications affected our
findings. We did attempt to reduce bias using specific
abstraction measures (Table 1) and can thus be reasonably
confident that RALP is at least noninferior to LRP and ORP in
terms of early complication rates.
Complications are also difficult to interpret without
knowledge of comorbidities. However, 349 of 400 (87%) of
the included articles did not mention comorbidity status at
all, and only 11 of 400 articles (2.75%) reported comorbidity
using the Charlson index. Although age was clinically similar
between the surgical groups, thus suggesting that differences
in comorbidities between cohorts might not have been large,
readers are advised to consider that these differences might
have existed and thus influenced complication rates. Another
factor that could have influenced the results of this meta-
analysis was differences in clinical stage between the surgical
groups. Unfortunately, clinical stage was only reported
consistent with the TNM system in 122 of 400 articles
(30%). However, the inclusion of pathologic stage in this
meta-analysis compensates to some extent for the lack of
availability of clinical stage information. Route of access to
the prostate during surgery can also affect complications. It
was not possible to compare trans- and extraperitoneal
approaches for MIS because only 13 of 307 articles (4.2%)
separated their data based on route. In fact, many papers did
not even mention which route was used (91 of 307; 29.6%).
That said, most minimally invasive radical prostatectomies
are performed transperitoneally, and thus the effect of
different routes on various complication differences such as
hematoma and lymphocele between the minimally invasive
surgical modalities is likely to be modest.
Level of experience is a factor in determining outcomes,
with largely comparable results published by high-volume
surgeons in the field [27,33,34]. This meta-analysis does not
provide evidence that one modality is superior to another
among comparisons between high-volume surgeons. We
were not able to do this comparison because many included
studies did not state individual surgeon caseloads. Further
evidence that learning curve could play a part in differential
outcomes between treatment modalities is that a funnel plot
analysis (Fig. 4) showed skewed complication outcomes,
with smaller studies more often reporting higher complica-
tion rates, especially for LRP. It may be that included studies
resulted in favorable results for RALP over LRP and ORP for
some outcomes because the learning curve is shorter for
RALP [20,35,36], and thus more so-called expert RALP
surgeons were sampled in this meta-analysis than so-called
expert LRP or ORP surgeons. Hence it may be that expert
surgeons of any modality achieve similar results and that less
experienced surgeons fare better with RALP for certain
outcomes. Another possibility for our results is that known
oncologic factors controlled for in this meta-analysis do not
fully represent the biology of the disease. For example, lymph
node status was not included in this meta-analysis because
this information was often not available. Only 22 of 400 of the
papers (5.5%) reported lymph node yield, a surrogate for the
extent of lymphadenectomy. An additional 127 of 400 of the
papers (32%) reported on the number of patients who
underwent lymphadenectomy, and the rest of the articles
either gave no information at all (184 of 400; 46%), mentioned
that lymphadenectomy was performed in patients who
fulfilled specific criteria but did not give the number of
patients (47 of 400; 12%), or just reported the number of
positive lymph nodes (18 of 400; 4.5%). Therefore, readers
are cautioned to interpret differences between surgical
modalities in lymphatic-related complications such as
lymphocele and thromboembolic disease with care.
Due to limiting the time frame of this study to 30 d
postoperatively, this meta-analysis did not compare urinary
continence or sexual potency outcomes. This is a limitation
of the scope of this work, especially because these outcomes
can be related to PSM rates, and thus these comparisons will
be the subject of future work. Although Hu and colleagues
[14] reported on these outcomes, interpretation of their
results is difficult in the absence of validated question-
naires. A recent analysis by Alemozaffar et al. (2011)
demonstrated relatively poor outcomes for radical prosta-
tectomy in general with regard to intermediate-term (2-yr)
erectile function, making comparisons between surgical
modalities for this outcome yet more important [37]. Until
all the preceding comparisons are made in a reliable and
robust manner, it is not possible to recommend definitively
one type of surgical approach over the other, but this meta-
analysis is suggestive of at least equivalent PSM rates and
improved perioperative morbidity profiles for RALP com-
pared with LRP and ORP.
Author contributions: Ashutosh Tewari had full access to all the data in
the study and takes responsibility for the integrity of the data and the
accuracy of the data analysis.
Study concept and design: Tewari, Wiklund.
Acquisition of data: Hebert, Sooriakumaran.
Analysis and interpretation of data: Sooriakumaran, Bloch, Seshadri-
Kreaden, Wiklund.
Drafting of the manuscript: Sooriakumaran, Hebert, Bloch, Seshadri-
Kreaden.
Critical revision of the manuscript for important intellectual content:
Tewari, Wiklund.
Statistical analysis: Bloch.
Obtaining funding: None.
Administrative, technical, or material support: Hebert.
Supervision: Tewari.
Other (specify): None.
Financial disclosures: Ashutosh Tewari certifies that all conflicts of
interest, including specific financial interests and relationships and
affiliations relevant to the subject matter or materials discussed in the
manuscript (eg, employment/ affiliation, grants or funding, consultancies,
honoraria, stock ownership or options, expert testimony, royalties, or
patents filed, received, or pending), are the following: Usha Seshadri-
Kreaden and April E. Hebert have support from Intuitive Surgical Inc. as
paid employees. Ashutosh Tewari has received grants from Intuitive
Surgical Inc. in the past. Daniel A. Bloch receives consultancy fees from
Intuitive Surgical Inc. Prasanna Sooriakumaran and Peter Wiklund have
nothing to disclose.
Funding/Support and role of the sponsor: None.
Acknowledgment statement: The authors acknowledge Mark Burns and
Sherry Wang of Intuitive Surgical Inc. for aiding with data collection.

E U R O P E A N U R O L O G Y 6 2 ( 2 0 1 2 ) 1 – 1 5 15
Appendix A. Supplementary data
Supplementary data associated with this article can be
found, in the online version, at doi:10.1016/j.eururo.2012.
02.029.
References
[1] Jemal A, Siegel R, Xu J, Ward E. Cancer statistics, 2010. CA Cancer
J Clin 2010;60:277–300.
[2] Schroder FH, Carter HB, Wolters T, et al. Early detection of prostate
cancer in 2007. Part 1: PSA and PSA kinetics. Eur Urol 2008;53:
468–77.
[3] Tewari A, Srivasatava A, Menon M. A prospective comparison of
radical retropubic and robot-assisted prostatectomy: experience in
one institution. BJU Int 2003;92:205–10.
[4] Eden CG, Cahill D, Vass JA, Adams TH, Dauleh MI. Laparoscopic radical
prostatectomy: the initial UK series. BJU Int 2002;90:876–82.
[5] Kowalczyk KJ, Levy JM, Caplan CF, et al. Temporal national trends of
minimally invasive and retropubic radical prostatectomy outcomes
from 2003 to 2007: results from the 100% Medicare sample. Eur
Urol 2012;61:803–9.
[6] Trinh QD, Sammon J, Sun M, et al. Perioperative outcomes of robot-
assisted radical prostatectomy compared with open radical pros-
tatectomy: results from the nationwide inpatient sample. Eur Urol
2012;61:679–85.
[7] Dasgupta P, Kirby RS. The current status of robot-assisted radical
prostatectomy. Asian J Androl 2009;11:90–3.
[8] Guazzoni G, Cestari A, Naspro R, et al. Intra- and peri-operative
outcomes comparing radical retropubic and laparoscopic radical
prostatectomy: results from a prospective, randomised, single-
surgeon study. Eur Urol 2006;50:98–104.
[9] Ficarra V, Novara G, Artibani W, et al. Retropubic, laparoscopic, and
robot-assisted radical prostatectomy: a systematic review and cu-
mulative analysis of comparative studies. Eur Urol 2009;55:1037–63.
[10] Tooher R, Swindle P, Woo H, Miller J, Maddern G. Laparoscopic
radical prostatectomy for localized prostate cancer: a systematic
review of comparative studies. J Urol 2006;175:2011–7.
[11] Parsons JK, Bennett JL. Outcomes of retropubic, laparoscopic, and
robotic-assisted prostatectomy. Urology 2008;72:412–6.
[12] Rosenbaum PR, Rubin DB. The central role of the propensity score in
observational studies for causal effects. Biometrika 1983;70:41–55.
[13] Rosenbaum PR, Rubin DB. Reducing bias in observational studies
using subclassification on the propensity score. J Am Stat Assoc
1984;79:516–24.
[14] Hu JC, Gu X, Lipsitz SR, et al. Comparative effectiveness of minimally
invasive vs open radical prostatectomy. JAMA 2009;302:1557–64.
[15] Weight CJ, Lieser G, Larson BT, et al. Partial nephrectomy is associated
with improved overall survival compared to radical nephrectomy in
patients with unanticipated benign renal tumours. Eur Urol 2010;
58:293–8.
[16] Wong Y-N, Freedland SJ, Egleston B, et al. The role of primary
androgen deprivation therapy in localized prostate cancer. Eur Urol
2009;56:609–16.
[17] Klatte T, Grubmuller B, Waldert M, Weibl P, Remzi M. Laparoscopic
cryoablation versus partial nephrectomy for the treatment of small
renal masses: systematic review and cumulative analysis of obser-
vational studies. Eur Urol 2011;60:435–43.
[18] Moher D, Liberati A, Tetzlaff J, Altman DG, PRISMA Group. Preferred
reporting items for systematic reviews and meta-analyses: the
PRISMA statement. J Clin Epidemiol 2009;62:1006–12.
[19] Steinberg PL, Merguerian PA, Bihrle III W, Seigne JD. The cost of
learning robotic-assisted prostatectomy. Urology 2008;72:1068–72.
[20] Ahlering TE, Skarecky D, Lee D, Clayman RV. Successful transfer of
open surgical skills to a laparoscopic environment using a robotic
interface: initial experience with laparoscopic radical prostatec-
tomy. J Urol 2003;170:1738–41.
[21] Atug F, Castle EP, Srivastav SK, et al. Positive surgical margins in
robotic-assisted radical prostatectomy: impact of learning curve on
oncologic outcomes. Eur Urol 2006;49:866–72.
[22] Ficarra V, Cavalleri S, Novara G, Aragona M, Artibani W. Evidence
from robot-assisted laparoscopic radical prostatectomy: a system-
atic review. Eur Urol 2007;51:45–56, discussion 56.
[23] Artibani W, Ficarra V, Guillonneau BD. Open to debate. The motion:
a robot is needed to perform the best nerve sparing prostatectomy.
Eur Urol 2007;52:275–8.
[24] Williams SB, Chen MH, D’Amico AV, et al. Radical retropubic prosta-
tectomy and robotic-assisted laparoscopic prostatectomy: likelihood
of positive surgical margin(s). Urology 2010;76:1097–101.
[25] Coelho RF, Rocco B, Patel MB, et al. Retropubic, laparoscopic, and
robot-assisted radical prostatectomy: a critical review of outcomes
reported by high-volume centers. J Endourol 2010;24:2003–15.
[26] Magheli A, Gonzalgo ML, Su LM, et al. Impact of surgical technique
(open vs laparoscopic vs robotic-assisted) on pathological and
biochemical outcomes following radical prostatectomy: an analysis
using propensity score matching. BJU Int 2011;107:1956–62.
[27] Barocas DA, Salem S, Kordan Y, et al. Robotic assisted laparoscopic
prostatectomy versus radical retropubic prostatectomy for clini-
cally localized prostate cancer: comparison of short-term biochem-
ical recurrence-free survival. J Urol 2010;183:990–6.
[28] Rochat CH, Sauvain J, Dubernard P, Hebert AE, Kreaden U. Mid-term
biochemical recurrence-free outcomes following robotic versus
laparoscopic radical prostatectomy. J Robotic Surg 2011;5:251–7.
[29] Drouin SJ, Vaessen C, Hupertan V, et al. Comparison of mid-term
carcinologic control obtained after open, laparoscopic, and robot-
assisted radical prostatectomy for localized prostate cancer. World
J Urol 2009;27:599–605.
[30] Hohwu L, Akre O, Pedersen KV, et al. Open retropubic prostatec-
tomy versus robot-assisted laparoscopic prostatectomy: a com-
parison of length of sick leave. Scand J Urol Nephrol 2009;43:
259–64.
[31] Sultan R, Slova D, Thiel B, Lepor H. Time to return to work and
physical activity following open radical retropubic prostatectomy.
J Urol 2006;176:1420–3.
[32] Dindo D, Demartines N, Clavien PA. Classification of surgical com-
plications: a new proposal with evaluation in a cohort of 6336
patients and results of a survey. Ann Surg 2004;240:205–13.
[33] Klein EA, Bianco FJ, Serio AM, et al. Surgeon experience is strongly
associated with biochemical recurrence after radical prostatectomy
for all preoperative risk categories. J Urol 2008;179:2212–6,
discussion 2216–7.
[34] Wiltz AL, Shikanov S, Eggener SE, et al. Robotic radical prostatec-
tomy in overweight and obese patients: oncological and validated-
functional outcomes. Urology 2008;73:316–22.
[35] Guillonneau B, Rozet F, Barret E, Cathelineau X, Vallancien G.
Laparoscopic radical prostatectomy: assessment after 240 proce-
dures. Urol Clin North Am 2001;28:189–202.
[36] Patel VR, Tully AS, Holmes R, Lindsay J. Robotic radical prostatec-
tomy in the community setting—the learning curve and beyond:
initial 200 cases. J Urol 2005;174:269–72.
[37] Alemozaffar M, Regan MM, Cooperberg MR, et al. Prediction of
erectile function following treatment for prostate cancer. JAMA
2011;306:1205–14.