Political Framework for Renewable Energies in Germany 12th of November 2008 AHK-Program Renewables...
31
Political Framework for Renewable Energies in Germany 12th of November 2008 AHK-Program “Renewables Made in Germany” Uusikaupunki, Finland Sebastián Rivera, Ecofys Germany GmbH
-
Upload
kathy-hirst -
Category
Documents
-
view
221 -
download
0
Transcript of Political Framework for Renewable Energies in Germany 12th of November 2008 AHK-Program Renewables...
Political Framework for
Renewable Energies in Germany
12th of November 2008AHK-Program “Renewables Made in Germany”Uusikaupunki, Finland
Sebastián Rivera, Ecofys Germany GmbH

Support mechanisms in Germany
• The Renewable Energy Act: Feed-in Tariff for electricity
• The Renewable Heat Act and the Market Incentive Program
• Tax exemptions replaced by quota

The Renewable Energy Law - EEG
• Enacted in 2000, adjusted in 2004 and latest amendments to be in force as from January 1st 2009
• Priority for feed-in of RE
• Feed-In Tariffs for Renewable Power
• 2005: European Commission attested feed-in tariffs to be an effective and cost efficient instrument

Cent/kWh Degression
Hydropower (< 5 MW) 6.65 - 9.67 0%
Biomass (<20 MW) 8.06 – 20.83 1.5% (on base tariff)
Geothermal Energy (<20MW)
7.16 - 15.00 1.0%
Wind energy (onshore)
5.07 - 8.03 2.0%
Wind energy (offshore)
6.07 - 8.92 2.0%
Solar power 35.49 – 48.99 5%-6.5%
Feed-In Tariffs 2008

Feed-in and payment under the Electricity Feed Act (StrEG) and the Renewable Energy Sources Act (EEG) in Germanay
44.0
51.5
38.5
10.4
18.1
25.0
28.51.0 1.3 1.6 2.3 2.8 3.7 4.8
6.8 7.93.5
0
1,000
2,000
3,000
4,000
5,000
6,000
1991 1992 1993 1994 1995 1996 1997 1998 1999 2000 2001 2002 2003 2004 2005 2006*
[millio
n e
uro
]
0.0
10.0
20.0
30.0
40.0
50.0
60.0
[TW
h/a
]
Feed-in under StrEG [TWh/a]
Feed-in under EEG * [TWh/a]
Payment of fees [mn. €]
Amended EEG:from August 2004
EEG:from April 2000
Electricity Feed Act:Jan 1991 - March 2000
* Private and public feed-inIn 2004 for the first time, fees paid w ith regard for avoided grid utilisation feesSources: Internet Update BMU-Brochure " Renew able energy sources in f igures – national and international development" Version: November 2007; provisional f igures
EEG-supported installations

Contribution of renewable energy sourcesto electricity generation in Germany 1990 - 2006
0
10,000
20,000
30,000
40,000
50,000
60,000
70,000
80,000
1990 1991 1992 1993 1994 1995 1996 1997 1998 1999 2000 2001 2002 2003 2004 2005 2006
[GW
h]
Hydropower Wind energy
Biomass* Photovoltaics
StrEG Act on the Sale of Electricity to the Grid* solid, liquid, gaseous biomass, biogenic share of waste, landfill and sewage gas; Electricity from geothermal energy is not presented due to the low volumes of electricitySources: Internet Update BMU-Brochure " Renewable energy sources in figures – national and international development"; Version: November 2007P rovisional figures
EEG 1. April 2000
new EEG1. August 2004
StrEG1. January 1991
EEG effects on technologies

Essential Changes to EEG 2004• Basic structure retained• Higher requirements for power generating
facilities• Improvement of grid management and feed-
in conditions for RE• Increase of financial incentives for
repowering
Improved framework conditions Significant changes in tariffs in some RE-
sectors (e.g. Biogas)
The Renewable Heat Act
• To come into Force on the 1st of January 2009
• Main Elements:Obligation for the use of Renewable
Energy sources for Heat Integration of the Budget for the
Market Incentive Program within the Law
Incentive to the development of district heating networks
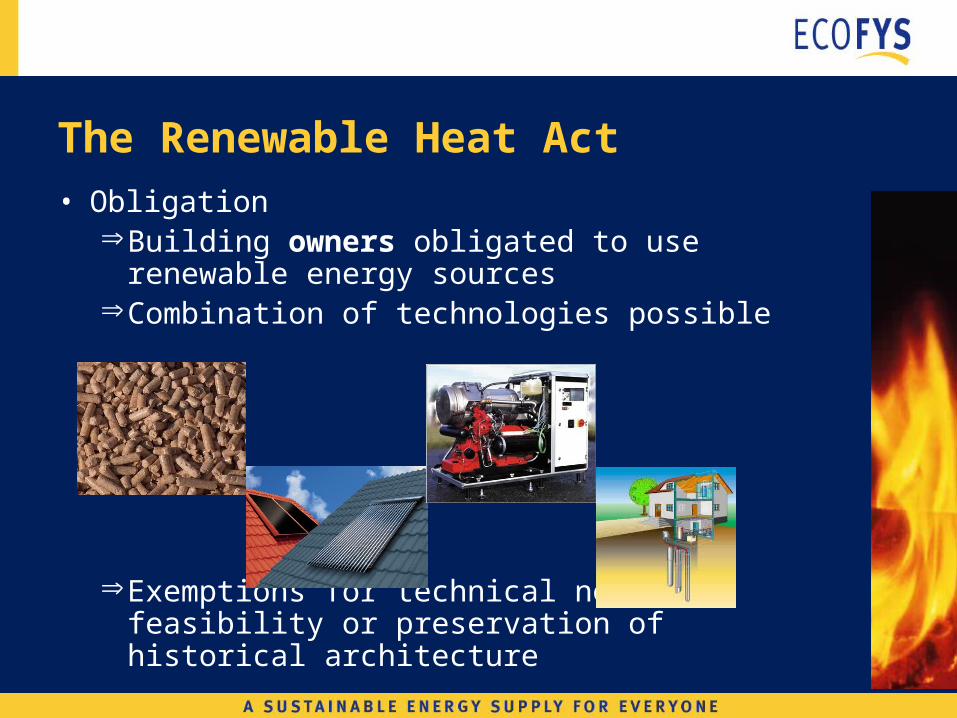
• ObligationBuilding owners obligated to use
renewable energy sources Combination of technologies possible
Exemptions for technical non-feasibility or preservation of historical architecture
The Renewable Heat Act
The Market Incentive Program MAP
• Continuation of MAP 2007 with new focal points and higher budgets2008: 350 mio.€ 2009 - 2012: 500 mio.€ (by Law)
• Additional new bonus system for highly efficient facilities and intelligent coupling of different renewable energy sources
• Additional subsidies for efficient heat pumps
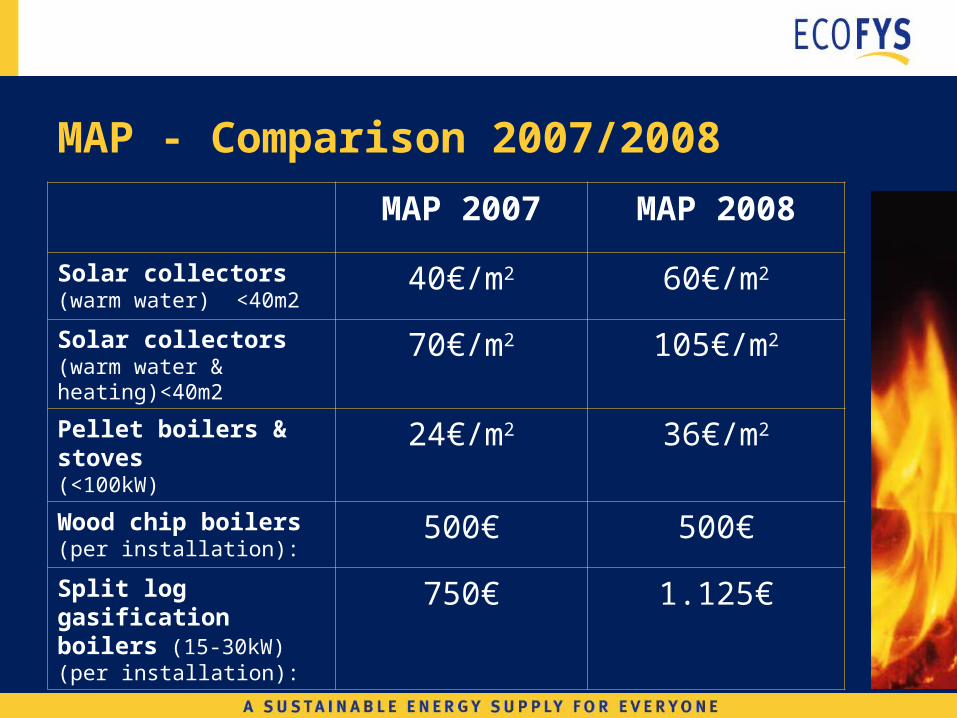
MAP - Comparison 2007/2008
MAP 2007 MAP 2008
Solar collectors (warm water) <40m2
40€/m2 60€/m2
Solar collectors (warm water & heating)<40m2
70€/m2 105€/m2
Pellet boilers & stoves(<100kW)
24€/m2 36€/m2
Wood chip boilers (per installation):
500€ 500€
Split log gasification boilers (15-30kW) (per installation):
750€ 1.125€

MAP – subsidized installations
YearlyCumulative
State: December 2006

Bio-fuels – recent developments
• Total bio-fuels until 2014: 6,25 % energetic
• Support coupled to cross compliance standards (habitat protection, minimum environmental cultivation standards)
• 2011 quota will be revised
• Tax reduction of 3 Ct/l for B-100

Renewable fuels in Germany
Structure of biogenic fuelsin Germany in 2006
Total: 40,4 TWh
Biodiesel72.9%
Bioethanol8.8% Vegetable oil
18.4%
Sources: Internet Update BMU Presentation "Renew able energy sources in f igures – national and international development-" Status: November 2007, provisional f igures

Current Discussions
• Positive energy balance of bioethanol production not always guaranteed
• Sustainability certification system (also for imported biomass)
• Second generation biofuels need further R&D
• Food vs. Fuel

From policy to market – Energy Turnover
Total turnover with renewable energy sourcesin Germany in 2006
Total: approx. € 22.4 billion
Biomass;€ 9,135 m; (40.8%)
Wind energy;€ 5,650 m; (25.2%)
Hydropower;€ 1,180 m; (5.3%)
Geothermal energy; € 590 m; (2.6%)
Solar energy;€ 5,825 m;
(26.0%)
Sources: Internet Update BMU-Brochure "Renew able energy sources in f igures – national and international development" Version: November 2007; provisional f igures

From Policy to Market – Construction Turnover
Turnover from the construction of plants for the use of renewable energy sources in Germany in 2006
Total: approx. € 11.1 billion
Geothermal energy; € 590 m; (5.3%)
Biomass electricity; € 1,350 m; (12.2%)
Photovoltaics;€ 3,735 m; (33.7%)
Solar thermal energy;€ 910 m; (8.2%)
Wind energy;€ 2,900 m; (26.2%)
Biomass heat;€ 1,520 m; (13.7%)
Hydropower;€ 70 m; (0.6%)
Sources: Internet Update BMU-Brochure "Renew able energy sources in f igures – national and international development" Version: November 2007; provisional f igures
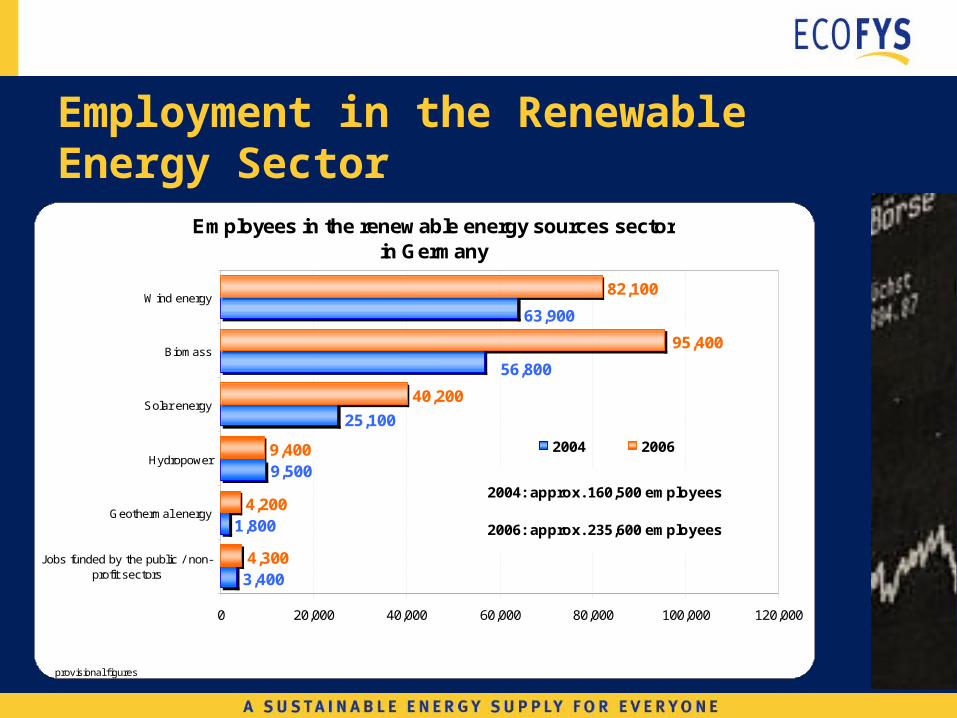
Employment in the Renewable Energy Sector
Employees in the renewable energy sources sectorin Germany
1,800
9,500
4,200
9,400
40,200
82,100
63,900
56,800
3,400
25,100
95,400
4,300
0 20,000 40,000 60,000 80,000 100,000 120,000
Jobs funded by the public / non-profit sectors
Geothermal energy
Hydropower
Solar energy
Biomass
Wind energy
2004 2006
2004: approx. 160,500 employees
2006: approx. 235,600 employees
Sources: BMU-Brochure "Renew able energy: Gross employment 2006, f inal reprot of the proposal " Effect of increased use of renew able energies on the German labour market - Follow up" Version: September 2007provisional f igures

• EU-assigned RES-E target for Germany in 2010 is 12.5% already exceeded in 2007
• National targets for 2020:• Renewable Electricity share: 25-30 %• Renewable Heat share: 14% • Biofuels share: 17% ?
• European Commission attested feed-in tariffs to be an effective and cost efficient instrument
EU quota system of complementary character
Germany in the European context

Conclusion policy measures
• Big future challenges• German approach has been very
successful so far – electricity: targets exceeded
• Technologies are available / strong industry has developed
• Smart support schemes must aim at making technologies competitive
• International cooperation needed

Conclusions
• RE are climate friendly, technologically mature, a „job wonder“, highly popular, approaching competitiveness,… => i.e. a widely accepted option for today AND tomorrow
• Political will / smart support is essential for further market development
• EU Renewable targets: not „burden“ sharing but sharing of new business opportunities

Companies present at this event
• Bekon Energy Technologies GmbH & Co KG Michal Kosuth
• epo GmbH Ansgar Hahn
• IMS Ingenieurgesellschaft Peter Ruland
• ROHRPLAN Ing.-Büro für Anlagen- und Rohrleistungsplanung GmbH Hermman Liess
• MAN Turbo AG Toralf Forstreuter
• Omniwatt AG Torsten Scholl

Further Detailed Information
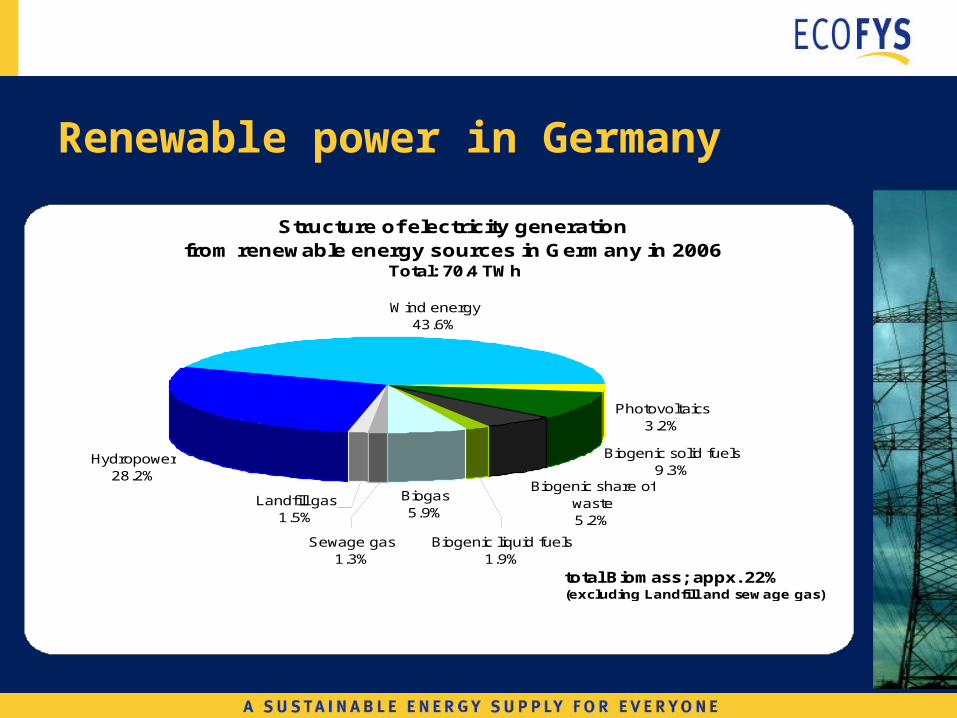
Renewable power in Germany
Structure of electricity generationfrom renewable energy sources in Germany in 2006
Total: 70.4 TWh
Wind energy43.6%
Photovoltaics3.2%
Biogenic solid fuels9.3%
Biogenic share of waste5.2%
Biogenic liquid fuels1.9%
Biogas5.9%
Hydropower28.2%
Sewage gas1.3%
Landfill gas1.5%
total Biomass; appx. 22%(excluding Landfill and sewage gas)
Sources: Internet Update BMU-Brochure " Renew able energy sources in f igures – national and international development" Version: November 2007

Changes to EEG 2004 - Details• Hydropower
Increased tariff for small-scale installations
Ecological criteria for all installationsUniform support period of 20 years
• BiomassIncreased incentives for CHP and Energy
Crops (Biogas)Increased tariff for small-scale
installationsObligation for CHP for installations >5MW

• Geothermal EnergyIncreased tariff for all installationsBonus for CHP Simplification of tariffs
• Wind - OffshoreIncreased tariff Degression increased and delayed
(2015)
Changes to EEG 2004 - Details

Changes to EEG 2004 - Details
• Wind - OnshoreImproved conditions for repoweringImproved grid integration
• PhotovoltaicDecreased tariffsIncreased degression

• Market Incentive Program (MAP) will be integrated in the Law
Investment Subsidies for Renewable Heat: 500 Mio € for 2009 - 2012
Bonus system for highly efficient devices and combination of technologies
Incentives for highly efficient heat pumps
The Renewable Heat Act & the MAP

Renewable heat in Germany
Structure of heat supply fromrenewable energy sources in Germany in 2006
Biogenic share of waste5.5%
Biogenic gaseous fuels3.4%
Biogenic liquid fuels1.6%
Biogenic solid fuels (households)
68.8%
Biogenic solid fuels (industry)
12.6%
Near-surface geothermal energy
2.0%
Deep geothermal energy0.2%
biogenic solid fuels (co-generation power
installations and heating installations)
2.4%
Solar thermal energy3.7%
Sources: Internet Update BMU-Brochure " Renew able energy sources in f igures – national and international development" Version: November 2007; provisional f igures
Total: 89.5 TWh

EU targets & capacities