
Planetary Cratering Mechanics
53
15-3 Planetary Cratering Mechanics John D. O'Keefe and Thomas J. Ahrens* Lindhurst Laboratory of Experimental Geophysics Seismological Laboratory, California Institute of Technology Pasadena, CA 91125 ^PLANETARY CRATERING MECHANICS (California N92-18810 I Inst. of Tech.) 53 p CSCL 03B Unclas aa/9i 0071408 *Correspondent J. Geophys. Res. -1- 2/13/92
Transcript of Planetary Cratering Mechanics

15-3
Planetary Cratering Mechanics
John D. O'Keefe and Thomas J. Ahrens*
Lindhurst Laboratory of Experimental GeophysicsSeismological Laboratory, California Institute of Technology
Pasadena, CA 91125
^PLANETARY CRATERING MECHANICS (California N92-18810I Inst. of Tech.) 53 p CSCL 03B
Unclasaa/9i 0071408
*Correspondent
J. Geophys. Res. -1- 2/13/92

ABSTRACT
To obtain a qualitative understanding of the cratering process over a broad range of
conditions, we have numerically computed the evolution of impact induced flow fields and
calculated the time histories of the major measures of crater geometry (e.g. depth diameter,
lip height...) for variations in planetary gravity (0 to 109cm/s2), material strength (0 to
140 kbar), thermodynamic properties, and impactor radius (0.05 to 5000 km). These
results were fit into the framework of the scaling relations of Holsapple and Schmidt
[1987].
We describe the impact process in terms of four regimes: (1) penetration, (2)
inertia!, (3) terminal and (4) relaxation. During the penetration regime, the depth of
impactor penetration grows linearly for dimensionless times T = (Ut/a) <5.1. Here, U is
projectile velocity, t is time, and "a" is projectile radius. In the inertial regime, T > 5.1,
the crater grows at a slower rate until it is arrested either by strength or gravitational forces.
The crater depth, D, and diameter, d, normalized by projectile radius is given by
D/a =1.3 (Ut/a)°-36 and d/a= 2.0= (Ut/a)°-36. For strength dominated craters, growth
stops at the end of the inertial regime, which occurs at (Yeg/pU2)-0-78i where Yeff is the
effective planetary crustal strength. In gravity dominated craters, growth stops when the
gravitational forces dominate over the inertial, which occurs at T = 0.92 (ga/U2)"^1. In
strength dominated craters, the growth stops at the end of the inertial regime, which occurs
at T = 0.33 (Yefl/pU2)"0-78. In the gravity and strength regimes the maximum depth of
penetration is Dp/a = 1.2 (ga/U2)-0-22 and Dj/a = 0.84 (Y/p U2)-^, respectively.
The transition form simple bowl-shaped craters to complex-shaped crater is found
to result from the transition from strength dominated to gravity dominated craters. The
diameter for this transition to occur is given by dj = Y/pg, and thus scales as g*1 for
planetary surfaces where strength is not strain-rate dependent. This result agrees with
crater-shape data for the terrestrial planets [Chapman and McKinnon, 1986].
J. Geophys. Res. -2- 2/14/92

We have related some of the calculable, but non-observable parameters which
characterize the cratering process (e.g. maximum depth of penetration, depth of
excavation, and maximum crater lip height) to the crater diameter. For example, the
maximum depth of penetration relative to the maximum crater diameter is 0.58, for strength
dominated craters, and 0.28 for gravity dominated craters. These values imply that
impactors associated with the large basin impacts penetrated relatively deeply into the
planet's surface. This significantly contrasts to earlier hypotheses in which it had been
erroneously inferred from structural data that the relative transient crater penetration
decreased with increasing diameter. Similarly, the ratio of the maximum depth of
excavation relative to the crater diameter is a constant = 0.1, for gravity dominated craters,
and ^).2 for strength dominated craters. This result implies that for threshold impact
velocities less than 25 km/sec, where significant vaporization begins to take place, the
excavated material comes from a maximum depth of 0.1 times the transient crater diameter
Moreover, we find apparent final crater diameter is approximately twice the transient crater
diameter at diameters of greater than dt=8.6 Y/pg.
J. Geophys. Res. -3- 2/14/92

INTRODUCTION
The recent decades of planetary observation and exploration have lead to the
conclusion that the impact of solid bodies is one of the fundamental processes in the origin
and evolution of the solar system.While the impact process is conceptually easy to
visualize, the detailed quantitative description of the mechanics has been difficult and
illusive (e.g. Melosh [1989]). The overall objective of this study is to obtain a quantative
understanding of the planetary cratering process over a broad range of conditions.
Specifically the objectives are to establish quantitative scaling relationships for (1) the
temporal evolution of the key measures of the crater geometry (depth, diameter, and lip
height), (2) the maximum depth of penetration and excavation, and (3) the transition
from simple to complex craters. We address these objectives over a broad range of
planetary gravities, material strengths, and impactor sizes (from meters to those that formed
the multiringed basins).
APPROACH AND SCOPE
We modeled the normal impact of spherical projectiles on a semi-infinite planet
surface over a broad range of conditions using numerical techniques. We do not address
the effect of a planet's atmosphere upon the cratering process in the present paper and refer
readers to [Melosh, 1989 Chapt. XI; O'Keefe and Ahrens, 1988; Roddy et al.f 1987;
Schultz and Gault, 1981]. To calculate the impact-induced flow fields within the solid
planets, we used the Eulerian-Lagrangian code developed by Thompson [1979]. The key
equation of state parameters along with the mechanical parameters that were used in the
code to represent a typical silicate impactor and planet are listed in Table 1. The constitutive
model accounted for elastic-plastic hydrodynamic responses [Thompson, 1979]. Other
models are being examined and will be reported upon in the future. We varied some of the
equation of state parameters such as the melt enthalpy and vaporization enthalpy, and also
J. Geophys. Res. -4- 2/13/92

the mechanical properties such as the yield strength. In all cases, the material properties of
the impactor and planet were identical.
The impact parameters and variables are listed in Table 1 along with the range over
which they were varied We nondimensionalized these using the formalism of Holsapple
and Schmidt [1987]. The magnitudes of the four dimensionless parameters ga/U2,
Y/pU2, Hm/U2 and Hvap/U2 are measures of the dominant mechanisms controlling the
cratering process. We varied these parameters over a range of conditions so as to
determine when each of these was the dominant parameter that described the impact
process.
The inverse Froude number, ga/U2, is a measure of the gravitational forces relative
to the pressure forces. The inverse Cauchy number, Y/pU2, is a measure of the planetary
strength relative to the pressure forces; and the melt, Hm/U2. and vaporization, Hvap/U2,
numbers are measures of the relative importance of melting and vaporization. In
determining the range of the inverse Froude number, we had a choice of varying either the
projectile radius or the gravitational acceleration; for ease of computation, we fixed the
radius and varied the gravitational acceleration over six orders of magnitude. This is
equivalent to varying the impactor radius from 5 m to 5000 km. In determining the range
of the vaporization number, HyajAJ2, we restricted the impact velocities to 12 km/s so as to
not get into the impact regime where there are significant vaporization effects. This limits
the validity of the scaling laws to velocities less than 30 km/s for typical silicates. We have
studied the effects of nigh speed impacts (>30 km/s) and will report in detail on these
elsewhere [O'Keefe and Ahrens, 1989].
The results of the computations represent a very large amount of computer output
with over -104 variables being calculated for each time step. In this paper we will report
on the geometrical measures of the cratering process such as the depth, diameter and lip
height The depth is defined as the distance from the initial planetary surface and the
planetary surface at a given time at the centerline of the impact; the diameter is defined as
J. Geophys. Res. -5- 2/13/92
the distance between the interface between the impactor and planetary surface at the initial
planetary surface height; the lip height is measured relative to the original planetary surface
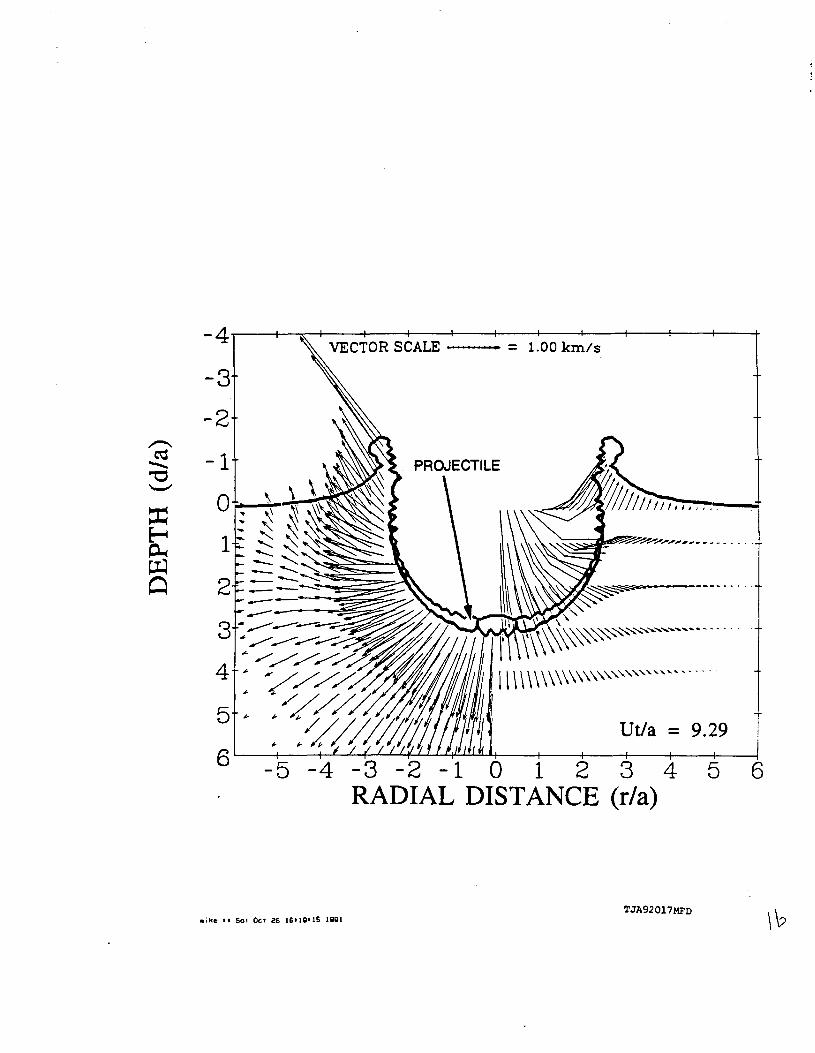
level (e. g. see figure 1). The dimensionless depth and diameter histories are summarized
in Table 2. In addition, we have included a series of detailed flow field plots; these
represent the development of a simple bowl shaped crater (figure 1) and a complex crater
exhibiting central peak and ring formation (figure 2) .To determine the displacement of
planetary material during the cratering process, we placed massless tracer particles at
various positions and computed their trajectories which are also shown.
CRATER SCALING REGIMES
The cratering process can be described in terms of at least four temporal regimes;
penetration, inertia!, terminal and relaxation. Schmidt and Holsapple called these first three
regimes the early stage, intermediate and late. The numerical approach taken here can be
used to describe the first three; the fourth, the terminal regime is the result of long term
equilibration and requires a different analytical approach such as viscous relaxation
methods (e.g. Melosh [1989], Chapt. 8). In the following section we will describe the first
three regimes and determine the numerical values of the parameters in the Holsapple and
Schmidt [1987] scaling laws. We will describe the depth, diameter, and other geometrical
measures in that order. The scaling laws and the numerical values of the parameters derived
from the present calculations are listed in Table 3.
PENETRATION REGIME
The penetration regime is characterized by the transfer of the kinetic energy of the
projectile to the planetary surface. In the case where the impactor and planetary surface
have similar properties, about half of the impactor kinetic energy is transferred to the planet
during the penetration regime [O'Keefe and Ahrens, 1977]. During this time, the impactor
drives a strong shock wave into the planet and also deforms and lines the growing crater
J. Geophys. Res. -6- 2/13/92

cavity wall (Figures la,b). The material properties of the impactor and the planet and the
planet's gravitational acceleration are not important during this time, except for relative
differences in density between the impactor and the planet [Holsapple and Schmidt, 1987].
Depth
The crater depth grows linearly with time in the penetration regime. Shown in
Figure 3 is a plot of the evolution of the interface between the impactor and the planet at the
centerline of impact for a wide range of impact conditions. Note that all the cases fall on a
single line independent of strength or gravitational acceleration. This linear growth is
expected during the early times when the shock at the interface is nearly planar and is
predicted from planar shock wave theory. The depth(D)/impactor radius(a) evolves as
D/a=j(Ut/a) (1)
where U is the impact velocity. The factor of two comes from the fact that upon impact of
bodies of like impedances, the interface velocity is one-half the impactor velocity.
The depth grows linearly with time until it enters the inertia! regime This was
predicted by Holsapple and Schmidt [1987] to occur at dimensionless time, T, of 5.1 for
like impacts and this is substantiated in Figure 3.
Diameter
The diameter does not have a simple growth law during the penetration regime. The
impact of a near spherical impactor will produce small amounts of jetting and vaporization
near the initial point of impact even at low velocities; the magnitude depends sensitively on
the details of the impactor-planetary surface geometry [Kieffer, 1976]. The penetration
regime for diameter ends when the maximum lateral extent of the impactor penetrates the
surface which, from geometrical considerations for a spherical impactor, occurs at
dimensionless time of
t=Ut/a= 2 (2)
J. Geophys. Res. -7- 2/13/92

Shape
The shape of the transient cavity changes rapidly during the penetration regime. The
depth grows more rapidly than the diameter during the penetration time for the depth, and
the scaling of the evolution of the diameter to depth is given from the ratio of equations 1
and 6
d/D = 4.0 (Ut/a )•<>•<* ; l < ( U t / a ) < 5 . 1 (3)
INERTIAL REGIME
The inertia! regime is characterized by the quasi-hemispherical expansion of the
crater cavity. In this regime, the geometry of the cavity does not change, and the projectile
is deformed into a thin hemispherical shell that lines the transient crater cavity. The strong
shock that was attached to the projectile during the penetration time has now propagated
away from the the cavity region [Bjork, 1961; O'Keefe and Ahrens, 1977]. Bjork called
this regime the detached shock regime. As in the penetration regime, the material strength
properties and gravity do not play a role in the evolution, however, the termination of this
regime occurs when either strength or gravitational effects arrest crater growth.
Depth
The depth grows as a simple power law in the inertia! regime and it is independent
of either strength or gravitational acceleration (see Figure 3). A similar result for the depth
was found by Holsapple and Schmidt [1987 Figure 4] for a variety of impact conditions.
Eq. 4 is obtained by fitting the depth versus time curve (Fig. 3) in the inertia! regime. The
scaling law is given by
(4)
J. Oeophys. Res. -8- 2/13/92

The magnitude of the inertia! regime exponent (S=0.36) is related to the coupling
coefficient of Holsapple and Schmidt [1987] by the relation
H = S/d-S) (5)
Eq. 5 gives \L = 0.56, which is consistent with the range of values found by Holsapple
and Schmidt [1987] for a range of impact conditions. In the following sections all of the
scaling laws will have exponents that are functions of \L and thus are related to the exponent
in the inertial regime.
Diameter
The diameter also grows as a simple power law in the inertial regime (e.g. Figure
4). The scaling for the diameter from a fit to the results in Fig. 4 is given by
d/a = 2.0 (Ut/a)0-36 (6)
Note that the exponent is the same for both the depth and diameter.
Shape
The shape is similar throughout the duration of the inertial regime. The ratio of the
diameter to depth is
d/D = 1.6 : l<(Ut/a)<tmp (7)
where tmp is the time of maximum penetration. This time is specified in Eq. 8 below.
TERMINAL REGIME
The growth in inertial regime is arrested by strength and gravitational forces, and
this marks the beginning of the terminal regime. In the case of simple craters (Figure 1),
the final shape of the crater is reached at the end of the inertial regime with the exception of
the collapsing and folding over of the crater lip and minor elastic rebounding. In the case of
complex craters (Figure 2), the end of the inenial regime marks the beginning of a series of
complex motions which subsequently occur. These motions include the rebounding of the
crater floor and the formation of central peaks and the collapse and propagation of the crater
lip to form ringed craters.
J. Geophys. Res. -9- 2/13/92

Depth
The beginning of the terminal regime for crater depth occurs at the time of
maximum penetration, tmp- This time, in the case where the gravitational forces dominant
over the strength forces, is given by
Utmi/a = 0.92(gaAP)-0-61 (8)
where the exponent magnitude is given by (l4ji)/(2+n). The proportionality constant is
obtained by fitting the results shown in Fig. 3.
The maximum in the depth of penetration in the gravity dominated case is a
function of the inverse Froude number and is obtained from Figure 5. The associated
scaling law is given by
Dp/a = 1.2 (gaAJ2 )-0-22 (9)
where the exponent is given by p/(2+n) and the proportionality contant is obtained from
the results shown in Figure 5.
The beginning of the terminal regime or the time of maximum penetration imp, in
the case where strength forces are dominant is given by
Utmp/a = 0.33 (Yeff/pU2 )-0.78 (10)
where the exponent is (l+H)/2 Here Yeff is equal to twice the maximum shear strength.
For the crusts of typical cratered planetary surfaces, we expect Yeff will be significantly
diminished from data from tests on undamaged rock on account of shock-induced cracking
(e.g. Simmons et al. [1973] and Ahrens and Rubin [1992]). The temporal evolution in the
strength dominated regime is shown in Fig. 6 from which Eq. 10 is derived by fitting the
peaks of D/a versus Ut/a relations shown in Fig. 6.
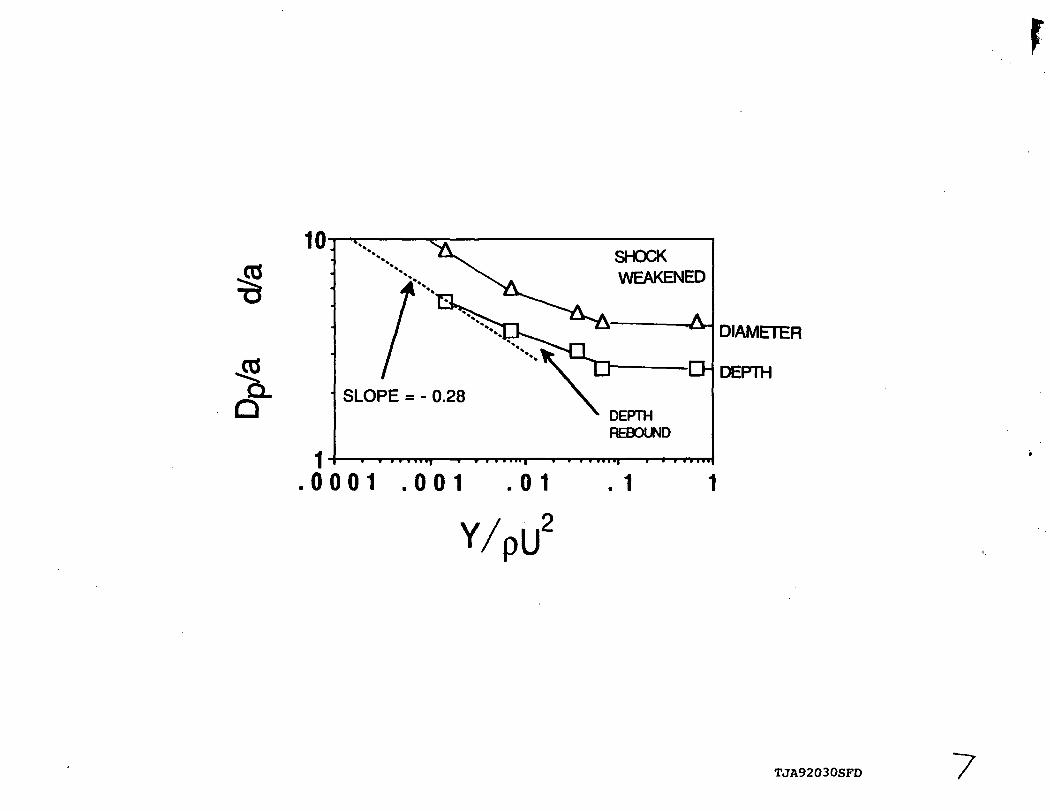
The maximum depth of penetration in the strength dominated case is a function of
the inverse Cauchy number and is shown in Figure 7. The depth follows a power law
with an expected slope given by n/2 = 0.28 until the inverse Cauchy number approaches ~
10"2. This change in scaling is a result of increased importance of shock weakening of the
planetary material in the cratering process. Weakening is a result of the irreversible work
J. Geophys. Res. -10- 2/13/92
done in by the shock and subsequent unloading process and as a result of the post-shock
deformation of the rock surrounding the crater. The irreversible work will result from both
thermal shock heating and mechanical fracturing effects and is more intense close to the
impact point where the high shock stresses are experienced. The importance of shock
weakening depends upon the planetary strength, thermal state, and impact velocity. In the
case of weak planetary crusts, and low impact velocities, the volume of the final crater is
much greater than the shock weakened region and the effect is minor. However in the case
of very strong initial crustal strengths, high surface temperatures or high (>30 km/sec)
impact velocities, the extent of the shock weakening is comparable to the crater size, and
the shock weakening effect can dominate late crater growth and the entire size and shape of
the final crater.
Shock weakening was modeled as thermal weakening and did not account for
fracturing, which is currently an area of active interest (e.g.[Ahrens and Rubin, 1992;
Asphaug et al., 1991; Housen and Holsapple, 1990]) and the present work should be
extended to include that effect Our code computed the temperature field at each time step.
The local temperature was used to compute the degree of thermal weakening by reducing
the local strength in proportion to the difference between temperature and the melt
temperature where the strength vanishes. The results of the code runs are plotted in Fig. 7
for both depth of penetration and diameter.
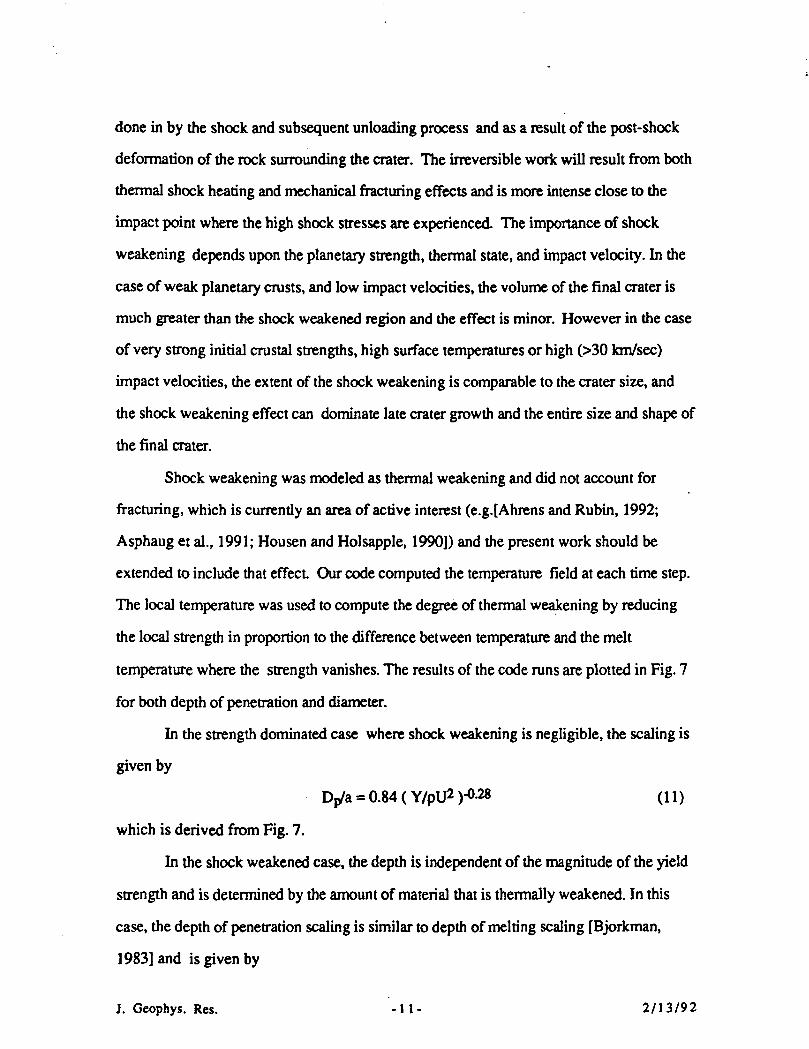
In the strength dominated case where shock weakening is negligible, the scaling is
given by
Dp/a = 0.84 (Y/pU2 )-°-28 (11)
which is derived from Fig. 7.
In the shock weakened case, the depth is independent of the magnitude of the yield
strength and is determined by the amount of material that is thermally weakened. In this
case, the depth of penetration scaling is similar to depth of melting scaling [Bjorkman,
1983] and is given by
J. Geophys. Res. -11- 2/13/92

Dp/a = 0.70 (Hm/U2)-0-28 (12)
where Hm is the enthalpy required to induce shock melting, which in the case of thermal
weakening is equal to the enthalpy to melt as referenced to the planets' ambient surface
condition. The constants in Eq. 12 are obtained from fitting the calculational results of Fig.
8. The exponent is n/2, which is identical to the strength case.
The condition for the transition between the strength and the shock weakened
regimes can be obtained by equating Eqs. 11 and 12, which gives
Y/pHm=0.25 (13)
A general relationship for depth that accounts for both regimes can be obtained by
adding Eqs. 11 and 12 which yields
Dp/a = Ks ( Y/pU2 )-0-28 +KSW (Hm/U2 )-0-28 (14)
where Ks = 0.84 and Ksw = 0.7. This relationship can be plotted over a range of values
relevant to planetary surfaces and is shown in Fig. 8. Eq. 14 implies an effective strength
which accounts for shock weakening which can be defined as
Yeff = Y { 1 + (KSW/KS) (Y/pHm )0.28}(-1/0.28) (15)
This result is plotted in Figure 9.
A general interpolation relationship of the form suggested by Holsapple and
Schmidt [1987] can be used to span the gravity and strength regimes
Dp/a = Ks (ga/U2 )-0-22 { (Kg/Ks)-0-22 + (Y/pU2)(0.22/0.28) (ga/U2)-l J-0.22 (16)
where Kg = 1.2.
Replacing the shear strength by the effective strength defined in Eq. 15
leads to a more general scaling relationship that includes gravity, strength and shock
weakening effects
Dp/a = Ks (gaAJ2 )-0-22 {(Kg/Ks)-0-22 + ( (Y/ptj2) { 1 +
(KSW/KS) (Y/pHm )0-28 J.l/6.28) (0.22/0.28 ) (gaAJ2)-l}-0-22} (17)
The maximum depth of penetration of projectiles from giant impacts has been a
topic of much debate in the literature (e.g. Grieve et al.[1981]). The tracer particles
J. Geophys. Res. -12- 2/13/92

employed in the calculations help elucidate the motions of material in the cratering process.
Referring to Figs. 1 and 2, we see that near the centerline of impact, planetary material is
driven downward and is not ejected in the cratering process. As one moves from the
centerline towards the crater lip, there is a region in which the planetary material is
essentially stagnated against the outwardly moving cavity wall; this stagnated region,
delineated by layers of tracer particles, shows a lower layer of particles being driven
downward and an upper layer moving upward and being excavated (see Fig. Ic). The
scaling laws for the maximum depth of excavation is given by
Dex/a = 0.17 (Y/pU2)-0-2* (18a)
and
Dex/a=K(ga/U2)-0-22 (18b)
for the strength dominated regime. Here the exponents for strength and gravity scaling are
given by Eqs. 11 and 12. The proportional constant is obtained from Figs. 2 and 3.
Diameter
The beginning of the terminal regime for the diameter occurs when the crater lip
stops expanding laterally. In the case where the gravitational forces are dominant, this
occurs when
Ut/a=1.8(ga/U2)-0.61 (19)
where the exponent magnitude is given by (l+n)/(2+n) and the proportionality factor in
this equation and those of Eqs. 20 and 21, below, come from fitting the results of Fig. 4.
An example of the crater morphology at the time the crater cavity has reached its
maximum diameter in the gravity dominated case is shown in Figure 2c. The cavity
maximum diameter is a function of the inverse Froude number and is given by
dm/a= ^Kga/U2)-0-22 (20)
where the exponent is \i/(2+\L).
At the time the crater cavity has reached its maximum diameter, the crater lip has
reached its maximum height (figure 2c). This height scales as
J. Geophys. Res. -13- 2/13/92

H//a= 0.53 (gaAJ2)-0-22 (21)
where the exponent is again |0/(2+n)where the proportionality factor was obtained from
plots such as Fig. 2c.
The crater lip will collapse and produce an outwardly propagating surface wave
which rapidly increases the apparent diameter of the crater (Figs. 2c-2d). Simultaneously,
the crater floor moves upward and an inner crater lip forms. Note that neither the outer ring
nor the inner ring correspond to the maximum diameter of the transient crater.
The diameter of the outer ring scales as
d/a = 4.28 (gaAJ2)-0-22 (22)
where as before the exponent is given by \i/(2+\i). The proportionality factor comes from
Eq. 4.
When strength dominates the cratering process, the crater growth ends in the inertia!
regime with only a small amount of elastic rebounding occurring followed by long term
crater relaxation. The time of termination of crater formation is given by
Ut/a = 0.33(Yefl/pU2)-0-78 (23)
Note that this time is identical to that for the depth. The parameters come from fitting the
results of Fig. 6.
The maximum or final crater diameter in the strength dominated regime is given by
d/a=1.4 (Y/pU2)-0-2* (24)
Here we employed the results shown in Fig. 7. In the shock weakened regime the final
diameter is given by
d/a= 1.3 (Hm/U2)-0-2* (25)
where the exponent is n/2 .
In a similar manner to the depth, a general interpolation relationship spanning the
strength and shock weakened regimes is given by
d/a = Ks (Y/pU2)-^ + Ksw (Hm/lPj-O.M , (26)
J. Geophys. Res. -14- 2/13/92

where for the diameter Ks= 1.4(Eq. 24), andKsw= 1.3(Eq. 25).
Transition from Simple to Complex Craters
The transition from simple to complex craters is the transition from strength-
dominated to gravity-dominated craters. A general interpolation relationship for the crater
diameter which spans both the gravity and strength regimes is given by
d/a = Ks (ga/U2)-0-22 { (Kg/Ks)-0-22 + {(Y/pU2){l +
(KSW/KS) (Y/pHm )°-28 H/0-28) (0.22/0.28) (ga/U2)-1}-0-22 (27)
where for the diameter Ks = 1.4 (Eq. 24), and Ksw = 1.3 (Eq. 25), and Kg = 4.28 (Eq.
22). This result is plotted in Figure 10.
The transition diameter, or equivalently, the intersection between the strength and
gravity dominated regimes can be readily derived. The transition diameter is obtained by
equating Eqs. 22 and 24, and solving for the transition impactor radius. Substituting this
radius into Eq. 22 yields the following simple relationship
dt= (Kdg/Kds)«2+u)Ai))Y/pg (28)
where K^g is the gravity proportionality constant in Equation 23 and K^g is the strength
proportionality constant in Equation 25, and using those numerical values we obtain
(Kdg/Kds)((
2+H)M)) = 8.6. Note that the transition diameter is directly proportional to the
strength and inversely proportional to gravitational acceleration. This result is compared in
Fig. 11 to the transition diameters as a function of surface gravity for the terrestrial planets
and various satellites [Chapman and McKinnon, 1986; Schenk, 1989].
The transition from simple to complex craters has been studied for some time using
static models to predict the slumping of freshly formed craters [Melosh, 1977; Melosh and
McKinnon, 1978]. Melosh [1977] found, using a perfectly plastic constitutive relation,
that the criterion for stability of freshly formed bowl-shaped craters is given by
pgD,/Y = Km 5< Km <10 (29)\
J. Geophys. Res. -15- 2/13/92

We will show that Eq. 29 can be cast in the form of Eq. 28 and leads to similar
conclusions as those drawn by Melosh. Eq. 29 can be solved for the maximum depth of
penetration and that result is used in Eq. 11 to determine the transition impactor radius.
Substituting this into Eq.24 for the diameter yields
where KDS is the strength proportionality constant in Eq. 11.Equating Eq. 28 and 30 gives
the following expression for the Melosh constant
Km = KDsQCdgdt/Kd^C+iMO (31)
For the numerical values found in our calculational results, we obtain a value of Km = 8.9,
which is in agreement with Melosh's range of values (5=>10).
Shape. Observables. and Inferables
In studying cratering on remote planetary surfaces, the observables are the surface
morphology of the craters. In the following section we will relate some of the transient
non-observable aspects of the cratering process (e.g. depth of penetration, excavation ....)
to the usual observable quantity — crater diameter.
The maximum transient cavity diameter relative to the final crater diameter in gravity
dominated craters is given by dividing Eq. 20 by Eq. 22, which yields
dm/d = 0.5 (32)
and for strength dominated craters, the maximum cavity diameter is equal to the final
diameter, except for minor crater rebounding. Notably, the maximum transient diameter is
the maximum diameter in this case,
dtm/d = 1 (33)
The maximum crater lip height relative to the crater diameter in gravity dominated craters
can be obtained by dividing Eq. 21 by Eq. 22 to get
H//d = 0.12 (34)
J. Geophys. Res. -16- 2/13/92

The ratio of the time for the crater lip to collapse (tip) to the time for the crater floor
to rebound Or) in the gravity dominated regime can be obtained from Figure 4 and is given
by
ytr = 2 (35)
The depth of penetration relative to the crater diameter for gravity-dominated
craters can be obtained by dividing Eq. 9 by Eq. 22, which yields
Dp/d = 0.28 (36)
and for strength dominated craters by dividing Eq. 11 by Eq. 24, which yields
Dp/d = 0.58 (37)
In a similar manner.the depth of excavation relative to the crater diameter for
gravity dominated craters can be obtained by dividing Eq. 18a by Eq. 22, which yields
Dex/d = 0.1 (38)
and for strength dominated craters by dividing Eq. 18b by Eq. 24
Dex/d = 0.2 (39)
Note that the depth of penetration and excavation relative to the crater diameter are a
factor of two less in the gravity dominated cases because the crater diameter is larger as a
result of the lip collapse and lipwave propagation. The above result for the depth of
excavation is compared to field data from terrestrial craters in Fig. 12. The maximum depth
of penetration and depth of excavation as a function of crater diameter are plotted for the
various planets in Fig. 13. As an example, for craters in the range of 150 km in diameter,
which is in the estimated size for the K-T event [Alvarez et ah, 1980], the maximum depth
of penetration is 42 km while the maximum depth of excavation is -15 km. Impacts of
this magnitude appear to open the possibility of impact-induced volcanism from the mantle.
CONCLUSIONS
The objective of this study was to obtain a quantitative understanding of the
cratering process over a broad range of conditions. In accomplishing this objective we
J. Geophys. Res. -17- 2/13/92

numerically computed the evolution of impact induced flow fields and calculated the time
histories of the major measures of crater geometry (e.g. depth, diameter, and lip height) for
variations in planetary gravity, material strength, thermal properties and impactor size. The
results of these calculations are summarized in Table 2. These results were fit with the
scaling laws of Holsapple and Schmidt [1987]. In all of the measures we examined, these
scaling laws were found to be in good agreement with the numerical results. From this
experience, we expect this agreement to hold in general.
We have described the impact process in terms of four regimes: (1) penetration, (2)
inertia!, (3) terminal, and (4) relaxation. The scaling laws for each of the first three
regimes are given in Table 3. In the penetration regime the depth evolves linearly with
time. In the inertia! regime, the scaling of the crater geometry is a function of the coupling
coefficient (p.) as defined by Holsapple and Schmidt [1987] and was shown by them to be
related to the slope of the growth of the depth and diameter in that regime. The results of
this paper confirm that relationship.
In studying cratering on remote planetary surfaces, the primary observables are the
crater diameter including the diameters of the multiple rings, the presence of central peaks
and pits and the relaxed crater depth. We have related several key transient non-observable
aspects of the cratering process (e.g. maximum depth of penetration, depth of excavation,
and maximum crater lip height) to the crater diameter. For example, the maximum depth of
penetration relative to the crater diameter is -0.58 for strength dominated craters and -0.28
for gravity dominated craters. This implies that impactors associated with the large basin
impacts penetrated deep into the planetary surfaces. In examining the details of the
rebounding of the depth in the gravity dominated regime, we found that the initial planetary
material layering sequence is reconstructed in the rebound process. This phenomenon thus
accounts for apparent contradictions of field data and experiments conducted on the
geotechnical centrifuge [Schmidt and Holsapple, 1981], that the impactor did not penetrate
very deep because the layering sequence was relatively undisturbed. In a similar manner
J. Geophys. Res. -18- 2/13/92

to the penetration, the maximum deep of excavation relative to the crater diameter is ~0.1
for gravity dominated craters and -0.2 for strength dominated; this implies that for impact
velocities less than the threshold for significant vaporization, the excavated material can
have rather deep origins for large diameter basin-forming craters
The transition from simple bowl shaped craters to complex craters was analyzed.
This occurs at the transition from strength to gravity dominated craters. The transition
diameter is proportional to Y/pg where the proportionality constant is ~8.6. This constant
is in the range of values (5-10) found by Melosh [1977] using a gravitational plastic
instability model.
Acknowledgments. Research supported under NASA Grant NSG 1953. We
appreciate the computational assistance of M. Lainhart and many helpful discussions with
K. Holsapple and R. Schmidt. Contribution No. 4859, Division of Geological and
Planetary Sciences, California Institute of Technology, Pasadena, 91125.
J. Geophys. Res. -19- 2/13/92

REFERENCES
Ahrens, T. J., and A. Rubin, Impact-induced tensional failure in rock, J. Geophys. Res.,
submitted 1992.
Alvarez, L. E., W. Alvarez, F. Asaro, and H. V. Michel, Extraterrestrial cause for the
Cretaceous-Tertiary extinction, Science, 208,1095-1108,1980.
Andrews, R. J., Characteristics of debris from small-scale cratering experiments, in Impact
and Explosion Cratering, edited by D. J. Roddy, R. O. Pepin and R. B. Merrill,
pp. 1089-1100, Pergamon Press, New York, 1977.
Asphaug, E., H. J. Melosh, and E. Ryan, A numerical laboratory for fragmentation
studies: Some Insights into collisional processes and outcomes, LPSC (Abstract),
XXII, 37-38, 1991.
Bjork, R. L., Analysis of the formation of Meteor Crater, Arizona. A preliminary report,
/. Geophys. Res.,66, 3379-3387, 1961.
Bjorkman, M. D., Dependence of crater melt on impact velocity, Eos Trans. AGU
(abstract), 64,747,1983.
Chapman, C. R., and W. B. McKinnon, Cratering of planetary satellites, in Satellites,
edited by J. A. Burns and M. S. Matthews, pp. 492-580, 1986.
Frederikson, K., A. Duba, D. J. Milton, and M. S. Balasundaram, Lonar Lake, India: An
impact crater in basalt, Science, 180, 862-864,1973.
Gault, D. E., W. L. Quaide, and V. R. Oberbeck, Impact cratering mechanics and
structures, in Shock Metamorphism of Natural Materials, edited by B. M. French
and N. M. Short, pp. 87-100, Mono Press, 1968.
Grieve, R. A. F., P. B. Robertson, and M. R. Dence, Constraints on the formation of ring
impact structures, based on terrestrial data in, in Multi-Ring Basins, Proc. Lunar
Planet. Sci., vol. 12A, edited by P. H. Schultz and R. B. Merrill, pp. 37-57,
Pergamon Press, 1981.»
J. Geophys. Res. -20- 2/14/92
Holsapple, K. A., and R. M. Schmidt, Point-source solutions and coupling parameters in
cratering mechanics, /. Geophys. Res., 92, 6350-6376,1987.
Housen, K. R., and K. A. Holsapple, On the fragmentation of asteroids and planetary
satellites, Icarus, 84,220-253,1990.
Kieffer, S. W., Impact Conditions Required for Melt by Jetting in Silicates. Impact with
Explosion Cratering, Pergamon Press, 1-751,1976.
Melosh, H. J., Crater modification by gravity: A mechanical analysis of slumping, in
Impact and Explosion Cratering, edited by D. J. Roddy, R. O. Pepin and R. B.
Merrill, pp. 1245-1260, Pergamon Press, New York, 1977.
Melosh, H. J., Impact Cratering, A Geologic Process, Oxford University Press, New
York, 1-245,1989.
Melosh, H. J., and W. B. McKinnon, The mechanics of ringed basin formation, Geophys.
Res. Lett., 5, 985-988, 1978.
Offield, T. W;, and H. A. Pohn, Deformation at the Decaturville impact structure,
Missouri, in Impact and Explosion Cratering, edited by D. J. Roddy, R. O. Pepin
and R. B. Merrill, pp. 321-341, 1977.
O'Keefe, J. D., and T. J. Ahrens, Impact induced energy partitioning, melting, and
vaporization on terrestrial planets, Proc. Lunar Sci. ConfSth, 3357-3374,1977.
O'Keefe, J. D., and T. J. Ahrens, Large scale impact on the earth with an atmosphere,
Abstract, Lunar and Planetary Science, XIX, 887-888,1988.
O'Keefe, J. D., and T. J. Ahrens, The effects of gravity, size, and velocity on the scaling
of crater gemetry and the transition from simple to complex craters, LPSC, XX,
810-811, 1989.
Roddy, D. J., Large-scale impact and explosion craters: Comparisons of morphological
and structural analogs, in Impact and Explosion Cratering, edited by D. J. Roddy,
R. O. Pepin and R. B. Merrill, pp. 185-246, Pergamon Press, 1977.
J. Geophys. Res. -21- 2/14/92

Roddy, D. J., S. H. Schuster, M. Rosenblatt, L. B. Grant, P. J. Hassig, and K. N.
Kreyenhagen, Computer simulations of large asteroid impacts into oceanic and
continental sites—Preliminary results on atmospheric, cratering and ejecta
dynamics, Int. J. Impact Engng., 5, 525-541, 1987.
Schenk, P. M., Crater formation and modification on the icy satellites of Uranus and
Saturn: Depth/diameter and central peak occurrence, J. Geophys. Res., 94, 3813-
3832, 1989.
Schmidt, R. M., and K. A. Holsapple, An experimental investigation of transient crater
size, Abstracts, Lunar and Planetary Science, XII, 934-936,1981.
Schultz, P. H., and D. E. Gault, Impact ejecta dynamics in an atmosphere: Experimental
results and extrapolations, Geol. Soc. Am. Spec. Paper, 190,152-174, 1981.
Shoemaker, E. M., and R. E. Eggleton, Terrestrial features of impact origin, Proc.
Geophys. Lab., Lawrence Radiation Laboratory Cratering Symp., Lawrence
Radiation Laboratory Rept. UCRL-6438, pt. 1, paper A27, p., 1961.
Shoemaker, E. M., Impact mechanics at Meteor Crater, Arizona, in Moon, Meteorites, and
Comets, edited by B. M. Middlehurst and G. P. Kuiper, pp. 301-336, Univ. of
Chicago Press, 1963.
Simmons, G., T. Todd, and H. Wang, The 25-km discontinuity: Implications for Lunar
History, Science, 182, 158-161, 1973.
Thompson, S. L., Sandia National Labs, Albuquerque, N.M., SAND 77-1339, p., 1979.
J. Geophys. Res. -22- 2/14/92

Table 1. Scope of Parameters Studied for Impact ofSilicate Projectile on a Planetary Halfspace.
Parameter Symbol Values Employed Units
impact velocityplanetary gravity
densitybulk modulusGruneisen coefficientmelt enthalpyvaporization enthalpy
yield strength
Ug
pEYHmHyap
Y
12(U.KP.IOMO6
2.77.6 xlO11
2.01.1 x 10*01.2x1011,1.2x1012,8.0 x 1012
0,0.24,2.4,5.6, 24, 28,140,
km/secge(980cm/s2)
g/cm^dynes/cm2
—ergs/g
ergs/g
240,2400 kbarinverse Froude Numberinverse Cauchy Numbermelt numbervaporization number
ga/U2
Y/pU2Hm/U2
0,3.4x10-7,3.4x10-5,3.4x10-3,0.340, 7.2x10-5,7.2x10-*,7.2x 10-3,0.0367.6 x 10-30.08, 0.8, 1.2

Table 2. Normalized Crater Diameter and Depth, versus, Tfor different values of ga/U2, and Y/pU2. The impact velocity, U,
was 12 km/s except where indicated.
ga/U2Y/pU2 d/a D/a
0ft
ft
0 (U=10km/s)a
it
ti
n
ti
0 (U=50km/s)ait
ti
it
tt
ti
0(U=100km/s)aii
»t
it
tt
rt
tt
it
ii
ti
3.41xlO-7
11
ti
ti
ti
ti
tt
ti
ft
ft
tt
ti
3.41xlO-7
it
0.00.00.0
0.00.00.00.00.0
0.00.00.00.00.00.0
0.00.00.00.00.00.00.00.00.00.0
1.4x10-31.4x10-31.4x10-31.4xlO-3
1.4x10-31.4x10-31.4x10-31.4x10-31.4x10-31.4x10-31.4x10-31.4x10-31.4x10⁻³
7.2x10-37.2x10-3
3.4005.1005.7006.5006.5006.6007.4007.8008.8009.0009.0009.0009.000
3.5004.500
0.431.071.53
0.20.82.03.04.0
0.41.02.02.64.05.2
0.21.02.02.64.05.06.07.08.09.5
1.653.003.353.753.753.954.404.755.155.205.105.105.00
1.7002.700
0.8702.1403.119
0.41.65.0
12.016.0
0.82.04.06.0
19.050.0
0.412.004.006.00
20.0040.0075.00
105.00130.00200.00
3.189.28
12.2816.5016.5018.5023.3029.6441.0055.9075.4094.00
113.00
3.4807.700

ga/LJ2
Table 2. Normalized Crater Diameter and Depth, versus, Tfor different values of ga/U2, and Y/pU2. The impact velocity,
U, was 12 km/s except where indicated.(continued)
Y/pU2 d/a D/a
II
II
It
It
tt
It
•1
M
3.41xlO-7
it
it
it
it
tt
it
it
it
11
3.41x10⁻⁵it
it
tt
•t
it
it
it
it
3.41x10⁻³it
it
it
It
it
it
ii
it
it
it
3.41xlO-3
it
it
7.2x10-37.2x10-37.2x10-37.2x10-37.2x10-37.2x10-37.2x10-37.2x10-3
3.6xlO-2
3.6x10-23.6x10-23.6x10-23.6x10-23.6x10-23.6x10-23.6x10-23.6x10-23.6x10⁻²
0.00.00.00.00.00.00.00.00.0
0.00.00.00.00.00.00.00.00.00.00.0
6.2xlO-5
6.2x10-56.2x10-5
5.0005.5005.700 -6.0006.0005.7005.6005.400
3.3004.3504.6004.6004.5004.2004.0003.8002.1001.000
3.0003.5003.7003.7503.6003.4003.2002.800
1.7502.9003.1002.9502.7002.5002.4502.3002.2001.500
0.371.162.172.601.673.023.534.054.42
0.401.902.633.254.104.203.101.401.204.103.45
0.750.401.20
10.56014.80017.60022.10026.40030.48034.30037.400
3.3608.900
13.30017.20021.02024.40026.80029.50034.08049.600
0.8252.3505.5907.7003.600
10.10014.18019.00024.000
0.8254.4807.890
13.27922.77032.00041.20050.6002.360
27.60036.800
1.5500.8542.370

ga/U2
Table 2. Normalized Crater Diameter and Depth, versus, tfor different values of ga/U2, and Y/pU2. The impact velocity,
U, was 12 km/s except where indicated.(continued)
Y/pU2 d/a D/a
II
It
fl
tt
II
II
II
II
II
II
II
It
II
tt
It
II
3.41x10⁻³it
•t
it
3.41x10⁻³ii
it
it
it
it
it
»i
it
it
ii
ii
3.4xlO-2
it
tt
•i
it
ti
3.4x1 0-2
it
6.2x10-56.2xlO-5
6.2x10-56.2x10-56.2x10-56.2x10-56.2x10-56.2x10-56.2x10-56.2x10-56.2x10-56.2x10-56.2x10-56.2x10-56.2x10-56.2x10-5
6.2x1 0-4
6.2x1 0-4
6.2x10-46.2x10^
6.2x10-36.2x10-36.2x10-36.2x10-36.2x10-36.2x10-36.2x10-36.2x10-36.2x10-36.2x10-36.2x10-36.2x10-3
000000
6.2x10-56.2x10-5
1.501.601.702.002.300.102.702.502.903.203.603.803.903.653.002.00
0.501.101.702.15
0.501.221.852.352.553.003.353.302.201.853.002.50
1.250 1.4000.900 0.6000.700 0.2000.250 0.1002.450 0.1004.100 0.100
2.000 0.4002.750 1.100
3.0903.3703.6405.2006.0700.2008.3507.2009.660
12.69017.10021.90027.80035.40042.60050.400
0.9072.0523.2804.776
0.9342.3243.7105.5607.040
10.15015.09020.02043.20050.85027.60035.470
21.67028.80033.60037.70042.96046.560
0.8282.120

ga/U2
Table 2. Normalized Crater Diameter and Depth, versus, tfor different values of ga/U2, and Y/pU2. The impact velocity,
U, was 12 km/s except where indicated.(continued)
Y/plP d/a D/a
It
«
tt
»
tt
tt
ti
ti
it
it
it
it
tt
3.41xlO-2
ii
ti
tt
it
vi
n
ti
3.4x1 0'2it
tt
tt
tt
it
ti
it
it
it
3.4xlO-2
tt
ti
it
it
3.4xlO-2
ti
ti
6.2x10-56.2xlO-5
6.2x10-56.2x10-56.2x10-56.2x10-56.2x10*56.2x10-56.2x10-56.2x10-56.2x10-56.2x10-56.2x10-5
6.2X10⁻⁴
6.2x10-46.2x10"*6.2x10-46.2x10^
. 6.2x10-46.2x10^6.2x10⁻⁴
6.2x10-36.2x10-36.2x10-36.2x10-36.2x10-36.2x10-36.2x10-36.2x10-36.2x10-36.2x10-3
6.2xlO'2
6.2x10-36.2x10-36.2x10-36.2x10-3
6.2x10-16.2x10-!6.2X10"1
3.3003.5503.8504.1004.2504.8506.6008.3508.6008.1008.2008.6008.600
5.2009.1509.1009.1009.1009.100
10.000
2.7002.9504.4004.6005.0505.5506.5007.5008.2009.400
4.8505.1005.3007.5008.100
3.0003.3503.800
1.7002.0002.3502.4502.4502.2001.9501.5501.1500.6500.5000.3500.300
2.2001.5500.8000.4000.3500.2000.3000.400
1.3502.1502.3502.3502.1502.0001.8501.6001.4000.800
2.0501.8501.6500.8500.100
1.3501.7502.250
3.3804.5806.0207.990
10.20013.70017.60021.30024.90028.50031.40034.00034.800
13.75021.30028.56034.10034.80038.92044.88049.920
2.9205.6008.320
10.20012.80014.40016.20017.90019.60023.800
13.89015.84017.76024.96032.640
2.6103.6906.450

Table 2. Normalized Crater Diameter and Depth, versus, tfor different values of ga/U2, and Y/pU2. The impact velocity,
U, was 12 km/s except where indicated.(continued)
Y/plP d/a D/a
tl
tl
II
II
II
3.4xlO-2if
ir
it
ii
ii
0.341it
if
it
tt
it
it
it
it
it
0.341it
tt
tt
it
it
it
it
6.2x10-16.2x10-!6.2X10⁻¹
6.2X10⁻¹
6.2x10-!
6.26.26.26.26.26.2
0.00.00.00.00.00.00.00.00.00.00.00.0
6.2xlO-5
6.2xlO-5
6.2x10-56.2x10-56.2x10-56.2xlO-5
6.2x10-56.2x10-5
4.0003.9503.9504.1504.200
3.2003.8004.0504.1504.2004.050
2.12.82.35.05.82.62.06.82.42.34.05.3
2.4002.3502.3502.2001.950
1.4502.4002.4002.3502.2502.000
0.40.10.50.35.10.50.40.10.50.45
1.301.25
0.380.680.901.151.301.351.431.50
8.6409.980
10.50012.60018.000
2.6606.7669.040
11.40012.90016.300
0.7652.0104.0805.2205.9703.5004.4807.0503.9004.1804.7505.678
0.7611.2901.7002.1302.4902.9503.4002.880
(a) Time history taken from Holsapple & Schmidt (1987).

TABLES. SUMMARY OF CRATER SCALING FORMULA
Regime Formula Proportionality ExponentConstant (K)
Comments
Penetration Regime
Depth EvolutionDepth transition to inertia!regime
Diameter EvolutionDiameter transition to inertia!regimeDiameter/depth evolution
D/a = 0.5(Ut/a)Ut/a=5.1
Ut/a=2
d/D=K(Ut/a)
0.5
1.3 0.78
Independent ofmaterial properties
Inertia! RegimeDepth Evolution
Coupling coefficient
Transition to terminal (g)*Transition to terminal (Y)+
D/a=K(Ut/a)s
VL = s/(l-s)
Ut/a=K(ga/U2)-0+nX2+u)
1.3
0.56
0.920.33
0.36
0.610.78
Independent ofmaterial propertiesSlope of growth, s,determines the valueof|.i = s/(l-s)which, in turn,determines theexponents for allregimes (Holsappleand Schmidt, 1987)
Maximum depth of penetration (g) &/% - K (ga/u2)-M/(2+u)Maximum depth of penetration (Y) Dn/a=K( Y/pU2)'^Maximum depth penetrationCYsw)-*-1- Dp/a=K(Hm/U2)'^
1.20.840.70
0.220.280.28
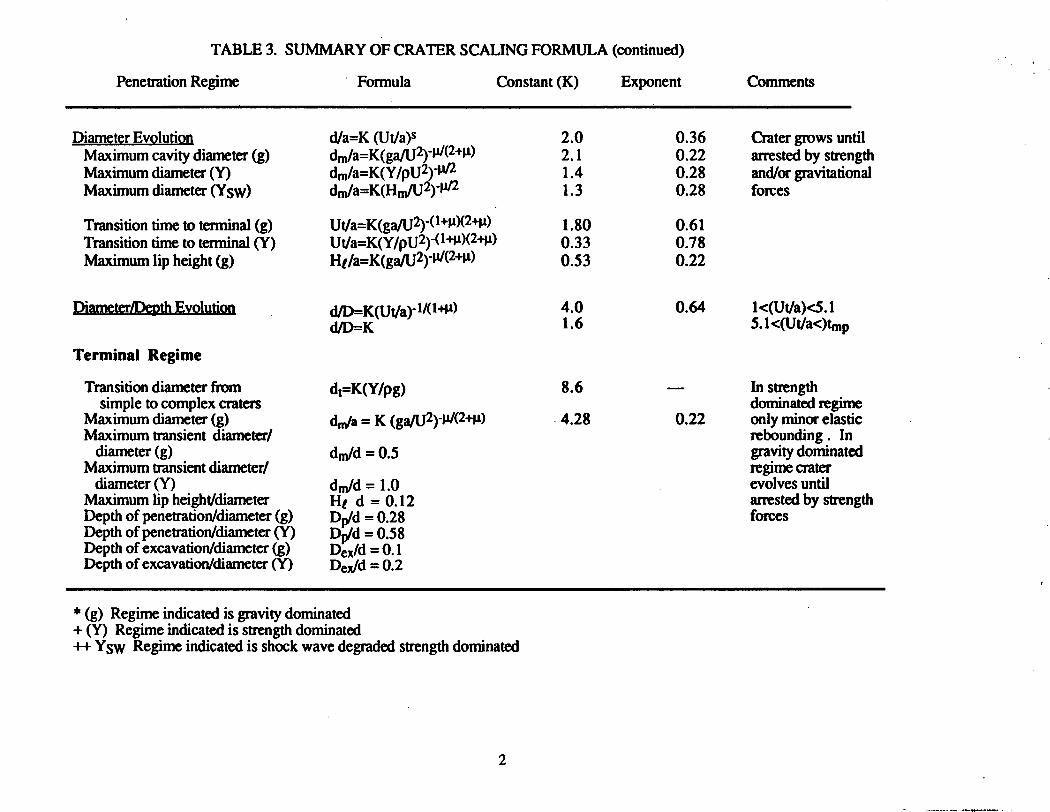
TABLE 3. SUMMARY OF CRATER SCALING FORMULA (continued)
Penetration Regime Formula Constant (K) Exponent
* (g) Regime indicated is gravity dominated+ (Y) Regime indicated is strength dominated++ YSW Regime indicated is shock wave degraded strength dominated
Comments
Diameter EvolutionMaximum cavity diameter (g)Maximum diameter (Y)Maximum diameter (Y$w)
Transition time to terminal (g)Transition time to terminal (Y)Maximum lip height (g)
Diameter/Depth Evolution
Terminal Regime
Transition diameter fromsimple to complex craters
Maximum diameter (g)Maximum transient diameter/
diameter (g)Maximum transient diameter/
diameter ( Y)Maximum lip height/diameterDepth of penetration/diameter (g)Depth of penetration/diameter (Y)Depth of excavation/diameter (g)Depth of excavation/diameter (Y)
d/a-K (Ut/a)s
dm/a=K(ga/U2)"^2+^dm/a=K(Y/pU2)-u>2
dm/a=K(Hm/U2)-u/2
Ut/a=K(ga/U2)-<1+M2+u>Ut/a=K(Y/pU2)-<1+HX2+")H,/a=K(ga/U2)-M/<2^>
d/D_R 1/(1+u)
d/D=K
dt=K(Y/pg)
dm/a = K (ga/U2)-M/(2-Hi)
dm/d = 0.5
dm/d = 1.0Hi d = 0.12Dp/d = 0.28Dp/d = 0.58Dex/d = 0. 1Dex/d = 0.2
2.02.11.41.3
1.800.330.53
4.01.6
8.6
4.28
0.360.220.280.28
0.610.780.22
0.64
__
0.22
Crater grows untilarrested by strengthand/or gravitationalforces
l<(Ut/a)<5.15.1<(Ut/a<)tfnp
In strengthdominated regimeonly minor elasticrebounding . Ingravity dominatedregime craterevolves untilarrested by strengthforces

Figure 1. Simple bowl shaped crater Flow field for the impact of a silicate projectile on asilicate halfspace. The flow field is in the strength dominated regime with ga/U2 =3.7x10*7and Y/pU^ 1.4x10⁻³. The velocity field is shown on the left side with the scale shown atthe top. On the right hand are the trajectories of tracer particles placed at various depths.The panels represent dimensionless times of 3.19,9.29 and 16.6. This is representative ofa simple bowl shaped crater.
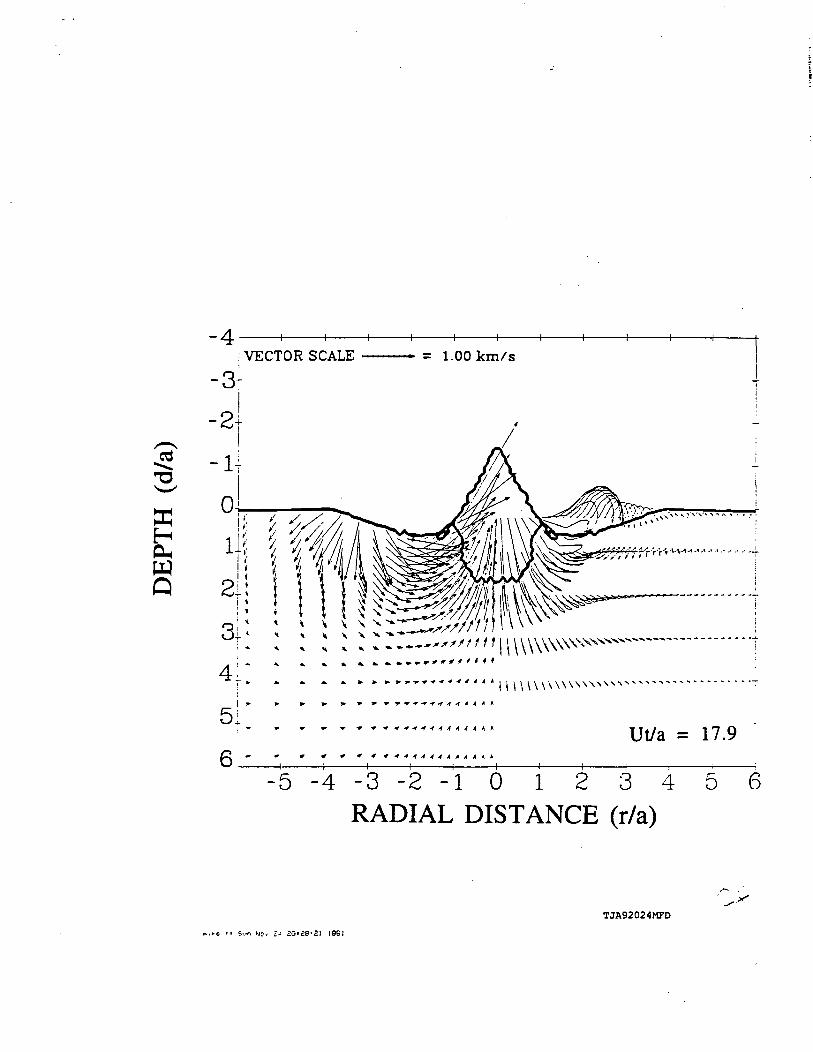
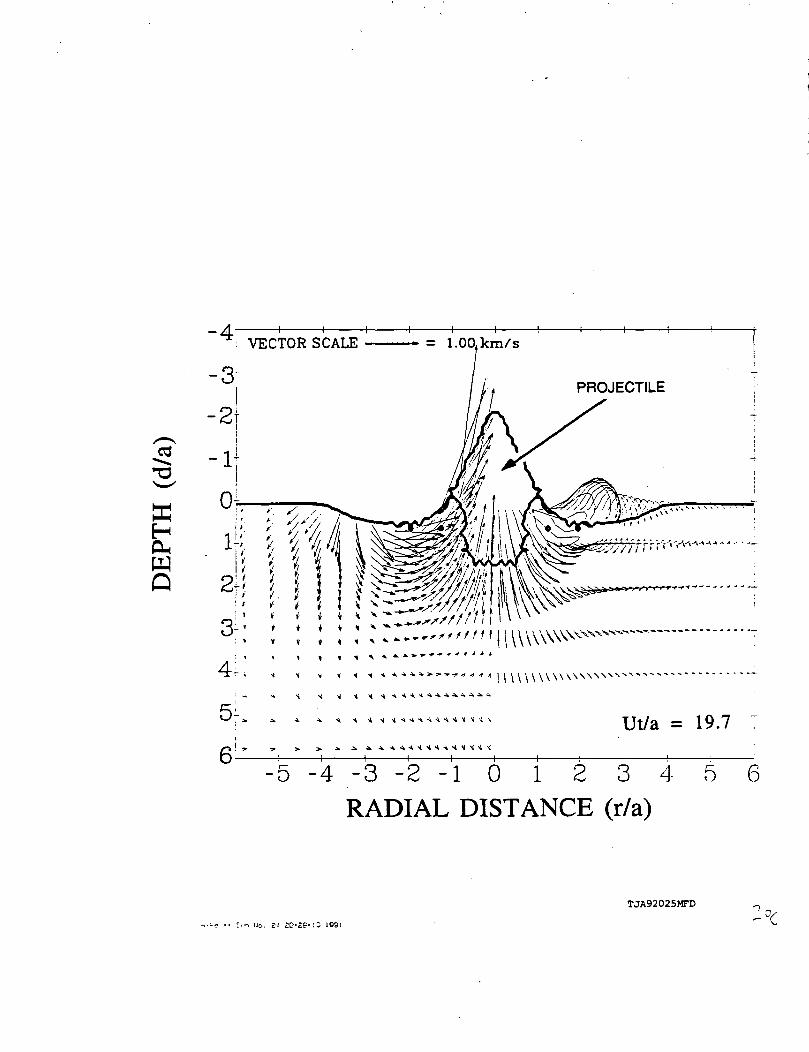
Figure 2. Complex crater Velocity and deformation history fields for the impact of asilicate projectile on a silicate halfspace. the flow field is gravity dominated at late timeswith ga/U* = 3.4 x 10'2 and Y/pU2 = 6.2 x 10'3. The velocity field is shown on the leftside with the scale at the top. On the right side are the trajectories of tracer particles placedat various depths. The panels represent dimensionless times of 5.57, 8.32,10.2, 12.8,14.4, 17.9, and 19.7.
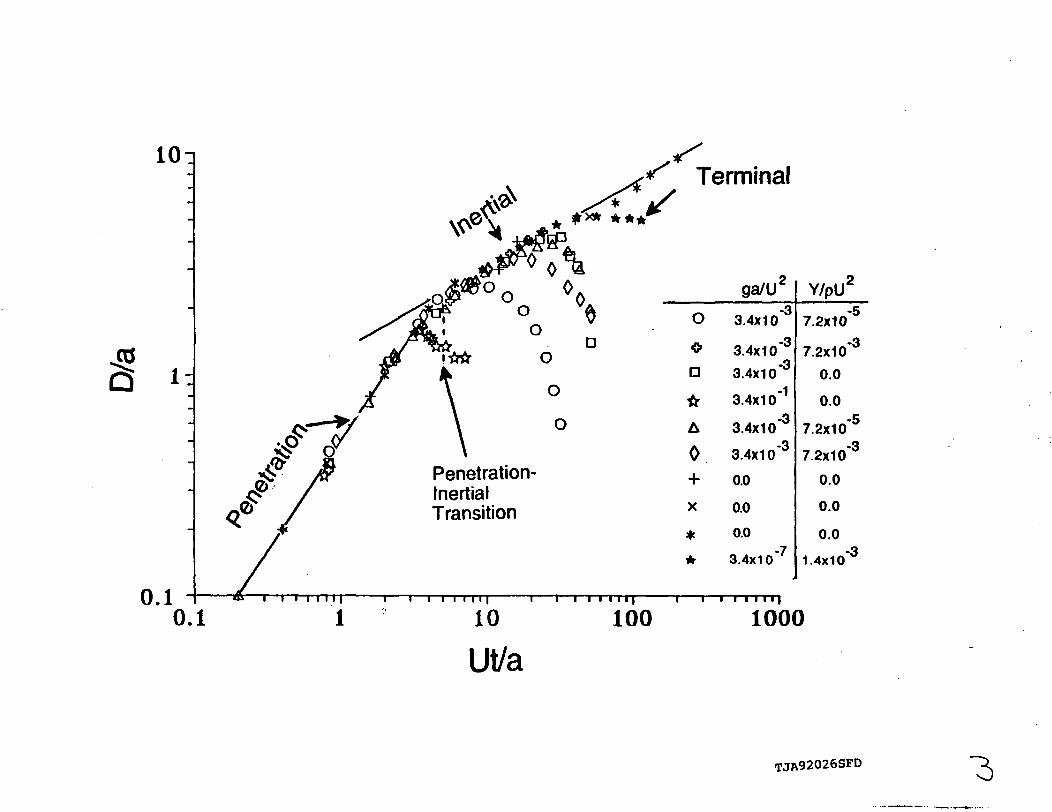
Figure 3. Dimensionless depth versus dimensionless time for the penetration, and inertia!,terminal and relaxation regimes for different values of ga/LJ2 and Y/pU2.
Figure 4. Temporal evolution of the dimensionless depth of penetration (D/a) and craterdiameter (d/a) for a fixed value of inverse Froude number (ga/U2=0-034), and variousvalues of Y/pga.
Figure 5. Dimensionless maximum depth of penetration (Dp/a) and diameter (d/a) as afunction inverse Froude number (ga/U2). Slope corresponds to - \JJ(2+[L) for gravityscaling. Symbols are results for different calculations.
Figure 6. Temporal evolution of dimensionless depth (D/a) and diameter (d/a) in thestrength dominated region.
Figure 7. Dimensionless maximum depth of penetration (Dp/a) and diameter (d/a) as afunction of inverse Cauchy number (Y/pU2). The slope is -0.28=-M/2 and corresponds tostrength scaling. The change in slope is a result of melting and shock weakening.Symbols represent different calculations for a fixed value of Froude number (ga/U2=0.034)for various values of the melt number (Hm/U2).
Figure 8. Dimensionless crater diameter (d/a) as a function of inverse Cauchy number(Y/pU2) in the strength dominated regime (see Figure 10).
Figure 9. Effective strength as a function of weakening energy.
Figure 10. Dimensionless crater diameter as a function of inverse Froude number (ga/U2)for various values of inverse Cauchy number (Y/pU2). Slope corresponds to gravityscaling.
Figure 11. Crater transition diameter from simple to complex craters as a function ofplanetary surface gravity. Slope corresponds to scaling law of Eq. 28.
Figure 12. Depth of excavation of planetary material (Dex) divided by the crater diameter(d) as a function of crater diameter for terrestrial craters. Calculation results indicated bysolid line, (a) sand, Gault et al., 1968; (b) sand, Andrews, 1976; (c) 500 ton TNT,Roddy, 1976; (d) Jangle U, Shoemaker, 1963; (e) Teapot Ess, Shoemaker, 1963; (f)

Odessa, Shoemaker and Eggleston, 1961; (g) LonarLake, Fredriksson et al., 1973; (h)Decaturville, Offield and Pohn, 1976.
Figure 13. Maximum depth of penetration (Dp) and excavation (Dex) as a function of craterdiameter for various planets and satellites. Vertical lines delineate the transition fromstrength to gravity scaling.

I 1 1 1
-5 -4 - 3 - 2 - 1 0 1 2 3 4 5RADIAL DISTANCE (r/a)
6
• ike » Sot Oci 36 ie-ie-23 IBS] TJA92016MFD
ffiH
- 5 - 4 - 3 - 2 - 1 0 1 2 3 4 5 6RADIAL DISTANCE (r/a)
«ike i> Soi Oet ZE 16U8-1E ISSlTJA92017MFD

ctf
5-aswQ
- 5 - 4 - 3 - 2 - 1 0 1 2 3 4 5 6RADIAL DISTANCE (r/a)
TJA92018MFD»ike ii Sot Oci 26 lEi25i47 1991

S3H
- 5 - 4 - 3 - 2 - 1 0 1 2 3 4 5 6
RADIAL DISTANCE (r/a)
TJA92019MFD

ffiH
WQ
k k »\ ^C^~
V v \
\ \ \ \ \ \ \ \ \ \ \ \ \ \ X \ w x
- 5 - 4 - 3 - 2 - 1 0 1 2 3 4 5
RADIAL DISTANCE (r/a)
TJA92020MFD

ffiHOHWQ
Ut/a = 10.2
- 5 - 4 - 3 - 2 - 1 0 1 2 3 4 56
RADIAL DISTANCE (r/a)
TJA92021MFD
t-t if £.,_•'- NC.v

IffiHOHWQ
4r5f'
6--
, ,///////im\, , s s ////////////
t f t * * 4» * TUt/a = 12.8
- 5 - 4 - 3 - 2 - 1 0 1 2 3 4 5 6
RADIAL DISTANCE (r/a)
TJA92022MFD
Fr 1991

ffi
Q
/I 1 ' 1 1 1 1 1 1 -1 ! 1 1
3
2
vrrrTOP °;PAT P i r — i nn ir-m 'c
-
- 5 - 4 - 3 - 2 - 1 0 1 2 3 4 5 6RADIAL DISTANCE (r/a)
TJA92023MFD
test
-4
ffiHOlwQ
i VECTOR SCALE = 1.00 km/s
s;6JL
Ut/a = 17.9
- 5 - 4 - 3 - 2 - 1 0 1 2 3 4 5 6RADIAL DISTANCE (r/a)
TJA92024MFD
ffiHD<WQ
- 5 - 4 - 3 - 2 - 1 0 1 2 3 4RADIAL DISTANCE (r/a)
5 6
TJA92025MFD
1B8I
lOn
c
0.10.1
Penetration-Inertia!Transition
*"" Terminal
10
Ut/a
ga/U
0
oD
ft
A
0
+
X
**
3.4x1 0'3
3.4x1 0'3-3
3.4x10
3.4x1 0"1
3.4x1 0"3
3.4x1 0"3
0.0
0.0
0.0
3.4x1 0"7
Y/plT
7.2x1 0'5
7.2x10~3
0.0
0.0
7.2x10~5
7.2x1 0"3
0.0
0.0
0.0
1.4x1o"3
100 1000
TJA92026SFD

LIPPROPAGATION
STRENGTHDOMINATED
PENETRATIONREGIME
Y/pga
•— 0.018
0.18
1.80
18.0
TJA92027SFD

10DIAIU
SLOPE = -0.22
ETER
DEPTH
1.001 .01 .1
.21
ga/u
TJA92028SFD

10
45Q
1
DIAMETER
DEPTH
SHOCK WEAKENING
ga/U2
D—
O—
- 3.4X1 0'7
- 3.4X10"7
- 3.4X1 0"7
-3.4X10"4
. aaxio"4
Y/pU2
1.4X10'3
7.2X1 0"3
3.6X1 0"2
6.2X1 0"2
6.2X1 0"1
1 10 100Ut/a
1000
TJA92029SFD
10
SLOPE = - 0.28
10 0 0 1 . 001 . 01
Y/pU:
SHOCKWEAKENED
DEPTHREBOUND
DIAMETER
DEPTH
. 1
TJA92030SFD 7

-2
TJA92031SFD

ozLU
III
LLJLLLJLLU
108.
107'
10'
Y = 1.0kbar
FRACTUREENERGY
MELTENERGY
106 107 108 109 1010 1011 1012
WEAKENING ENERGY(ergs/g)
TJA92032SFD

1000
slope = -0.22
gravity dominated
CO
1Q-7 10*6 10'5 10'4 10'3 10"2 10'1 10l
ga/U'
10
N
/ OTJA92033SFD

100 SURFACE GRAVITY (cm /s2) 10°°
TJA92034SFDI)

"DX0Q
10' 10° 10' 10 10
CRATER DIAMETER (m)
2.TJA92035SFD

Oex(gravity)
UJ
a => o< o oS a s•= uj
Dex(strength)
0.01 0.1 1 10 100 1000CRATER DIAMETER (km)
TJA92036SFD 13